Cities with the Highest Percentage of Births to Unmarried Women under the Age of 20 in Louisiana

RELATED REPORTS & OPTIONS

Highest Illegitimacy | Women 15-19
Population
Families and Households
Female Fertility
Female Fertility (Unmarried)
Race (Community Size)
Race (Percentage)
Ancestry (Community Size)
AfghanAfricanAlaska NativeAlaskan AthabascanAlbanianAleutAlsatianAmericanApacheArabArapahoArgentineanArmenianAssyrian / Chaldean / SyriacAustralianAustrianBahamianBangladeshiBarbadianBasqueBelgianBelizeanBermudanBhutaneseBlackfeetBolivianBrazilianBritishBritish West IndianBulgarianBurmeseCajunCambodianCanadianCape VerdeanCarpatho RusynCelticCentral AmericanCentral American IndianCherokeeCheyenneChickasawChileanChineseChippewaChoctawColombianColvilleComancheCosta RicanCreeCreekCroatianCrowCubanCypriotCzechCzechoslovakianDanishDelawareDominicanDutchDutch West IndianEastern EuropeanEcuadorianEgyptianEnglishEstonianEthiopianEuropeanFijianFilipinoFinnishFrenchFrench American IndianFrench CanadianGermanGerman RussianGhanaianGreekGuamanian / ChamorroGuatemalanGuyaneseHaitianHmongHonduranHopiHoumaHungarianIcelanderIndian (Asian)IndonesianInupiatIranianIraqiIrishIroquoisIsraeliItalianJamaicanJapaneseJordanianKenyanKiowaKoreanLaotianLatvianLebaneseLiberianLithuanianLumbeeLuxembourgerMacedonianMalaysianMalteseMarshalleseMenomineeMexicanMexican American IndianMongolianMoroccanNative HawaiianNavajoNepaleseNew ZealanderNicaraguanNigerianNorthern EuropeanNorwegianOkinawanOsageOttawaPaiutePakistaniPalestinianPanamanianParaguayanPennsylvania GermanPeruvianPimaPolishPortuguesePotawatomiPuebloPuerto RicanPuget Sound SalishRomanianRussianSalvadoranSamoanScandinavianScotch-IrishScottishSeminoleSenegaleseSerbianShoshoneSierra LeoneanSiouxSlavicSlovakSloveneSomaliSouth AfricanSouth AmericanSouth American IndianSoviet UnionSpaniardSpanishSpanish AmericanSpanish American IndianSri LankanSubsaharan AfricanSudaneseSwedishSwissSyrianTaiwaneseThaiTlingit-HaidaTohono O'OdhamTonganTrinidadian and TobagonianTsimshianTurkishU.S. Virgin IslanderUgandanUkrainianUruguayanUteVenezuelanVietnameseWelshWest IndianYakamaYaquiYugoslavianYumanYup'ikZimbabwean
Ancestry (Percentage)
AfghanAfricanAlaska NativeAlaskan AthabascanAlbanianAleutAlsatianAmericanApacheArabArapahoArgentineanArmenianAssyrian / Chaldean / SyriacAustralianAustrianBahamianBangladeshiBarbadianBasqueBelgianBelizeanBermudanBhutaneseBlackfeetBolivianBrazilianBritishBritish West IndianBulgarianBurmeseCajunCambodianCanadianCape VerdeanCarpatho RusynCelticCentral AmericanCentral American IndianCherokeeCheyenneChickasawChileanChineseChippewaChoctawColombianColvilleComancheCosta RicanCreeCreekCroatianCrowCubanCypriotCzechCzechoslovakianDanishDelawareDominicanDutchDutch West IndianEastern EuropeanEcuadorianEgyptianEnglishEstonianEthiopianEuropeanFijianFilipinoFinnishFrenchFrench American IndianFrench CanadianGermanGerman RussianGhanaianGreekGuamanian / ChamorroGuatemalanGuyaneseHaitianHmongHonduranHopiHoumaHungarianIcelanderIndian (Asian)IndonesianInupiatIranianIraqiIrishIroquoisIsraeliItalianJamaicanJapaneseJordanianKenyanKiowaKoreanLaotianLatvianLebaneseLiberianLithuanianLumbeeLuxembourgerMacedonianMalaysianMalteseMarshalleseMenomineeMexicanMexican American IndianMongolianMoroccanNative HawaiianNavajoNepaleseNew ZealanderNicaraguanNigerianNorthern EuropeanNorwegianOkinawanOsageOttawaPaiutePakistaniPalestinianPanamanianParaguayanPennsylvania GermanPeruvianPimaPolishPortuguesePotawatomiPuebloPuerto RicanPuget Sound SalishRomanianRussianSalvadoranSamoanScandinavianScotch-IrishScottishSeminoleSenegaleseSerbianShoshoneSierra LeoneanSiouxSlavicSlovakSloveneSomaliSouth AfricanSouth AmericanSouth American IndianSoviet UnionSpaniardSpanishSpanish AmericanSpanish American IndianSri LankanSubsaharan AfricanSudaneseSwedishSwissSyrianTaiwaneseThaiTlingit-HaidaTohono O'OdhamTonganTrinidadian and TobagonianTsimshianTurkishU.S. Virgin IslanderUgandanUkrainianUruguayanUteVenezuelanVietnameseWelshWest IndianYakamaYaquiYugoslavianYumanYup'ikZimbabwean
Immigrant Origin (Total)
AfghanistanAfricaAlbaniaArgentinaArmeniaAsiaAustraliaAustriaAzoresBahamasBangladeshBarbadosBelarusBelgiumBelizeBoliviaBosnia and HerzegovinaBrazilBulgariaBurma / MyanmarCabo VerdeCambodiaCameroonCanadaCaribbeanCentral AmericaChileChinaColombiaCongoCosta RicaCroatiaCubaCzechoslovakiaDenmarkDominicaDominican RepublicEastern AfricaEastern AsiaEastern EuropeEcuadorEgyptEl SalvadorEnglandEritreaEthiopiaEuropeFijiFranceGermanyGhanaGreeceGrenadaGuatemalaGuyanaHaitiHondurasHong KongHungaryIndiaIndonesiaIranIraqIrelandIsraelItalyJamaicaJapanJordanKazakhstanKenyaKoreaKuwaitLaosLatin AmericaLatviaLebanonLiberiaLithuaniaMalaysiaMexicoMicronesiaMiddle AfricaMoldovaMoroccoNepalNetherlandsNicaraguaNigeriaNorth MacedoniaNorthern AfricaNorthern EuropeNorwayOceaniaPakistanPanamaPeruPhilippinesPolandPortugalRomaniaRussiaSaudi ArabiaScotlandSenegalSerbiaSierra LeoneSingaporeSomaliaSouth AfricaSouth AmericaSouth Central AsiaSouth Eastern AsiaSouthern EuropeSpainSri LankaSt. Vincent and the GrenadinesSudanSwedenSwitzerlandSyriaTaiwanThailandTrinidad and TobagoTurkeyUgandaUkraineUruguayUzbekistanVenezuelaVietnamWest IndiesWestern AfricaWestern AsiaWestern EuropeYemenZaireZimbabwe
Immigrant Origin (Percentage)
AfghanistanAfricaAlbaniaArgentinaArmeniaAsiaAustraliaAustriaAzoresBahamasBangladeshBarbadosBelarusBelgiumBelizeBoliviaBosnia and HerzegovinaBrazilBulgariaBurma / MyanmarCabo VerdeCambodiaCameroonCanadaCaribbeanCentral AmericaChileChinaColombiaCongoCosta RicaCroatiaCubaCzechoslovakiaDenmarkDominicaDominican RepublicEastern AfricaEastern AsiaEastern EuropeEcuadorEgyptEl SalvadorEnglandEritreaEthiopiaEuropeFijiFranceGermanyGhanaGreeceGrenadaGuatemalaGuyanaHaitiHondurasHong KongHungaryIndiaIndonesiaIranIraqIrelandIsraelItalyJamaicaJapanJordanKazakhstanKenyaKoreaKuwaitLaosLatin AmericaLatviaLebanonLiberiaLithuaniaMalaysiaMexicoMicronesiaMiddle AfricaMoldovaMoroccoNepalNetherlandsNicaraguaNigeriaNorth MacedoniaNorthern AfricaNorthern EuropeNorwayOceaniaPakistanPanamaPeruPhilippinesPolandPortugalRomaniaRussiaSaudi ArabiaScotlandSenegalSerbiaSierra LeoneSingaporeSomaliaSouth AfricaSouth AmericaSouth Central AsiaSouth Eastern AsiaSouthern EuropeSpainSri LankaSt. Vincent and the GrenadinesSudanSwedenSwitzerlandSyriaTaiwanThailandTrinidad and TobagoTurkeyUgandaUkraineUruguayUzbekistanVenezuelaVietnamWest IndiesWestern AfricaWestern AsiaWestern EuropeYemenZaireZimbabwe
Income
Income (Families)
Income (Households)
Poverty
Poverty (Families)
Unemployment
Employment Occupations
Employment Industries
Employer Class
Commute Time
Commute Means
School Enrollment
Education by Degree Field
Occupancy
Finances
Physical Characteristics
Louisiana
Compare Cities
Comparison Subject

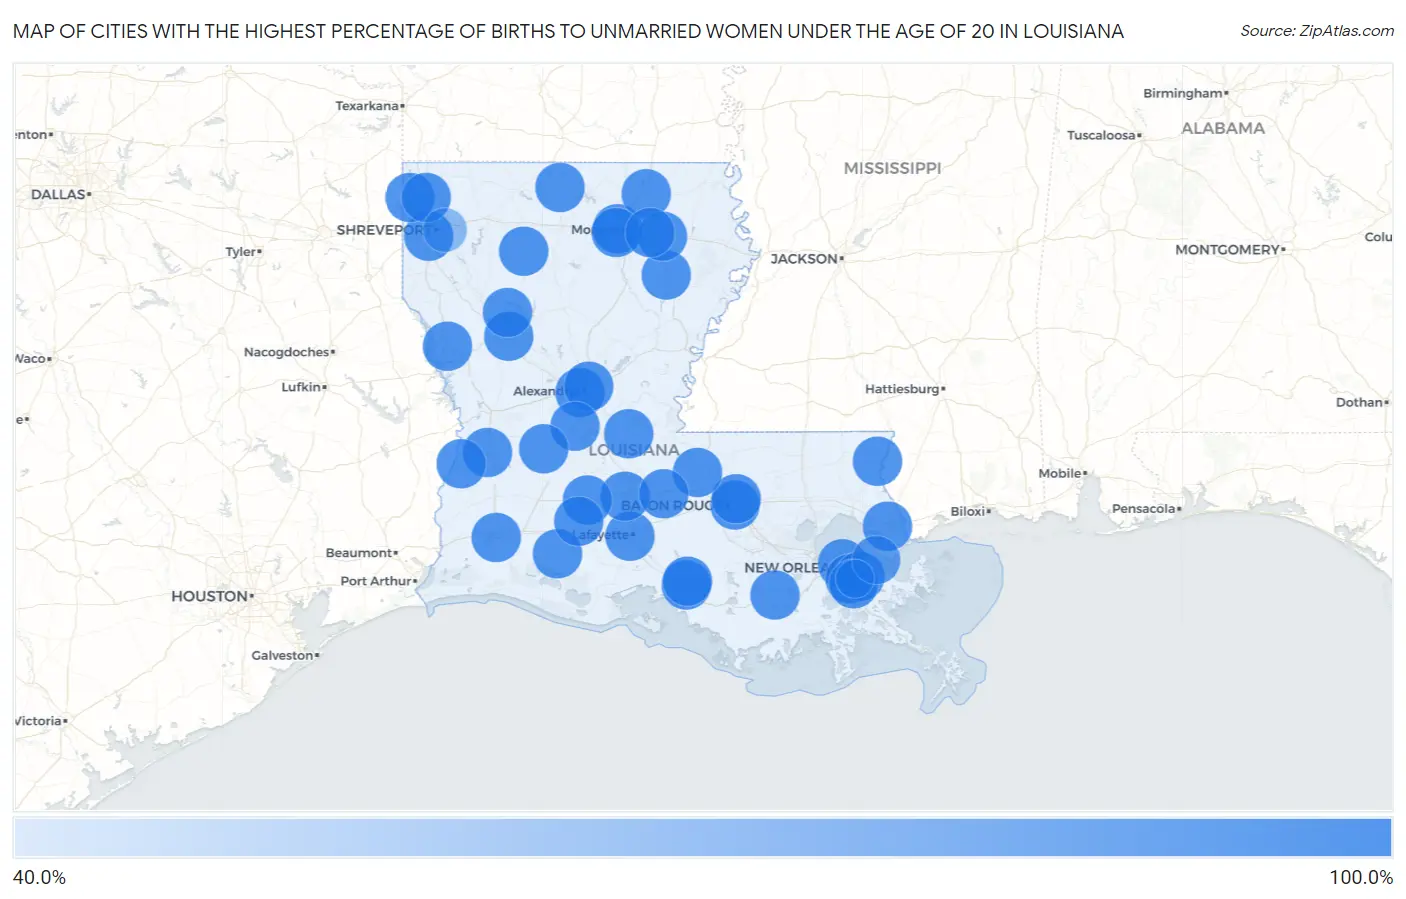
Map of Cities with the Highest Percentage of Births to Unmarried Women under the Age of 20 in Louisiana

0.0%
100.0%
Cities with the Highest Percentage of Births to Unmarried Women under the Age of 20 in Louisiana Map

Cities with the Highest Percentage of Births to Unmarried Women under the Age of 20 in Louisiana

City % Unmarried vs State vs National
1.Baton Rouge100.0%94.9%(+5.10)#186.9%(+13.1)#44
2.Shreveport100.0%94.9%(+5.10)#286.9%(+13.1)#68
3.Metairie100.0%94.9%(+5.10)#386.9%(+13.1)#95
4.Lafayette100.0%94.9%(+5.10)#486.9%(+13.1)#114
5.Lake Charles100.0%94.9%(+5.10)#586.9%(+13.1)#214
6.Alexandria100.0%94.9%(+5.10)#686.9%(+13.1)#391
7.Marrero100.0%94.9%(+5.10)#786.9%(+13.1)#515
8.Slidell100.0%94.9%(+5.10)#886.9%(+13.1)#547
9.Terrytown100.0%94.9%(+5.10)#986.9%(+13.1)#572
10.Natchitoches100.0%94.9%(+5.10)#1086.9%(+13.1)#718
11.Opelousas100.0%94.9%(+5.10)#1186.9%(+13.1)#772
12.Pineville100.0%94.9%(+5.10)#1286.9%(+13.1)#814
13.West Monroe100.0%94.9%(+5.10)#1386.9%(+13.1)#856
14.Woodmere100.0%94.9%(+5.10)#1486.9%(+13.1)#899
15.Bogalusa100.0%94.9%(+5.10)#1586.9%(+13.1)#918
16.Deridder100.0%94.9%(+5.10)#1686.9%(+13.1)#953
17.Bastrop100.0%94.9%(+5.10)#1786.9%(+13.1)#961
18.Eunice100.0%94.9%(+5.10)#1886.9%(+13.1)#969
19.Merrydale100.0%94.9%(+5.10)#1986.9%(+13.1)#1,005
20.Winnsboro100.0%94.9%(+5.10)#2086.9%(+13.1)#1,157
21.New Roads100.0%94.9%(+5.10)#2186.9%(+13.1)#1,173
22.Brownsville100.0%94.9%(+5.10)#2286.9%(+13.1)#1,194
23.Rayville100.0%94.9%(+5.10)#2386.9%(+13.1)#1,242
24.Lake Arthur100.0%94.9%(+5.10)#2486.9%(+13.1)#1,318
25.Lafourche Crossing100.0%94.9%(+5.10)#2586.9%(+13.1)#1,340
26.Baldwin100.0%94.9%(+5.10)#2686.9%(+13.1)#1,387
27.Zwolle100.0%94.9%(+5.10)#2786.9%(+13.1)#1,428
28.Cottonport100.0%94.9%(+5.10)#2886.9%(+13.1)#1,450
29.Iota100.0%94.9%(+5.10)#2986.9%(+13.1)#1,492
30.Bernice100.0%94.9%(+5.10)#3086.9%(+13.1)#1,565
31.Oil City100.0%94.9%(+5.10)#3186.9%(+13.1)#1,599
32.Charenton100.0%94.9%(+5.10)#3286.9%(+13.1)#1,608
33.Campti100.0%94.9%(+5.10)#3386.9%(+13.1)#1,638
34.Start100.0%94.9%(+5.10)#3486.9%(+13.1)#1,645
35.Merryville100.0%94.9%(+5.10)#3586.9%(+13.1)#1,648
36.Krotz Springs100.0%94.9%(+5.10)#3686.9%(+13.1)#1,649
37.Forest Hill100.0%94.9%(+5.10)#3786.9%(+13.1)#1,719
38.Elizabeth100.0%94.9%(+5.10)#3886.9%(+13.1)#1,801
39.Belcher100.0%94.9%(+5.10)#3986.9%(+13.1)#1,886
40.Bienville100.0%94.9%(+5.10)#4086.9%(+13.1)#1,926
41.New Orleans94.0%94.9%(-0.900)#4186.9%(+7.10)#1,958
42.Bossier City71.4%94.9%(-23.5)#4286.9%(-15.5)#2,044
43.Harvey41.1%94.9%(-53.8)#4386.9%(-45.8)#2,102

Common Questions

What are the Top 10 Cities with the Highest Percentage of Births to Unmarried Women under the Age of 20 in Louisiana?
Top 10 Cities with the Highest Percentage of Births to Unmarried Women under the Age of 20 in Louisiana are:
#1
100.0%
#2
100.0%
#3
100.0%
#4
100.0%
#5
100.0%
#6
100.0%
#7
100.0%
#8
100.0%
#9
100.0%
#10
100.0%
What city has the Highest Percentage of Births to Unmarried Women under the Age of 20 in Louisiana?
Baton Rouge has the Highest Percentage of Births to Unmarried Women under the Age of 20 in Louisiana with 100.0%.
What is the Percentage of Births to Unmarried Women under the Age of 20 in the State of Louisiana?
Percentage of Births to Unmarried Women under the Age of 20 in Louisiana is 94.9%.
What is the Percentage of Births to Unmarried Women under the Age of 20 in the United States?
Percentage of Births to Unmarried Women under the Age of 20 in the United States is 86.9%.