Cities with the Highest Percentage of Births to Unmarried Women under the Age of 20 in Kansas

RELATED REPORTS & OPTIONS

Highest Illegitimacy | Women 15-19
Population
Families and Households
Female Fertility
Female Fertility (Unmarried)
Race (Community Size)
Race (Percentage)
Ancestry (Community Size)
AfghanAfricanAlaska NativeAlaskan AthabascanAlbanianAleutAlsatianAmericanApacheArabArapahoArgentineanArmenianAssyrian / Chaldean / SyriacAustralianAustrianBahamianBangladeshiBarbadianBasqueBelgianBelizeanBermudanBhutaneseBlackfeetBolivianBrazilianBritishBritish West IndianBulgarianBurmeseCajunCambodianCanadianCape VerdeanCarpatho RusynCelticCentral AmericanCentral American IndianCherokeeCheyenneChickasawChileanChineseChippewaChoctawColombianColvilleComancheCosta RicanCreeCreekCroatianCrowCubanCypriotCzechCzechoslovakianDanishDelawareDominicanDutchDutch West IndianEastern EuropeanEcuadorianEgyptianEnglishEstonianEthiopianEuropeanFijianFilipinoFinnishFrenchFrench American IndianFrench CanadianGermanGerman RussianGhanaianGreekGuamanian / ChamorroGuatemalanGuyaneseHaitianHmongHonduranHopiHoumaHungarianIcelanderIndian (Asian)IndonesianInupiatIranianIraqiIrishIroquoisIsraeliItalianJamaicanJapaneseJordanianKenyanKiowaKoreanLaotianLatvianLebaneseLiberianLithuanianLumbeeLuxembourgerMacedonianMalaysianMalteseMarshalleseMenomineeMexicanMexican American IndianMongolianMoroccanNative HawaiianNavajoNepaleseNew ZealanderNicaraguanNigerianNorthern EuropeanNorwegianOkinawanOsageOttawaPaiutePakistaniPalestinianPanamanianParaguayanPennsylvania GermanPeruvianPimaPolishPortuguesePotawatomiPuebloPuerto RicanPuget Sound SalishRomanianRussianSalvadoranSamoanScandinavianScotch-IrishScottishSeminoleSenegaleseSerbianShoshoneSierra LeoneanSiouxSlavicSlovakSloveneSomaliSouth AfricanSouth AmericanSouth American IndianSoviet UnionSpaniardSpanishSpanish AmericanSpanish American IndianSri LankanSubsaharan AfricanSudaneseSwedishSwissSyrianTaiwaneseThaiTlingit-HaidaTohono O'OdhamTonganTrinidadian and TobagonianTsimshianTurkishU.S. Virgin IslanderUgandanUkrainianUruguayanUteVenezuelanVietnameseWelshWest IndianYakamaYaquiYugoslavianYumanYup'ikZimbabwean
Ancestry (Percentage)
AfghanAfricanAlaska NativeAlaskan AthabascanAlbanianAleutAlsatianAmericanApacheArabArapahoArgentineanArmenianAssyrian / Chaldean / SyriacAustralianAustrianBahamianBangladeshiBarbadianBasqueBelgianBelizeanBermudanBhutaneseBlackfeetBolivianBrazilianBritishBritish West IndianBulgarianBurmeseCajunCambodianCanadianCape VerdeanCarpatho RusynCelticCentral AmericanCentral American IndianCherokeeCheyenneChickasawChileanChineseChippewaChoctawColombianColvilleComancheCosta RicanCreeCreekCroatianCrowCubanCypriotCzechCzechoslovakianDanishDelawareDominicanDutchDutch West IndianEastern EuropeanEcuadorianEgyptianEnglishEstonianEthiopianEuropeanFijianFilipinoFinnishFrenchFrench American IndianFrench CanadianGermanGerman RussianGhanaianGreekGuamanian / ChamorroGuatemalanGuyaneseHaitianHmongHonduranHopiHoumaHungarianIcelanderIndian (Asian)IndonesianInupiatIranianIraqiIrishIroquoisIsraeliItalianJamaicanJapaneseJordanianKenyanKiowaKoreanLaotianLatvianLebaneseLiberianLithuanianLumbeeLuxembourgerMacedonianMalaysianMalteseMarshalleseMenomineeMexicanMexican American IndianMongolianMoroccanNative HawaiianNavajoNepaleseNew ZealanderNicaraguanNigerianNorthern EuropeanNorwegianOkinawanOsageOttawaPaiutePakistaniPalestinianPanamanianParaguayanPennsylvania GermanPeruvianPimaPolishPortuguesePotawatomiPuebloPuerto RicanPuget Sound SalishRomanianRussianSalvadoranSamoanScandinavianScotch-IrishScottishSeminoleSenegaleseSerbianShoshoneSierra LeoneanSiouxSlavicSlovakSloveneSomaliSouth AfricanSouth AmericanSouth American IndianSoviet UnionSpaniardSpanishSpanish AmericanSpanish American IndianSri LankanSubsaharan AfricanSudaneseSwedishSwissSyrianTaiwaneseThaiTlingit-HaidaTohono O'OdhamTonganTrinidadian and TobagonianTsimshianTurkishU.S. Virgin IslanderUgandanUkrainianUruguayanUteVenezuelanVietnameseWelshWest IndianYakamaYaquiYugoslavianYumanYup'ikZimbabwean
Immigrant Origin (Total)
AfghanistanAfricaAlbaniaArgentinaArmeniaAsiaAustraliaAustriaAzoresBahamasBangladeshBarbadosBelarusBelgiumBelizeBoliviaBosnia and HerzegovinaBrazilBulgariaBurma / MyanmarCabo VerdeCambodiaCameroonCanadaCaribbeanCentral AmericaChileChinaColombiaCongoCosta RicaCroatiaCubaCzechoslovakiaDenmarkDominicaDominican RepublicEastern AfricaEastern AsiaEastern EuropeEcuadorEgyptEl SalvadorEnglandEritreaEthiopiaEuropeFijiFranceGermanyGhanaGreeceGrenadaGuatemalaGuyanaHaitiHondurasHong KongHungaryIndiaIndonesiaIranIraqIrelandIsraelItalyJamaicaJapanJordanKazakhstanKenyaKoreaKuwaitLaosLatin AmericaLatviaLebanonLiberiaLithuaniaMalaysiaMexicoMicronesiaMiddle AfricaMoldovaMoroccoNepalNetherlandsNicaraguaNigeriaNorth MacedoniaNorthern AfricaNorthern EuropeNorwayOceaniaPakistanPanamaPeruPhilippinesPolandPortugalRomaniaRussiaSaudi ArabiaScotlandSenegalSerbiaSierra LeoneSingaporeSomaliaSouth AfricaSouth AmericaSouth Central AsiaSouth Eastern AsiaSouthern EuropeSpainSri LankaSt. Vincent and the GrenadinesSudanSwedenSwitzerlandSyriaTaiwanThailandTrinidad and TobagoTurkeyUgandaUkraineUruguayUzbekistanVenezuelaVietnamWest IndiesWestern AfricaWestern AsiaWestern EuropeYemenZaireZimbabwe
Immigrant Origin (Percentage)
AfghanistanAfricaAlbaniaArgentinaArmeniaAsiaAustraliaAustriaAzoresBahamasBangladeshBarbadosBelarusBelgiumBelizeBoliviaBosnia and HerzegovinaBrazilBulgariaBurma / MyanmarCabo VerdeCambodiaCameroonCanadaCaribbeanCentral AmericaChileChinaColombiaCongoCosta RicaCroatiaCubaCzechoslovakiaDenmarkDominicaDominican RepublicEastern AfricaEastern AsiaEastern EuropeEcuadorEgyptEl SalvadorEnglandEritreaEthiopiaEuropeFijiFranceGermanyGhanaGreeceGrenadaGuatemalaGuyanaHaitiHondurasHong KongHungaryIndiaIndonesiaIranIraqIrelandIsraelItalyJamaicaJapanJordanKazakhstanKenyaKoreaKuwaitLaosLatin AmericaLatviaLebanonLiberiaLithuaniaMalaysiaMexicoMicronesiaMiddle AfricaMoldovaMoroccoNepalNetherlandsNicaraguaNigeriaNorth MacedoniaNorthern AfricaNorthern EuropeNorwayOceaniaPakistanPanamaPeruPhilippinesPolandPortugalRomaniaRussiaSaudi ArabiaScotlandSenegalSerbiaSierra LeoneSingaporeSomaliaSouth AfricaSouth AmericaSouth Central AsiaSouth Eastern AsiaSouthern EuropeSpainSri LankaSt. Vincent and the GrenadinesSudanSwedenSwitzerlandSyriaTaiwanThailandTrinidad and TobagoTurkeyUgandaUkraineUruguayUzbekistanVenezuelaVietnamWest IndiesWestern AfricaWestern AsiaWestern EuropeYemenZaireZimbabwe
Income
Income (Families)
Income (Households)
Poverty
Poverty (Families)
Unemployment
Employment Occupations
Employment Industries
Employer Class
Commute Time
Commute Means
School Enrollment
Education by Degree Field
Occupancy
Finances
Physical Characteristics
Kansas
Compare Cities
Comparison Subject

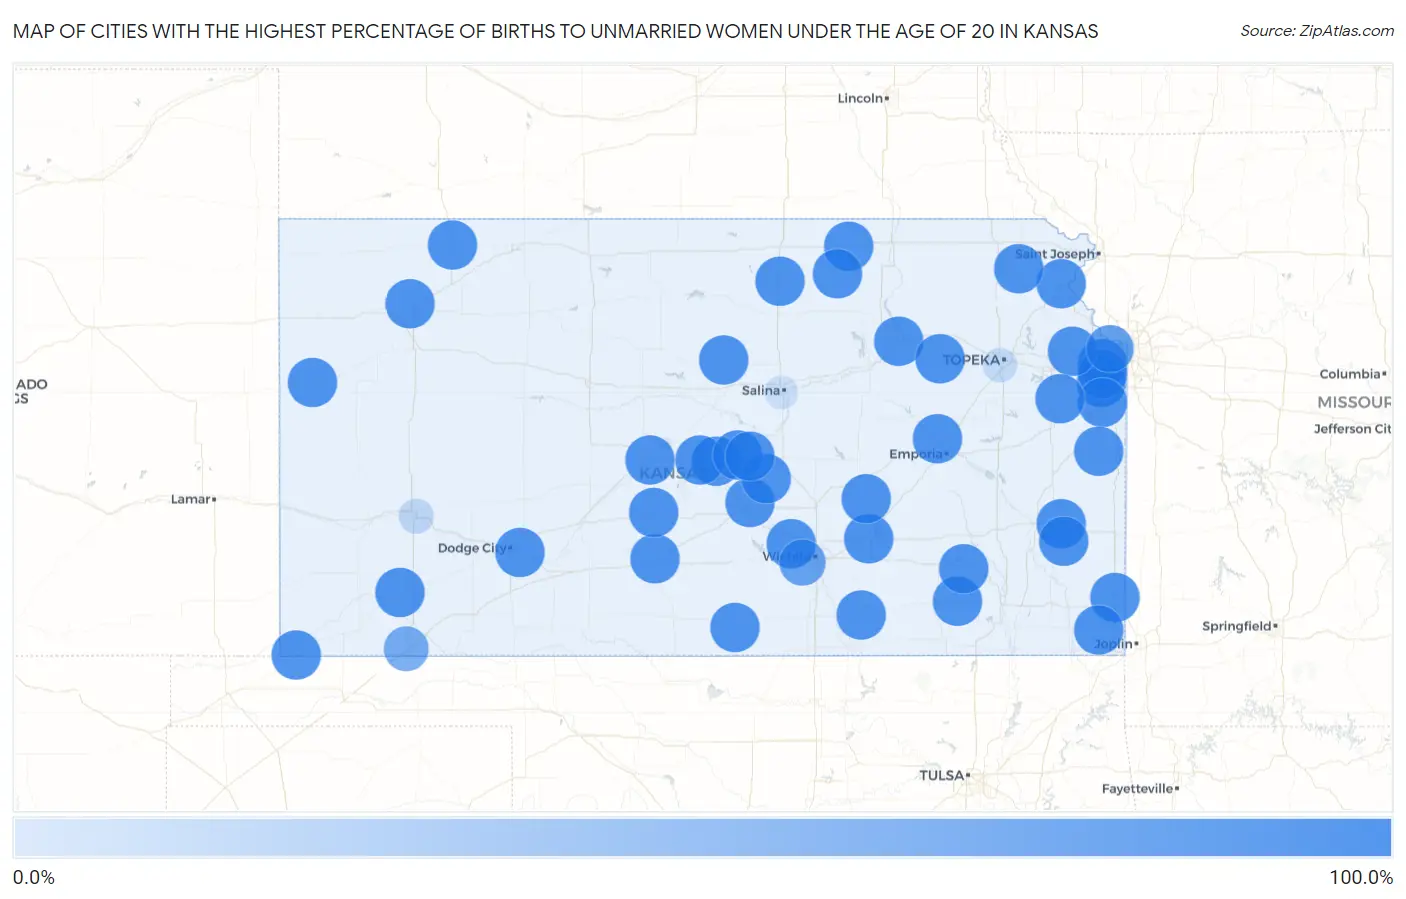
Map of Cities with the Highest Percentage of Births to Unmarried Women under the Age of 20 in Kansas

0.0%
100.0%
Cities with the Highest Percentage of Births to Unmarried Women under the Age of 20 in Kansas Map

Cities with the Highest Percentage of Births to Unmarried Women under the Age of 20 in Kansas

City % Unmarried vs State vs National
1.Olathe100.0%79.7%(+20.3)#186.9%(+13.1)#94
2.Shawnee100.0%79.7%(+20.3)#286.9%(+13.1)#266
3.Lenexa100.0%79.7%(+20.3)#386.9%(+13.1)#320
4.Manhattan100.0%79.7%(+20.3)#486.9%(+13.1)#335
5.Hutchinson100.0%79.7%(+20.3)#586.9%(+13.1)#432
6.Pittsburg100.0%79.7%(+20.3)#686.9%(+13.1)#663
7.Great Bend100.0%79.7%(+20.3)#786.9%(+13.1)#802
8.El Dorado100.0%79.7%(+20.3)#886.9%(+13.1)#859
9.Winfield100.0%79.7%(+20.3)#986.9%(+13.1)#893
10.Atchison100.0%79.7%(+20.3)#1086.9%(+13.1)#913
11.Spring Hill100.0%79.7%(+20.3)#1186.9%(+13.1)#1,020
12.Pratt100.0%79.7%(+20.3)#1286.9%(+13.1)#1,070
13.Tonganoxie100.0%79.7%(+20.3)#1386.9%(+13.1)#1,126
14.Concordia100.0%79.7%(+20.3)#1486.9%(+13.1)#1,145
15.Baldwin City100.0%79.7%(+20.3)#1586.9%(+13.1)#1,155
16.Lyons100.0%79.7%(+20.3)#1686.9%(+13.1)#1,224
17.Columbus100.0%79.7%(+20.3)#1786.9%(+13.1)#1,278
18.Anthony100.0%79.7%(+20.3)#1886.9%(+13.1)#1,350
19.Horton100.0%79.7%(+20.3)#1986.9%(+13.1)#1,457
20.Oberlin100.0%79.7%(+20.3)#2086.9%(+13.1)#1,472
21.Elkhart100.0%79.7%(+20.3)#2186.9%(+13.1)#1,488
22.Colwich100.0%79.7%(+20.3)#2286.9%(+13.1)#1,493
23.Inman100.0%79.7%(+20.3)#2386.9%(+13.1)#1,515
24.St John100.0%79.7%(+20.3)#2486.9%(+13.1)#1,561
25.Lincoln Center100.0%79.7%(+20.3)#2586.9%(+13.1)#1,602
26.Americus100.0%79.7%(+20.3)#2686.9%(+13.1)#1,614
27.Washington100.0%79.7%(+20.3)#2786.9%(+13.1)#1,620
28.Wilroads Gardens100.0%79.7%(+20.3)#2886.9%(+13.1)#1,657
29.Satanta100.0%79.7%(+20.3)#2986.9%(+13.1)#1,659
30.Sharon Springs100.0%79.7%(+20.3)#3086.9%(+13.1)#1,662
31.Chase100.0%79.7%(+20.3)#3186.9%(+13.1)#1,802
32.Moran100.0%79.7%(+20.3)#3286.9%(+13.1)#1,803
33.Fontana100.0%79.7%(+20.3)#3386.9%(+13.1)#1,824
34.Little River100.0%79.7%(+20.3)#3486.9%(+13.1)#1,837
35.Mcfarland100.0%79.7%(+20.3)#3586.9%(+13.1)#1,852
36.Longton100.0%79.7%(+20.3)#3686.9%(+13.1)#1,865
37.Burns100.0%79.7%(+20.3)#3786.9%(+13.1)#1,883
38.Fall River100.0%79.7%(+20.3)#3886.9%(+13.1)#1,923
39.Palmer100.0%79.7%(+20.3)#3986.9%(+13.1)#1,933
40.Gem100.0%79.7%(+20.3)#4086.9%(+13.1)#1,936
41.Windom100.0%79.7%(+20.3)#4186.9%(+13.1)#1,944
42.Elsmore100.0%79.7%(+20.3)#4286.9%(+13.1)#1,945
43.Kansas City89.2%79.7%(+9.50)#4386.9%(+2.30)#1,976
44.Wichita83.6%79.7%(+3.90)#4486.9%(-3.30)#1,997
45.Liberal75.9%79.7%(-3.80)#4586.9%(-11.0)#2,031
46.Garden City25.6%79.7%(-54.1)#4686.9%(-61.3)#2,124
47.Topeka23.3%79.7%(-56.4)#4786.9%(-63.6)#2,128
48.Salina17.9%79.7%(-61.8)#4886.9%(-69.0)#2,136

Common Questions

What are the Top 10 Cities with the Highest Percentage of Births to Unmarried Women under the Age of 20 in Kansas?
Top 10 Cities with the Highest Percentage of Births to Unmarried Women under the Age of 20 in Kansas are:
#1
100.0%
#2
100.0%
#3
100.0%
#4
100.0%
#5
100.0%
#6
100.0%
#7
100.0%
#8
100.0%
#9
100.0%
#10
100.0%
What city has the Highest Percentage of Births to Unmarried Women under the Age of 20 in Kansas?
Olathe has the Highest Percentage of Births to Unmarried Women under the Age of 20 in Kansas with 100.0%.
What is the Percentage of Births to Unmarried Women under the Age of 20 in the State of Kansas?
Percentage of Births to Unmarried Women under the Age of 20 in Kansas is 79.7%.
What is the Percentage of Births to Unmarried Women under the Age of 20 in the United States?
Percentage of Births to Unmarried Women under the Age of 20 in the United States is 86.9%.