Williamstown borough, PA Map & Demographics
Williamstown borough Overview
$26,620
PER CAPITA INCOME
$63,906
AVG FAMILY INCOME
$58,015
AVG HOUSEHOLD INCOME
47.2%
WAGE / INCOME GAP [ % ]
52.8¢/ $1
WAGE / INCOME GAP [ $ ]
0.34
INEQUALITY / GINI INDEX
1,162
TOTAL POPULATION
509
MALE POPULATION
653
FEMALE POPULATION
77.95
MALES / 100 FEMALES
128.29
FEMALES / 100 MALES
40.8
MEDIAN AGE
2.8
AVG FAMILY SIZE
2.2
AVG HOUSEHOLD SIZE
521
LABOR FORCE [ PEOPLE ]
54.6%
PERCENT IN LABOR FORCE
5.2%
UNEMPLOYMENT RATE
Income in Williamstown borough
Income Overview in Williamstown borough
Per Capita Income in Williamstown borough is $26,620, while median incomes of families and households are $63,906 and $58,015 respectively.
| Characteristic | Number | Measure |
| Per Capita Income | 1,162 | $26,620 |
| Median Family Income | 281 | $63,906 |
| Mean Family Income | 281 | $64,715 |
| Median Household Income | 523 | $58,015 |
| Mean Household Income | 523 | $60,602 |
| Income Deficit | 281 | $0 |
| Wage / Income Gap (%) | 1,162 | 47.16% |
| Wage / Income Gap ($) | 1,162 | 52.84¢ per $1 |
| Gini / Inequality Index | 1,162 | 0.34 |
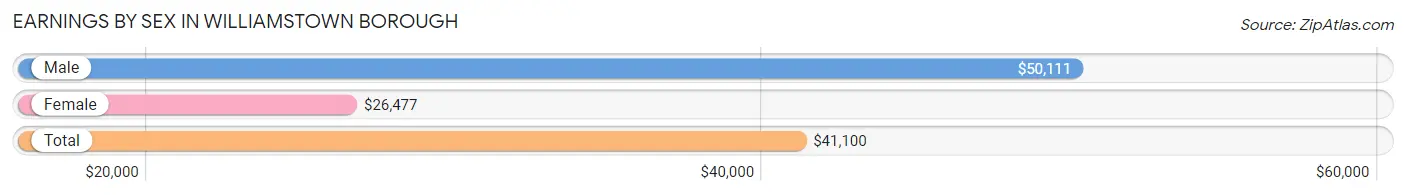
Earnings by Sex in Williamstown borough
Average Earnings in Williamstown borough are $41,100, $50,111 for men and $26,477 for women, a difference of 47.2%.
| Sex | Number | Average Earnings |
| Male | 272 (51.5%) | $50,111 |
| Female | 256 (48.5%) | $26,477 |
| Total | 528 (100.0%) | $41,100 |
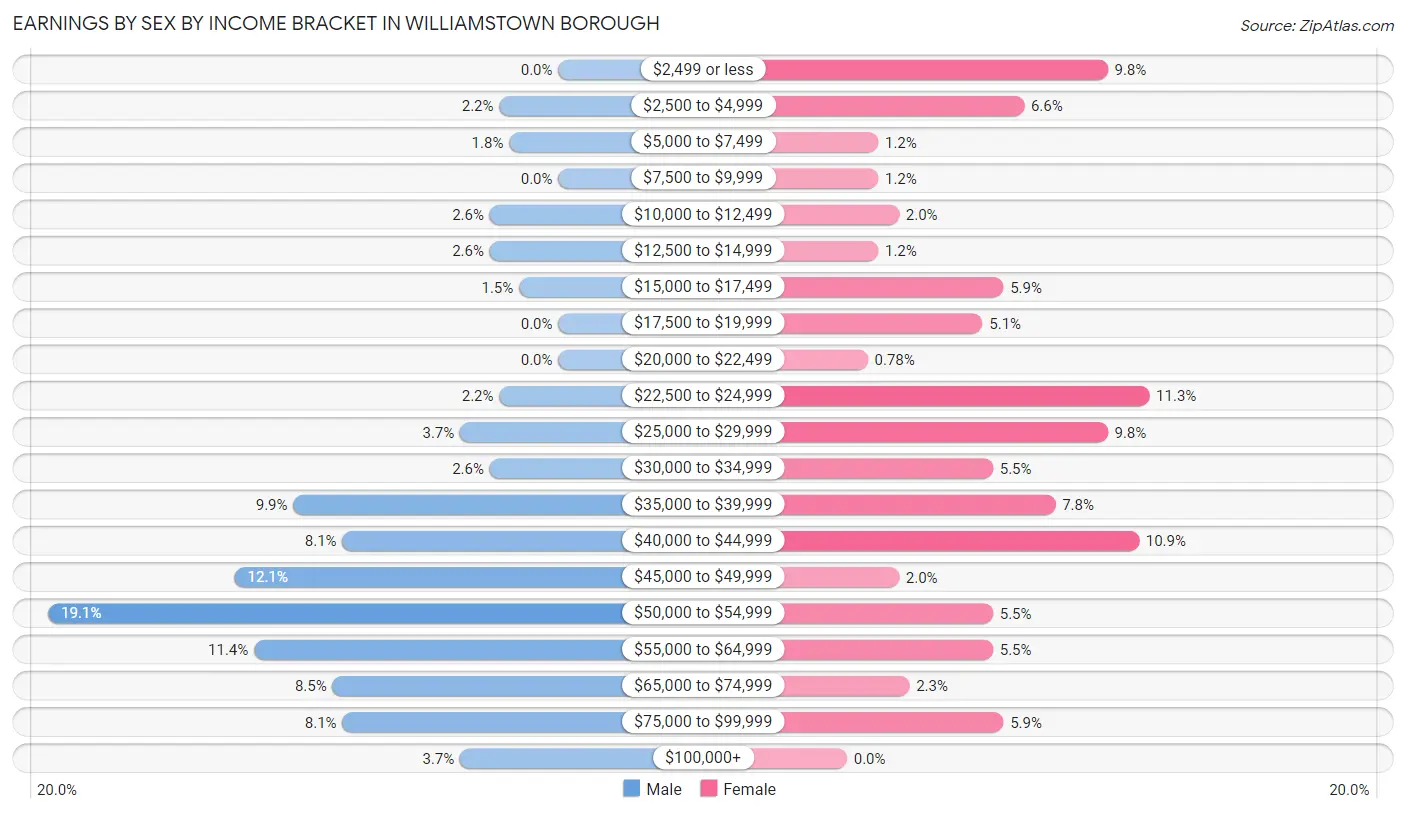
Earnings by Sex by Income Bracket in Williamstown borough
The most common earnings brackets in Williamstown borough are $50,000 to $54,999 for men (52 | 19.1%) and $22,500 to $24,999 for women (29 | 11.3%).
| Income | Male | Female |
| $2,499 or less | 0 (0.0%) | 25 (9.8%) |
| $2,500 to $4,999 | 6 (2.2%) | 17 (6.6%) |
| $5,000 to $7,499 | 5 (1.8%) | 3 (1.2%) |
| $7,500 to $9,999 | 0 (0.0%) | 3 (1.2%) |
| $10,000 to $12,499 | 7 (2.6%) | 5 (1.9%) |
| $12,500 to $14,999 | 7 (2.6%) | 3 (1.2%) |
| $15,000 to $17,499 | 4 (1.5%) | 15 (5.9%) |
| $17,500 to $19,999 | 0 (0.0%) | 13 (5.1%) |
| $20,000 to $22,499 | 0 (0.0%) | 2 (0.8%) |
| $22,500 to $24,999 | 6 (2.2%) | 29 (11.3%) |
| $25,000 to $29,999 | 10 (3.7%) | 25 (9.8%) |
| $30,000 to $34,999 | 7 (2.6%) | 14 (5.5%) |
| $35,000 to $39,999 | 27 (9.9%) | 20 (7.8%) |
| $40,000 to $44,999 | 22 (8.1%) | 28 (10.9%) |
| $45,000 to $49,999 | 33 (12.1%) | 5 (1.9%) |
| $50,000 to $54,999 | 52 (19.1%) | 14 (5.5%) |
| $55,000 to $64,999 | 31 (11.4%) | 14 (5.5%) |
| $65,000 to $74,999 | 23 (8.5%) | 6 (2.3%) |
| $75,000 to $99,999 | 22 (8.1%) | 15 (5.9%) |
| $100,000+ | 10 (3.7%) | 0 (0.0%) |
| Total | 272 (100.0%) | 256 (100.0%) |
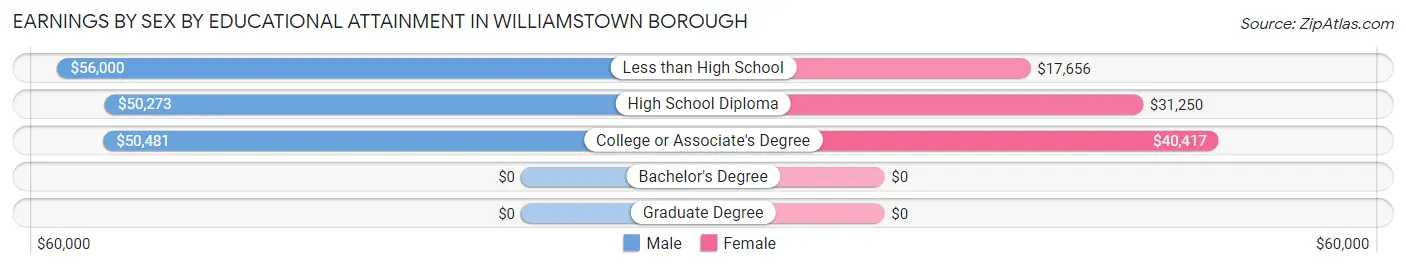
Earnings by Sex by Educational Attainment in Williamstown borough
Average earnings in Williamstown borough are $50,389 for men and $31,250 for women, a difference of 38.0%. Men with an educational attainment of less than high school enjoy the highest average annual earnings of $56,000, while those with high school diploma education earn the least with $50,273. Women with an educational attainment of college or associate's degree earn the most with the average annual earnings of $40,417, while those with less than high school education have the smallest earnings of $17,656.
| Educational Attainment | Male Income | Female Income |
| Less than High School | $56,000 | $17,656 |
| High School Diploma | $50,273 | $31,250 |
| College or Associate's Degree | $50,481 | $40,417 |
| Bachelor's Degree | - | - |
| Graduate Degree | - | - |
| Total | $50,389 | $31,250 |
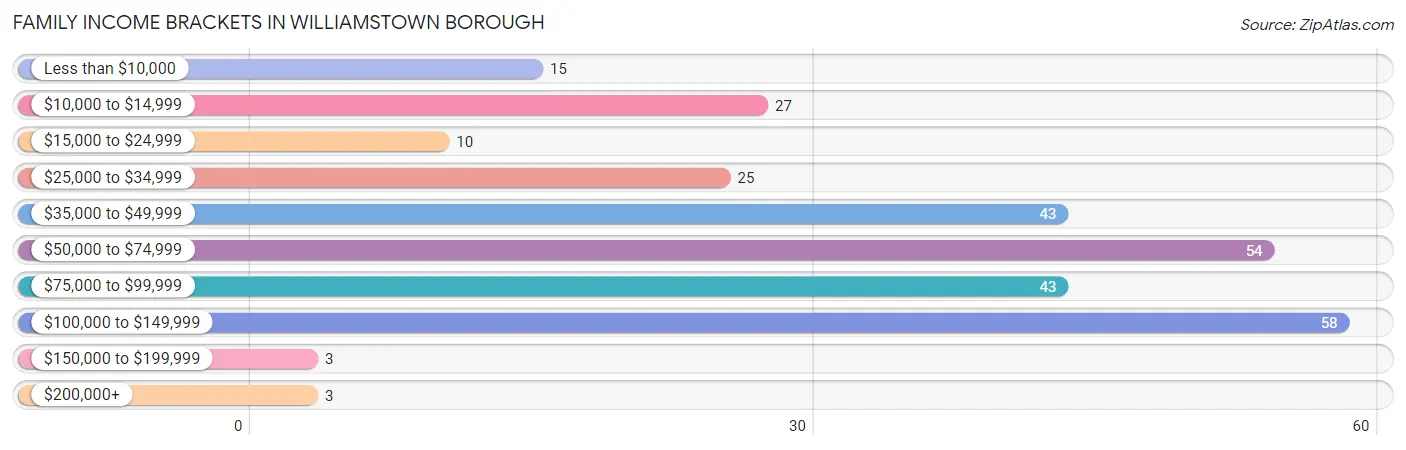
Family Income in Williamstown borough
Family Income Brackets in Williamstown borough
According to the Williamstown borough family income data, there are 58 families falling into the $100,000 to $149,999 income range, which is the most common income bracket and makes up 20.6% of all families. Conversely, the $150,000 to $199,999 income bracket is the least frequent group with only 3 families (1.1%) belonging to this category.
| Income Bracket | # Families | % Families |
| Less than $10,000 | 15 | 5.3% |
| $10,000 to $14,999 | 27 | 9.6% |
| $15,000 to $24,999 | 10 | 3.6% |
| $25,000 to $34,999 | 25 | 8.9% |
| $35,000 to $49,999 | 43 | 15.3% |
| $50,000 to $74,999 | 54 | 19.2% |
| $75,000 to $99,999 | 43 | 15.3% |
| $100,000 to $149,999 | 58 | 20.6% |
| $150,000 to $199,999 | 3 | 1.1% |
| $200,000+ | 3 | 1.1% |
Family Income by Famaliy Size in Williamstown borough
2-person families (191 | 68.0%) account for the highest median family income in Williamstown borough with $65,481 per family, while 2-person families (191 | 68.0%) have the highest median income of $32,740 per family member.
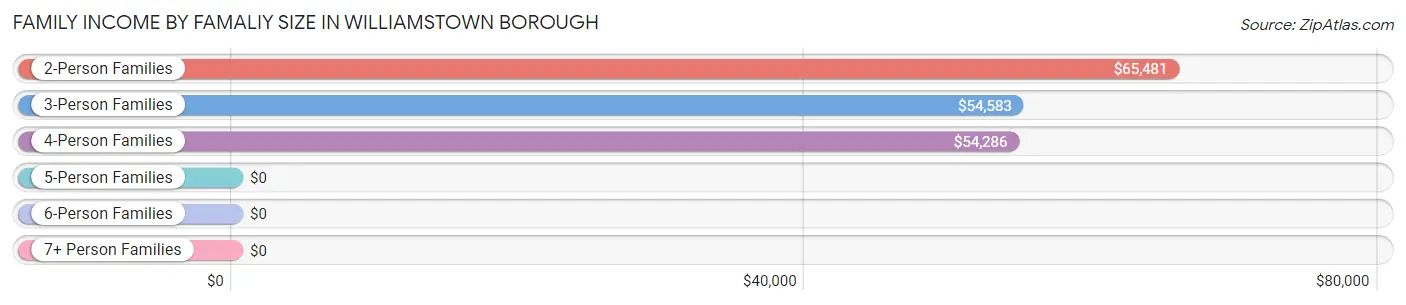
| Income Bracket | # Families | Median Income |
| 2-Person Families | 191 (68.0%) | $65,481 |
| 3-Person Families | 23 (8.2%) | $54,583 |
| 4-Person Families | 22 (7.8%) | $54,286 |
| 5-Person Families | 34 (12.1%) | $0 |
| 6-Person Families | 8 (2.9%) | $0 |
| 7+ Person Families | 3 (1.1%) | $0 |
| Total | 281 (100.0%) | $63,906 |
Family Income by Number of Earners in Williamstown borough
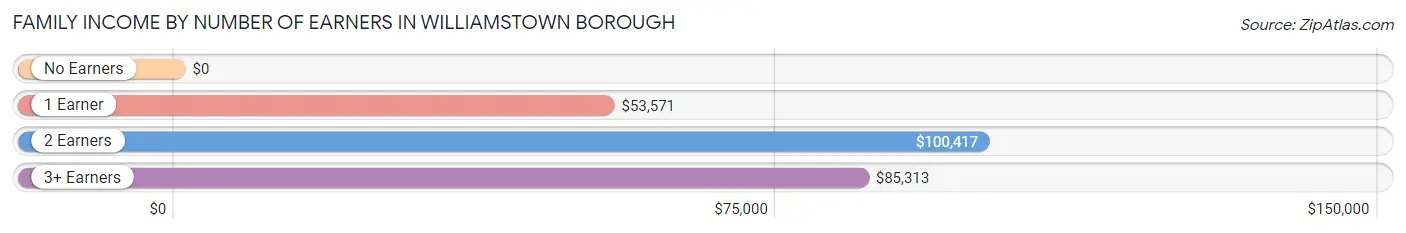
| Number of Earners | # Families | Median Income |
| No Earners | 80 (28.5%) | $0 |
| 1 Earner | 100 (35.6%) | $53,571 |
| 2 Earners | 78 (27.8%) | $100,417 |
| 3+ Earners | 23 (8.2%) | $85,313 |
| Total | 281 (100.0%) | $63,906 |
Household Income in Williamstown borough
Household Income Brackets in Williamstown borough
With 118 households falling in the category, the $50,000 to $74,999 income range is the most frequent in Williamstown borough, accounting for 22.6% of all households. In contrast, only 3 households (0.6%) fall into the $150,000 to $199,999 income bracket, making it the least populous group.
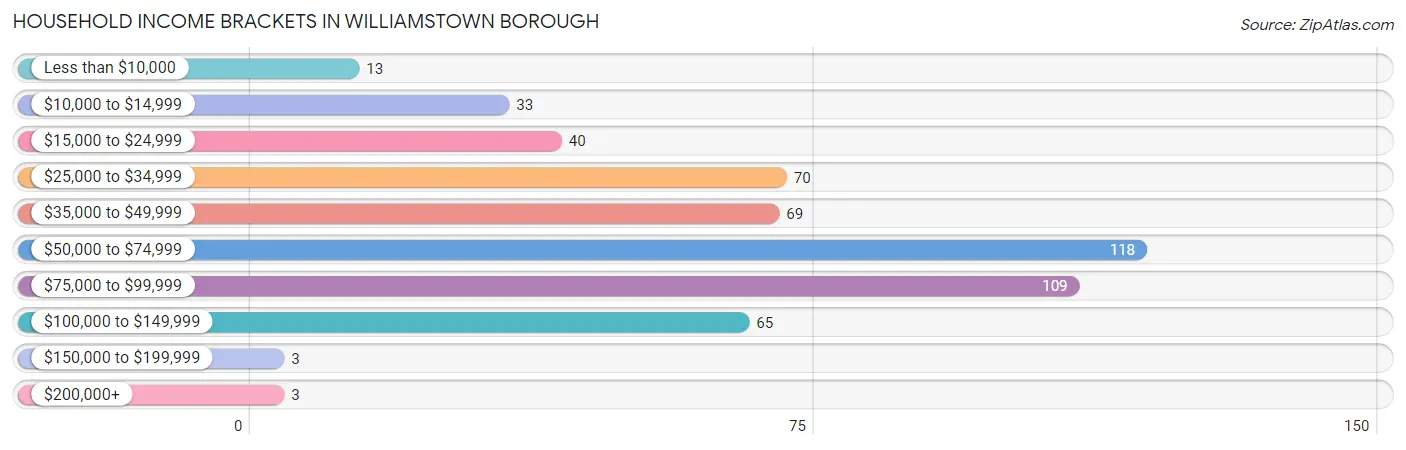
| Income Bracket | # Households | % Households |
| Less than $10,000 | 13 | 2.5% |
| $10,000 to $14,999 | 33 | 6.3% |
| $15,000 to $24,999 | 40 | 7.6% |
| $25,000 to $34,999 | 70 | 13.4% |
| $35,000 to $49,999 | 69 | 13.2% |
| $50,000 to $74,999 | 118 | 22.6% |
| $75,000 to $99,999 | 109 | 20.8% |
| $100,000 to $149,999 | 65 | 12.4% |
| $150,000 to $199,999 | 3 | 0.6% |
| $200,000+ | 3 | 0.6% |
Household Income by Householder Age in Williamstown borough
The median household income in Williamstown borough is $58,015, with the highest median household income of $79,313 found in the 15 to 24 years age bracket for the primary householder. A total of 39 households (7.5%) fall into this category. Meanwhile, the 65+ years age bracket for the primary householder has the lowest median household income of $31,985, with 151 households (28.9%) in this group.
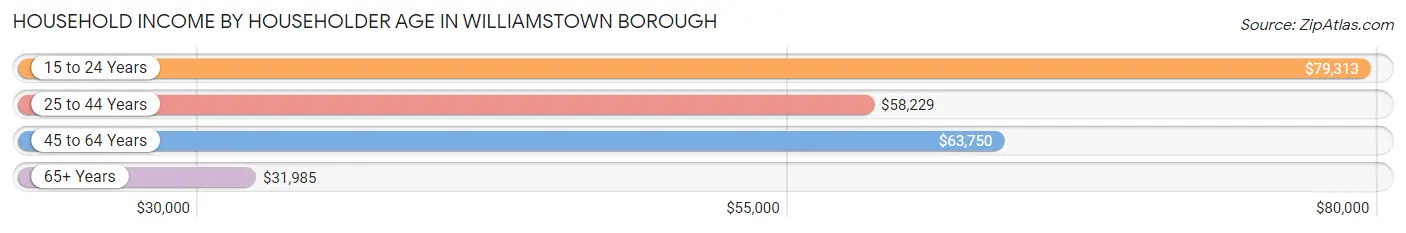
| Income Bracket | # Households | Median Income |
| 15 to 24 Years | 39 (7.5%) | $79,313 |
| 25 to 44 Years | 93 (17.8%) | $58,229 |
| 45 to 64 Years | 240 (45.9%) | $63,750 |
| 65+ Years | 151 (28.9%) | $31,985 |
| Total | 523 (100.0%) | $58,015 |
Poverty in Williamstown borough
Income Below Poverty by Sex and Age in Williamstown borough
With 17.8% poverty level for males and 30.8% for females among the residents of Williamstown borough, 5 year old males and 5 year old females are the most vulnerable to poverty, with 6 males (100.0%) and 12 females (100.0%) in their respective age groups living below the poverty level.
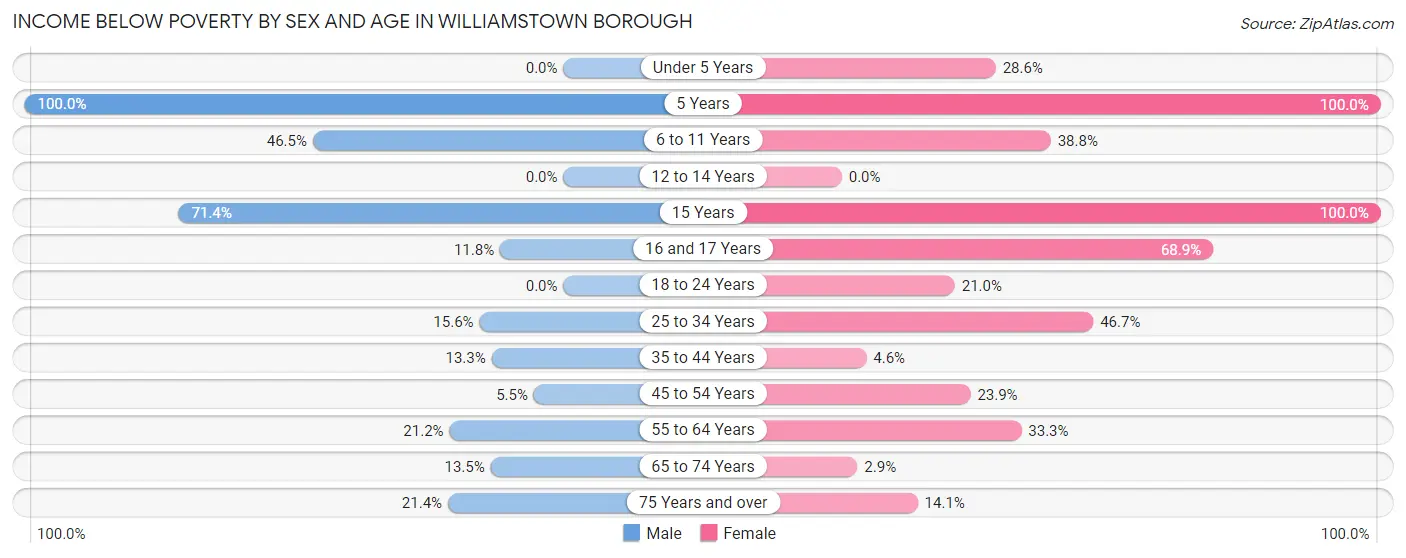
| Age Bracket | Male | Female |
| Under 5 Years | 0 (0.0%) | 14 (28.6%) |
| 5 Years | 6 (100.0%) | 12 (100.0%) |
| 6 to 11 Years | 20 (46.5%) | 19 (38.8%) |
| 12 to 14 Years | 0 (0.0%) | 0 (0.0%) |
| 15 Years | 5 (71.4%) | 6 (100.0%) |
| 16 and 17 Years | 2 (11.8%) | 31 (68.9%) |
| 18 to 24 Years | 0 (0.0%) | 13 (21.0%) |
| 25 to 34 Years | 12 (15.6%) | 42 (46.7%) |
| 35 to 44 Years | 8 (13.3%) | 1 (4.5%) |
| 45 to 54 Years | 4 (5.5%) | 16 (23.9%) |
| 55 to 64 Years | 22 (21.1%) | 35 (33.3%) |
| 65 to 74 Years | 5 (13.5%) | 2 (2.9%) |
| 75 Years and over | 6 (21.4%) | 10 (14.1%) |
| Total | 90 (17.8%) | 201 (30.8%) |
Income Above Poverty by Sex and Age in Williamstown borough
According to the poverty statistics in Williamstown borough, males aged under 5 years and females aged 12 to 14 years are the age groups that are most secure financially, with 100.0% of males and 100.0% of females in these age groups living above the poverty line.
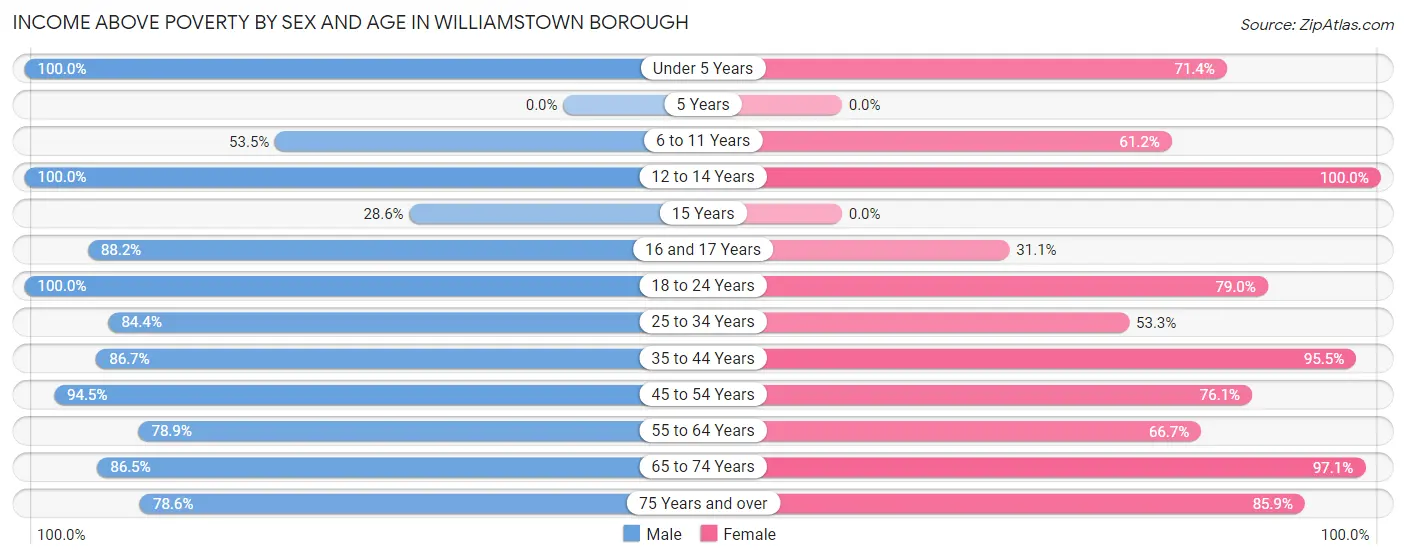
| Age Bracket | Male | Female |
| Under 5 Years | 11 (100.0%) | 35 (71.4%) |
| 5 Years | 0 (0.0%) | 0 (0.0%) |
| 6 to 11 Years | 23 (53.5%) | 30 (61.2%) |
| 12 to 14 Years | 16 (100.0%) | 6 (100.0%) |
| 15 Years | 2 (28.6%) | 0 (0.0%) |
| 16 and 17 Years | 15 (88.2%) | 14 (31.1%) |
| 18 to 24 Years | 27 (100.0%) | 49 (79.0%) |
| 25 to 34 Years | 65 (84.4%) | 48 (53.3%) |
| 35 to 44 Years | 52 (86.7%) | 21 (95.5%) |
| 45 to 54 Years | 69 (94.5%) | 51 (76.1%) |
| 55 to 64 Years | 82 (78.8%) | 70 (66.7%) |
| 65 to 74 Years | 32 (86.5%) | 67 (97.1%) |
| 75 Years and over | 22 (78.6%) | 61 (85.9%) |
| Total | 416 (82.2%) | 452 (69.2%) |
Income Below Poverty Among Married-Couple Families in Williamstown borough
The poverty statistics for married-couple families in Williamstown borough show that 9.9% or 18 of the total 181 families live below the poverty line. Families with 5 or more children have the highest poverty rate of 100.0%, comprising of 1 families. On the other hand, families with 1 or 2 children have the lowest poverty rate of 0.0%, which includes 0 families.
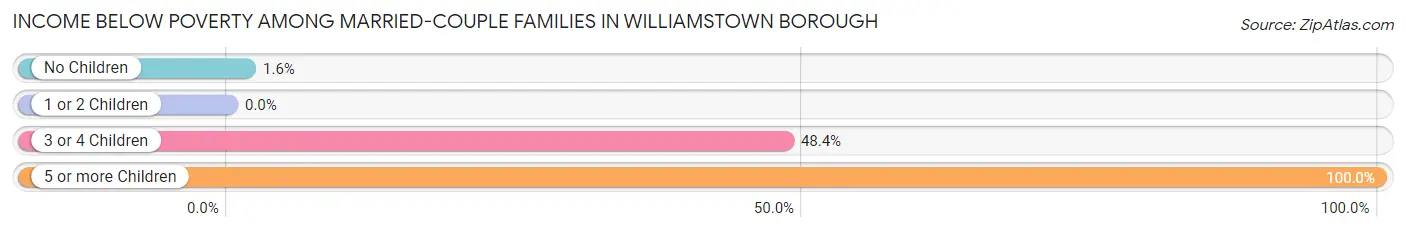
| Children | Above Poverty | Below Poverty |
| No Children | 125 (98.4%) | 2 (1.6%) |
| 1 or 2 Children | 22 (100.0%) | 0 (0.0%) |
| 3 or 4 Children | 16 (51.6%) | 15 (48.4%) |
| 5 or more Children | 0 (0.0%) | 1 (100.0%) |
| Total | 163 (90.1%) | 18 (9.9%) |
Income Below Poverty Among Single-Parent Households in Williamstown borough
According to the poverty data in Williamstown borough, 13.5% or 5 single-father households and 65.1% or 41 single-mother households are living below the poverty line. Among single-father households, those with 1 or 2 children have the highest poverty rate, with 5 households (16.7%) experiencing poverty. Likewise, among single-mother households, those with 5 or more children have the highest poverty rate, with 2 households (100.0%) falling below the poverty line.
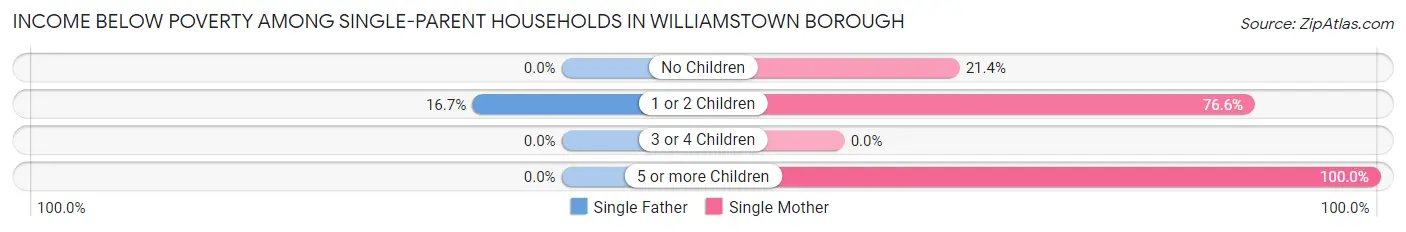
| Children | Single Father | Single Mother |
| No Children | 0 (0.0%) | 3 (21.4%) |
| 1 or 2 Children | 5 (16.7%) | 36 (76.6%) |
| 3 or 4 Children | 0 (0.0%) | 0 (0.0%) |
| 5 or more Children | 0 (0.0%) | 2 (100.0%) |
| Total | 5 (13.5%) | 41 (65.1%) |
Income Below Poverty Among Married-Couple vs Single-Parent Households in Williamstown borough
The poverty data for Williamstown borough shows that 18 of the married-couple family households (9.9%) and 46 of the single-parent households (46.0%) are living below the poverty level. Within the married-couple family households, those with 5 or more children have the highest poverty rate, with 1 households (100.0%) falling below the poverty line. Among the single-parent households, those with 5 or more children have the highest poverty rate, with 2 household (100.0%) living below poverty.
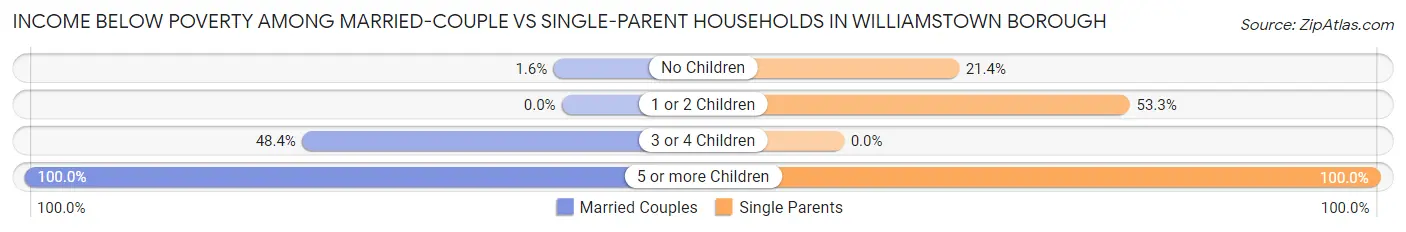
| Children | Married-Couple Families | Single-Parent Households |
| No Children | 2 (1.6%) | 3 (21.4%) |
| 1 or 2 Children | 0 (0.0%) | 41 (53.2%) |
| 3 or 4 Children | 15 (48.4%) | 0 (0.0%) |
| 5 or more Children | 1 (100.0%) | 2 (100.0%) |
| Total | 18 (9.9%) | 46 (46.0%) |
Race in Williamstown borough
The most populous races in Williamstown borough are White / Caucasian (1,023 | 88.0%), Hispanic or Latino (120 | 10.3%), and Two or more Races (71 | 6.1%).
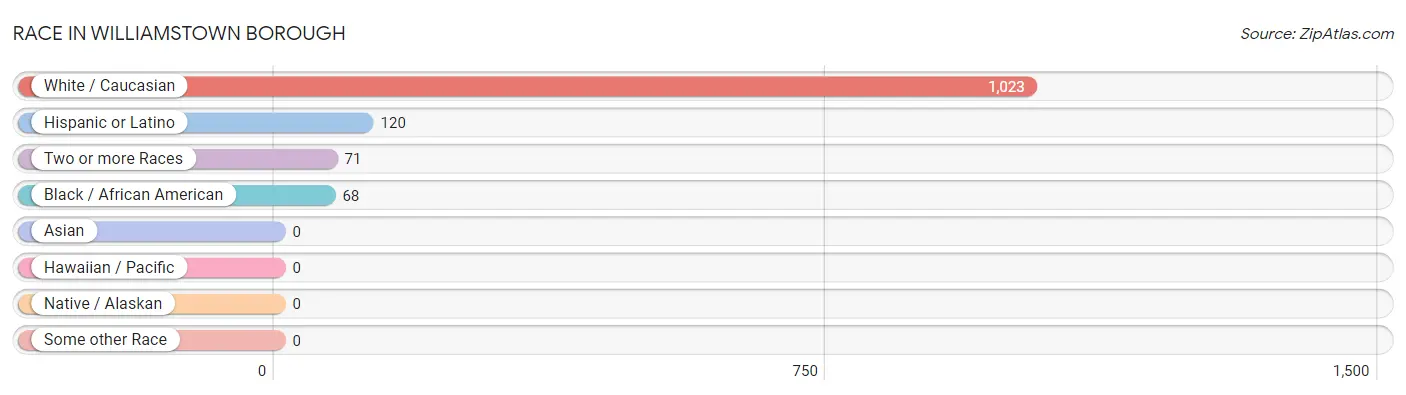
| Race | # Population | % Population |
| Asian | 0 | 0.0% |
| Black / African American | 68 | 5.9% |
| Hawaiian / Pacific | 0 | 0.0% |
| Hispanic or Latino | 120 | 10.3% |
| Native / Alaskan | 0 | 0.0% |
| White / Caucasian | 1,023 | 88.0% |
| Two or more Races | 71 | 6.1% |
| Some other Race | 0 | 0.0% |
| Total | 1,162 | 100.0% |
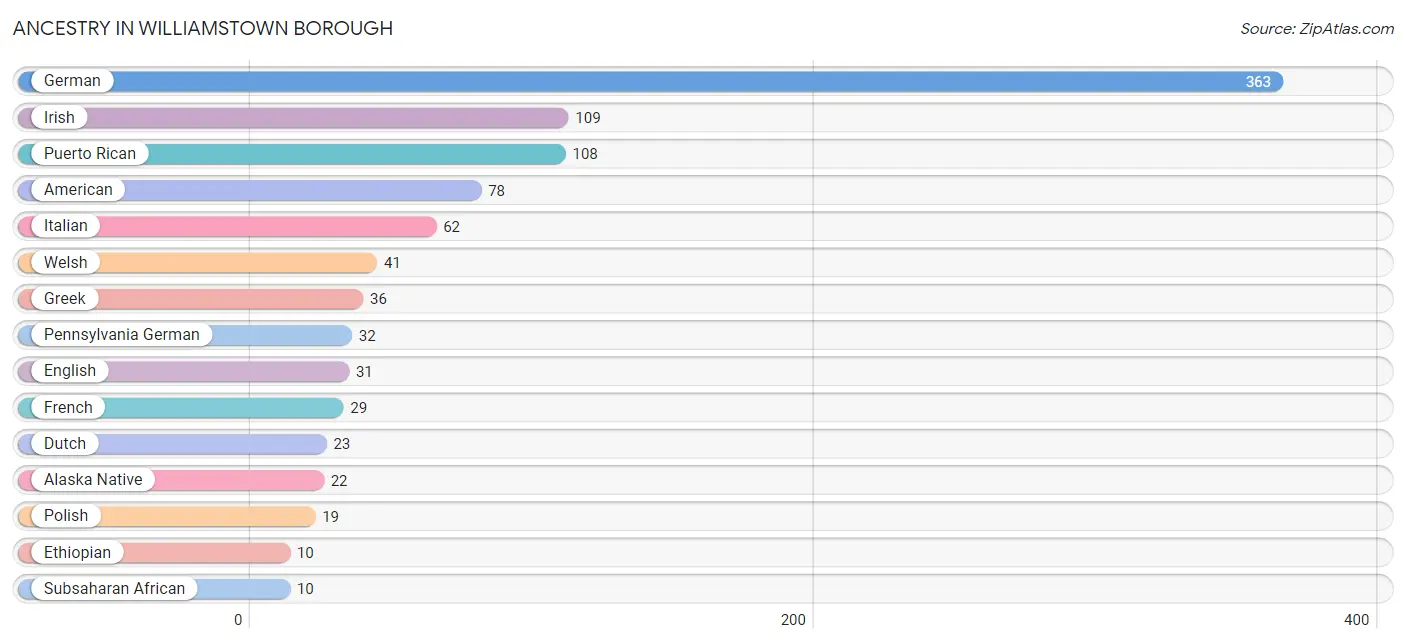
Ancestry in Williamstown borough
The most populous ancestries reported in Williamstown borough are German (363 | 31.2%), Irish (109 | 9.4%), Puerto Rican (108 | 9.3%), American (78 | 6.7%), and Italian (62 | 5.3%), together accounting for 62.0% of all Williamstown borough residents.
| Ancestry | # Population | % Population |
| Alaska Native | 22 | 1.9% |
| American | 78 | 6.7% |
| British | 2 | 0.2% |
| Czech | 3 | 0.3% |
| Czechoslovakian | 1 | 0.1% |
| Dominican | 7 | 0.6% |
| Dutch | 23 | 2.0% |
| English | 31 | 2.7% |
| Ethiopian | 10 | 0.9% |
| European | 5 | 0.4% |
| French | 29 | 2.5% |
| German | 363 | 31.2% |
| Greek | 36 | 3.1% |
| Hungarian | 6 | 0.5% |
| Irish | 109 | 9.4% |
| Italian | 62 | 5.3% |
| Jamaican | 5 | 0.4% |
| Lithuanian | 2 | 0.2% |
| Pennsylvania German | 32 | 2.8% |
| Polish | 19 | 1.6% |
| Portuguese | 4 | 0.3% |
| Puerto Rican | 108 | 9.3% |
| Romanian | 2 | 0.2% |
| Russian | 4 | 0.3% |
| Spaniard | 5 | 0.4% |
| Subsaharan African | 10 | 0.9% |
| Swedish | 5 | 0.4% |
| Swiss | 5 | 0.4% |
| Welsh | 41 | 3.5% | View All 29 Rows |
Immigrants in Williamstown borough
The most numerous immigrant groups reported in Williamstown borough came from Africa (2 | 0.2%), Eastern Africa (2 | 0.2%), Ethiopia (2 | 0.2%), Europe (2 | 0.2%), and Northern Europe (2 | 0.2%), together accounting for 0.8% of all Williamstown borough residents.
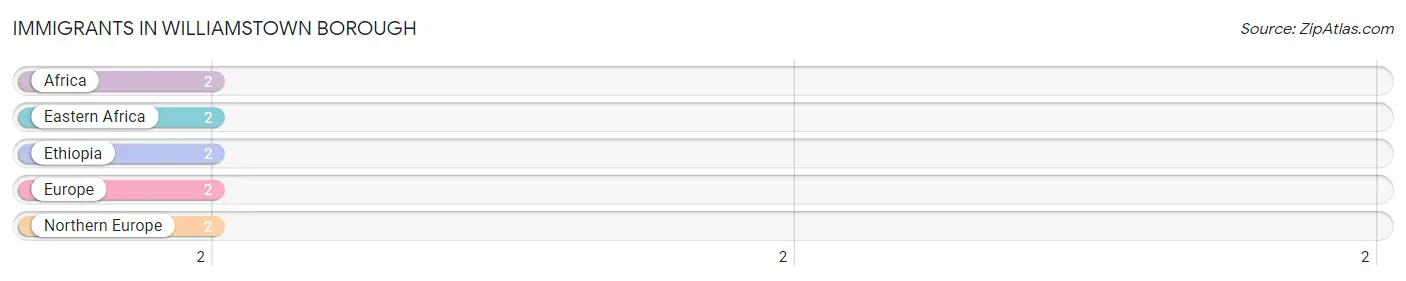
| Immigration Origin | # Population | % Population |
| Africa | 2 | 0.2% |
| Eastern Africa | 2 | 0.2% |
| Ethiopia | 2 | 0.2% |
| Europe | 2 | 0.2% |
| Northern Europe | 2 | 0.2% | View All 5 Rows |
Sex and Age in Williamstown borough
Sex and Age in Williamstown borough
The most populous age groups in Williamstown borough are 60 to 64 Years (53 | 10.4%) for men and 55 to 59 Years (75 | 11.5%) for women.
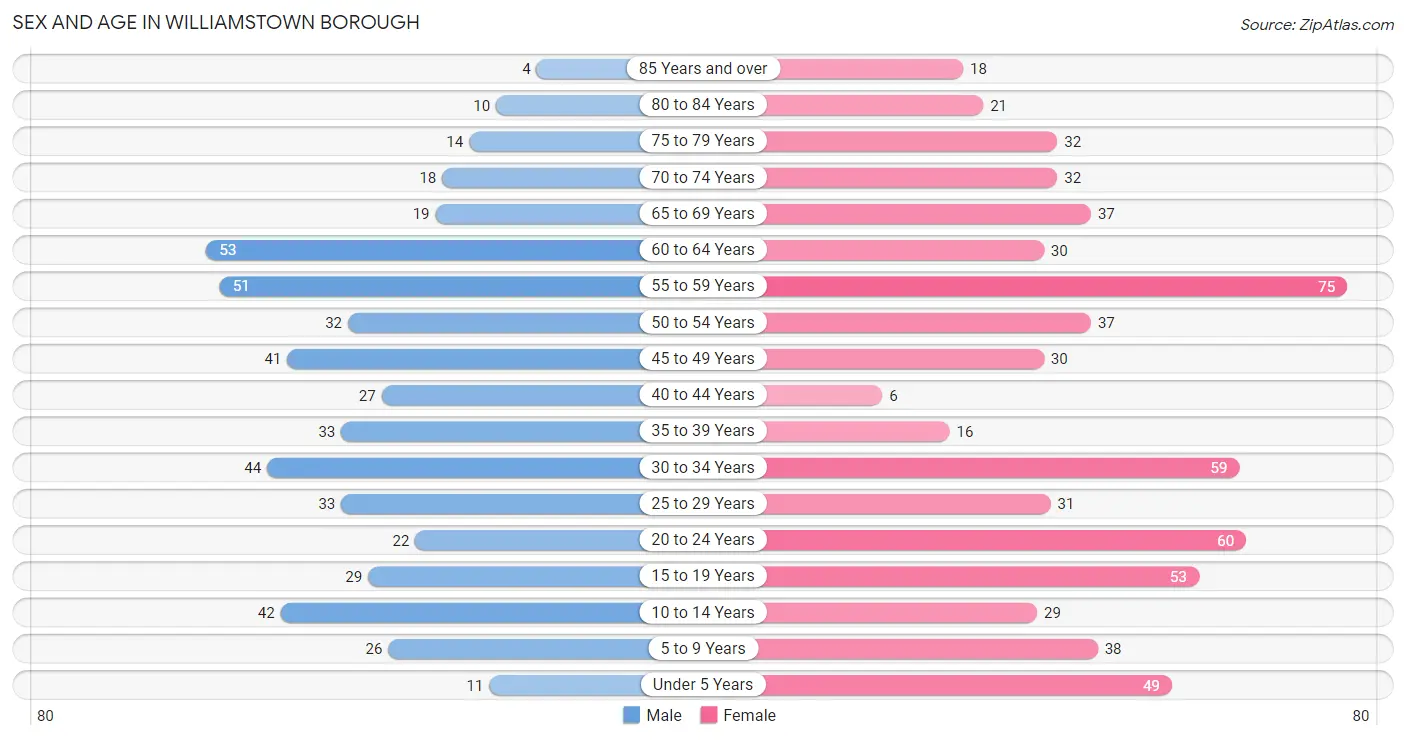
| Age Bracket | Male | Female |
| Under 5 Years | 11 (2.2%) | 49 (7.5%) |
| 5 to 9 Years | 26 (5.1%) | 38 (5.8%) |
| 10 to 14 Years | 42 (8.3%) | 29 (4.4%) |
| 15 to 19 Years | 29 (5.7%) | 53 (8.1%) |
| 20 to 24 Years | 22 (4.3%) | 60 (9.2%) |
| 25 to 29 Years | 33 (6.5%) | 31 (4.8%) |
| 30 to 34 Years | 44 (8.6%) | 59 (9.0%) |
| 35 to 39 Years | 33 (6.5%) | 16 (2.5%) |
| 40 to 44 Years | 27 (5.3%) | 6 (0.9%) |
| 45 to 49 Years | 41 (8.1%) | 30 (4.6%) |
| 50 to 54 Years | 32 (6.3%) | 37 (5.7%) |
| 55 to 59 Years | 51 (10.0%) | 75 (11.5%) |
| 60 to 64 Years | 53 (10.4%) | 30 (4.6%) |
| 65 to 69 Years | 19 (3.7%) | 37 (5.7%) |
| 70 to 74 Years | 18 (3.5%) | 32 (4.9%) |
| 75 to 79 Years | 14 (2.8%) | 32 (4.9%) |
| 80 to 84 Years | 10 (2.0%) | 21 (3.2%) |
| 85 Years and over | 4 (0.8%) | 18 (2.8%) |
| Total | 509 (100.0%) | 653 (100.0%) |
Families and Households in Williamstown borough
Median Family Size in Williamstown borough
The median family size in Williamstown borough is 2.78 persons per family, with married-couple families (181 | 64.4%) accounting for the largest median family size of 2.98 persons per family. On the other hand, single female/mother families (63 | 22.4%) represent the smallest median family size with 2.38 persons per family.
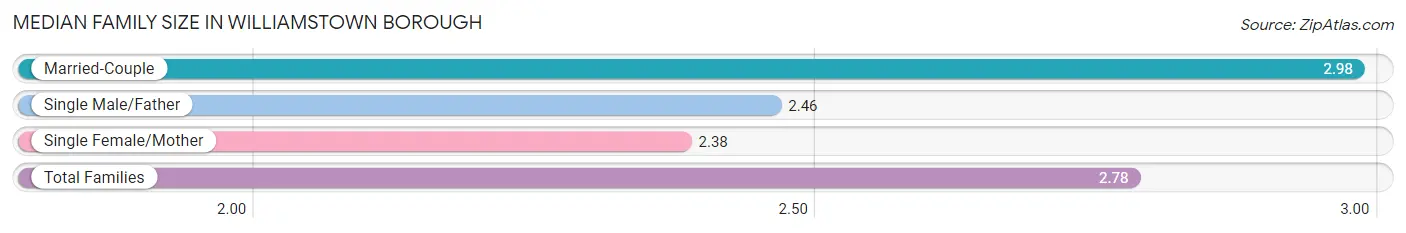
| Family Type | # Families | Family Size |
| Married-Couple | 181 (64.4%) | 2.98 |
| Single Male/Father | 37 (13.2%) | 2.46 |
| Single Female/Mother | 63 (22.4%) | 2.38 |
| Total Families | 281 (100.0%) | 2.78 |
Median Household Size in Williamstown borough
The median household size in Williamstown borough is 2.22 persons per household, with single male/father households (37 | 7.1%) accounting for the largest median household size of 3.3 persons per household. non-family households (242 | 46.3%) represent the smallest median household size with 1.29 persons per household.
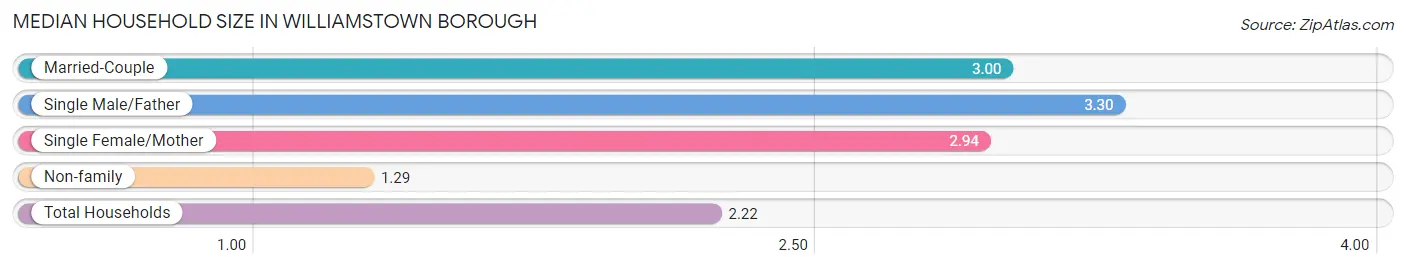
| Household Type | # Households | Household Size |
| Married-Couple | 181 (34.6%) | 3.00 |
| Single Male/Father | 37 (7.1%) | 3.30 |
| Single Female/Mother | 63 (12.0%) | 2.94 |
| Non-family | 242 (46.3%) | 1.29 |
| Total Households | 523 (100.0%) | 2.22 |
Household Size by Marriage Status in Williamstown borough
Out of a total of 523 households in Williamstown borough, 281 (53.7%) are family households, while 242 (46.3%) are nonfamily households. The most numerous type of family households are 2-person households, comprising 128, and the most common type of nonfamily households are 1-person households, comprising 170.
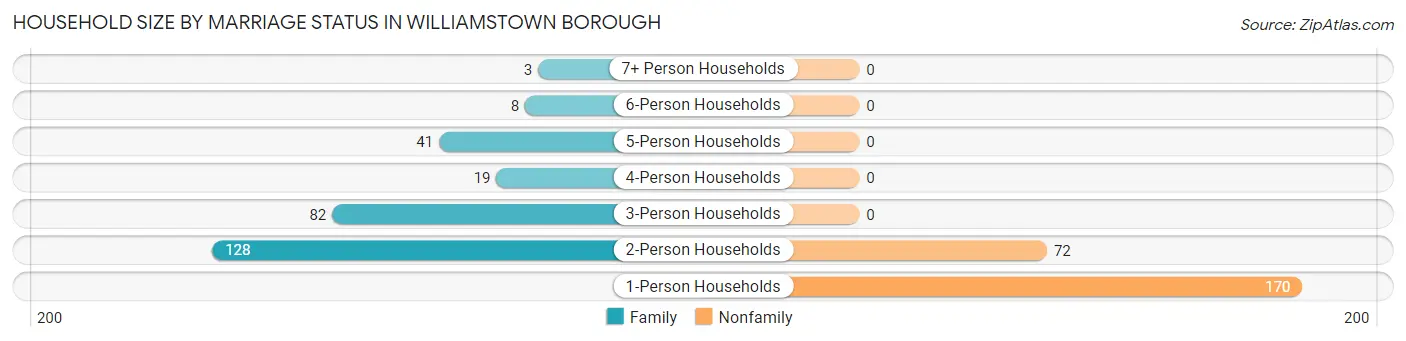
| Household Size | Family Households | Nonfamily Households |
| 1-Person Households | - | 170 (32.5%) |
| 2-Person Households | 128 (24.5%) | 72 (13.8%) |
| 3-Person Households | 82 (15.7%) | 0 (0.0%) |
| 4-Person Households | 19 (3.6%) | 0 (0.0%) |
| 5-Person Households | 41 (7.8%) | 0 (0.0%) |
| 6-Person Households | 8 (1.5%) | 0 (0.0%) |
| 7+ Person Households | 3 (0.6%) | 0 (0.0%) |
| Total | 281 (53.7%) | 242 (46.3%) |
Female Fertility in Williamstown borough
Fertility by Age in Williamstown borough
Average fertility rate in Williamstown borough is 4.0 births per 1,000 women. Women in the age bracket of 35 to 50 years have the highest fertility rate with 17.0 births per 1,000 women. Women in the age bracket of 35 to 50 years acount for 100.0% of all women with births.
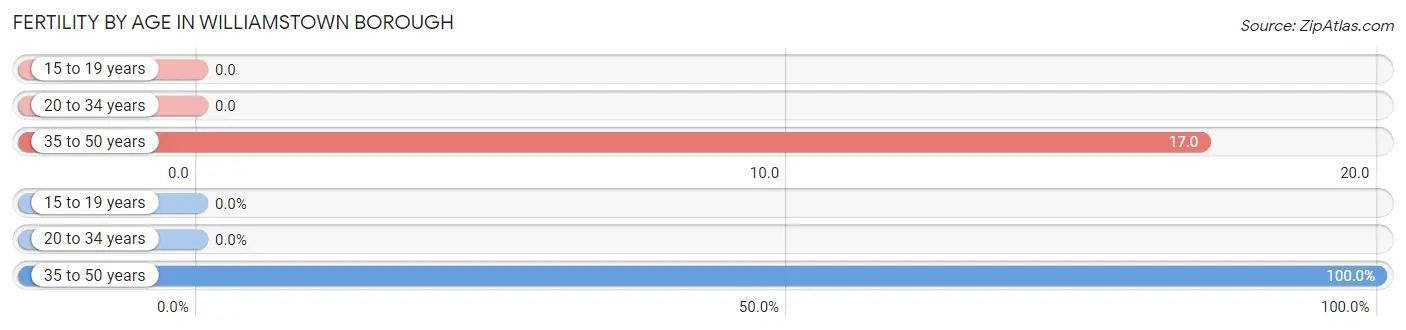
| Age Bracket | Women with Births | Births / 1,000 Women |
| 15 to 19 years | 0 (0.0%) | 0.0 |
| 20 to 34 years | 0 (0.0%) | 0.0 |
| 35 to 50 years | 1 (100.0%) | 17.0 |
| Total | 1 (100.0%) | 4.0 |
Fertility by Age by Marriage Status in Williamstown borough
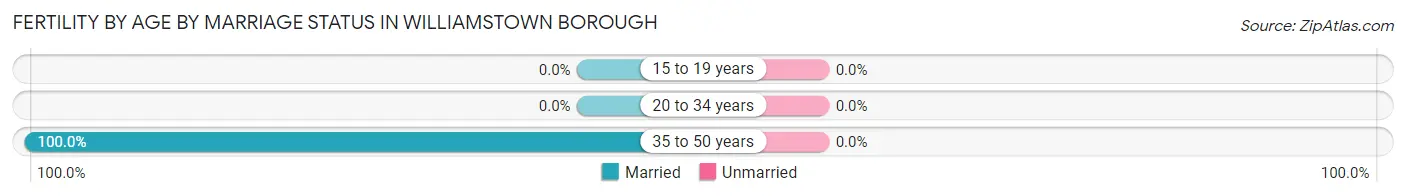
| Age Bracket | Married | Unmarried |
| 15 to 19 years | 0 (0.0%) | 0 (0.0%) |
| 20 to 34 years | 0 (0.0%) | 0 (0.0%) |
| 35 to 50 years | 1 (100.0%) | 0 (0.0%) |
| Total | 1 (100.0%) | 0 (0.0%) |
Fertility by Education in Williamstown borough
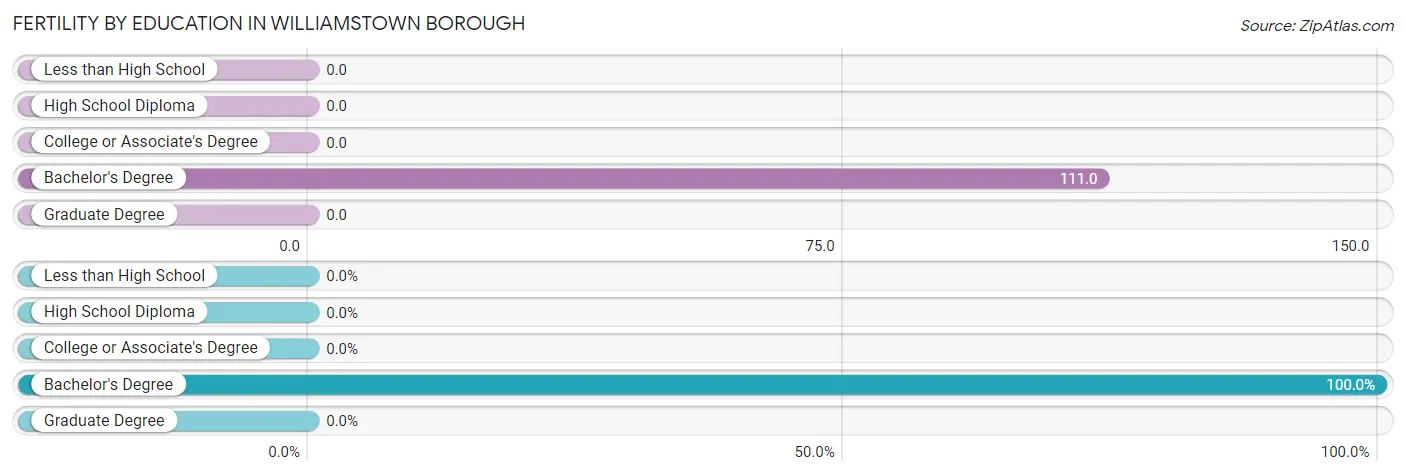
| Educational Attainment | Women with Births | Births / 1,000 Women |
| Less than High School | 0 (0.0%) | 0.0 |
| High School Diploma | 0 (0.0%) | 0.0 |
| College or Associate's Degree | 0 (0.0%) | 0.0 |
| Bachelor's Degree | 1 (100.0%) | 111.0 |
| Graduate Degree | 0 (0.0%) | 0.0 |
| Total | 1 (100.0%) | 4.0 |
Fertility by Education by Marriage Status in Williamstown borough
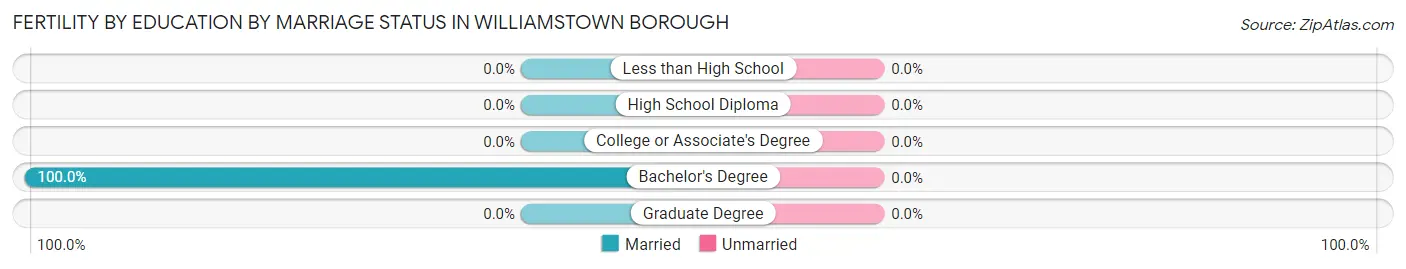
| Educational Attainment | Married | Unmarried |
| Less than High School | 0 (0.0%) | 0 (0.0%) |
| High School Diploma | 0 (0.0%) | 0 (0.0%) |
| College or Associate's Degree | 0 (0.0%) | 0 (0.0%) |
| Bachelor's Degree | 1 (100.0%) | 0 (0.0%) |
| Graduate Degree | 0 (0.0%) | 0 (0.0%) |
| Total | 1 (100.0%) | 0 (0.0%) |
Employment Characteristics in Williamstown borough
Employment by Class of Employer in Williamstown borough
Among the 486 employed individuals in Williamstown borough, private company employees (365 | 75.1%), not-for-profit organizations (40 | 8.2%), and local government employees (35 | 7.2%) make up the most common classes of employment.
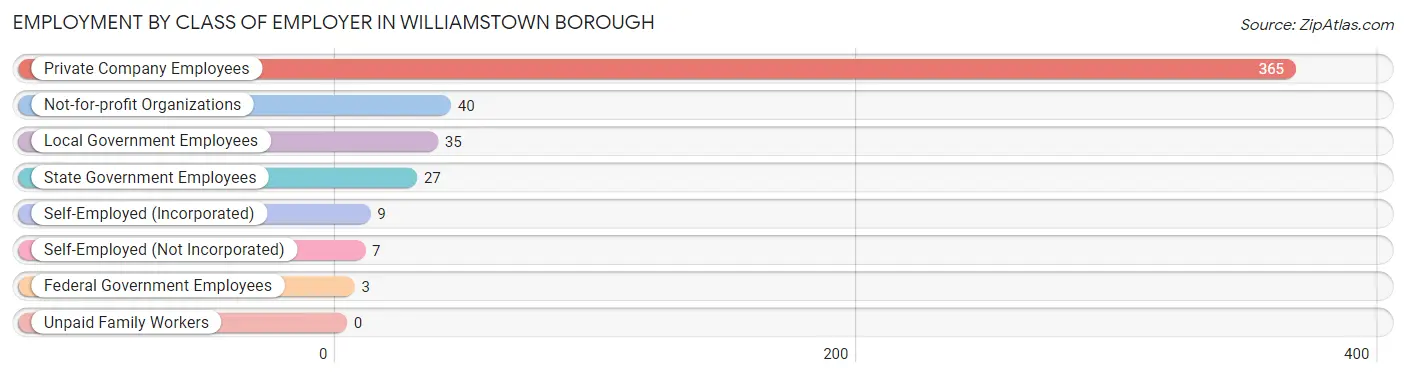
| Employer Class | # Employees | % Employees |
| Private Company Employees | 365 | 75.1% |
| Self-Employed (Incorporated) | 9 | 1.8% |
| Self-Employed (Not Incorporated) | 7 | 1.4% |
| Not-for-profit Organizations | 40 | 8.2% |
| Local Government Employees | 35 | 7.2% |
| State Government Employees | 27 | 5.6% |
| Federal Government Employees | 3 | 0.6% |
| Unpaid Family Workers | 0 | 0.0% |
| Total | 486 | 100.0% |
Employment Status by Age in Williamstown borough
According to the labor force statistics for Williamstown borough, out of the total population over 16 years of age (954), 54.6% or 521 individuals are in the labor force, with 5.2% or 27 of them unemployed. The age group with the highest labor force participation rate is 35 to 44 years, with 90.2% or 74 individuals in the labor force. Within the labor force, the 75 years and over age range has the highest percentage of unemployed individuals, with 42.9% or 3 of them being unemployed.
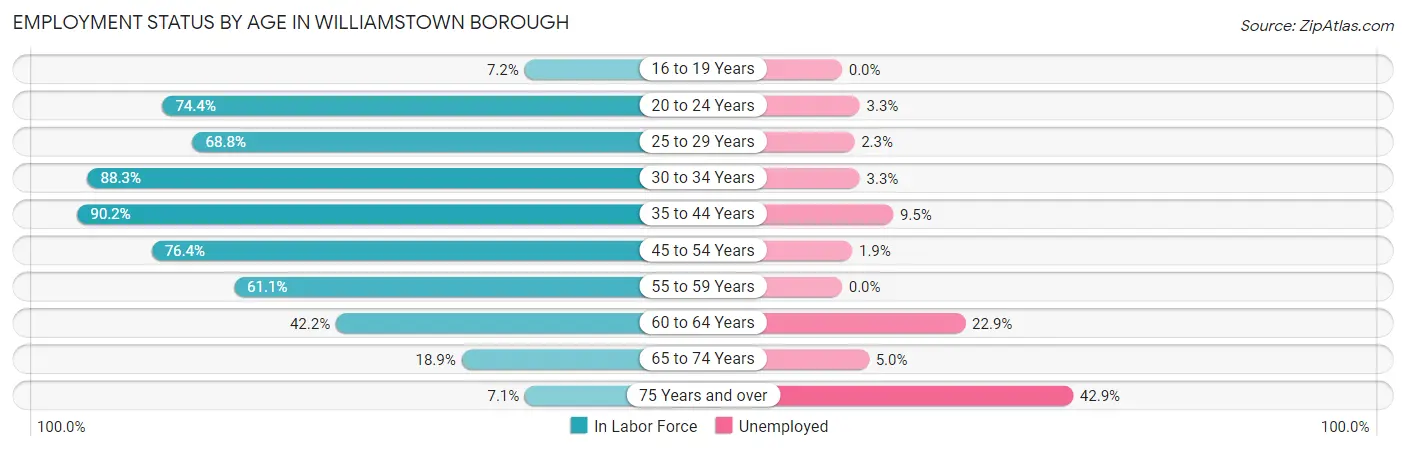
| Age Bracket | In Labor Force | Unemployed |
| 16 to 19 Years | 5 (7.2%) | 0 (0.0%) |
| 20 to 24 Years | 61 (74.4%) | 2 (3.3%) |
| 25 to 29 Years | 44 (68.8%) | 1 (2.3%) |
| 30 to 34 Years | 91 (88.3%) | 3 (3.3%) |
| 35 to 44 Years | 74 (90.2%) | 7 (9.5%) |
| 45 to 54 Years | 107 (76.4%) | 2 (1.9%) |
| 55 to 59 Years | 77 (61.1%) | 0 (0.0%) |
| 60 to 64 Years | 35 (42.2%) | 8 (22.9%) |
| 65 to 74 Years | 20 (18.9%) | 1 (5.0%) |
| 75 Years and over | 7 (7.1%) | 3 (42.9%) |
| Total | 521 (54.6%) | 27 (5.2%) |
Employment Status by Educational Attainment in Williamstown borough
According to labor force statistics for Williamstown borough, 71.6% of individuals (428) out of the total population between 25 and 64 years of age (598) are in the labor force, with 4.9% or 21 of them being unemployed. The group with the highest labor force participation rate are those with the educational attainment of college / associate degree, with 93.7% or 163 individuals in the labor force. Within the labor force, individuals with college / associate degree education have the highest percentage of unemployment, with 7.4% or 12 of them being unemployed.
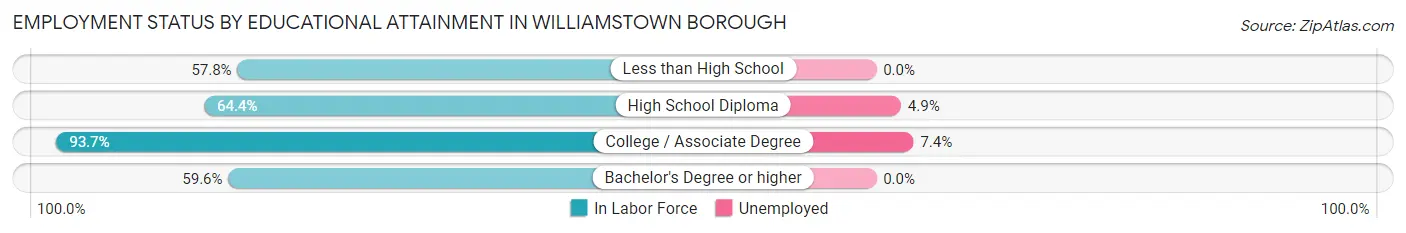
| Educational Attainment | In Labor Force | Unemployed |
| Less than High School | 48 (57.8%) | 0 (0.0%) |
| High School Diploma | 183 (64.4%) | 14 (4.9%) |
| College / Associate Degree | 163 (93.7%) | 13 (7.4%) |
| Bachelor's Degree or higher | 34 (59.6%) | 0 (0.0%) |
| Total | 428 (71.6%) | 29 (4.9%) |
Employment Occupations by Sex in Williamstown borough
Management, Business, Science and Arts Occupations
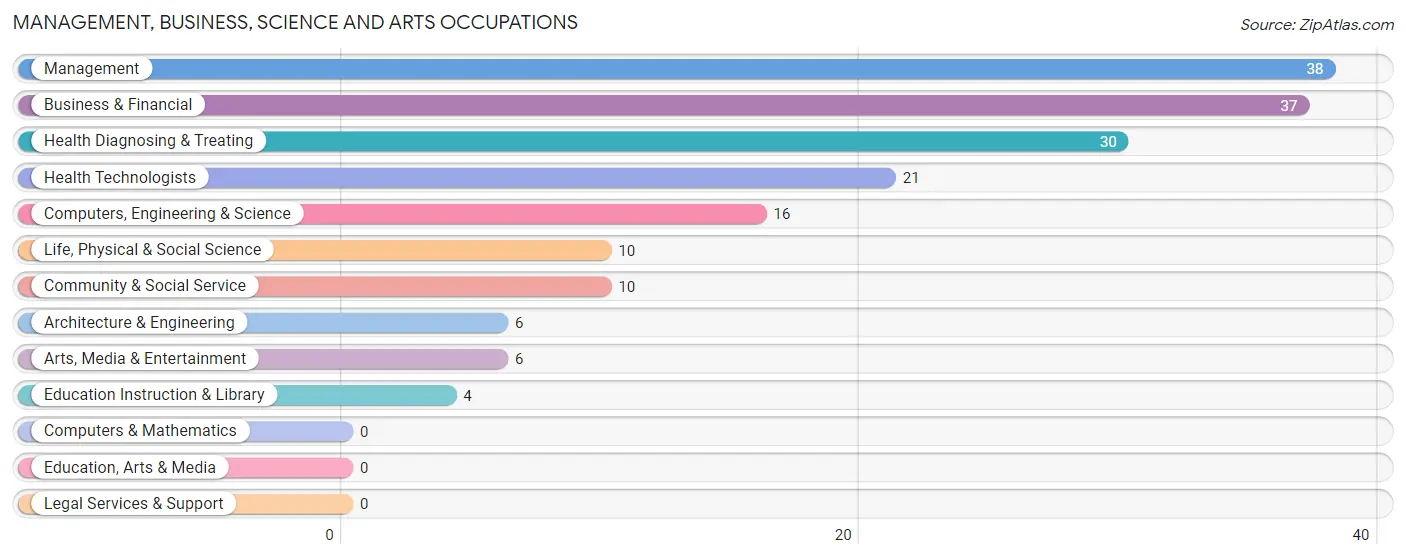
The most common Management, Business, Science and Arts occupations in Williamstown borough are Management (38 | 7.7%), Business & Financial (37 | 7.5%), Health Diagnosing & Treating (30 | 6.1%), Health Technologists (21 | 4.3%), and Computers, Engineering & Science (16 | 3.2%).
Management, Business, Science and Arts Occupations by Sex
Within the Management, Business, Science and Arts occupations in Williamstown borough, the most male-oriented occupations are Architecture & Engineering (100.0%), Computers, Engineering & Science (81.2%), and Business & Financial (70.3%), while the most female-oriented occupations are Education Instruction & Library (100.0%), Health Diagnosing & Treating (100.0%), and Health Technologists (100.0%).
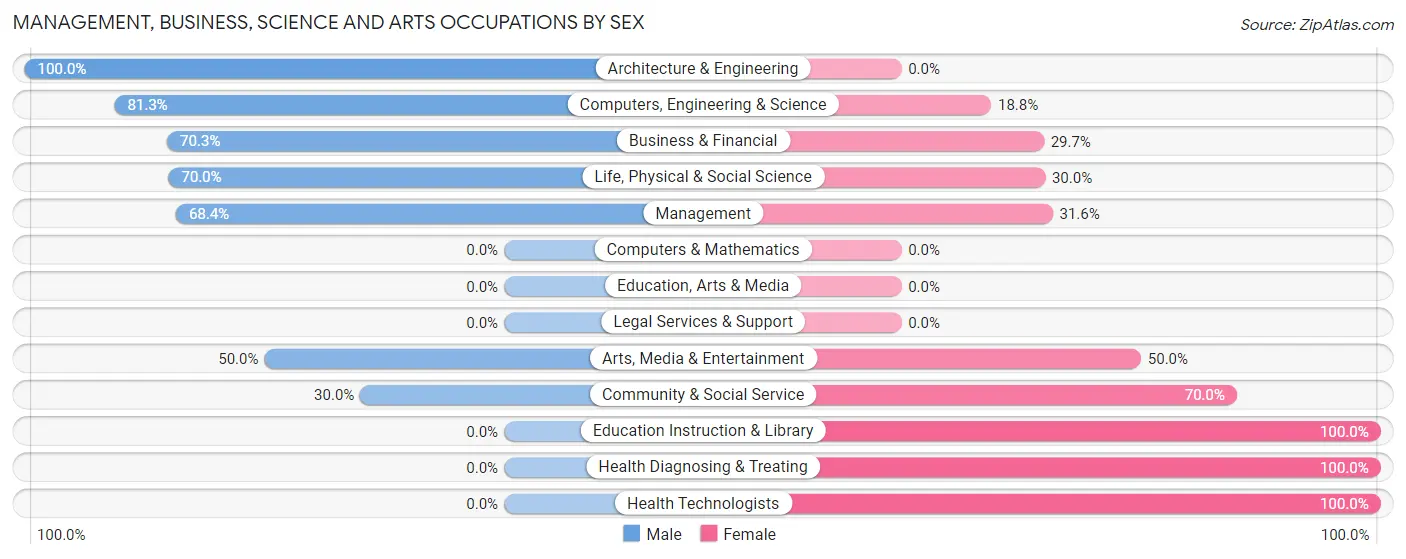
| Occupation | Male | Female |
| Management | 26 (68.4%) | 12 (31.6%) |
| Business & Financial | 26 (70.3%) | 11 (29.7%) |
| Computers, Engineering & Science | 13 (81.2%) | 3 (18.8%) |
| Computers & Mathematics | 0 (0.0%) | 0 (0.0%) |
| Architecture & Engineering | 6 (100.0%) | 0 (0.0%) |
| Life, Physical & Social Science | 7 (70.0%) | 3 (30.0%) |
| Community & Social Service | 3 (30.0%) | 7 (70.0%) |
| Education, Arts & Media | 0 (0.0%) | 0 (0.0%) |
| Legal Services & Support | 0 (0.0%) | 0 (0.0%) |
| Education Instruction & Library | 0 (0.0%) | 4 (100.0%) |
| Arts, Media & Entertainment | 3 (50.0%) | 3 (50.0%) |
| Health Diagnosing & Treating | 0 (0.0%) | 30 (100.0%) |
| Health Technologists | 0 (0.0%) | 21 (100.0%) |
| Total (Category) | 68 (51.9%) | 63 (48.1%) |
| Total (Overall) | 265 (53.6%) | 229 (46.4%) |
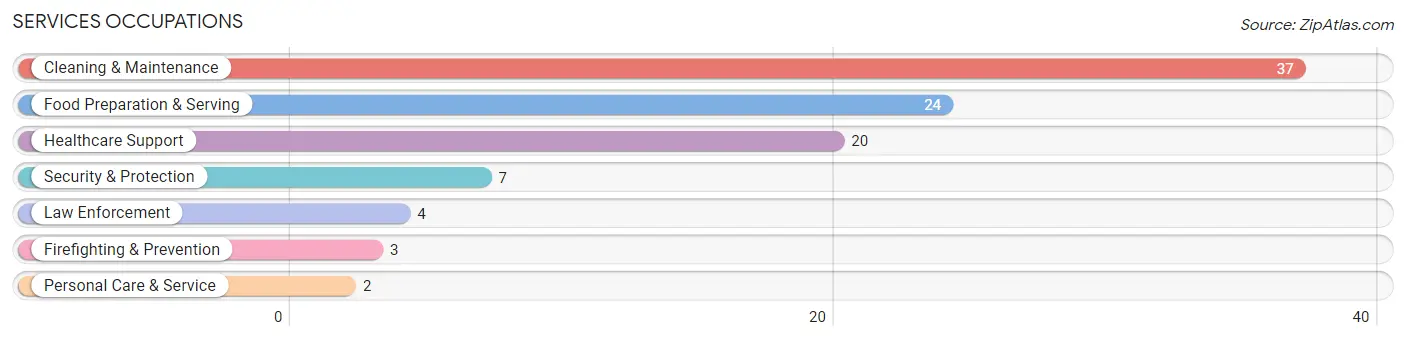
Services Occupations
The most common Services occupations in Williamstown borough are Cleaning & Maintenance (37 | 7.5%), Food Preparation & Serving (24 | 4.9%), Healthcare Support (20 | 4.1%), Security & Protection (7 | 1.4%), and Law Enforcement (4 | 0.8%).
Services Occupations by Sex
Within the Services occupations in Williamstown borough, the most male-oriented occupations are Security & Protection (100.0%), Firefighting & Prevention (100.0%), and Law Enforcement (100.0%), while the most female-oriented occupations are Healthcare Support (100.0%), Food Preparation & Serving (100.0%), and Personal Care & Service (100.0%).
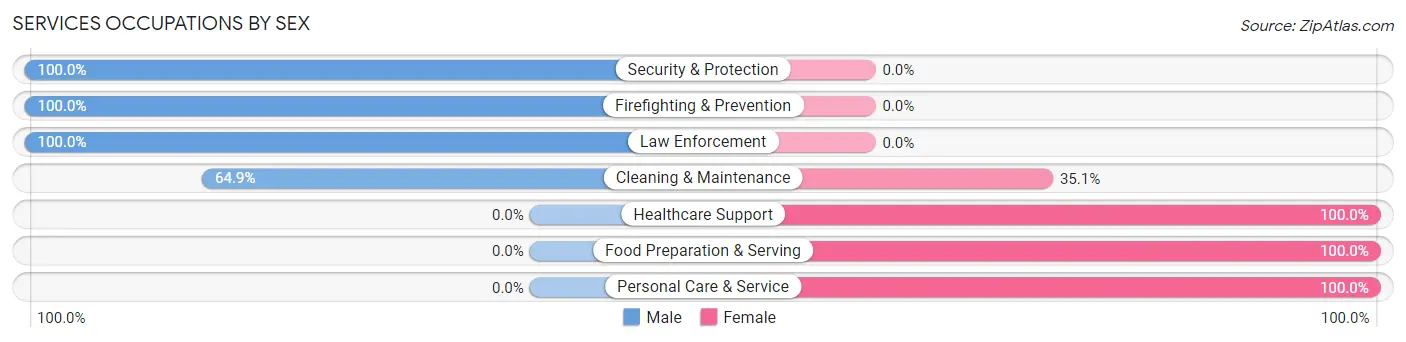
| Occupation | Male | Female |
| Healthcare Support | 0 (0.0%) | 20 (100.0%) |
| Security & Protection | 7 (100.0%) | 0 (0.0%) |
| Firefighting & Prevention | 3 (100.0%) | 0 (0.0%) |
| Law Enforcement | 4 (100.0%) | 0 (0.0%) |
| Food Preparation & Serving | 0 (0.0%) | 24 (100.0%) |
| Cleaning & Maintenance | 24 (64.9%) | 13 (35.1%) |
| Personal Care & Service | 0 (0.0%) | 2 (100.0%) |
| Total (Category) | 31 (34.4%) | 59 (65.6%) |
| Total (Overall) | 265 (53.6%) | 229 (46.4%) |
Sales and Office Occupations
The most common Sales and Office occupations in Williamstown borough are Office & Administration (61 | 12.3%), and Sales & Related (26 | 5.3%).
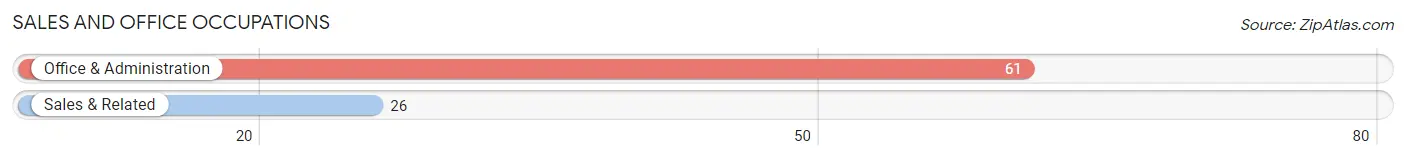
Sales and Office Occupations by Sex
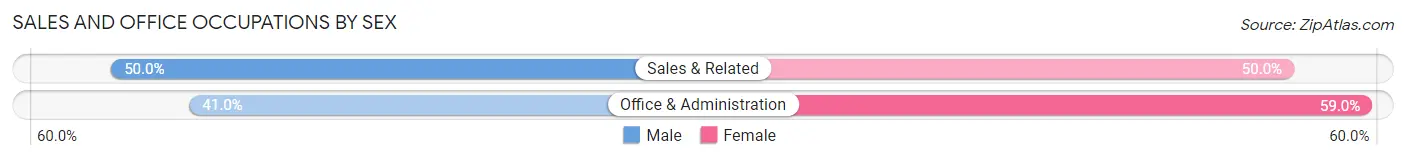
| Occupation | Male | Female |
| Sales & Related | 13 (50.0%) | 13 (50.0%) |
| Office & Administration | 25 (41.0%) | 36 (59.0%) |
| Total (Category) | 38 (43.7%) | 49 (56.3%) |
| Total (Overall) | 265 (53.6%) | 229 (46.4%) |
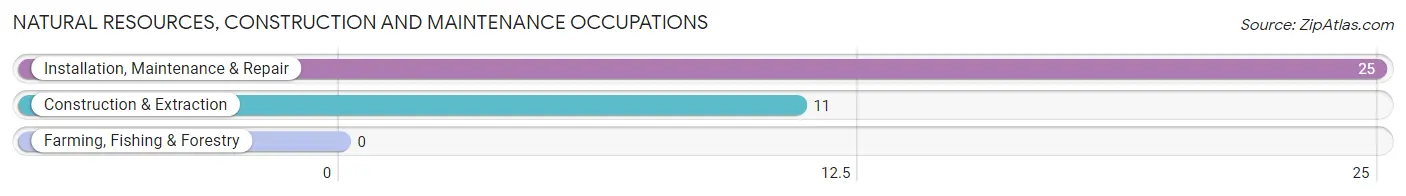
Natural Resources, Construction and Maintenance Occupations
The most common Natural Resources, Construction and Maintenance occupations in Williamstown borough are Installation, Maintenance & Repair (25 | 5.1%), and Construction & Extraction (11 | 2.2%).
Natural Resources, Construction and Maintenance Occupations by Sex
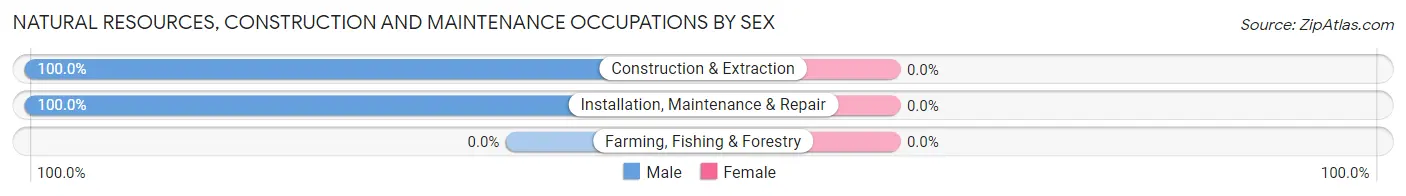
| Occupation | Male | Female |
| Farming, Fishing & Forestry | 0 (0.0%) | 0 (0.0%) |
| Construction & Extraction | 11 (100.0%) | 0 (0.0%) |
| Installation, Maintenance & Repair | 25 (100.0%) | 0 (0.0%) |
| Total (Category) | 36 (100.0%) | 0 (0.0%) |
| Total (Overall) | 265 (53.6%) | 229 (46.4%) |
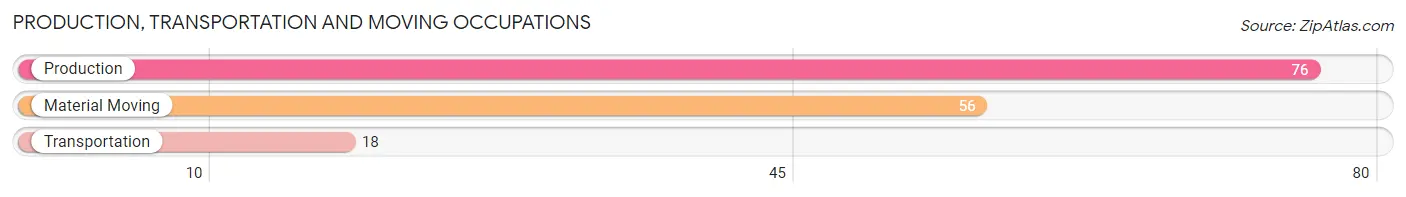
Production, Transportation and Moving Occupations
The most common Production, Transportation and Moving occupations in Williamstown borough are Production (76 | 15.4%), Material Moving (56 | 11.3%), and Transportation (18 | 3.6%).
Production, Transportation and Moving Occupations by Sex
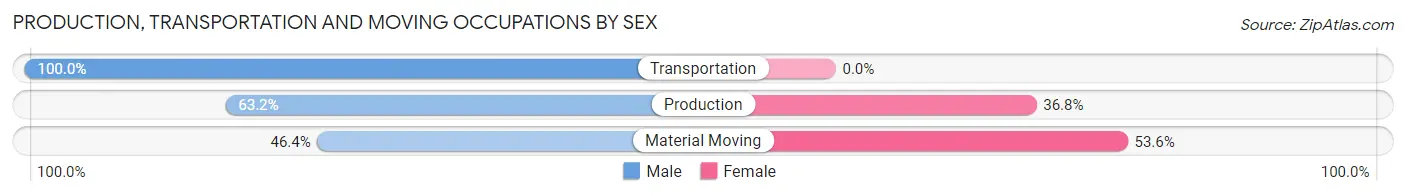
| Occupation | Male | Female |
| Production | 48 (63.2%) | 28 (36.8%) |
| Transportation | 18 (100.0%) | 0 (0.0%) |
| Material Moving | 26 (46.4%) | 30 (53.6%) |
| Total (Category) | 92 (61.3%) | 58 (38.7%) |
| Total (Overall) | 265 (53.6%) | 229 (46.4%) |
Employment Industries by Sex in Williamstown borough
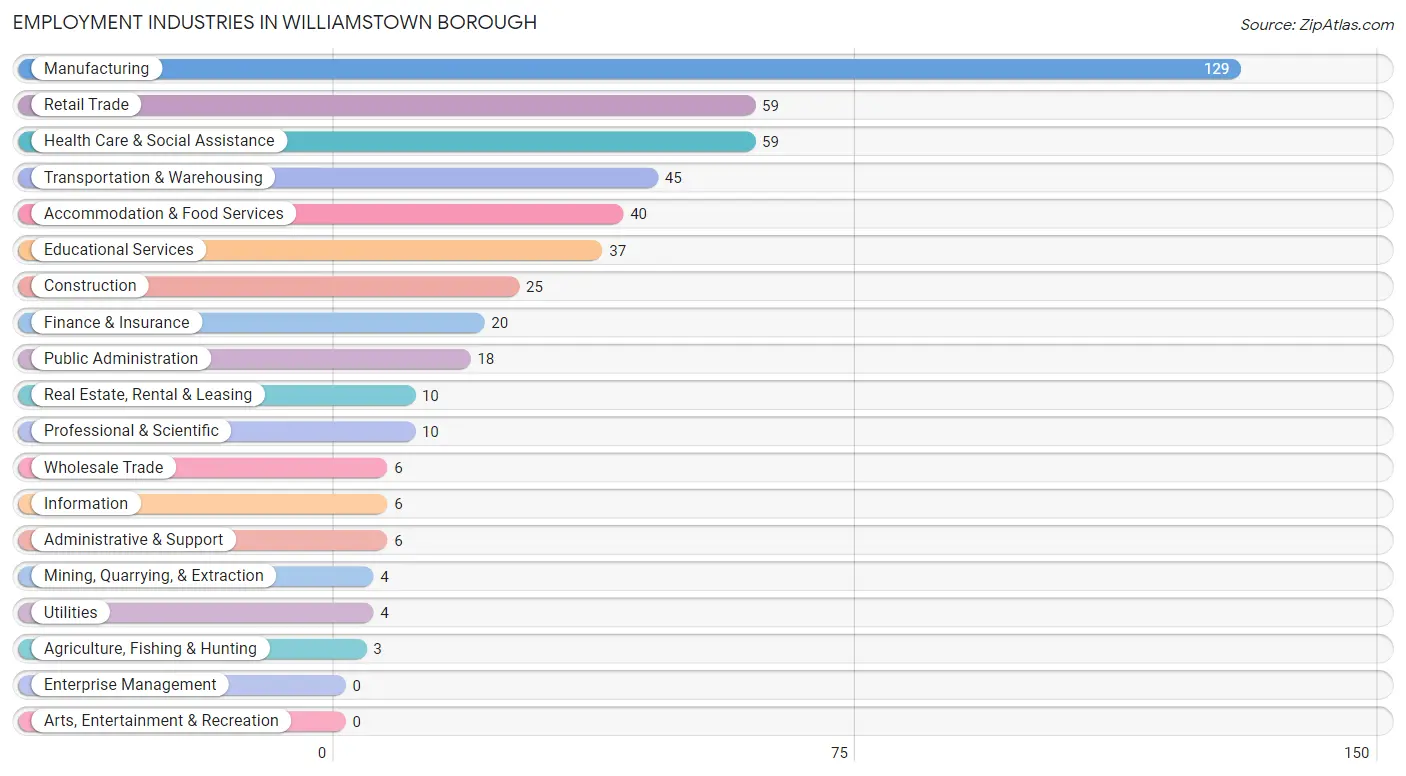
Employment Industries in Williamstown borough
The major employment industries in Williamstown borough include Manufacturing (129 | 26.1%), Retail Trade (59 | 11.9%), Health Care & Social Assistance (59 | 11.9%), Transportation & Warehousing (45 | 9.1%), and Accommodation & Food Services (40 | 8.1%).
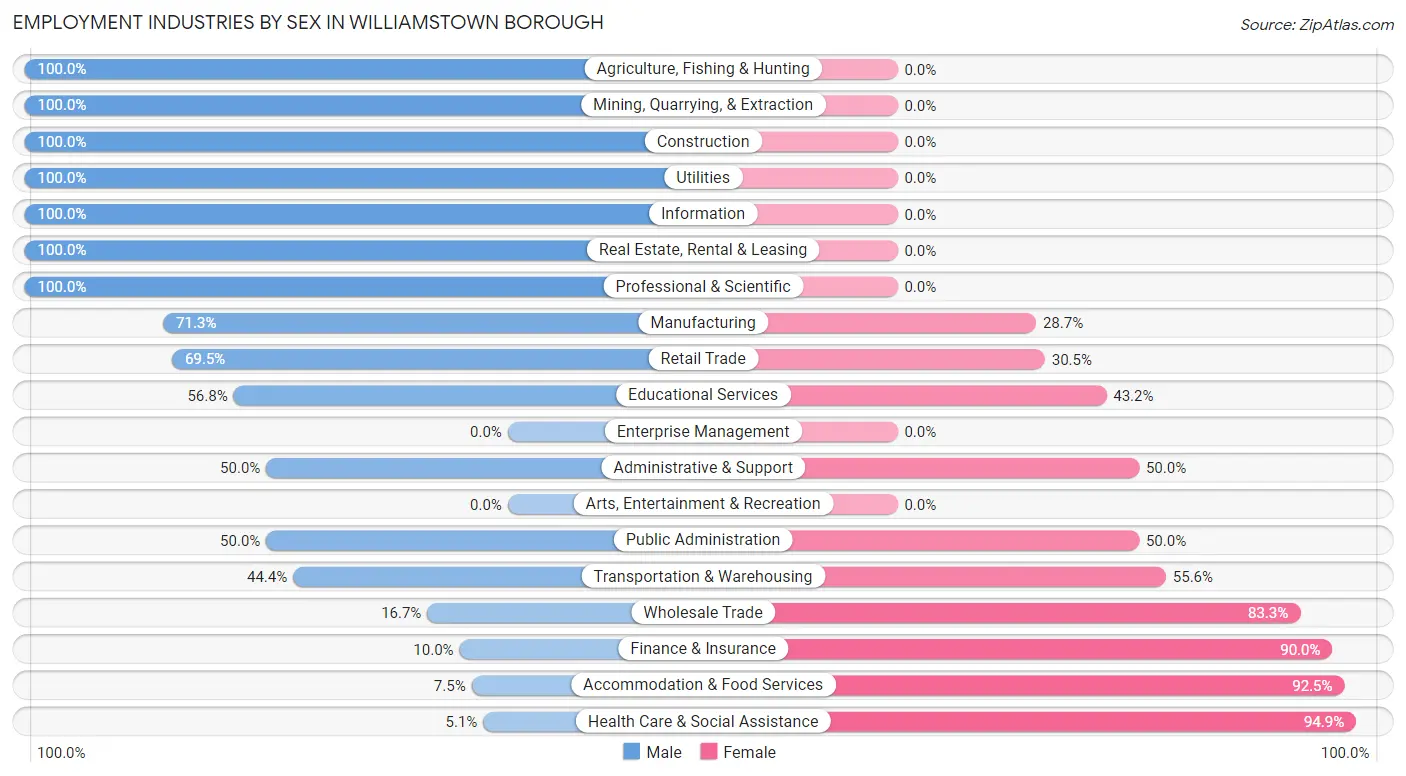
Employment Industries by Sex in Williamstown borough
The Williamstown borough industries that see more men than women are Agriculture, Fishing & Hunting (100.0%), Mining, Quarrying, & Extraction (100.0%), and Construction (100.0%), whereas the industries that tend to have a higher number of women are Health Care & Social Assistance (94.9%), Accommodation & Food Services (92.5%), and Finance & Insurance (90.0%).
| Industry | Male | Female |
| Agriculture, Fishing & Hunting | 3 (100.0%) | 0 (0.0%) |
| Mining, Quarrying, & Extraction | 4 (100.0%) | 0 (0.0%) |
| Construction | 25 (100.0%) | 0 (0.0%) |
| Manufacturing | 92 (71.3%) | 37 (28.7%) |
| Wholesale Trade | 1 (16.7%) | 5 (83.3%) |
| Retail Trade | 41 (69.5%) | 18 (30.5%) |
| Transportation & Warehousing | 20 (44.4%) | 25 (55.6%) |
| Utilities | 4 (100.0%) | 0 (0.0%) |
| Information | 6 (100.0%) | 0 (0.0%) |
| Finance & Insurance | 2 (10.0%) | 18 (90.0%) |
| Real Estate, Rental & Leasing | 10 (100.0%) | 0 (0.0%) |
| Professional & Scientific | 10 (100.0%) | 0 (0.0%) |
| Enterprise Management | 0 (0.0%) | 0 (0.0%) |
| Administrative & Support | 3 (50.0%) | 3 (50.0%) |
| Educational Services | 21 (56.8%) | 16 (43.2%) |
| Health Care & Social Assistance | 3 (5.1%) | 56 (94.9%) |
| Arts, Entertainment & Recreation | 0 (0.0%) | 0 (0.0%) |
| Accommodation & Food Services | 3 (7.5%) | 37 (92.5%) |
| Public Administration | 9 (50.0%) | 9 (50.0%) |
| Total | 265 (53.6%) | 229 (46.4%) |
Education in Williamstown borough
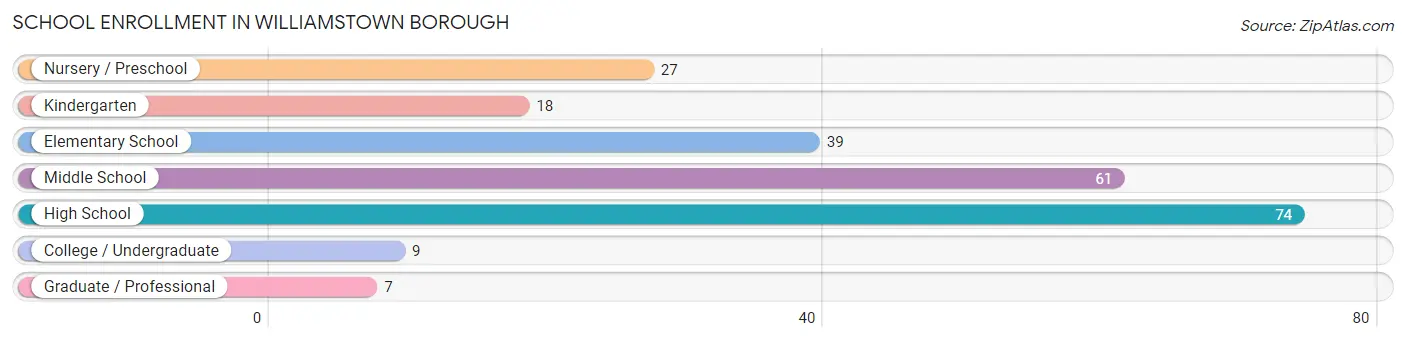
School Enrollment in Williamstown borough
The most common levels of schooling among the 235 students in Williamstown borough are high school (74 | 31.5%), middle school (61 | 26.0%), and elementary school (39 | 16.6%).
| School Level | # Students | % Students |
| Nursery / Preschool | 27 | 11.5% |
| Kindergarten | 18 | 7.7% |
| Elementary School | 39 | 16.6% |
| Middle School | 61 | 26.0% |
| High School | 74 | 31.5% |
| College / Undergraduate | 9 | 3.8% |
| Graduate / Professional | 7 | 3.0% |
| Total | 235 | 100.0% |
School Enrollment by Age by Funding Source in Williamstown borough
Out of a total of 235 students who are enrolled in schools in Williamstown borough, 44 (18.7%) attend a private institution, while the remaining 191 (81.3%) are enrolled in public schools. The age group of 25 to 34 year olds has the highest likelihood of being enrolled in private schools, with 7 (100.0% in the age bracket) enrolled. Conversely, the age group of 18 to 19 year olds has the lowest likelihood of being enrolled in a private school, with 7 (100.0% in the age bracket) attending a public institution.
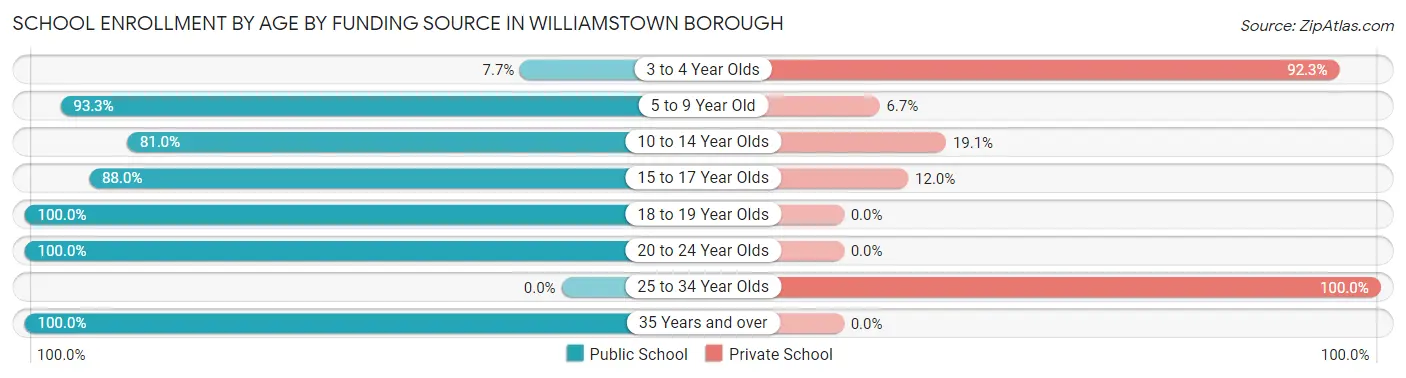
| Age Bracket | Public School | Private School |
| 3 to 4 Year Olds | 1 (7.7%) | 12 (92.3%) |
| 5 to 9 Year Old | 56 (93.3%) | 4 (6.7%) |
| 10 to 14 Year Olds | 51 (80.9%) | 12 (19.1%) |
| 15 to 17 Year Olds | 66 (88.0%) | 9 (12.0%) |
| 18 to 19 Year Olds | 7 (100.0%) | 0 (0.0%) |
| 20 to 24 Year Olds | 3 (100.0%) | 0 (0.0%) |
| 25 to 34 Year Olds | 0 (0.0%) | 7 (100.0%) |
| 35 Years and over | 7 (100.0%) | 0 (0.0%) |
| Total | 191 (81.3%) | 44 (18.7%) |
Educational Attainment by Field of Study in Williamstown borough
Education (31 | 40.3%), computers & mathematics (11 | 14.3%), business (10 | 13.0%), science & technology (8 | 10.4%), and arts & humanities (7 | 9.1%) are the most common fields of study among 77 individuals in Williamstown borough who have obtained a bachelor's degree or higher.
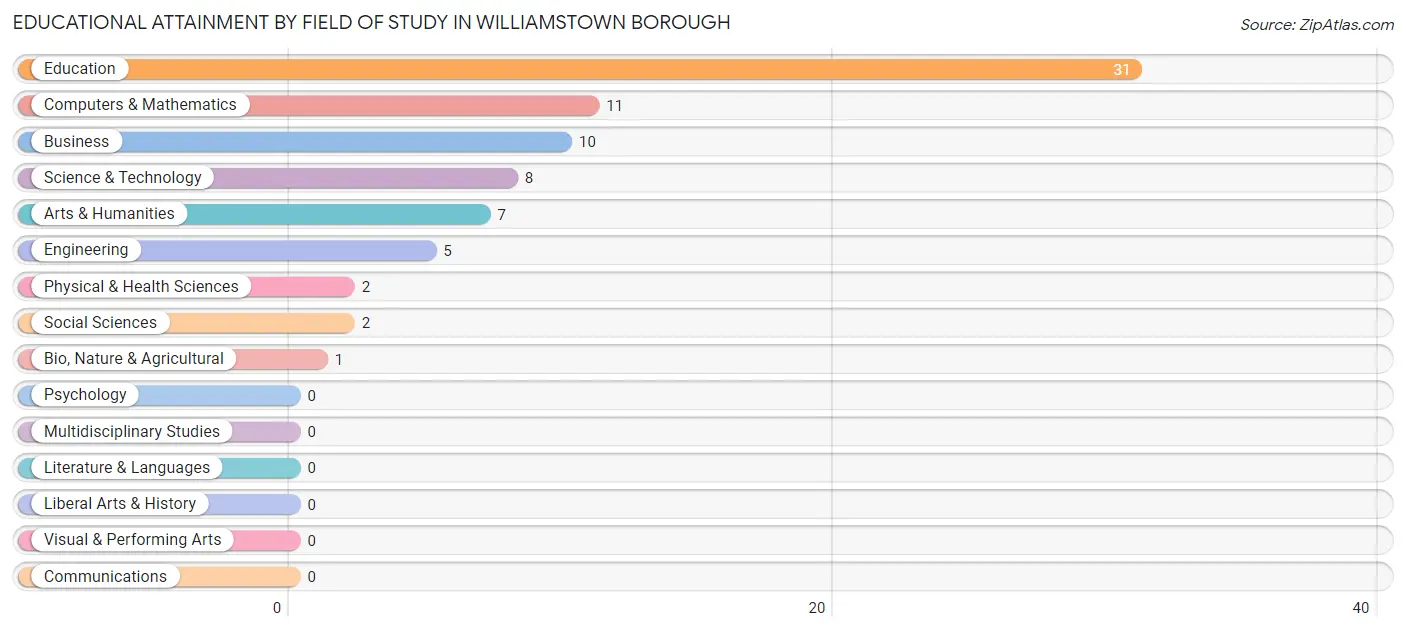
| Field of Study | # Graduates | % Graduates |
| Computers & Mathematics | 11 | 14.3% |
| Bio, Nature & Agricultural | 1 | 1.3% |
| Physical & Health Sciences | 2 | 2.6% |
| Psychology | 0 | 0.0% |
| Social Sciences | 2 | 2.6% |
| Engineering | 5 | 6.5% |
| Multidisciplinary Studies | 0 | 0.0% |
| Science & Technology | 8 | 10.4% |
| Business | 10 | 13.0% |
| Education | 31 | 40.3% |
| Literature & Languages | 0 | 0.0% |
| Liberal Arts & History | 0 | 0.0% |
| Visual & Performing Arts | 0 | 0.0% |
| Communications | 0 | 0.0% |
| Arts & Humanities | 7 | 9.1% |
| Total | 77 | 100.0% |
Transportation & Commute in Williamstown borough
Vehicle Availability by Sex in Williamstown borough
The most prevalent vehicle ownership categories in Williamstown borough are males with 2 vehicles (126, accounting for 48.6%) and females with 2 vehicles (112, making up 55.5%).
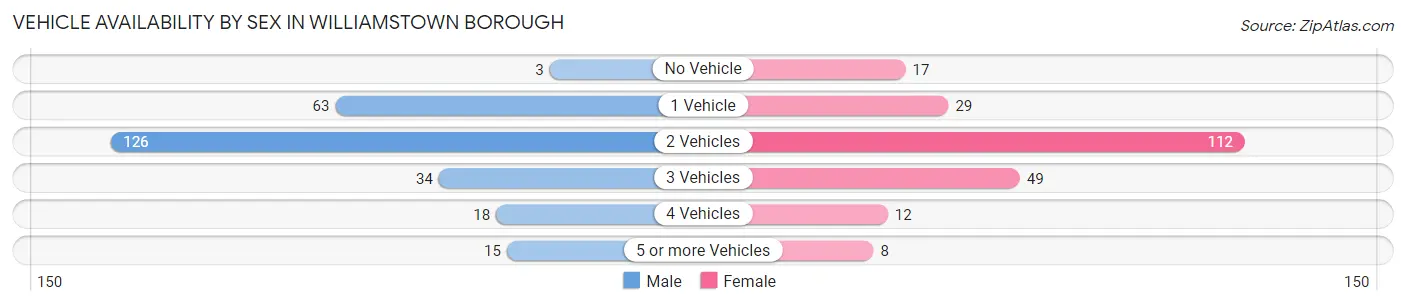
| Vehicles Available | Male | Female |
| No Vehicle | 3 (1.2%) | 17 (7.5%) |
| 1 Vehicle | 63 (24.3%) | 29 (12.8%) |
| 2 Vehicles | 126 (48.6%) | 112 (49.3%) |
| 3 Vehicles | 34 (13.1%) | 49 (21.6%) |
| 4 Vehicles | 18 (7.0%) | 12 (5.3%) |
| 5 or more Vehicles | 15 (5.8%) | 8 (3.5%) |
| Total | 259 (100.0%) | 227 (100.0%) |
Commute Time in Williamstown borough
The most frequently occuring commute durations in Williamstown borough are 45 to 59 minutes (87 commuters, 18.8%), 60 to 89 minutes (71 commuters, 15.3%), and 20 to 24 minutes (65 commuters, 14.0%).
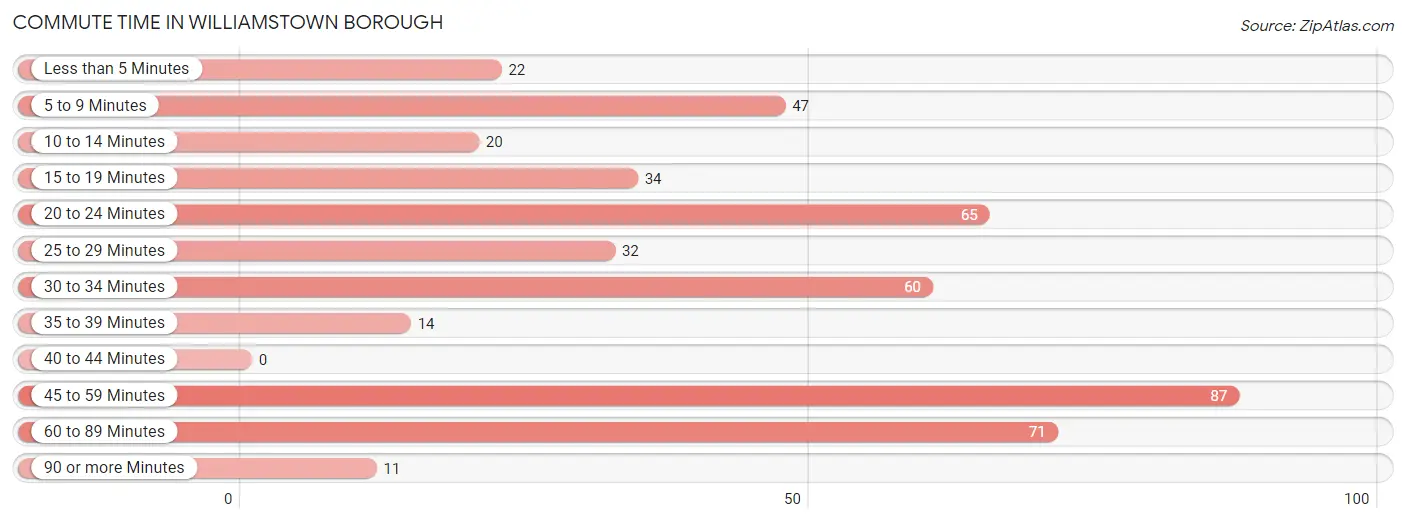
| Commute Time | # Commuters | % Commuters |
| Less than 5 Minutes | 22 | 4.8% |
| 5 to 9 Minutes | 47 | 10.2% |
| 10 to 14 Minutes | 20 | 4.3% |
| 15 to 19 Minutes | 34 | 7.3% |
| 20 to 24 Minutes | 65 | 14.0% |
| 25 to 29 Minutes | 32 | 6.9% |
| 30 to 34 Minutes | 60 | 13.0% |
| 35 to 39 Minutes | 14 | 3.0% |
| 40 to 44 Minutes | 0 | 0.0% |
| 45 to 59 Minutes | 87 | 18.8% |
| 60 to 89 Minutes | 71 | 15.3% |
| 90 or more Minutes | 11 | 2.4% |
Commute Time by Sex in Williamstown borough
The most common commute times in Williamstown borough are 45 to 59 minutes (50 commuters, 19.5%) for males and 45 to 59 minutes (37 commuters, 18.0%) for females.
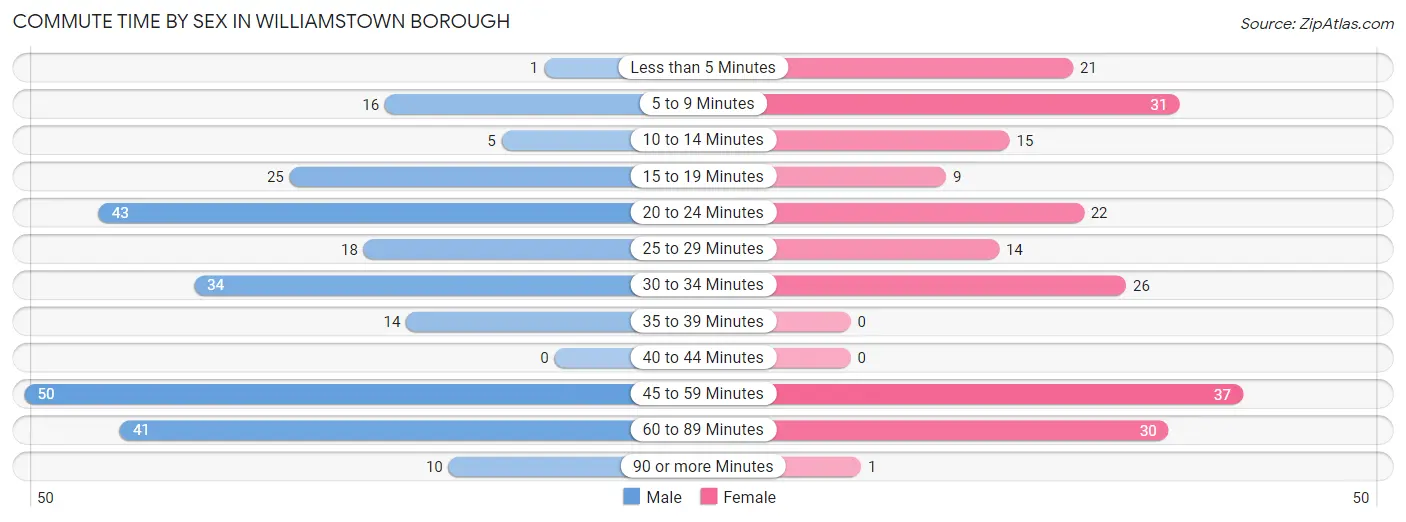
| Commute Time | Male | Female |
| Less than 5 Minutes | 1 (0.4%) | 21 (10.2%) |
| 5 to 9 Minutes | 16 (6.2%) | 31 (15.0%) |
| 10 to 14 Minutes | 5 (1.9%) | 15 (7.3%) |
| 15 to 19 Minutes | 25 (9.7%) | 9 (4.4%) |
| 20 to 24 Minutes | 43 (16.7%) | 22 (10.7%) |
| 25 to 29 Minutes | 18 (7.0%) | 14 (6.8%) |
| 30 to 34 Minutes | 34 (13.2%) | 26 (12.6%) |
| 35 to 39 Minutes | 14 (5.4%) | 0 (0.0%) |
| 40 to 44 Minutes | 0 (0.0%) | 0 (0.0%) |
| 45 to 59 Minutes | 50 (19.5%) | 37 (18.0%) |
| 60 to 89 Minutes | 41 (16.0%) | 30 (14.6%) |
| 90 or more Minutes | 10 (3.9%) | 1 (0.5%) |
Time of Departure to Work by Sex in Williamstown borough
The most frequent times of departure to work in Williamstown borough are 5:30 AM to 5:59 AM (42, 16.3%) for males and 12:00 PM to 3:59 PM (41, 19.9%) for females.
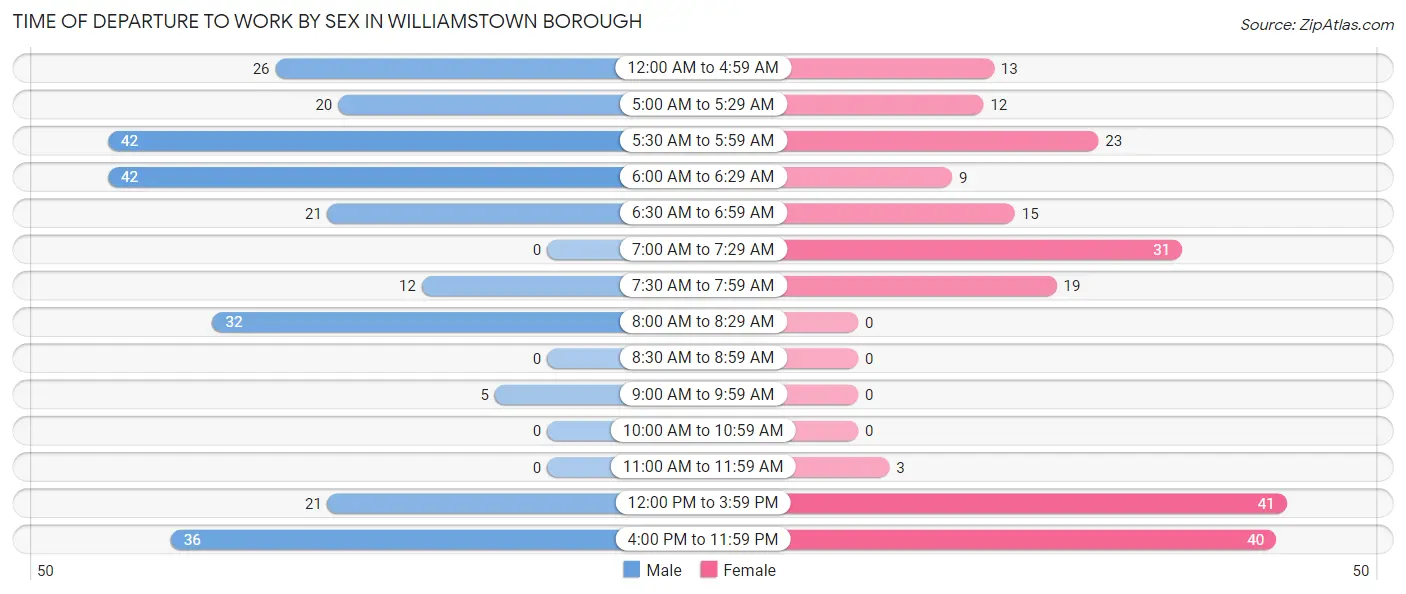
| Time of Departure | Male | Female |
| 12:00 AM to 4:59 AM | 26 (10.1%) | 13 (6.3%) |
| 5:00 AM to 5:29 AM | 20 (7.8%) | 12 (5.8%) |
| 5:30 AM to 5:59 AM | 42 (16.3%) | 23 (11.2%) |
| 6:00 AM to 6:29 AM | 42 (16.3%) | 9 (4.4%) |
| 6:30 AM to 6:59 AM | 21 (8.2%) | 15 (7.3%) |
| 7:00 AM to 7:29 AM | 0 (0.0%) | 31 (15.0%) |
| 7:30 AM to 7:59 AM | 12 (4.7%) | 19 (9.2%) |
| 8:00 AM to 8:29 AM | 32 (12.4%) | 0 (0.0%) |
| 8:30 AM to 8:59 AM | 0 (0.0%) | 0 (0.0%) |
| 9:00 AM to 9:59 AM | 5 (1.9%) | 0 (0.0%) |
| 10:00 AM to 10:59 AM | 0 (0.0%) | 0 (0.0%) |
| 11:00 AM to 11:59 AM | 0 (0.0%) | 3 (1.5%) |
| 12:00 PM to 3:59 PM | 21 (8.2%) | 41 (19.9%) |
| 4:00 PM to 11:59 PM | 36 (14.0%) | 40 (19.4%) |
| Total | 257 (100.0%) | 206 (100.0%) |
Housing Occupancy in Williamstown borough
Occupancy by Ownership in Williamstown borough
Of the total 523 dwellings in Williamstown borough, owner-occupied units account for 312 (59.7%), while renter-occupied units make up 211 (40.3%).
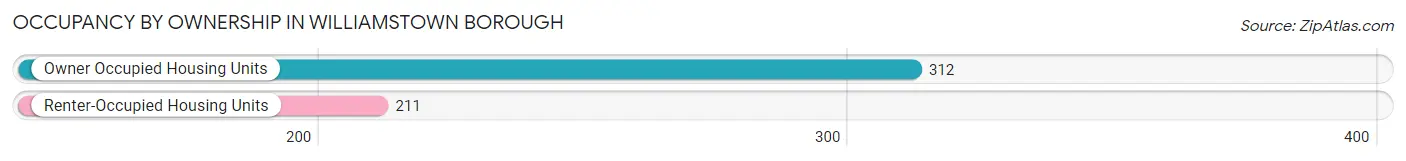
| Occupancy | # Housing Units | % Housing Units |
| Owner Occupied Housing Units | 312 | 59.7% |
| Renter-Occupied Housing Units | 211 | 40.3% |
| Total Occupied Housing Units | 523 | 100.0% |
Occupancy by Household Size in Williamstown borough
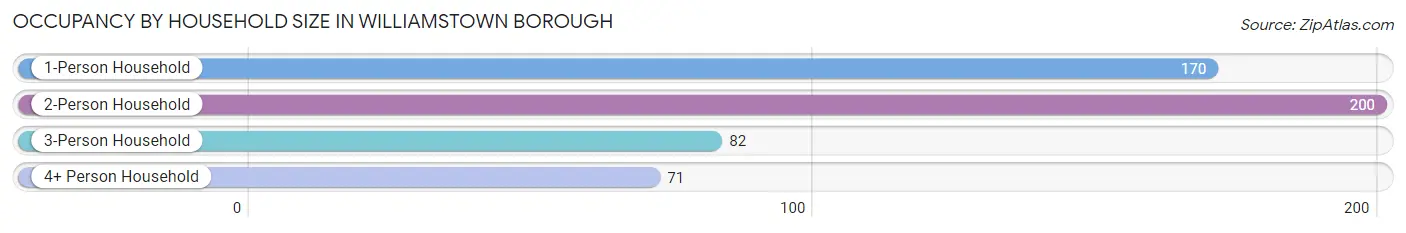
| Household Size | # Housing Units | % Housing Units |
| 1-Person Household | 170 | 32.5% |
| 2-Person Household | 200 | 38.2% |
| 3-Person Household | 82 | 15.7% |
| 4+ Person Household | 71 | 13.6% |
| Total Housing Units | 523 | 100.0% |
Occupancy by Ownership by Household Size in Williamstown borough
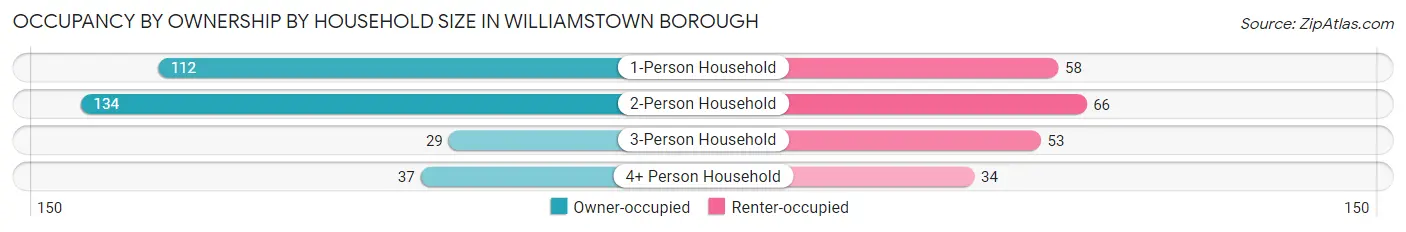
| Household Size | Owner-occupied | Renter-occupied |
| 1-Person Household | 112 (65.9%) | 58 (34.1%) |
| 2-Person Household | 134 (67.0%) | 66 (33.0%) |
| 3-Person Household | 29 (35.4%) | 53 (64.6%) |
| 4+ Person Household | 37 (52.1%) | 34 (47.9%) |
| Total Housing Units | 312 (59.7%) | 211 (40.3%) |
Occupancy by Educational Attainment in Williamstown borough
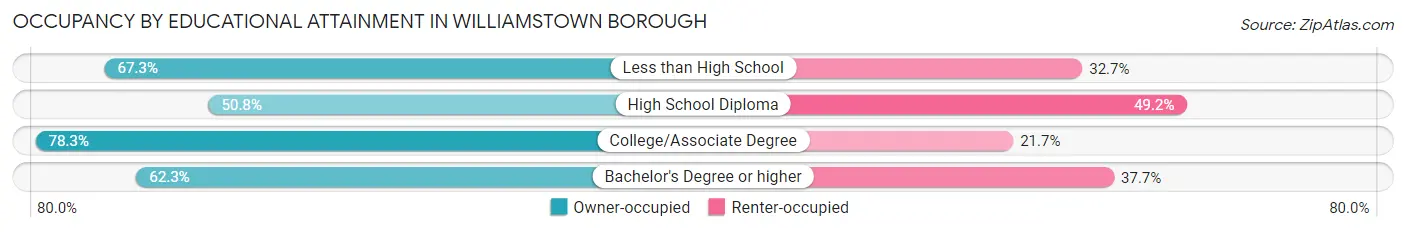
| Household Size | Owner-occupied | Renter-occupied |
| Less than High School | 35 (67.3%) | 17 (32.7%) |
| High School Diploma | 154 (50.8%) | 149 (49.2%) |
| College/Associate Degree | 90 (78.3%) | 25 (21.7%) |
| Bachelor's Degree or higher | 33 (62.3%) | 20 (37.7%) |
Occupancy by Age of Householder in Williamstown borough
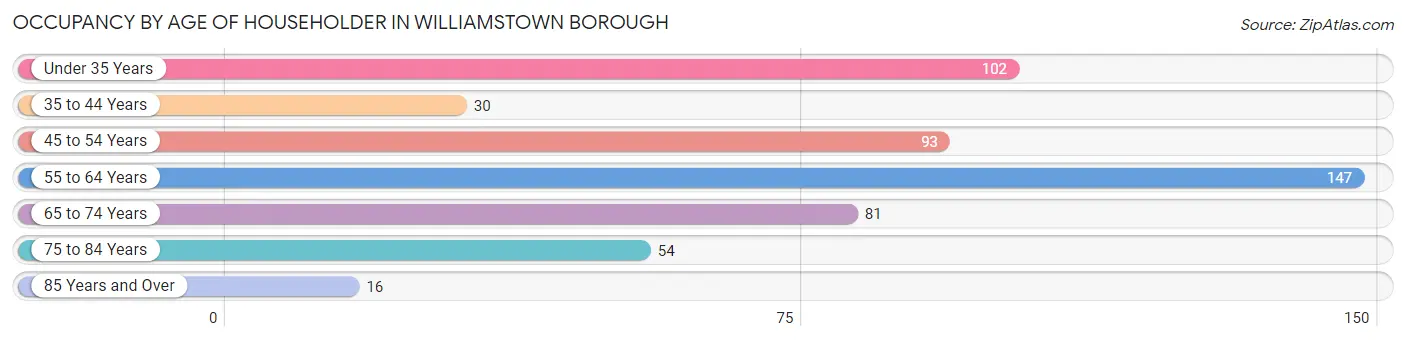
| Age Bracket | # Households | % Households |
| Under 35 Years | 102 | 19.5% |
| 35 to 44 Years | 30 | 5.7% |
| 45 to 54 Years | 93 | 17.8% |
| 55 to 64 Years | 147 | 28.1% |
| 65 to 74 Years | 81 | 15.5% |
| 75 to 84 Years | 54 | 10.3% |
| 85 Years and Over | 16 | 3.1% |
| Total | 523 | 100.0% |
Housing Finances in Williamstown borough
Median Income by Occupancy in Williamstown borough
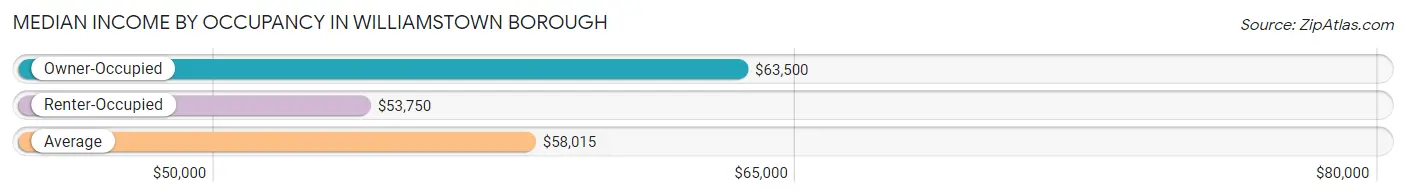
| Occupancy Type | # Households | Median Income |
| Owner-Occupied | 312 (59.7%) | $63,500 |
| Renter-Occupied | 211 (40.3%) | $53,750 |
| Average | 523 (100.0%) | $58,015 |
Occupancy by Householder Income Bracket in Williamstown borough
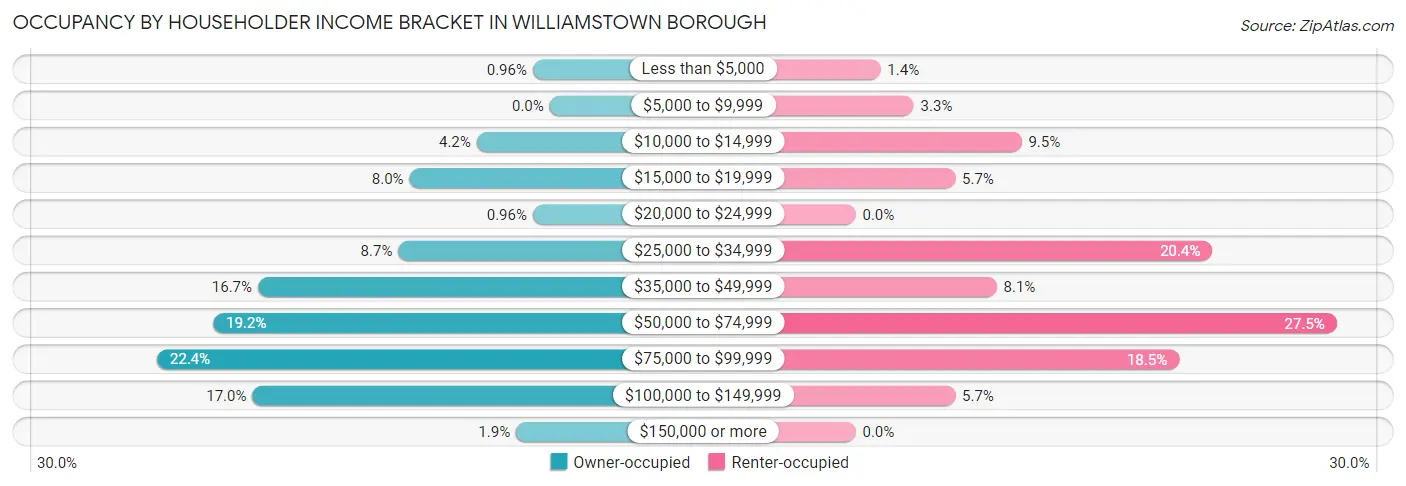
| Income Bracket | Owner-occupied | Renter-occupied |
| Less than $5,000 | 3 (1.0%) | 3 (1.4%) |
| $5,000 to $9,999 | 0 (0.0%) | 7 (3.3%) |
| $10,000 to $14,999 | 13 (4.2%) | 20 (9.5%) |
| $15,000 to $19,999 | 25 (8.0%) | 12 (5.7%) |
| $20,000 to $24,999 | 3 (1.0%) | 0 (0.0%) |
| $25,000 to $34,999 | 27 (8.6%) | 43 (20.4%) |
| $35,000 to $49,999 | 52 (16.7%) | 17 (8.1%) |
| $50,000 to $74,999 | 60 (19.2%) | 58 (27.5%) |
| $75,000 to $99,999 | 70 (22.4%) | 39 (18.5%) |
| $100,000 to $149,999 | 53 (17.0%) | 12 (5.7%) |
| $150,000 or more | 6 (1.9%) | 0 (0.0%) |
| Total | 312 (100.0%) | 211 (100.0%) |
Monthly Housing Cost Tiers in Williamstown borough
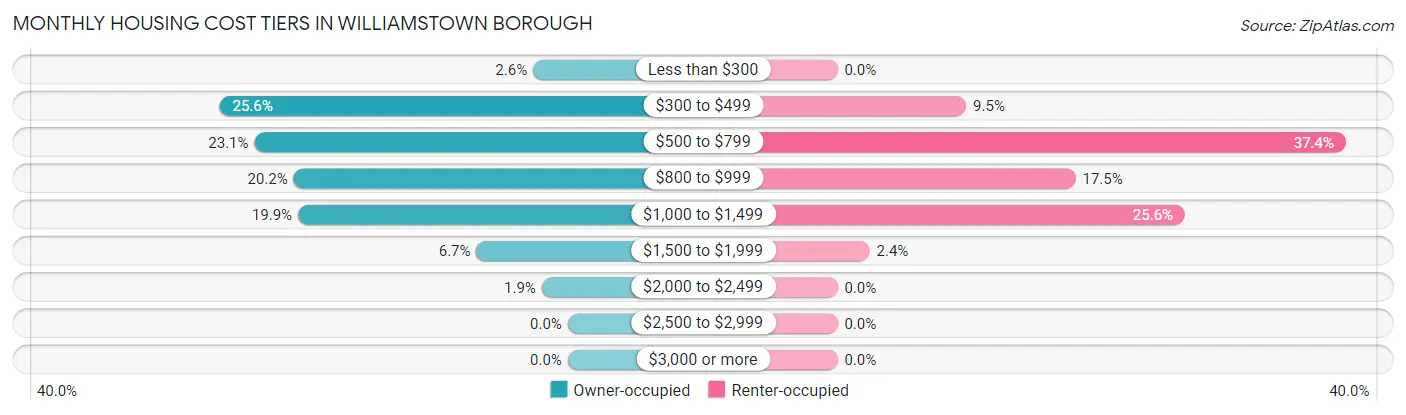
| Monthly Cost | Owner-occupied | Renter-occupied |
| Less than $300 | 8 (2.6%) | 0 (0.0%) |
| $300 to $499 | 80 (25.6%) | 20 (9.5%) |
| $500 to $799 | 72 (23.1%) | 79 (37.4%) |
| $800 to $999 | 63 (20.2%) | 37 (17.5%) |
| $1,000 to $1,499 | 62 (19.9%) | 54 (25.6%) |
| $1,500 to $1,999 | 21 (6.7%) | 5 (2.4%) |
| $2,000 to $2,499 | 6 (1.9%) | 0 (0.0%) |
| $2,500 to $2,999 | 0 (0.0%) | 0 (0.0%) |
| $3,000 or more | 0 (0.0%) | 0 (0.0%) |
| Total | 312 (100.0%) | 211 (100.0%) |
Physical Housing Characteristics in Williamstown borough
Housing Structures in Williamstown borough
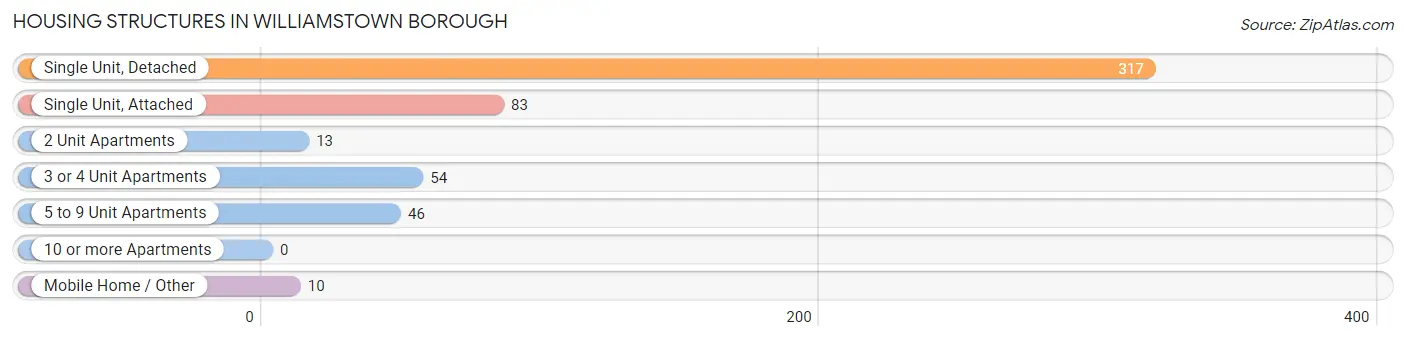
| Structure Type | # Housing Units | % Housing Units |
| Single Unit, Detached | 317 | 60.6% |
| Single Unit, Attached | 83 | 15.9% |
| 2 Unit Apartments | 13 | 2.5% |
| 3 or 4 Unit Apartments | 54 | 10.3% |
| 5 to 9 Unit Apartments | 46 | 8.8% |
| 10 or more Apartments | 0 | 0.0% |
| Mobile Home / Other | 10 | 1.9% |
| Total | 523 | 100.0% |
Housing Structures by Occupancy in Williamstown borough
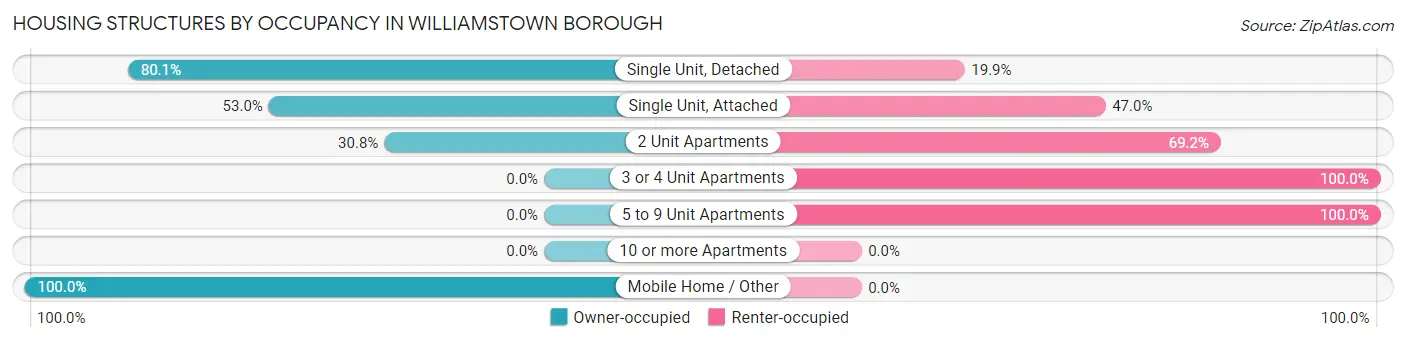
| Structure Type | Owner-occupied | Renter-occupied |
| Single Unit, Detached | 254 (80.1%) | 63 (19.9%) |
| Single Unit, Attached | 44 (53.0%) | 39 (47.0%) |
| 2 Unit Apartments | 4 (30.8%) | 9 (69.2%) |
| 3 or 4 Unit Apartments | 0 (0.0%) | 54 (100.0%) |
| 5 to 9 Unit Apartments | 0 (0.0%) | 46 (100.0%) |
| 10 or more Apartments | 0 (0.0%) | 0 (0.0%) |
| Mobile Home / Other | 10 (100.0%) | 0 (0.0%) |
| Total | 312 (59.7%) | 211 (40.3%) |
Housing Structures by Number of Rooms in Williamstown borough
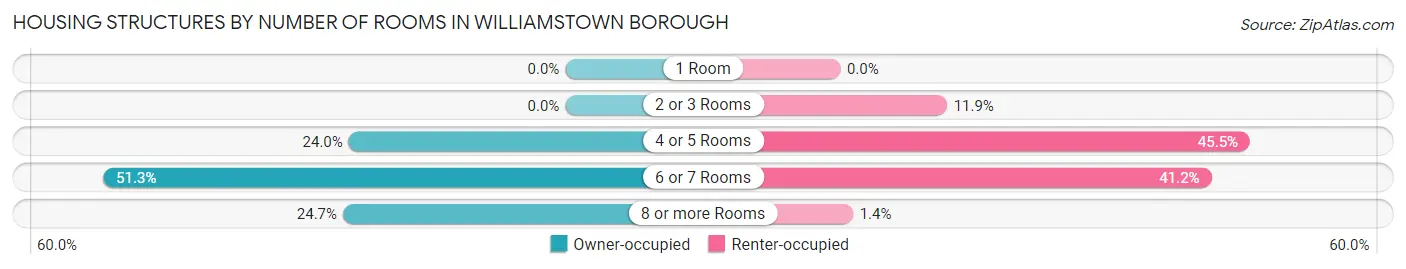
| Number of Rooms | Owner-occupied | Renter-occupied |
| 1 Room | 0 (0.0%) | 0 (0.0%) |
| 2 or 3 Rooms | 0 (0.0%) | 25 (11.8%) |
| 4 or 5 Rooms | 75 (24.0%) | 96 (45.5%) |
| 6 or 7 Rooms | 160 (51.3%) | 87 (41.2%) |
| 8 or more Rooms | 77 (24.7%) | 3 (1.4%) |
| Total | 312 (100.0%) | 211 (100.0%) |
Housing Structure by Heating Type in Williamstown borough
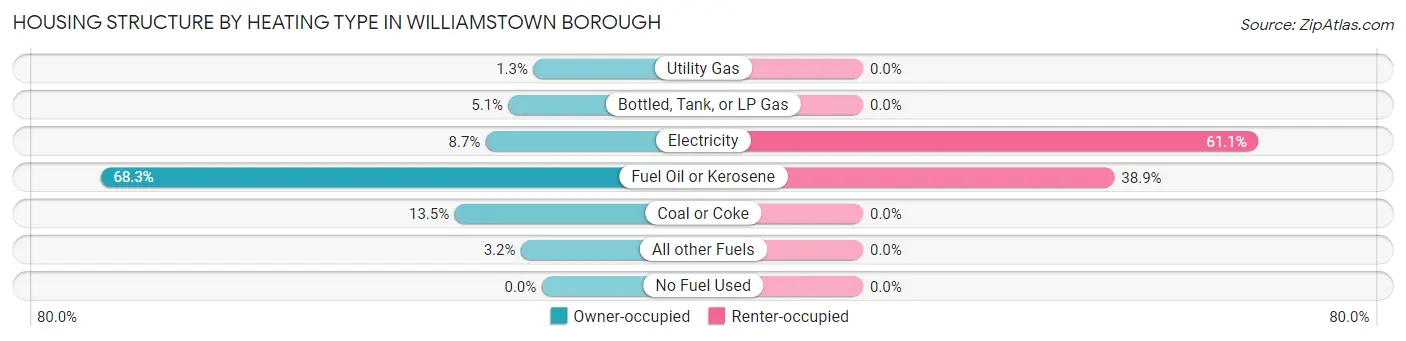
| Heating Type | Owner-occupied | Renter-occupied |
| Utility Gas | 4 (1.3%) | 0 (0.0%) |
| Bottled, Tank, or LP Gas | 16 (5.1%) | 0 (0.0%) |
| Electricity | 27 (8.6%) | 129 (61.1%) |
| Fuel Oil or Kerosene | 213 (68.3%) | 82 (38.9%) |
| Coal or Coke | 42 (13.5%) | 0 (0.0%) |
| All other Fuels | 10 (3.2%) | 0 (0.0%) |
| No Fuel Used | 0 (0.0%) | 0 (0.0%) |
| Total | 312 (100.0%) | 211 (100.0%) |
Household Vehicle Usage in Williamstown borough
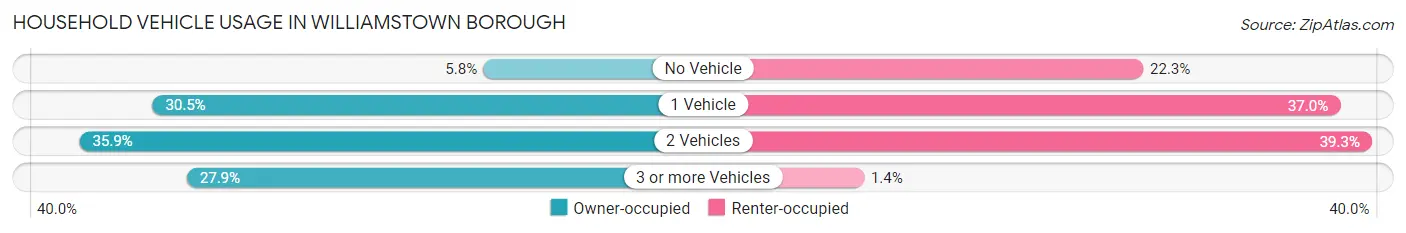
| Vehicles per Household | Owner-occupied | Renter-occupied |
| No Vehicle | 18 (5.8%) | 47 (22.3%) |
| 1 Vehicle | 95 (30.4%) | 78 (37.0%) |
| 2 Vehicles | 112 (35.9%) | 83 (39.3%) |
| 3 or more Vehicles | 87 (27.9%) | 3 (1.4%) |
| Total | 312 (100.0%) | 211 (100.0%) |
Real Estate & Mortgages in Williamstown borough
Real Estate and Mortgage Overview in Williamstown borough
| Characteristic | Without Mortgage | With Mortgage |
| Housing Units | 151 | 161 |
| Median Property Value | $82,600 | $96,500 |
| Median Household Income | $40,156 | $3 |
| Monthly Housing Costs | $483 | $0 |
| Real Estate Taxes | $1,192 | $12 |
Property Value by Mortgage Status in Williamstown borough
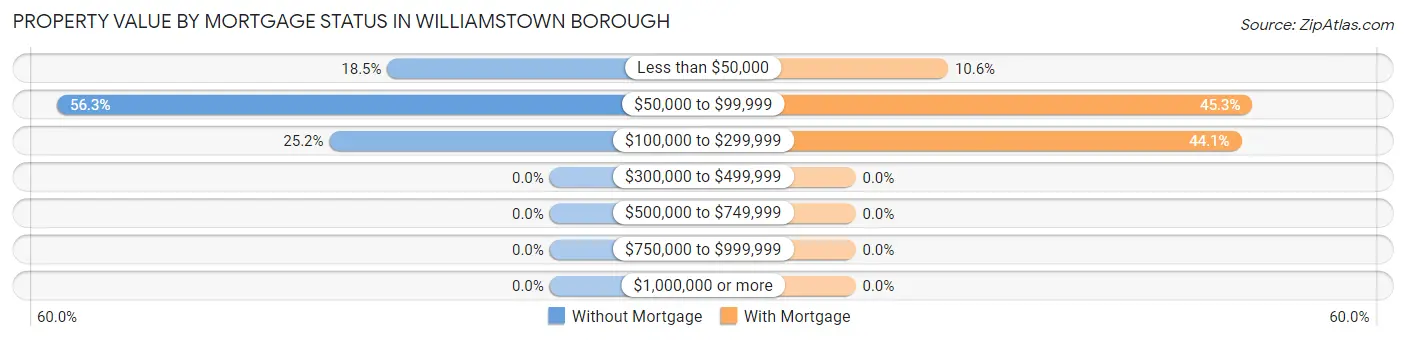
| Property Value | Without Mortgage | With Mortgage |
| Less than $50,000 | 28 (18.5%) | 17 (10.6%) |
| $50,000 to $99,999 | 85 (56.3%) | 73 (45.3%) |
| $100,000 to $299,999 | 38 (25.2%) | 71 (44.1%) |
| $300,000 to $499,999 | 0 (0.0%) | 0 (0.0%) |
| $500,000 to $749,999 | 0 (0.0%) | 0 (0.0%) |
| $750,000 to $999,999 | 0 (0.0%) | 0 (0.0%) |
| $1,000,000 or more | 0 (0.0%) | 0 (0.0%) |
| Total | 151 (100.0%) | 161 (100.0%) |
Household Income by Mortgage Status in Williamstown borough
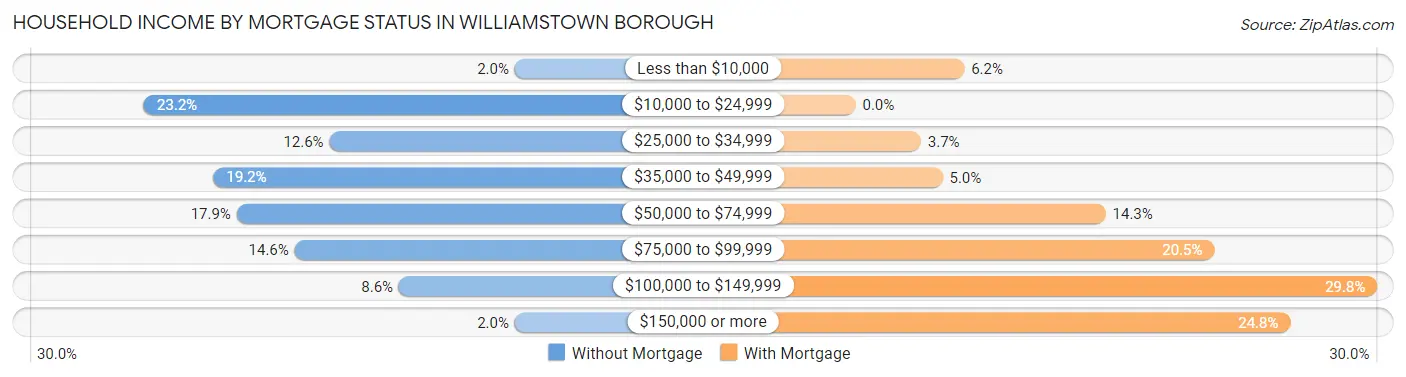
| Household Income | Without Mortgage | With Mortgage |
| Less than $10,000 | 3 (2.0%) | 10 (6.2%) |
| $10,000 to $24,999 | 35 (23.2%) | 0 (0.0%) |
| $25,000 to $34,999 | 19 (12.6%) | 6 (3.7%) |
| $35,000 to $49,999 | 29 (19.2%) | 8 (5.0%) |
| $50,000 to $74,999 | 27 (17.9%) | 23 (14.3%) |
| $75,000 to $99,999 | 22 (14.6%) | 33 (20.5%) |
| $100,000 to $149,999 | 13 (8.6%) | 48 (29.8%) |
| $150,000 or more | 3 (2.0%) | 40 (24.8%) |
| Total | 151 (100.0%) | 161 (100.0%) |
Property Value to Household Income Ratio in Williamstown borough
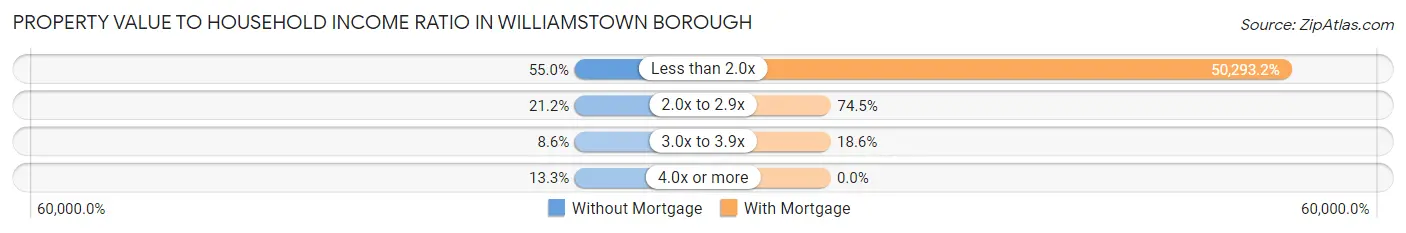
| Value-to-Income Ratio | Without Mortgage | With Mortgage |
| Less than 2.0x | 83 (55.0%) | 80,972 (50,293.2%) |
| 2.0x to 2.9x | 32 (21.2%) | 120 (74.5%) |
| 3.0x to 3.9x | 13 (8.6%) | 30 (18.6%) |
| 4.0x or more | 20 (13.3%) | 0 (0.0%) |
| Total | 151 (100.0%) | 161 (100.0%) |
Real Estate Taxes by Mortgage Status in Williamstown borough
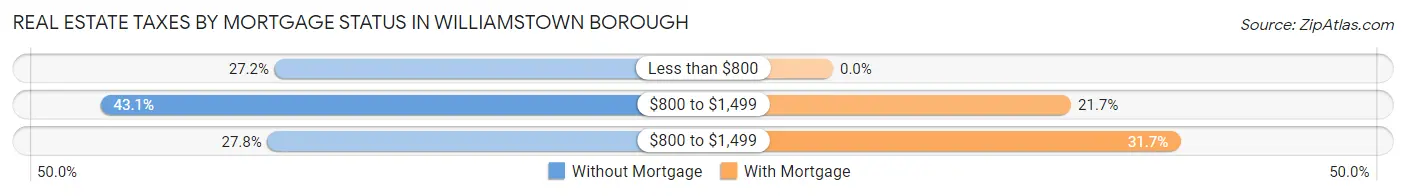
| Property Taxes | Without Mortgage | With Mortgage |
| Less than $800 | 41 (27.2%) | 0 (0.0%) |
| $800 to $1,499 | 65 (43.0%) | 35 (21.7%) |
| $800 to $1,499 | 42 (27.8%) | 51 (31.7%) |
| Total | 151 (100.0%) | 161 (100.0%) |
Health & Disability in Williamstown borough
Health Insurance Coverage by Age in Williamstown borough
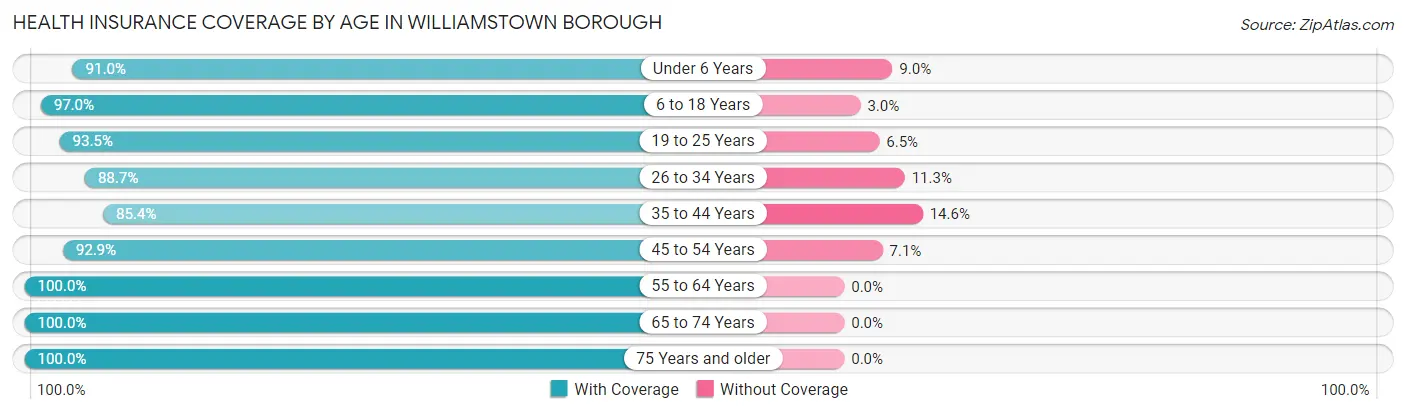
| Age Bracket | With Coverage | Without Coverage |
| Under 6 Years | 71 (91.0%) | 7 (9.0%) |
| 6 to 18 Years | 193 (97.0%) | 6 (3.0%) |
| 19 to 25 Years | 100 (93.5%) | 7 (6.5%) |
| 26 to 34 Years | 126 (88.7%) | 16 (11.3%) |
| 35 to 44 Years | 70 (85.4%) | 12 (14.6%) |
| 45 to 54 Years | 130 (92.9%) | 10 (7.1%) |
| 55 to 64 Years | 209 (100.0%) | 0 (0.0%) |
| 65 to 74 Years | 106 (100.0%) | 0 (0.0%) |
| 75 Years and older | 99 (100.0%) | 0 (0.0%) |
| Total | 1,104 (95.0%) | 58 (5.0%) |
Health Insurance Coverage by Citizenship Status in Williamstown borough
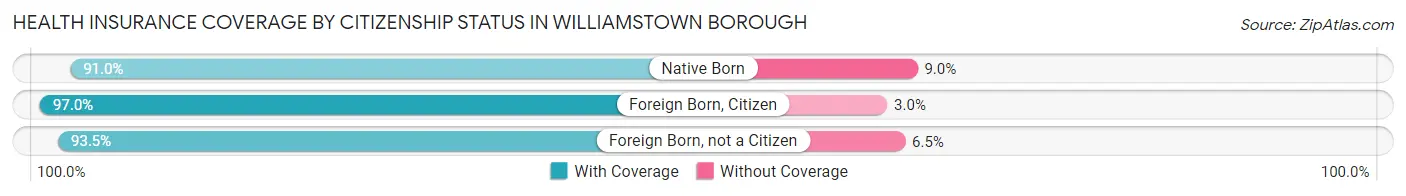
| Citizenship Status | With Coverage | Without Coverage |
| Native Born | 71 (91.0%) | 7 (9.0%) |
| Foreign Born, Citizen | 193 (97.0%) | 6 (3.0%) |
| Foreign Born, not a Citizen | 100 (93.5%) | 7 (6.5%) |
Health Insurance Coverage by Household Income in Williamstown borough
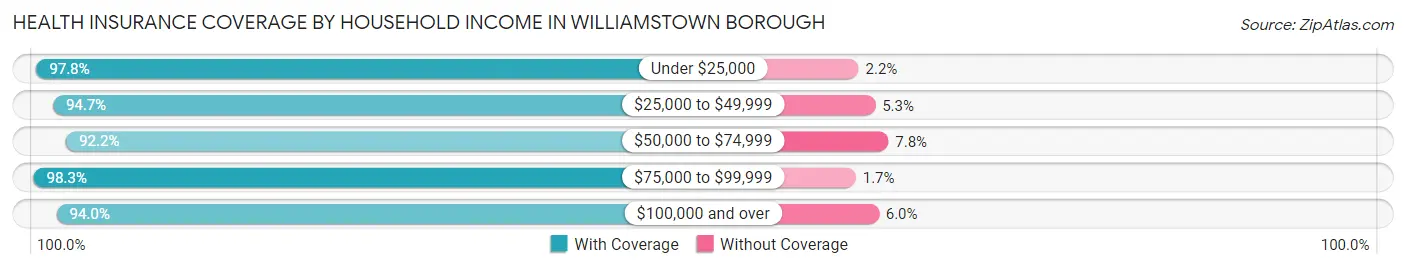
| Household Income | With Coverage | Without Coverage |
| Under $25,000 | 133 (97.8%) | 3 (2.2%) |
| $25,000 to $49,999 | 249 (94.7%) | 14 (5.3%) |
| $50,000 to $74,999 | 284 (92.2%) | 24 (7.8%) |
| $75,000 to $99,999 | 234 (98.3%) | 4 (1.7%) |
| $100,000 and over | 204 (94.0%) | 13 (6.0%) |
Public vs Private Health Insurance Coverage by Age in Williamstown borough
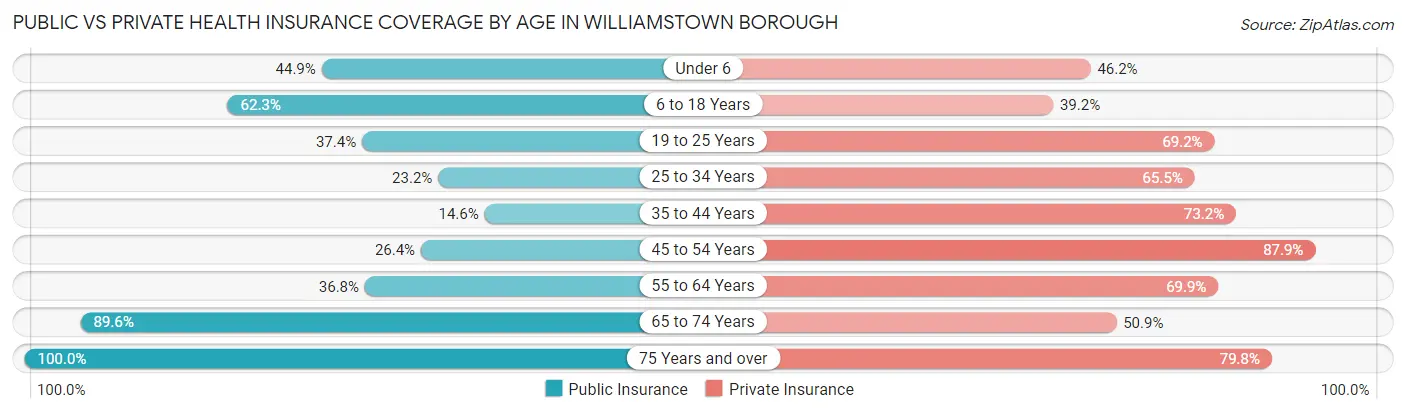
| Age Bracket | Public Insurance | Private Insurance |
| Under 6 | 35 (44.9%) | 36 (46.2%) |
| 6 to 18 Years | 124 (62.3%) | 78 (39.2%) |
| 19 to 25 Years | 40 (37.4%) | 74 (69.2%) |
| 25 to 34 Years | 33 (23.2%) | 93 (65.5%) |
| 35 to 44 Years | 12 (14.6%) | 60 (73.2%) |
| 45 to 54 Years | 37 (26.4%) | 123 (87.9%) |
| 55 to 64 Years | 77 (36.8%) | 146 (69.9%) |
| 65 to 74 Years | 95 (89.6%) | 54 (50.9%) |
| 75 Years and over | 99 (100.0%) | 79 (79.8%) |
| Total | 552 (47.5%) | 743 (63.9%) |
Disability Status by Sex by Age in Williamstown borough
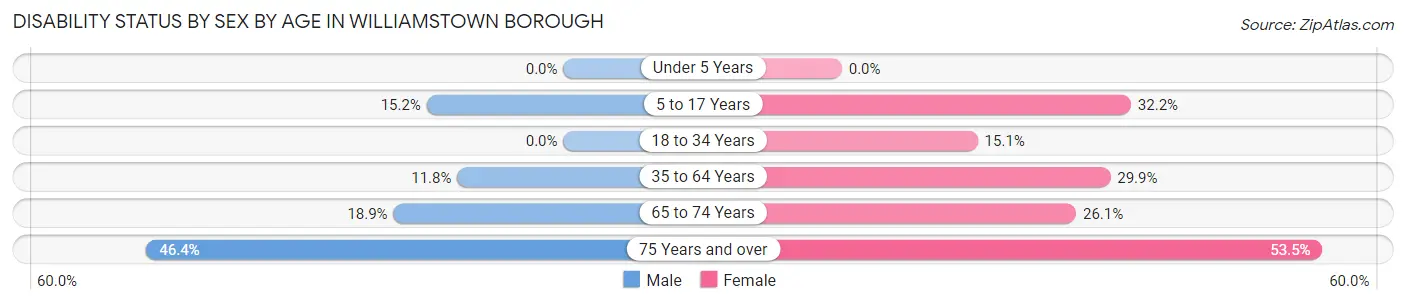
| Age Bracket | Male | Female |
| Under 5 Years | 0 (0.0%) | 0 (0.0%) |
| 5 to 17 Years | 14 (15.2%) | 38 (32.2%) |
| 18 to 34 Years | 0 (0.0%) | 23 (15.1%) |
| 35 to 64 Years | 28 (11.8%) | 58 (29.9%) |
| 65 to 74 Years | 7 (18.9%) | 18 (26.1%) |
| 75 Years and over | 13 (46.4%) | 38 (53.5%) |
Disability Class by Sex by Age in Williamstown borough
Disability Class: Hearing Difficulty
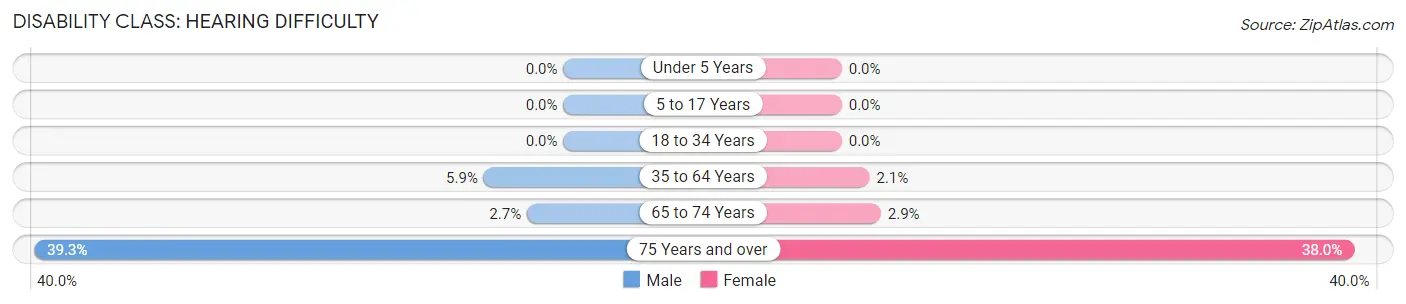
| Age Bracket | Male | Female |
| Under 5 Years | 0 (0.0%) | 0 (0.0%) |
| 5 to 17 Years | 0 (0.0%) | 0 (0.0%) |
| 18 to 34 Years | 0 (0.0%) | 0 (0.0%) |
| 35 to 64 Years | 14 (5.9%) | 4 (2.1%) |
| 65 to 74 Years | 1 (2.7%) | 2 (2.9%) |
| 75 Years and over | 11 (39.3%) | 27 (38.0%) |
Disability Class: Vision Difficulty
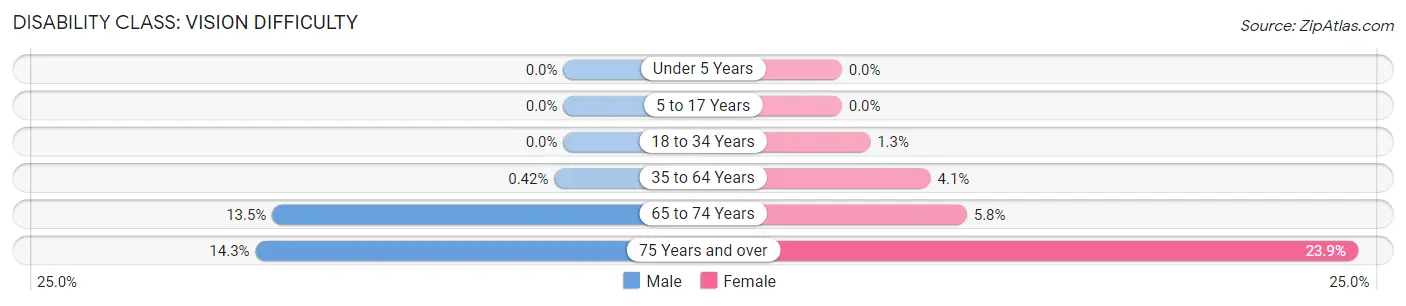
| Age Bracket | Male | Female |
| Under 5 Years | 0 (0.0%) | 0 (0.0%) |
| 5 to 17 Years | 0 (0.0%) | 0 (0.0%) |
| 18 to 34 Years | 0 (0.0%) | 2 (1.3%) |
| 35 to 64 Years | 1 (0.4%) | 8 (4.1%) |
| 65 to 74 Years | 5 (13.5%) | 4 (5.8%) |
| 75 Years and over | 4 (14.3%) | 17 (23.9%) |
Disability Class: Cognitive Difficulty
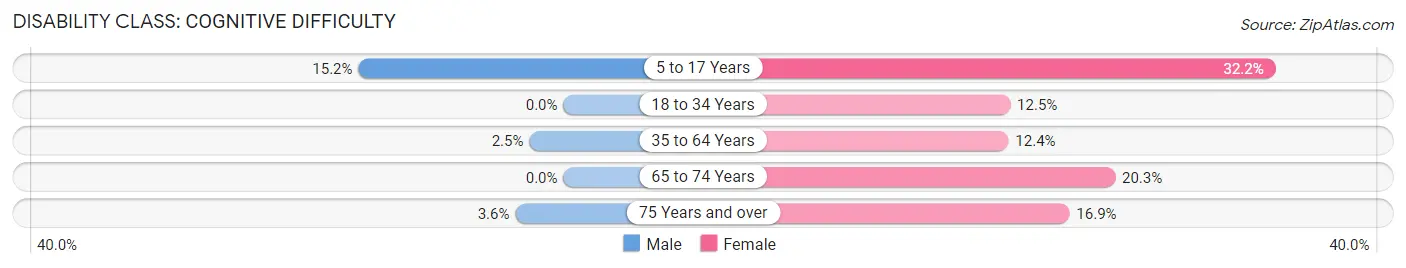
| Age Bracket | Male | Female |
| 5 to 17 Years | 14 (15.2%) | 38 (32.2%) |
| 18 to 34 Years | 0 (0.0%) | 19 (12.5%) |
| 35 to 64 Years | 6 (2.5%) | 24 (12.4%) |
| 65 to 74 Years | 0 (0.0%) | 14 (20.3%) |
| 75 Years and over | 1 (3.6%) | 12 (16.9%) |
Disability Class: Ambulatory Difficulty
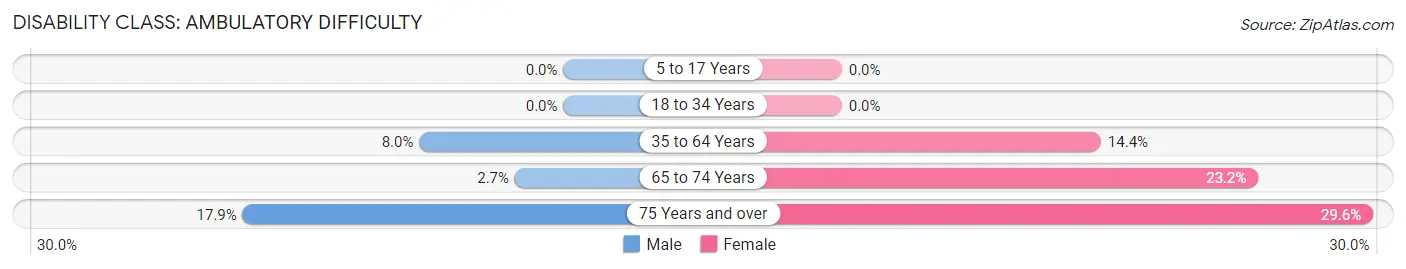
| Age Bracket | Male | Female |
| 5 to 17 Years | 0 (0.0%) | 0 (0.0%) |
| 18 to 34 Years | 0 (0.0%) | 0 (0.0%) |
| 35 to 64 Years | 19 (8.0%) | 28 (14.4%) |
| 65 to 74 Years | 1 (2.7%) | 16 (23.2%) |
| 75 Years and over | 5 (17.9%) | 21 (29.6%) |
Disability Class: Self-Care Difficulty
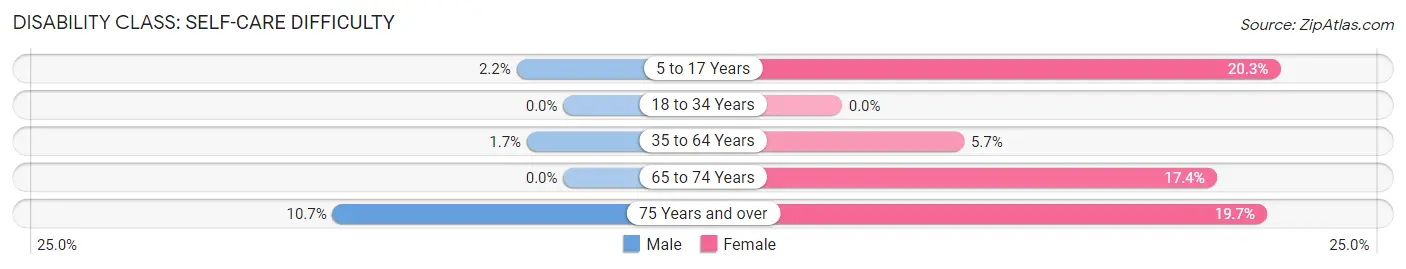
| Age Bracket | Male | Female |
| 5 to 17 Years | 2 (2.2%) | 24 (20.3%) |
| 18 to 34 Years | 0 (0.0%) | 0 (0.0%) |
| 35 to 64 Years | 4 (1.7%) | 11 (5.7%) |
| 65 to 74 Years | 0 (0.0%) | 12 (17.4%) |
| 75 Years and over | 3 (10.7%) | 14 (19.7%) |
Technology Access in Williamstown borough
Computing Device Access in Williamstown borough
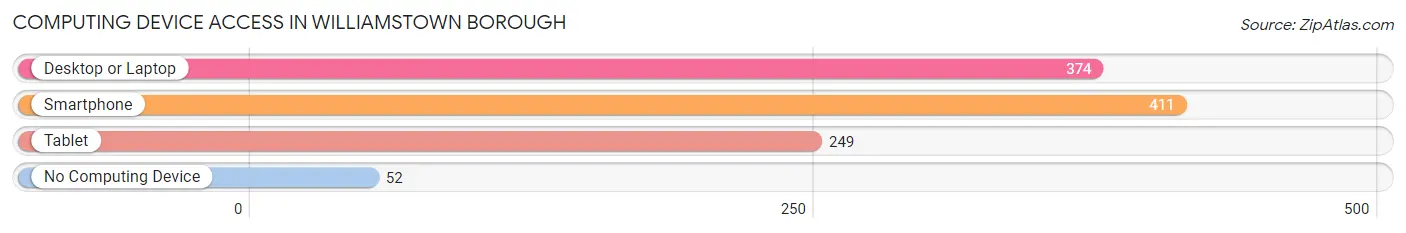
| Device Type | # Households | % Households |
| Desktop or Laptop | 374 | 71.5% |
| Smartphone | 411 | 78.6% |
| Tablet | 249 | 47.6% |
| No Computing Device | 52 | 9.9% |
| Total | 523 | 100.0% |
Internet Access in Williamstown borough
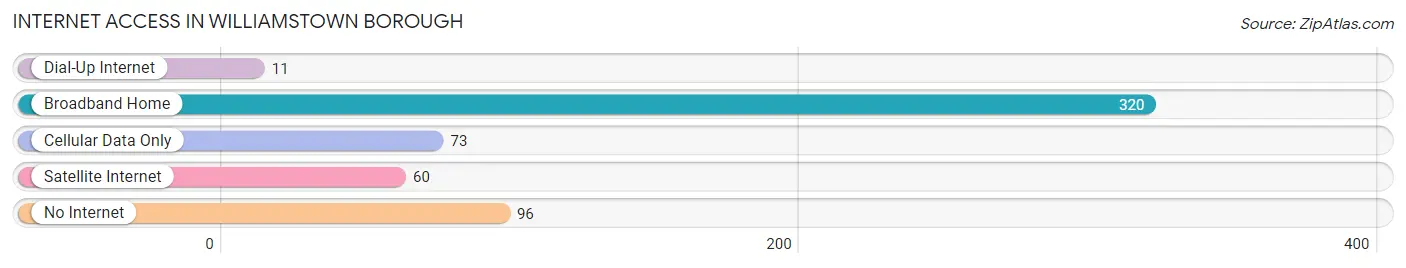
| Internet Type | # Households | % Households |
| Dial-Up Internet | 11 | 2.1% |
| Broadband Home | 320 | 61.2% |
| Cellular Data Only | 73 | 14.0% |
| Satellite Internet | 60 | 11.5% |
| No Internet | 96 | 18.4% |
| Total | 523 | 100.0% |
Williamstown borough Summary
Williamstown Borough is a small borough located in Dauphin County, Pennsylvania. It is situated in the Susquehanna Valley, approximately 10 miles south of Harrisburg, the state capital. The borough is part of the Harrisburg-Carlisle Metropolitan Statistical Area. As of the 2010 census, the population of Williamstown Borough was 1,845.
History
Williamstown Borough was founded in 1817 by William Henry, a Revolutionary War veteran. The town was named after him and was originally part of Dauphin County. In 1819, the borough was incorporated and the first mayor was elected.
The town was a small farming community until the mid-1800s when the Pennsylvania Railroad was built through the area. This brought an influx of new residents and businesses to the area. The railroad also helped to spur the growth of the local coal industry, which was a major employer in the area for many years.
In the early 1900s, Williamstown Borough was a popular tourist destination. The town was known for its natural beauty and its many outdoor activities, such as fishing, hunting, and camping.
Geography
Williamstown Borough is located in the Susquehanna Valley, approximately 10 miles south of Harrisburg. The borough is situated on the east bank of the Susquehanna River, and is bordered by the townships of East Hanover, West Hanover, and Conewago.
The borough has a total area of 1.2 square miles, all of which is land. The terrain is mostly flat, with some rolling hills. The climate is humid continental, with hot summers and cold winters.
Economy
Williamstown Borough’s economy is largely based on agriculture and tourism. The town is home to several farms, which produce a variety of crops, including corn, soybeans, and hay. The town is also home to several wineries, which attract tourists from all over the region.
The town is also home to several small businesses, including restaurants, shops, and services. The town is also home to a few manufacturing companies, which produce a variety of products, including furniture, clothing, and electronics.
Demographics
As of the 2010 census, the population of Williamstown Borough was 1,845. The racial makeup of the borough was 95.3% White, 1.2% African American, 0.3% Native American, 0.7% Asian, 0.1% Pacific Islander, 0.7% from other races, and 1.9% from two or more races. Hispanic or Latino of any race were 2.2% of the population.
The median household income in the borough was $45,938, and the median family income was $51,938. The per capita income was $20,938. About 8.3% of families and 10.2% of the population were below the poverty line, including 14.2% of those under age 18 and 6.2% of those age 65 or over.
Conclusion
Williamstown Borough is a small borough located in Dauphin County, Pennsylvania. It is situated in the Susquehanna Valley, approximately 10 miles south of Harrisburg, the state capital. The borough was founded in 1817 and was originally a small farming community. The Pennsylvania Railroad brought an influx of new residents and businesses to the area in the mid-1800s, and the town is now home to several farms, wineries, and small businesses. As of the 2010 census, the population of Williamstown Borough was 1,845. The borough’s economy is largely based on agriculture and tourism, and the median household income is $45,938.
Common Questions
What is Per Capita Income in Williamstown borough?
Per Capita income in Williamstown borough is $26,620.
What is the Median Family Income in Williamstown borough?
Median Family Income in Williamstown borough is $63,906.
What is the Median Household income in Williamstown borough?
Median Household Income in Williamstown borough is $58,015.
What is Income or Wage Gap in Williamstown borough?
Income or Wage Gap in Williamstown borough is 47.2%.
Women in Williamstown borough earn 52.8 cents for every dollar earned by a man.
What is Inequality or Gini Index in Williamstown borough?
Inequality or Gini Index in Williamstown borough is 0.34.
What is the Total Population of Williamstown borough?
Total Population of Williamstown borough is 1,162.
What is the Total Male Population of Williamstown borough?
Total Male Population of Williamstown borough is 509.
What is the Total Female Population of Williamstown borough?
Total Female Population of Williamstown borough is 653.
What is the Ratio of Males per 100 Females in Williamstown borough?
There are 77.95 Males per 100 Females in Williamstown borough.
What is the Ratio of Females per 100 Males in Williamstown borough?
There are 128.29 Females per 100 Males in Williamstown borough.
What is the Median Population Age in Williamstown borough?
Median Population Age in Williamstown borough is 40.8 Years.
What is the Average Family Size in Williamstown borough
Average Family Size in Williamstown borough is 2.8 People.
What is the Average Household Size in Williamstown borough
Average Household Size in Williamstown borough is 2.2 People.
How Large is the Labor Force in Williamstown borough?
There are 521 People in the Labor Forcein in Williamstown borough.
What is the Percentage of People in the Labor Force in Williamstown borough?
54.6% of People are in the Labor Force in Williamstown borough.
What is the Unemployment Rate in Williamstown borough?
Unemployment Rate in Williamstown borough is 5.2%.