Mountainhome, PA Map & Demographics
Mountainhome Map
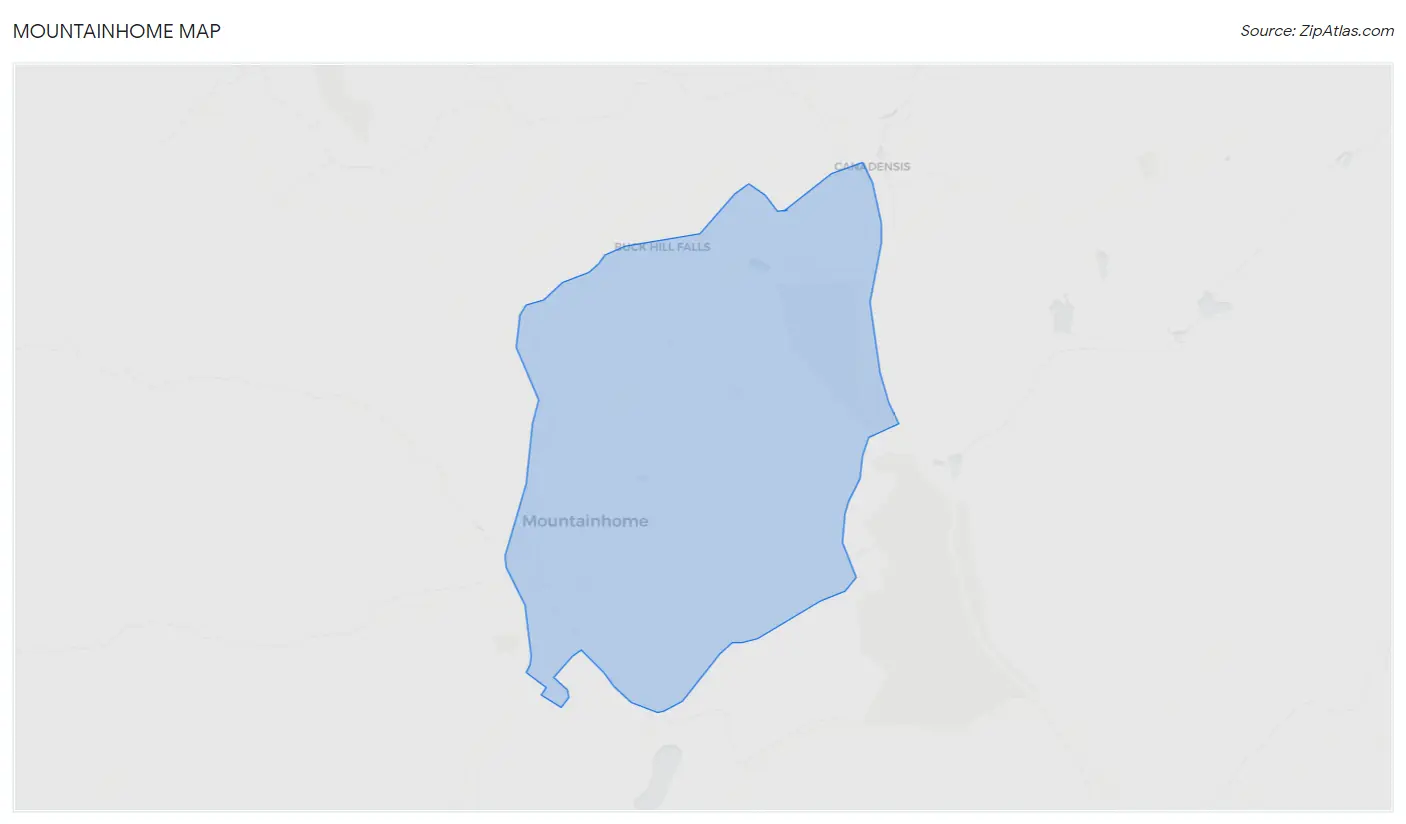
Mountainhome Overview
$38,052
PER CAPITA INCOME
$85,726
AVG HOUSEHOLD INCOME
18.7%
WAGE / INCOME GAP [ % ]
81.3¢/ $1
WAGE / INCOME GAP [ $ ]
0.39
INEQUALITY / GINI INDEX
1,033
TOTAL POPULATION
608
MALE POPULATION
425
FEMALE POPULATION
143.06
MALES / 100 FEMALES
69.90
FEMALES / 100 MALES
45.6
MEDIAN AGE
3.9
AVG FAMILY SIZE
2.8
AVG HOUSEHOLD SIZE
642
LABOR FORCE [ PEOPLE ]
72.5%
PERCENT IN LABOR FORCE
Mountainhome Zip Codes
Mountainhome Area Codes
Income in Mountainhome
Income Overview in Mountainhome
| Characteristic | Number | Measure |
| Per Capita Income | 1,033 | $38,052 |
| Median Family Income | 205 | $0 |
| Mean Family Income | 205 | $132,521 |
| Median Household Income | 368 | $85,726 |
| Mean Household Income | 368 | $97,069 |
| Income Deficit | 205 | $0 |
| Wage / Income Gap (%) | 1,033 | 18.75% |
| Wage / Income Gap ($) | 1,033 | 81.25¢ per $1 |
| Gini / Inequality Index | 1,033 | 0.39 |
Earnings by Sex in Mountainhome
Average Earnings in Mountainhome are $54,147, $54,504 for men and $44,286 for women, a difference of 18.8%.
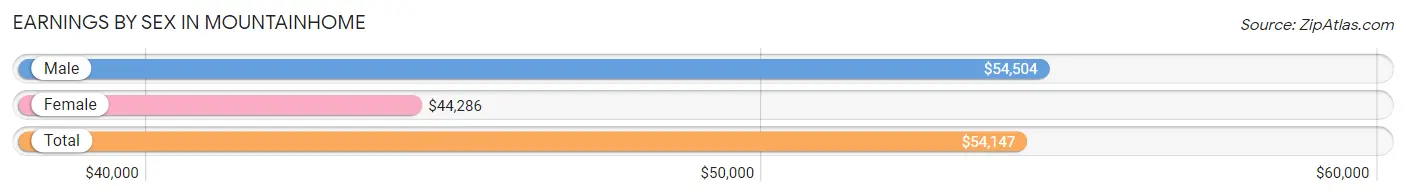
| Sex | Number | Average Earnings |
| Male | 451 (67.4%) | $54,504 |
| Female | 218 (32.6%) | $44,286 |
| Total | 669 (100.0%) | $54,147 |
Earnings by Sex by Income Bracket in Mountainhome
The most common earnings brackets in Mountainhome are $2,499 or less for men (66 | 14.6%) and $55,000 to $64,999 for women (68 | 31.2%).
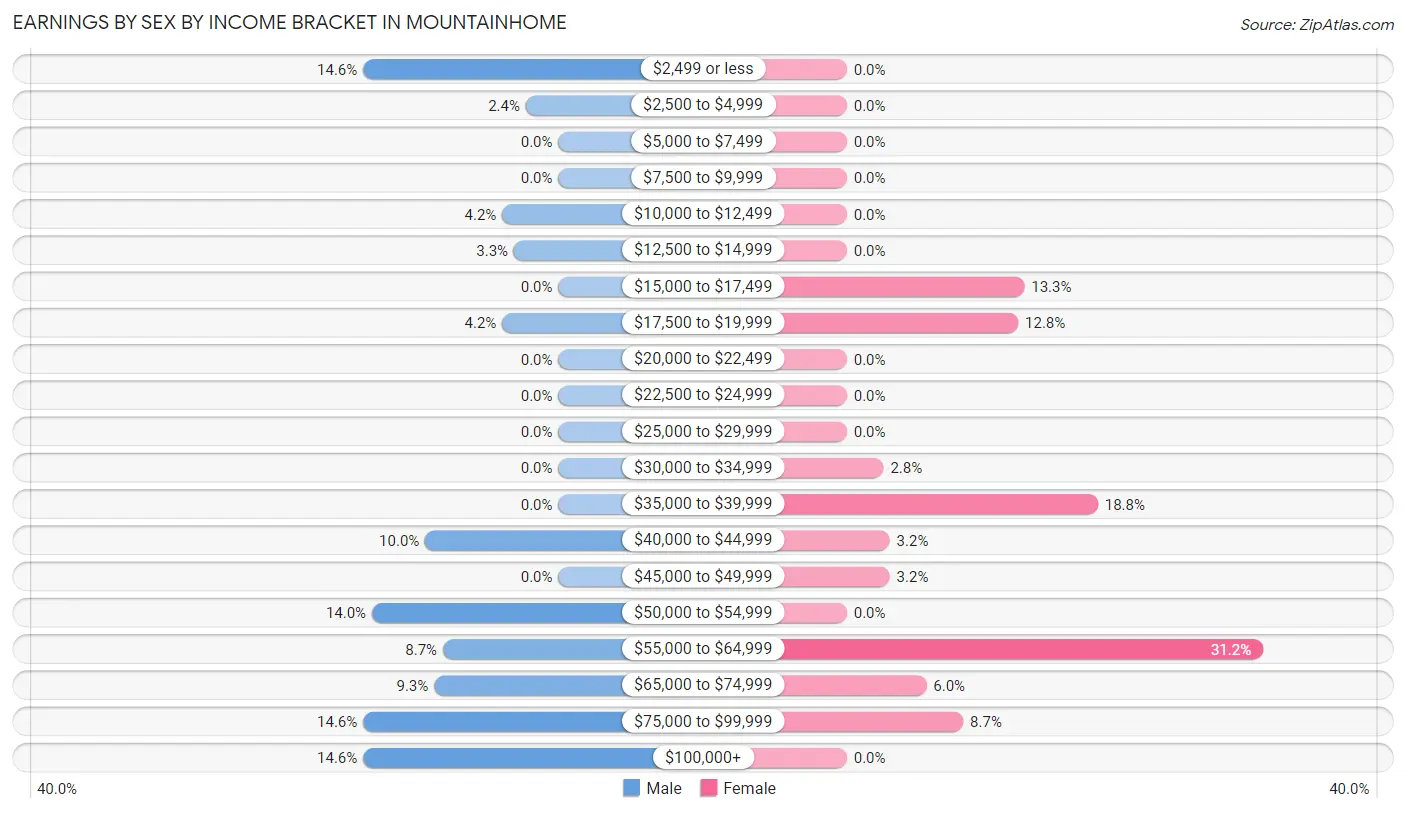
| Income | Male | Female |
| $2,499 or less | 66 (14.6%) | 0 (0.0%) |
| $2,500 to $4,999 | 11 (2.4%) | 0 (0.0%) |
| $5,000 to $7,499 | 0 (0.0%) | 0 (0.0%) |
| $7,500 to $9,999 | 0 (0.0%) | 0 (0.0%) |
| $10,000 to $12,499 | 19 (4.2%) | 0 (0.0%) |
| $12,500 to $14,999 | 15 (3.3%) | 0 (0.0%) |
| $15,000 to $17,499 | 0 (0.0%) | 29 (13.3%) |
| $17,500 to $19,999 | 19 (4.2%) | 28 (12.8%) |
| $20,000 to $22,499 | 0 (0.0%) | 0 (0.0%) |
| $22,500 to $24,999 | 0 (0.0%) | 0 (0.0%) |
| $25,000 to $29,999 | 0 (0.0%) | 0 (0.0%) |
| $30,000 to $34,999 | 0 (0.0%) | 6 (2.8%) |
| $35,000 to $39,999 | 0 (0.0%) | 41 (18.8%) |
| $40,000 to $44,999 | 45 (10.0%) | 7 (3.2%) |
| $45,000 to $49,999 | 0 (0.0%) | 7 (3.2%) |
| $50,000 to $54,999 | 63 (14.0%) | 0 (0.0%) |
| $55,000 to $64,999 | 39 (8.6%) | 68 (31.2%) |
| $65,000 to $74,999 | 42 (9.3%) | 13 (6.0%) |
| $75,000 to $99,999 | 66 (14.6%) | 19 (8.7%) |
| $100,000+ | 66 (14.6%) | 0 (0.0%) |
| Total | 451 (100.0%) | 218 (100.0%) |
Earnings by Sex by Educational Attainment in Mountainhome
Average earnings in Mountainhome are $65,774 for men and $55,423 for women, a difference of 15.7%. Men with an educational attainment of high school diploma enjoy the highest average annual earnings of $56,603, while those with high school diploma education earn the least with $56,603. Women with an educational attainment of high school diploma earn the most with the average annual earnings of $56,710, while those with high school diploma education have the smallest earnings of $56,710.
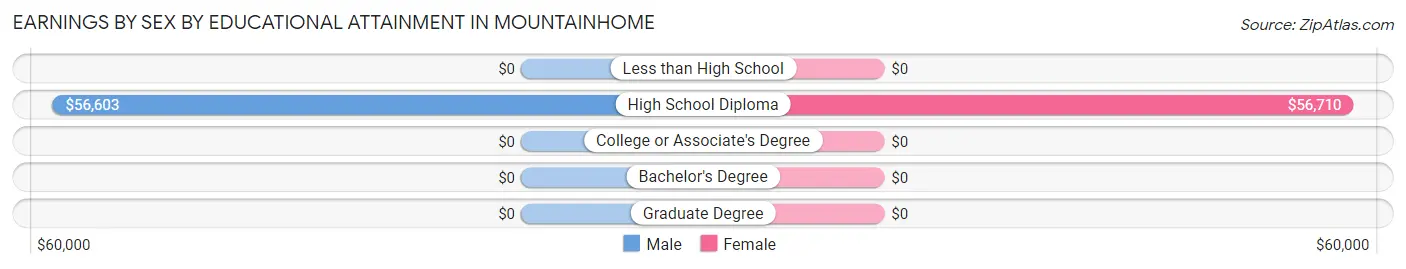
| Educational Attainment | Male Income | Female Income |
| Less than High School | - | - |
| High School Diploma | $56,603 | $56,710 |
| College or Associate's Degree | - | - |
| Bachelor's Degree | - | - |
| Graduate Degree | - | - |
| Total | $65,774 | $55,423 |
Family Income in Mountainhome
Family Income Brackets in Mountainhome
According to the Mountainhome family income data, there are 76 families falling into the $200,000+ income range, which is the most common income bracket and makes up 37.1% of all families.
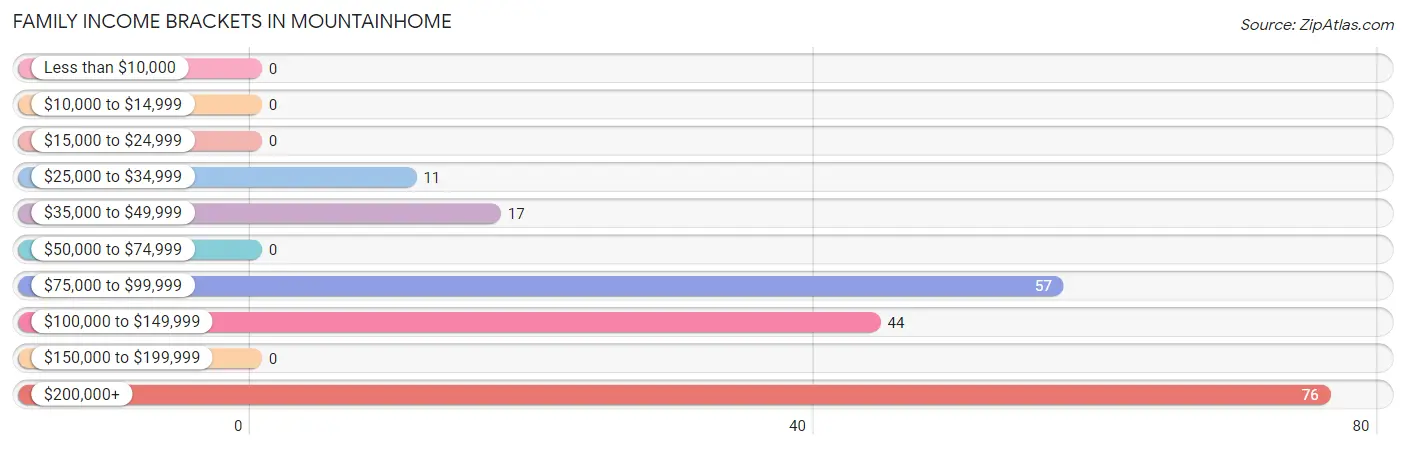
| Income Bracket | # Families | % Families |
| Less than $10,000 | 0 | 0.0% |
| $10,000 to $14,999 | 0 | 0.0% |
| $15,000 to $24,999 | 0 | 0.0% |
| $25,000 to $34,999 | 11 | 5.4% |
| $35,000 to $49,999 | 17 | 8.3% |
| $50,000 to $74,999 | 0 | 0.0% |
| $75,000 to $99,999 | 57 | 27.8% |
| $100,000 to $149,999 | 44 | 21.5% |
| $150,000 to $199,999 | 0 | 0.0% |
| $200,000+ | 76 | 37.1% |
Family Income by Famaliy Size in Mountainhome
2-person families (79 | 38.5%) account for the highest median family income in Mountainhome with $105,321 per family, while 2-person families (79 | 38.5%) have the highest median income of $52,660 per family member.
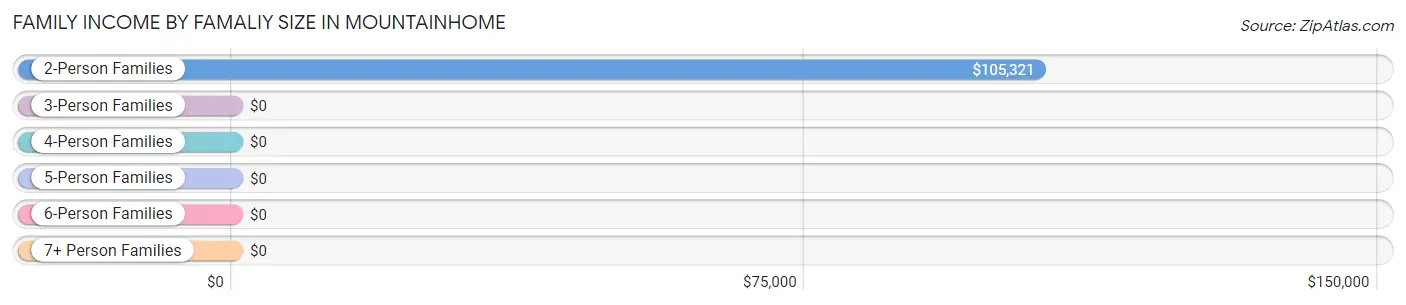
| Income Bracket | # Families | Median Income |
| 2-Person Families | 79 (38.5%) | $105,321 |
| 3-Person Families | 0 (0.0%) | $0 |
| 4-Person Families | 92 (44.9%) | $0 |
| 5-Person Families | 34 (16.6%) | $0 |
| 6-Person Families | 0 (0.0%) | $0 |
| 7+ Person Families | 0 (0.0%) | $0 |
| Total | 205 (100.0%) | $0 |
Family Income by Number of Earners in Mountainhome
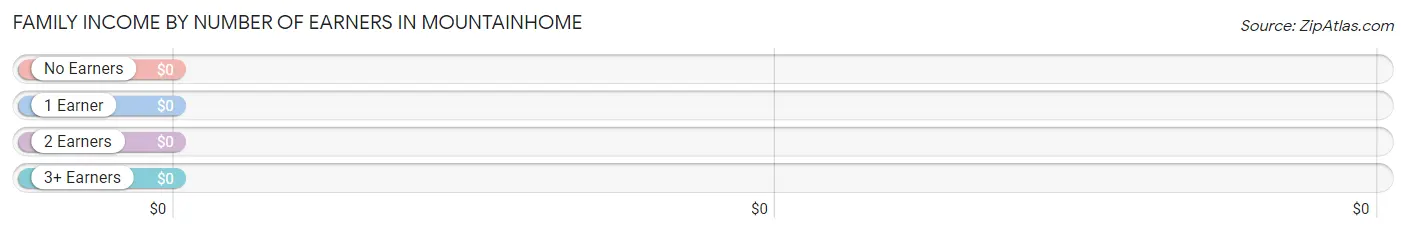
| Number of Earners | # Families | Median Income |
| No Earners | 17 (8.3%) | $0 |
| 1 Earner | 40 (19.5%) | $0 |
| 2 Earners | 91 (44.4%) | $0 |
| 3+ Earners | 57 (27.8%) | $0 |
| Total | 205 (100.0%) | $0 |
Household Income in Mountainhome
Household Income Brackets in Mountainhome
With 79 households falling in the category, the $75,000 to $99,999 income range is the most frequent in Mountainhome, accounting for 21.5% of all households.
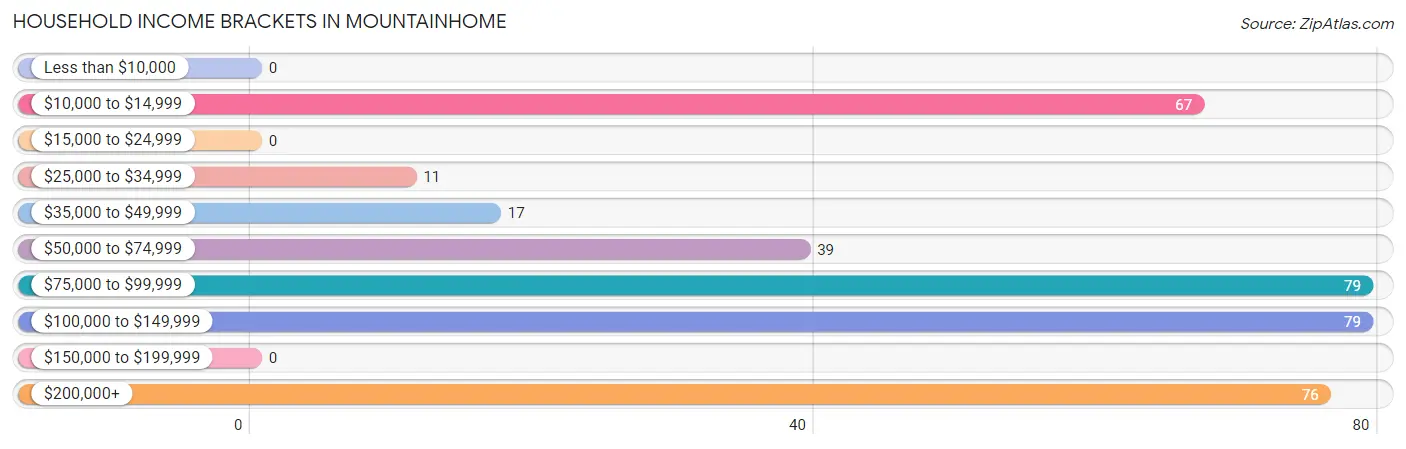
| Income Bracket | # Households | % Households |
| Less than $10,000 | 0 | 0.0% |
| $10,000 to $14,999 | 67 | 18.2% |
| $15,000 to $24,999 | 0 | 0.0% |
| $25,000 to $34,999 | 11 | 3.0% |
| $35,000 to $49,999 | 17 | 4.6% |
| $50,000 to $74,999 | 39 | 10.6% |
| $75,000 to $99,999 | 79 | 21.5% |
| $100,000 to $149,999 | 79 | 21.5% |
| $150,000 to $199,999 | 0 | 0.0% |
| $200,000+ | 76 | 20.7% |
Household Income by Householder Age in Mountainhome
The median household income in Mountainhome is $85,726, with the highest median household income of $106,929 found in the 45 to 64 years age bracket for the primary householder. A total of 238 households (64.7%) fall into this category.
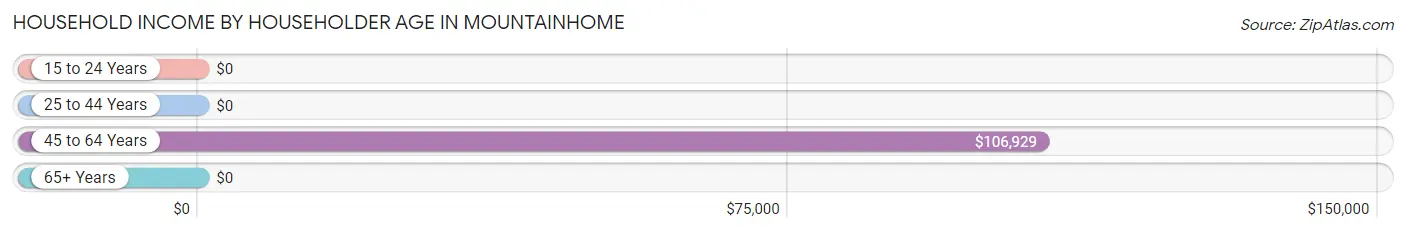
| Income Bracket | # Households | Median Income |
| 15 to 24 Years | 0 (0.0%) | $0 |
| 25 to 44 Years | 7 (1.9%) | $0 |
| 45 to 64 Years | 238 (64.7%) | $106,929 |
| 65+ Years | 123 (33.4%) | $0 |
| Total | 368 (100.0%) | $85,726 |
Poverty in Mountainhome
Income Below Poverty by Sex and Age in Mountainhome
With 11.0% poverty level for males and 8.2% for females among the residents of Mountainhome, 55 to 64 year old males and 65 to 74 year old females are the most vulnerable to poverty, with 19 males (55.9%) and 30 females (43.5%) in their respective age groups living below the poverty level.
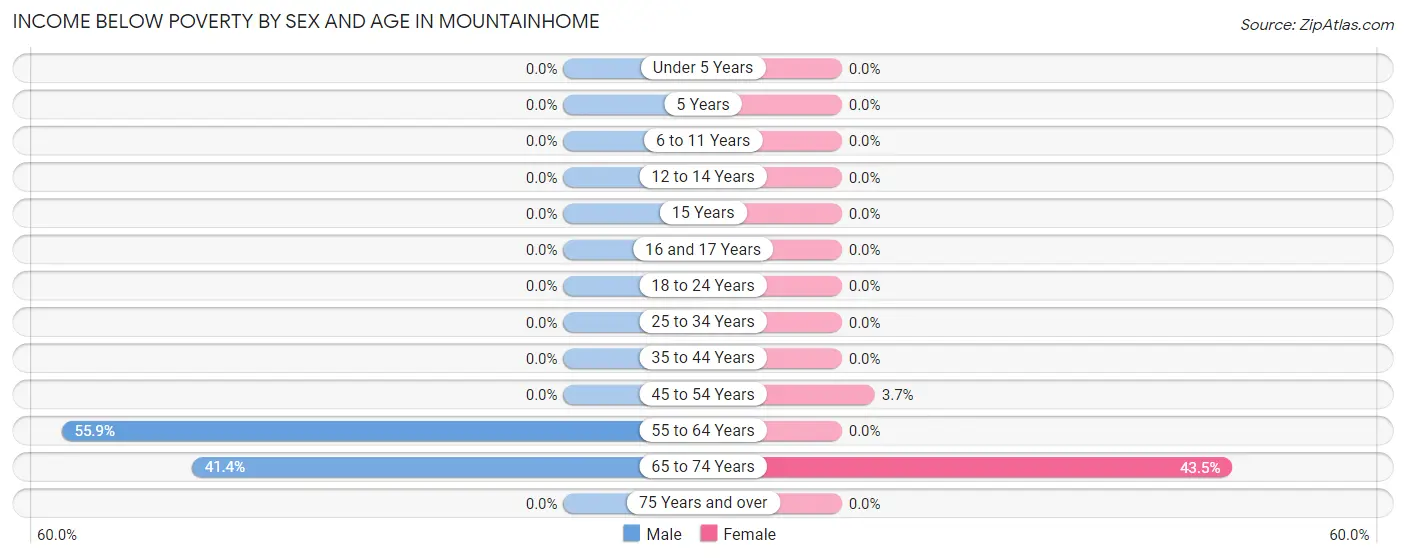
| Age Bracket | Male | Female |
| Under 5 Years | 0 (0.0%) | 0 (0.0%) |
| 5 Years | 0 (0.0%) | 0 (0.0%) |
| 6 to 11 Years | 0 (0.0%) | 0 (0.0%) |
| 12 to 14 Years | 0 (0.0%) | 0 (0.0%) |
| 15 Years | 0 (0.0%) | 0 (0.0%) |
| 16 and 17 Years | 0 (0.0%) | 0 (0.0%) |
| 18 to 24 Years | 0 (0.0%) | 0 (0.0%) |
| 25 to 34 Years | 0 (0.0%) | 0 (0.0%) |
| 35 to 44 Years | 0 (0.0%) | 0 (0.0%) |
| 45 to 54 Years | 0 (0.0%) | 5 (3.7%) |
| 55 to 64 Years | 19 (55.9%) | 0 (0.0%) |
| 65 to 74 Years | 48 (41.4%) | 30 (43.5%) |
| 75 Years and over | 0 (0.0%) | 0 (0.0%) |
| Total | 67 (11.0%) | 35 (8.2%) |
Income Above Poverty by Sex and Age in Mountainhome
According to the poverty statistics in Mountainhome, males aged under 5 years and females aged under 5 years are the age groups that are most secure financially, with 100.0% of males and 100.0% of females in these age groups living above the poverty line.
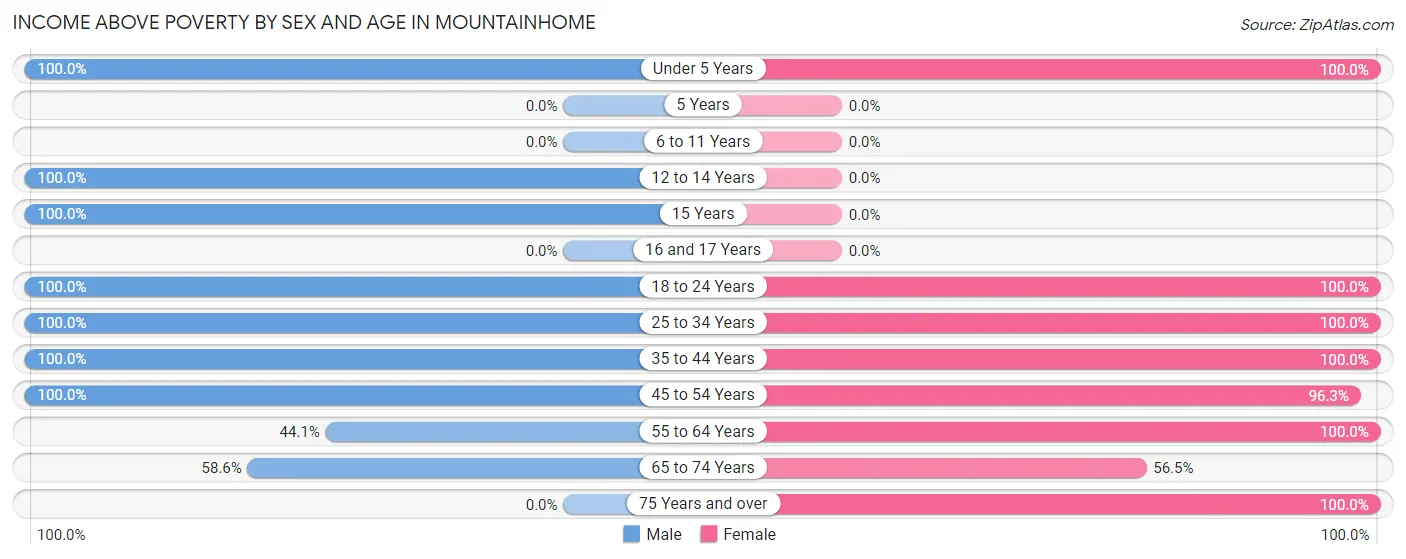
| Age Bracket | Male | Female |
| Under 5 Years | 36 (100.0%) | 55 (100.0%) |
| 5 Years | 0 (0.0%) | 0 (0.0%) |
| 6 to 11 Years | 0 (0.0%) | 0 (0.0%) |
| 12 to 14 Years | 29 (100.0%) | 0 (0.0%) |
| 15 Years | 27 (100.0%) | 0 (0.0%) |
| 16 and 17 Years | 0 (0.0%) | 0 (0.0%) |
| 18 to 24 Years | 129 (100.0%) | 85 (100.0%) |
| 25 to 34 Years | 36 (100.0%) | 13 (100.0%) |
| 35 to 44 Years | 19 (100.0%) | 29 (100.0%) |
| 45 to 54 Years | 182 (100.0%) | 131 (96.3%) |
| 55 to 64 Years | 15 (44.1%) | 19 (100.0%) |
| 65 to 74 Years | 68 (58.6%) | 39 (56.5%) |
| 75 Years and over | 0 (0.0%) | 19 (100.0%) |
| Total | 541 (89.0%) | 390 (91.8%) |
Income Below Poverty Among Married-Couple Families in Mountainhome
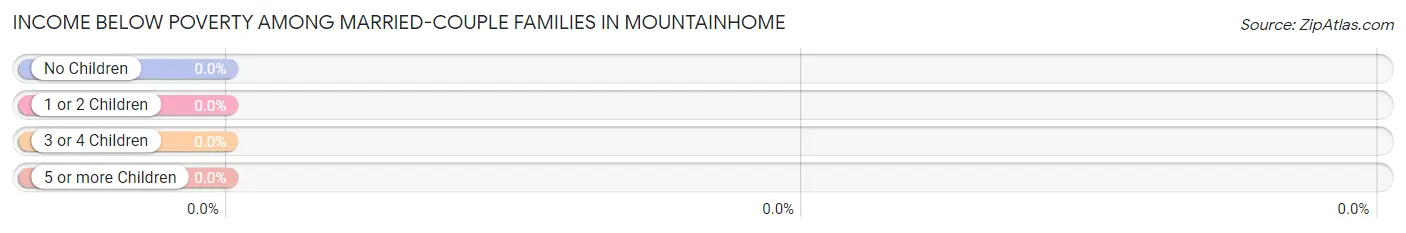
| Children | Above Poverty | Below Poverty |
| No Children | 115 (100.0%) | 0 (0.0%) |
| 1 or 2 Children | 34 (100.0%) | 0 (0.0%) |
| 3 or 4 Children | 0 (0.0%) | 0 (0.0%) |
| 5 or more Children | 0 (0.0%) | 0 (0.0%) |
| Total | 149 (100.0%) | 0 (0.0%) |
Income Below Poverty Among Single-Parent Households in Mountainhome
| Children | Single Father | Single Mother |
| No Children | 0 (0.0%) | 0 (0.0%) |
| 1 or 2 Children | 0 (0.0%) | 0 (0.0%) |
| 3 or 4 Children | 0 (0.0%) | 0 (0.0%) |
| 5 or more Children | 0 (0.0%) | 0 (0.0%) |
| Total | 0 (0.0%) | 0 (0.0%) |
Income Below Poverty Among Married-Couple vs Single-Parent Households in Mountainhome
| Children | Married-Couple Families | Single-Parent Households |
| No Children | 0 (0.0%) | 0 (0.0%) |
| 1 or 2 Children | 0 (0.0%) | 0 (0.0%) |
| 3 or 4 Children | 0 (0.0%) | 0 (0.0%) |
| 5 or more Children | 0 (0.0%) | 0 (0.0%) |
| Total | 0 (0.0%) | 0 (0.0%) |
Race in Mountainhome
The most populous races in Mountainhome are White / Caucasian (718 | 69.5%), Asian (243 | 23.5%), and Two or more Races (61 | 5.9%).
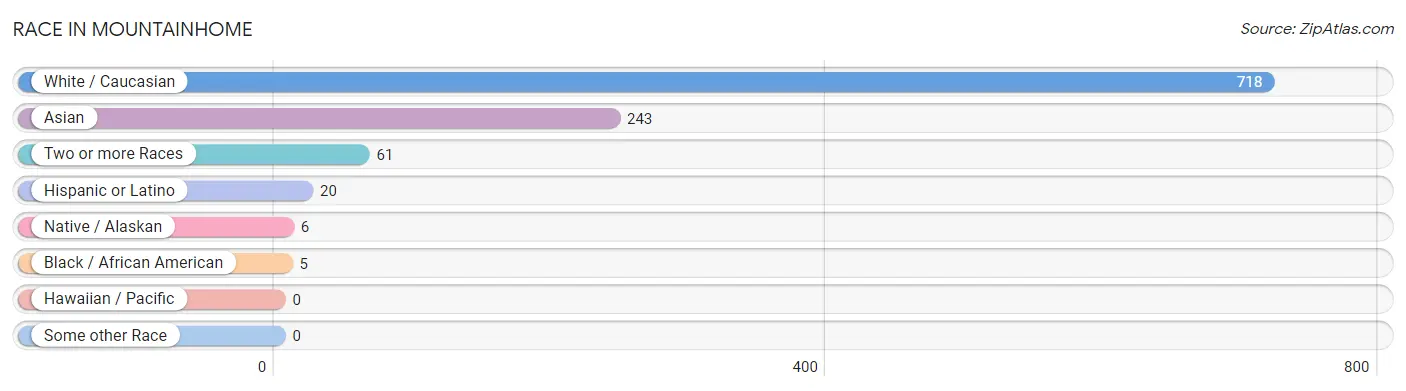
| Race | # Population | % Population |
| Asian | 243 | 23.5% |
| Black / African American | 5 | 0.5% |
| Hawaiian / Pacific | 0 | 0.0% |
| Hispanic or Latino | 20 | 1.9% |
| Native / Alaskan | 6 | 0.6% |
| White / Caucasian | 718 | 69.5% |
| Two or more Races | 61 | 5.9% |
| Some other Race | 0 | 0.0% |
| Total | 1,033 | 100.0% |
Ancestry in Mountainhome
The most populous ancestries reported in Mountainhome are American (268 | 25.9%), Thai (214 | 20.7%), Italian (151 | 14.6%), Irish (127 | 12.3%), and English (88 | 8.5%), together accounting for 82.1% of all Mountainhome residents.
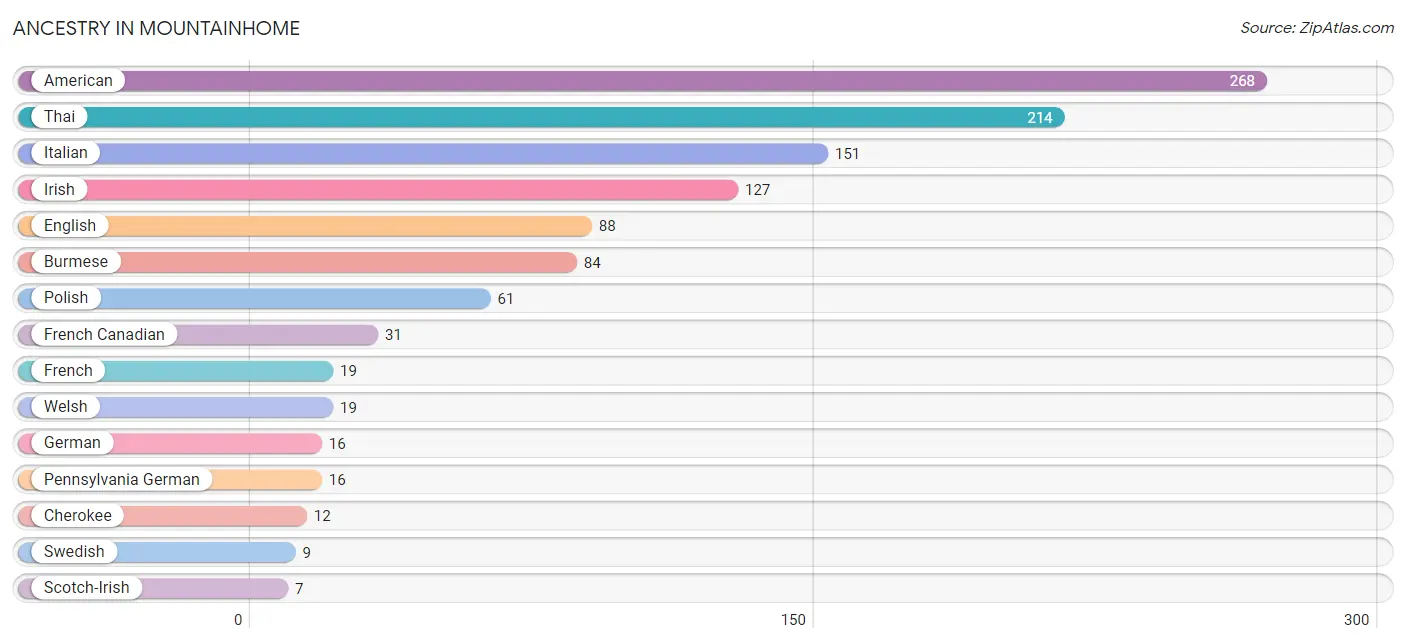
| Ancestry | # Population | % Population |
| American | 268 | 25.9% |
| Burmese | 84 | 8.1% |
| Cherokee | 12 | 1.2% |
| English | 88 | 8.5% |
| French | 19 | 1.8% |
| French Canadian | 31 | 3.0% |
| German | 16 | 1.5% |
| Irish | 127 | 12.3% |
| Italian | 151 | 14.6% |
| Pennsylvania German | 16 | 1.5% |
| Polish | 61 | 5.9% |
| Scotch-Irish | 7 | 0.7% |
| Swedish | 9 | 0.9% |
| Thai | 214 | 20.7% |
| Ukrainian | 7 | 0.7% |
| Welsh | 19 | 1.8% | View All 16 Rows |
Immigrants in Mountainhome
The most numerous immigrant groups reported in Mountainhome came from Asia (71 | 6.9%), India (42 | 4.1%), South Central Asia (42 | 4.1%), Eastern Asia (29 | 2.8%), and Korea (29 | 2.8%), together accounting for 20.6% of all Mountainhome residents.
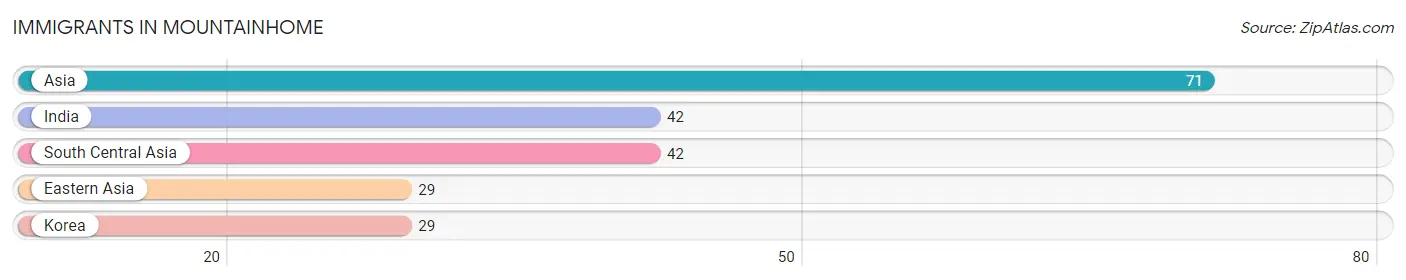
| Immigration Origin | # Population | % Population |
| Asia | 71 | 6.9% |
| Eastern Asia | 29 | 2.8% |
| India | 42 | 4.1% |
| Korea | 29 | 2.8% |
| South Central Asia | 42 | 4.1% | View All 5 Rows |
Sex and Age in Mountainhome
Sex and Age in Mountainhome
The most populous age groups in Mountainhome are 20 to 24 Years (129 | 21.2%) for men and 45 to 49 Years (101 | 23.8%) for women.
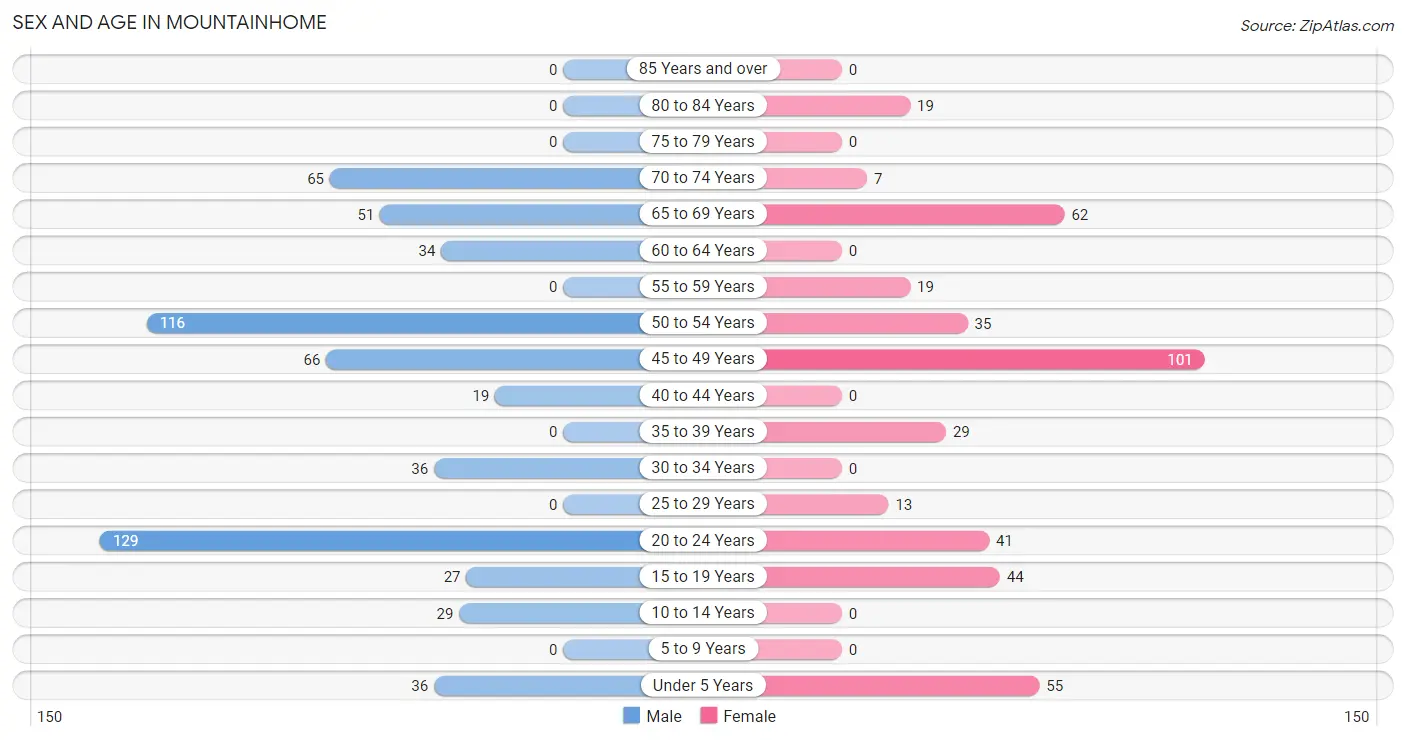
| Age Bracket | Male | Female |
| Under 5 Years | 36 (5.9%) | 55 (12.9%) |
| 5 to 9 Years | 0 (0.0%) | 0 (0.0%) |
| 10 to 14 Years | 29 (4.8%) | 0 (0.0%) |
| 15 to 19 Years | 27 (4.4%) | 44 (10.3%) |
| 20 to 24 Years | 129 (21.2%) | 41 (9.7%) |
| 25 to 29 Years | 0 (0.0%) | 13 (3.1%) |
| 30 to 34 Years | 36 (5.9%) | 0 (0.0%) |
| 35 to 39 Years | 0 (0.0%) | 29 (6.8%) |
| 40 to 44 Years | 19 (3.1%) | 0 (0.0%) |
| 45 to 49 Years | 66 (10.9%) | 101 (23.8%) |
| 50 to 54 Years | 116 (19.1%) | 35 (8.2%) |
| 55 to 59 Years | 0 (0.0%) | 19 (4.5%) |
| 60 to 64 Years | 34 (5.6%) | 0 (0.0%) |
| 65 to 69 Years | 51 (8.4%) | 62 (14.6%) |
| 70 to 74 Years | 65 (10.7%) | 7 (1.7%) |
| 75 to 79 Years | 0 (0.0%) | 0 (0.0%) |
| 80 to 84 Years | 0 (0.0%) | 19 (4.5%) |
| 85 Years and over | 0 (0.0%) | 0 (0.0%) |
| Total | 608 (100.0%) | 425 (100.0%) |
Families and Households in Mountainhome
Median Family Size in Mountainhome
The median family size in Mountainhome is 3.93 persons per family, with single male/father families (50 | 24.4%) accounting for the largest median family size of 5.06 persons per family. On the other hand, single female/mother families (6 | 2.9%) represent the smallest median family size with 2.00 persons per family.
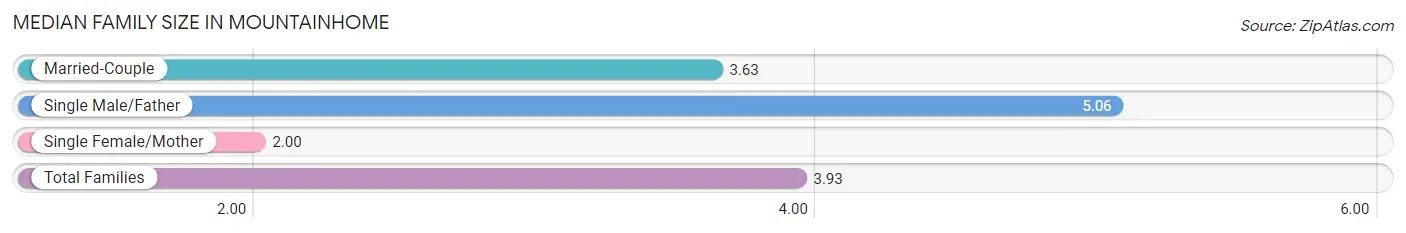
| Family Type | # Families | Family Size |
| Married-Couple | 149 (72.7%) | 3.63 |
| Single Male/Father | 50 (24.4%) | 5.06 |
| Single Female/Mother | 6 (2.9%) | 2.00 |
| Total Families | 205 (100.0%) | 3.93 |
Median Household Size in Mountainhome
The median household size in Mountainhome is 2.79 persons per household, with single male/father households (50 | 13.6%) accounting for the largest median household size of 5.64 persons per household. non-family households (163 | 44.3%) represent the smallest median household size with 1.18 persons per household.
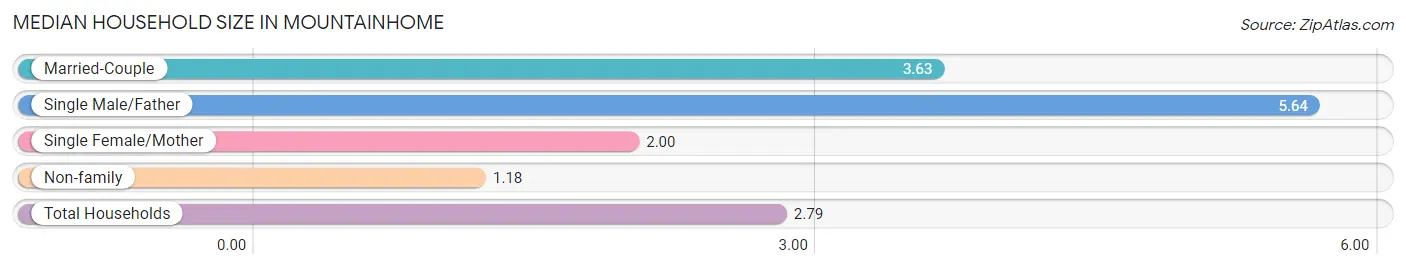
| Household Type | # Households | Household Size |
| Married-Couple | 149 (40.5%) | 3.63 |
| Single Male/Father | 50 (13.6%) | 5.64 |
| Single Female/Mother | 6 (1.6%) | 2.00 |
| Non-family | 163 (44.3%) | 1.18 |
| Total Households | 368 (100.0%) | 2.79 |
Household Size by Marriage Status in Mountainhome
Out of a total of 368 households in Mountainhome, 205 (55.7%) are family households, while 163 (44.3%) are nonfamily households. The most numerous type of family households are 2-person households, comprising 79, and the most common type of nonfamily households are 1-person households, comprising 124.
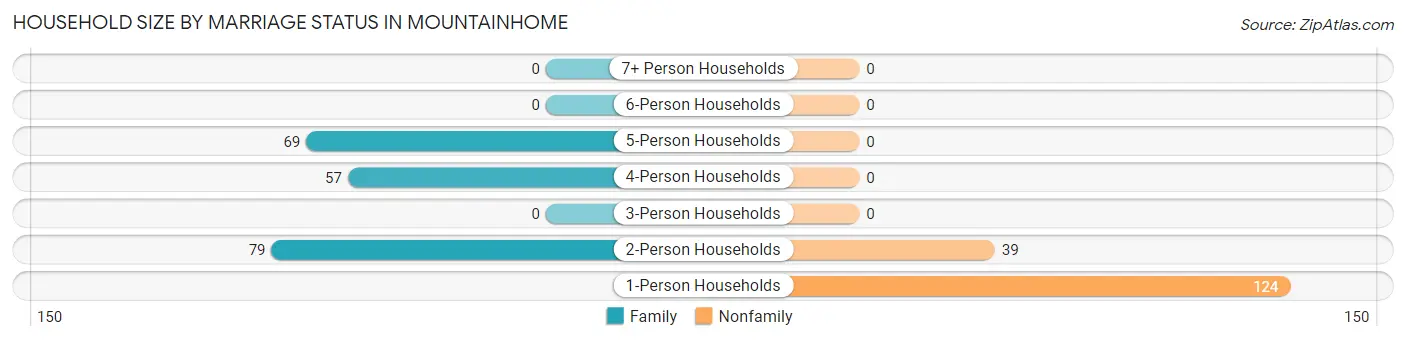
| Household Size | Family Households | Nonfamily Households |
| 1-Person Households | - | 124 (33.7%) |
| 2-Person Households | 79 (21.5%) | 39 (10.6%) |
| 3-Person Households | 0 (0.0%) | 0 (0.0%) |
| 4-Person Households | 57 (15.5%) | 0 (0.0%) |
| 5-Person Households | 69 (18.8%) | 0 (0.0%) |
| 6-Person Households | 0 (0.0%) | 0 (0.0%) |
| 7+ Person Households | 0 (0.0%) | 0 (0.0%) |
| Total | 205 (55.7%) | 163 (44.3%) |
Female Fertility in Mountainhome
Fertility by Age in Mountainhome
| Age Bracket | Women with Births | Births / 1,000 Women |
| 15 to 19 years | 0 (0.0%) | 0.0 |
| 20 to 34 years | 0 (0.0%) | 0.0 |
| 35 to 50 years | 0 (0.0%) | 0.0 |
| Total | 0 (0.0%) | 0.0 |
Fertility by Age by Marriage Status in Mountainhome
| Age Bracket | Married | Unmarried |
| 15 to 19 years | 0 (0.0%) | 0 (0.0%) |
| 20 to 34 years | 0 (0.0%) | 0 (0.0%) |
| 35 to 50 years | 0 (0.0%) | 0 (0.0%) |
| Total | 0 (0.0%) | 0 (0.0%) |
Fertility by Education in Mountainhome
| Educational Attainment | Women with Births | Births / 1,000 Women |
| Less than High School | 0 (0.0%) | 0.0 |
| High School Diploma | 0 (0.0%) | 0.0 |
| College or Associate's Degree | 0 (0.0%) | 0.0 |
| Bachelor's Degree | 0 (0.0%) | 0.0 |
| Graduate Degree | 0 (0.0%) | 0.0 |
| Total | 0 (0.0%) | 0.0 |
Fertility by Education by Marriage Status in Mountainhome
| Educational Attainment | Married | Unmarried |
| Less than High School | 0 (0.0%) | 0 (0.0%) |
| High School Diploma | 0 (0.0%) | 0 (0.0%) |
| College or Associate's Degree | 0 (0.0%) | 0 (0.0%) |
| Bachelor's Degree | 0 (0.0%) | 0 (0.0%) |
| Graduate Degree | 0 (0.0%) | 0 (0.0%) |
| Total | 0 (0.0%) | 0 (0.0%) |
Employment Characteristics in Mountainhome
Employment by Class of Employer in Mountainhome
Among the 642 employed individuals in Mountainhome, private company employees (519 | 80.8%), self-employed (incorporated) (50 | 7.8%), and not-for-profit organizations (28 | 4.4%) make up the most common classes of employment.
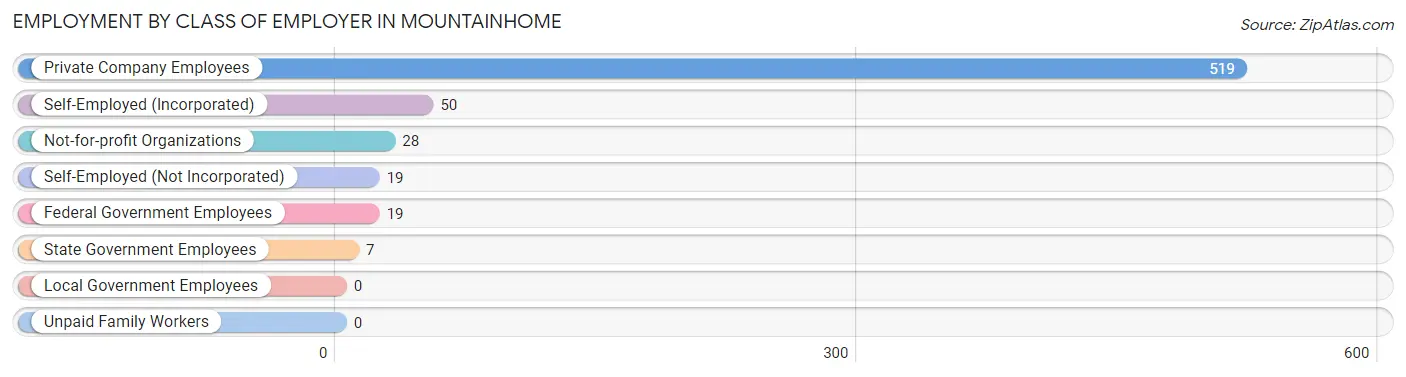
| Employer Class | # Employees | % Employees |
| Private Company Employees | 519 | 80.8% |
| Self-Employed (Incorporated) | 50 | 7.8% |
| Self-Employed (Not Incorporated) | 19 | 3.0% |
| Not-for-profit Organizations | 28 | 4.4% |
| Local Government Employees | 0 | 0.0% |
| State Government Employees | 7 | 1.1% |
| Federal Government Employees | 19 | 3.0% |
| Unpaid Family Workers | 0 | 0.0% |
| Total | 642 | 100.0% |
Employment Status by Age in Mountainhome
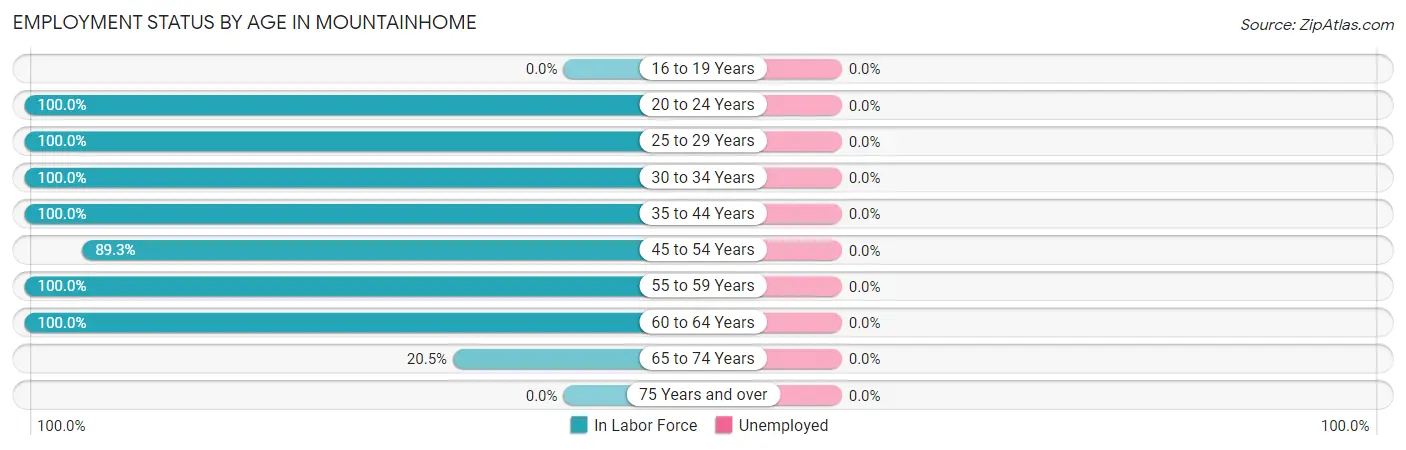
| Age Bracket | In Labor Force | Unemployed |
| 16 to 19 Years | 0 (0.0%) | 0 (0.0%) |
| 20 to 24 Years | 170 (100.0%) | 0 (0.0%) |
| 25 to 29 Years | 13 (100.0%) | 0 (0.0%) |
| 30 to 34 Years | 36 (100.0%) | 0 (0.0%) |
| 35 to 44 Years | 48 (100.0%) | 0 (0.0%) |
| 45 to 54 Years | 284 (89.3%) | 0 (0.0%) |
| 55 to 59 Years | 19 (100.0%) | 0 (0.0%) |
| 60 to 64 Years | 34 (100.0%) | 0 (0.0%) |
| 65 to 74 Years | 38 (20.5%) | 0 (0.0%) |
| 75 Years and over | 0 (0.0%) | 0 (0.0%) |
| Total | 642 (72.5%) | 0 (0.0%) |
Employment Status by Educational Attainment in Mountainhome
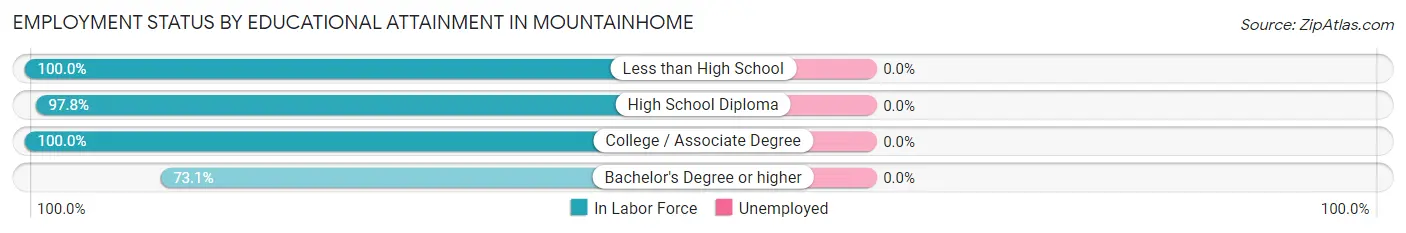
| Educational Attainment | In Labor Force | Unemployed |
| Less than High School | 6 (100.0%) | 0 (0.0%) |
| High School Diploma | 222 (97.8%) | 0 (0.0%) |
| College / Associate Degree | 127 (100.0%) | 0 (0.0%) |
| Bachelor's Degree or higher | 79 (73.1%) | 0 (0.0%) |
| Total | 434 (92.7%) | 0 (0.0%) |
Employment Occupations by Sex in Mountainhome
Management, Business, Science and Arts Occupations
The most common Management, Business, Science and Arts occupations in Mountainhome are Management (148 | 23.1%), Community & Social Service (41 | 6.4%), Arts, Media & Entertainment (41 | 6.4%), Business & Financial (39 | 6.1%), and Health Diagnosing & Treating (7 | 1.1%).
Management, Business, Science and Arts Occupations by Sex
Within the Management, Business, Science and Arts occupations in Mountainhome, the most male-oriented occupations are Management (96.0%), and Business & Financial (82.1%), while the most female-oriented occupations are Community & Social Service (100.0%), Arts, Media & Entertainment (100.0%), and Health Diagnosing & Treating (100.0%).
| Occupation | Male | Female |
| Management | 142 (96.0%) | 6 (4.1%) |
| Business & Financial | 32 (82.1%) | 7 (17.9%) |
| Computers, Engineering & Science | 0 (0.0%) | 0 (0.0%) |
| Computers & Mathematics | 0 (0.0%) | 0 (0.0%) |
| Architecture & Engineering | 0 (0.0%) | 0 (0.0%) |
| Life, Physical & Social Science | 0 (0.0%) | 0 (0.0%) |
| Community & Social Service | 0 (0.0%) | 41 (100.0%) |
| Education, Arts & Media | 0 (0.0%) | 0 (0.0%) |
| Legal Services & Support | 0 (0.0%) | 0 (0.0%) |
| Education Instruction & Library | 0 (0.0%) | 0 (0.0%) |
| Arts, Media & Entertainment | 0 (0.0%) | 41 (100.0%) |
| Health Diagnosing & Treating | 0 (0.0%) | 7 (100.0%) |
| Health Technologists | 0 (0.0%) | 0 (0.0%) |
| Total (Category) | 174 (74.0%) | 61 (26.0%) |
| Total (Overall) | 431 (67.1%) | 211 (32.9%) |
Services Occupations
The most common Services occupations in Mountainhome are Personal Care & Service (28 | 4.4%), Security & Protection (20 | 3.1%), Firefighting & Prevention (20 | 3.1%), and Food Preparation & Serving (19 | 3.0%).
Services Occupations by Sex
| Occupation | Male | Female |
| Healthcare Support | 0 (0.0%) | 0 (0.0%) |
| Security & Protection | 20 (100.0%) | 0 (0.0%) |
| Firefighting & Prevention | 20 (100.0%) | 0 (0.0%) |
| Law Enforcement | 0 (0.0%) | 0 (0.0%) |
| Food Preparation & Serving | 19 (100.0%) | 0 (0.0%) |
| Cleaning & Maintenance | 0 (0.0%) | 0 (0.0%) |
| Personal Care & Service | 0 (0.0%) | 28 (100.0%) |
| Total (Category) | 39 (58.2%) | 28 (41.8%) |
| Total (Overall) | 431 (67.1%) | 211 (32.9%) |
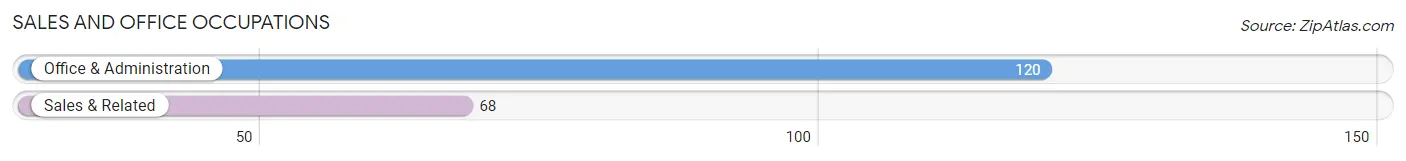
Sales and Office Occupations
The most common Sales and Office occupations in Mountainhome are Office & Administration (120 | 18.7%), and Sales & Related (68 | 10.6%).
Sales and Office Occupations by Sex
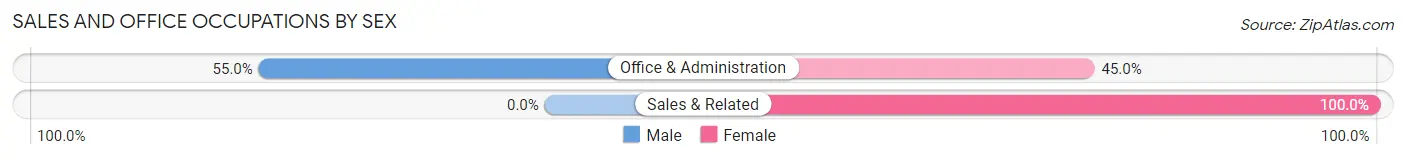
| Occupation | Male | Female |
| Sales & Related | 0 (0.0%) | 68 (100.0%) |
| Office & Administration | 66 (55.0%) | 54 (45.0%) |
| Total (Category) | 66 (35.1%) | 122 (64.9%) |
| Total (Overall) | 431 (67.1%) | 211 (32.9%) |
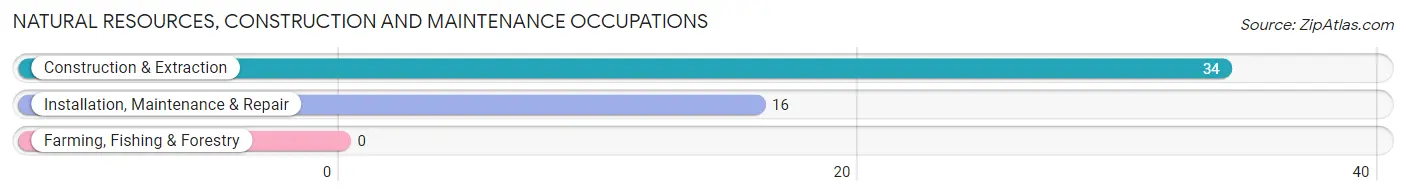
Natural Resources, Construction and Maintenance Occupations
The most common Natural Resources, Construction and Maintenance occupations in Mountainhome are Construction & Extraction (34 | 5.3%), and Installation, Maintenance & Repair (16 | 2.5%).
Natural Resources, Construction and Maintenance Occupations by Sex
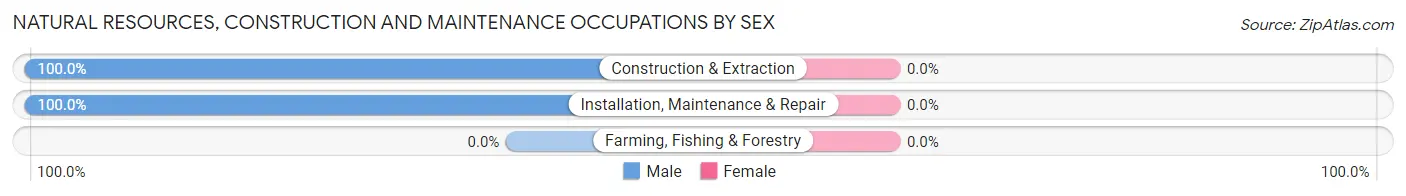
| Occupation | Male | Female |
| Farming, Fishing & Forestry | 0 (0.0%) | 0 (0.0%) |
| Construction & Extraction | 34 (100.0%) | 0 (0.0%) |
| Installation, Maintenance & Repair | 16 (100.0%) | 0 (0.0%) |
| Total (Category) | 50 (100.0%) | 0 (0.0%) |
| Total (Overall) | 431 (67.1%) | 211 (32.9%) |
Production, Transportation and Moving Occupations
The most common Production, Transportation and Moving occupations in Mountainhome are , and Production (102 | 15.9%).
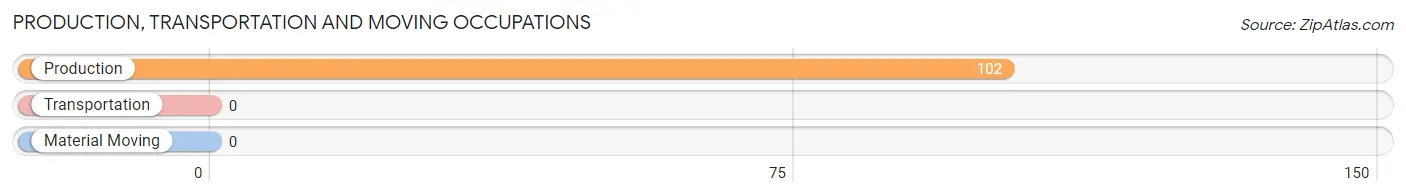
Production, Transportation and Moving Occupations by Sex
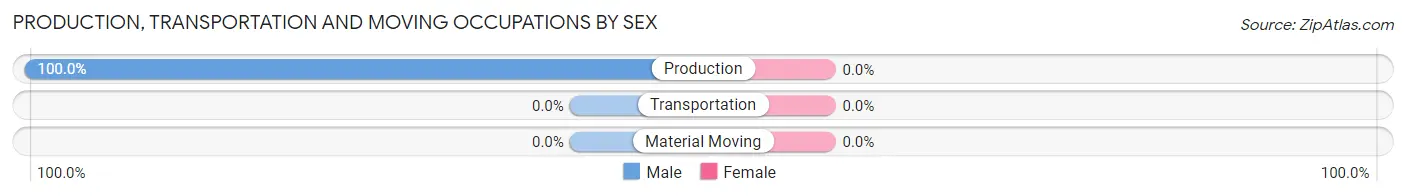
| Occupation | Male | Female |
| Production | 102 (100.0%) | 0 (0.0%) |
| Transportation | 0 (0.0%) | 0 (0.0%) |
| Material Moving | 0 (0.0%) | 0 (0.0%) |
| Total (Category) | 102 (100.0%) | 0 (0.0%) |
| Total (Overall) | 431 (67.1%) | 211 (32.9%) |
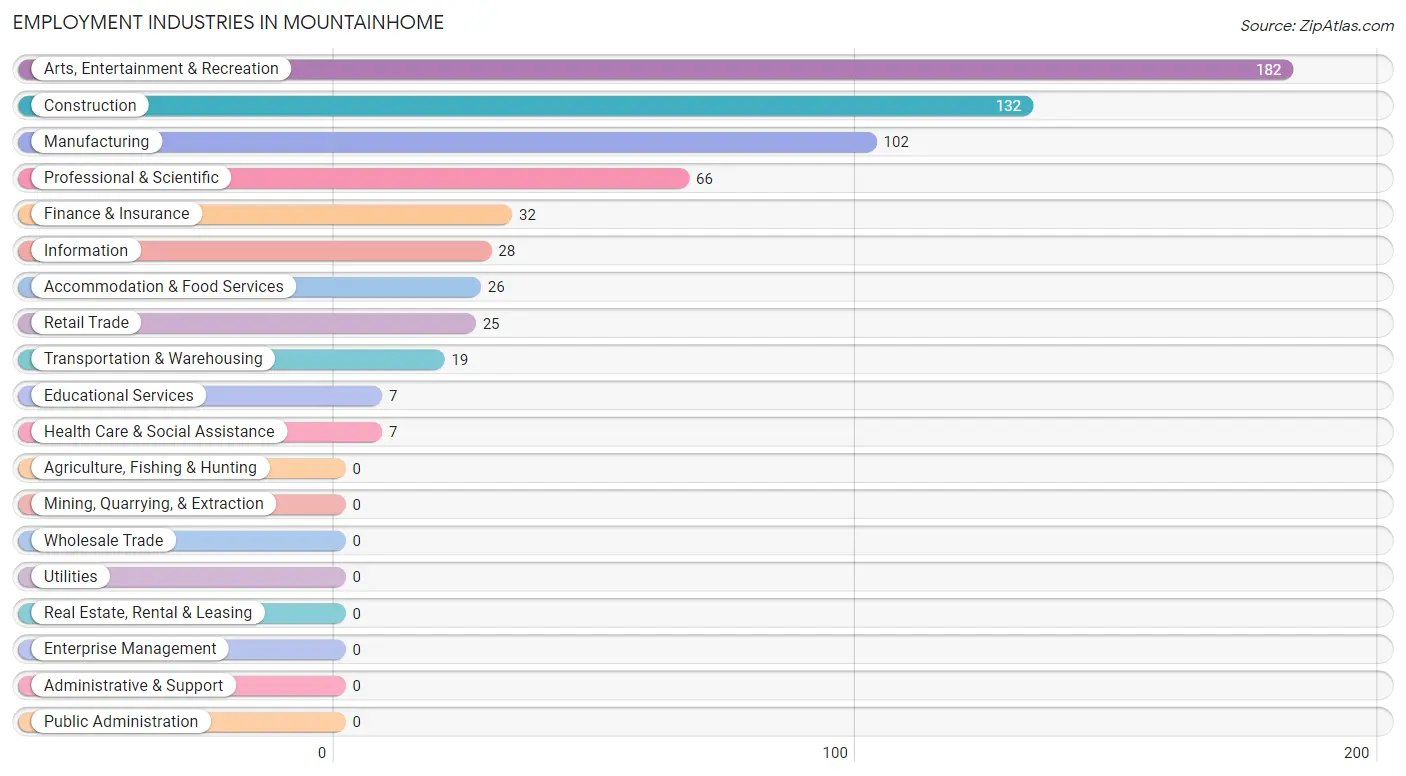
Employment Industries by Sex in Mountainhome
Employment Industries in Mountainhome
The major employment industries in Mountainhome include Arts, Entertainment & Recreation (182 | 28.3%), Construction (132 | 20.6%), Manufacturing (102 | 15.9%), Professional & Scientific (66 | 10.3%), and Finance & Insurance (32 | 5.0%).
Employment Industries by Sex in Mountainhome
The Mountainhome industries that see more men than women are Manufacturing (100.0%), Finance & Insurance (100.0%), and Professional & Scientific (100.0%), whereas the industries that tend to have a higher number of women are Transportation & Warehousing (100.0%), Information (100.0%), and Educational Services (100.0%).
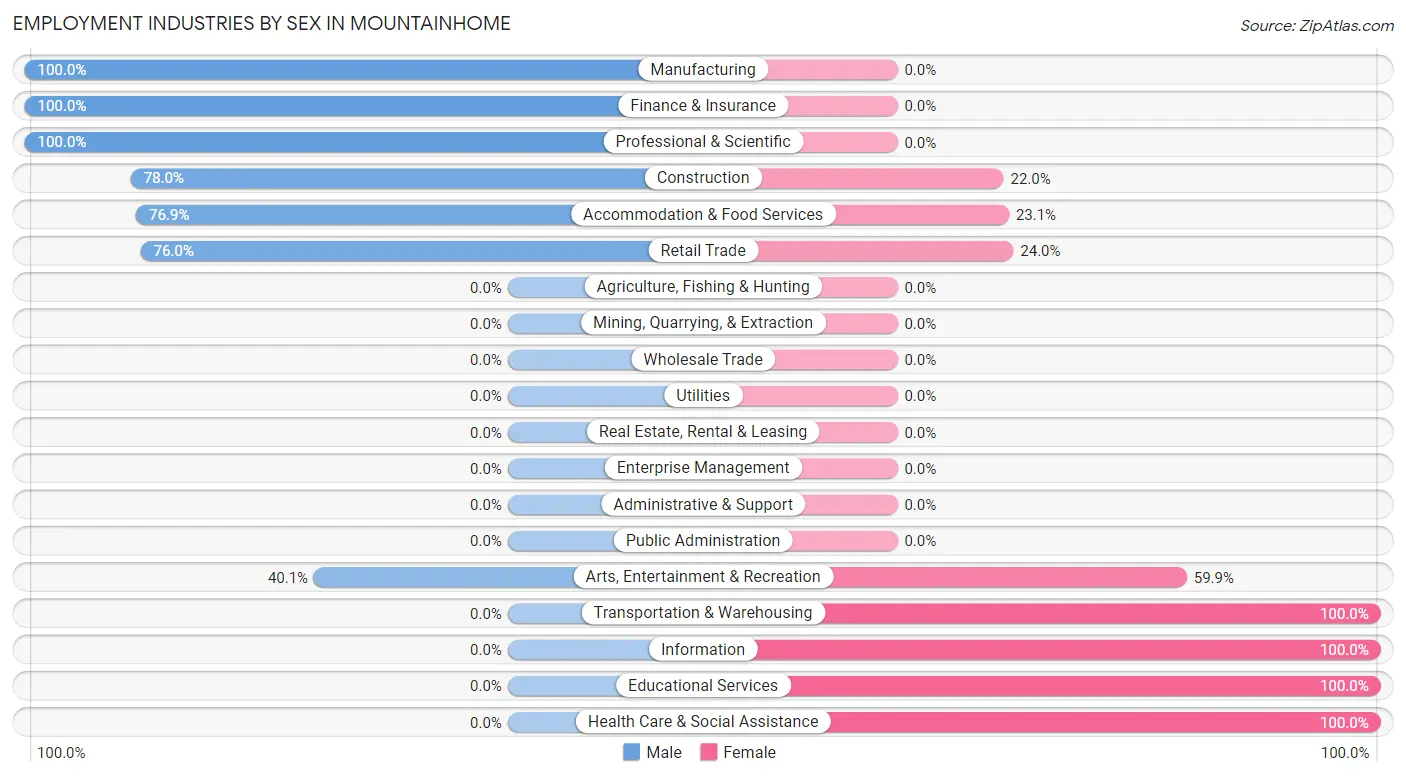
| Industry | Male | Female |
| Agriculture, Fishing & Hunting | 0 (0.0%) | 0 (0.0%) |
| Mining, Quarrying, & Extraction | 0 (0.0%) | 0 (0.0%) |
| Construction | 103 (78.0%) | 29 (22.0%) |
| Manufacturing | 102 (100.0%) | 0 (0.0%) |
| Wholesale Trade | 0 (0.0%) | 0 (0.0%) |
| Retail Trade | 19 (76.0%) | 6 (24.0%) |
| Transportation & Warehousing | 0 (0.0%) | 19 (100.0%) |
| Utilities | 0 (0.0%) | 0 (0.0%) |
| Information | 0 (0.0%) | 28 (100.0%) |
| Finance & Insurance | 32 (100.0%) | 0 (0.0%) |
| Real Estate, Rental & Leasing | 0 (0.0%) | 0 (0.0%) |
| Professional & Scientific | 66 (100.0%) | 0 (0.0%) |
| Enterprise Management | 0 (0.0%) | 0 (0.0%) |
| Administrative & Support | 0 (0.0%) | 0 (0.0%) |
| Educational Services | 0 (0.0%) | 7 (100.0%) |
| Health Care & Social Assistance | 0 (0.0%) | 7 (100.0%) |
| Arts, Entertainment & Recreation | 73 (40.1%) | 109 (59.9%) |
| Accommodation & Food Services | 20 (76.9%) | 6 (23.1%) |
| Public Administration | 0 (0.0%) | 0 (0.0%) |
| Total | 431 (67.1%) | 211 (32.9%) |
Education in Mountainhome
School Enrollment in Mountainhome
The most common levels of schooling among the 243 students in Mountainhome are college / undergraduate (143 | 58.9%), high school (71 | 29.2%), and middle school (29 | 11.9%).
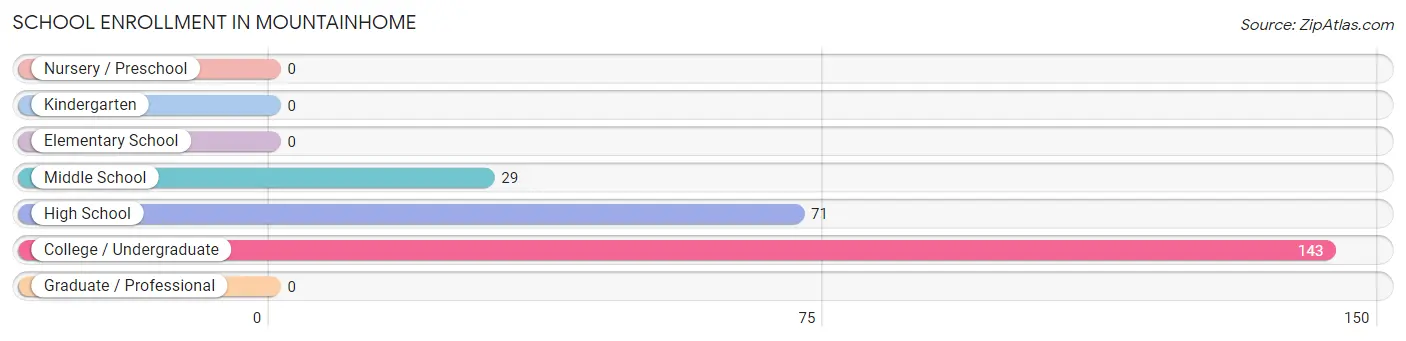
| School Level | # Students | % Students |
| Nursery / Preschool | 0 | 0.0% |
| Kindergarten | 0 | 0.0% |
| Elementary School | 0 | 0.0% |
| Middle School | 29 | 11.9% |
| High School | 71 | 29.2% |
| College / Undergraduate | 143 | 58.9% |
| Graduate / Professional | 0 | 0.0% |
| Total | 243 | 100.0% |
School Enrollment by Age by Funding Source in Mountainhome
Out of a total of 243 students who are enrolled in schools in Mountainhome, 68 (28.0%) attend a private institution, while the remaining 175 (72.0%) are enrolled in public schools. The age group of 15 to 17 year olds has the highest likelihood of being enrolled in private schools, with 27 (100.0% in the age bracket) enrolled. Conversely, the age group of 10 to 14 year olds has the lowest likelihood of being enrolled in a private school, with 29 (100.0% in the age bracket) attending a public institution.
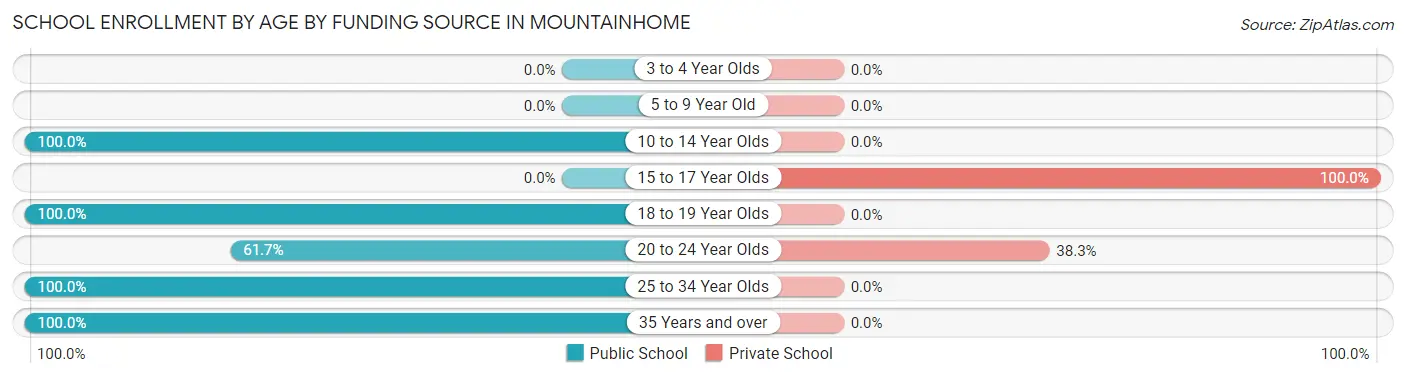
| Age Bracket | Public School | Private School |
| 3 to 4 Year Olds | 0 (0.0%) | 0 (0.0%) |
| 5 to 9 Year Old | 0 (0.0%) | 0 (0.0%) |
| 10 to 14 Year Olds | 29 (100.0%) | 0 (0.0%) |
| 15 to 17 Year Olds | 0 (0.0%) | 27 (100.0%) |
| 18 to 19 Year Olds | 44 (100.0%) | 0 (0.0%) |
| 20 to 24 Year Olds | 66 (61.7%) | 41 (38.3%) |
| 25 to 34 Year Olds | 7 (100.0%) | 0 (0.0%) |
| 35 Years and over | 29 (100.0%) | 0 (0.0%) |
| Total | 175 (72.0%) | 68 (28.0%) |
Educational Attainment by Field of Study in Mountainhome
Computers & mathematics (48 | 26.8%), science & technology (38 | 21.2%), business (32 | 17.9%), literature & languages (28 | 15.6%), and visual & performing arts (19 | 10.6%) are the most common fields of study among 179 individuals in Mountainhome who have obtained a bachelor's degree or higher.
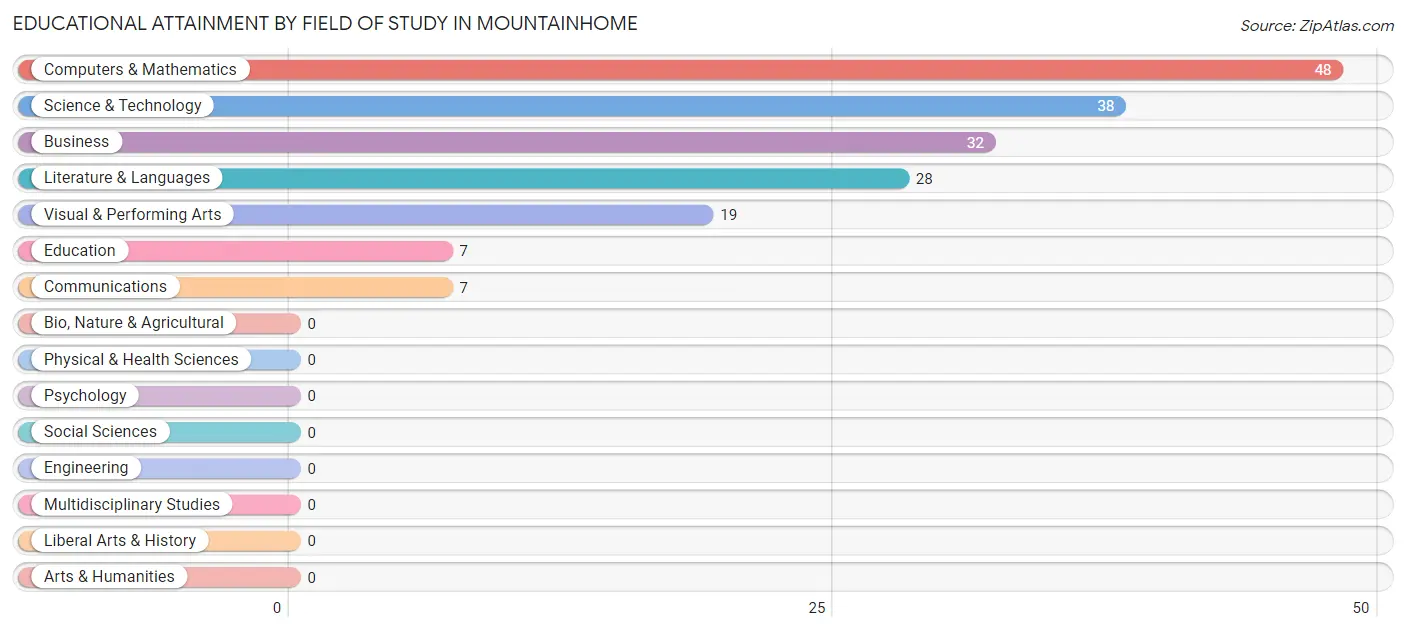
| Field of Study | # Graduates | % Graduates |
| Computers & Mathematics | 48 | 26.8% |
| Bio, Nature & Agricultural | 0 | 0.0% |
| Physical & Health Sciences | 0 | 0.0% |
| Psychology | 0 | 0.0% |
| Social Sciences | 0 | 0.0% |
| Engineering | 0 | 0.0% |
| Multidisciplinary Studies | 0 | 0.0% |
| Science & Technology | 38 | 21.2% |
| Business | 32 | 17.9% |
| Education | 7 | 3.9% |
| Literature & Languages | 28 | 15.6% |
| Liberal Arts & History | 0 | 0.0% |
| Visual & Performing Arts | 19 | 10.6% |
| Communications | 7 | 3.9% |
| Arts & Humanities | 0 | 0.0% |
| Total | 179 | 100.0% |
Transportation & Commute in Mountainhome
Vehicle Availability by Sex in Mountainhome
The most prevalent vehicle ownership categories in Mountainhome are males with 4 vehicles (206, accounting for 47.8%) and females with 4 vehicles (138, making up 97.6%).
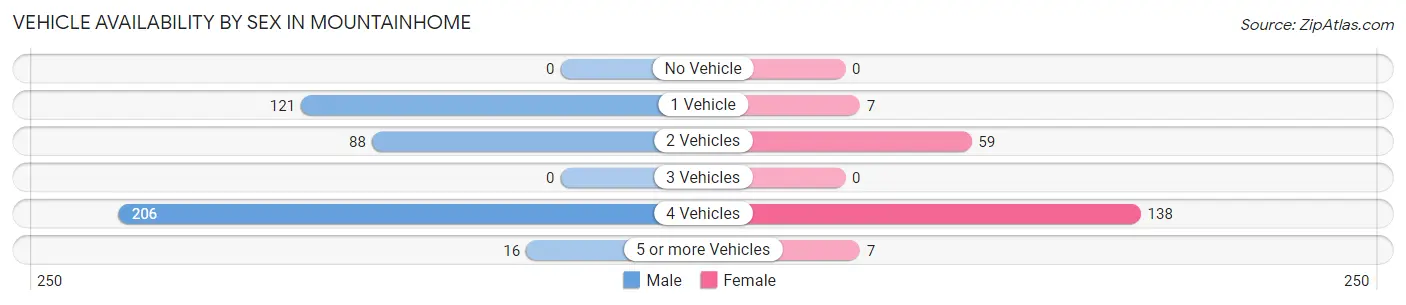
| Vehicles Available | Male | Female |
| No Vehicle | 0 (0.0%) | 0 (0.0%) |
| 1 Vehicle | 121 (28.1%) | 7 (3.3%) |
| 2 Vehicles | 88 (20.4%) | 59 (28.0%) |
| 3 Vehicles | 0 (0.0%) | 0 (0.0%) |
| 4 Vehicles | 206 (47.8%) | 138 (65.4%) |
| 5 or more Vehicles | 16 (3.7%) | 7 (3.3%) |
| Total | 431 (100.0%) | 211 (100.0%) |
Commute Time in Mountainhome
The most frequently occuring commute durations in Mountainhome are 10 to 14 minutes (130 commuters, 22.6%), 90 or more minutes (129 commuters, 22.4%), and 20 to 24 minutes (123 commuters, 21.4%).
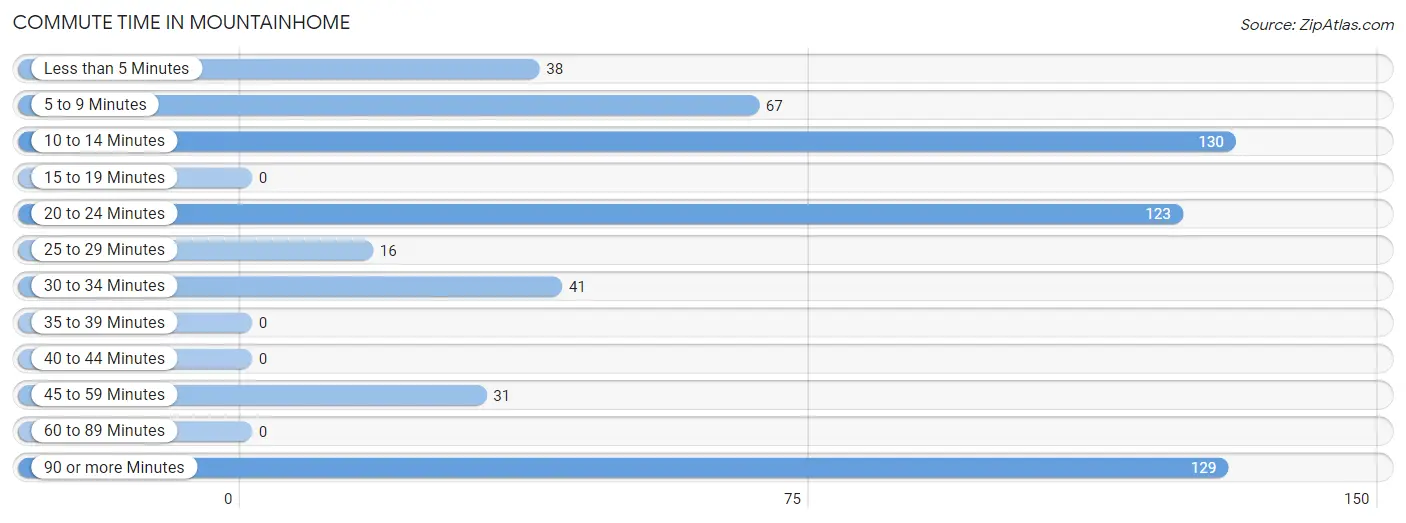
| Commute Time | # Commuters | % Commuters |
| Less than 5 Minutes | 38 | 6.6% |
| 5 to 9 Minutes | 67 | 11.7% |
| 10 to 14 Minutes | 130 | 22.6% |
| 15 to 19 Minutes | 0 | 0.0% |
| 20 to 24 Minutes | 123 | 21.4% |
| 25 to 29 Minutes | 16 | 2.8% |
| 30 to 34 Minutes | 41 | 7.1% |
| 35 to 39 Minutes | 0 | 0.0% |
| 40 to 44 Minutes | 0 | 0.0% |
| 45 to 59 Minutes | 31 | 5.4% |
| 60 to 89 Minutes | 0 | 0.0% |
| 90 or more Minutes | 129 | 22.4% |
Commute Time by Sex in Mountainhome
The most common commute times in Mountainhome are 90 or more minutes (100 commuters, 27.5%) for males and 10 to 14 minutes (68 commuters, 32.2%) for females.
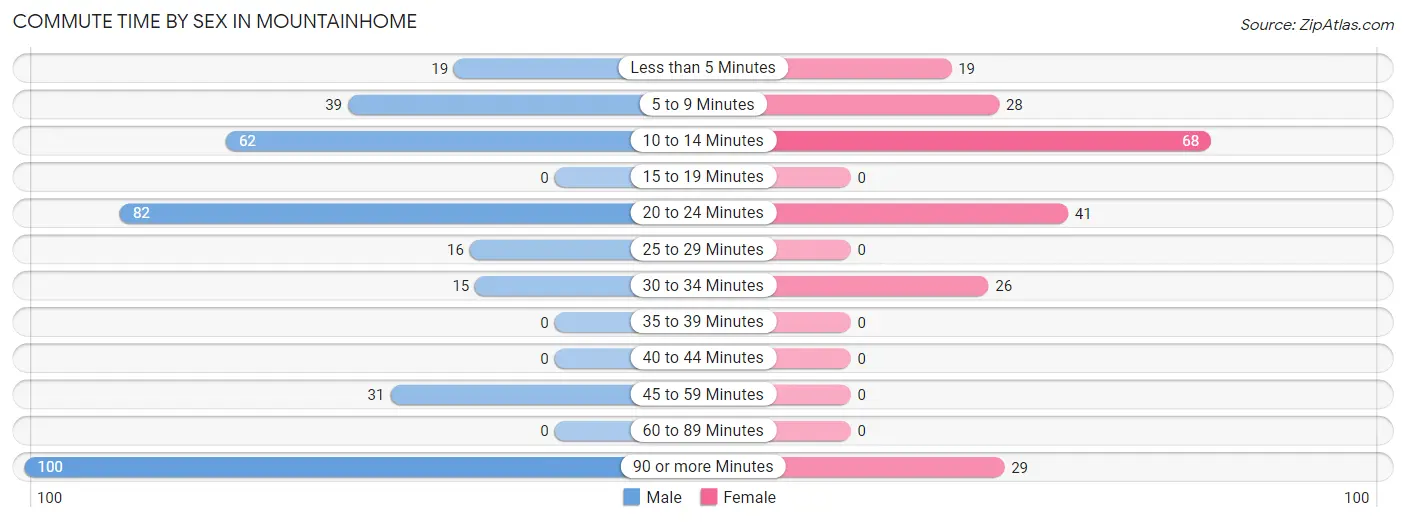
| Commute Time | Male | Female |
| Less than 5 Minutes | 19 (5.2%) | 19 (9.0%) |
| 5 to 9 Minutes | 39 (10.7%) | 28 (13.3%) |
| 10 to 14 Minutes | 62 (17.0%) | 68 (32.2%) |
| 15 to 19 Minutes | 0 (0.0%) | 0 (0.0%) |
| 20 to 24 Minutes | 82 (22.5%) | 41 (19.4%) |
| 25 to 29 Minutes | 16 (4.4%) | 0 (0.0%) |
| 30 to 34 Minutes | 15 (4.1%) | 26 (12.3%) |
| 35 to 39 Minutes | 0 (0.0%) | 0 (0.0%) |
| 40 to 44 Minutes | 0 (0.0%) | 0 (0.0%) |
| 45 to 59 Minutes | 31 (8.5%) | 0 (0.0%) |
| 60 to 89 Minutes | 0 (0.0%) | 0 (0.0%) |
| 90 or more Minutes | 100 (27.5%) | 29 (13.7%) |
Time of Departure to Work by Sex in Mountainhome
The most frequent times of departure to work in Mountainhome are 7:00 AM to 7:29 AM (120, 33.0%) for males and 10:00 AM to 10:59 AM (68, 32.2%) for females.
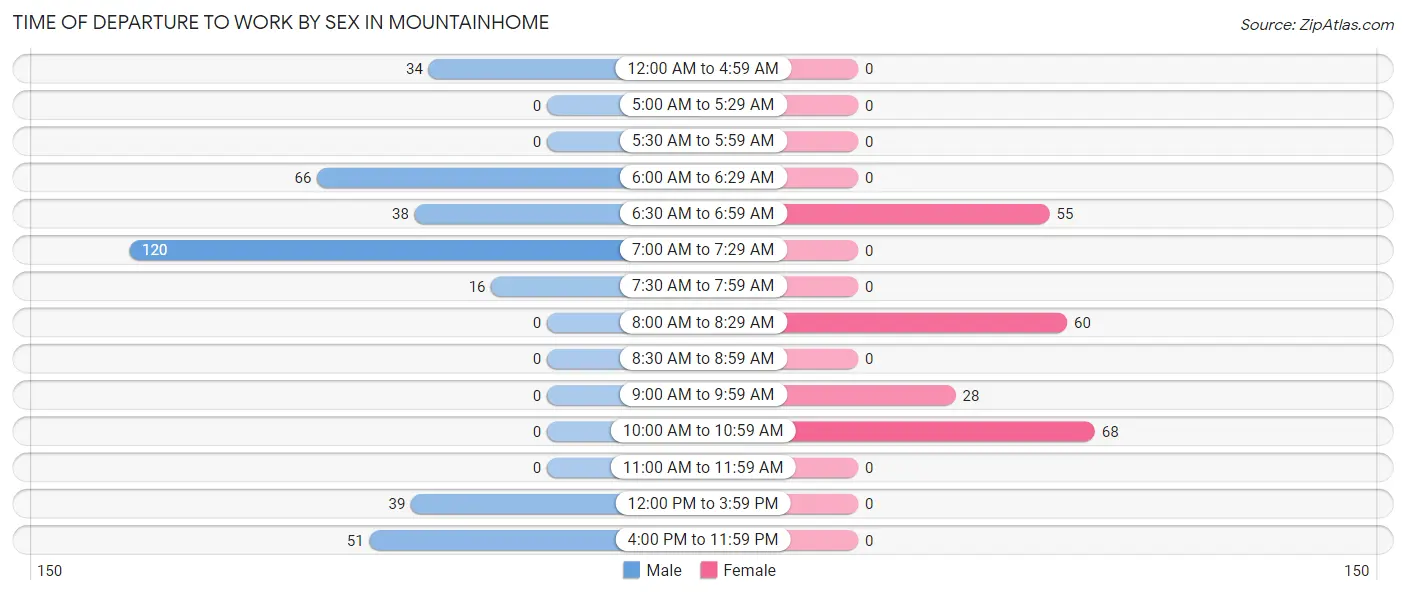
| Time of Departure | Male | Female |
| 12:00 AM to 4:59 AM | 34 (9.3%) | 0 (0.0%) |
| 5:00 AM to 5:29 AM | 0 (0.0%) | 0 (0.0%) |
| 5:30 AM to 5:59 AM | 0 (0.0%) | 0 (0.0%) |
| 6:00 AM to 6:29 AM | 66 (18.1%) | 0 (0.0%) |
| 6:30 AM to 6:59 AM | 38 (10.4%) | 55 (26.1%) |
| 7:00 AM to 7:29 AM | 120 (33.0%) | 0 (0.0%) |
| 7:30 AM to 7:59 AM | 16 (4.4%) | 0 (0.0%) |
| 8:00 AM to 8:29 AM | 0 (0.0%) | 60 (28.4%) |
| 8:30 AM to 8:59 AM | 0 (0.0%) | 0 (0.0%) |
| 9:00 AM to 9:59 AM | 0 (0.0%) | 28 (13.3%) |
| 10:00 AM to 10:59 AM | 0 (0.0%) | 68 (32.2%) |
| 11:00 AM to 11:59 AM | 0 (0.0%) | 0 (0.0%) |
| 12:00 PM to 3:59 PM | 39 (10.7%) | 0 (0.0%) |
| 4:00 PM to 11:59 PM | 51 (14.0%) | 0 (0.0%) |
| Total | 364 (100.0%) | 211 (100.0%) |
Housing Occupancy in Mountainhome
Occupancy by Ownership in Mountainhome
Of the total 368 dwellings in Mountainhome, owner-occupied units account for 301 (81.8%), while renter-occupied units make up 67 (18.2%).
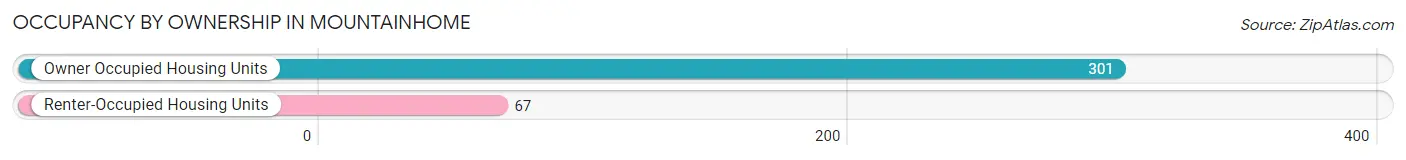
| Occupancy | # Housing Units | % Housing Units |
| Owner Occupied Housing Units | 301 | 81.8% |
| Renter-Occupied Housing Units | 67 | 18.2% |
| Total Occupied Housing Units | 368 | 100.0% |
Occupancy by Household Size in Mountainhome
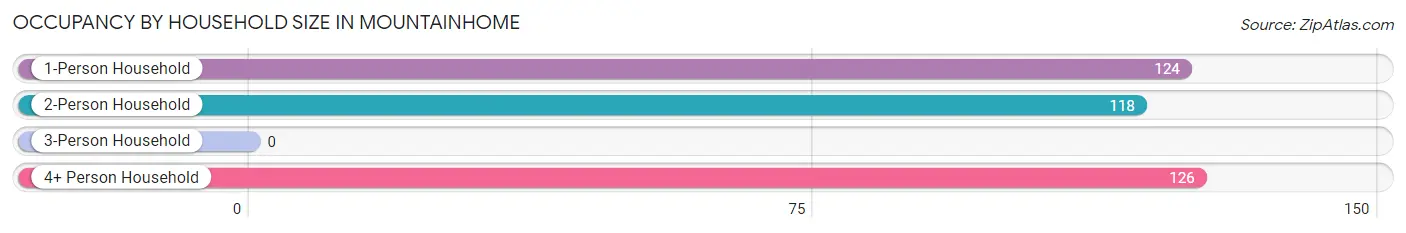
| Household Size | # Housing Units | % Housing Units |
| 1-Person Household | 124 | 33.7% |
| 2-Person Household | 118 | 32.1% |
| 3-Person Household | 0 | 0.0% |
| 4+ Person Household | 126 | 34.2% |
| Total Housing Units | 368 | 100.0% |
Occupancy by Ownership by Household Size in Mountainhome
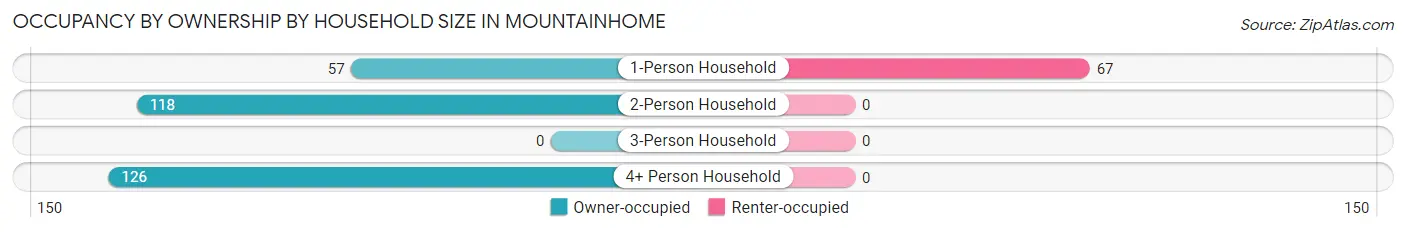
| Household Size | Owner-occupied | Renter-occupied |
| 1-Person Household | 57 (46.0%) | 67 (54.0%) |
| 2-Person Household | 118 (100.0%) | 0 (0.0%) |
| 3-Person Household | 0 (0.0%) | 0 (0.0%) |
| 4+ Person Household | 126 (100.0%) | 0 (0.0%) |
| Total Housing Units | 301 (81.8%) | 67 (18.2%) |
Occupancy by Educational Attainment in Mountainhome
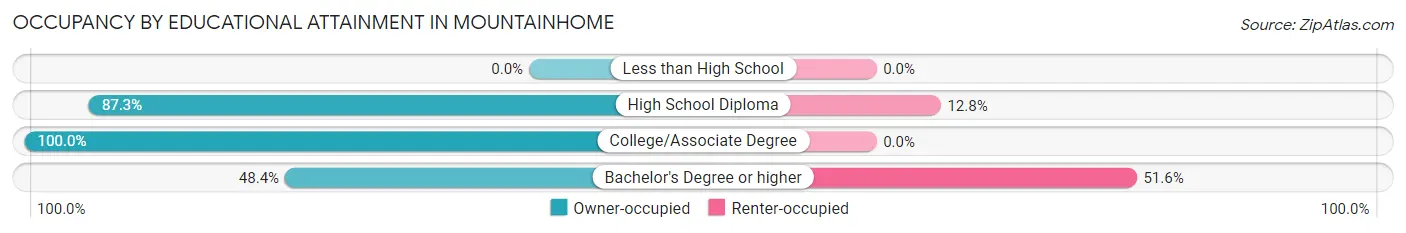
| Household Size | Owner-occupied | Renter-occupied |
| Less than High School | 0 (0.0%) | 0 (0.0%) |
| High School Diploma | 130 (87.3%) | 19 (12.8%) |
| College/Associate Degree | 126 (100.0%) | 0 (0.0%) |
| Bachelor's Degree or higher | 45 (48.4%) | 48 (51.6%) |
Occupancy by Age of Householder in Mountainhome
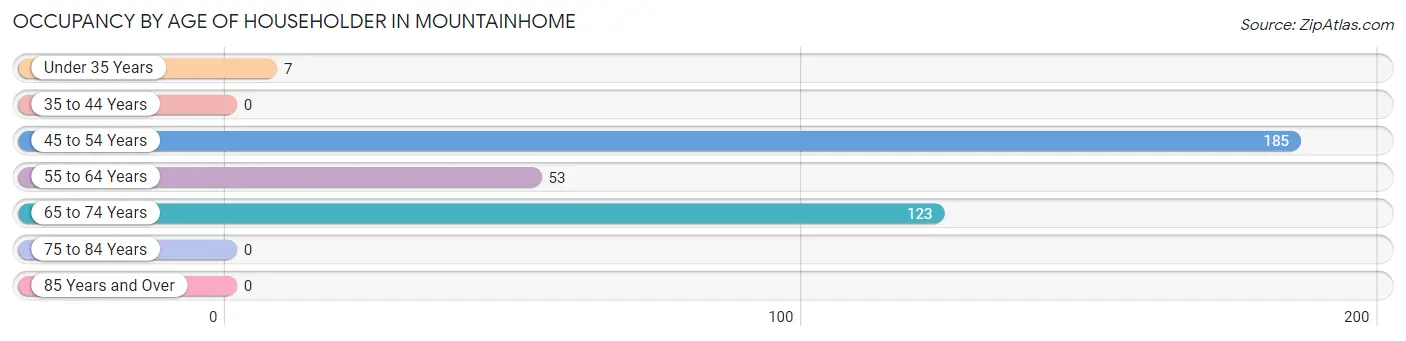
| Age Bracket | # Households | % Households |
| Under 35 Years | 7 | 1.9% |
| 35 to 44 Years | 0 | 0.0% |
| 45 to 54 Years | 185 | 50.3% |
| 55 to 64 Years | 53 | 14.4% |
| 65 to 74 Years | 123 | 33.4% |
| 75 to 84 Years | 0 | 0.0% |
| 85 Years and Over | 0 | 0.0% |
| Total | 368 | 100.0% |
Housing Finances in Mountainhome
Median Income by Occupancy in Mountainhome
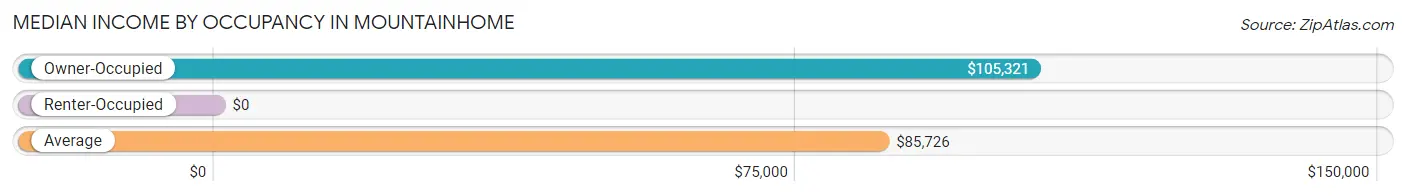
| Occupancy Type | # Households | Median Income |
| Owner-Occupied | 301 (81.8%) | $105,321 |
| Renter-Occupied | 67 (18.2%) | $0 |
| Average | 368 (100.0%) | $85,726 |
Occupancy by Householder Income Bracket in Mountainhome
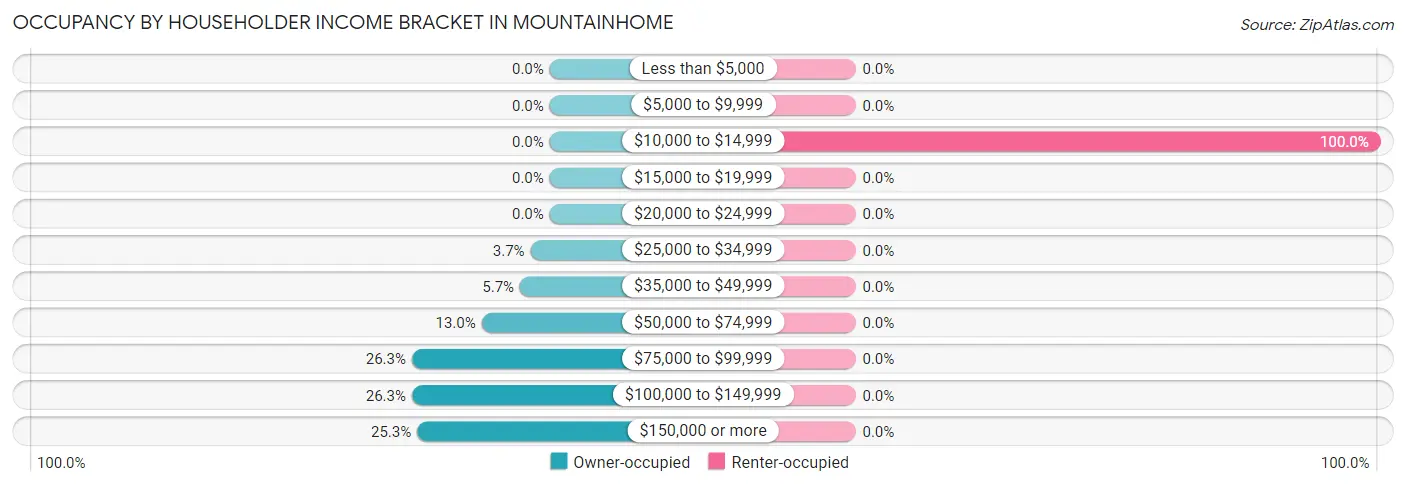
| Income Bracket | Owner-occupied | Renter-occupied |
| Less than $5,000 | 0 (0.0%) | 0 (0.0%) |
| $5,000 to $9,999 | 0 (0.0%) | 0 (0.0%) |
| $10,000 to $14,999 | 0 (0.0%) | 67 (100.0%) |
| $15,000 to $19,999 | 0 (0.0%) | 0 (0.0%) |
| $20,000 to $24,999 | 0 (0.0%) | 0 (0.0%) |
| $25,000 to $34,999 | 11 (3.6%) | 0 (0.0%) |
| $35,000 to $49,999 | 17 (5.7%) | 0 (0.0%) |
| $50,000 to $74,999 | 39 (13.0%) | 0 (0.0%) |
| $75,000 to $99,999 | 79 (26.3%) | 0 (0.0%) |
| $100,000 to $149,999 | 79 (26.3%) | 0 (0.0%) |
| $150,000 or more | 76 (25.3%) | 0 (0.0%) |
| Total | 301 (100.0%) | 67 (100.0%) |
Monthly Housing Cost Tiers in Mountainhome
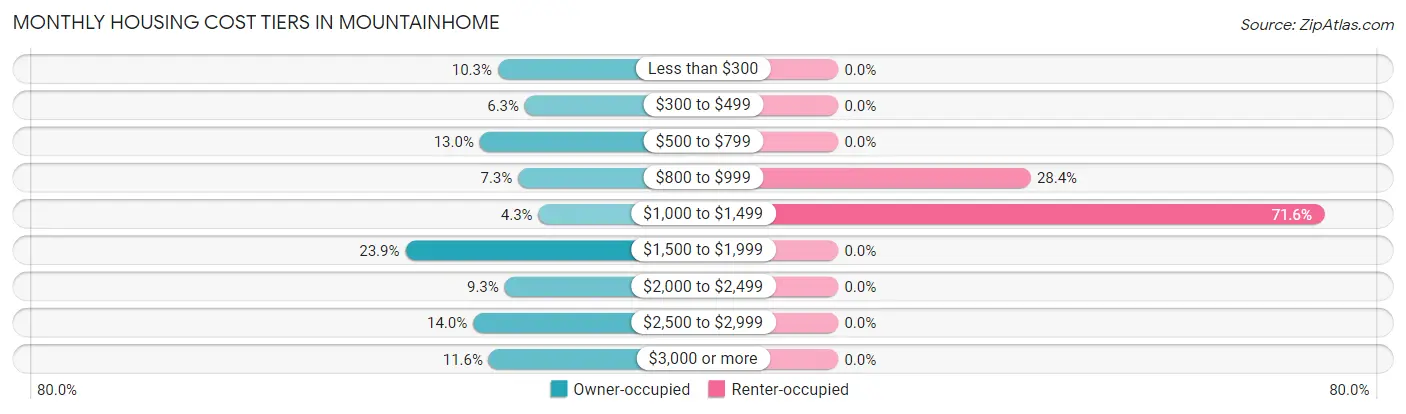
| Monthly Cost | Owner-occupied | Renter-occupied |
| Less than $300 | 31 (10.3%) | 0 (0.0%) |
| $300 to $499 | 19 (6.3%) | 0 (0.0%) |
| $500 to $799 | 39 (13.0%) | 0 (0.0%) |
| $800 to $999 | 22 (7.3%) | 19 (28.4%) |
| $1,000 to $1,499 | 13 (4.3%) | 48 (71.6%) |
| $1,500 to $1,999 | 72 (23.9%) | 0 (0.0%) |
| $2,000 to $2,499 | 28 (9.3%) | 0 (0.0%) |
| $2,500 to $2,999 | 42 (14.0%) | 0 (0.0%) |
| $3,000 or more | 35 (11.6%) | 0 (0.0%) |
| Total | 301 (100.0%) | 67 (100.0%) |
Physical Housing Characteristics in Mountainhome
Housing Structures in Mountainhome
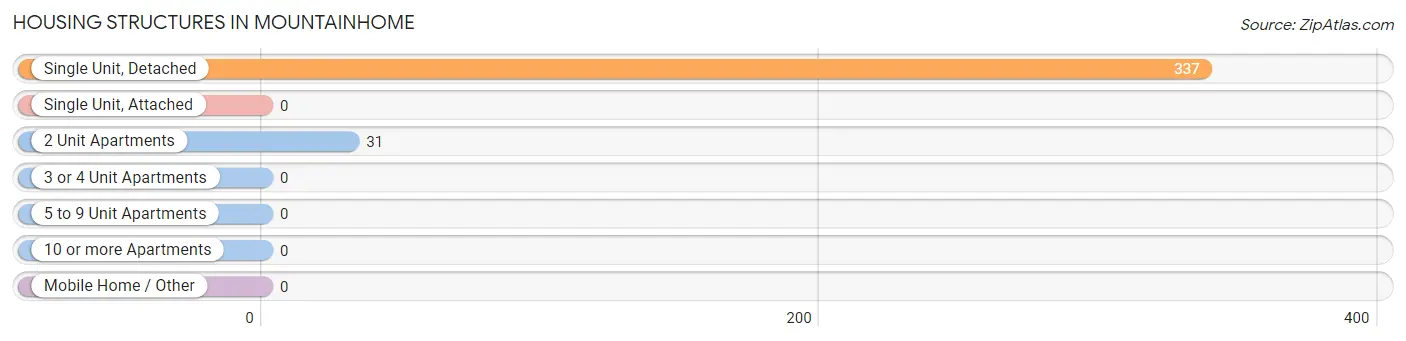
| Structure Type | # Housing Units | % Housing Units |
| Single Unit, Detached | 337 | 91.6% |
| Single Unit, Attached | 0 | 0.0% |
| 2 Unit Apartments | 31 | 8.4% |
| 3 or 4 Unit Apartments | 0 | 0.0% |
| 5 to 9 Unit Apartments | 0 | 0.0% |
| 10 or more Apartments | 0 | 0.0% |
| Mobile Home / Other | 0 | 0.0% |
| Total | 368 | 100.0% |
Housing Structures by Occupancy in Mountainhome
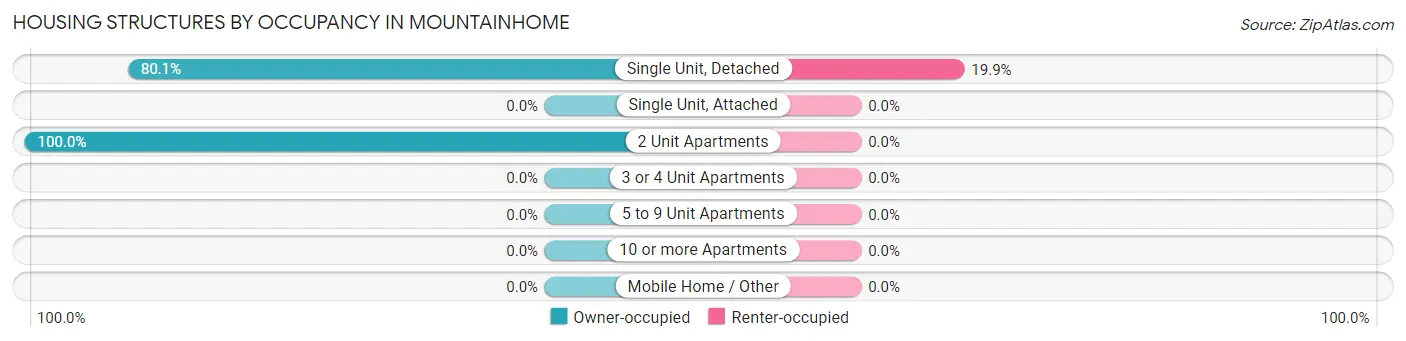
| Structure Type | Owner-occupied | Renter-occupied |
| Single Unit, Detached | 270 (80.1%) | 67 (19.9%) |
| Single Unit, Attached | 0 (0.0%) | 0 (0.0%) |
| 2 Unit Apartments | 31 (100.0%) | 0 (0.0%) |
| 3 or 4 Unit Apartments | 0 (0.0%) | 0 (0.0%) |
| 5 to 9 Unit Apartments | 0 (0.0%) | 0 (0.0%) |
| 10 or more Apartments | 0 (0.0%) | 0 (0.0%) |
| Mobile Home / Other | 0 (0.0%) | 0 (0.0%) |
| Total | 301 (81.8%) | 67 (18.2%) |
Housing Structures by Number of Rooms in Mountainhome
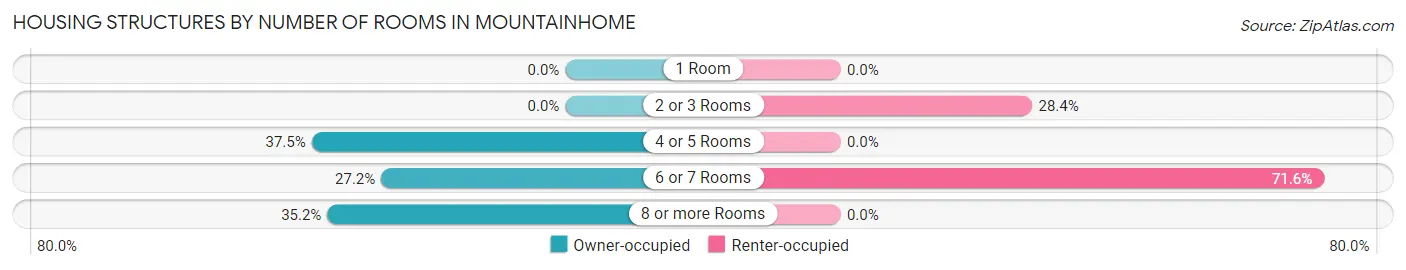
| Number of Rooms | Owner-occupied | Renter-occupied |
| 1 Room | 0 (0.0%) | 0 (0.0%) |
| 2 or 3 Rooms | 0 (0.0%) | 19 (28.4%) |
| 4 or 5 Rooms | 113 (37.5%) | 0 (0.0%) |
| 6 or 7 Rooms | 82 (27.2%) | 48 (71.6%) |
| 8 or more Rooms | 106 (35.2%) | 0 (0.0%) |
| Total | 301 (100.0%) | 67 (100.0%) |
Housing Structure by Heating Type in Mountainhome
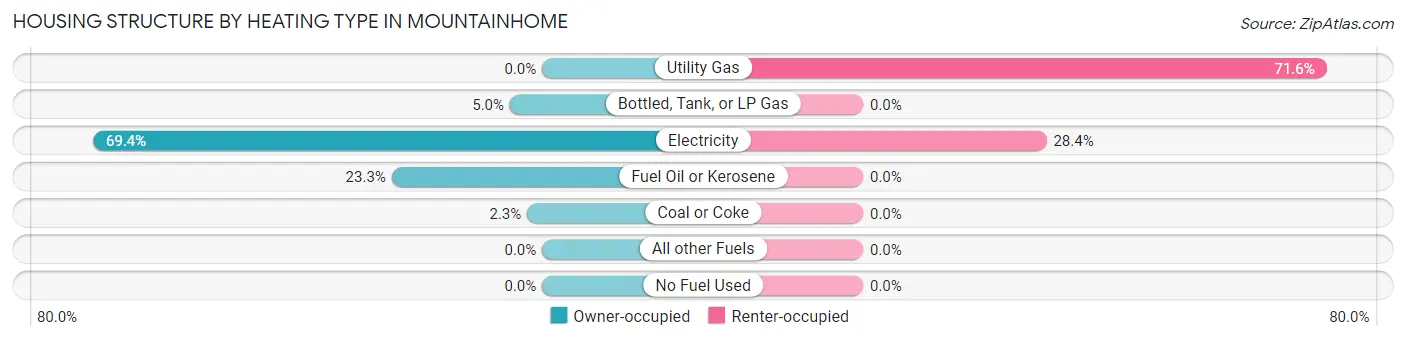
| Heating Type | Owner-occupied | Renter-occupied |
| Utility Gas | 0 (0.0%) | 48 (71.6%) |
| Bottled, Tank, or LP Gas | 15 (5.0%) | 0 (0.0%) |
| Electricity | 209 (69.4%) | 19 (28.4%) |
| Fuel Oil or Kerosene | 70 (23.3%) | 0 (0.0%) |
| Coal or Coke | 7 (2.3%) | 0 (0.0%) |
| All other Fuels | 0 (0.0%) | 0 (0.0%) |
| No Fuel Used | 0 (0.0%) | 0 (0.0%) |
| Total | 301 (100.0%) | 67 (100.0%) |
Household Vehicle Usage in Mountainhome
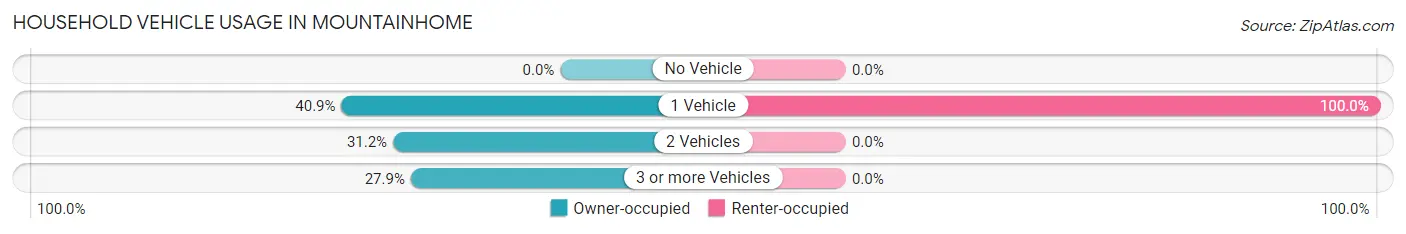
| Vehicles per Household | Owner-occupied | Renter-occupied |
| No Vehicle | 0 (0.0%) | 0 (0.0%) |
| 1 Vehicle | 123 (40.9%) | 67 (100.0%) |
| 2 Vehicles | 94 (31.2%) | 0 (0.0%) |
| 3 or more Vehicles | 84 (27.9%) | 0 (0.0%) |
| Total | 301 (100.0%) | 67 (100.0%) |
Real Estate & Mortgages in Mountainhome
Real Estate and Mortgage Overview in Mountainhome
| Characteristic | Without Mortgage | With Mortgage |
| Housing Units | 65 | 236 |
| Median Property Value | - | - |
| Median Household Income | $84,803 | $76 |
| Monthly Housing Costs | - | - |
| Real Estate Taxes | - | - |
Property Value by Mortgage Status in Mountainhome
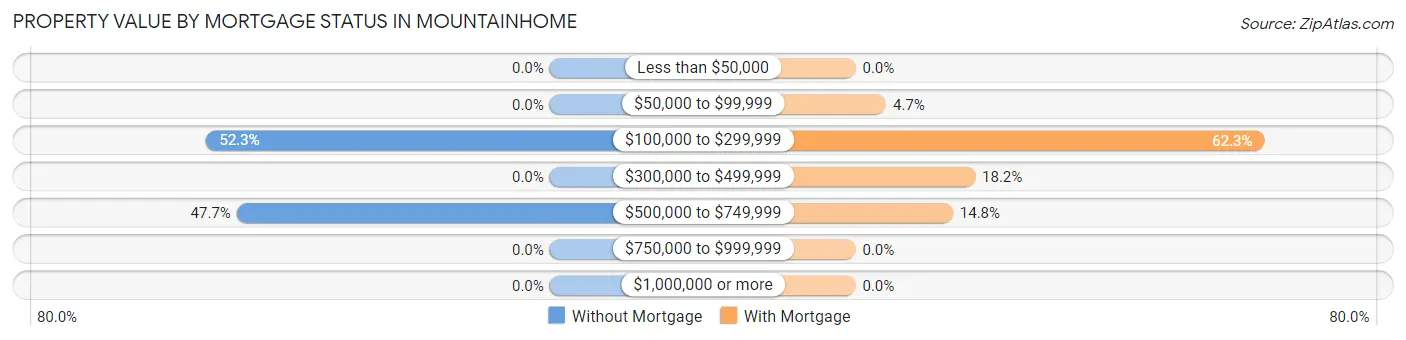
| Property Value | Without Mortgage | With Mortgage |
| Less than $50,000 | 0 (0.0%) | 0 (0.0%) |
| $50,000 to $99,999 | 0 (0.0%) | 11 (4.7%) |
| $100,000 to $299,999 | 34 (52.3%) | 147 (62.3%) |
| $300,000 to $499,999 | 0 (0.0%) | 43 (18.2%) |
| $500,000 to $749,999 | 31 (47.7%) | 35 (14.8%) |
| $750,000 to $999,999 | 0 (0.0%) | 0 (0.0%) |
| $1,000,000 or more | 0 (0.0%) | 0 (0.0%) |
| Total | 65 (100.0%) | 236 (100.0%) |
Household Income by Mortgage Status in Mountainhome
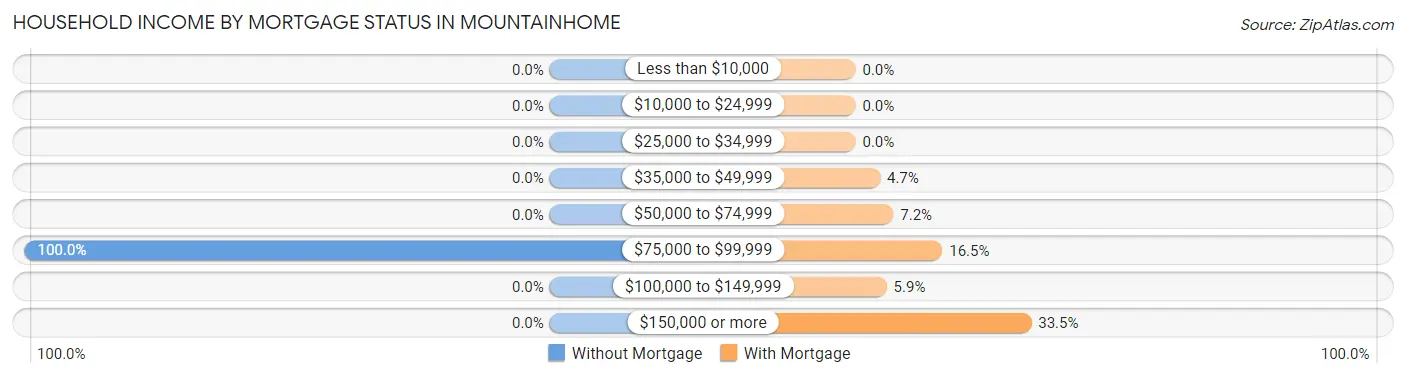
| Household Income | Without Mortgage | With Mortgage |
| Less than $10,000 | 0 (0.0%) | 0 (0.0%) |
| $10,000 to $24,999 | 0 (0.0%) | 0 (0.0%) |
| $25,000 to $34,999 | 0 (0.0%) | 0 (0.0%) |
| $35,000 to $49,999 | 0 (0.0%) | 11 (4.7%) |
| $50,000 to $74,999 | 0 (0.0%) | 17 (7.2%) |
| $75,000 to $99,999 | 65 (100.0%) | 39 (16.5%) |
| $100,000 to $149,999 | 0 (0.0%) | 14 (5.9%) |
| $150,000 or more | 0 (0.0%) | 79 (33.5%) |
| Total | 65 (100.0%) | 236 (100.0%) |
Property Value to Household Income Ratio in Mountainhome
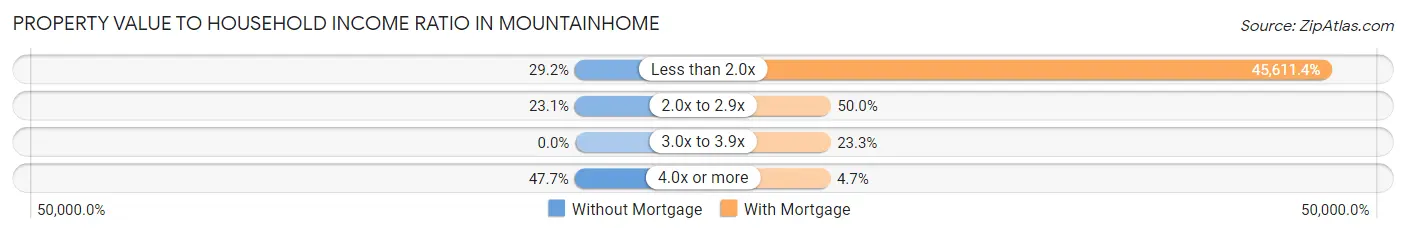
| Value-to-Income Ratio | Without Mortgage | With Mortgage |
| Less than 2.0x | 19 (29.2%) | 107,643 (45,611.4%) |
| 2.0x to 2.9x | 15 (23.1%) | 118 (50.0%) |
| 3.0x to 3.9x | 0 (0.0%) | 55 (23.3%) |
| 4.0x or more | 31 (47.7%) | 11 (4.7%) |
| Total | 65 (100.0%) | 236 (100.0%) |
Real Estate Taxes by Mortgage Status in Mountainhome
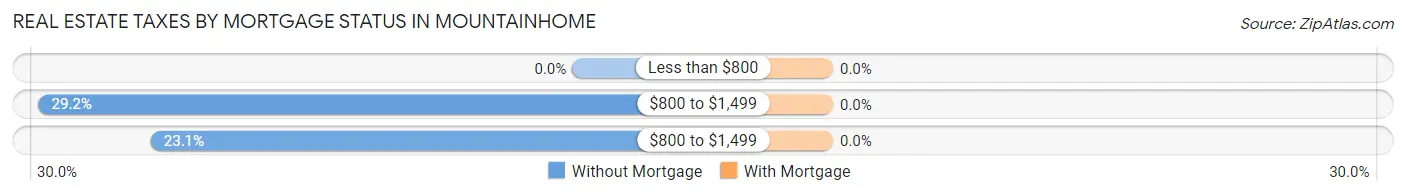
| Property Taxes | Without Mortgage | With Mortgage |
| Less than $800 | 0 (0.0%) | 0 (0.0%) |
| $800 to $1,499 | 19 (29.2%) | 0 (0.0%) |
| $800 to $1,499 | 15 (23.1%) | 0 (0.0%) |
| Total | 65 (100.0%) | 236 (100.0%) |
Health & Disability in Mountainhome
Health Insurance Coverage by Age in Mountainhome
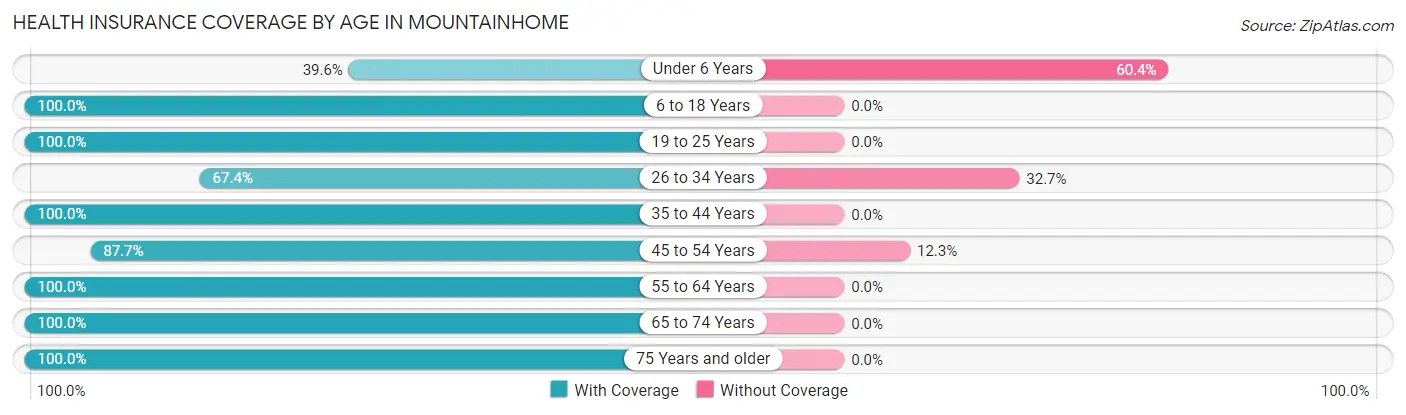
| Age Bracket | With Coverage | Without Coverage |
| Under 6 Years | 36 (39.6%) | 55 (60.4%) |
| 6 to 18 Years | 100 (100.0%) | 0 (0.0%) |
| 19 to 25 Years | 170 (100.0%) | 0 (0.0%) |
| 26 to 34 Years | 33 (67.3%) | 16 (32.7%) |
| 35 to 44 Years | 48 (100.0%) | 0 (0.0%) |
| 45 to 54 Years | 279 (87.7%) | 39 (12.3%) |
| 55 to 64 Years | 53 (100.0%) | 0 (0.0%) |
| 65 to 74 Years | 185 (100.0%) | 0 (0.0%) |
| 75 Years and older | 19 (100.0%) | 0 (0.0%) |
| Total | 923 (89.3%) | 110 (10.6%) |
Health Insurance Coverage by Citizenship Status in Mountainhome
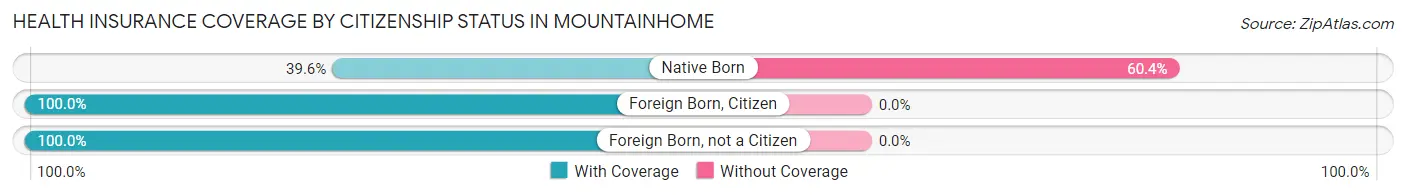
| Citizenship Status | With Coverage | Without Coverage |
| Native Born | 36 (39.6%) | 55 (60.4%) |
| Foreign Born, Citizen | 100 (100.0%) | 0 (0.0%) |
| Foreign Born, not a Citizen | 170 (100.0%) | 0 (0.0%) |
Health Insurance Coverage by Household Income in Mountainhome
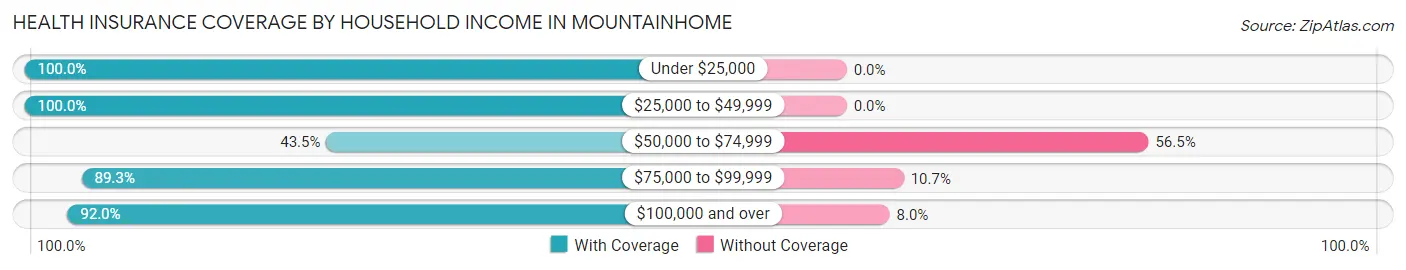
| Household Income | With Coverage | Without Coverage |
| Under $25,000 | 67 (100.0%) | 0 (0.0%) |
| $25,000 to $49,999 | 56 (100.0%) | 0 (0.0%) |
| $50,000 to $74,999 | 30 (43.5%) | 39 (56.5%) |
| $75,000 to $99,999 | 134 (89.3%) | 16 (10.7%) |
| $100,000 and over | 631 (92.0%) | 55 (8.0%) |
Public vs Private Health Insurance Coverage by Age in Mountainhome
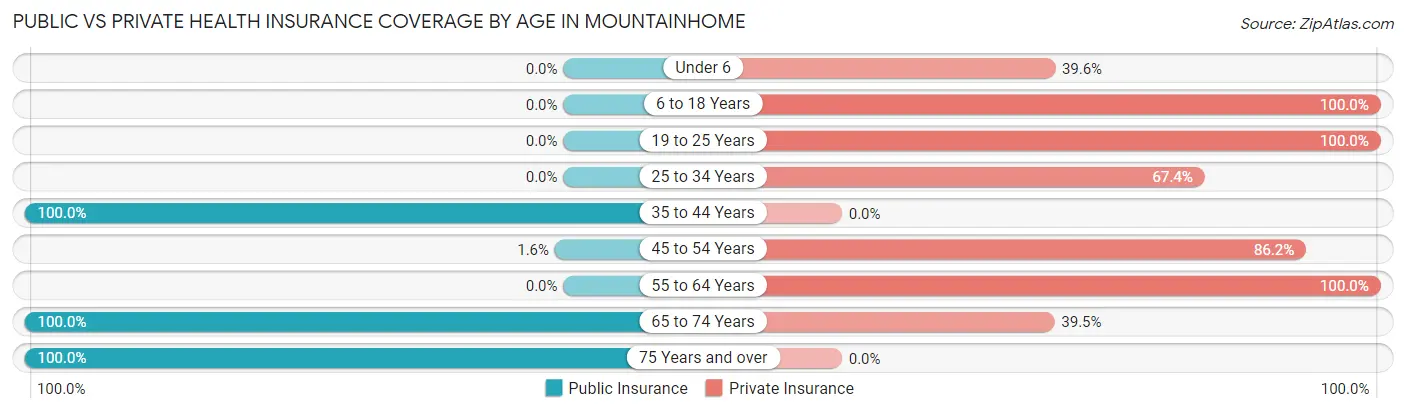
| Age Bracket | Public Insurance | Private Insurance |
| Under 6 | 0 (0.0%) | 36 (39.6%) |
| 6 to 18 Years | 0 (0.0%) | 100 (100.0%) |
| 19 to 25 Years | 0 (0.0%) | 170 (100.0%) |
| 25 to 34 Years | 0 (0.0%) | 33 (67.3%) |
| 35 to 44 Years | 48 (100.0%) | 0 (0.0%) |
| 45 to 54 Years | 5 (1.6%) | 274 (86.2%) |
| 55 to 64 Years | 0 (0.0%) | 53 (100.0%) |
| 65 to 74 Years | 185 (100.0%) | 73 (39.5%) |
| 75 Years and over | 19 (100.0%) | 0 (0.0%) |
| Total | 257 (24.9%) | 739 (71.5%) |
Disability Status by Sex by Age in Mountainhome
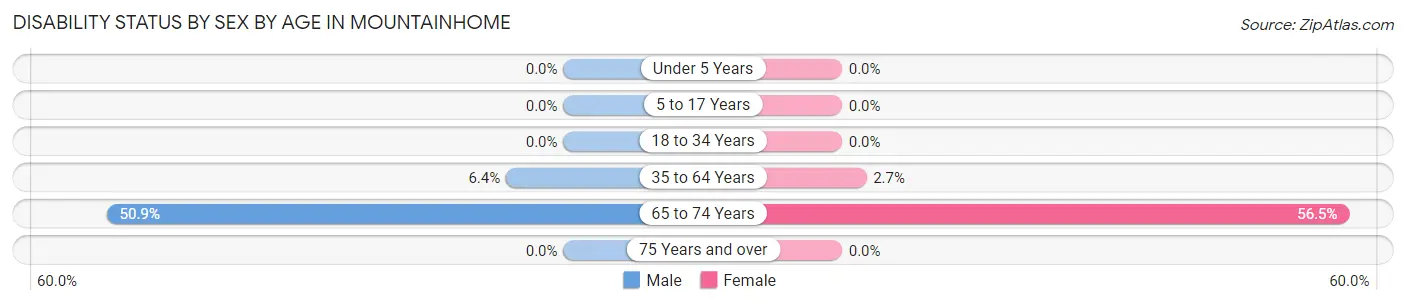
| Age Bracket | Male | Female |
| Under 5 Years | 0 (0.0%) | 0 (0.0%) |
| 5 to 17 Years | 0 (0.0%) | 0 (0.0%) |
| 18 to 34 Years | 0 (0.0%) | 0 (0.0%) |
| 35 to 64 Years | 15 (6.4%) | 5 (2.7%) |
| 65 to 74 Years | 59 (50.9%) | 39 (56.5%) |
| 75 Years and over | 0 (0.0%) | 0 (0.0%) |
Disability Class by Sex by Age in Mountainhome
Disability Class: Hearing Difficulty
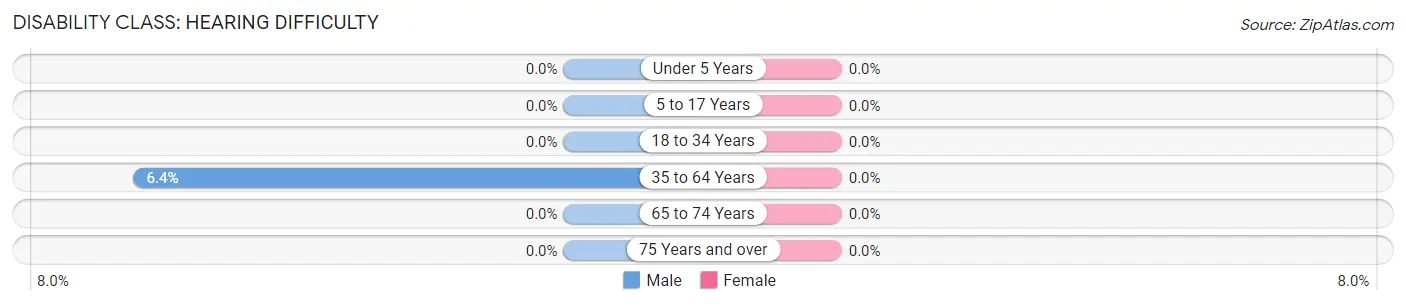
| Age Bracket | Male | Female |
| Under 5 Years | 0 (0.0%) | 0 (0.0%) |
| 5 to 17 Years | 0 (0.0%) | 0 (0.0%) |
| 18 to 34 Years | 0 (0.0%) | 0 (0.0%) |
| 35 to 64 Years | 15 (6.4%) | 0 (0.0%) |
| 65 to 74 Years | 0 (0.0%) | 0 (0.0%) |
| 75 Years and over | 0 (0.0%) | 0 (0.0%) |
Disability Class: Vision Difficulty
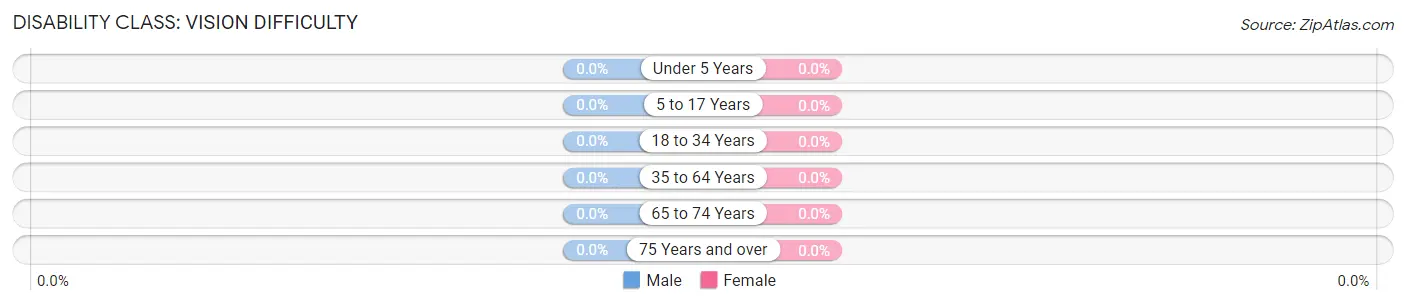
| Age Bracket | Male | Female |
| Under 5 Years | 0 (0.0%) | 0 (0.0%) |
| 5 to 17 Years | 0 (0.0%) | 0 (0.0%) |
| 18 to 34 Years | 0 (0.0%) | 0 (0.0%) |
| 35 to 64 Years | 0 (0.0%) | 0 (0.0%) |
| 65 to 74 Years | 0 (0.0%) | 0 (0.0%) |
| 75 Years and over | 0 (0.0%) | 0 (0.0%) |
Disability Class: Cognitive Difficulty
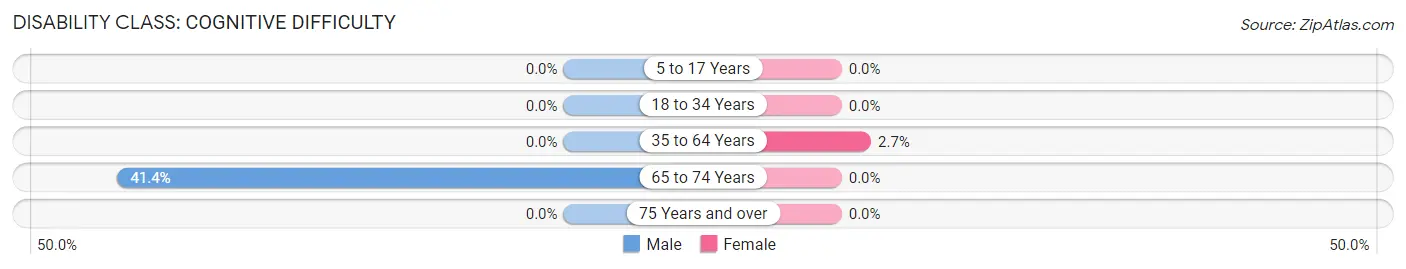
| Age Bracket | Male | Female |
| 5 to 17 Years | 0 (0.0%) | 0 (0.0%) |
| 18 to 34 Years | 0 (0.0%) | 0 (0.0%) |
| 35 to 64 Years | 0 (0.0%) | 5 (2.7%) |
| 65 to 74 Years | 48 (41.4%) | 0 (0.0%) |
| 75 Years and over | 0 (0.0%) | 0 (0.0%) |
Disability Class: Ambulatory Difficulty
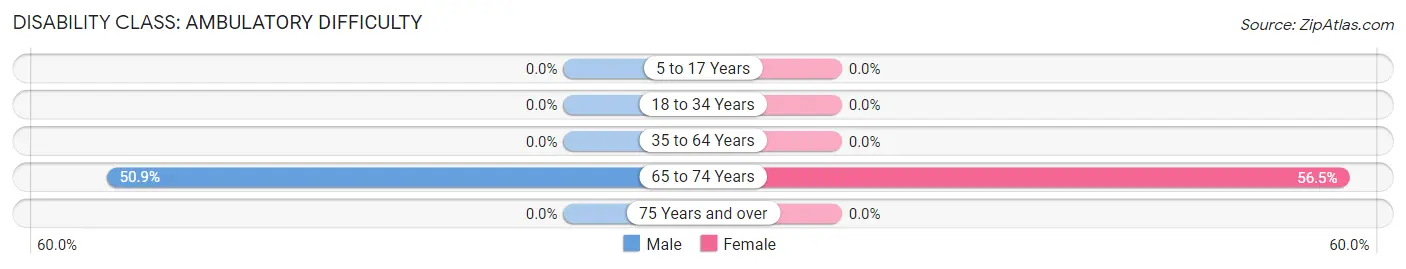
| Age Bracket | Male | Female |
| 5 to 17 Years | 0 (0.0%) | 0 (0.0%) |
| 18 to 34 Years | 0 (0.0%) | 0 (0.0%) |
| 35 to 64 Years | 0 (0.0%) | 0 (0.0%) |
| 65 to 74 Years | 59 (50.9%) | 39 (56.5%) |
| 75 Years and over | 0 (0.0%) | 0 (0.0%) |
Disability Class: Self-Care Difficulty
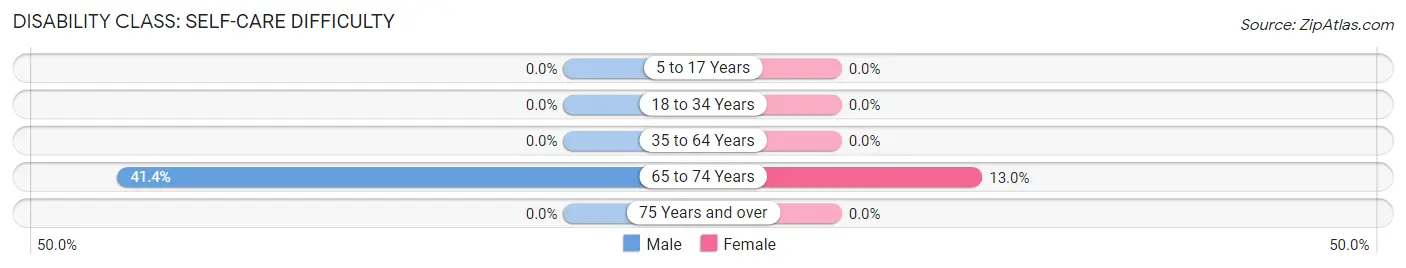
| Age Bracket | Male | Female |
| 5 to 17 Years | 0 (0.0%) | 0 (0.0%) |
| 18 to 34 Years | 0 (0.0%) | 0 (0.0%) |
| 35 to 64 Years | 0 (0.0%) | 0 (0.0%) |
| 65 to 74 Years | 48 (41.4%) | 9 (13.0%) |
| 75 Years and over | 0 (0.0%) | 0 (0.0%) |
Technology Access in Mountainhome
Computing Device Access in Mountainhome
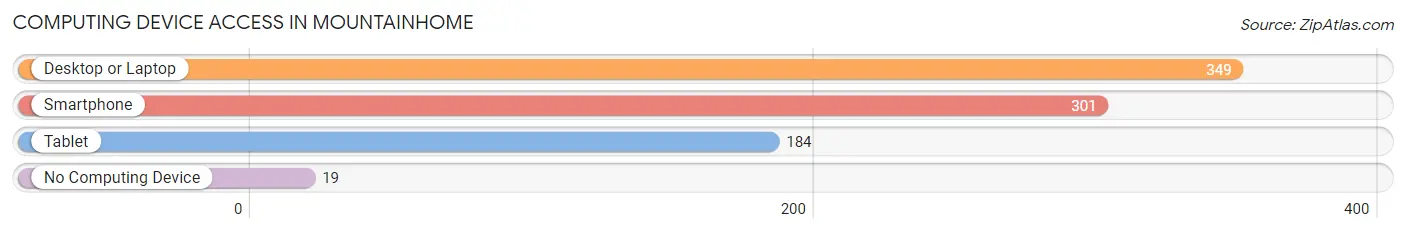
| Device Type | # Households | % Households |
| Desktop or Laptop | 349 | 94.8% |
| Smartphone | 301 | 81.8% |
| Tablet | 184 | 50.0% |
| No Computing Device | 19 | 5.2% |
| Total | 368 | 100.0% |
Internet Access in Mountainhome
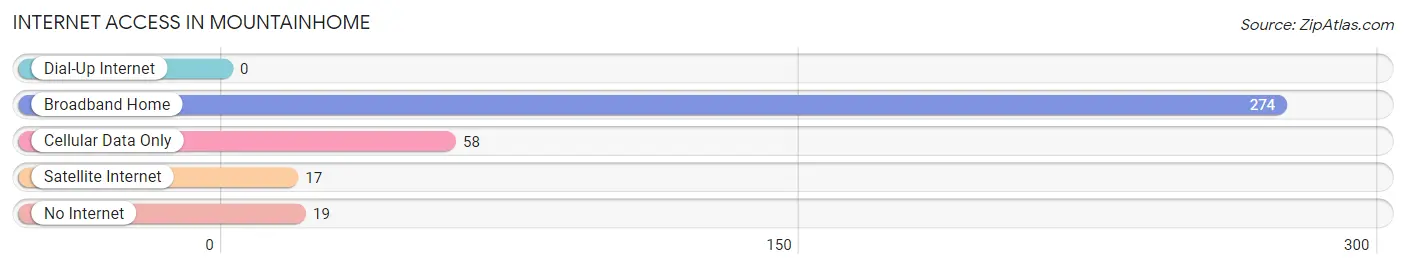
| Internet Type | # Households | % Households |
| Dial-Up Internet | 0 | 0.0% |
| Broadband Home | 274 | 74.5% |
| Cellular Data Only | 58 | 15.8% |
| Satellite Internet | 17 | 4.6% |
| No Internet | 19 | 5.2% |
| Total | 368 | 100.0% |
Mountainhome Summary
Mountainhome is a small unincorporated community located in the Pocono Mountains of northeastern Pennsylvania. It is situated in the northern part of Monroe County, approximately 10 miles from the county seat of Stroudsburg. The community is located in a rural area, surrounded by forests and mountains, and is home to a population of approximately 1,000 people.
History
Mountainhome was first settled in the late 1700s by German immigrants who were attracted to the area by its natural beauty and abundant resources. The community was originally known as “Mountain Home” and was later changed to “Mountainhome”. The first post office was established in 1845 and the first school was built in 1848.
The community grew slowly over the years, but it was not until the 1950s that it began to experience significant growth. This was due to the development of the nearby ski resorts, which brought an influx of tourists to the area. The population of Mountainhome has remained relatively stable since then, with a slight increase in recent years.
Geography
Mountainhome is located in the Pocono Mountains of northeastern Pennsylvania. It is situated in the northern part of Monroe County, approximately 10 miles from the county seat of Stroudsburg. The community is surrounded by forests and mountains, and is home to a population of approximately 1,000 people.
The area is known for its natural beauty, with numerous lakes, rivers, and streams, as well as a variety of wildlife. The nearby Delaware Water Gap National Recreation Area is a popular destination for outdoor activities such as hiking, camping, fishing, and boating.
Economy
Mountainhome’s economy is largely based on tourism, with the nearby ski resorts and other attractions drawing visitors from all over the region. The community also has a number of small businesses, including restaurants, shops, and lodging.
The area is also home to a number of farms, which produce a variety of crops, including corn, soybeans, and hay. The nearby Delaware Water Gap National Recreation Area is a popular destination for outdoor activities such as hiking, camping, fishing, and boating.
Demographics
As of the 2010 census, the population of Mountainhome was 1,000. The racial makeup of the community was 97.2% White, 0.7% African American, 0.2% Native American, 0.2% Asian, 0.2% from other races, and 1.7% from two or more races. Hispanic or Latino of any race were 1.2% of the population.
The median household income in Mountainhome was $45,000, and the median family income was $50,000. The per capita income was $20,000. About 10.2% of families and 12.2% of the population were below the poverty line, including 16.7% of those under age 18 and 8.3% of those age 65 or over.
Mountainhome is a small, rural community with a population of approximately 1,000 people. The area is known for its natural beauty and is a popular destination for outdoor activities. The economy is largely based on tourism, with the nearby ski resorts and other attractions drawing visitors from all over the region. The community also has a number of small businesses, including restaurants, shops, and lodging. The population is predominantly White, with a small percentage of African American, Native American, and Asian residents. The median household income is $45,000 and the median family income is $50,000.
Common Questions
What is Per Capita Income in Mountainhome?
Per Capita income in Mountainhome is $38,052.
What is the Median Household income in Mountainhome?
Median Household Income in Mountainhome is $85,726.
What is Income or Wage Gap in Mountainhome?
Income or Wage Gap in Mountainhome is 18.7%.
Women in Mountainhome earn 81.3 cents for every dollar earned by a man.
What is Inequality or Gini Index in Mountainhome?
Inequality or Gini Index in Mountainhome is 0.39.
What is the Total Population of Mountainhome?
Total Population of Mountainhome is 1,033.
What is the Total Male Population of Mountainhome?
Total Male Population of Mountainhome is 608.
What is the Total Female Population of Mountainhome?
Total Female Population of Mountainhome is 425.
What is the Ratio of Males per 100 Females in Mountainhome?
There are 143.06 Males per 100 Females in Mountainhome.
What is the Ratio of Females per 100 Males in Mountainhome?
There are 69.90 Females per 100 Males in Mountainhome.
What is the Median Population Age in Mountainhome?
Median Population Age in Mountainhome is 45.6 Years.
What is the Average Family Size in Mountainhome
Average Family Size in Mountainhome is 3.9 People.
What is the Average Household Size in Mountainhome
Average Household Size in Mountainhome is 2.8 People.
How Large is the Labor Force in Mountainhome?
There are 642 People in the Labor Forcein in Mountainhome.
What is the Percentage of People in the Labor Force in Mountainhome?
72.5% of People are in the Labor Force in Mountainhome.