Glen Rock borough, PA Map & Demographics
Glen Rock borough Overview
$31,470
PER CAPITA INCOME
$83,000
AVG FAMILY INCOME
$62,750
AVG HOUSEHOLD INCOME
38.1%
WAGE / INCOME GAP [ % ]
61.9¢/ $1
WAGE / INCOME GAP [ $ ]
0.43
INEQUALITY / GINI INDEX
2,364
TOTAL POPULATION
934
MALE POPULATION
1,430
FEMALE POPULATION
65.31
MALES / 100 FEMALES
153.10
FEMALES / 100 MALES
32.5
MEDIAN AGE
3.1
AVG FAMILY SIZE
2.7
AVG HOUSEHOLD SIZE
1,268
LABOR FORCE [ PEOPLE ]
75.2%
PERCENT IN LABOR FORCE
11.1%
UNEMPLOYMENT RATE
Income in Glen Rock borough
Income Overview in Glen Rock borough
Per Capita Income in Glen Rock borough is $31,470, while median incomes of families and households are $83,000 and $62,750 respectively.
| Characteristic | Number | Measure |
| Per Capita Income | 2,364 | $31,470 |
| Median Family Income | 668 | $83,000 |
| Mean Family Income | 668 | $95,376 |
| Median Household Income | 867 | $62,750 |
| Mean Household Income | 867 | $85,244 |
| Income Deficit | 668 | $0 |
| Wage / Income Gap (%) | 2,364 | 38.14% |
| Wage / Income Gap ($) | 2,364 | 61.86¢ per $1 |
| Gini / Inequality Index | 2,364 | 0.43 |
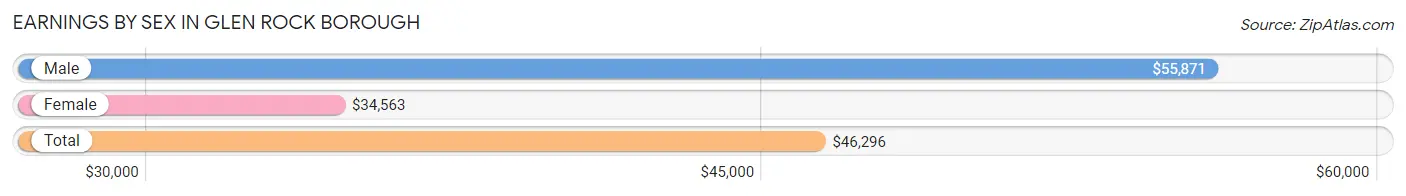
Earnings by Sex in Glen Rock borough
Average Earnings in Glen Rock borough are $46,296, $55,871 for men and $34,563 for women, a difference of 38.1%.
| Sex | Number | Average Earnings |
| Male | 511 (42.3%) | $55,871 |
| Female | 696 (57.7%) | $34,563 |
| Total | 1,207 (100.0%) | $46,296 |
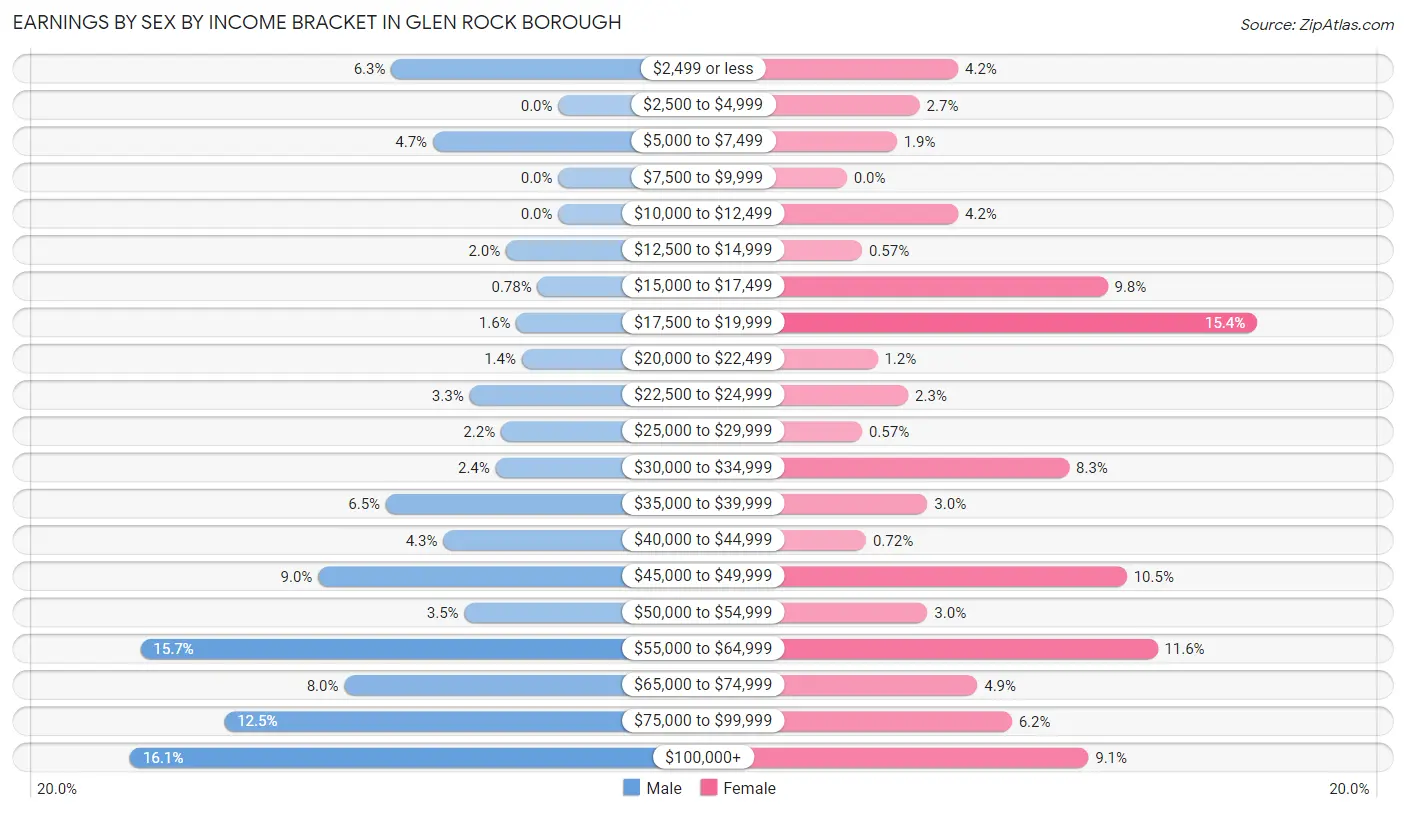
Earnings by Sex by Income Bracket in Glen Rock borough
The most common earnings brackets in Glen Rock borough are $100,000+ for men (82 | 16.1%) and $17,500 to $19,999 for women (107 | 15.4%).
| Income | Male | Female |
| $2,499 or less | 32 (6.3%) | 29 (4.2%) |
| $2,500 to $4,999 | 0 (0.0%) | 19 (2.7%) |
| $5,000 to $7,499 | 24 (4.7%) | 13 (1.9%) |
| $7,500 to $9,999 | 0 (0.0%) | 0 (0.0%) |
| $10,000 to $12,499 | 0 (0.0%) | 29 (4.2%) |
| $12,500 to $14,999 | 10 (2.0%) | 4 (0.6%) |
| $15,000 to $17,499 | 4 (0.8%) | 68 (9.8%) |
| $17,500 to $19,999 | 8 (1.6%) | 107 (15.4%) |
| $20,000 to $22,499 | 7 (1.4%) | 8 (1.1%) |
| $22,500 to $24,999 | 17 (3.3%) | 16 (2.3%) |
| $25,000 to $29,999 | 11 (2.1%) | 4 (0.6%) |
| $30,000 to $34,999 | 12 (2.4%) | 58 (8.3%) |
| $35,000 to $39,999 | 33 (6.5%) | 21 (3.0%) |
| $40,000 to $44,999 | 22 (4.3%) | 5 (0.7%) |
| $45,000 to $49,999 | 46 (9.0%) | 73 (10.5%) |
| $50,000 to $54,999 | 18 (3.5%) | 21 (3.0%) |
| $55,000 to $64,999 | 80 (15.7%) | 81 (11.6%) |
| $65,000 to $74,999 | 41 (8.0%) | 34 (4.9%) |
| $75,000 to $99,999 | 64 (12.5%) | 43 (6.2%) |
| $100,000+ | 82 (16.1%) | 63 (9.0%) |
| Total | 511 (100.0%) | 696 (100.0%) |
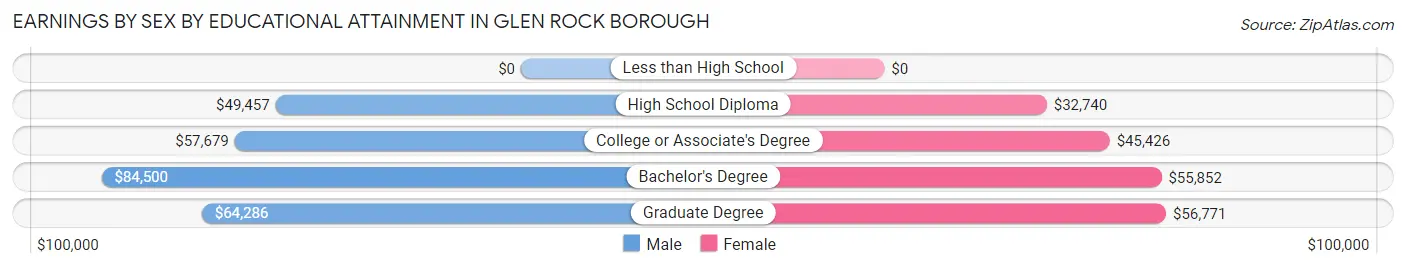
Earnings by Sex by Educational Attainment in Glen Rock borough
Average earnings in Glen Rock borough are $57,708 for men and $46,052 for women, a difference of 20.2%. Men with an educational attainment of bachelor's degree enjoy the highest average annual earnings of $84,500, while those with high school diploma education earn the least with $49,457. Women with an educational attainment of graduate degree earn the most with the average annual earnings of $56,771, while those with high school diploma education have the smallest earnings of $32,740.
| Educational Attainment | Male Income | Female Income |
| Less than High School | - | - |
| High School Diploma | $49,457 | $32,740 |
| College or Associate's Degree | $57,679 | $45,426 |
| Bachelor's Degree | $84,500 | $55,852 |
| Graduate Degree | $64,286 | $56,771 |
| Total | $57,708 | $46,052 |
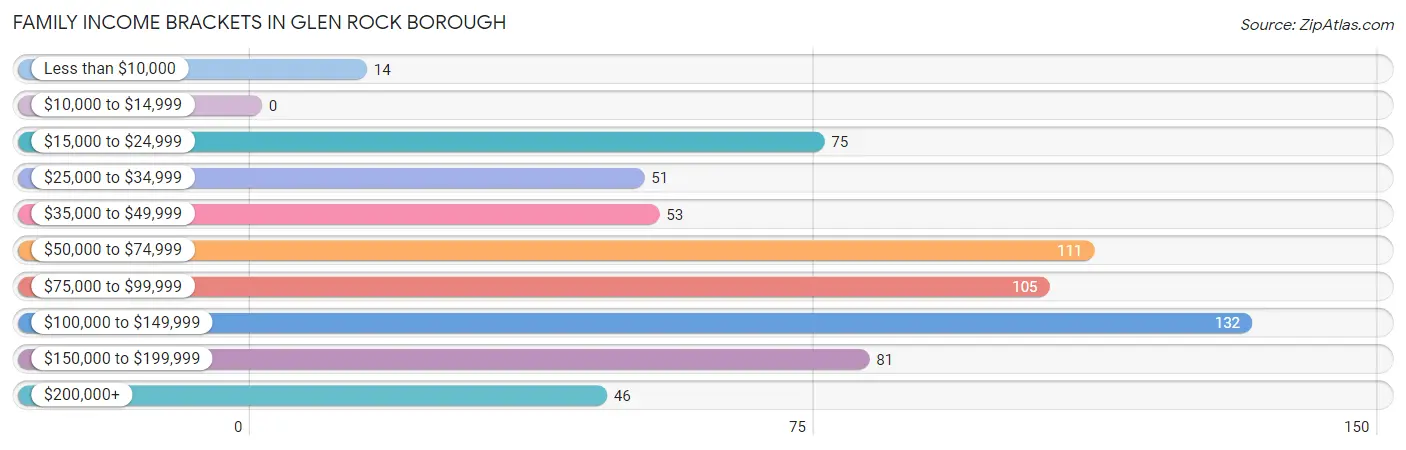
Family Income in Glen Rock borough
Family Income Brackets in Glen Rock borough
According to the Glen Rock borough family income data, there are 132 families falling into the $100,000 to $149,999 income range, which is the most common income bracket and makes up 19.8% of all families.
| Income Bracket | # Families | % Families |
| Less than $10,000 | 14 | 2.1% |
| $10,000 to $14,999 | 0 | 0.0% |
| $15,000 to $24,999 | 75 | 11.2% |
| $25,000 to $34,999 | 51 | 7.6% |
| $35,000 to $49,999 | 53 | 7.9% |
| $50,000 to $74,999 | 111 | 16.6% |
| $75,000 to $99,999 | 105 | 15.7% |
| $100,000 to $149,999 | 132 | 19.8% |
| $150,000 to $199,999 | 81 | 12.1% |
| $200,000+ | 46 | 6.9% |
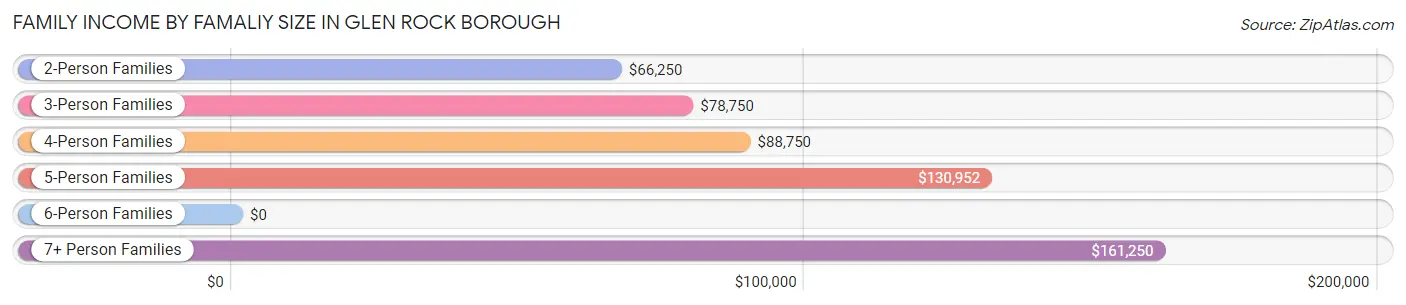
Family Income by Famaliy Size in Glen Rock borough
7+ person families (28 | 4.2%) account for the highest median family income in Glen Rock borough with $161,250 per family, while 2-person families (334 | 50.0%) have the highest median income of $33,125 per family member.
| Income Bracket | # Families | Median Income |
| 2-Person Families | 334 (50.0%) | $66,250 |
| 3-Person Families | 146 (21.9%) | $78,750 |
| 4-Person Families | 117 (17.5%) | $88,750 |
| 5-Person Families | 36 (5.4%) | $130,952 |
| 6-Person Families | 7 (1.1%) | $0 |
| 7+ Person Families | 28 (4.2%) | $161,250 |
| Total | 668 (100.0%) | $83,000 |
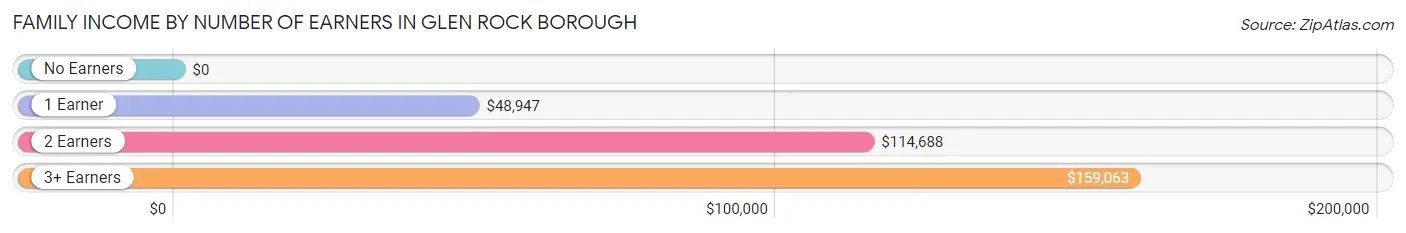
Family Income by Number of Earners in Glen Rock borough
| Number of Earners | # Families | Median Income |
| No Earners | 62 (9.3%) | $0 |
| 1 Earner | 296 (44.3%) | $48,947 |
| 2 Earners | 253 (37.9%) | $114,688 |
| 3+ Earners | 57 (8.5%) | $159,063 |
| Total | 668 (100.0%) | $83,000 |
Household Income in Glen Rock borough
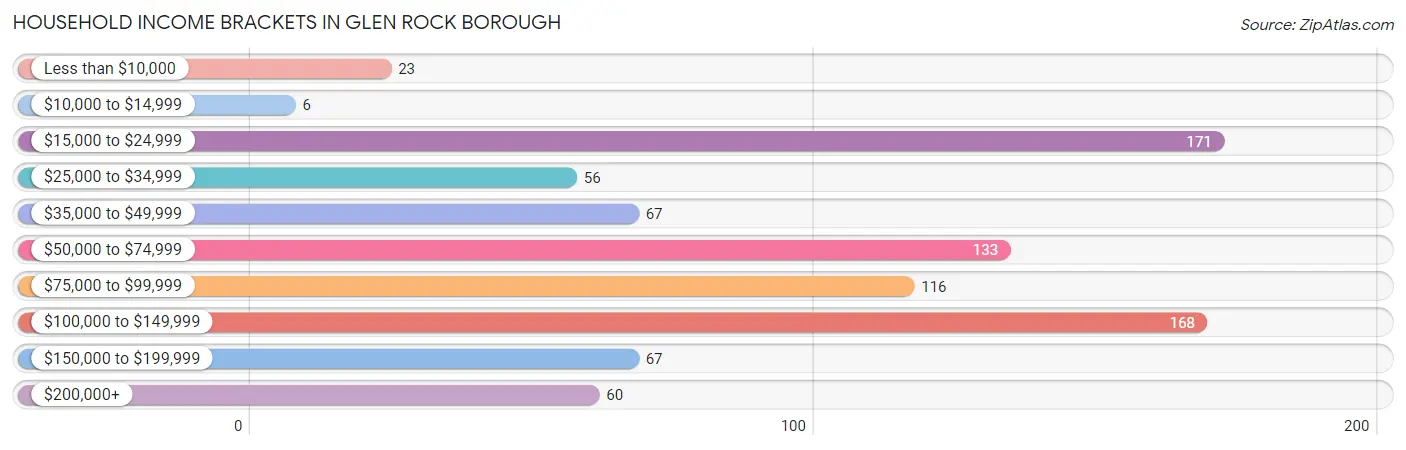
Household Income Brackets in Glen Rock borough
With 171 households falling in the category, the $15,000 to $24,999 income range is the most frequent in Glen Rock borough, accounting for 19.7% of all households. In contrast, only 6 households (0.7%) fall into the $10,000 to $14,999 income bracket, making it the least populous group.
| Income Bracket | # Households | % Households |
| Less than $10,000 | 23 | 2.7% |
| $10,000 to $14,999 | 6 | 0.7% |
| $15,000 to $24,999 | 171 | 19.7% |
| $25,000 to $34,999 | 56 | 6.5% |
| $35,000 to $49,999 | 67 | 7.7% |
| $50,000 to $74,999 | 133 | 15.3% |
| $75,000 to $99,999 | 116 | 13.4% |
| $100,000 to $149,999 | 168 | 19.4% |
| $150,000 to $199,999 | 67 | 7.7% |
| $200,000+ | 60 | 6.9% |
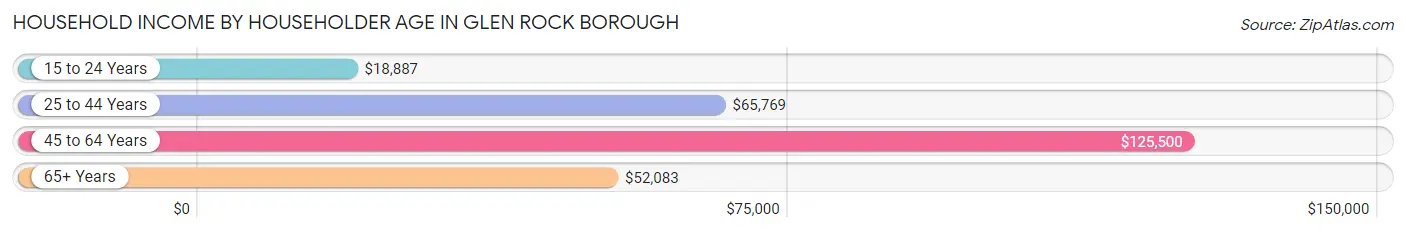
Household Income by Householder Age in Glen Rock borough
The median household income in Glen Rock borough is $62,750, with the highest median household income of $125,500 found in the 45 to 64 years age bracket for the primary householder. A total of 246 households (28.4%) fall into this category. Meanwhile, the 15 to 24 years age bracket for the primary householder has the lowest median household income of $18,887, with 91 households (10.5%) in this group.
| Income Bracket | # Households | Median Income |
| 15 to 24 Years | 91 (10.5%) | $18,887 |
| 25 to 44 Years | 374 (43.1%) | $65,769 |
| 45 to 64 Years | 246 (28.4%) | $125,500 |
| 65+ Years | 156 (18.0%) | $52,083 |
| Total | 867 (100.0%) | $62,750 |
Poverty in Glen Rock borough
Income Below Poverty by Sex and Age in Glen Rock borough
With 11.1% poverty level for males and 16.0% for females among the residents of Glen Rock borough, 6 to 11 year old males and under 5 year old females are the most vulnerable to poverty, with 48 males (31.4%) and 58 females (52.7%) in their respective age groups living below the poverty level.
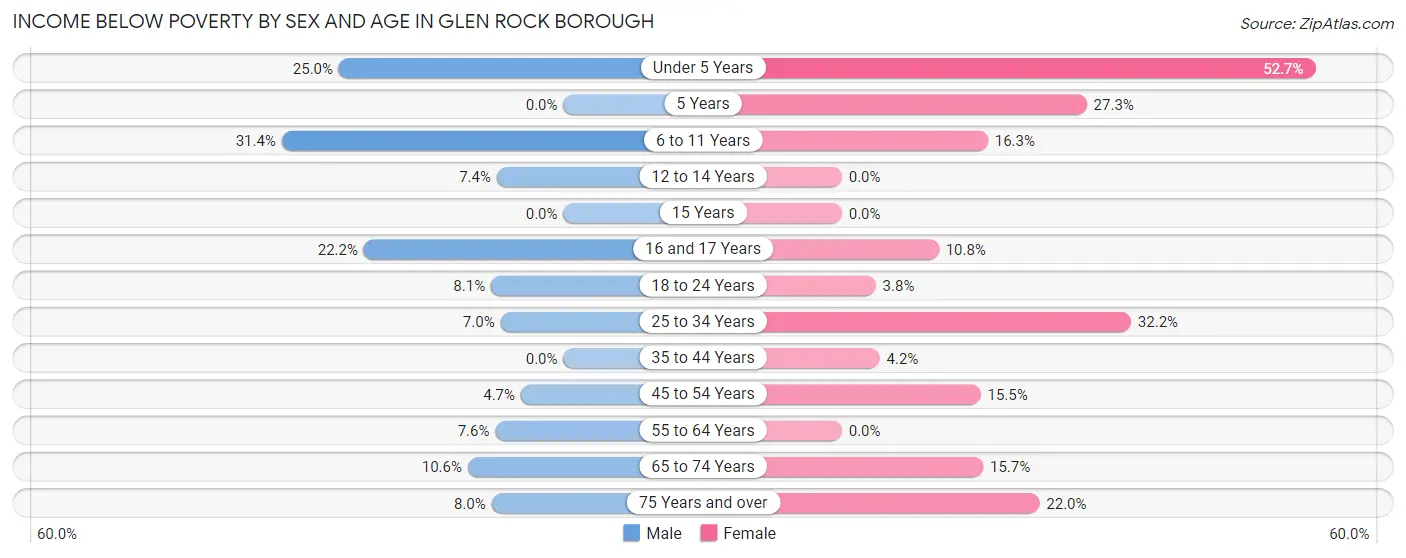
| Age Bracket | Male | Female |
| Under 5 Years | 12 (25.0%) | 58 (52.7%) |
| 5 Years | 0 (0.0%) | 6 (27.3%) |
| 6 to 11 Years | 48 (31.4%) | 33 (16.3%) |
| 12 to 14 Years | 4 (7.4%) | 0 (0.0%) |
| 15 Years | 0 (0.0%) | 0 (0.0%) |
| 16 and 17 Years | 6 (22.2%) | 15 (10.8%) |
| 18 to 24 Years | 5 (8.1%) | 4 (3.8%) |
| 25 to 34 Years | 7 (7.0%) | 57 (32.2%) |
| 35 to 44 Years | 0 (0.0%) | 12 (4.2%) |
| 45 to 54 Years | 8 (4.7%) | 19 (15.4%) |
| 55 to 64 Years | 5 (7.6%) | 0 (0.0%) |
| 65 to 74 Years | 5 (10.6%) | 14 (15.7%) |
| 75 Years and over | 4 (8.0%) | 11 (22.0%) |
| Total | 104 (11.1%) | 229 (16.0%) |
Income Above Poverty by Sex and Age in Glen Rock borough
According to the poverty statistics in Glen Rock borough, males aged 5 years and females aged 12 to 14 years are the age groups that are most secure financially, with 100.0% of males and 100.0% of females in these age groups living above the poverty line.
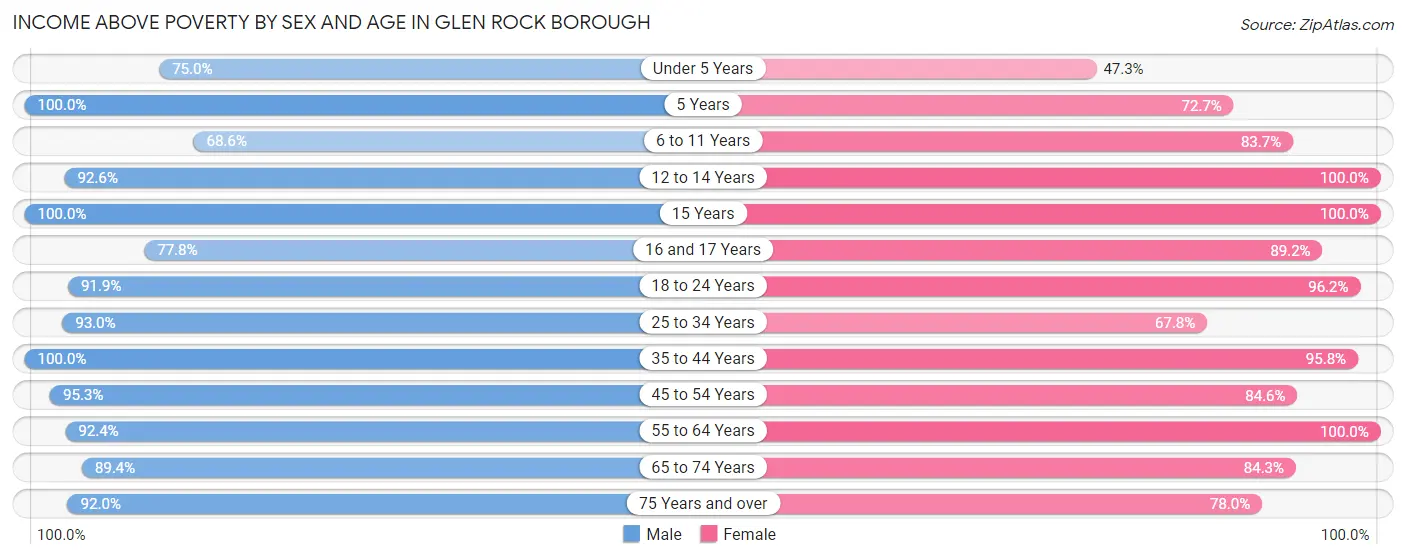
| Age Bracket | Male | Female |
| Under 5 Years | 36 (75.0%) | 52 (47.3%) |
| 5 Years | 15 (100.0%) | 16 (72.7%) |
| 6 to 11 Years | 105 (68.6%) | 170 (83.7%) |
| 12 to 14 Years | 50 (92.6%) | 40 (100.0%) |
| 15 Years | 21 (100.0%) | 12 (100.0%) |
| 16 and 17 Years | 21 (77.8%) | 124 (89.2%) |
| 18 to 24 Years | 57 (91.9%) | 102 (96.2%) |
| 25 to 34 Years | 93 (93.0%) | 120 (67.8%) |
| 35 to 44 Years | 122 (100.0%) | 273 (95.8%) |
| 45 to 54 Years | 161 (95.3%) | 104 (84.6%) |
| 55 to 64 Years | 61 (92.4%) | 74 (100.0%) |
| 65 to 74 Years | 42 (89.4%) | 75 (84.3%) |
| 75 Years and over | 46 (92.0%) | 39 (78.0%) |
| Total | 830 (88.9%) | 1,201 (84.0%) |
Income Below Poverty Among Married-Couple Families in Glen Rock borough
The poverty statistics for married-couple families in Glen Rock borough show that 2.6% or 11 of the total 429 families live below the poverty line. Families with 3 or 4 children have the highest poverty rate of 14.3%, comprising of 7 families. On the other hand, families with 1 or 2 children have the lowest poverty rate of 0.0%, which includes 0 families.
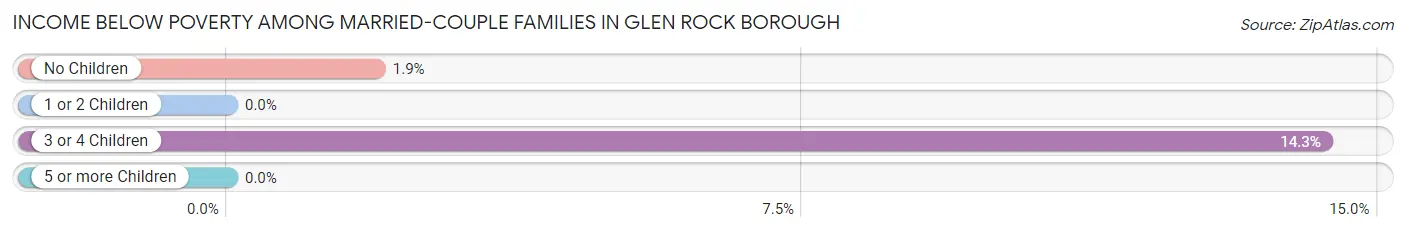
| Children | Above Poverty | Below Poverty |
| No Children | 203 (98.1%) | 4 (1.9%) |
| 1 or 2 Children | 166 (100.0%) | 0 (0.0%) |
| 3 or 4 Children | 42 (85.7%) | 7 (14.3%) |
| 5 or more Children | 7 (100.0%) | 0 (0.0%) |
| Total | 418 (97.4%) | 11 (2.6%) |
Income Below Poverty Among Single-Parent Households in Glen Rock borough
According to the poverty data in Glen Rock borough, 16.1% or 5 single-father households and 38.5% or 80 single-mother households are living below the poverty line. Among single-father households, those with 1 or 2 children have the highest poverty rate, with 5 households (27.8%) experiencing poverty. Likewise, among single-mother households, those with 3 or 4 children have the highest poverty rate, with 23 households (100.0%) falling below the poverty line.
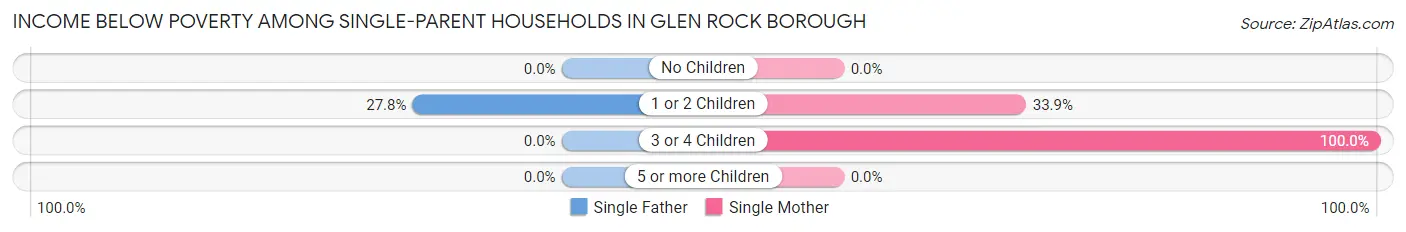
| Children | Single Father | Single Mother |
| No Children | 0 (0.0%) | 0 (0.0%) |
| 1 or 2 Children | 5 (27.8%) | 57 (33.9%) |
| 3 or 4 Children | 0 (0.0%) | 23 (100.0%) |
| 5 or more Children | 0 (0.0%) | 0 (0.0%) |
| Total | 5 (16.1%) | 80 (38.5%) |
Income Below Poverty Among Married-Couple vs Single-Parent Households in Glen Rock borough
The poverty data for Glen Rock borough shows that 11 of the married-couple family households (2.6%) and 85 of the single-parent households (35.6%) are living below the poverty level. Within the married-couple family households, those with 3 or 4 children have the highest poverty rate, with 7 households (14.3%) falling below the poverty line. Among the single-parent households, those with 3 or 4 children have the highest poverty rate, with 23 household (100.0%) living below poverty.
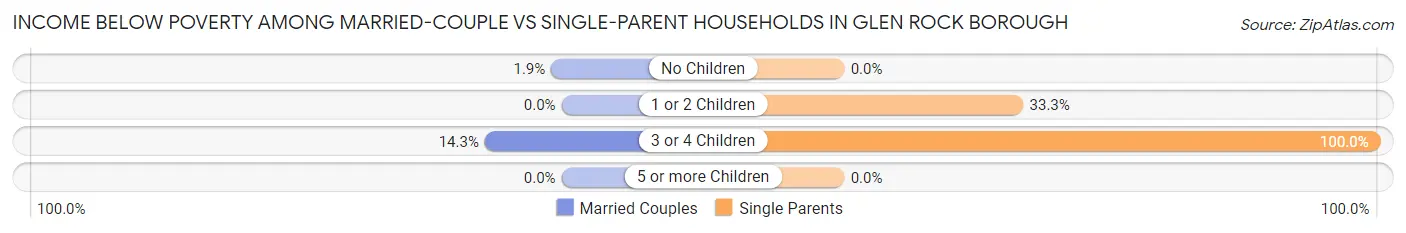
| Children | Married-Couple Families | Single-Parent Households |
| No Children | 4 (1.9%) | 0 (0.0%) |
| 1 or 2 Children | 0 (0.0%) | 62 (33.3%) |
| 3 or 4 Children | 7 (14.3%) | 23 (100.0%) |
| 5 or more Children | 0 (0.0%) | 0 (0.0%) |
| Total | 11 (2.6%) | 85 (35.6%) |
Race in Glen Rock borough
The most populous races in Glen Rock borough are White / Caucasian (1,945 | 82.3%), Two or more Races (333 | 14.1%), and Hispanic or Latino (237 | 10.0%).
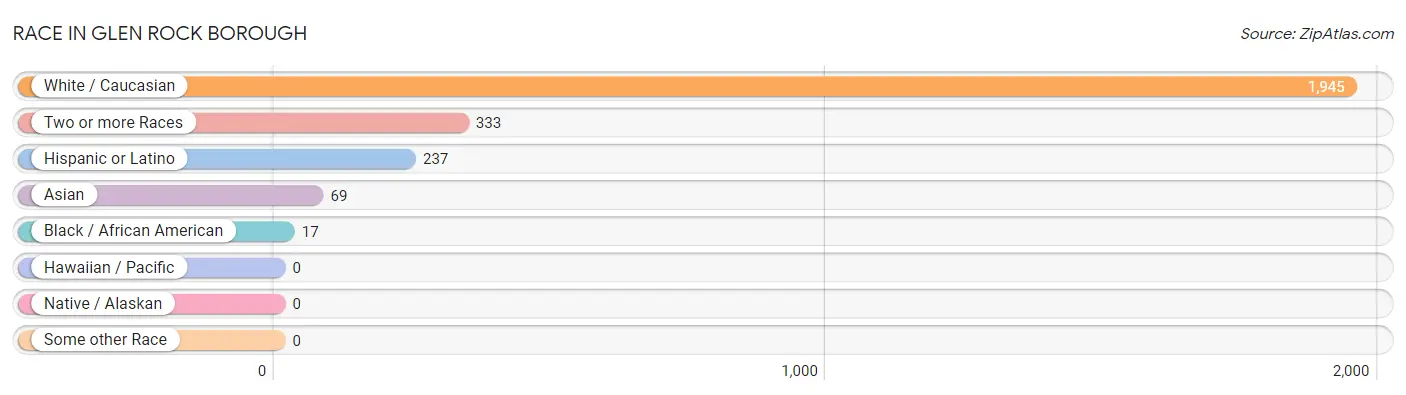
| Race | # Population | % Population |
| Asian | 69 | 2.9% |
| Black / African American | 17 | 0.7% |
| Hawaiian / Pacific | 0 | 0.0% |
| Hispanic or Latino | 237 | 10.0% |
| Native / Alaskan | 0 | 0.0% |
| White / Caucasian | 1,945 | 82.3% |
| Two or more Races | 333 | 14.1% |
| Some other Race | 0 | 0.0% |
| Total | 2,364 | 100.0% |
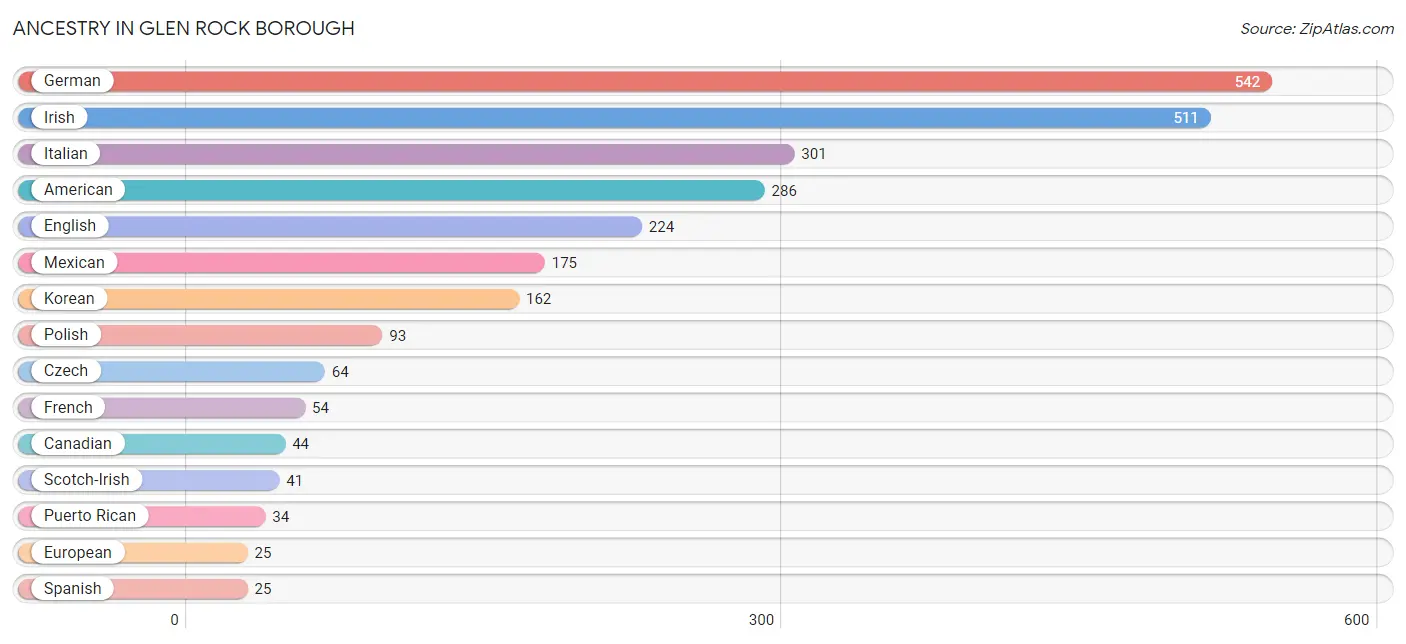
Ancestry in Glen Rock borough
The most populous ancestries reported in Glen Rock borough are German (542 | 22.9%), Irish (511 | 21.6%), Italian (301 | 12.7%), American (286 | 12.1%), and English (224 | 9.5%), together accounting for 78.9% of all Glen Rock borough residents.
| Ancestry | # Population | % Population |
| American | 286 | 12.1% |
| Austrian | 10 | 0.4% |
| British | 11 | 0.5% |
| Canadian | 44 | 1.9% |
| Cuban | 3 | 0.1% |
| Czech | 64 | 2.7% |
| Dutch | 9 | 0.4% |
| English | 224 | 9.5% |
| European | 25 | 1.1% |
| French | 54 | 2.3% |
| French Canadian | 12 | 0.5% |
| German | 542 | 22.9% |
| Greek | 17 | 0.7% |
| Hungarian | 12 | 0.5% |
| Irish | 511 | 21.6% |
| Italian | 301 | 12.7% |
| Korean | 162 | 6.9% |
| Mexican | 175 | 7.4% |
| Native Hawaiian | 7 | 0.3% |
| Norwegian | 9 | 0.4% |
| Pakistani | 3 | 0.1% |
| Pennsylvania German | 5 | 0.2% |
| Polish | 93 | 3.9% |
| Puerto Rican | 34 | 1.4% |
| Scotch-Irish | 41 | 1.7% |
| Seminole | 3 | 0.1% |
| Slovene | 5 | 0.2% |
| Spanish | 25 | 1.1% |
| Swedish | 3 | 0.1% |
| Swiss | 11 | 0.5% |
| Thai | 6 | 0.3% |
| Welsh | 21 | 0.9% |
| Yugoslavian | 23 | 1.0% | View All 33 Rows |
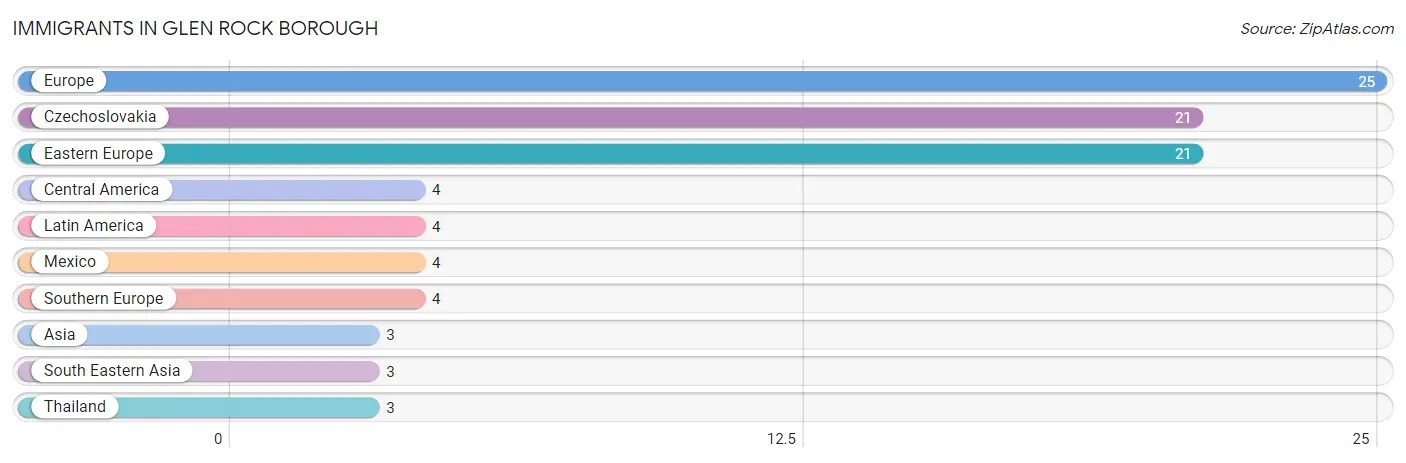
Immigrants in Glen Rock borough
The most numerous immigrant groups reported in Glen Rock borough came from Europe (25 | 1.1%), Czechoslovakia (21 | 0.9%), Eastern Europe (21 | 0.9%), Central America (4 | 0.2%), and Latin America (4 | 0.2%), together accounting for 3.2% of all Glen Rock borough residents.
| Immigration Origin | # Population | % Population |
| Asia | 3 | 0.1% |
| Central America | 4 | 0.2% |
| Czechoslovakia | 21 | 0.9% |
| Eastern Europe | 21 | 0.9% |
| Europe | 25 | 1.1% |
| Latin America | 4 | 0.2% |
| Mexico | 4 | 0.2% |
| South Eastern Asia | 3 | 0.1% |
| Southern Europe | 4 | 0.2% |
| Thailand | 3 | 0.1% | View All 10 Rows |
Sex and Age in Glen Rock borough
Sex and Age in Glen Rock borough
The most populous age groups in Glen Rock borough are 5 to 9 Years (119 | 12.7%) for men and 35 to 39 Years (221 | 15.4%) for women.
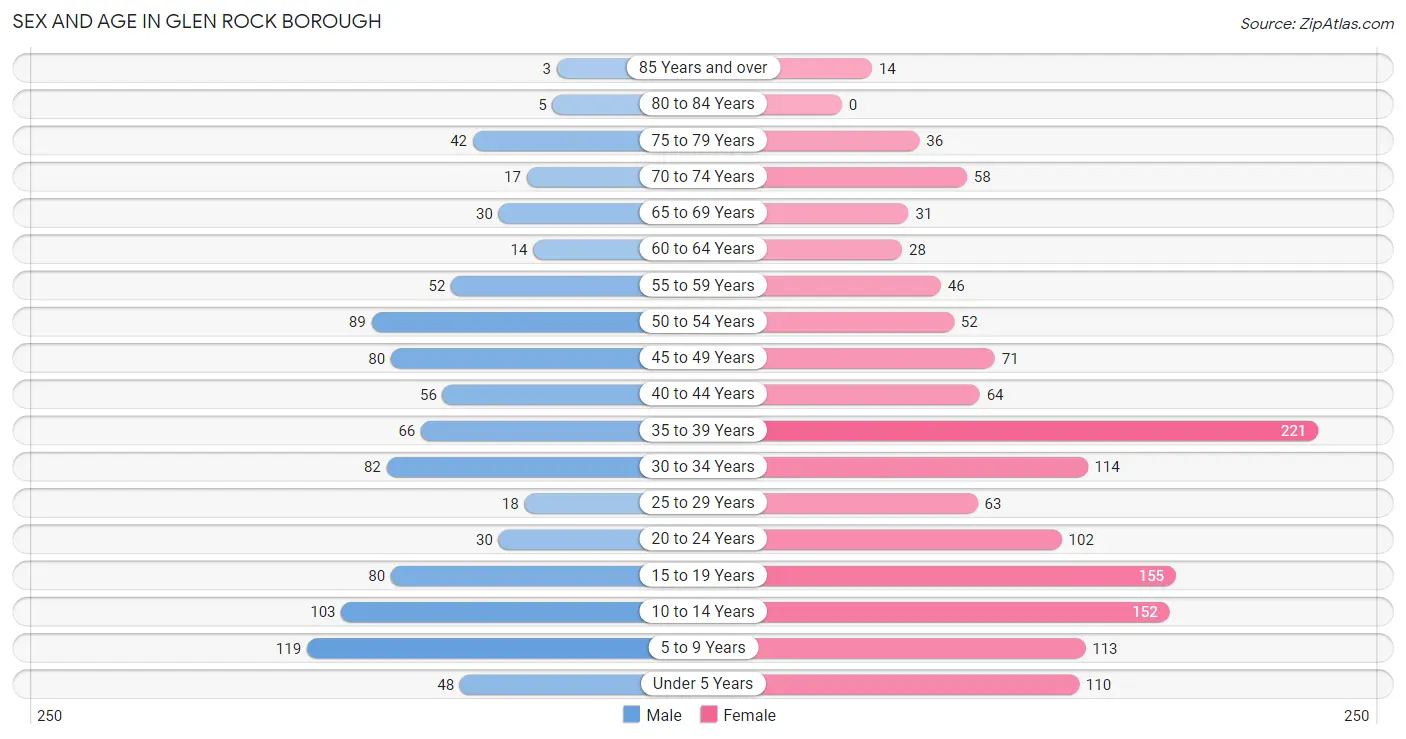
| Age Bracket | Male | Female |
| Under 5 Years | 48 (5.1%) | 110 (7.7%) |
| 5 to 9 Years | 119 (12.7%) | 113 (7.9%) |
| 10 to 14 Years | 103 (11.0%) | 152 (10.6%) |
| 15 to 19 Years | 80 (8.6%) | 155 (10.8%) |
| 20 to 24 Years | 30 (3.2%) | 102 (7.1%) |
| 25 to 29 Years | 18 (1.9%) | 63 (4.4%) |
| 30 to 34 Years | 82 (8.8%) | 114 (8.0%) |
| 35 to 39 Years | 66 (7.1%) | 221 (15.4%) |
| 40 to 44 Years | 56 (6.0%) | 64 (4.5%) |
| 45 to 49 Years | 80 (8.6%) | 71 (5.0%) |
| 50 to 54 Years | 89 (9.5%) | 52 (3.6%) |
| 55 to 59 Years | 52 (5.6%) | 46 (3.2%) |
| 60 to 64 Years | 14 (1.5%) | 28 (2.0%) |
| 65 to 69 Years | 30 (3.2%) | 31 (2.2%) |
| 70 to 74 Years | 17 (1.8%) | 58 (4.1%) |
| 75 to 79 Years | 42 (4.5%) | 36 (2.5%) |
| 80 to 84 Years | 5 (0.5%) | 0 (0.0%) |
| 85 Years and over | 3 (0.3%) | 14 (1.0%) |
| Total | 934 (100.0%) | 1,430 (100.0%) |
Families and Households in Glen Rock borough
Median Family Size in Glen Rock borough
The median family size in Glen Rock borough is 3.12 persons per family, with married-couple families (429 | 64.2%) accounting for the largest median family size of 3.33 persons per family. On the other hand, single male/father families (31 | 4.6%) represent the smallest median family size with 2.16 persons per family.
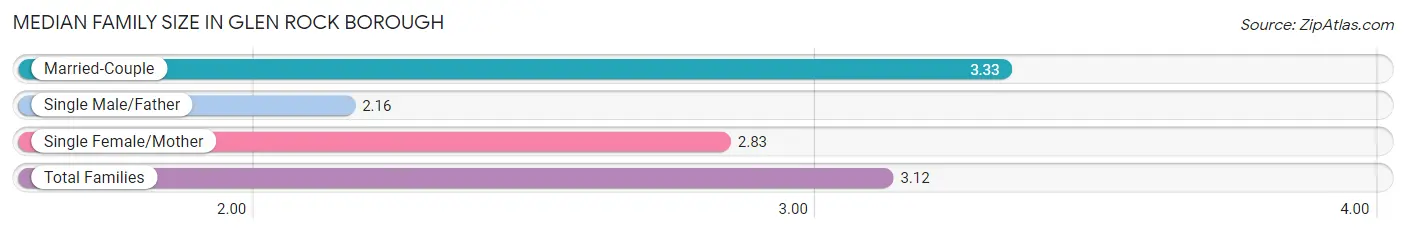
| Family Type | # Families | Family Size |
| Married-Couple | 429 (64.2%) | 3.33 |
| Single Male/Father | 31 (4.6%) | 2.16 |
| Single Female/Mother | 208 (31.1%) | 2.83 |
| Total Families | 668 (100.0%) | 3.12 |
Median Household Size in Glen Rock borough
The median household size in Glen Rock borough is 2.73 persons per household, with married-couple households (429 | 49.5%) accounting for the largest median household size of 3.37 persons per household. non-family households (199 | 23.0%) represent the smallest median household size with 1.14 persons per household.
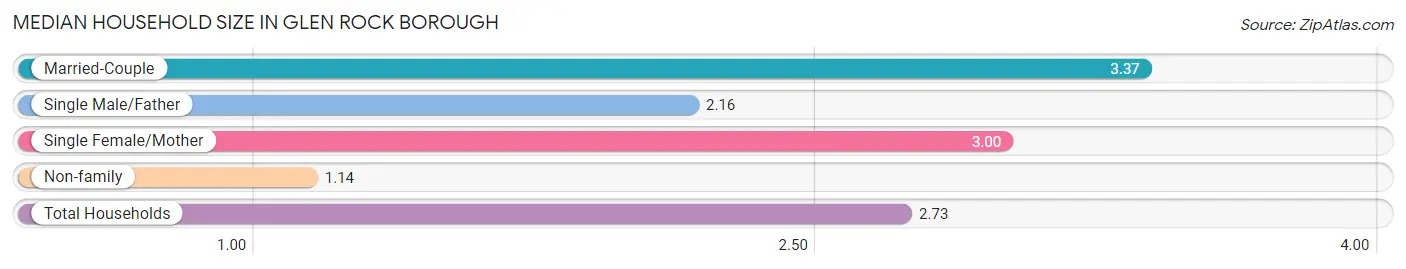
| Household Type | # Households | Household Size |
| Married-Couple | 429 (49.5%) | 3.37 |
| Single Male/Father | 31 (3.6%) | 2.16 |
| Single Female/Mother | 208 (24.0%) | 3.00 |
| Non-family | 199 (23.0%) | 1.14 |
| Total Households | 867 (100.0%) | 2.73 |
Household Size by Marriage Status in Glen Rock borough
Out of a total of 867 households in Glen Rock borough, 668 (77.0%) are family households, while 199 (23.0%) are nonfamily households. The most numerous type of family households are 2-person households, comprising 310, and the most common type of nonfamily households are 1-person households, comprising 170.
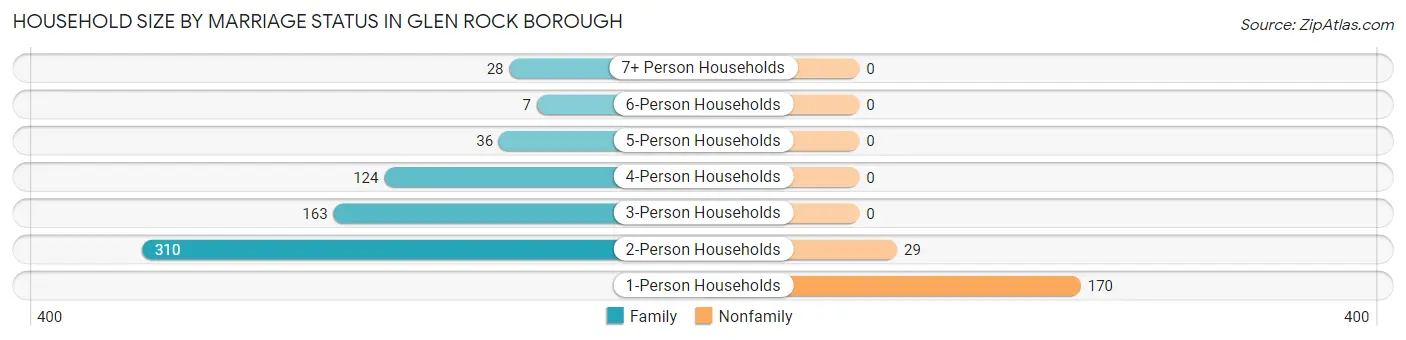
| Household Size | Family Households | Nonfamily Households |
| 1-Person Households | - | 170 (19.6%) |
| 2-Person Households | 310 (35.8%) | 29 (3.3%) |
| 3-Person Households | 163 (18.8%) | 0 (0.0%) |
| 4-Person Households | 124 (14.3%) | 0 (0.0%) |
| 5-Person Households | 36 (4.2%) | 0 (0.0%) |
| 6-Person Households | 7 (0.8%) | 0 (0.0%) |
| 7+ Person Households | 28 (3.2%) | 0 (0.0%) |
| Total | 668 (77.0%) | 199 (23.0%) |
Female Fertility in Glen Rock borough
Fertility by Age in Glen Rock borough
Average fertility rate in Glen Rock borough is 31.0 births per 1,000 women. Women in the age bracket of 35 to 50 years have the highest fertility rate with 41.0 births per 1,000 women. Women in the age bracket of 35 to 50 years acount for 60.0% of all women with births.
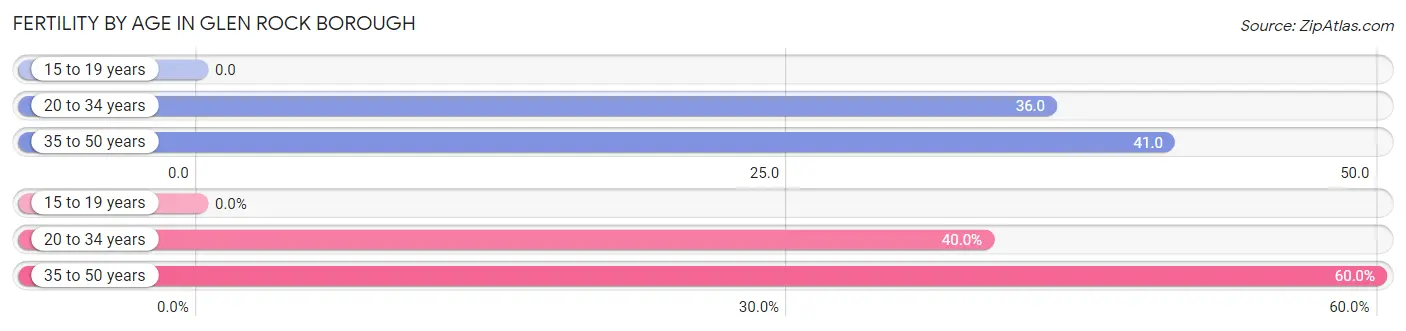
| Age Bracket | Women with Births | Births / 1,000 Women |
| 15 to 19 years | 0 (0.0%) | 0.0 |
| 20 to 34 years | 10 (40.0%) | 36.0 |
| 35 to 50 years | 15 (60.0%) | 41.0 |
| Total | 25 (100.0%) | 31.0 |
Fertility by Age by Marriage Status in Glen Rock borough
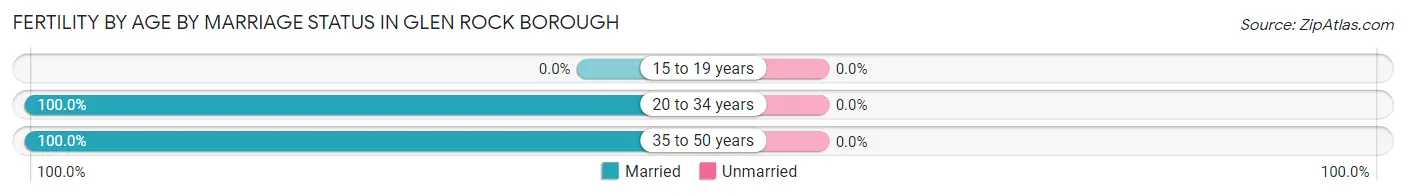
| Age Bracket | Married | Unmarried |
| 15 to 19 years | 0 (0.0%) | 0 (0.0%) |
| 20 to 34 years | 10 (100.0%) | 0 (0.0%) |
| 35 to 50 years | 15 (100.0%) | 0 (0.0%) |
| Total | 25 (100.0%) | 0 (0.0%) |
Fertility by Education in Glen Rock borough
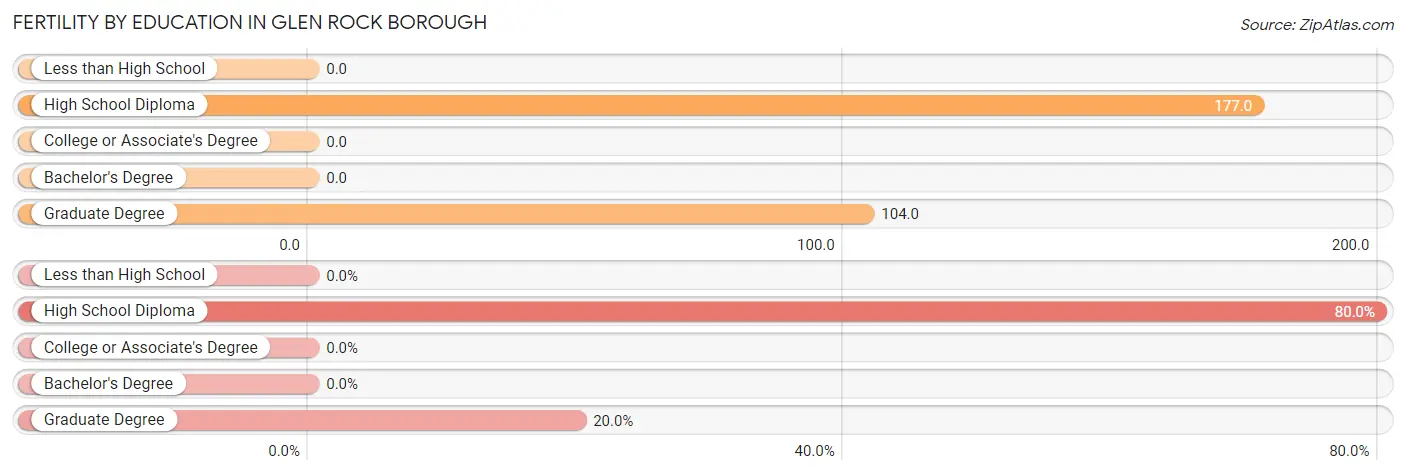
| Educational Attainment | Women with Births | Births / 1,000 Women |
| Less than High School | 0 (0.0%) | 0.0 |
| High School Diploma | 20 (80.0%) | 177.0 |
| College or Associate's Degree | 0 (0.0%) | 0.0 |
| Bachelor's Degree | 0 (0.0%) | 0.0 |
| Graduate Degree | 5 (20.0%) | 104.0 |
| Total | 25 (100.0%) | 31.0 |
Fertility by Education by Marriage Status in Glen Rock borough
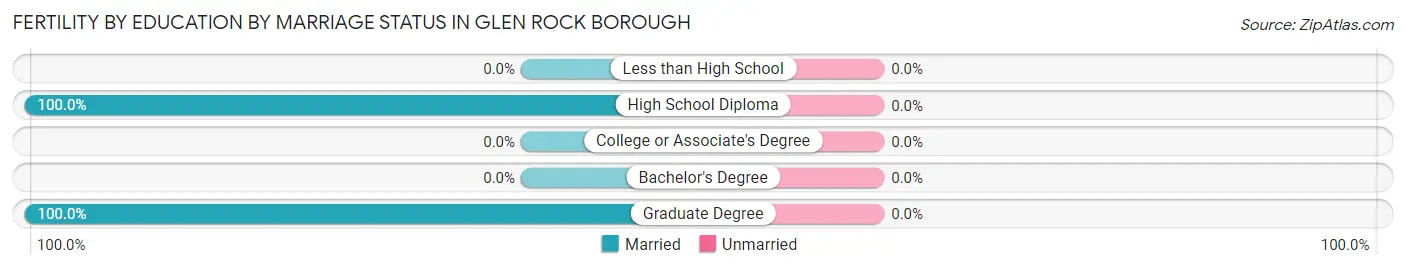
| Educational Attainment | Married | Unmarried |
| Less than High School | 0 (0.0%) | 0 (0.0%) |
| High School Diploma | 20 (100.0%) | 0 (0.0%) |
| College or Associate's Degree | 0 (0.0%) | 0 (0.0%) |
| Bachelor's Degree | 0 (0.0%) | 0 (0.0%) |
| Graduate Degree | 5 (100.0%) | 0 (0.0%) |
| Total | 25 (100.0%) | 0 (0.0%) |
Employment Characteristics in Glen Rock borough
Employment by Class of Employer in Glen Rock borough
Among the 1,105 employed individuals in Glen Rock borough, private company employees (720 | 65.2%), not-for-profit organizations (167 | 15.1%), and local government employees (87 | 7.9%) make up the most common classes of employment.
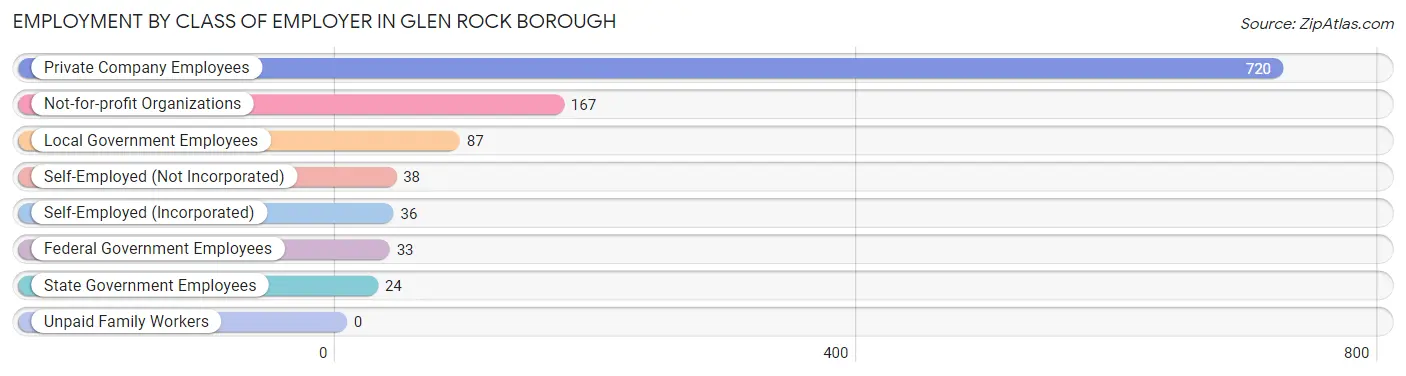
| Employer Class | # Employees | % Employees |
| Private Company Employees | 720 | 65.2% |
| Self-Employed (Incorporated) | 36 | 3.3% |
| Self-Employed (Not Incorporated) | 38 | 3.4% |
| Not-for-profit Organizations | 167 | 15.1% |
| Local Government Employees | 87 | 7.9% |
| State Government Employees | 24 | 2.2% |
| Federal Government Employees | 33 | 3.0% |
| Unpaid Family Workers | 0 | 0.0% |
| Total | 1,105 | 100.0% |
Employment Status by Age in Glen Rock borough
According to the labor force statistics for Glen Rock borough, out of the total population over 16 years of age (1,686), 75.2% or 1,268 individuals are in the labor force, with 11.1% or 141 of them unemployed. The age group with the highest labor force participation rate is 45 to 54 years, with 94.2% or 275 individuals in the labor force. Within the labor force, the 16 to 19 years age range has the highest percentage of unemployed individuals, with 76.2% or 109 of them being unemployed.
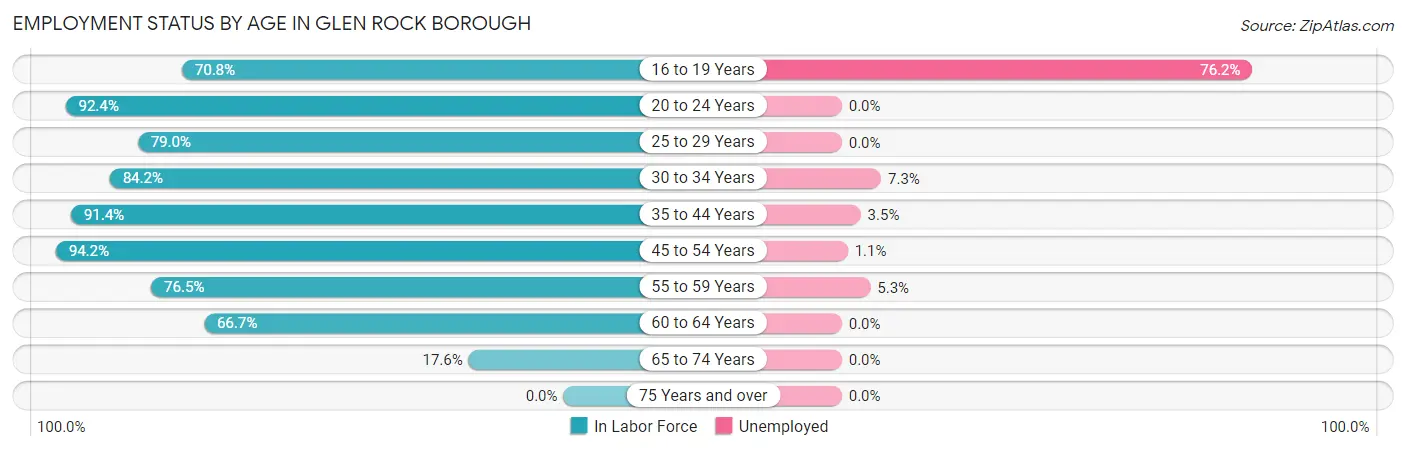
| Age Bracket | In Labor Force | Unemployed |
| 16 to 19 Years | 143 (70.8%) | 109 (76.2%) |
| 20 to 24 Years | 122 (92.4%) | 0 (0.0%) |
| 25 to 29 Years | 64 (79.0%) | 0 (0.0%) |
| 30 to 34 Years | 165 (84.2%) | 12 (7.3%) |
| 35 to 44 Years | 372 (91.4%) | 13 (3.5%) |
| 45 to 54 Years | 275 (94.2%) | 3 (1.1%) |
| 55 to 59 Years | 75 (76.5%) | 4 (5.3%) |
| 60 to 64 Years | 28 (66.7%) | 0 (0.0%) |
| 65 to 74 Years | 24 (17.6%) | 0 (0.0%) |
| 75 Years and over | 0 (0.0%) | 0 (0.0%) |
| Total | 1,268 (75.2%) | 141 (11.1%) |
Employment Status by Educational Attainment in Glen Rock borough
According to labor force statistics for Glen Rock borough, 87.7% of individuals (979) out of the total population between 25 and 64 years of age (1,116) are in the labor force, with 3.3% or 32 of them being unemployed. The group with the highest labor force participation rate are those with the educational attainment of bachelor's degree or higher, with 97.7% or 390 individuals in the labor force. Within the labor force, individuals with college / associate degree education have the highest percentage of unemployment, with 10.0% or 32 of them being unemployed.
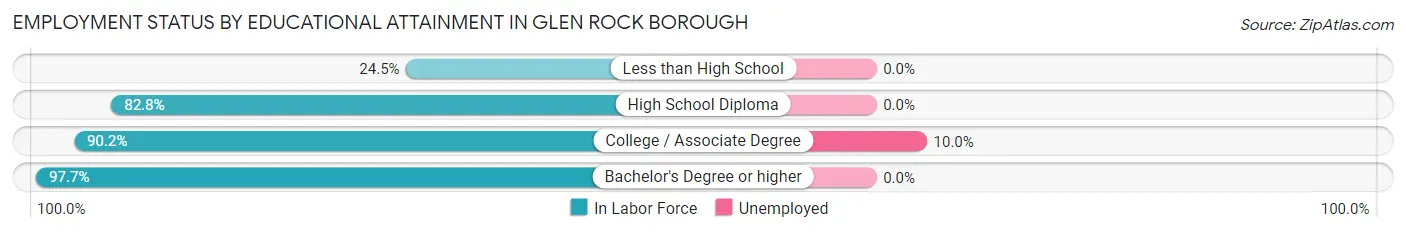
| Educational Attainment | In Labor Force | Unemployed |
| Less than High School | 13 (24.5%) | 0 (0.0%) |
| High School Diploma | 255 (82.8%) | 0 (0.0%) |
| College / Associate Degree | 321 (90.2%) | 36 (10.0%) |
| Bachelor's Degree or higher | 390 (97.7%) | 0 (0.0%) |
| Total | 979 (87.7%) | 37 (3.3%) |
Employment Occupations by Sex in Glen Rock borough
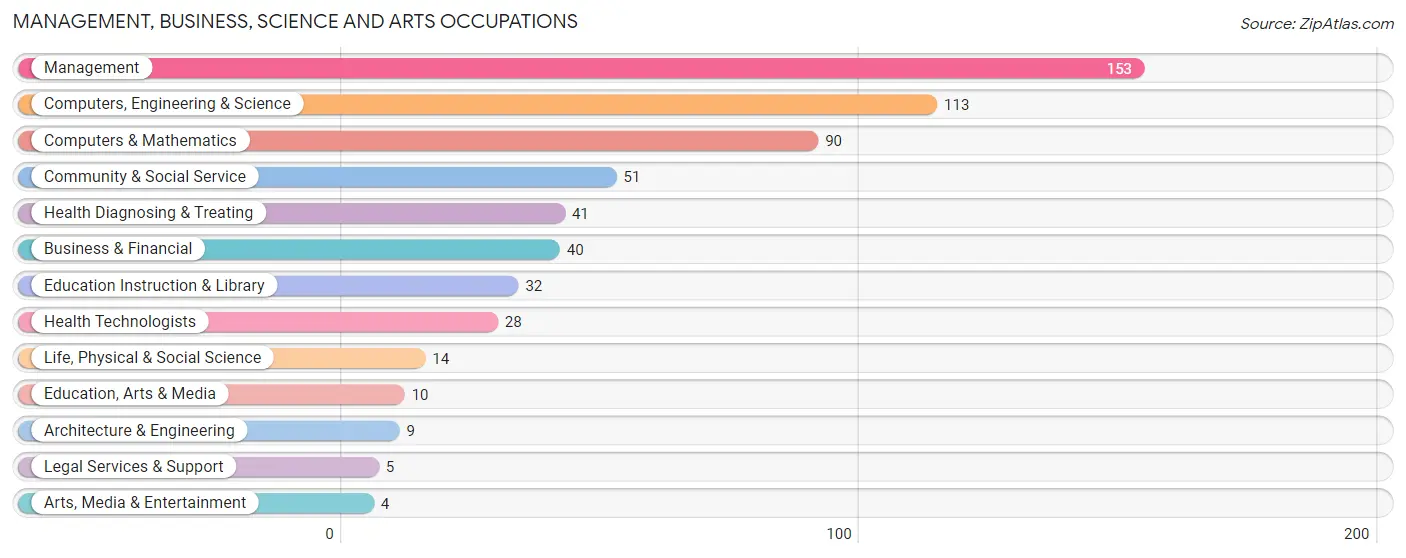
Management, Business, Science and Arts Occupations
The most common Management, Business, Science and Arts occupations in Glen Rock borough are Management (153 | 13.6%), Computers, Engineering & Science (113 | 10.0%), Computers & Mathematics (90 | 8.0%), Community & Social Service (51 | 4.5%), and Health Diagnosing & Treating (41 | 3.6%).
Management, Business, Science and Arts Occupations by Sex
Within the Management, Business, Science and Arts occupations in Glen Rock borough, the most male-oriented occupations are Architecture & Engineering (100.0%), Business & Financial (55.0%), and Education, Arts & Media (40.0%), while the most female-oriented occupations are Life, Physical & Social Science (100.0%), Legal Services & Support (100.0%), and Arts, Media & Entertainment (100.0%).
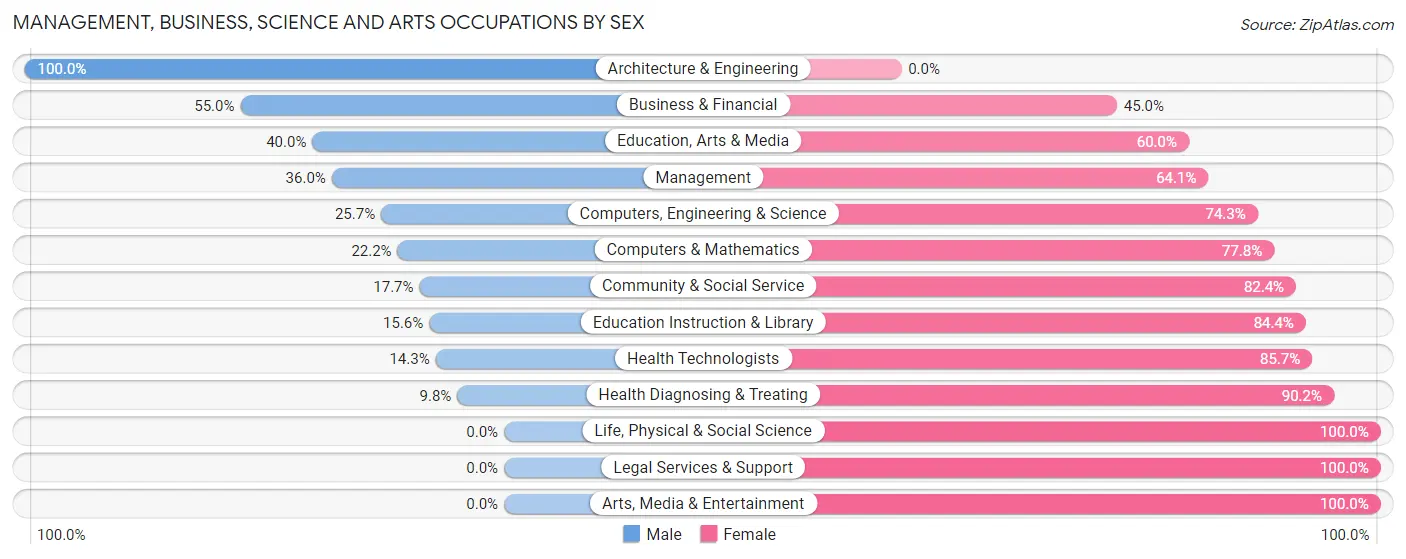
| Occupation | Male | Female |
| Management | 55 (35.9%) | 98 (64.0%) |
| Business & Financial | 22 (55.0%) | 18 (45.0%) |
| Computers, Engineering & Science | 29 (25.7%) | 84 (74.3%) |
| Computers & Mathematics | 20 (22.2%) | 70 (77.8%) |
| Architecture & Engineering | 9 (100.0%) | 0 (0.0%) |
| Life, Physical & Social Science | 0 (0.0%) | 14 (100.0%) |
| Community & Social Service | 9 (17.6%) | 42 (82.4%) |
| Education, Arts & Media | 4 (40.0%) | 6 (60.0%) |
| Legal Services & Support | 0 (0.0%) | 5 (100.0%) |
| Education Instruction & Library | 5 (15.6%) | 27 (84.4%) |
| Arts, Media & Entertainment | 0 (0.0%) | 4 (100.0%) |
| Health Diagnosing & Treating | 4 (9.8%) | 37 (90.2%) |
| Health Technologists | 4 (14.3%) | 24 (85.7%) |
| Total (Category) | 119 (29.9%) | 279 (70.1%) |
| Total (Overall) | 467 (41.4%) | 660 (58.6%) |
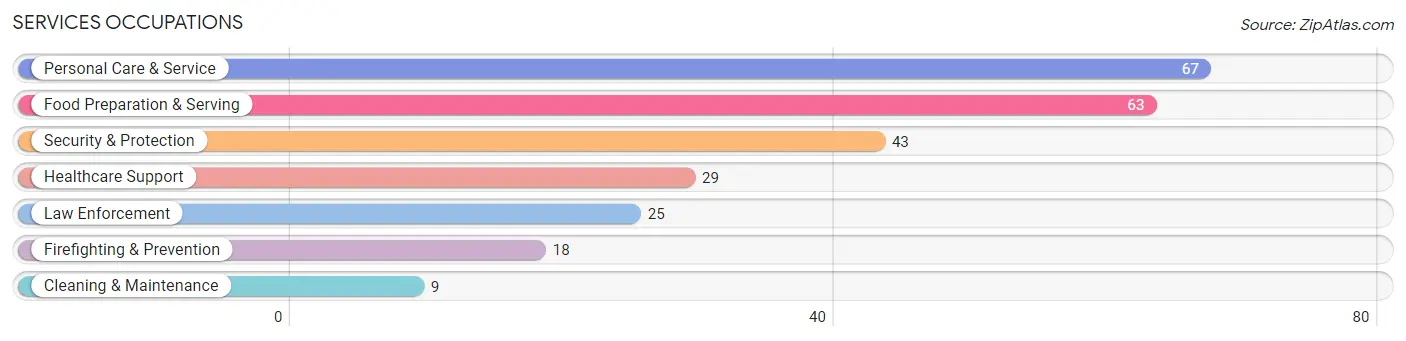
Services Occupations
The most common Services occupations in Glen Rock borough are Personal Care & Service (67 | 5.9%), Food Preparation & Serving (63 | 5.6%), Security & Protection (43 | 3.8%), Healthcare Support (29 | 2.6%), and Law Enforcement (25 | 2.2%).
Services Occupations by Sex
Within the Services occupations in Glen Rock borough, the most male-oriented occupations are Law Enforcement (100.0%), Cleaning & Maintenance (100.0%), and Security & Protection (81.4%), while the most female-oriented occupations are Healthcare Support (100.0%), Personal Care & Service (100.0%), and Food Preparation & Serving (73.0%).
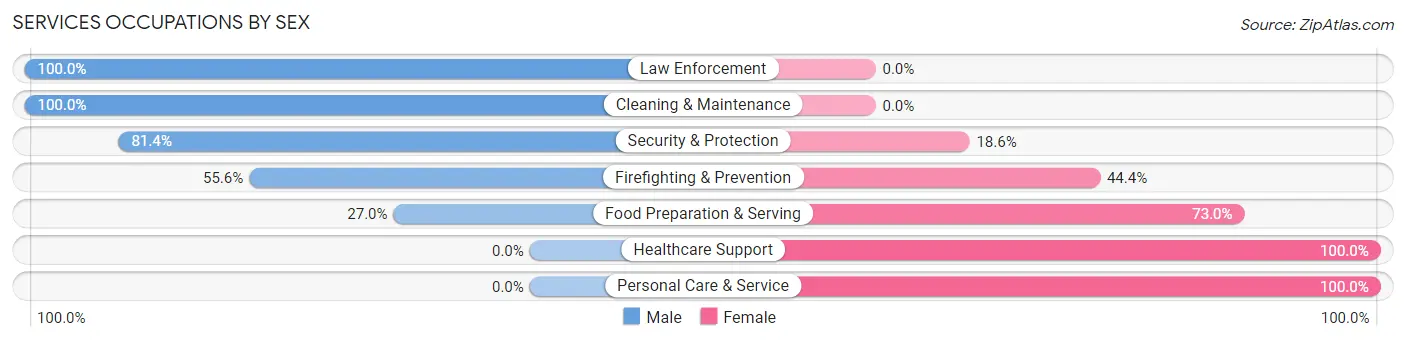
| Occupation | Male | Female |
| Healthcare Support | 0 (0.0%) | 29 (100.0%) |
| Security & Protection | 35 (81.4%) | 8 (18.6%) |
| Firefighting & Prevention | 10 (55.6%) | 8 (44.4%) |
| Law Enforcement | 25 (100.0%) | 0 (0.0%) |
| Food Preparation & Serving | 17 (27.0%) | 46 (73.0%) |
| Cleaning & Maintenance | 9 (100.0%) | 0 (0.0%) |
| Personal Care & Service | 0 (0.0%) | 67 (100.0%) |
| Total (Category) | 61 (28.9%) | 150 (71.1%) |
| Total (Overall) | 467 (41.4%) | 660 (58.6%) |
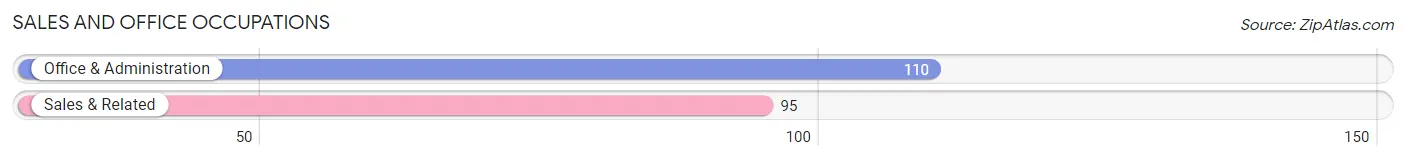
Sales and Office Occupations
The most common Sales and Office occupations in Glen Rock borough are Office & Administration (110 | 9.8%), and Sales & Related (95 | 8.4%).
Sales and Office Occupations by Sex
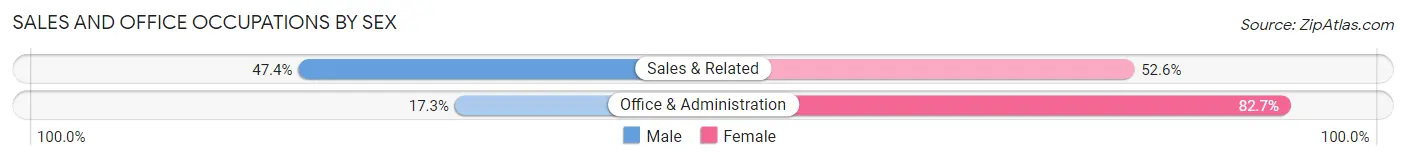
| Occupation | Male | Female |
| Sales & Related | 45 (47.4%) | 50 (52.6%) |
| Office & Administration | 19 (17.3%) | 91 (82.7%) |
| Total (Category) | 64 (31.2%) | 141 (68.8%) |
| Total (Overall) | 467 (41.4%) | 660 (58.6%) |
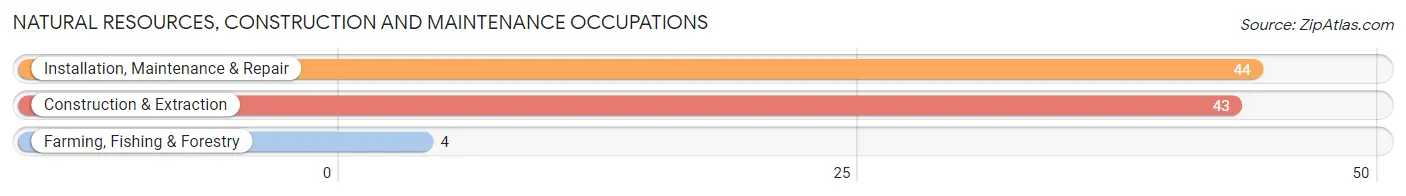
Natural Resources, Construction and Maintenance Occupations
The most common Natural Resources, Construction and Maintenance occupations in Glen Rock borough are Installation, Maintenance & Repair (44 | 3.9%), Construction & Extraction (43 | 3.8%), and Farming, Fishing & Forestry (4 | 0.4%).
Natural Resources, Construction and Maintenance Occupations by Sex
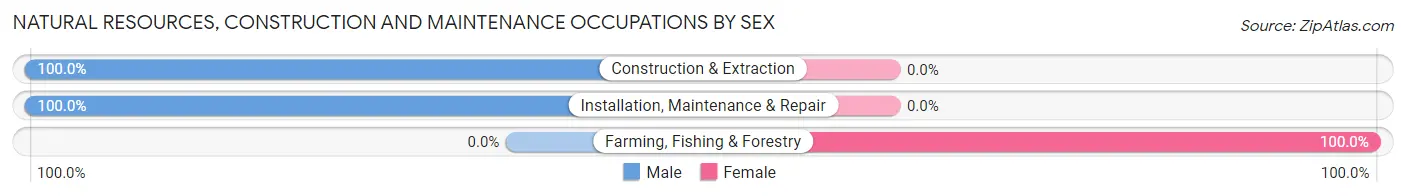
| Occupation | Male | Female |
| Farming, Fishing & Forestry | 0 (0.0%) | 4 (100.0%) |
| Construction & Extraction | 43 (100.0%) | 0 (0.0%) |
| Installation, Maintenance & Repair | 44 (100.0%) | 0 (0.0%) |
| Total (Category) | 87 (95.6%) | 4 (4.4%) |
| Total (Overall) | 467 (41.4%) | 660 (58.6%) |
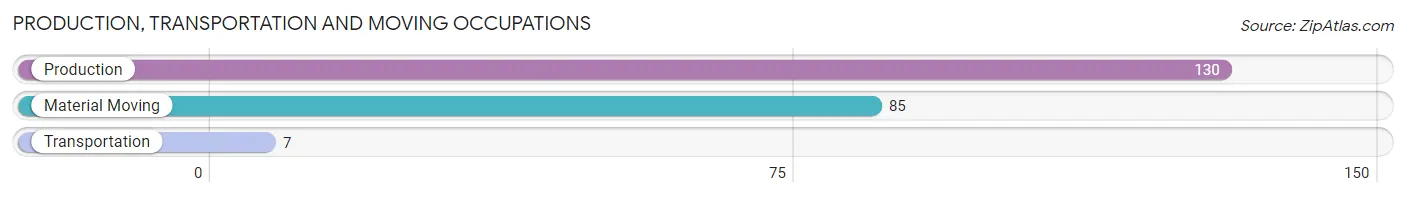
Production, Transportation and Moving Occupations
The most common Production, Transportation and Moving occupations in Glen Rock borough are Production (130 | 11.5%), Material Moving (85 | 7.5%), and Transportation (7 | 0.6%).
Production, Transportation and Moving Occupations by Sex
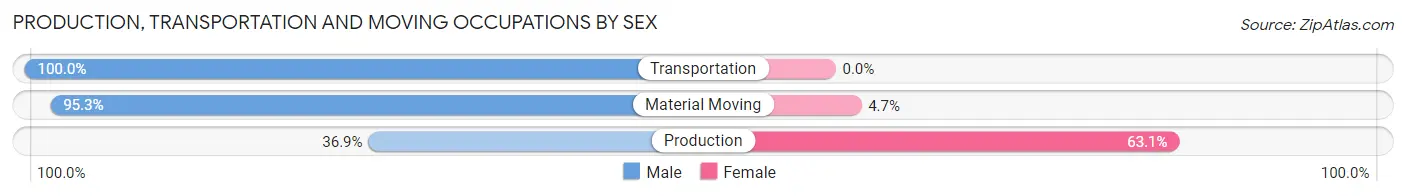
| Occupation | Male | Female |
| Production | 48 (36.9%) | 82 (63.1%) |
| Transportation | 7 (100.0%) | 0 (0.0%) |
| Material Moving | 81 (95.3%) | 4 (4.7%) |
| Total (Category) | 136 (61.3%) | 86 (38.7%) |
| Total (Overall) | 467 (41.4%) | 660 (58.6%) |
Employment Industries by Sex in Glen Rock borough
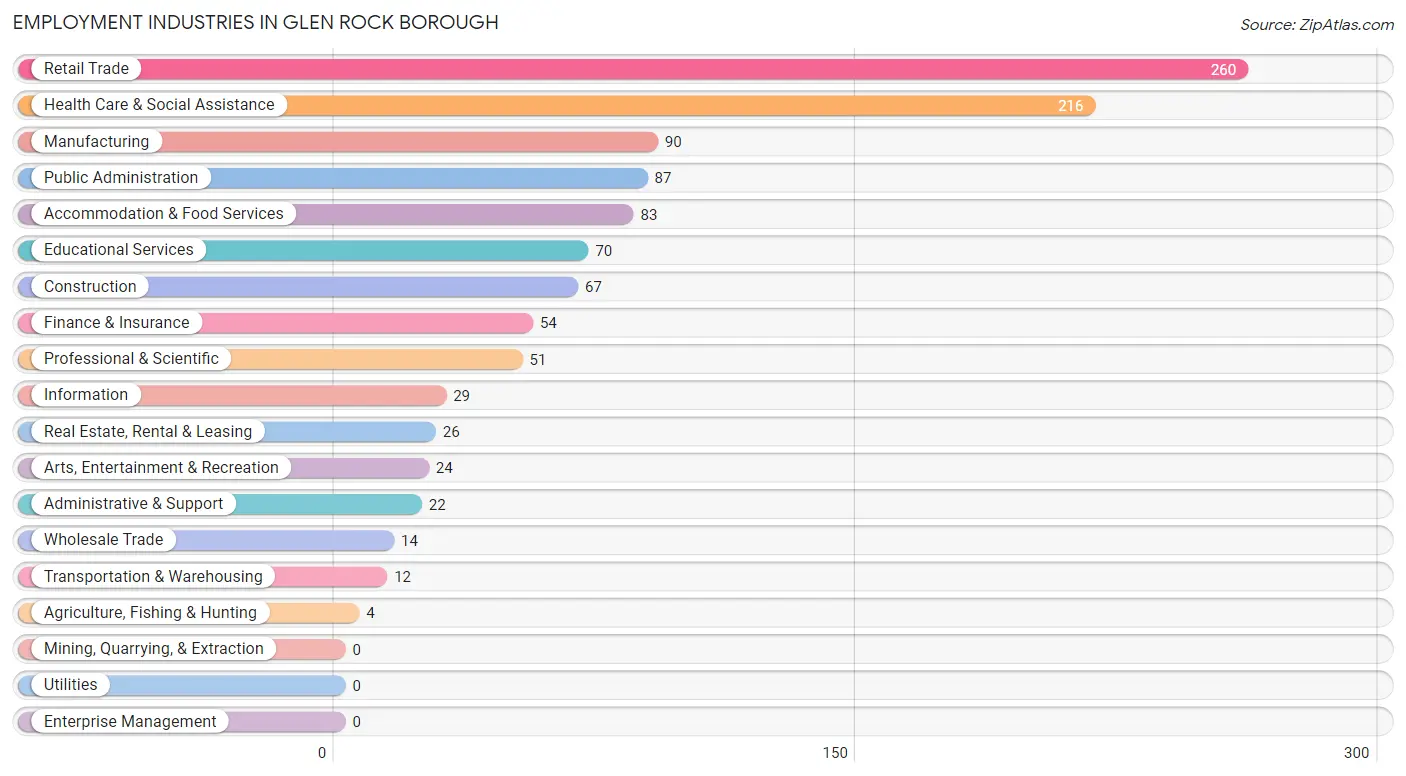
Employment Industries in Glen Rock borough
The major employment industries in Glen Rock borough include Retail Trade (260 | 23.1%), Health Care & Social Assistance (216 | 19.2%), Manufacturing (90 | 8.0%), Public Administration (87 | 7.7%), and Accommodation & Food Services (83 | 7.4%).
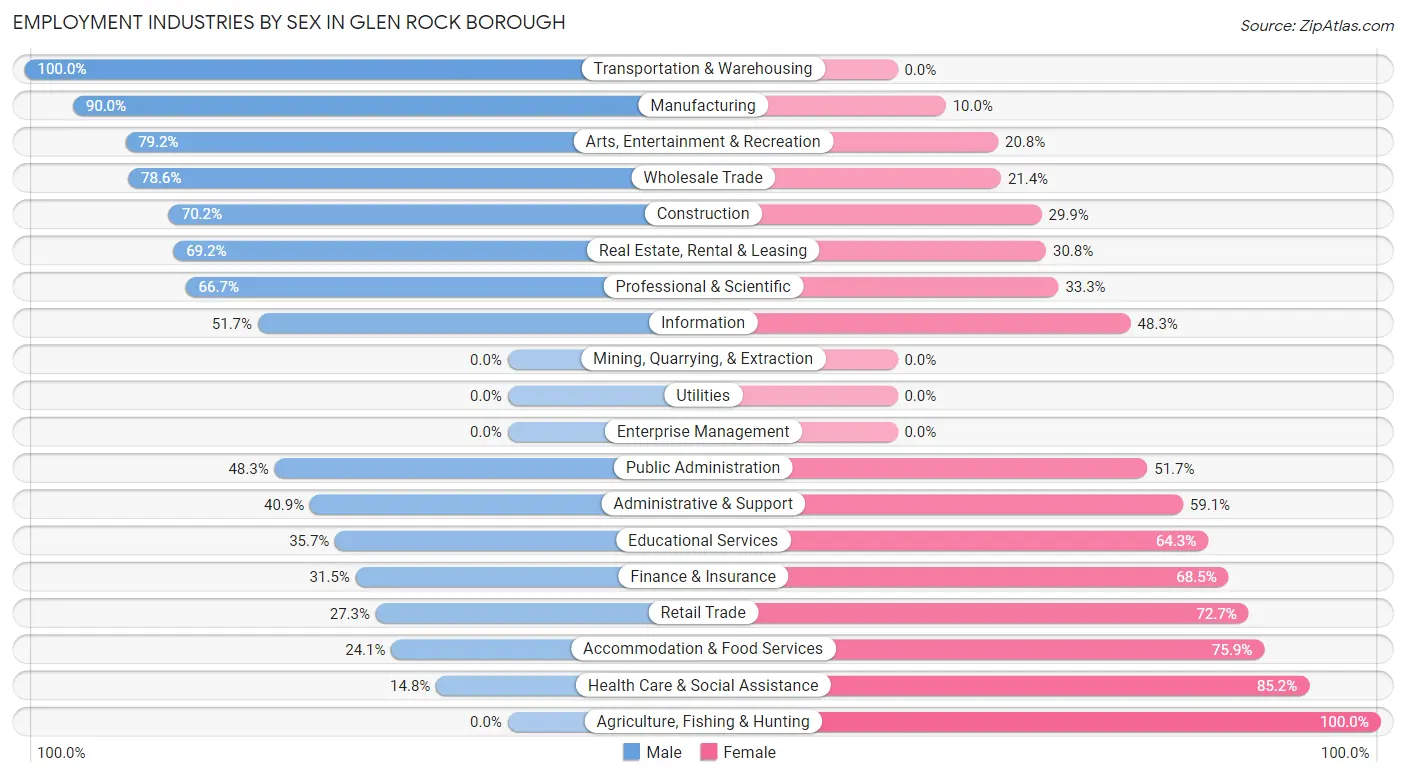
Employment Industries by Sex in Glen Rock borough
The Glen Rock borough industries that see more men than women are Transportation & Warehousing (100.0%), Manufacturing (90.0%), and Arts, Entertainment & Recreation (79.2%), whereas the industries that tend to have a higher number of women are Agriculture, Fishing & Hunting (100.0%), Health Care & Social Assistance (85.2%), and Accommodation & Food Services (75.9%).
| Industry | Male | Female |
| Agriculture, Fishing & Hunting | 0 (0.0%) | 4 (100.0%) |
| Mining, Quarrying, & Extraction | 0 (0.0%) | 0 (0.0%) |
| Construction | 47 (70.2%) | 20 (29.8%) |
| Manufacturing | 81 (90.0%) | 9 (10.0%) |
| Wholesale Trade | 11 (78.6%) | 3 (21.4%) |
| Retail Trade | 71 (27.3%) | 189 (72.7%) |
| Transportation & Warehousing | 12 (100.0%) | 0 (0.0%) |
| Utilities | 0 (0.0%) | 0 (0.0%) |
| Information | 15 (51.7%) | 14 (48.3%) |
| Finance & Insurance | 17 (31.5%) | 37 (68.5%) |
| Real Estate, Rental & Leasing | 18 (69.2%) | 8 (30.8%) |
| Professional & Scientific | 34 (66.7%) | 17 (33.3%) |
| Enterprise Management | 0 (0.0%) | 0 (0.0%) |
| Administrative & Support | 9 (40.9%) | 13 (59.1%) |
| Educational Services | 25 (35.7%) | 45 (64.3%) |
| Health Care & Social Assistance | 32 (14.8%) | 184 (85.2%) |
| Arts, Entertainment & Recreation | 19 (79.2%) | 5 (20.8%) |
| Accommodation & Food Services | 20 (24.1%) | 63 (75.9%) |
| Public Administration | 42 (48.3%) | 45 (51.7%) |
| Total | 467 (41.4%) | 660 (58.6%) |
Education in Glen Rock borough
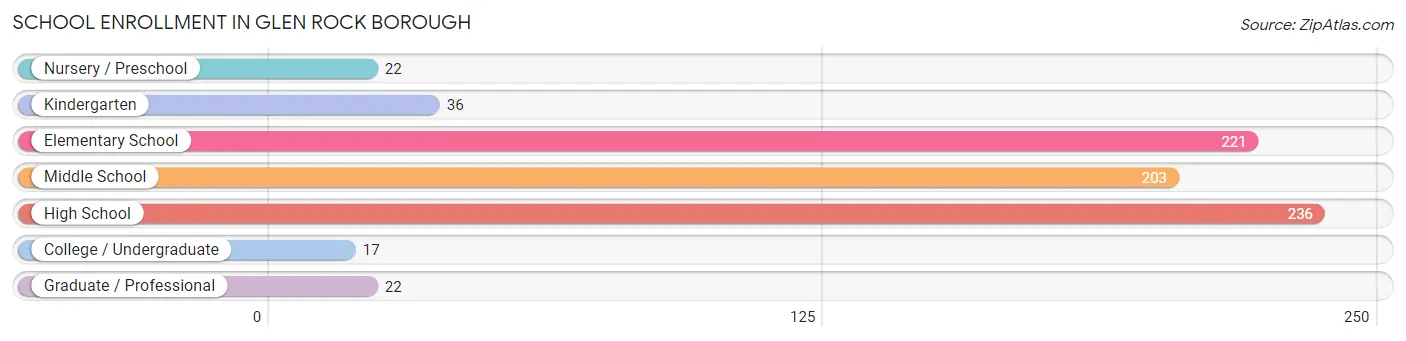
School Enrollment in Glen Rock borough
The most common levels of schooling among the 757 students in Glen Rock borough are high school (236 | 31.2%), elementary school (221 | 29.2%), and middle school (203 | 26.8%).
| School Level | # Students | % Students |
| Nursery / Preschool | 22 | 2.9% |
| Kindergarten | 36 | 4.8% |
| Elementary School | 221 | 29.2% |
| Middle School | 203 | 26.8% |
| High School | 236 | 31.2% |
| College / Undergraduate | 17 | 2.2% |
| Graduate / Professional | 22 | 2.9% |
| Total | 757 | 100.0% |
School Enrollment by Age by Funding Source in Glen Rock borough
Out of a total of 757 students who are enrolled in schools in Glen Rock borough, 34 (4.5%) attend a private institution, while the remaining 723 (95.5%) are enrolled in public schools. The age group of 3 to 4 year olds has the highest likelihood of being enrolled in private schools, with 4 (18.2% in the age bracket) enrolled. Conversely, the age group of 18 to 19 year olds has the lowest likelihood of being enrolled in a private school, with 22 (100.0% in the age bracket) attending a public institution.
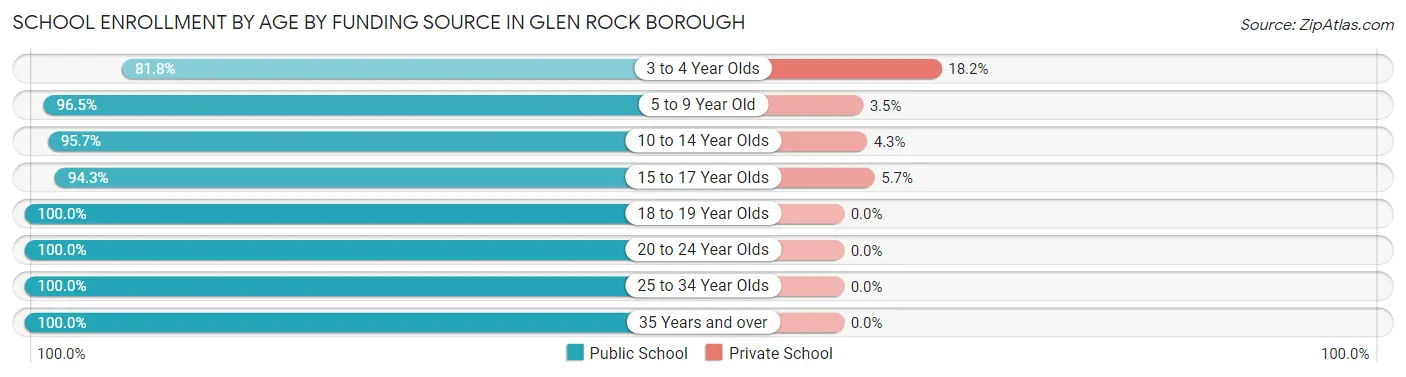
| Age Bracket | Public School | Private School |
| 3 to 4 Year Olds | 18 (81.8%) | 4 (18.2%) |
| 5 to 9 Year Old | 218 (96.5%) | 8 (3.5%) |
| 10 to 14 Year Olds | 244 (95.7%) | 11 (4.3%) |
| 15 to 17 Year Olds | 182 (94.3%) | 11 (5.7%) |
| 18 to 19 Year Olds | 22 (100.0%) | 0 (0.0%) |
| 20 to 24 Year Olds | 11 (100.0%) | 0 (0.0%) |
| 25 to 34 Year Olds | 6 (100.0%) | 0 (0.0%) |
| 35 Years and over | 22 (100.0%) | 0 (0.0%) |
| Total | 723 (95.5%) | 34 (4.5%) |
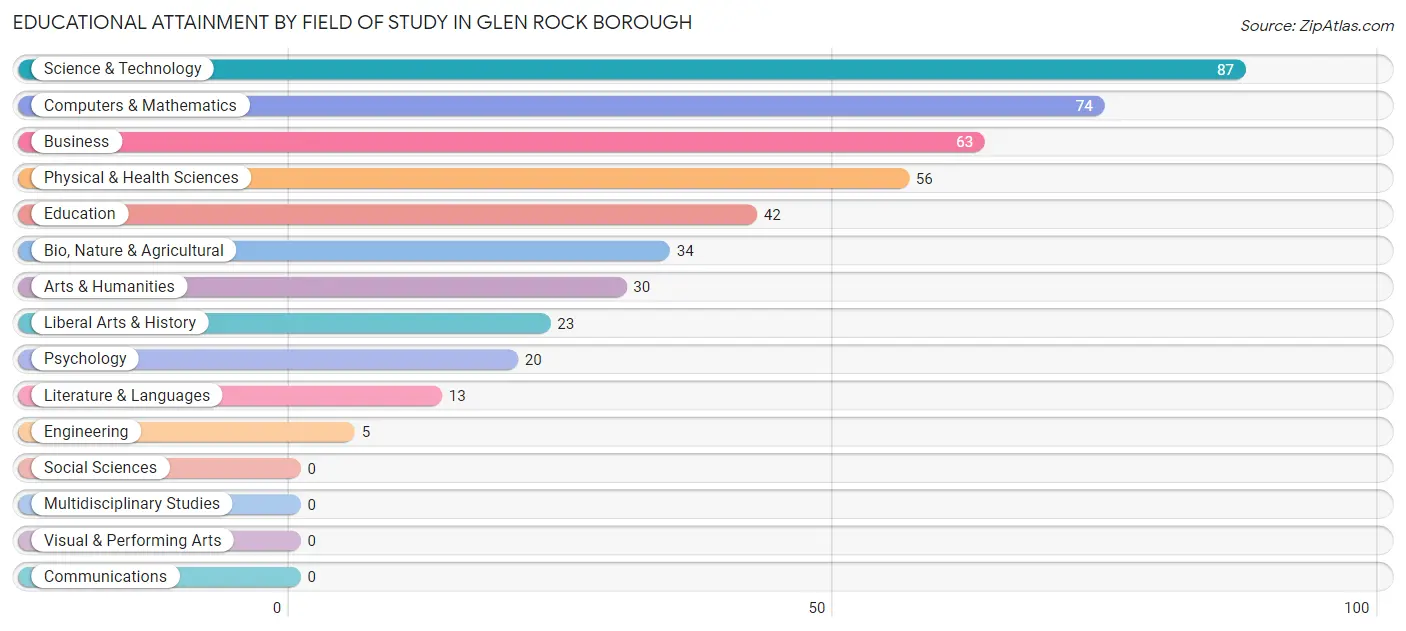
Educational Attainment by Field of Study in Glen Rock borough
Science & technology (87 | 19.5%), computers & mathematics (74 | 16.6%), business (63 | 14.1%), physical & health sciences (56 | 12.5%), and education (42 | 9.4%) are the most common fields of study among 447 individuals in Glen Rock borough who have obtained a bachelor's degree or higher.
| Field of Study | # Graduates | % Graduates |
| Computers & Mathematics | 74 | 16.6% |
| Bio, Nature & Agricultural | 34 | 7.6% |
| Physical & Health Sciences | 56 | 12.5% |
| Psychology | 20 | 4.5% |
| Social Sciences | 0 | 0.0% |
| Engineering | 5 | 1.1% |
| Multidisciplinary Studies | 0 | 0.0% |
| Science & Technology | 87 | 19.5% |
| Business | 63 | 14.1% |
| Education | 42 | 9.4% |
| Literature & Languages | 13 | 2.9% |
| Liberal Arts & History | 23 | 5.1% |
| Visual & Performing Arts | 0 | 0.0% |
| Communications | 0 | 0.0% |
| Arts & Humanities | 30 | 6.7% |
| Total | 447 | 100.0% |
Transportation & Commute in Glen Rock borough
Vehicle Availability by Sex in Glen Rock borough
The most prevalent vehicle ownership categories in Glen Rock borough are males with 2 vehicles (204, accounting for 44.4%) and females with 2 vehicles (173, making up 31.6%).
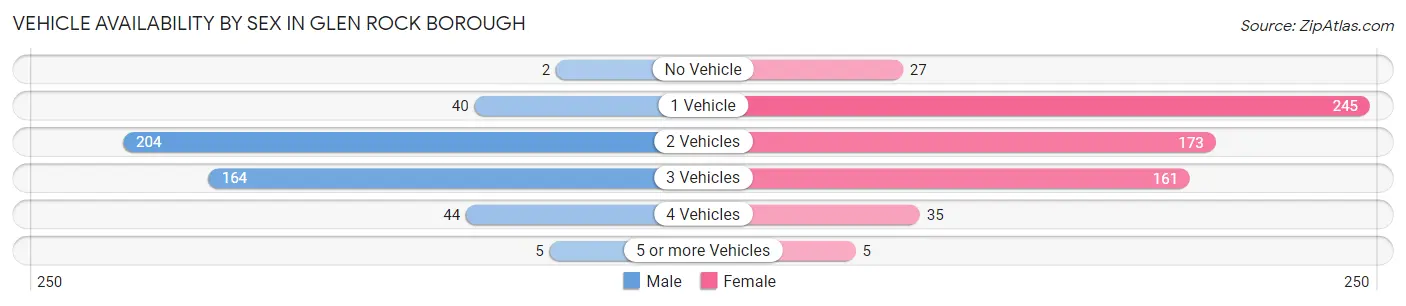
| Vehicles Available | Male | Female |
| No Vehicle | 2 (0.4%) | 27 (4.2%) |
| 1 Vehicle | 40 (8.7%) | 245 (37.9%) |
| 2 Vehicles | 204 (44.4%) | 173 (26.8%) |
| 3 Vehicles | 164 (35.7%) | 161 (24.9%) |
| 4 Vehicles | 44 (9.6%) | 35 (5.4%) |
| 5 or more Vehicles | 5 (1.1%) | 5 (0.8%) |
| Total | 459 (100.0%) | 646 (100.0%) |
Commute Time in Glen Rock borough
The most frequently occuring commute durations in Glen Rock borough are 10 to 14 minutes (257 commuters, 25.2%), 60 to 89 minutes (180 commuters, 17.7%), and 45 to 59 minutes (173 commuters, 17.0%).
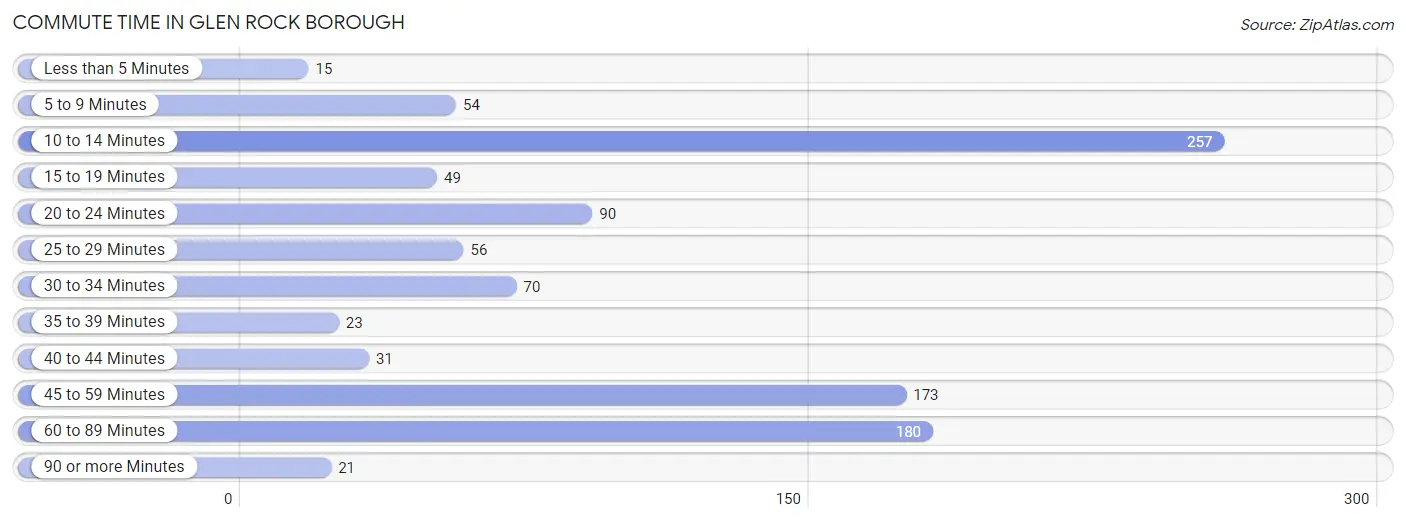
| Commute Time | # Commuters | % Commuters |
| Less than 5 Minutes | 15 | 1.5% |
| 5 to 9 Minutes | 54 | 5.3% |
| 10 to 14 Minutes | 257 | 25.2% |
| 15 to 19 Minutes | 49 | 4.8% |
| 20 to 24 Minutes | 90 | 8.8% |
| 25 to 29 Minutes | 56 | 5.5% |
| 30 to 34 Minutes | 70 | 6.9% |
| 35 to 39 Minutes | 23 | 2.3% |
| 40 to 44 Minutes | 31 | 3.0% |
| 45 to 59 Minutes | 173 | 17.0% |
| 60 to 89 Minutes | 180 | 17.7% |
| 90 or more Minutes | 21 | 2.1% |
Commute Time by Sex in Glen Rock borough
The most common commute times in Glen Rock borough are 45 to 59 minutes (96 commuters, 22.6%) for males and 10 to 14 minutes (193 commuters, 32.5%) for females.
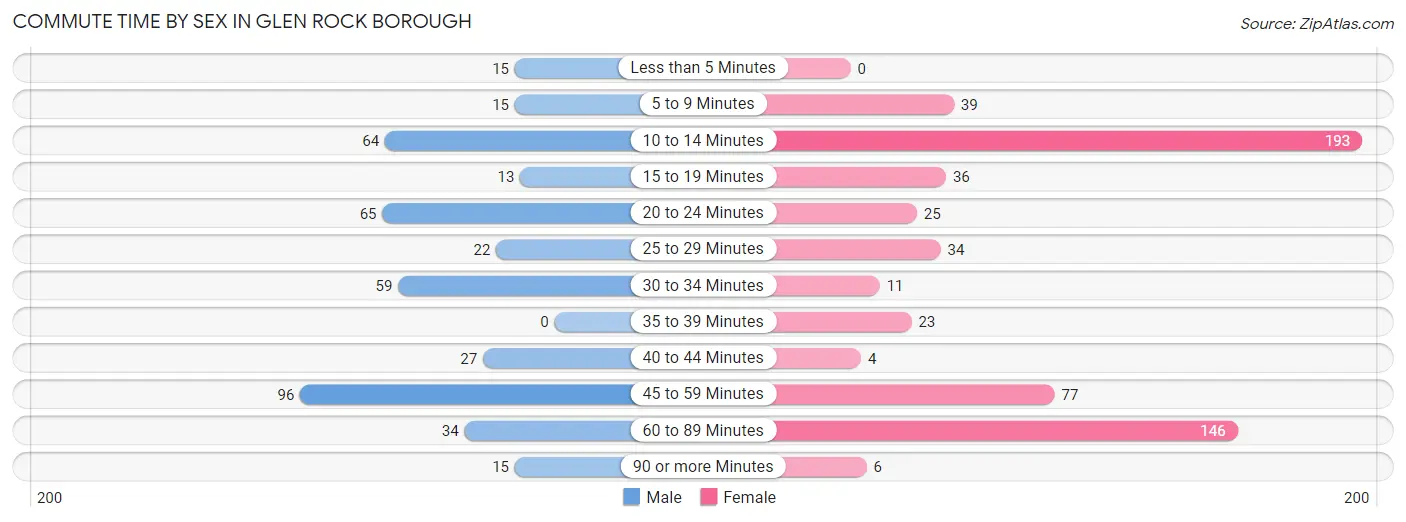
| Commute Time | Male | Female |
| Less than 5 Minutes | 15 (3.5%) | 0 (0.0%) |
| 5 to 9 Minutes | 15 (3.5%) | 39 (6.6%) |
| 10 to 14 Minutes | 64 (15.1%) | 193 (32.5%) |
| 15 to 19 Minutes | 13 (3.1%) | 36 (6.1%) |
| 20 to 24 Minutes | 65 (15.3%) | 25 (4.2%) |
| 25 to 29 Minutes | 22 (5.2%) | 34 (5.7%) |
| 30 to 34 Minutes | 59 (13.9%) | 11 (1.8%) |
| 35 to 39 Minutes | 0 (0.0%) | 23 (3.9%) |
| 40 to 44 Minutes | 27 (6.4%) | 4 (0.7%) |
| 45 to 59 Minutes | 96 (22.6%) | 77 (13.0%) |
| 60 to 89 Minutes | 34 (8.0%) | 146 (24.6%) |
| 90 or more Minutes | 15 (3.5%) | 6 (1.0%) |
Time of Departure to Work by Sex in Glen Rock borough
The most frequent times of departure to work in Glen Rock borough are 6:00 AM to 6:29 AM (103, 24.2%) for males and 7:30 AM to 7:59 AM (147, 24.7%) for females.
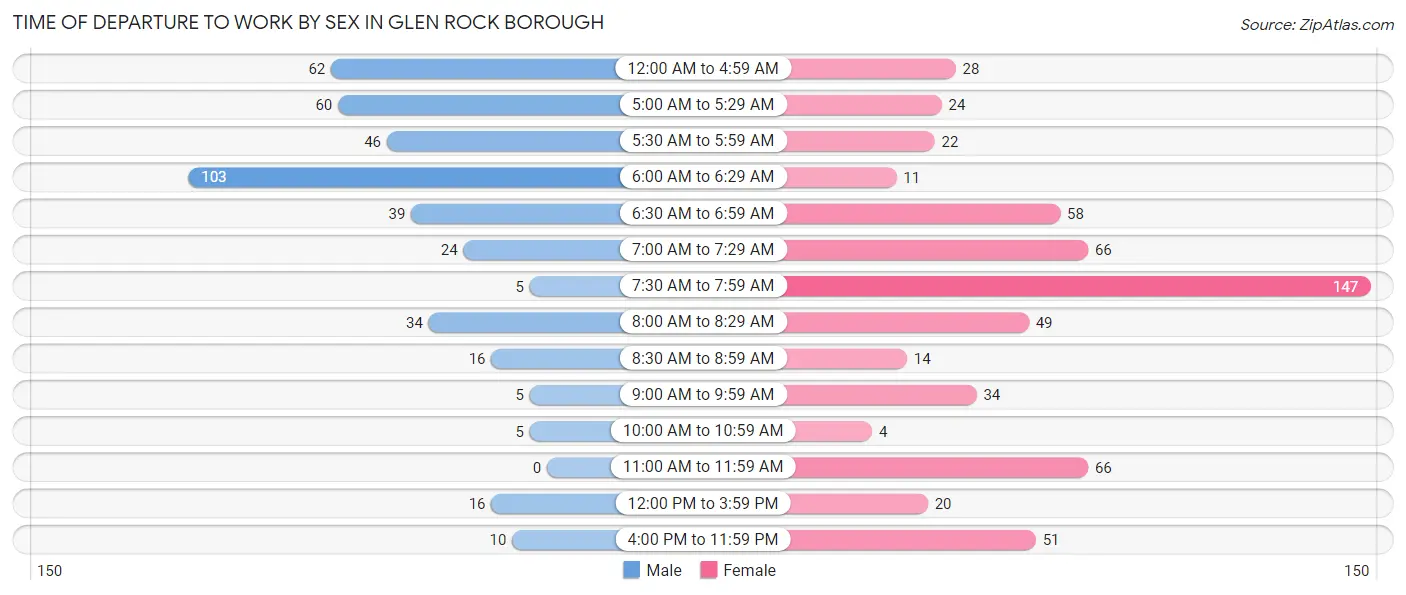
| Time of Departure | Male | Female |
| 12:00 AM to 4:59 AM | 62 (14.6%) | 28 (4.7%) |
| 5:00 AM to 5:29 AM | 60 (14.1%) | 24 (4.0%) |
| 5:30 AM to 5:59 AM | 46 (10.8%) | 22 (3.7%) |
| 6:00 AM to 6:29 AM | 103 (24.2%) | 11 (1.8%) |
| 6:30 AM to 6:59 AM | 39 (9.2%) | 58 (9.8%) |
| 7:00 AM to 7:29 AM | 24 (5.7%) | 66 (11.1%) |
| 7:30 AM to 7:59 AM | 5 (1.2%) | 147 (24.7%) |
| 8:00 AM to 8:29 AM | 34 (8.0%) | 49 (8.3%) |
| 8:30 AM to 8:59 AM | 16 (3.8%) | 14 (2.4%) |
| 9:00 AM to 9:59 AM | 5 (1.2%) | 34 (5.7%) |
| 10:00 AM to 10:59 AM | 5 (1.2%) | 4 (0.7%) |
| 11:00 AM to 11:59 AM | 0 (0.0%) | 66 (11.1%) |
| 12:00 PM to 3:59 PM | 16 (3.8%) | 20 (3.4%) |
| 4:00 PM to 11:59 PM | 10 (2.4%) | 51 (8.6%) |
| Total | 425 (100.0%) | 594 (100.0%) |
Housing Occupancy in Glen Rock borough
Occupancy by Ownership in Glen Rock borough
Of the total 867 dwellings in Glen Rock borough, owner-occupied units account for 444 (51.2%), while renter-occupied units make up 423 (48.8%).
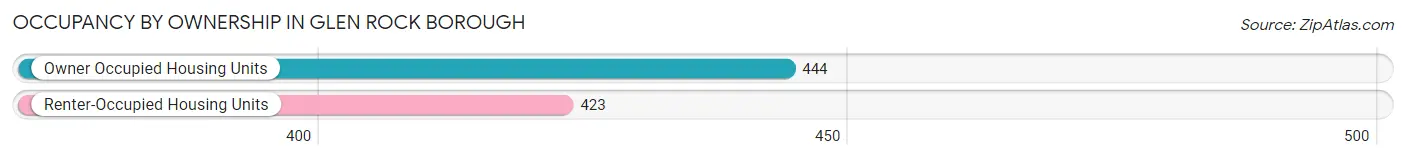
| Occupancy | # Housing Units | % Housing Units |
| Owner Occupied Housing Units | 444 | 51.2% |
| Renter-Occupied Housing Units | 423 | 48.8% |
| Total Occupied Housing Units | 867 | 100.0% |
Occupancy by Household Size in Glen Rock borough
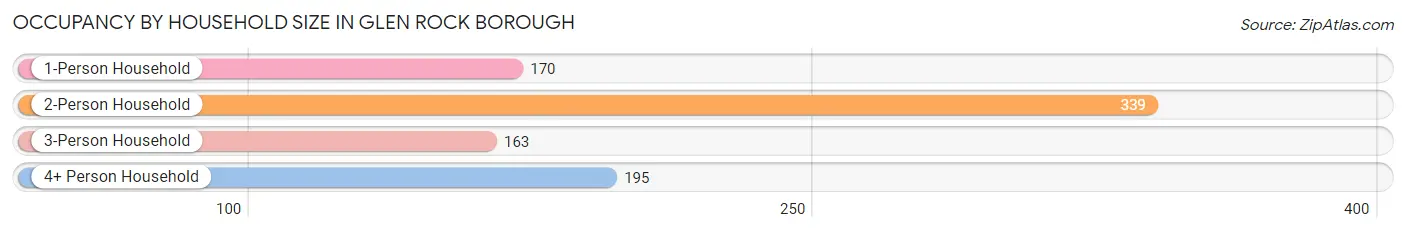
| Household Size | # Housing Units | % Housing Units |
| 1-Person Household | 170 | 19.6% |
| 2-Person Household | 339 | 39.1% |
| 3-Person Household | 163 | 18.8% |
| 4+ Person Household | 195 | 22.5% |
| Total Housing Units | 867 | 100.0% |
Occupancy by Ownership by Household Size in Glen Rock borough
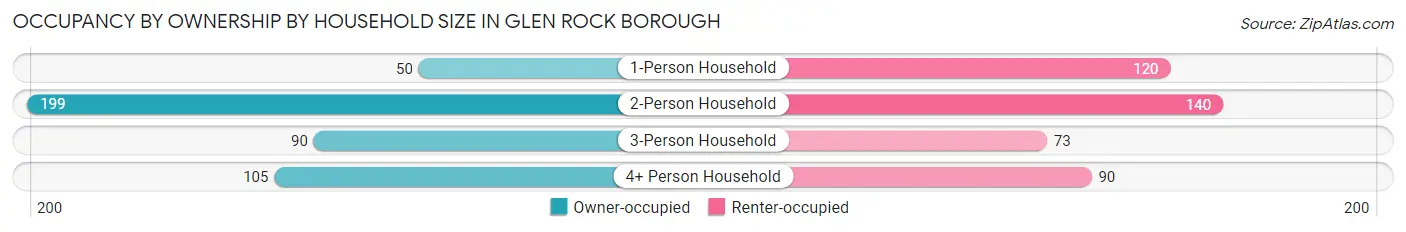
| Household Size | Owner-occupied | Renter-occupied |
| 1-Person Household | 50 (29.4%) | 120 (70.6%) |
| 2-Person Household | 199 (58.7%) | 140 (41.3%) |
| 3-Person Household | 90 (55.2%) | 73 (44.8%) |
| 4+ Person Household | 105 (53.8%) | 90 (46.2%) |
| Total Housing Units | 444 (51.2%) | 423 (48.8%) |
Occupancy by Educational Attainment in Glen Rock borough
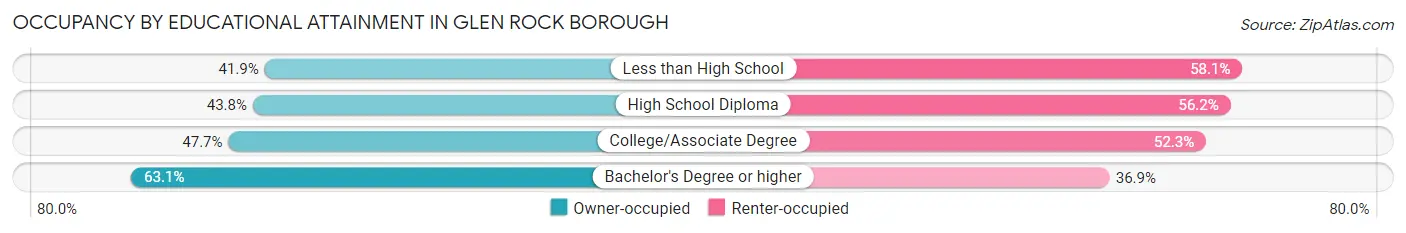
| Household Size | Owner-occupied | Renter-occupied |
| Less than High School | 13 (41.9%) | 18 (58.1%) |
| High School Diploma | 106 (43.8%) | 136 (56.2%) |
| College/Associate Degree | 154 (47.7%) | 169 (52.3%) |
| Bachelor's Degree or higher | 171 (63.1%) | 100 (36.9%) |
Occupancy by Age of Householder in Glen Rock borough
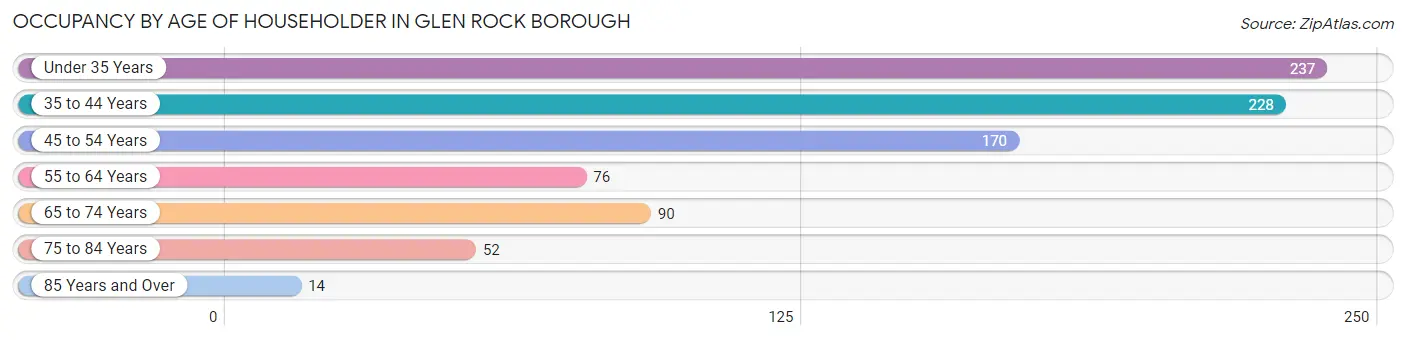
| Age Bracket | # Households | % Households |
| Under 35 Years | 237 | 27.3% |
| 35 to 44 Years | 228 | 26.3% |
| 45 to 54 Years | 170 | 19.6% |
| 55 to 64 Years | 76 | 8.8% |
| 65 to 74 Years | 90 | 10.4% |
| 75 to 84 Years | 52 | 6.0% |
| 85 Years and Over | 14 | 1.6% |
| Total | 867 | 100.0% |
Housing Finances in Glen Rock borough
Median Income by Occupancy in Glen Rock borough
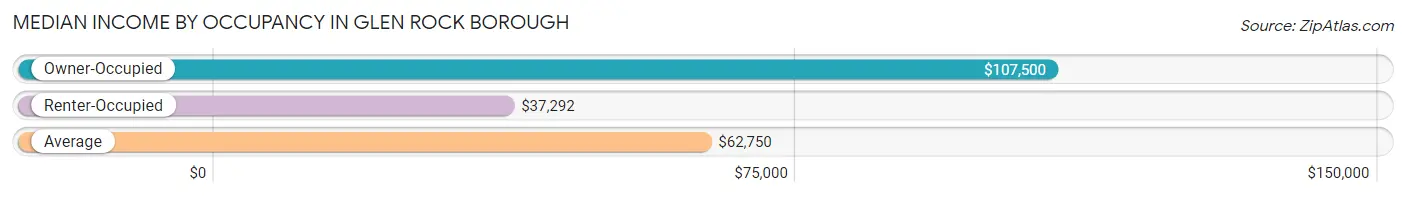
| Occupancy Type | # Households | Median Income |
| Owner-Occupied | 444 (51.2%) | $107,500 |
| Renter-Occupied | 423 (48.8%) | $37,292 |
| Average | 867 (100.0%) | $62,750 |
Occupancy by Householder Income Bracket in Glen Rock borough
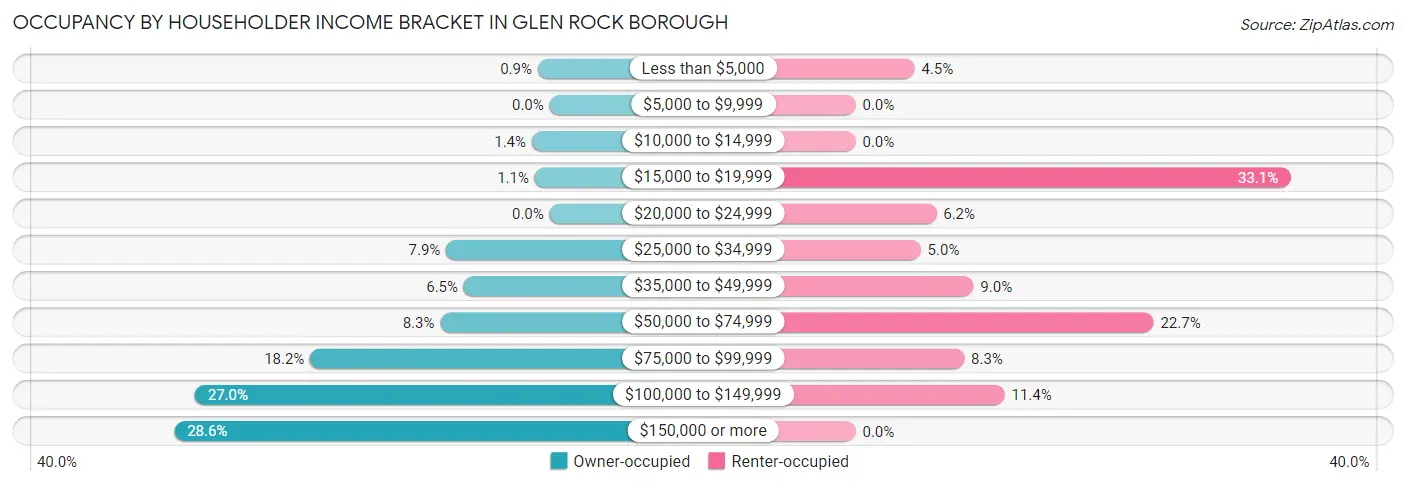
| Income Bracket | Owner-occupied | Renter-occupied |
| Less than $5,000 | 4 (0.9%) | 19 (4.5%) |
| $5,000 to $9,999 | 0 (0.0%) | 0 (0.0%) |
| $10,000 to $14,999 | 6 (1.3%) | 0 (0.0%) |
| $15,000 to $19,999 | 5 (1.1%) | 140 (33.1%) |
| $20,000 to $24,999 | 0 (0.0%) | 26 (6.1%) |
| $25,000 to $34,999 | 35 (7.9%) | 21 (5.0%) |
| $35,000 to $49,999 | 29 (6.5%) | 38 (9.0%) |
| $50,000 to $74,999 | 37 (8.3%) | 96 (22.7%) |
| $75,000 to $99,999 | 81 (18.2%) | 35 (8.3%) |
| $100,000 to $149,999 | 120 (27.0%) | 48 (11.4%) |
| $150,000 or more | 127 (28.6%) | 0 (0.0%) |
| Total | 444 (100.0%) | 423 (100.0%) |
Monthly Housing Cost Tiers in Glen Rock borough
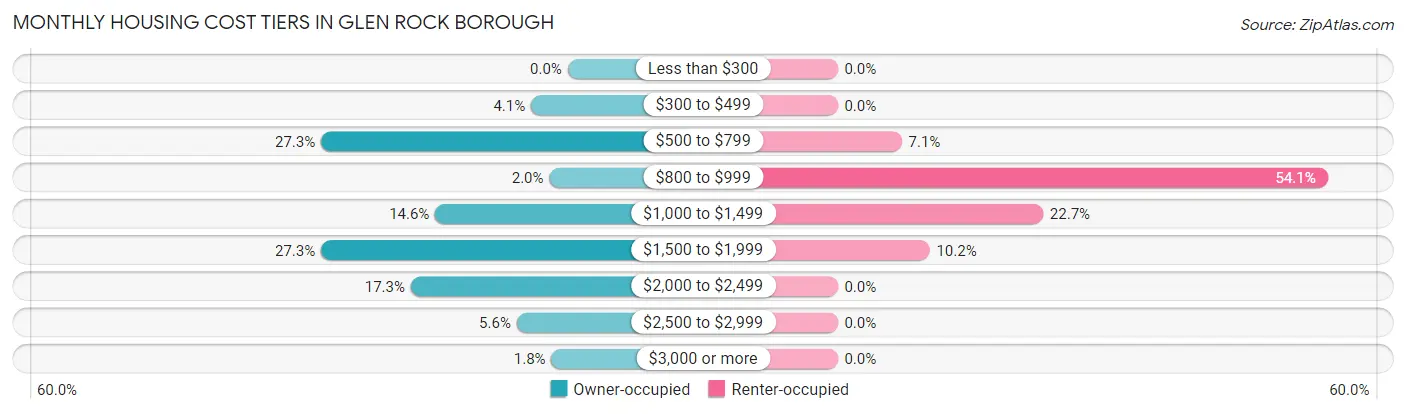
| Monthly Cost | Owner-occupied | Renter-occupied |
| Less than $300 | 0 (0.0%) | 0 (0.0%) |
| $300 to $499 | 18 (4.1%) | 0 (0.0%) |
| $500 to $799 | 121 (27.3%) | 30 (7.1%) |
| $800 to $999 | 9 (2.0%) | 229 (54.1%) |
| $1,000 to $1,499 | 65 (14.6%) | 96 (22.7%) |
| $1,500 to $1,999 | 121 (27.3%) | 43 (10.2%) |
| $2,000 to $2,499 | 77 (17.3%) | 0 (0.0%) |
| $2,500 to $2,999 | 25 (5.6%) | 0 (0.0%) |
| $3,000 or more | 8 (1.8%) | 0 (0.0%) |
| Total | 444 (100.0%) | 423 (100.0%) |
Physical Housing Characteristics in Glen Rock borough
Housing Structures in Glen Rock borough
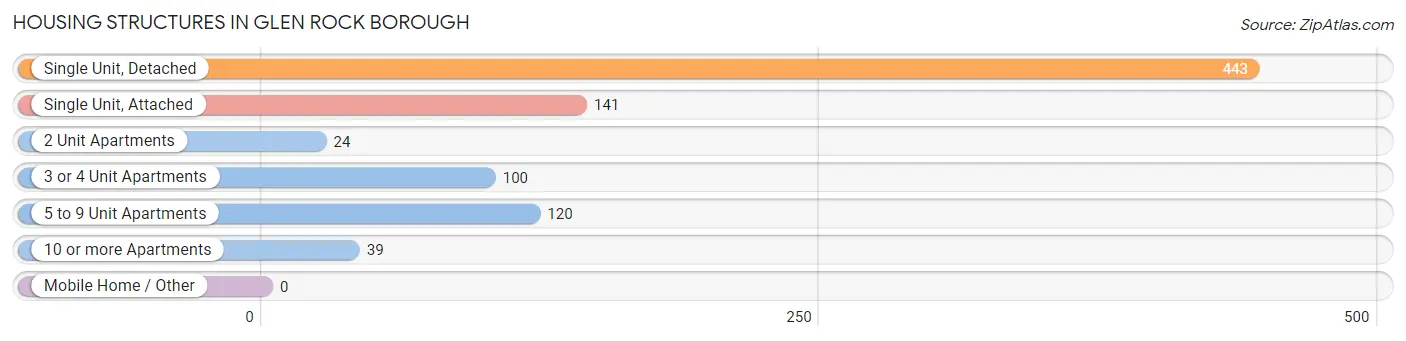
| Structure Type | # Housing Units | % Housing Units |
| Single Unit, Detached | 443 | 51.1% |
| Single Unit, Attached | 141 | 16.3% |
| 2 Unit Apartments | 24 | 2.8% |
| 3 or 4 Unit Apartments | 100 | 11.5% |
| 5 to 9 Unit Apartments | 120 | 13.8% |
| 10 or more Apartments | 39 | 4.5% |
| Mobile Home / Other | 0 | 0.0% |
| Total | 867 | 100.0% |
Housing Structures by Occupancy in Glen Rock borough
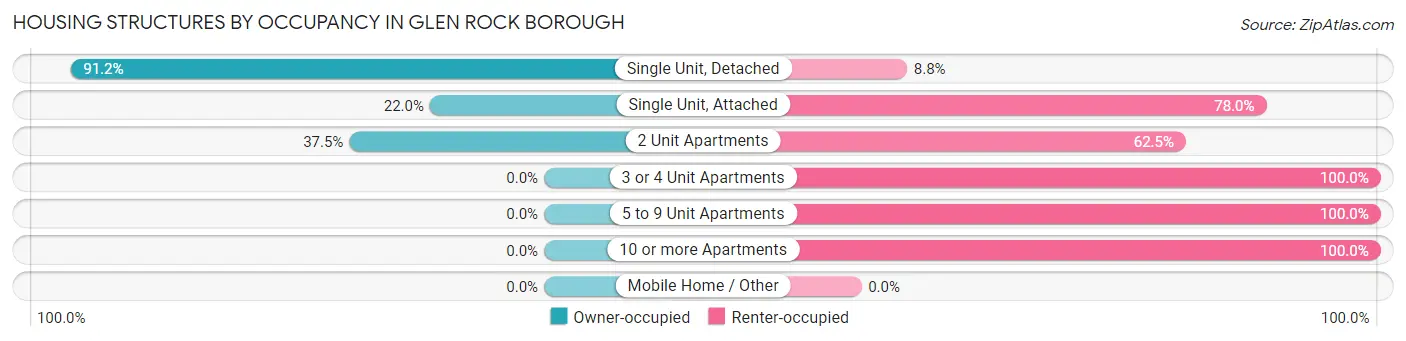
| Structure Type | Owner-occupied | Renter-occupied |
| Single Unit, Detached | 404 (91.2%) | 39 (8.8%) |
| Single Unit, Attached | 31 (22.0%) | 110 (78.0%) |
| 2 Unit Apartments | 9 (37.5%) | 15 (62.5%) |
| 3 or 4 Unit Apartments | 0 (0.0%) | 100 (100.0%) |
| 5 to 9 Unit Apartments | 0 (0.0%) | 120 (100.0%) |
| 10 or more Apartments | 0 (0.0%) | 39 (100.0%) |
| Mobile Home / Other | 0 (0.0%) | 0 (0.0%) |
| Total | 444 (51.2%) | 423 (48.8%) |
Housing Structures by Number of Rooms in Glen Rock borough
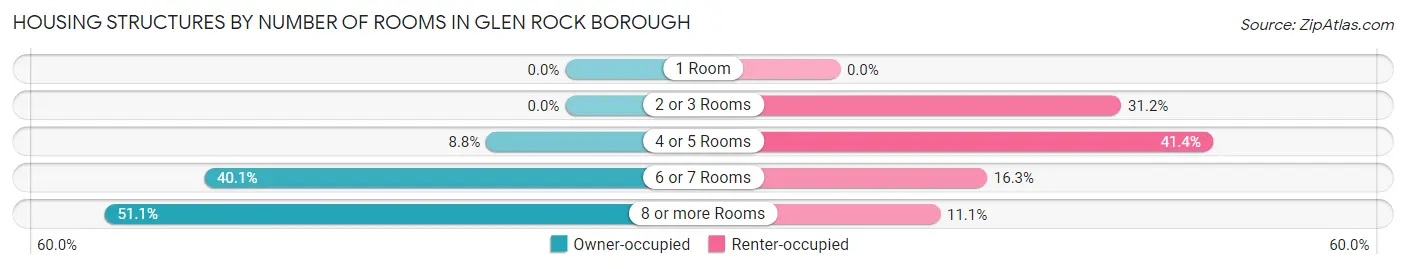
| Number of Rooms | Owner-occupied | Renter-occupied |
| 1 Room | 0 (0.0%) | 0 (0.0%) |
| 2 or 3 Rooms | 0 (0.0%) | 132 (31.2%) |
| 4 or 5 Rooms | 39 (8.8%) | 175 (41.4%) |
| 6 or 7 Rooms | 178 (40.1%) | 69 (16.3%) |
| 8 or more Rooms | 227 (51.1%) | 47 (11.1%) |
| Total | 444 (100.0%) | 423 (100.0%) |
Housing Structure by Heating Type in Glen Rock borough
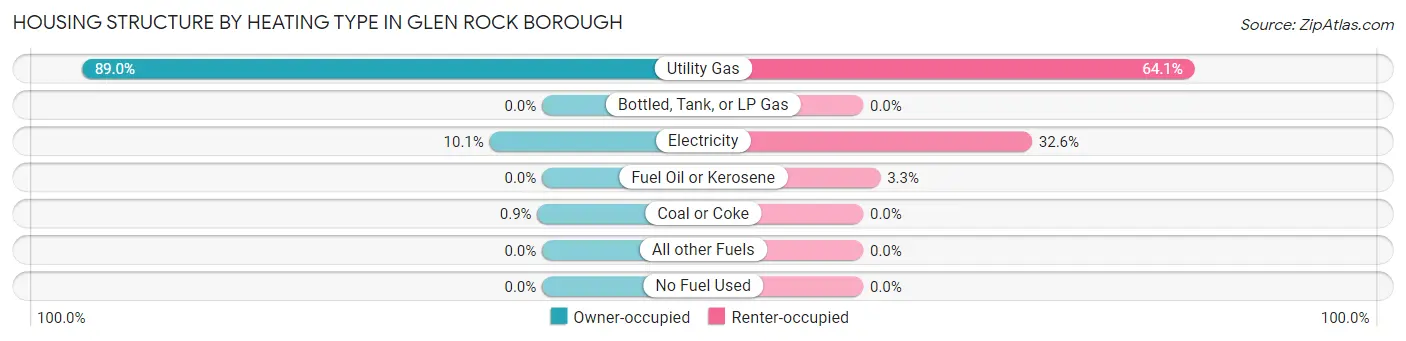
| Heating Type | Owner-occupied | Renter-occupied |
| Utility Gas | 395 (89.0%) | 271 (64.1%) |
| Bottled, Tank, or LP Gas | 0 (0.0%) | 0 (0.0%) |
| Electricity | 45 (10.1%) | 138 (32.6%) |
| Fuel Oil or Kerosene | 0 (0.0%) | 14 (3.3%) |
| Coal or Coke | 4 (0.9%) | 0 (0.0%) |
| All other Fuels | 0 (0.0%) | 0 (0.0%) |
| No Fuel Used | 0 (0.0%) | 0 (0.0%) |
| Total | 444 (100.0%) | 423 (100.0%) |
Household Vehicle Usage in Glen Rock borough
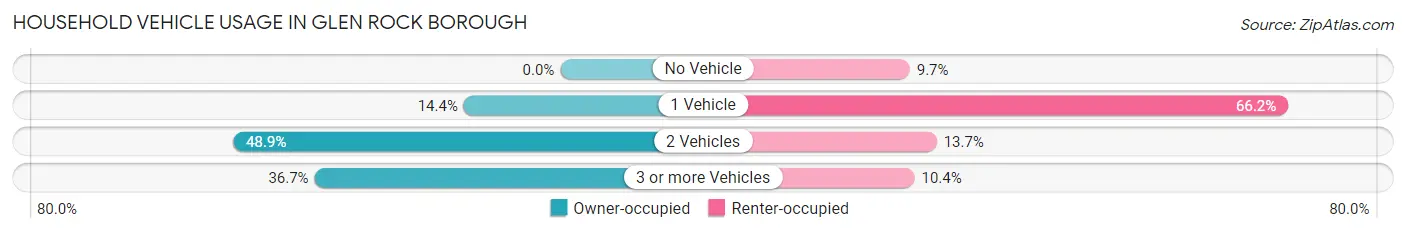
| Vehicles per Household | Owner-occupied | Renter-occupied |
| No Vehicle | 0 (0.0%) | 41 (9.7%) |
| 1 Vehicle | 64 (14.4%) | 280 (66.2%) |
| 2 Vehicles | 217 (48.9%) | 58 (13.7%) |
| 3 or more Vehicles | 163 (36.7%) | 44 (10.4%) |
| Total | 444 (100.0%) | 423 (100.0%) |
Real Estate & Mortgages in Glen Rock borough
Real Estate and Mortgage Overview in Glen Rock borough
| Characteristic | Without Mortgage | With Mortgage |
| Housing Units | 139 | 305 |
| Median Property Value | $205,000 | $231,000 |
| Median Household Income | $55,417 | $108 |
| Monthly Housing Costs | $661 | $8 |
| Real Estate Taxes | $3,875 | $0 |
Property Value by Mortgage Status in Glen Rock borough
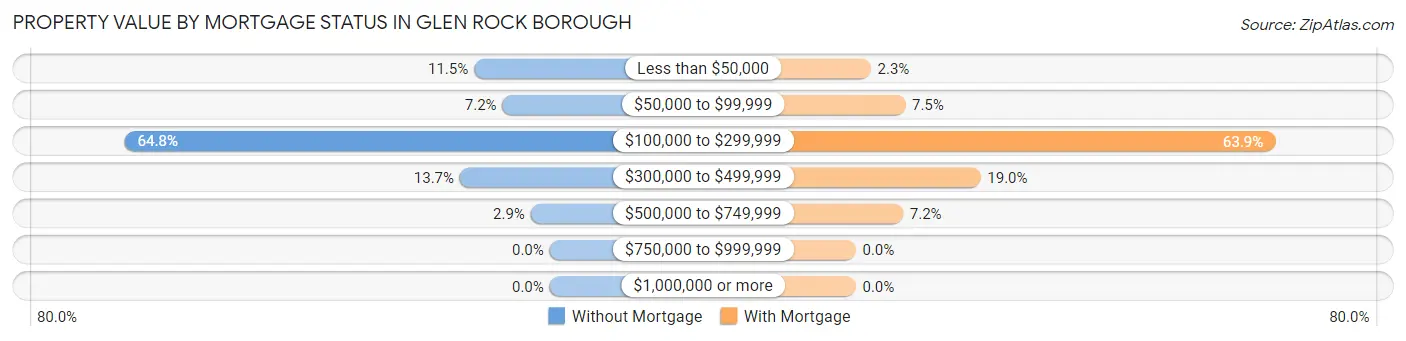
| Property Value | Without Mortgage | With Mortgage |
| Less than $50,000 | 16 (11.5%) | 7 (2.3%) |
| $50,000 to $99,999 | 10 (7.2%) | 23 (7.5%) |
| $100,000 to $299,999 | 90 (64.7%) | 195 (63.9%) |
| $300,000 to $499,999 | 19 (13.7%) | 58 (19.0%) |
| $500,000 to $749,999 | 4 (2.9%) | 22 (7.2%) |
| $750,000 to $999,999 | 0 (0.0%) | 0 (0.0%) |
| $1,000,000 or more | 0 (0.0%) | 0 (0.0%) |
| Total | 139 (100.0%) | 305 (100.0%) |
Household Income by Mortgage Status in Glen Rock borough
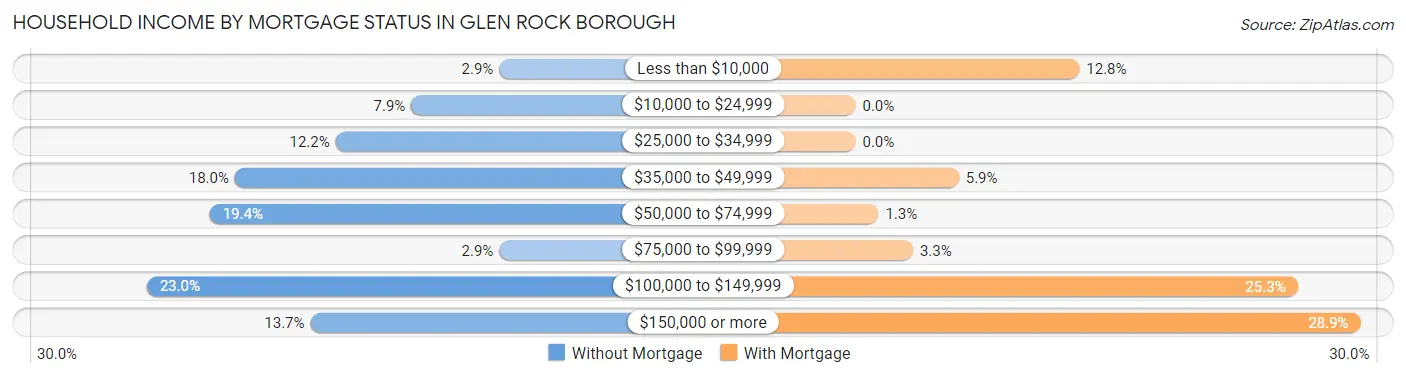
| Household Income | Without Mortgage | With Mortgage |
| Less than $10,000 | 4 (2.9%) | 39 (12.8%) |
| $10,000 to $24,999 | 11 (7.9%) | 0 (0.0%) |
| $25,000 to $34,999 | 17 (12.2%) | 0 (0.0%) |
| $35,000 to $49,999 | 25 (18.0%) | 18 (5.9%) |
| $50,000 to $74,999 | 27 (19.4%) | 4 (1.3%) |
| $75,000 to $99,999 | 4 (2.9%) | 10 (3.3%) |
| $100,000 to $149,999 | 32 (23.0%) | 77 (25.3%) |
| $150,000 or more | 19 (13.7%) | 88 (28.8%) |
| Total | 139 (100.0%) | 305 (100.0%) |
Property Value to Household Income Ratio in Glen Rock borough
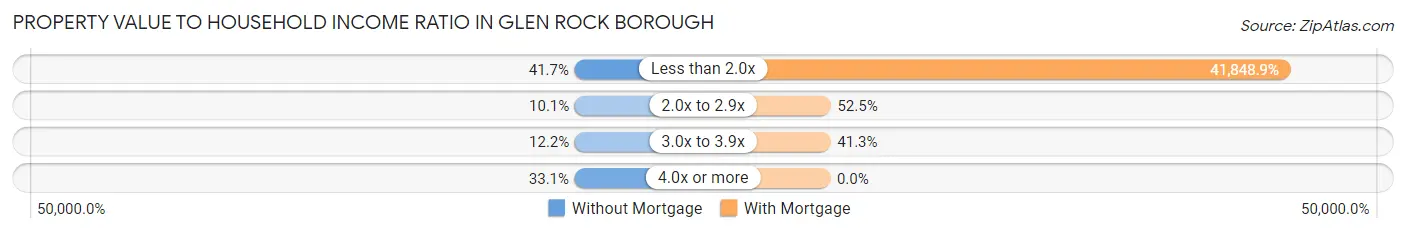
| Value-to-Income Ratio | Without Mortgage | With Mortgage |
| Less than 2.0x | 58 (41.7%) | 127,639 (41,848.8%) |
| 2.0x to 2.9x | 14 (10.1%) | 160 (52.5%) |
| 3.0x to 3.9x | 17 (12.2%) | 126 (41.3%) |
| 4.0x or more | 46 (33.1%) | 0 (0.0%) |
| Total | 139 (100.0%) | 305 (100.0%) |
Real Estate Taxes by Mortgage Status in Glen Rock borough
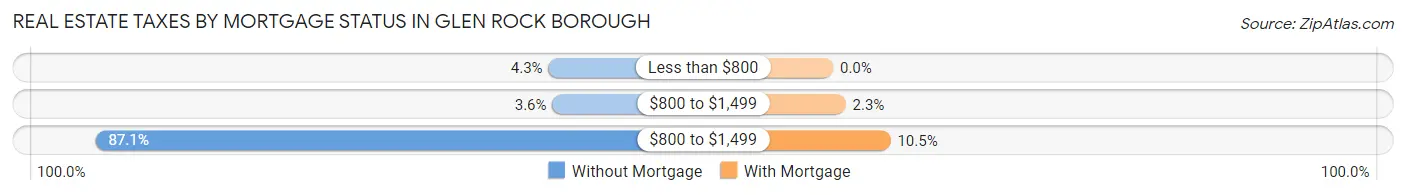
| Property Taxes | Without Mortgage | With Mortgage |
| Less than $800 | 6 (4.3%) | 0 (0.0%) |
| $800 to $1,499 | 5 (3.6%) | 7 (2.3%) |
| $800 to $1,499 | 121 (87.1%) | 32 (10.5%) |
| Total | 139 (100.0%) | 305 (100.0%) |
Health & Disability in Glen Rock borough
Health Insurance Coverage by Age in Glen Rock borough
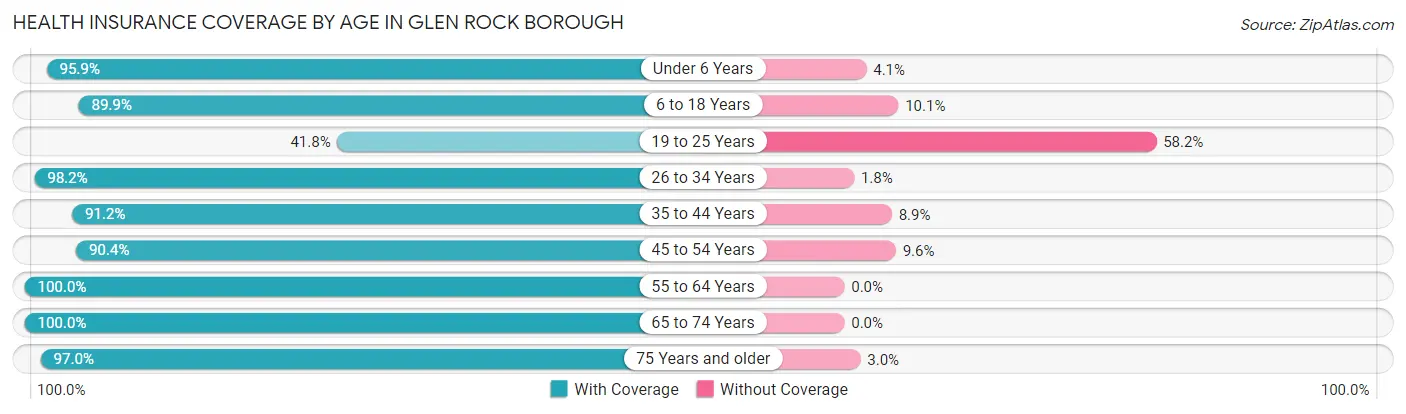
| Age Bracket | With Coverage | Without Coverage |
| Under 6 Years | 187 (95.9%) | 8 (4.1%) |
| 6 to 18 Years | 608 (89.9%) | 68 (10.1%) |
| 19 to 25 Years | 59 (41.8%) | 82 (58.2%) |
| 26 to 34 Years | 272 (98.2%) | 5 (1.8%) |
| 35 to 44 Years | 371 (91.1%) | 36 (8.8%) |
| 45 to 54 Years | 264 (90.4%) | 28 (9.6%) |
| 55 to 64 Years | 140 (100.0%) | 0 (0.0%) |
| 65 to 74 Years | 136 (100.0%) | 0 (0.0%) |
| 75 Years and older | 97 (97.0%) | 3 (3.0%) |
| Total | 2,134 (90.3%) | 230 (9.7%) |
Health Insurance Coverage by Citizenship Status in Glen Rock borough
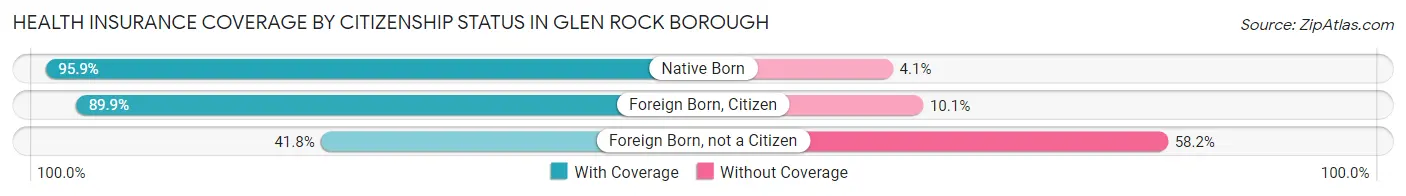
| Citizenship Status | With Coverage | Without Coverage |
| Native Born | 187 (95.9%) | 8 (4.1%) |
| Foreign Born, Citizen | 608 (89.9%) | 68 (10.1%) |
| Foreign Born, not a Citizen | 59 (41.8%) | 82 (58.2%) |
Health Insurance Coverage by Household Income in Glen Rock borough
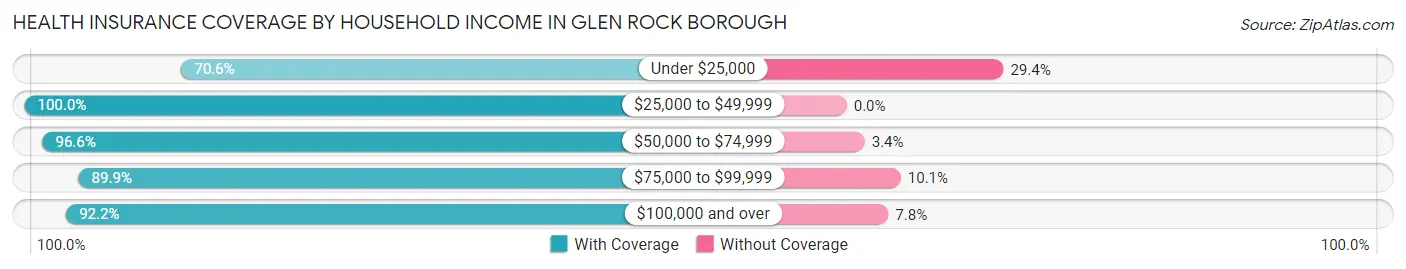
| Household Income | With Coverage | Without Coverage |
| Under $25,000 | 255 (70.6%) | 106 (29.4%) |
| $25,000 to $49,999 | 302 (100.0%) | 0 (0.0%) |
| $50,000 to $74,999 | 344 (96.6%) | 12 (3.4%) |
| $75,000 to $99,999 | 275 (89.9%) | 31 (10.1%) |
| $100,000 and over | 958 (92.2%) | 81 (7.8%) |
Public vs Private Health Insurance Coverage by Age in Glen Rock borough
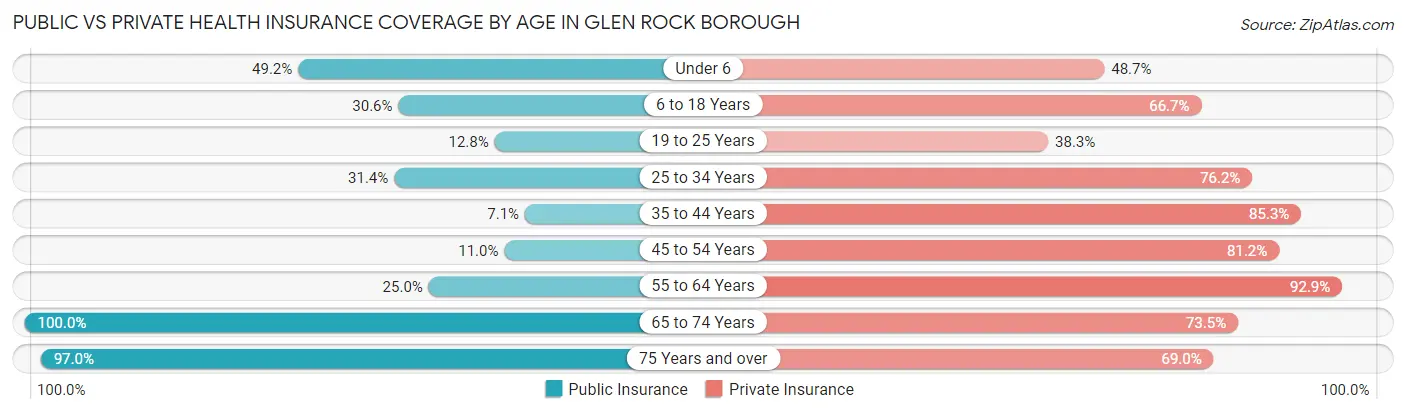
| Age Bracket | Public Insurance | Private Insurance |
| Under 6 | 96 (49.2%) | 95 (48.7%) |
| 6 to 18 Years | 207 (30.6%) | 451 (66.7%) |
| 19 to 25 Years | 18 (12.8%) | 54 (38.3%) |
| 25 to 34 Years | 87 (31.4%) | 211 (76.2%) |
| 35 to 44 Years | 29 (7.1%) | 347 (85.3%) |
| 45 to 54 Years | 32 (11.0%) | 237 (81.2%) |
| 55 to 64 Years | 35 (25.0%) | 130 (92.9%) |
| 65 to 74 Years | 136 (100.0%) | 100 (73.5%) |
| 75 Years and over | 97 (97.0%) | 69 (69.0%) |
| Total | 737 (31.2%) | 1,694 (71.7%) |
Disability Status by Sex by Age in Glen Rock borough
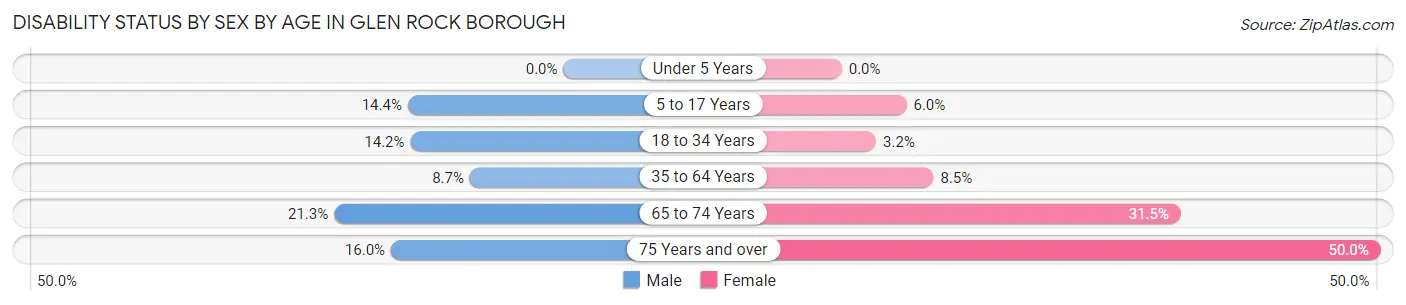
| Age Bracket | Male | Female |
| Under 5 Years | 0 (0.0%) | 0 (0.0%) |
| 5 to 17 Years | 39 (14.4%) | 25 (6.0%) |
| 18 to 34 Years | 23 (14.2%) | 9 (3.2%) |
| 35 to 64 Years | 31 (8.7%) | 41 (8.5%) |
| 65 to 74 Years | 10 (21.3%) | 28 (31.5%) |
| 75 Years and over | 8 (16.0%) | 25 (50.0%) |
Disability Class by Sex by Age in Glen Rock borough
Disability Class: Hearing Difficulty
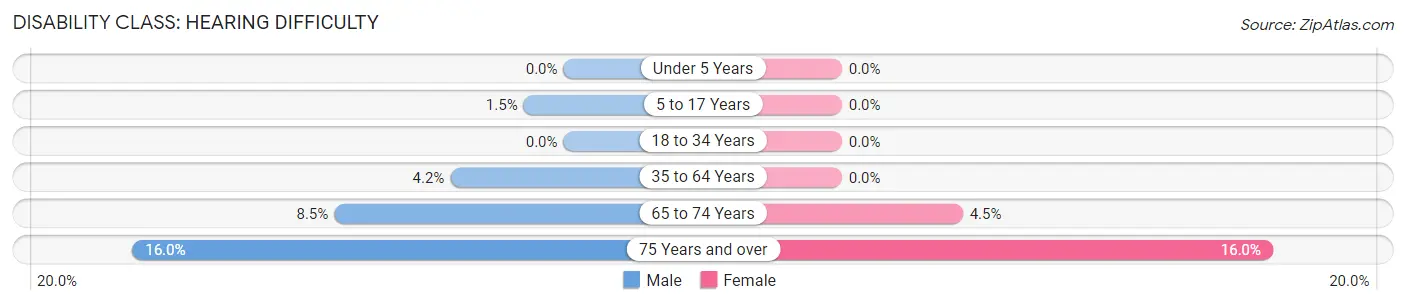
| Age Bracket | Male | Female |
| Under 5 Years | 0 (0.0%) | 0 (0.0%) |
| 5 to 17 Years | 4 (1.5%) | 0 (0.0%) |
| 18 to 34 Years | 0 (0.0%) | 0 (0.0%) |
| 35 to 64 Years | 15 (4.2%) | 0 (0.0%) |
| 65 to 74 Years | 4 (8.5%) | 4 (4.5%) |
| 75 Years and over | 8 (16.0%) | 8 (16.0%) |
Disability Class: Vision Difficulty
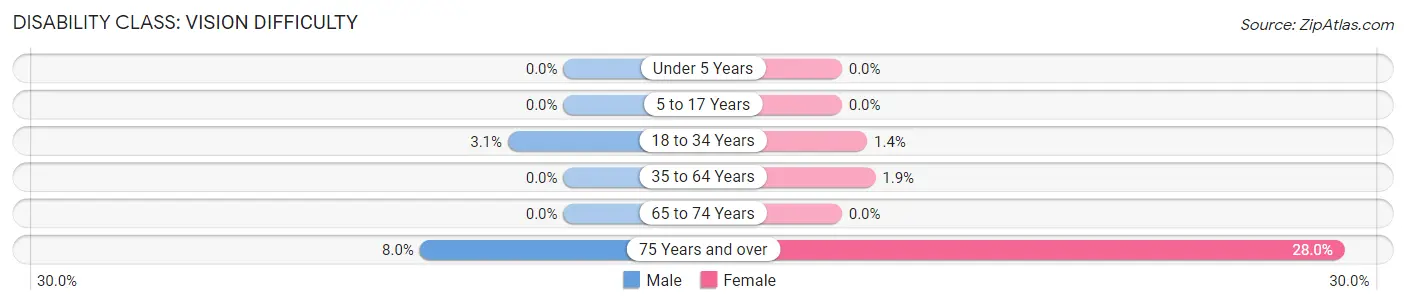
| Age Bracket | Male | Female |
| Under 5 Years | 0 (0.0%) | 0 (0.0%) |
| 5 to 17 Years | 0 (0.0%) | 0 (0.0%) |
| 18 to 34 Years | 5 (3.1%) | 4 (1.4%) |
| 35 to 64 Years | 0 (0.0%) | 9 (1.9%) |
| 65 to 74 Years | 0 (0.0%) | 0 (0.0%) |
| 75 Years and over | 4 (8.0%) | 14 (28.0%) |
Disability Class: Cognitive Difficulty
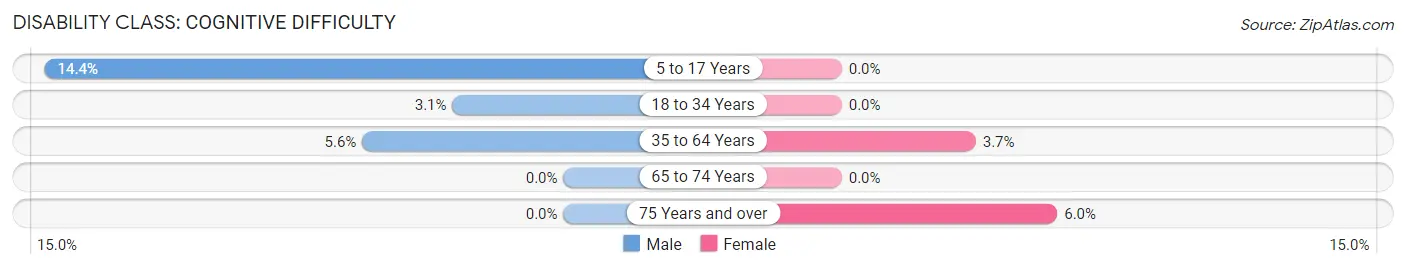
| Age Bracket | Male | Female |
| 5 to 17 Years | 39 (14.4%) | 0 (0.0%) |
| 18 to 34 Years | 5 (3.1%) | 0 (0.0%) |
| 35 to 64 Years | 20 (5.6%) | 18 (3.7%) |
| 65 to 74 Years | 0 (0.0%) | 0 (0.0%) |
| 75 Years and over | 0 (0.0%) | 3 (6.0%) |
Disability Class: Ambulatory Difficulty
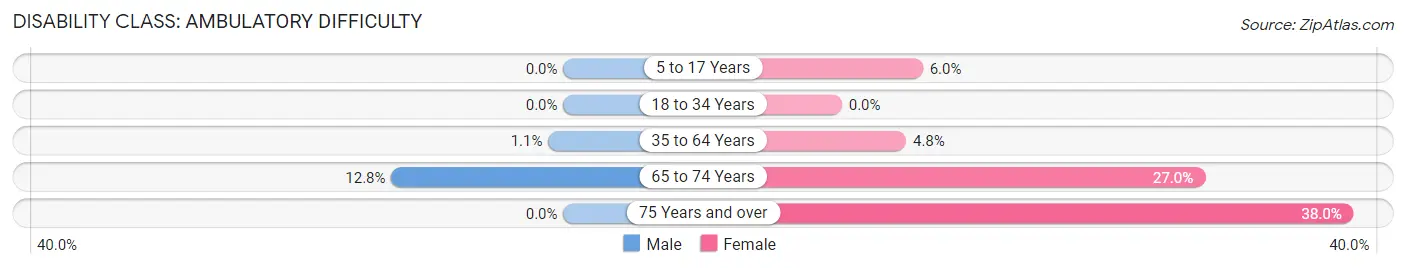
| Age Bracket | Male | Female |
| 5 to 17 Years | 0 (0.0%) | 25 (6.0%) |
| 18 to 34 Years | 0 (0.0%) | 0 (0.0%) |
| 35 to 64 Years | 4 (1.1%) | 23 (4.8%) |
| 65 to 74 Years | 6 (12.8%) | 24 (27.0%) |
| 75 Years and over | 0 (0.0%) | 19 (38.0%) |
Disability Class: Self-Care Difficulty
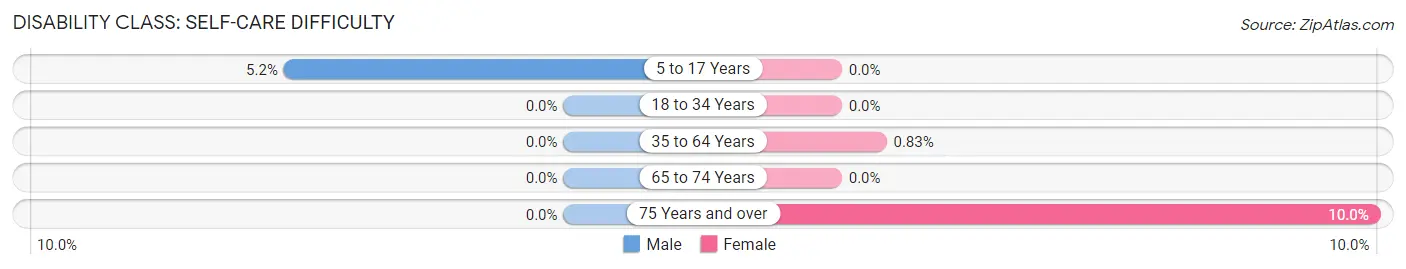
| Age Bracket | Male | Female |
| 5 to 17 Years | 14 (5.2%) | 0 (0.0%) |
| 18 to 34 Years | 0 (0.0%) | 0 (0.0%) |
| 35 to 64 Years | 0 (0.0%) | 4 (0.8%) |
| 65 to 74 Years | 0 (0.0%) | 0 (0.0%) |
| 75 Years and over | 0 (0.0%) | 5 (10.0%) |
Technology Access in Glen Rock borough
Computing Device Access in Glen Rock borough
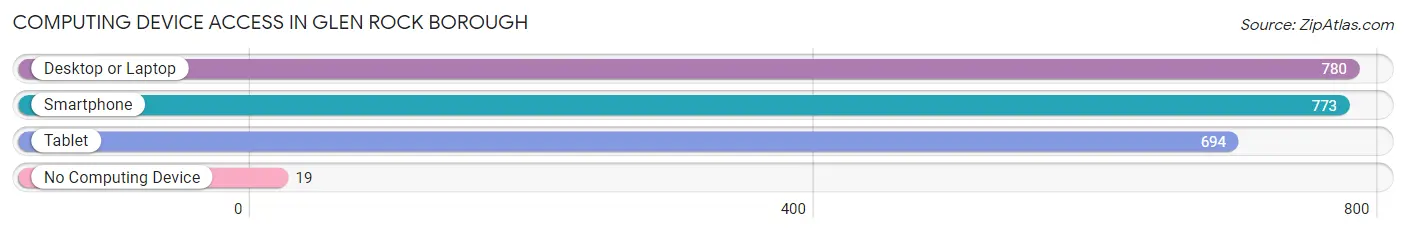
| Device Type | # Households | % Households |
| Desktop or Laptop | 780 | 90.0% |
| Smartphone | 773 | 89.2% |
| Tablet | 694 | 80.0% |
| No Computing Device | 19 | 2.2% |
| Total | 867 | 100.0% |
Internet Access in Glen Rock borough
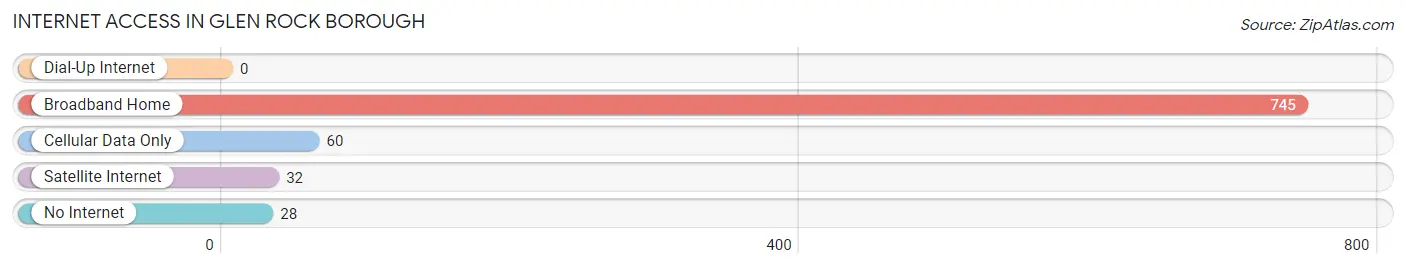
| Internet Type | # Households | % Households |
| Dial-Up Internet | 0 | 0.0% |
| Broadband Home | 745 | 85.9% |
| Cellular Data Only | 60 | 6.9% |
| Satellite Internet | 32 | 3.7% |
| No Internet | 28 | 3.2% |
| Total | 867 | 100.0% |
Glen Rock borough Summary
Glen Rock Borough is a small borough located in York County, Pennsylvania. It is situated in the southeastern corner of the county, approximately 20 miles south of the state capital of Harrisburg. The borough is bordered by the townships of North Codorus, Manheim, and Shrewsbury. As of the 2010 census, the population of Glen Rock was 2,417.
History
Glen Rock was first settled in 1750 by a group of German immigrants. The town was originally known as “Glenrock” and was part of the larger township of North Codorus. In 1854, the town was officially incorporated as the Borough of Glen Rock.
The town was named after a large rock formation located in the center of town. The formation was said to resemble a large glen, or valley, and was a popular spot for picnics and other outdoor activities.
The town grew steadily throughout the 19th century, and by the early 20th century, it had become a popular summer resort destination. The town was home to several hotels, a trolley line, and a large amusement park.
Geography
Glen Rock is located at 39°45'N 76°45'W (39.75, -76.75). According to the United States Census Bureau, the borough has a total area of 0.9 square miles (2.3 km2), all of it land.
The borough is located in the Piedmont region of Pennsylvania, and is surrounded by rolling hills and farmland. The town is situated along the Codorus Creek, which flows through the center of town.
Economy
The economy of Glen Rock is largely based on agriculture and tourism. The town is home to several small businesses, including a grocery store, a hardware store, and a few restaurants.
The town is also home to several small manufacturing companies, including a furniture factory and a printing company.
Demographics
As of the 2010 census, there were 2,417 people, 990 households, and 645 families residing in the borough. The population density was 2,637.3 people per square mile (1,017.2/km2). There were 1,053 housing units at an average density of 1,155.3 per square mile (446.2/km2). The racial makeup of the borough was 97.2% White, 0.7% African American, 0.2% Native American, 0.4% Asian, 0.2% from other races, and 1.3% from two or more races. Hispanic or Latino of any race were 1.2% of the population.
There were 990 households, out of which 28.2% had children under the age of 18 living with them, 51.2% were married couples living together, 10.2% had a female householder with no husband present, and 34.2% were non-families. 29.3% of all households were made up of individuals, and 14.2% had someone living alone who was 65 years of age or older. The average household size was 2.44 and the average family size was 3.02.
In the borough, the population was spread out, with 23.7% under the age of 18, 6.7% from 18 to 24, 28.2% from 25 to 44, 24.2% from 45 to 64, and 17.2% who were 65 years of age or older. The median age was 40 years. For every 100 females, there were 92.2 males. For every 100 females age 18 and over, there were 88.3 males.
The median income for a household in the borough was $41,250, and the median income for a family was $50,000. Males had a median income of $35,000 versus $25,000 for females. The per capita income for the borough was $20,945. About 4.3% of families and 6.2% of the population were below the poverty line, including 8.2% of those under age 18 and 5.2% of those age 65 or over.
Common Questions
What is Per Capita Income in Glen Rock borough?
Per Capita income in Glen Rock borough is $31,470.
What is the Median Family Income in Glen Rock borough?
Median Family Income in Glen Rock borough is $83,000.
What is the Median Household income in Glen Rock borough?
Median Household Income in Glen Rock borough is $62,750.
What is Income or Wage Gap in Glen Rock borough?
Income or Wage Gap in Glen Rock borough is 38.1%.
Women in Glen Rock borough earn 61.9 cents for every dollar earned by a man.
What is Inequality or Gini Index in Glen Rock borough?
Inequality or Gini Index in Glen Rock borough is 0.43.
What is the Total Population of Glen Rock borough?
Total Population of Glen Rock borough is 2,364.
What is the Total Male Population of Glen Rock borough?
Total Male Population of Glen Rock borough is 934.
What is the Total Female Population of Glen Rock borough?
Total Female Population of Glen Rock borough is 1,430.
What is the Ratio of Males per 100 Females in Glen Rock borough?
There are 65.31 Males per 100 Females in Glen Rock borough.
What is the Ratio of Females per 100 Males in Glen Rock borough?
There are 153.10 Females per 100 Males in Glen Rock borough.
What is the Median Population Age in Glen Rock borough?
Median Population Age in Glen Rock borough is 32.5 Years.
What is the Average Family Size in Glen Rock borough
Average Family Size in Glen Rock borough is 3.1 People.
What is the Average Household Size in Glen Rock borough
Average Household Size in Glen Rock borough is 2.7 People.
How Large is the Labor Force in Glen Rock borough?
There are 1,268 People in the Labor Forcein in Glen Rock borough.
What is the Percentage of People in the Labor Force in Glen Rock borough?
75.2% of People are in the Labor Force in Glen Rock borough.
What is the Unemployment Rate in Glen Rock borough?
Unemployment Rate in Glen Rock borough is 11.1%.