Luzerne borough, PA Map & Demographics
Luzerne borough Overview
$29,488
PER CAPITA INCOME
$52,045
AVG FAMILY INCOME
$39,471
AVG HOUSEHOLD INCOME
26.2%
WAGE / INCOME GAP [ % ]
73.8¢/ $1
WAGE / INCOME GAP [ $ ]
0.46
INEQUALITY / GINI INDEX
2,718
TOTAL POPULATION
1,362
MALE POPULATION
1,356
FEMALE POPULATION
100.44
MALES / 100 FEMALES
99.56
FEMALES / 100 MALES
49.4
MEDIAN AGE
2.8
AVG FAMILY SIZE
1.9
AVG HOUSEHOLD SIZE
1,476
LABOR FORCE [ PEOPLE ]
63.6%
PERCENT IN LABOR FORCE
7.1%
UNEMPLOYMENT RATE
Income in Luzerne borough
Income Overview in Luzerne borough
Per Capita Income in Luzerne borough is $29,488, while median incomes of families and households are $52,045 and $39,471 respectively.
| Characteristic | Number | Measure |
| Per Capita Income | 2,718 | $29,488 |
| Median Family Income | 688 | $52,045 |
| Mean Family Income | 688 | $74,818 |
| Median Household Income | 1,403 | $39,471 |
| Mean Household Income | 1,403 | $56,669 |
| Income Deficit | 688 | $0 |
| Wage / Income Gap (%) | 2,718 | 26.23% |
| Wage / Income Gap ($) | 2,718 | 73.77¢ per $1 |
| Gini / Inequality Index | 2,718 | 0.46 |
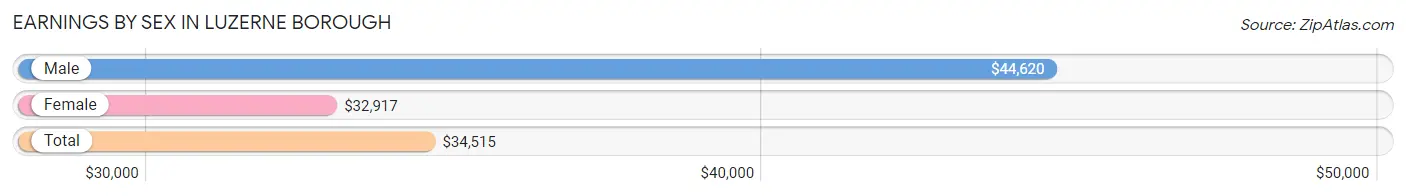
Earnings by Sex in Luzerne borough
Average Earnings in Luzerne borough are $34,515, $44,620 for men and $32,917 for women, a difference of 26.2%.
| Sex | Number | Average Earnings |
| Male | 791 (51.9%) | $44,620 |
| Female | 733 (48.1%) | $32,917 |
| Total | 1,524 (100.0%) | $34,515 |
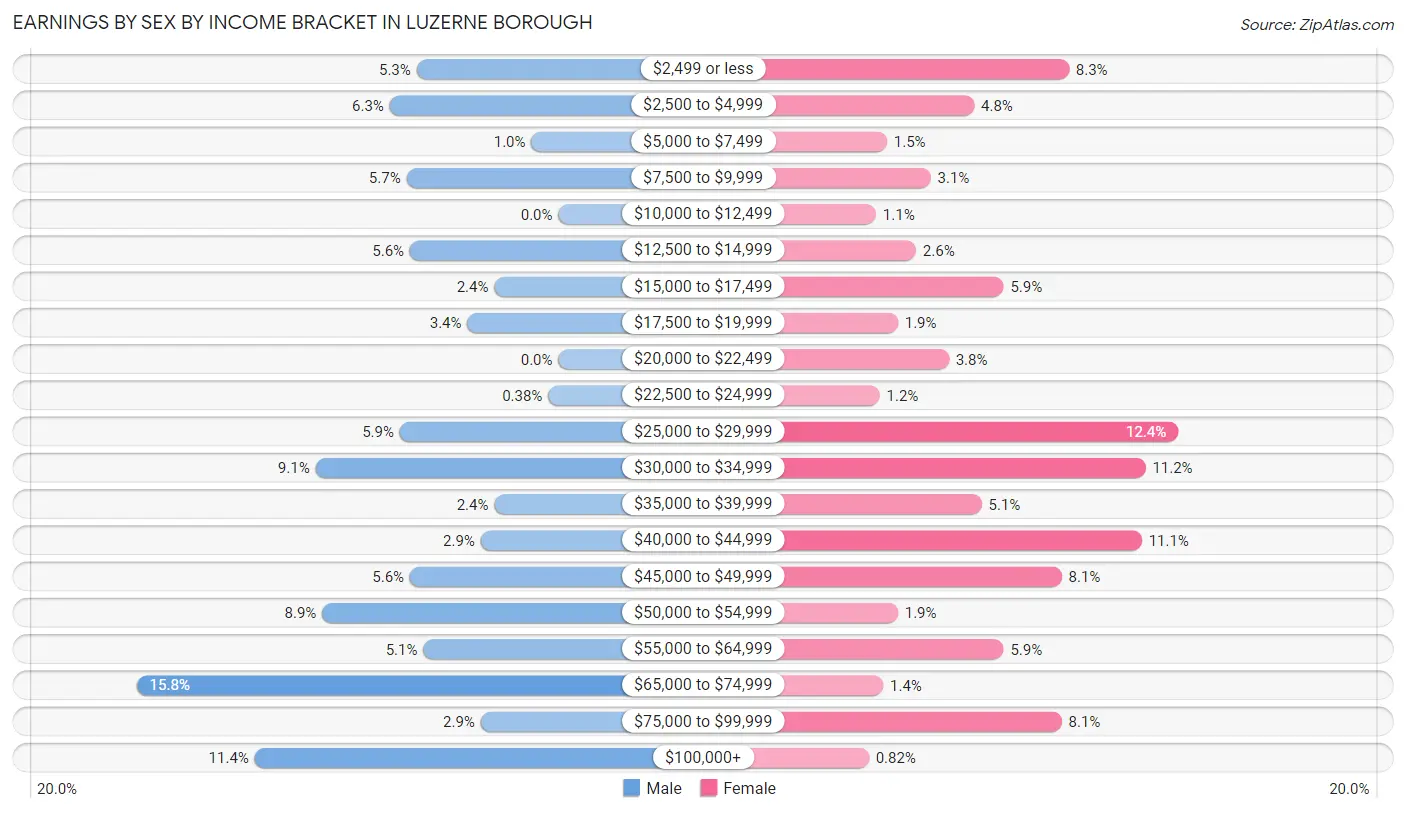
Earnings by Sex by Income Bracket in Luzerne borough
The most common earnings brackets in Luzerne borough are $65,000 to $74,999 for men (125 | 15.8%) and $25,000 to $29,999 for women (91 | 12.4%).
| Income | Male | Female |
| $2,499 or less | 42 (5.3%) | 61 (8.3%) |
| $2,500 to $4,999 | 50 (6.3%) | 35 (4.8%) |
| $5,000 to $7,499 | 8 (1.0%) | 11 (1.5%) |
| $7,500 to $9,999 | 45 (5.7%) | 23 (3.1%) |
| $10,000 to $12,499 | 0 (0.0%) | 8 (1.1%) |
| $12,500 to $14,999 | 44 (5.6%) | 19 (2.6%) |
| $15,000 to $17,499 | 19 (2.4%) | 43 (5.9%) |
| $17,500 to $19,999 | 27 (3.4%) | 14 (1.9%) |
| $20,000 to $22,499 | 0 (0.0%) | 28 (3.8%) |
| $22,500 to $24,999 | 3 (0.4%) | 9 (1.2%) |
| $25,000 to $29,999 | 47 (5.9%) | 91 (12.4%) |
| $30,000 to $34,999 | 72 (9.1%) | 82 (11.2%) |
| $35,000 to $39,999 | 19 (2.4%) | 37 (5.1%) |
| $40,000 to $44,999 | 23 (2.9%) | 81 (11.1%) |
| $45,000 to $49,999 | 44 (5.6%) | 59 (8.1%) |
| $50,000 to $54,999 | 70 (8.8%) | 14 (1.9%) |
| $55,000 to $64,999 | 40 (5.1%) | 43 (5.9%) |
| $65,000 to $74,999 | 125 (15.8%) | 10 (1.4%) |
| $75,000 to $99,999 | 23 (2.9%) | 59 (8.1%) |
| $100,000+ | 90 (11.4%) | 6 (0.8%) |
| Total | 791 (100.0%) | 733 (100.0%) |
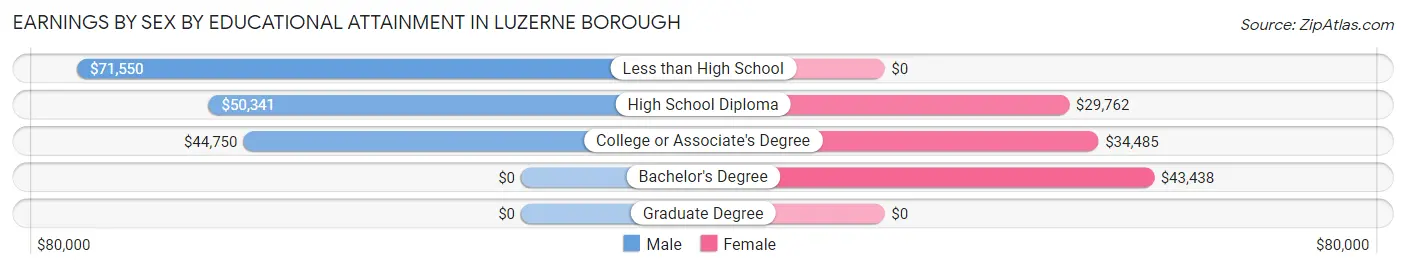
Earnings by Sex by Educational Attainment in Luzerne borough
Average earnings in Luzerne borough are $50,250 for men and $34,612 for women, a difference of 31.1%. Men with an educational attainment of less than high school enjoy the highest average annual earnings of $71,550, while those with college or associate's degree education earn the least with $44,750. Women with an educational attainment of bachelor's degree earn the most with the average annual earnings of $43,438, while those with high school diploma education have the smallest earnings of $29,762.
| Educational Attainment | Male Income | Female Income |
| Less than High School | $71,550 | $0 |
| High School Diploma | $50,341 | $29,762 |
| College or Associate's Degree | $44,750 | $34,485 |
| Bachelor's Degree | - | - |
| Graduate Degree | - | - |
| Total | $50,250 | $34,612 |
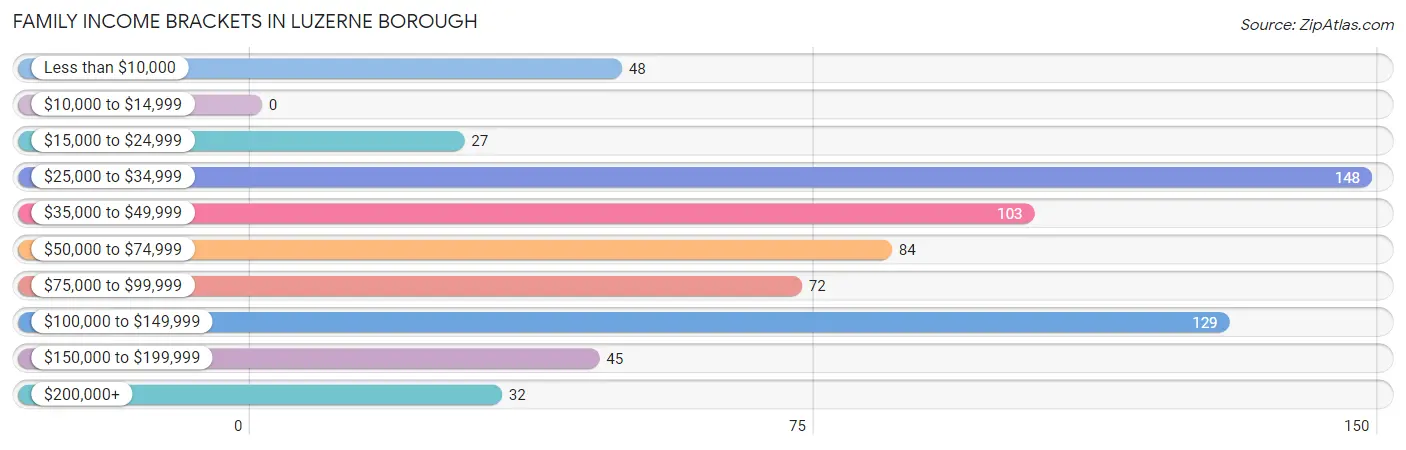
Family Income in Luzerne borough
Family Income Brackets in Luzerne borough
According to the Luzerne borough family income data, there are 148 families falling into the $25,000 to $34,999 income range, which is the most common income bracket and makes up 21.5% of all families.
| Income Bracket | # Families | % Families |
| Less than $10,000 | 48 | 7.0% |
| $10,000 to $14,999 | 0 | 0.0% |
| $15,000 to $24,999 | 27 | 3.9% |
| $25,000 to $34,999 | 148 | 21.5% |
| $35,000 to $49,999 | 103 | 15.0% |
| $50,000 to $74,999 | 84 | 12.2% |
| $75,000 to $99,999 | 72 | 10.5% |
| $100,000 to $149,999 | 129 | 18.8% |
| $150,000 to $199,999 | 45 | 6.5% |
| $200,000+ | 32 | 4.7% |
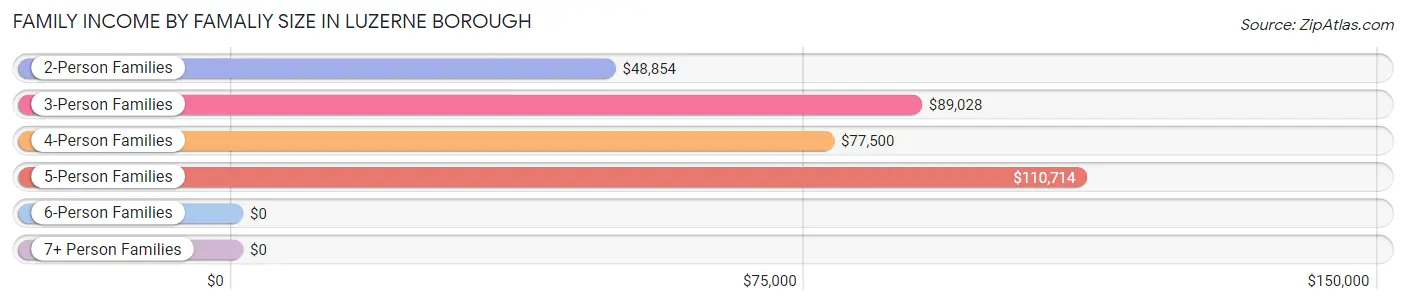
Family Income by Famaliy Size in Luzerne borough
5-person families (20 | 2.9%) account for the highest median family income in Luzerne borough with $110,714 per family, while 3-person families (185 | 26.9%) have the highest median income of $29,676 per family member.
| Income Bracket | # Families | Median Income |
| 2-Person Families | 416 (60.5%) | $48,854 |
| 3-Person Families | 185 (26.9%) | $89,028 |
| 4-Person Families | 46 (6.7%) | $77,500 |
| 5-Person Families | 20 (2.9%) | $110,714 |
| 6-Person Families | 18 (2.6%) | $0 |
| 7+ Person Families | 3 (0.4%) | $0 |
| Total | 688 (100.0%) | $52,045 |
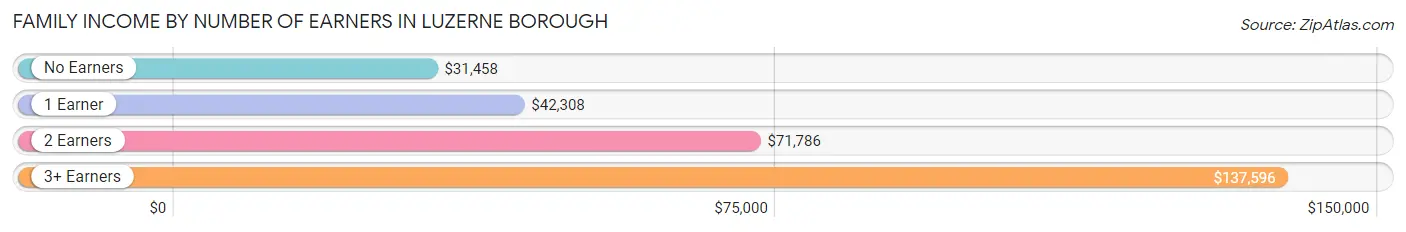
Family Income by Number of Earners in Luzerne borough
The median family income in Luzerne borough is $52,045, with families comprising 3+ earners (121) having the highest median family income of $137,596, while families with no earners (123) have the lowest median family income of $31,458, accounting for 17.6% and 17.9% of families, respectively.
| Number of Earners | # Families | Median Income |
| No Earners | 123 (17.9%) | $31,458 |
| 1 Earner | 300 (43.6%) | $42,308 |
| 2 Earners | 144 (20.9%) | $71,786 |
| 3+ Earners | 121 (17.6%) | $137,596 |
| Total | 688 (100.0%) | $52,045 |
Household Income in Luzerne borough
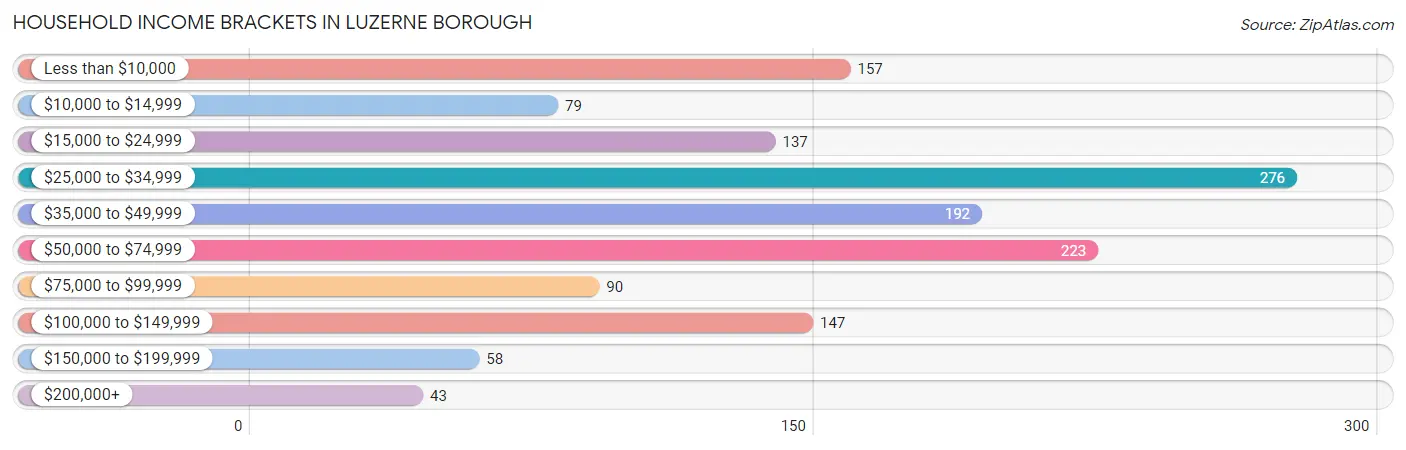
Household Income Brackets in Luzerne borough
With 276 households falling in the category, the $25,000 to $34,999 income range is the most frequent in Luzerne borough, accounting for 19.7% of all households. In contrast, only 43 households (3.1%) fall into the $200,000+ income bracket, making it the least populous group.
| Income Bracket | # Households | % Households |
| Less than $10,000 | 157 | 11.2% |
| $10,000 to $14,999 | 79 | 5.6% |
| $15,000 to $24,999 | 137 | 9.8% |
| $25,000 to $34,999 | 276 | 19.7% |
| $35,000 to $49,999 | 192 | 13.7% |
| $50,000 to $74,999 | 223 | 15.9% |
| $75,000 to $99,999 | 90 | 6.4% |
| $100,000 to $149,999 | 147 | 10.5% |
| $150,000 to $199,999 | 58 | 4.1% |
| $200,000+ | 43 | 3.1% |
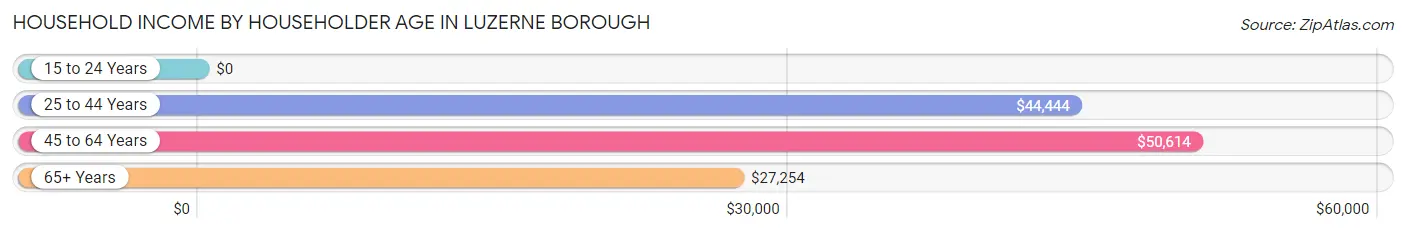
Household Income by Householder Age in Luzerne borough
The median household income in Luzerne borough is $39,471, with the highest median household income of $50,614 found in the 45 to 64 years age bracket for the primary householder. A total of 609 households (43.4%) fall into this category. Meanwhile, the 15 to 24 years age bracket for the primary householder has the lowest median household income of $0, with 74 households (5.3%) in this group.
| Income Bracket | # Households | Median Income |
| 15 to 24 Years | 74 (5.3%) | $0 |
| 25 to 44 Years | 282 (20.1%) | $44,444 |
| 45 to 64 Years | 609 (43.4%) | $50,614 |
| 65+ Years | 438 (31.2%) | $27,254 |
| Total | 1,403 (100.0%) | $39,471 |
Poverty in Luzerne borough
Income Below Poverty by Sex and Age in Luzerne borough
With 18.1% poverty level for males and 20.3% for females among the residents of Luzerne borough, under 5 year old males and 5 year old females are the most vulnerable to poverty, with 97 males (58.4%) and 20 females (100.0%) in their respective age groups living below the poverty level.
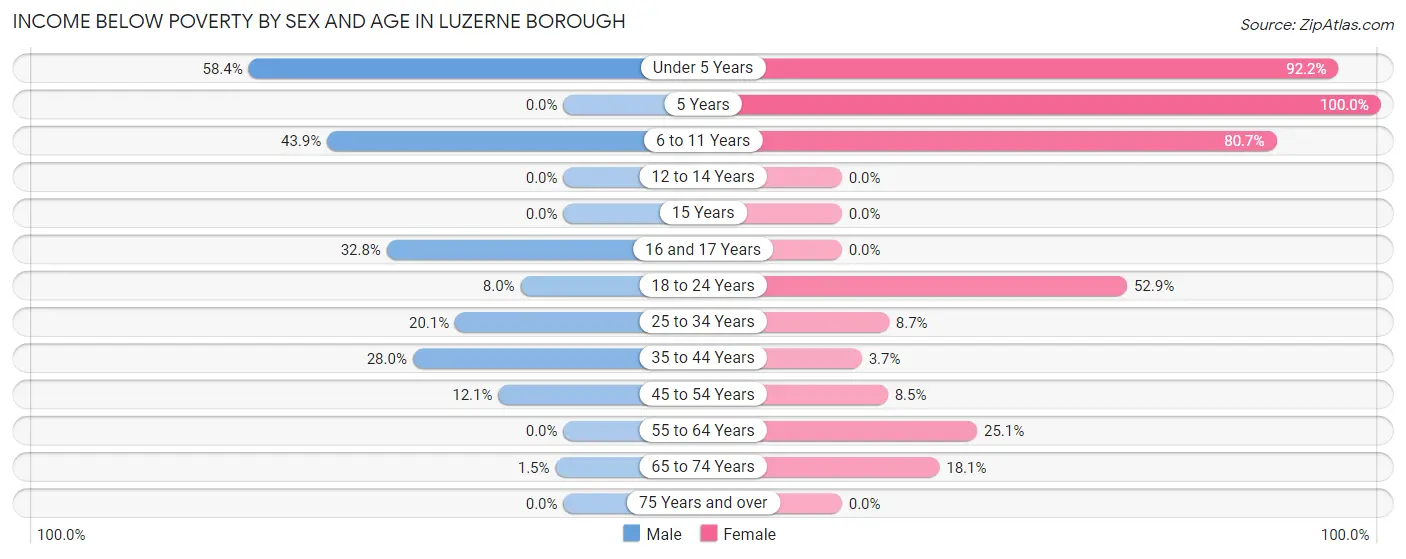
| Age Bracket | Male | Female |
| Under 5 Years | 97 (58.4%) | 47 (92.2%) |
| 5 Years | 0 (0.0%) | 20 (100.0%) |
| 6 to 11 Years | 25 (43.9%) | 25 (80.6%) |
| 12 to 14 Years | 0 (0.0%) | 0 (0.0%) |
| 15 Years | 0 (0.0%) | 0 (0.0%) |
| 16 and 17 Years | 20 (32.8%) | 0 (0.0%) |
| 18 to 24 Years | 11 (8.0%) | 45 (52.9%) |
| 25 to 34 Years | 41 (20.1%) | 9 (8.7%) |
| 35 to 44 Years | 26 (28.0%) | 4 (3.7%) |
| 45 to 54 Years | 25 (12.1%) | 18 (8.5%) |
| 55 to 64 Years | 0 (0.0%) | 65 (25.1%) |
| 65 to 74 Years | 2 (1.5%) | 42 (18.1%) |
| 75 Years and over | 0 (0.0%) | 0 (0.0%) |
| Total | 247 (18.1%) | 275 (20.3%) |
Income Above Poverty by Sex and Age in Luzerne borough
According to the poverty statistics in Luzerne borough, males aged 5 years and females aged 12 to 14 years are the age groups that are most secure financially, with 100.0% of males and 100.0% of females in these age groups living above the poverty line.
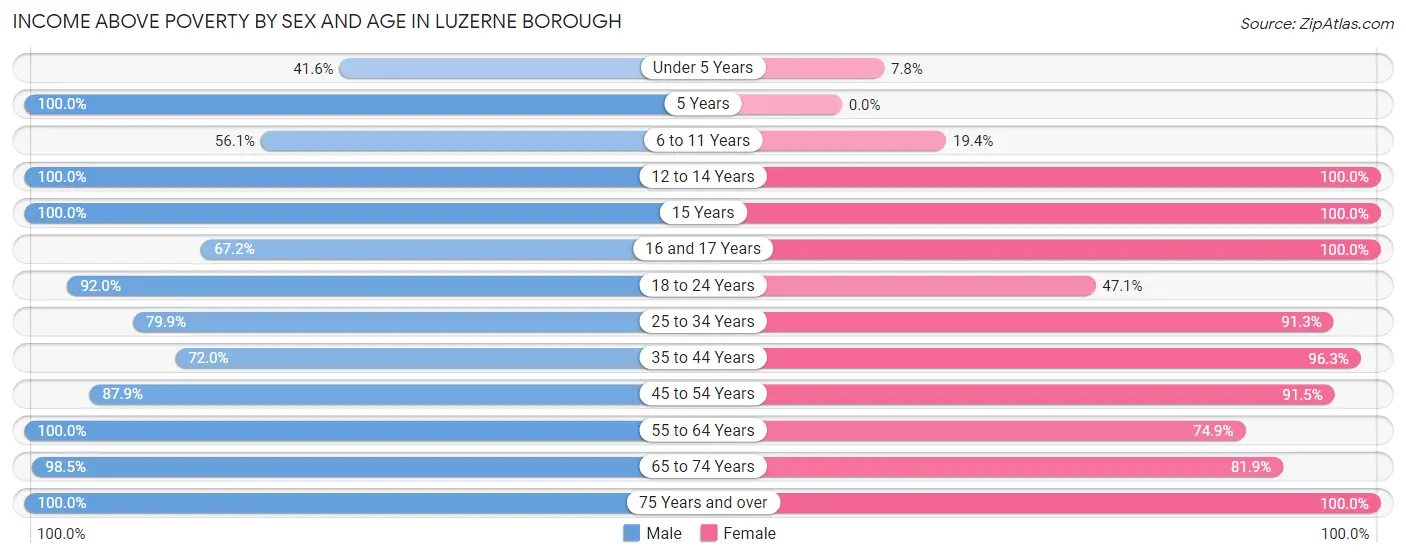
| Age Bracket | Male | Female |
| Under 5 Years | 69 (41.6%) | 4 (7.8%) |
| 5 Years | 3 (100.0%) | 0 (0.0%) |
| 6 to 11 Years | 32 (56.1%) | 6 (19.4%) |
| 12 to 14 Years | 19 (100.0%) | 14 (100.0%) |
| 15 Years | 29 (100.0%) | 8 (100.0%) |
| 16 and 17 Years | 41 (67.2%) | 53 (100.0%) |
| 18 to 24 Years | 127 (92.0%) | 40 (47.1%) |
| 25 to 34 Years | 163 (79.9%) | 94 (91.3%) |
| 35 to 44 Years | 67 (72.0%) | 104 (96.3%) |
| 45 to 54 Years | 182 (87.9%) | 193 (91.5%) |
| 55 to 64 Years | 179 (100.0%) | 194 (74.9%) |
| 65 to 74 Years | 133 (98.5%) | 190 (81.9%) |
| 75 Years and over | 71 (100.0%) | 181 (100.0%) |
| Total | 1,115 (81.9%) | 1,081 (79.7%) |
Income Below Poverty Among Married-Couple Families in Luzerne borough
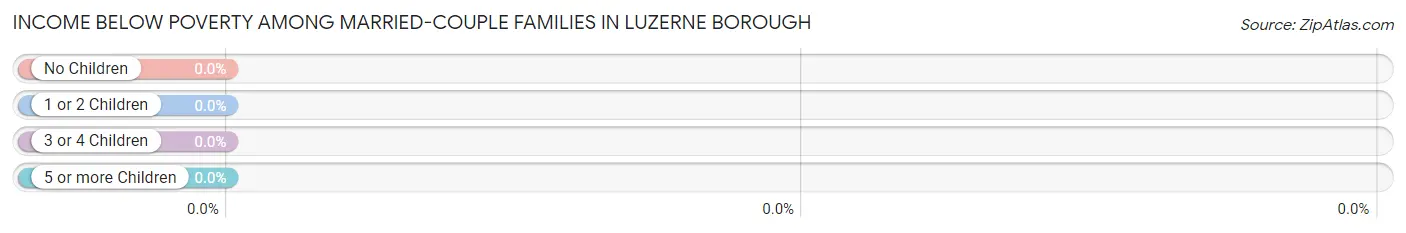
| Children | Above Poverty | Below Poverty |
| No Children | 290 (100.0%) | 0 (0.0%) |
| 1 or 2 Children | 52 (100.0%) | 0 (0.0%) |
| 3 or 4 Children | 11 (100.0%) | 0 (0.0%) |
| 5 or more Children | 0 (0.0%) | 0 (0.0%) |
| Total | 353 (100.0%) | 0 (0.0%) |
Income Below Poverty Among Single-Parent Households in Luzerne borough
According to the poverty data in Luzerne borough, 53.1% or 26 single-father households and 23.4% or 67 single-mother households are living below the poverty line. Among single-father households, those with 1 or 2 children have the highest poverty rate, with 26 households (61.9%) experiencing poverty. Likewise, among single-mother households, those with 5 or more children have the highest poverty rate, with 18 households (100.0%) falling below the poverty line.
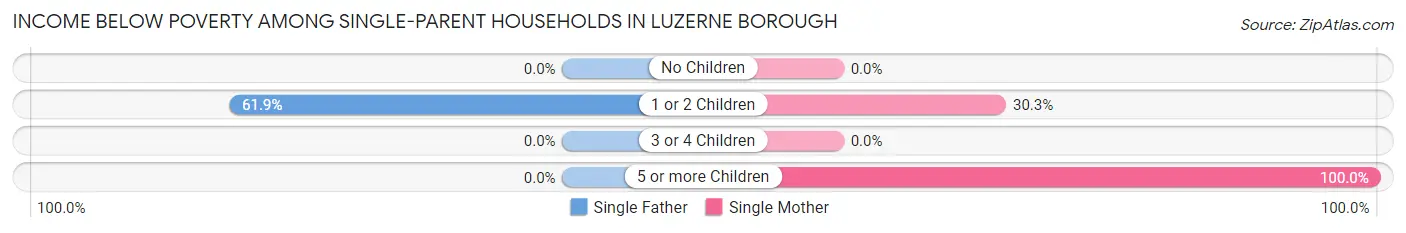
| Children | Single Father | Single Mother |
| No Children | 0 (0.0%) | 0 (0.0%) |
| 1 or 2 Children | 26 (61.9%) | 49 (30.2%) |
| 3 or 4 Children | 0 (0.0%) | 0 (0.0%) |
| 5 or more Children | 0 (0.0%) | 18 (100.0%) |
| Total | 26 (53.1%) | 67 (23.4%) |
Income Below Poverty Among Married-Couple vs Single-Parent Households in Luzerne borough
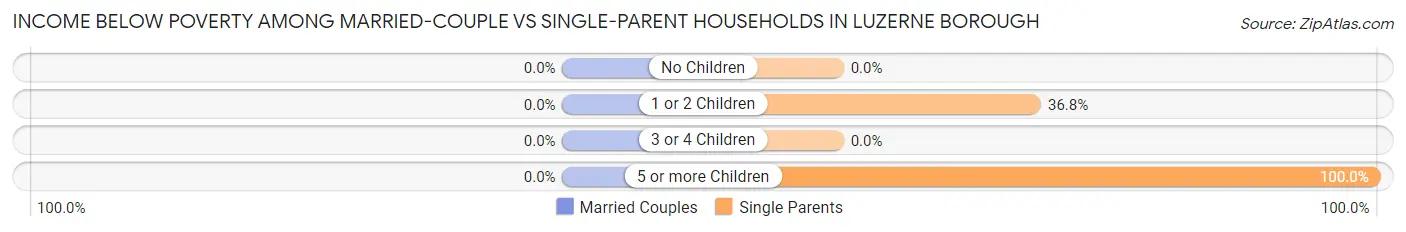
| Children | Married-Couple Families | Single-Parent Households |
| No Children | 0 (0.0%) | 0 (0.0%) |
| 1 or 2 Children | 0 (0.0%) | 75 (36.8%) |
| 3 or 4 Children | 0 (0.0%) | 0 (0.0%) |
| 5 or more Children | 0 (0.0%) | 18 (100.0%) |
| Total | 0 (0.0%) | 93 (27.8%) |
Race in Luzerne borough
The most populous races in Luzerne borough are White / Caucasian (2,581 | 95.0%), Two or more Races (109 | 4.0%), and Black / African American (28 | 1.0%).
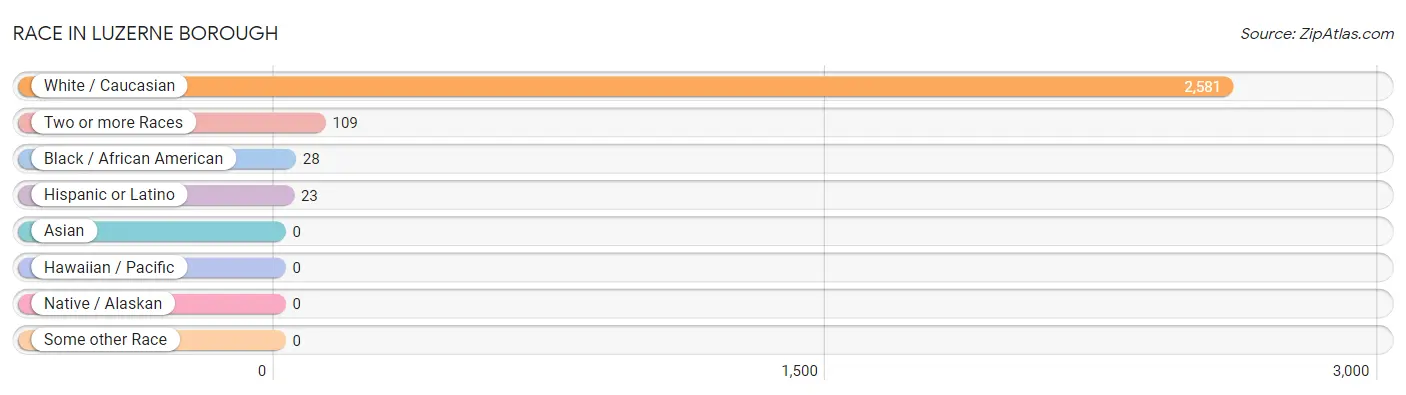
| Race | # Population | % Population |
| Asian | 0 | 0.0% |
| Black / African American | 28 | 1.0% |
| Hawaiian / Pacific | 0 | 0.0% |
| Hispanic or Latino | 23 | 0.9% |
| Native / Alaskan | 0 | 0.0% |
| White / Caucasian | 2,581 | 95.0% |
| Two or more Races | 109 | 4.0% |
| Some other Race | 0 | 0.0% |
| Total | 2,718 | 100.0% |
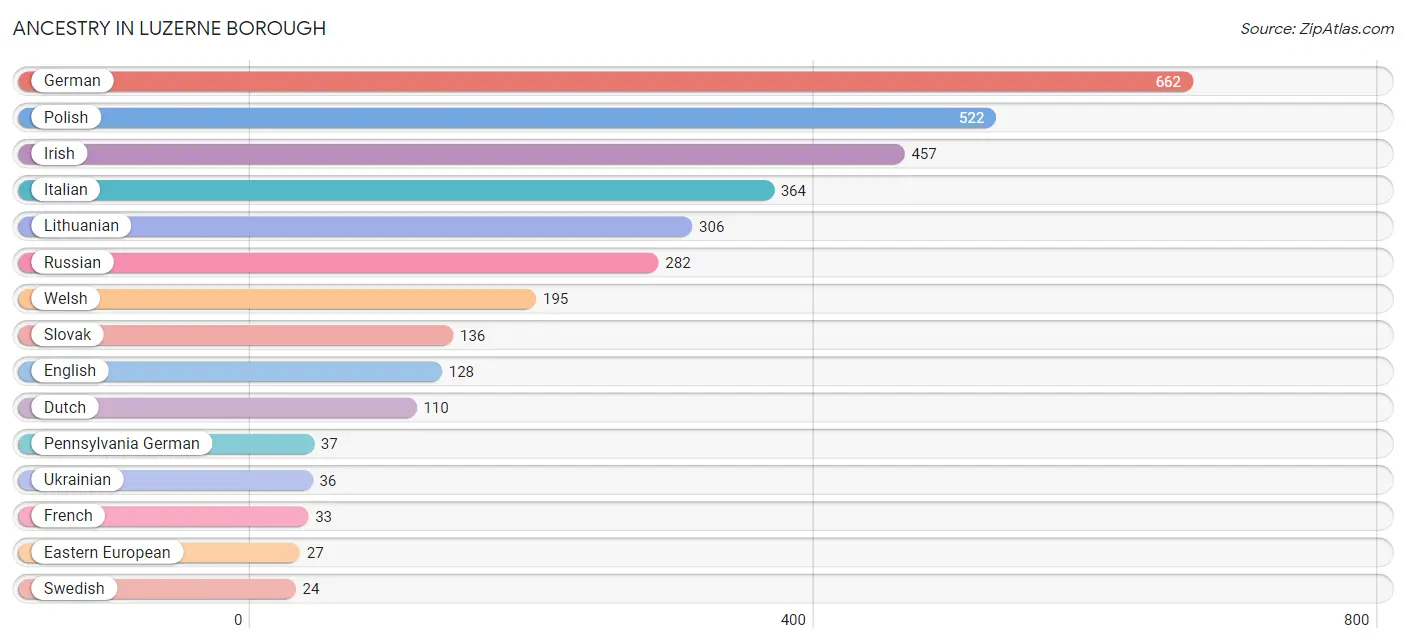
Ancestry in Luzerne borough
The most populous ancestries reported in Luzerne borough are German (662 | 24.4%), Polish (522 | 19.2%), Irish (457 | 16.8%), Italian (364 | 13.4%), and Lithuanian (306 | 11.3%), together accounting for 85.0% of all Luzerne borough residents.
| Ancestry | # Population | % Population |
| American | 12 | 0.4% |
| Arab | 6 | 0.2% |
| Czech | 17 | 0.6% |
| Czechoslovakian | 8 | 0.3% |
| Dutch | 110 | 4.1% |
| Eastern European | 27 | 1.0% |
| English | 128 | 4.7% |
| European | 8 | 0.3% |
| French | 33 | 1.2% |
| German | 662 | 24.4% |
| Hungarian | 3 | 0.1% |
| Irish | 457 | 16.8% |
| Italian | 364 | 13.4% |
| Lithuanian | 306 | 11.3% |
| Pennsylvania German | 37 | 1.4% |
| Polish | 522 | 19.2% |
| Puerto Rican | 23 | 0.9% |
| Russian | 282 | 10.4% |
| Scottish | 22 | 0.8% |
| Slovak | 136 | 5.0% |
| Swedish | 24 | 0.9% |
| Syrian | 6 | 0.2% |
| Thai | 15 | 0.5% |
| Ukrainian | 36 | 1.3% |
| Welsh | 195 | 7.2% | View All 25 Rows |
Immigrants in Luzerne borough
The most numerous immigrant groups reported in Luzerne borough came from Europe (25 | 0.9%), Italy (25 | 0.9%), and Southern Europe (25 | 0.9%), together accounting for 2.8% of all Luzerne borough residents.
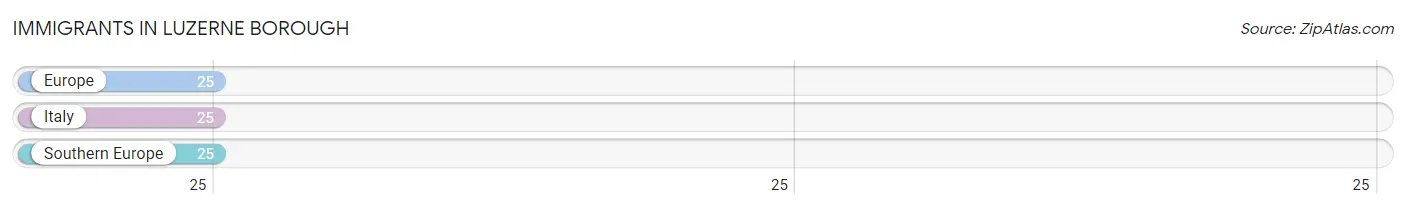
| Immigration Origin | # Population | % Population |
| Europe | 25 | 0.9% |
| Italy | 25 | 0.9% |
| Southern Europe | 25 | 0.9% | View All 3 Rows |
Sex and Age in Luzerne borough
Sex and Age in Luzerne borough
The most populous age groups in Luzerne borough are Under 5 Years (166 | 12.2%) for men and 50 to 54 Years (157 | 11.6%) for women.
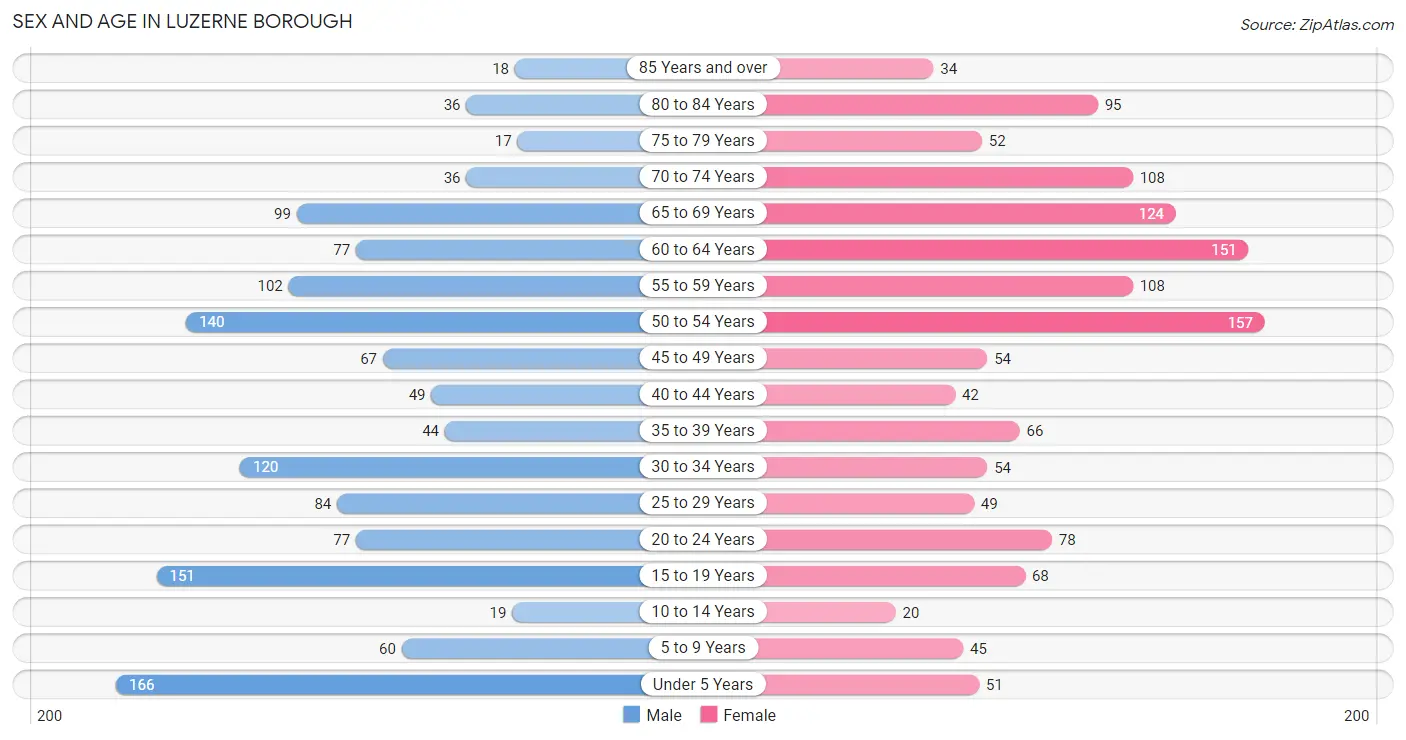
| Age Bracket | Male | Female |
| Under 5 Years | 166 (12.2%) | 51 (3.8%) |
| 5 to 9 Years | 60 (4.4%) | 45 (3.3%) |
| 10 to 14 Years | 19 (1.4%) | 20 (1.5%) |
| 15 to 19 Years | 151 (11.1%) | 68 (5.0%) |
| 20 to 24 Years | 77 (5.7%) | 78 (5.8%) |
| 25 to 29 Years | 84 (6.2%) | 49 (3.6%) |
| 30 to 34 Years | 120 (8.8%) | 54 (4.0%) |
| 35 to 39 Years | 44 (3.2%) | 66 (4.9%) |
| 40 to 44 Years | 49 (3.6%) | 42 (3.1%) |
| 45 to 49 Years | 67 (4.9%) | 54 (4.0%) |
| 50 to 54 Years | 140 (10.3%) | 157 (11.6%) |
| 55 to 59 Years | 102 (7.5%) | 108 (8.0%) |
| 60 to 64 Years | 77 (5.7%) | 151 (11.1%) |
| 65 to 69 Years | 99 (7.3%) | 124 (9.1%) |
| 70 to 74 Years | 36 (2.6%) | 108 (8.0%) |
| 75 to 79 Years | 17 (1.3%) | 52 (3.8%) |
| 80 to 84 Years | 36 (2.6%) | 95 (7.0%) |
| 85 Years and over | 18 (1.3%) | 34 (2.5%) |
| Total | 1,362 (100.0%) | 1,356 (100.0%) |
Families and Households in Luzerne borough
Median Family Size in Luzerne borough
The median family size in Luzerne borough is 2.75 persons per family, with married-couple families (353 | 51.3%) accounting for the largest median family size of 2.9 persons per family. On the other hand, single male/father families (49 | 7.1%) represent the smallest median family size with 2.55 persons per family.
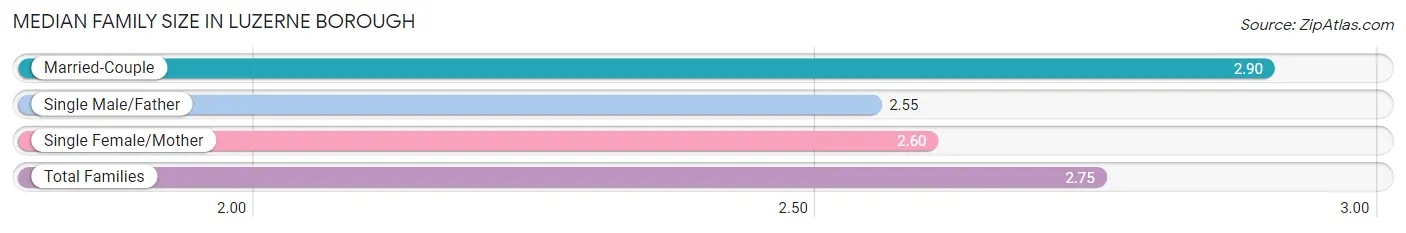
| Family Type | # Families | Family Size |
| Married-Couple | 353 (51.3%) | 2.90 |
| Single Male/Father | 49 (7.1%) | 2.55 |
| Single Female/Mother | 286 (41.6%) | 2.60 |
| Total Families | 688 (100.0%) | 2.75 |
Median Household Size in Luzerne borough
The median household size in Luzerne borough is 1.93 persons per household, with married-couple households (353 | 25.2%) accounting for the largest median household size of 2.9 persons per household. non-family households (715 | 51.0%) represent the smallest median household size with 1.13 persons per household.
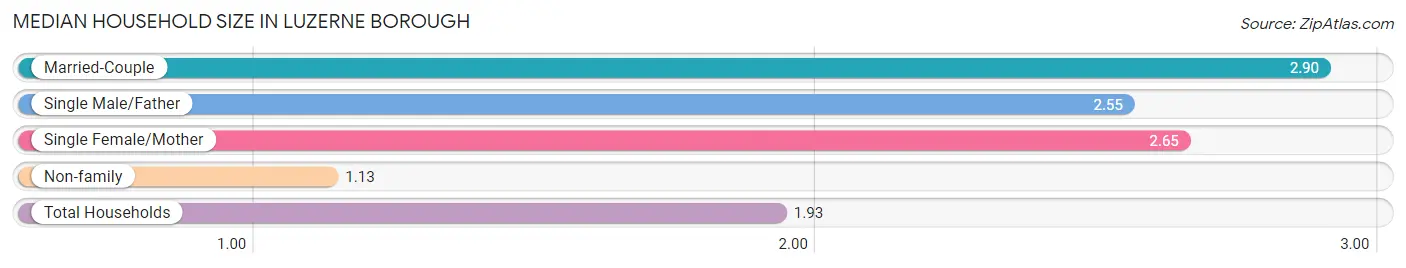
| Household Type | # Households | Household Size |
| Married-Couple | 353 (25.2%) | 2.90 |
| Single Male/Father | 49 (3.5%) | 2.55 |
| Single Female/Mother | 286 (20.4%) | 2.65 |
| Non-family | 715 (51.0%) | 1.13 |
| Total Households | 1,403 (100.0%) | 1.93 |
Household Size by Marriage Status in Luzerne borough
Out of a total of 1,403 households in Luzerne borough, 688 (49.0%) are family households, while 715 (51.0%) are nonfamily households. The most numerous type of family households are 2-person households, comprising 403, and the most common type of nonfamily households are 1-person households, comprising 635.
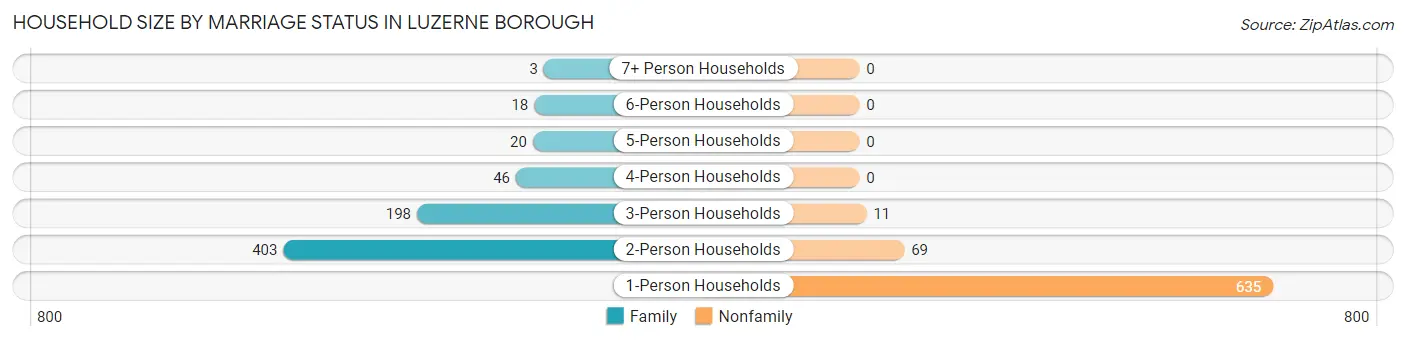
| Household Size | Family Households | Nonfamily Households |
| 1-Person Households | - | 635 (45.3%) |
| 2-Person Households | 403 (28.7%) | 69 (4.9%) |
| 3-Person Households | 198 (14.1%) | 11 (0.8%) |
| 4-Person Households | 46 (3.3%) | 0 (0.0%) |
| 5-Person Households | 20 (1.4%) | 0 (0.0%) |
| 6-Person Households | 18 (1.3%) | 0 (0.0%) |
| 7+ Person Households | 3 (0.2%) | 0 (0.0%) |
| Total | 688 (49.0%) | 715 (51.0%) |
Female Fertility in Luzerne borough
Fertility by Age in Luzerne borough
Average fertility rate in Luzerne borough is 87.0 births per 1,000 women. Women in the age bracket of 20 to 34 years have the highest fertility rate with 221.0 births per 1,000 women. Women in the age bracket of 20 to 34 years acount for 100.0% of all women with births.
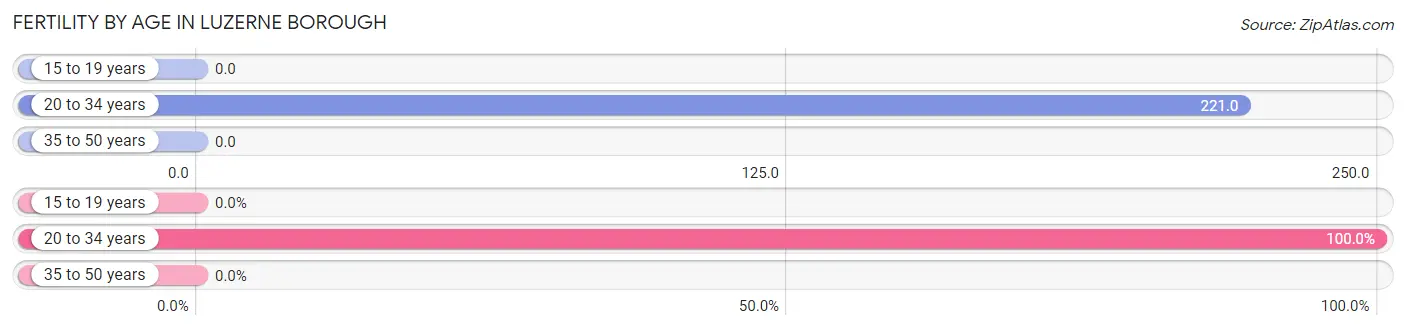
| Age Bracket | Women with Births | Births / 1,000 Women |
| 15 to 19 years | 0 (0.0%) | 0.0 |
| 20 to 34 years | 40 (100.0%) | 221.0 |
| 35 to 50 years | 0 (0.0%) | 0.0 |
| Total | 40 (100.0%) | 87.0 |
Fertility by Age by Marriage Status in Luzerne borough
27.5% of women with births (40) in Luzerne borough are married. The highest percentage of unmarried women with births falls into 20 to 34 years age bracket with 72.5% of them unmarried at the time of birth, while the lowest percentage of unmarried women with births belong to 20 to 34 years age bracket with 72.5% of them unmarried.
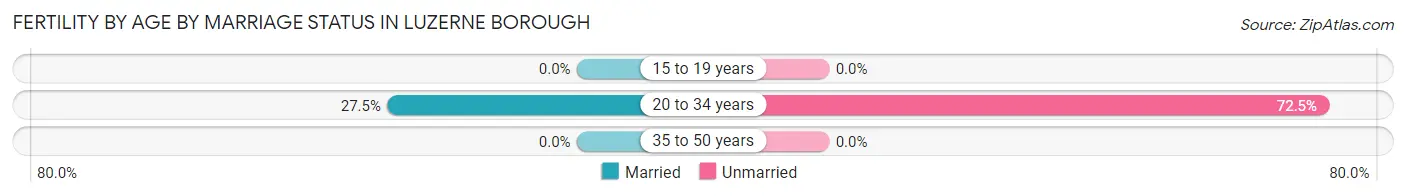
| Age Bracket | Married | Unmarried |
| 15 to 19 years | 0 (0.0%) | 0 (0.0%) |
| 20 to 34 years | 11 (27.5%) | 29 (72.5%) |
| 35 to 50 years | 0 (0.0%) | 0 (0.0%) |
| Total | 11 (27.5%) | 29 (72.5%) |
Fertility by Education in Luzerne borough
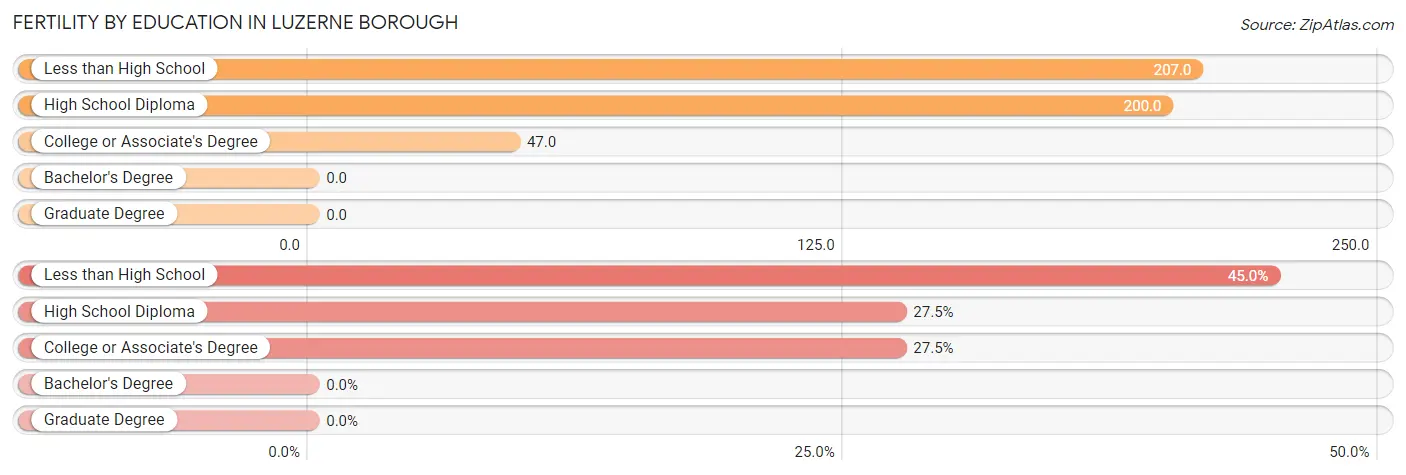
| Educational Attainment | Women with Births | Births / 1,000 Women |
| Less than High School | 18 (45.0%) | 207.0 |
| High School Diploma | 11 (27.5%) | 200.0 |
| College or Associate's Degree | 11 (27.5%) | 47.0 |
| Bachelor's Degree | 0 (0.0%) | 0.0 |
| Graduate Degree | 0 (0.0%) | 0.0 |
| Total | 40 (100.0%) | 87.0 |
Fertility by Education by Marriage Status in Luzerne borough
72.5% of women with births in Luzerne borough are unmarried. Women with the educational attainment of college or associate's degree are most likely to be married with 100.0% of them married at childbirth, while women with the educational attainment of less than high school are least likely to be married with 100.0% of them unmarried at childbirth.
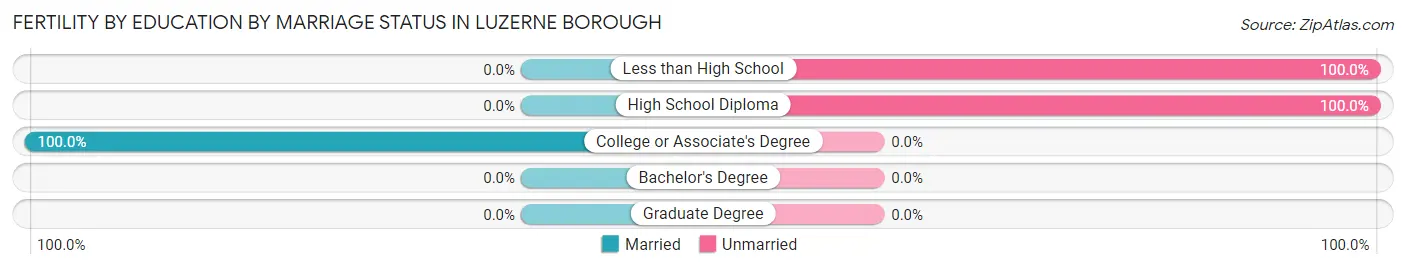
| Educational Attainment | Married | Unmarried |
| Less than High School | 0 (0.0%) | 18 (100.0%) |
| High School Diploma | 0 (0.0%) | 11 (100.0%) |
| College or Associate's Degree | 11 (100.0%) | 0 (0.0%) |
| Bachelor's Degree | 0 (0.0%) | 0 (0.0%) |
| Graduate Degree | 0 (0.0%) | 0 (0.0%) |
| Total | 11 (27.5%) | 29 (72.5%) |
Employment Characteristics in Luzerne borough
Employment by Class of Employer in Luzerne borough
Among the 1,340 employed individuals in Luzerne borough, private company employees (1,063 | 79.3%), not-for-profit organizations (112 | 8.4%), and federal government employees (55 | 4.1%) make up the most common classes of employment.
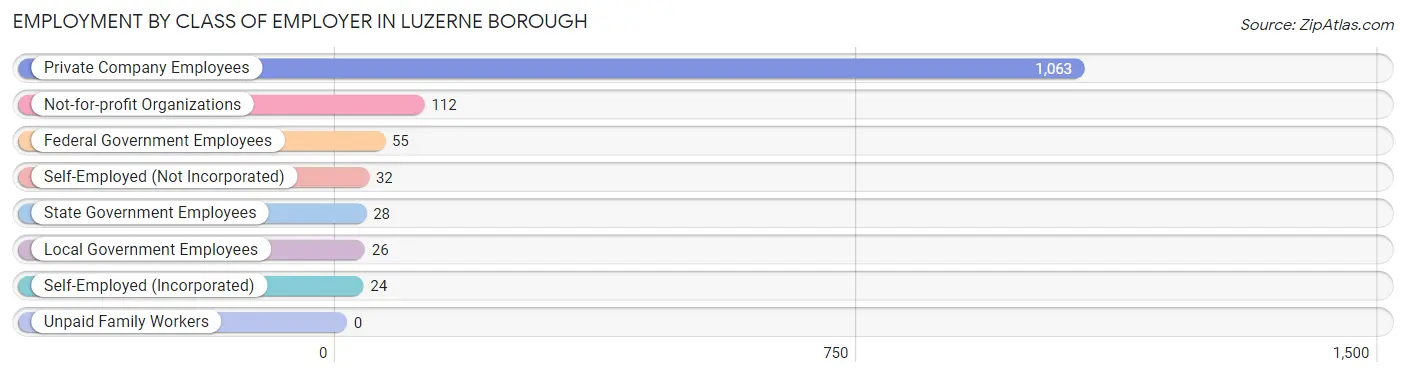
| Employer Class | # Employees | % Employees |
| Private Company Employees | 1,063 | 79.3% |
| Self-Employed (Incorporated) | 24 | 1.8% |
| Self-Employed (Not Incorporated) | 32 | 2.4% |
| Not-for-profit Organizations | 112 | 8.4% |
| Local Government Employees | 26 | 1.9% |
| State Government Employees | 28 | 2.1% |
| Federal Government Employees | 55 | 4.1% |
| Unpaid Family Workers | 0 | 0.0% |
| Total | 1,340 | 100.0% |
Employment Status by Age in Luzerne borough
According to the labor force statistics for Luzerne borough, out of the total population over 16 years of age (2,320), 63.6% or 1,476 individuals are in the labor force, with 7.1% or 105 of them unemployed. The age group with the highest labor force participation rate is 20 to 24 years, with 100.0% or 155 individuals in the labor force. Within the labor force, the 16 to 19 years age range has the highest percentage of unemployed individuals, with 58.7% or 54 of them being unemployed.
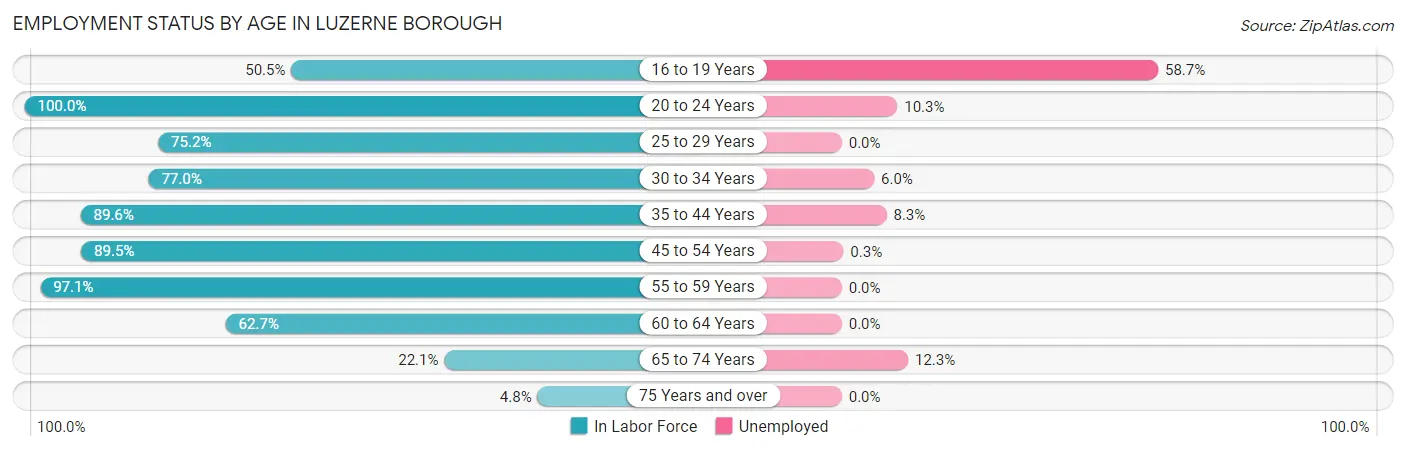
| Age Bracket | In Labor Force | Unemployed |
| 16 to 19 Years | 92 (50.5%) | 54 (58.7%) |
| 20 to 24 Years | 155 (100.0%) | 16 (10.3%) |
| 25 to 29 Years | 100 (75.2%) | 0 (0.0%) |
| 30 to 34 Years | 134 (77.0%) | 8 (6.0%) |
| 35 to 44 Years | 180 (89.6%) | 15 (8.3%) |
| 45 to 54 Years | 374 (89.5%) | 1 (0.3%) |
| 55 to 59 Years | 204 (97.1%) | 0 (0.0%) |
| 60 to 64 Years | 143 (62.7%) | 0 (0.0%) |
| 65 to 74 Years | 81 (22.1%) | 10 (12.3%) |
| 75 Years and over | 12 (4.8%) | 0 (0.0%) |
| Total | 1,476 (63.6%) | 105 (7.1%) |
Employment Status by Educational Attainment in Luzerne borough
According to labor force statistics for Luzerne borough, 83.2% of individuals (1,135) out of the total population between 25 and 64 years of age (1,364) are in the labor force, with 2.1% or 24 of them being unemployed. The group with the highest labor force participation rate are those with the educational attainment of bachelor's degree or higher, with 100.0% or 209 individuals in the labor force. Within the labor force, individuals with less than high school education have the highest percentage of unemployment, with 6.3% or 4 of them being unemployed.
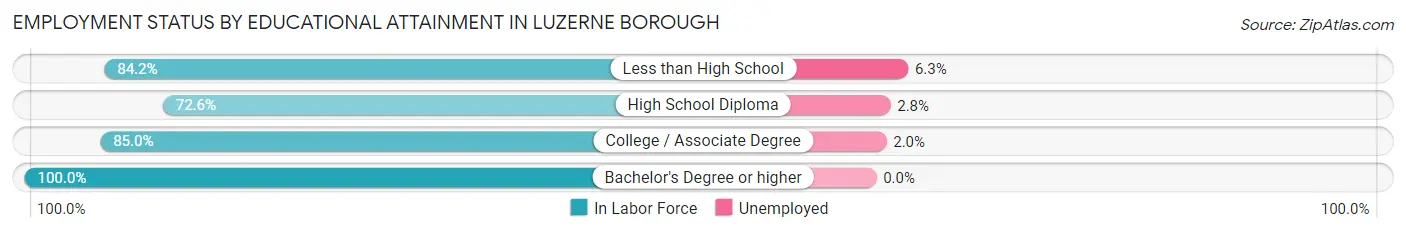
| Educational Attainment | In Labor Force | Unemployed |
| Less than High School | 64 (84.2%) | 5 (6.3%) |
| High School Diploma | 323 (72.6%) | 12 (2.8%) |
| College / Associate Degree | 539 (85.0%) | 13 (2.0%) |
| Bachelor's Degree or higher | 209 (100.0%) | 0 (0.0%) |
| Total | 1,135 (83.2%) | 29 (2.1%) |
Employment Occupations by Sex in Luzerne borough
Management, Business, Science and Arts Occupations
The most common Management, Business, Science and Arts occupations in Luzerne borough are Management (177 | 12.9%), Community & Social Service (104 | 7.6%), Health Diagnosing & Treating (98 | 7.1%), Business & Financial (76 | 5.5%), and Legal Services & Support (64 | 4.7%).
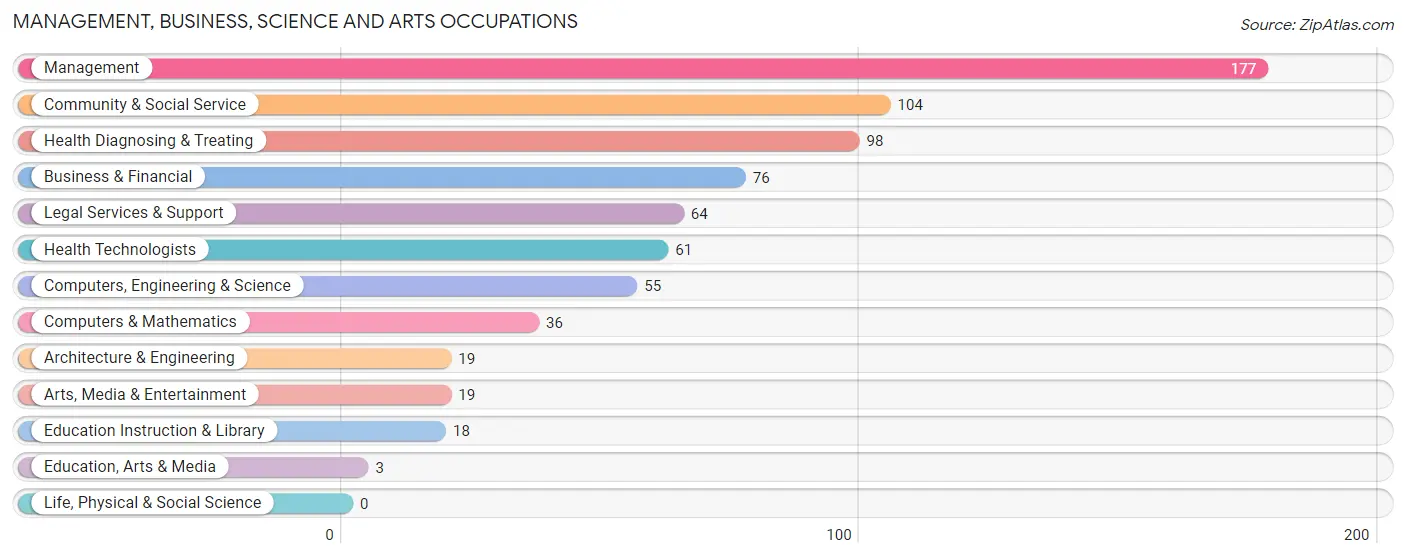
Management, Business, Science and Arts Occupations by Sex
Within the Management, Business, Science and Arts occupations in Luzerne borough, the most male-oriented occupations are Architecture & Engineering (100.0%), Education, Arts & Media (100.0%), and Arts, Media & Entertainment (57.9%), while the most female-oriented occupations are Computers & Mathematics (100.0%), Health Technologists (100.0%), and Health Diagnosing & Treating (80.6%).
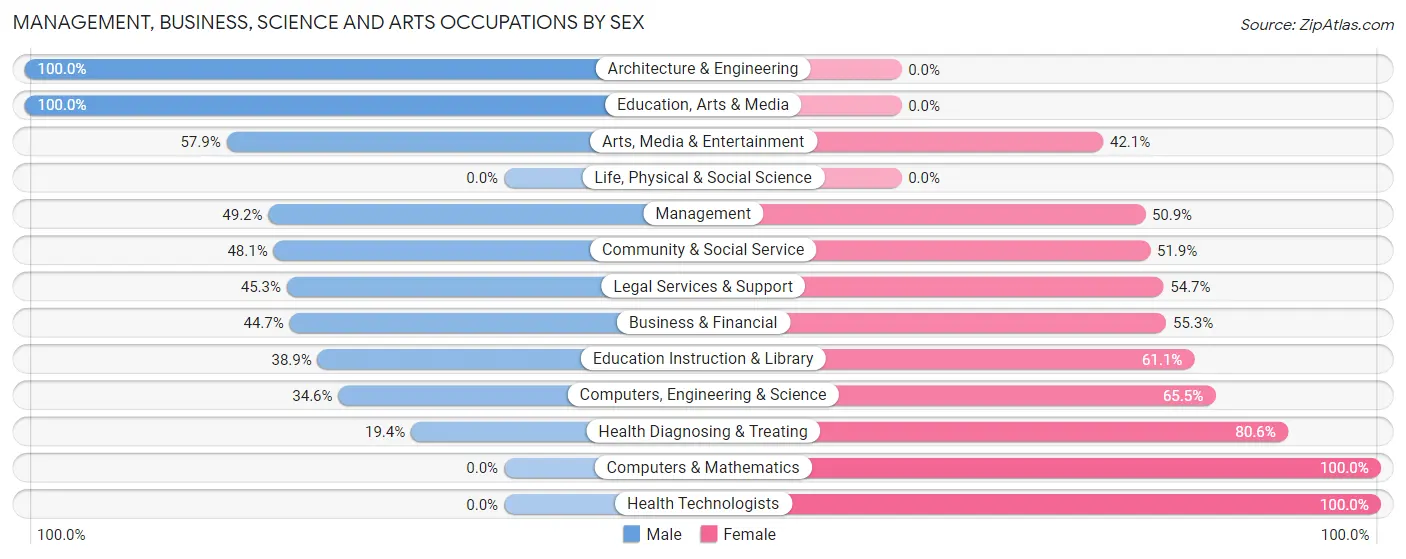
| Occupation | Male | Female |
| Management | 87 (49.1%) | 90 (50.8%) |
| Business & Financial | 34 (44.7%) | 42 (55.3%) |
| Computers, Engineering & Science | 19 (34.5%) | 36 (65.4%) |
| Computers & Mathematics | 0 (0.0%) | 36 (100.0%) |
| Architecture & Engineering | 19 (100.0%) | 0 (0.0%) |
| Life, Physical & Social Science | 0 (0.0%) | 0 (0.0%) |
| Community & Social Service | 50 (48.1%) | 54 (51.9%) |
| Education, Arts & Media | 3 (100.0%) | 0 (0.0%) |
| Legal Services & Support | 29 (45.3%) | 35 (54.7%) |
| Education Instruction & Library | 7 (38.9%) | 11 (61.1%) |
| Arts, Media & Entertainment | 11 (57.9%) | 8 (42.1%) |
| Health Diagnosing & Treating | 19 (19.4%) | 79 (80.6%) |
| Health Technologists | 0 (0.0%) | 61 (100.0%) |
| Total (Category) | 209 (41.0%) | 301 (59.0%) |
| Total (Overall) | 688 (50.2%) | 683 (49.8%) |
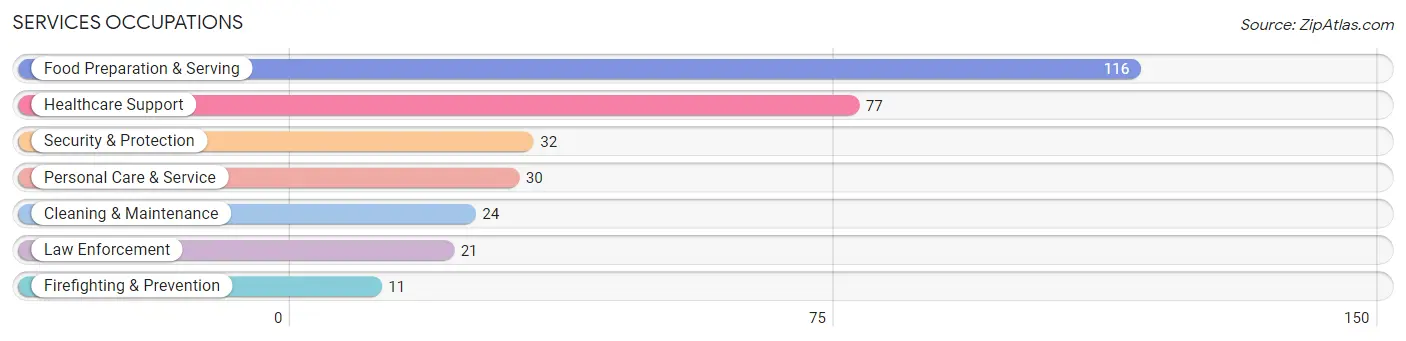
Services Occupations
The most common Services occupations in Luzerne borough are Food Preparation & Serving (116 | 8.5%), Healthcare Support (77 | 5.6%), Security & Protection (32 | 2.3%), Personal Care & Service (30 | 2.2%), and Cleaning & Maintenance (24 | 1.8%).
Services Occupations by Sex
Within the Services occupations in Luzerne borough, the most male-oriented occupations are Firefighting & Prevention (100.0%), Security & Protection (68.8%), and Food Preparation & Serving (54.3%), while the most female-oriented occupations are Healthcare Support (100.0%), Personal Care & Service (100.0%), and Cleaning & Maintenance (58.3%).
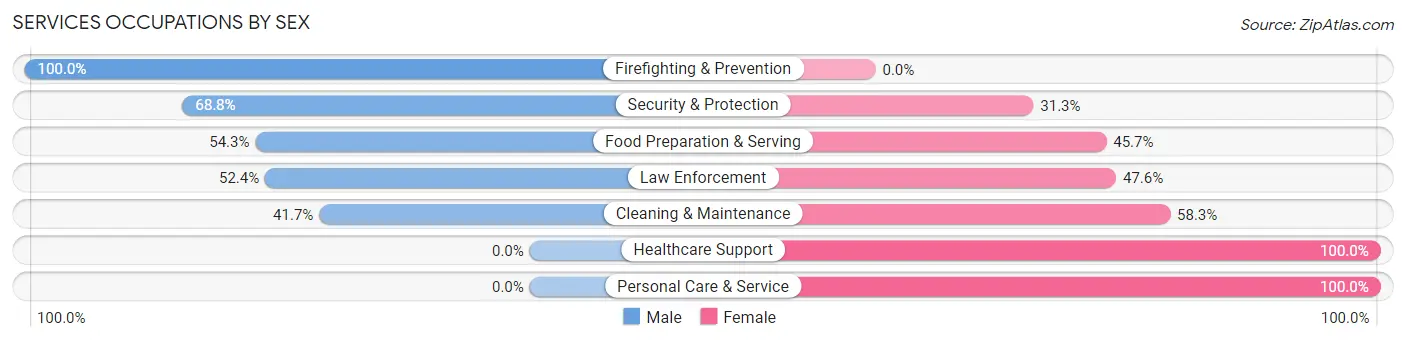
| Occupation | Male | Female |
| Healthcare Support | 0 (0.0%) | 77 (100.0%) |
| Security & Protection | 22 (68.8%) | 10 (31.2%) |
| Firefighting & Prevention | 11 (100.0%) | 0 (0.0%) |
| Law Enforcement | 11 (52.4%) | 10 (47.6%) |
| Food Preparation & Serving | 63 (54.3%) | 53 (45.7%) |
| Cleaning & Maintenance | 10 (41.7%) | 14 (58.3%) |
| Personal Care & Service | 0 (0.0%) | 30 (100.0%) |
| Total (Category) | 95 (34.1%) | 184 (65.9%) |
| Total (Overall) | 688 (50.2%) | 683 (49.8%) |
Sales and Office Occupations
The most common Sales and Office occupations in Luzerne borough are Sales & Related (159 | 11.6%), and Office & Administration (159 | 11.6%).

Sales and Office Occupations by Sex

| Occupation | Male | Female |
| Sales & Related | 111 (69.8%) | 48 (30.2%) |
| Office & Administration | 43 (27.0%) | 116 (73.0%) |
| Total (Category) | 154 (48.4%) | 164 (51.6%) |
| Total (Overall) | 688 (50.2%) | 683 (49.8%) |
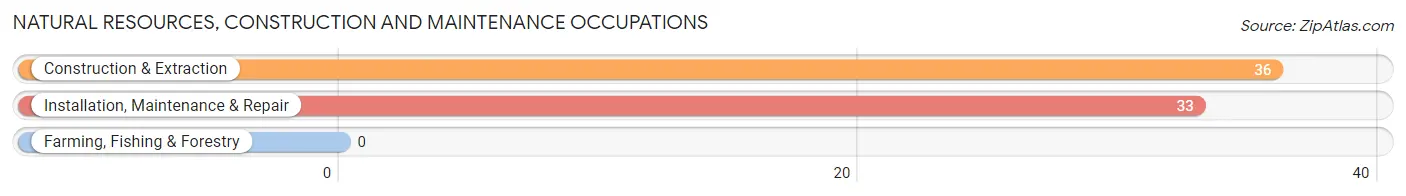
Natural Resources, Construction and Maintenance Occupations
The most common Natural Resources, Construction and Maintenance occupations in Luzerne borough are Construction & Extraction (36 | 2.6%), and Installation, Maintenance & Repair (33 | 2.4%).
Natural Resources, Construction and Maintenance Occupations by Sex

| Occupation | Male | Female |
| Farming, Fishing & Forestry | 0 (0.0%) | 0 (0.0%) |
| Construction & Extraction | 36 (100.0%) | 0 (0.0%) |
| Installation, Maintenance & Repair | 33 (100.0%) | 0 (0.0%) |
| Total (Category) | 69 (100.0%) | 0 (0.0%) |
| Total (Overall) | 688 (50.2%) | 683 (49.8%) |
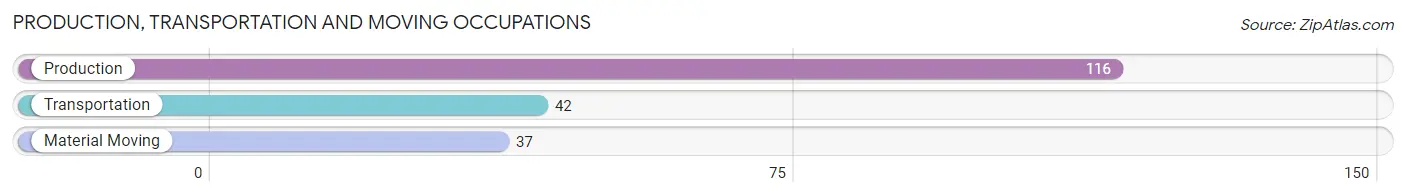
Production, Transportation and Moving Occupations
The most common Production, Transportation and Moving occupations in Luzerne borough are Production (116 | 8.5%), Transportation (42 | 3.1%), and Material Moving (37 | 2.7%).
Production, Transportation and Moving Occupations by Sex
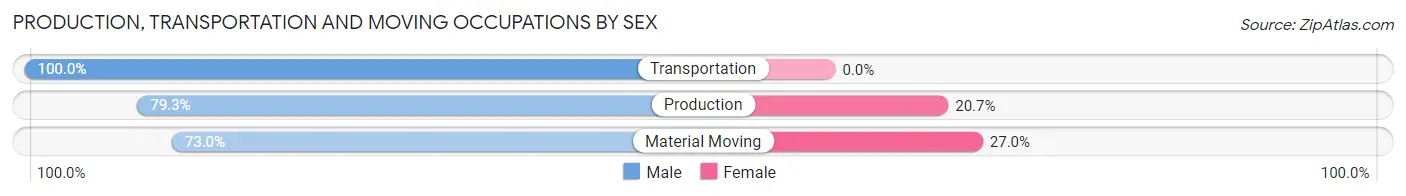
| Occupation | Male | Female |
| Production | 92 (79.3%) | 24 (20.7%) |
| Transportation | 42 (100.0%) | 0 (0.0%) |
| Material Moving | 27 (73.0%) | 10 (27.0%) |
| Total (Category) | 161 (82.6%) | 34 (17.4%) |
| Total (Overall) | 688 (50.2%) | 683 (49.8%) |
Employment Industries by Sex in Luzerne borough
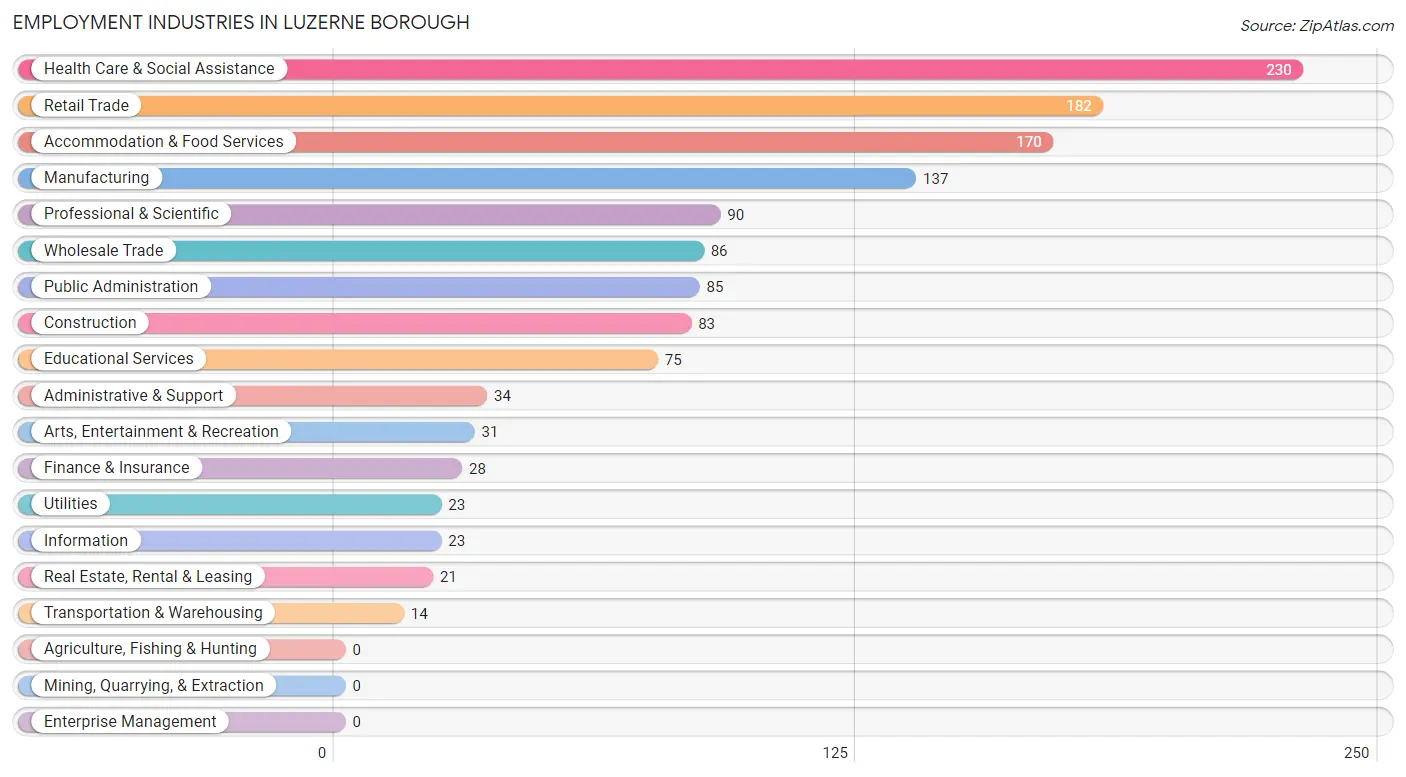
Employment Industries in Luzerne borough
The major employment industries in Luzerne borough include Health Care & Social Assistance (230 | 16.8%), Retail Trade (182 | 13.3%), Accommodation & Food Services (170 | 12.4%), Manufacturing (137 | 10.0%), and Professional & Scientific (90 | 6.6%).
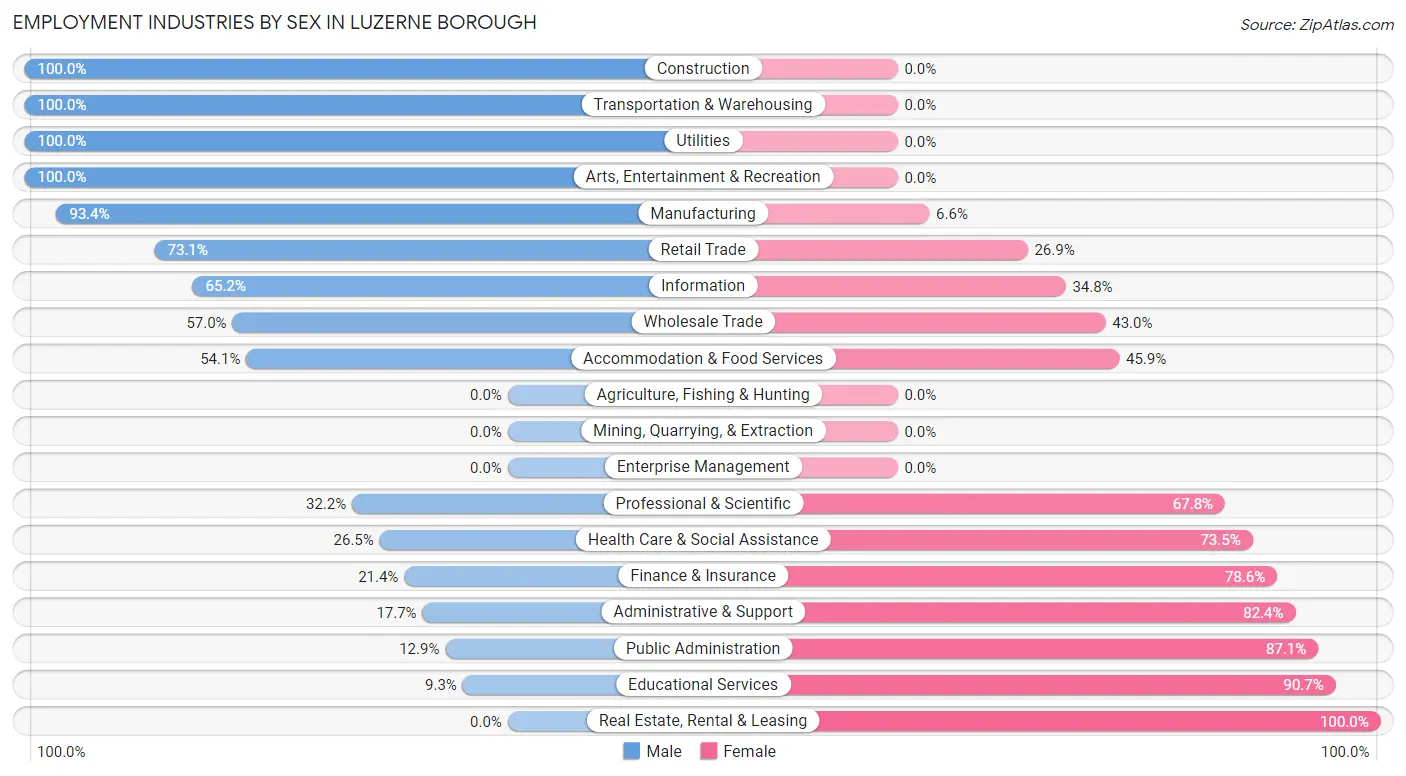
Employment Industries by Sex in Luzerne borough
The Luzerne borough industries that see more men than women are Construction (100.0%), Transportation & Warehousing (100.0%), and Utilities (100.0%), whereas the industries that tend to have a higher number of women are Real Estate, Rental & Leasing (100.0%), Educational Services (90.7%), and Public Administration (87.1%).
| Industry | Male | Female |
| Agriculture, Fishing & Hunting | 0 (0.0%) | 0 (0.0%) |
| Mining, Quarrying, & Extraction | 0 (0.0%) | 0 (0.0%) |
| Construction | 83 (100.0%) | 0 (0.0%) |
| Manufacturing | 128 (93.4%) | 9 (6.6%) |
| Wholesale Trade | 49 (57.0%) | 37 (43.0%) |
| Retail Trade | 133 (73.1%) | 49 (26.9%) |
| Transportation & Warehousing | 14 (100.0%) | 0 (0.0%) |
| Utilities | 23 (100.0%) | 0 (0.0%) |
| Information | 15 (65.2%) | 8 (34.8%) |
| Finance & Insurance | 6 (21.4%) | 22 (78.6%) |
| Real Estate, Rental & Leasing | 0 (0.0%) | 21 (100.0%) |
| Professional & Scientific | 29 (32.2%) | 61 (67.8%) |
| Enterprise Management | 0 (0.0%) | 0 (0.0%) |
| Administrative & Support | 6 (17.6%) | 28 (82.4%) |
| Educational Services | 7 (9.3%) | 68 (90.7%) |
| Health Care & Social Assistance | 61 (26.5%) | 169 (73.5%) |
| Arts, Entertainment & Recreation | 31 (100.0%) | 0 (0.0%) |
| Accommodation & Food Services | 92 (54.1%) | 78 (45.9%) |
| Public Administration | 11 (12.9%) | 74 (87.1%) |
| Total | 688 (50.2%) | 683 (49.8%) |
Education in Luzerne borough
School Enrollment in Luzerne borough
The most common levels of schooling among the 404 students in Luzerne borough are high school (185 | 45.8%), college / undergraduate (61 | 15.1%), and elementary school (56 | 13.9%).
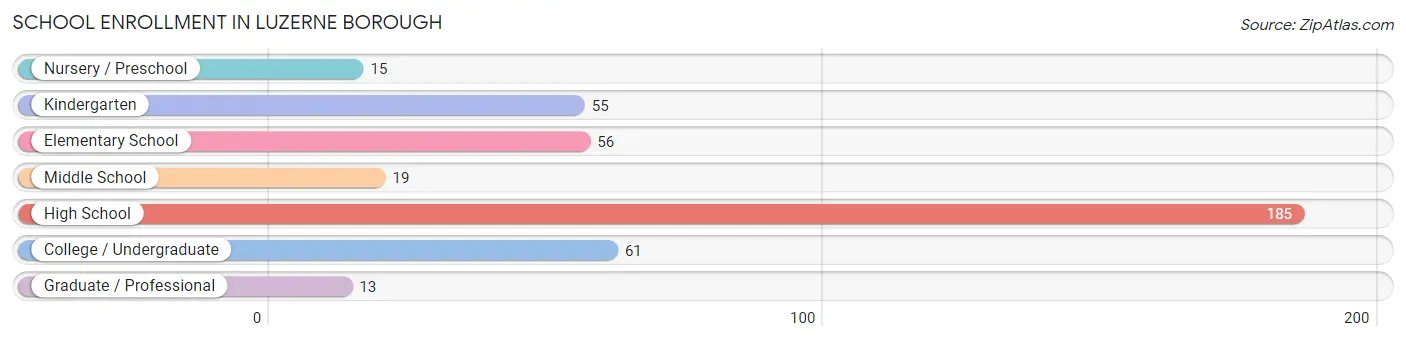
| School Level | # Students | % Students |
| Nursery / Preschool | 15 | 3.7% |
| Kindergarten | 55 | 13.6% |
| Elementary School | 56 | 13.9% |
| Middle School | 19 | 4.7% |
| High School | 185 | 45.8% |
| College / Undergraduate | 61 | 15.1% |
| Graduate / Professional | 13 | 3.2% |
| Total | 404 | 100.0% |
School Enrollment by Age by Funding Source in Luzerne borough
Out of a total of 404 students who are enrolled in schools in Luzerne borough, 117 (29.0%) attend a private institution, while the remaining 287 (71.0%) are enrolled in public schools. The age group of 3 to 4 year olds has the highest likelihood of being enrolled in private schools, with 15 (100.0% in the age bracket) enrolled. Conversely, the age group of 18 to 19 year olds has the lowest likelihood of being enrolled in a private school, with 23 (100.0% in the age bracket) attending a public institution.
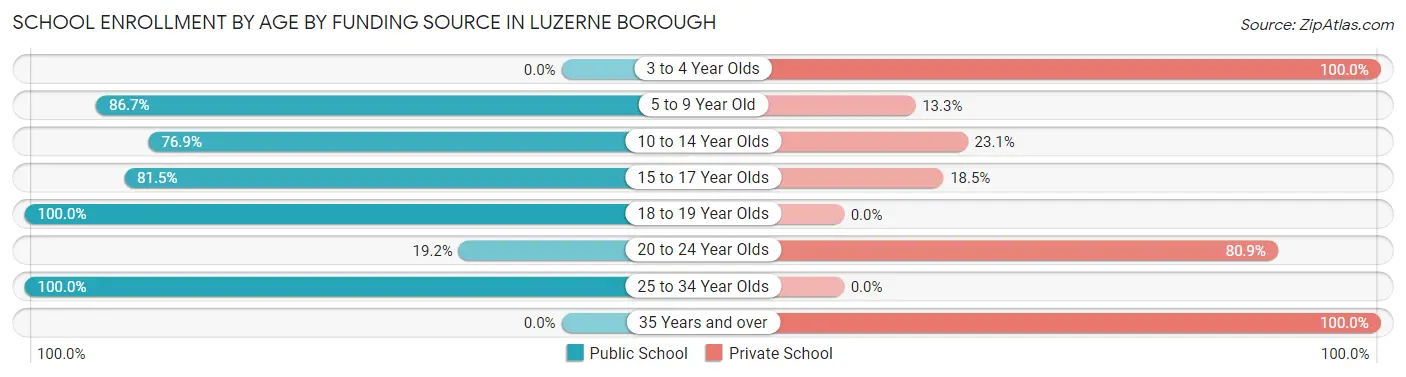
| Age Bracket | Public School | Private School |
| 3 to 4 Year Olds | 0 (0.0%) | 15 (100.0%) |
| 5 to 9 Year Old | 91 (86.7%) | 14 (13.3%) |
| 10 to 14 Year Olds | 30 (76.9%) | 9 (23.1%) |
| 15 to 17 Year Olds | 123 (81.5%) | 28 (18.5%) |
| 18 to 19 Year Olds | 23 (100.0%) | 0 (0.0%) |
| 20 to 24 Year Olds | 9 (19.2%) | 38 (80.8%) |
| 25 to 34 Year Olds | 11 (100.0%) | 0 (0.0%) |
| 35 Years and over | 0 (0.0%) | 13 (100.0%) |
| Total | 287 (71.0%) | 117 (29.0%) |
Educational Attainment by Field of Study in Luzerne borough
Business (118 | 40.6%), computers & mathematics (43 | 14.8%), liberal arts & history (38 | 13.1%), science & technology (28 | 9.6%), and literature & languages (23 | 7.9%) are the most common fields of study among 291 individuals in Luzerne borough who have obtained a bachelor's degree or higher.
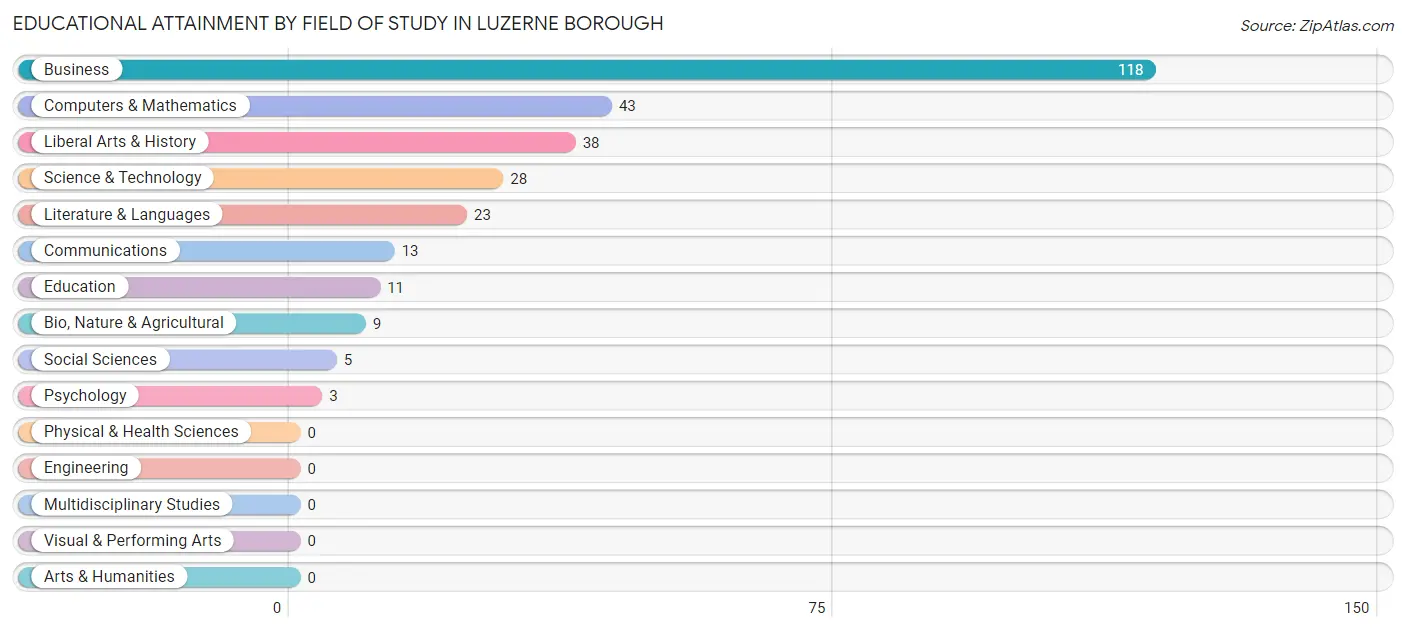
| Field of Study | # Graduates | % Graduates |
| Computers & Mathematics | 43 | 14.8% |
| Bio, Nature & Agricultural | 9 | 3.1% |
| Physical & Health Sciences | 0 | 0.0% |
| Psychology | 3 | 1.0% |
| Social Sciences | 5 | 1.7% |
| Engineering | 0 | 0.0% |
| Multidisciplinary Studies | 0 | 0.0% |
| Science & Technology | 28 | 9.6% |
| Business | 118 | 40.6% |
| Education | 11 | 3.8% |
| Literature & Languages | 23 | 7.9% |
| Liberal Arts & History | 38 | 13.1% |
| Visual & Performing Arts | 0 | 0.0% |
| Communications | 13 | 4.5% |
| Arts & Humanities | 0 | 0.0% |
| Total | 291 | 100.0% |
Transportation & Commute in Luzerne borough
Vehicle Availability by Sex in Luzerne borough
The most prevalent vehicle ownership categories in Luzerne borough are males with 1 vehicle (238, accounting for 34.9%) and females with 1 vehicle (278, making up 36.1%).
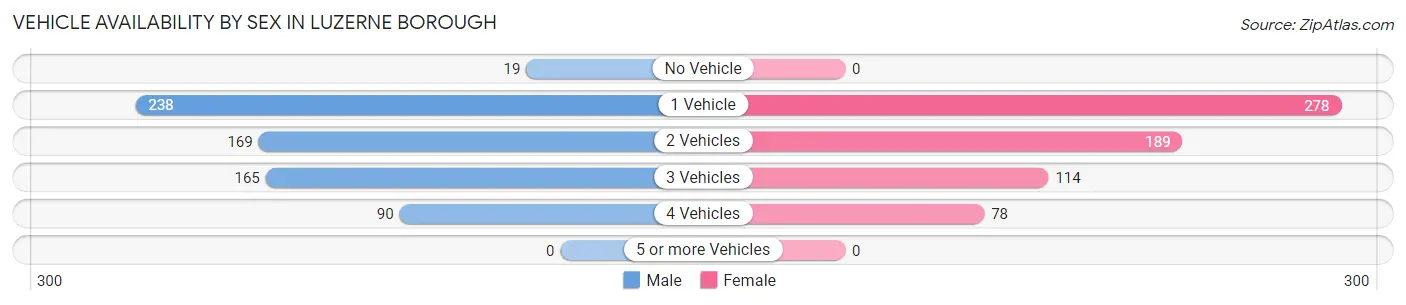
| Vehicles Available | Male | Female |
| No Vehicle | 19 (2.8%) | 0 (0.0%) |
| 1 Vehicle | 238 (34.9%) | 278 (42.2%) |
| 2 Vehicles | 169 (24.8%) | 189 (28.7%) |
| 3 Vehicles | 165 (24.2%) | 114 (17.3%) |
| 4 Vehicles | 90 (13.2%) | 78 (11.8%) |
| 5 or more Vehicles | 0 (0.0%) | 0 (0.0%) |
| Total | 681 (100.0%) | 659 (100.0%) |
Commute Time in Luzerne borough
The most frequently occuring commute durations in Luzerne borough are 10 to 14 minutes (372 commuters, 30.3%), 5 to 9 minutes (261 commuters, 21.3%), and 15 to 19 minutes (184 commuters, 15.0%).
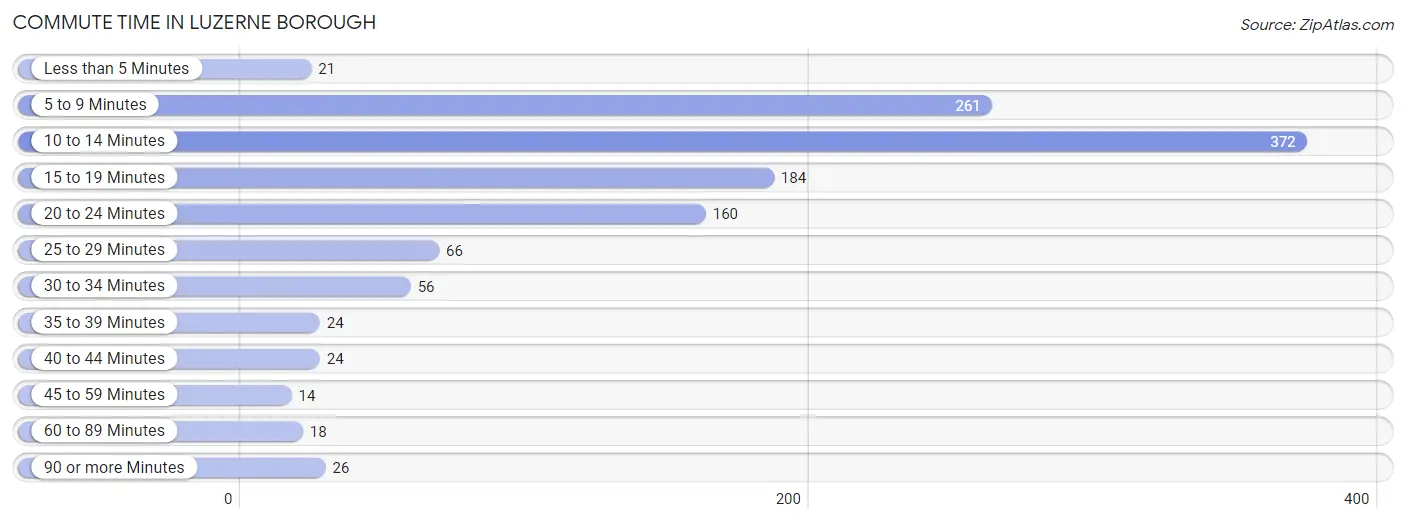
| Commute Time | # Commuters | % Commuters |
| Less than 5 Minutes | 21 | 1.7% |
| 5 to 9 Minutes | 261 | 21.3% |
| 10 to 14 Minutes | 372 | 30.3% |
| 15 to 19 Minutes | 184 | 15.0% |
| 20 to 24 Minutes | 160 | 13.1% |
| 25 to 29 Minutes | 66 | 5.4% |
| 30 to 34 Minutes | 56 | 4.6% |
| 35 to 39 Minutes | 24 | 2.0% |
| 40 to 44 Minutes | 24 | 2.0% |
| 45 to 59 Minutes | 14 | 1.1% |
| 60 to 89 Minutes | 18 | 1.5% |
| 90 or more Minutes | 26 | 2.1% |
Commute Time by Sex in Luzerne borough
The most common commute times in Luzerne borough are 10 to 14 minutes (156 commuters, 24.4%) for males and 10 to 14 minutes (216 commuters, 36.7%) for females.
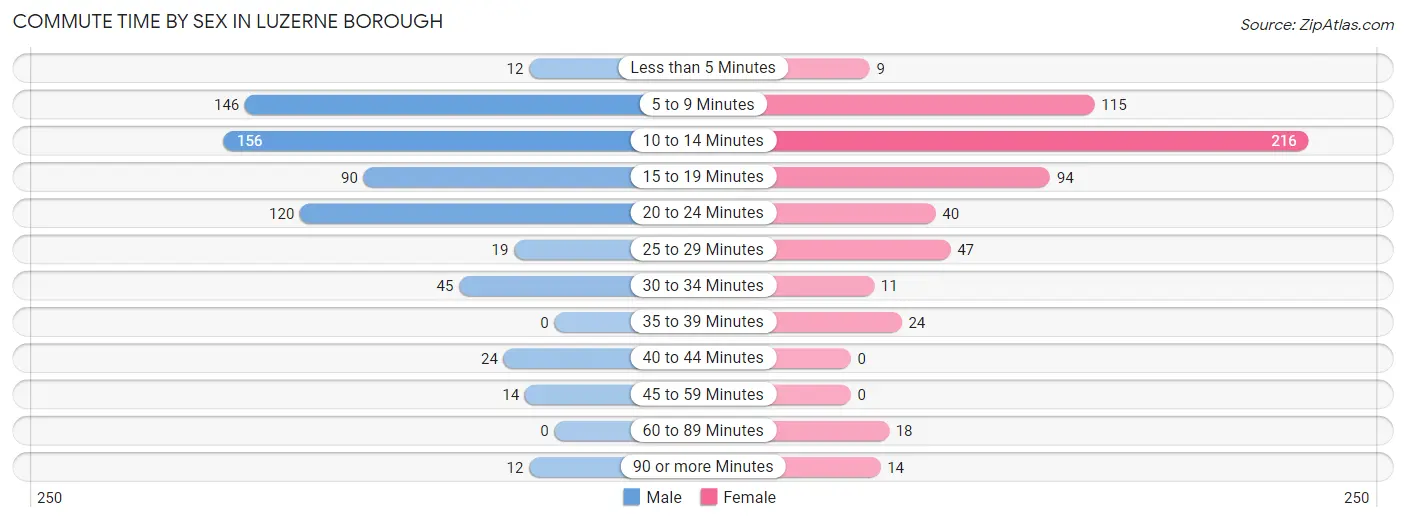
| Commute Time | Male | Female |
| Less than 5 Minutes | 12 (1.9%) | 9 (1.5%) |
| 5 to 9 Minutes | 146 (22.9%) | 115 (19.6%) |
| 10 to 14 Minutes | 156 (24.4%) | 216 (36.7%) |
| 15 to 19 Minutes | 90 (14.1%) | 94 (16.0%) |
| 20 to 24 Minutes | 120 (18.8%) | 40 (6.8%) |
| 25 to 29 Minutes | 19 (3.0%) | 47 (8.0%) |
| 30 to 34 Minutes | 45 (7.0%) | 11 (1.9%) |
| 35 to 39 Minutes | 0 (0.0%) | 24 (4.1%) |
| 40 to 44 Minutes | 24 (3.8%) | 0 (0.0%) |
| 45 to 59 Minutes | 14 (2.2%) | 0 (0.0%) |
| 60 to 89 Minutes | 0 (0.0%) | 18 (3.1%) |
| 90 or more Minutes | 12 (1.9%) | 14 (2.4%) |
Time of Departure to Work by Sex in Luzerne borough
The most frequent times of departure to work in Luzerne borough are 7:00 AM to 7:29 AM (96, 15.0%) for males and 6:30 AM to 6:59 AM (96, 16.3%) for females.
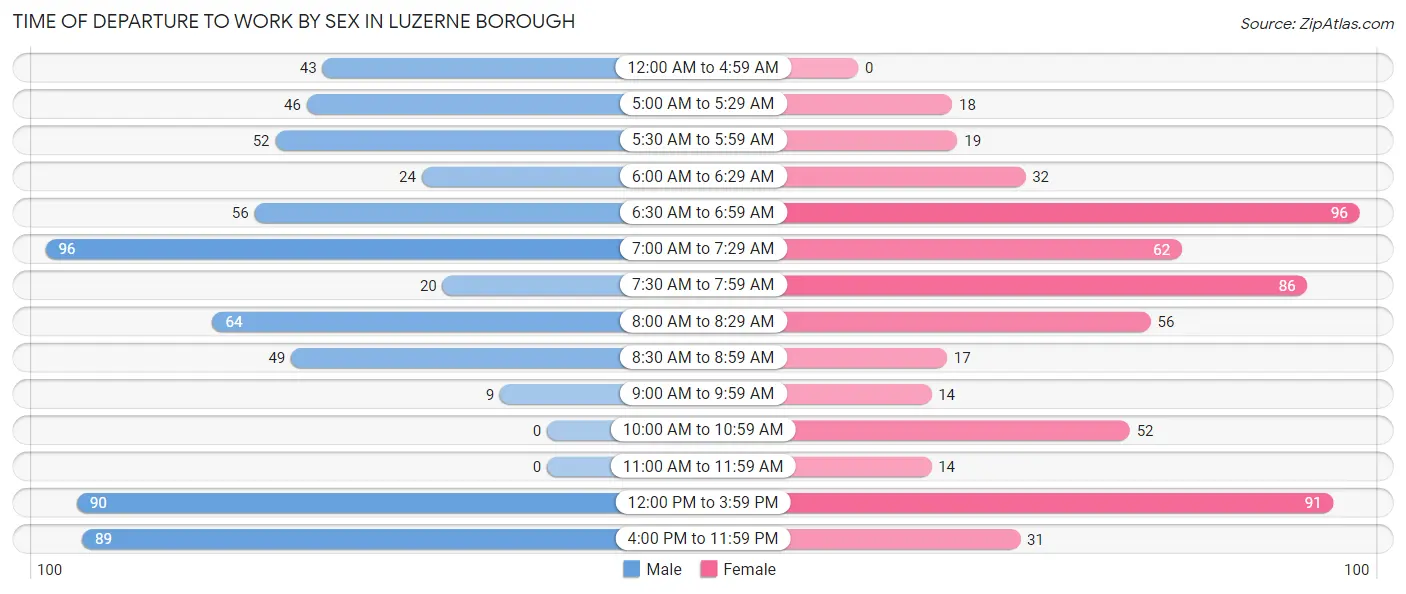
| Time of Departure | Male | Female |
| 12:00 AM to 4:59 AM | 43 (6.7%) | 0 (0.0%) |
| 5:00 AM to 5:29 AM | 46 (7.2%) | 18 (3.1%) |
| 5:30 AM to 5:59 AM | 52 (8.2%) | 19 (3.2%) |
| 6:00 AM to 6:29 AM | 24 (3.8%) | 32 (5.4%) |
| 6:30 AM to 6:59 AM | 56 (8.8%) | 96 (16.3%) |
| 7:00 AM to 7:29 AM | 96 (15.0%) | 62 (10.5%) |
| 7:30 AM to 7:59 AM | 20 (3.1%) | 86 (14.6%) |
| 8:00 AM to 8:29 AM | 64 (10.0%) | 56 (9.5%) |
| 8:30 AM to 8:59 AM | 49 (7.7%) | 17 (2.9%) |
| 9:00 AM to 9:59 AM | 9 (1.4%) | 14 (2.4%) |
| 10:00 AM to 10:59 AM | 0 (0.0%) | 52 (8.8%) |
| 11:00 AM to 11:59 AM | 0 (0.0%) | 14 (2.4%) |
| 12:00 PM to 3:59 PM | 90 (14.1%) | 91 (15.5%) |
| 4:00 PM to 11:59 PM | 89 (14.0%) | 31 (5.3%) |
| Total | 638 (100.0%) | 588 (100.0%) |
Housing Occupancy in Luzerne borough
Occupancy by Ownership in Luzerne borough
Of the total 1,403 dwellings in Luzerne borough, owner-occupied units account for 829 (59.1%), while renter-occupied units make up 574 (40.9%).
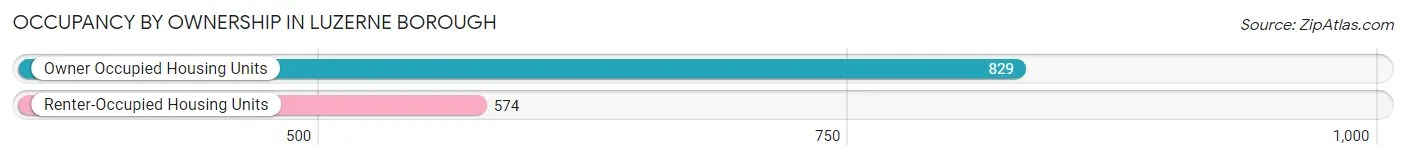
| Occupancy | # Housing Units | % Housing Units |
| Owner Occupied Housing Units | 829 | 59.1% |
| Renter-Occupied Housing Units | 574 | 40.9% |
| Total Occupied Housing Units | 1,403 | 100.0% |
Occupancy by Household Size in Luzerne borough
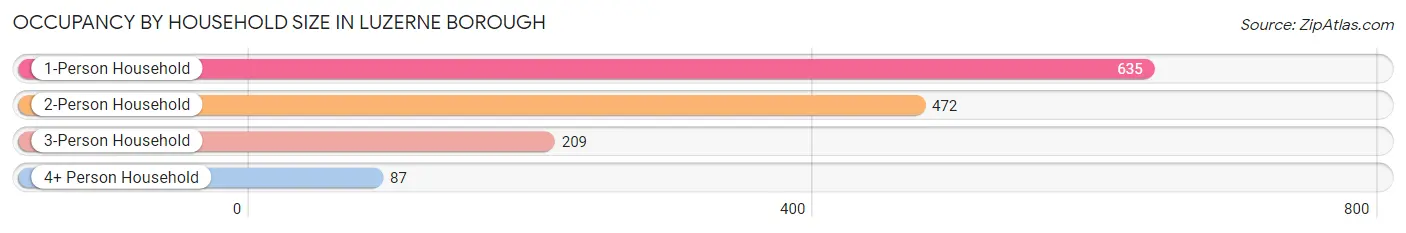
| Household Size | # Housing Units | % Housing Units |
| 1-Person Household | 635 | 45.3% |
| 2-Person Household | 472 | 33.6% |
| 3-Person Household | 209 | 14.9% |
| 4+ Person Household | 87 | 6.2% |
| Total Housing Units | 1,403 | 100.0% |
Occupancy by Ownership by Household Size in Luzerne borough
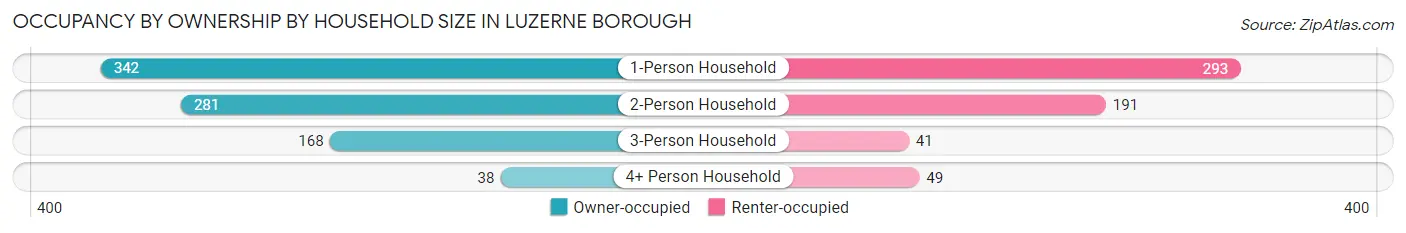
| Household Size | Owner-occupied | Renter-occupied |
| 1-Person Household | 342 (53.9%) | 293 (46.1%) |
| 2-Person Household | 281 (59.5%) | 191 (40.5%) |
| 3-Person Household | 168 (80.4%) | 41 (19.6%) |
| 4+ Person Household | 38 (43.7%) | 49 (56.3%) |
| Total Housing Units | 829 (59.1%) | 574 (40.9%) |
Occupancy by Educational Attainment in Luzerne borough
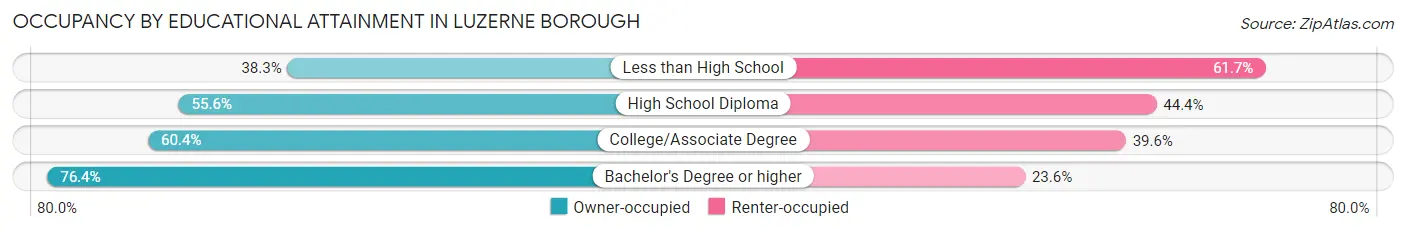
| Household Size | Owner-occupied | Renter-occupied |
| Less than High School | 36 (38.3%) | 58 (61.7%) |
| High School Diploma | 270 (55.6%) | 216 (44.4%) |
| College/Associate Degree | 400 (60.4%) | 262 (39.6%) |
| Bachelor's Degree or higher | 123 (76.4%) | 38 (23.6%) |
Occupancy by Age of Householder in Luzerne borough
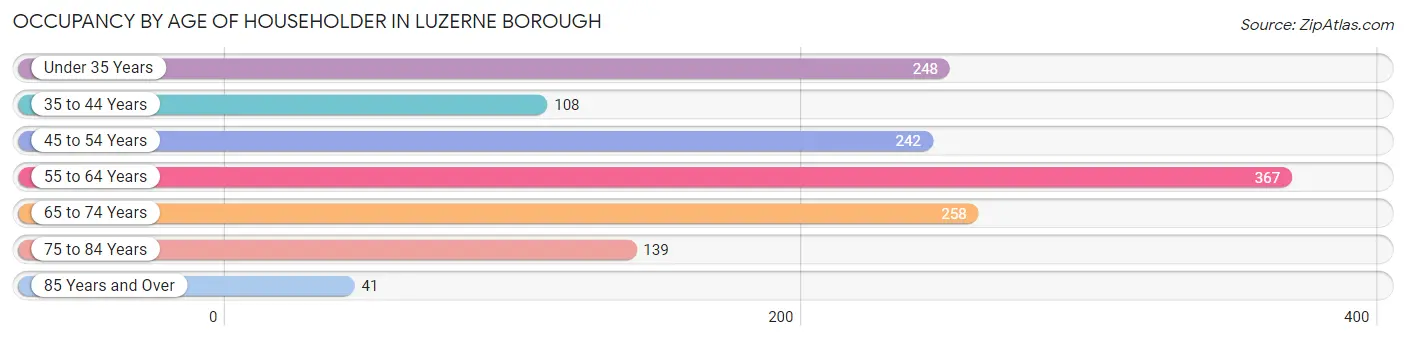
| Age Bracket | # Households | % Households |
| Under 35 Years | 248 | 17.7% |
| 35 to 44 Years | 108 | 7.7% |
| 45 to 54 Years | 242 | 17.2% |
| 55 to 64 Years | 367 | 26.2% |
| 65 to 74 Years | 258 | 18.4% |
| 75 to 84 Years | 139 | 9.9% |
| 85 Years and Over | 41 | 2.9% |
| Total | 1,403 | 100.0% |
Housing Finances in Luzerne borough
Median Income by Occupancy in Luzerne borough
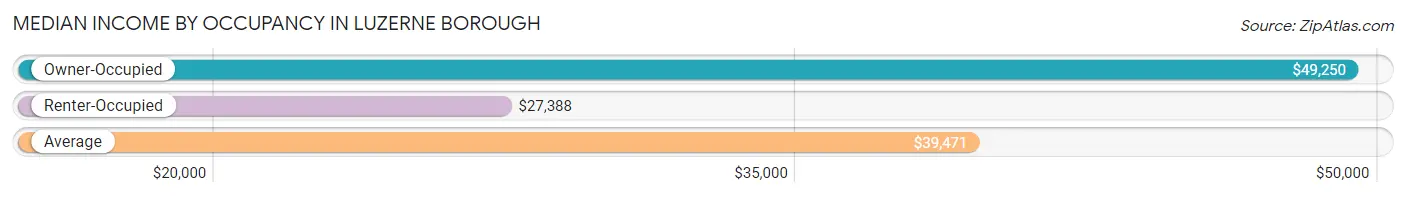
| Occupancy Type | # Households | Median Income |
| Owner-Occupied | 829 (59.1%) | $49,250 |
| Renter-Occupied | 574 (40.9%) | $27,388 |
| Average | 1,403 (100.0%) | $39,471 |
Occupancy by Householder Income Bracket in Luzerne borough
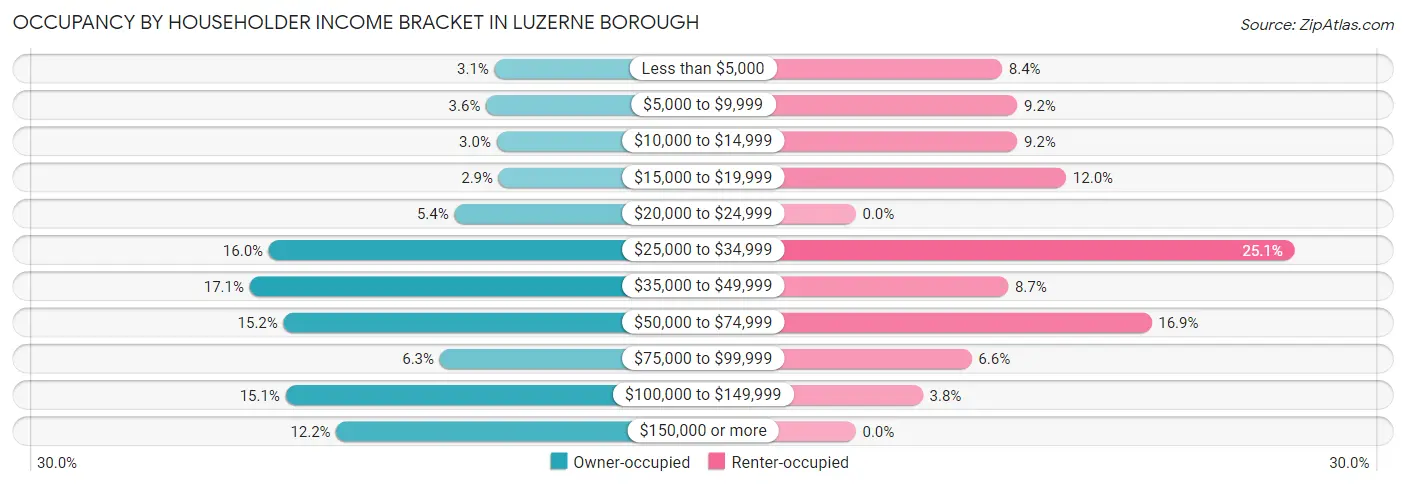
| Income Bracket | Owner-occupied | Renter-occupied |
| Less than $5,000 | 26 (3.1%) | 48 (8.4%) |
| $5,000 to $9,999 | 30 (3.6%) | 53 (9.2%) |
| $10,000 to $14,999 | 25 (3.0%) | 53 (9.2%) |
| $15,000 to $19,999 | 24 (2.9%) | 69 (12.0%) |
| $20,000 to $24,999 | 45 (5.4%) | 0 (0.0%) |
| $25,000 to $34,999 | 133 (16.0%) | 144 (25.1%) |
| $35,000 to $49,999 | 142 (17.1%) | 50 (8.7%) |
| $50,000 to $74,999 | 126 (15.2%) | 97 (16.9%) |
| $75,000 to $99,999 | 52 (6.3%) | 38 (6.6%) |
| $100,000 to $149,999 | 125 (15.1%) | 22 (3.8%) |
| $150,000 or more | 101 (12.2%) | 0 (0.0%) |
| Total | 829 (100.0%) | 574 (100.0%) |
Monthly Housing Cost Tiers in Luzerne borough
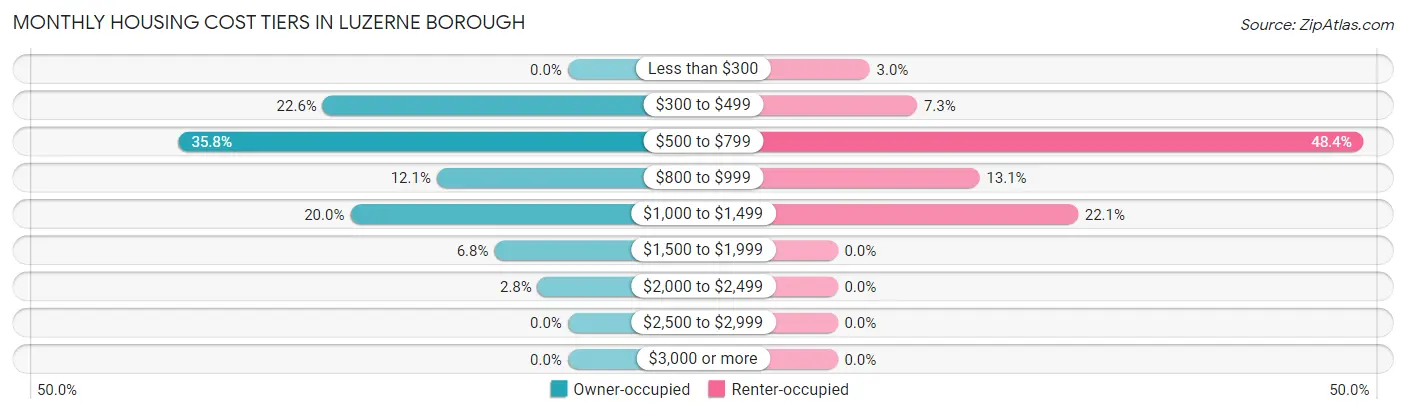
| Monthly Cost | Owner-occupied | Renter-occupied |
| Less than $300 | 0 (0.0%) | 17 (3.0%) |
| $300 to $499 | 187 (22.6%) | 42 (7.3%) |
| $500 to $799 | 297 (35.8%) | 278 (48.4%) |
| $800 to $999 | 100 (12.1%) | 75 (13.1%) |
| $1,000 to $1,499 | 166 (20.0%) | 127 (22.1%) |
| $1,500 to $1,999 | 56 (6.8%) | 0 (0.0%) |
| $2,000 to $2,499 | 23 (2.8%) | 0 (0.0%) |
| $2,500 to $2,999 | 0 (0.0%) | 0 (0.0%) |
| $3,000 or more | 0 (0.0%) | 0 (0.0%) |
| Total | 829 (100.0%) | 574 (100.0%) |
Physical Housing Characteristics in Luzerne borough
Housing Structures in Luzerne borough
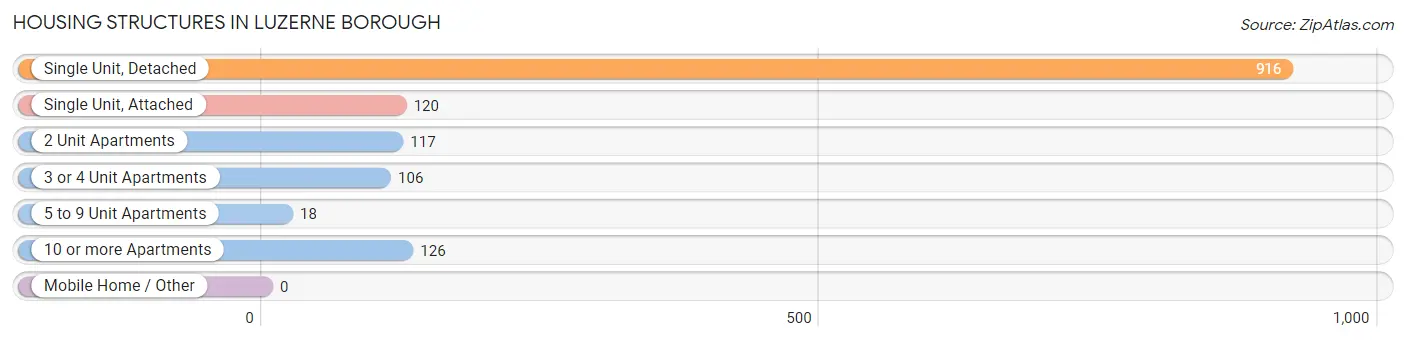
| Structure Type | # Housing Units | % Housing Units |
| Single Unit, Detached | 916 | 65.3% |
| Single Unit, Attached | 120 | 8.6% |
| 2 Unit Apartments | 117 | 8.3% |
| 3 or 4 Unit Apartments | 106 | 7.6% |
| 5 to 9 Unit Apartments | 18 | 1.3% |
| 10 or more Apartments | 126 | 9.0% |
| Mobile Home / Other | 0 | 0.0% |
| Total | 1,403 | 100.0% |
Housing Structures by Occupancy in Luzerne borough
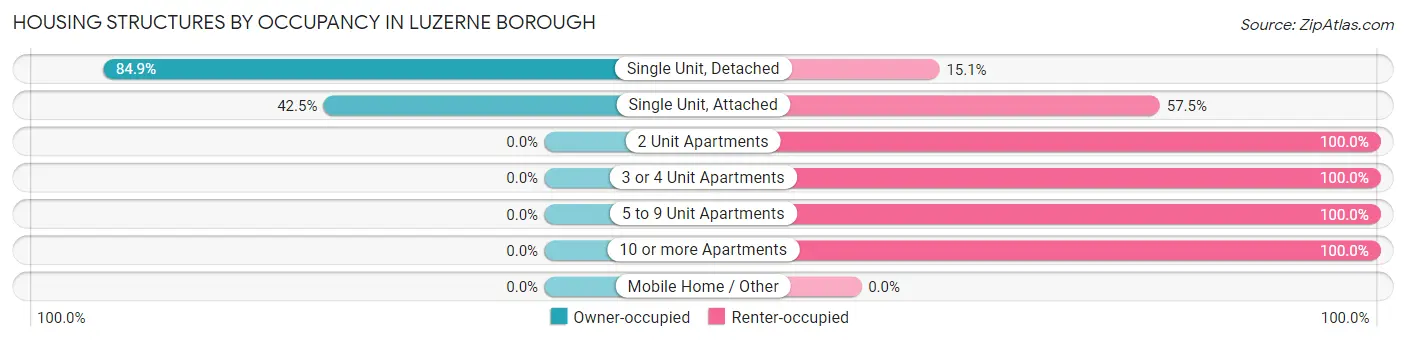
| Structure Type | Owner-occupied | Renter-occupied |
| Single Unit, Detached | 778 (84.9%) | 138 (15.1%) |
| Single Unit, Attached | 51 (42.5%) | 69 (57.5%) |
| 2 Unit Apartments | 0 (0.0%) | 117 (100.0%) |
| 3 or 4 Unit Apartments | 0 (0.0%) | 106 (100.0%) |
| 5 to 9 Unit Apartments | 0 (0.0%) | 18 (100.0%) |
| 10 or more Apartments | 0 (0.0%) | 126 (100.0%) |
| Mobile Home / Other | 0 (0.0%) | 0 (0.0%) |
| Total | 829 (59.1%) | 574 (40.9%) |
Housing Structures by Number of Rooms in Luzerne borough
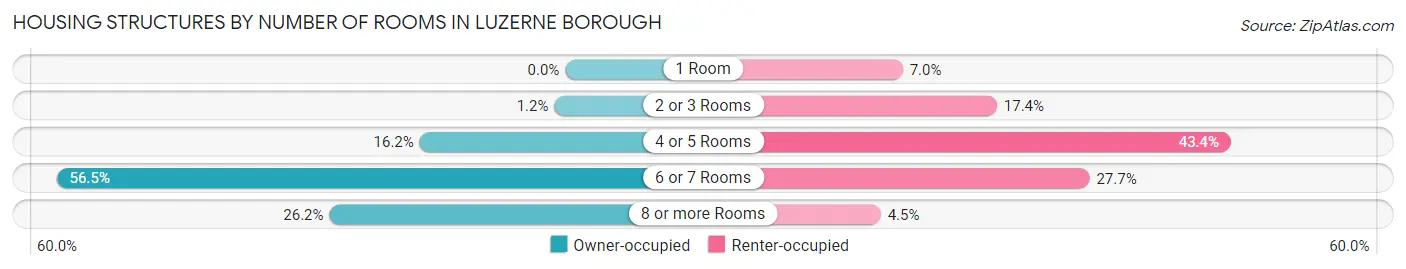
| Number of Rooms | Owner-occupied | Renter-occupied |
| 1 Room | 0 (0.0%) | 40 (7.0%) |
| 2 or 3 Rooms | 10 (1.2%) | 100 (17.4%) |
| 4 or 5 Rooms | 134 (16.2%) | 249 (43.4%) |
| 6 or 7 Rooms | 468 (56.5%) | 159 (27.7%) |
| 8 or more Rooms | 217 (26.2%) | 26 (4.5%) |
| Total | 829 (100.0%) | 574 (100.0%) |
Housing Structure by Heating Type in Luzerne borough
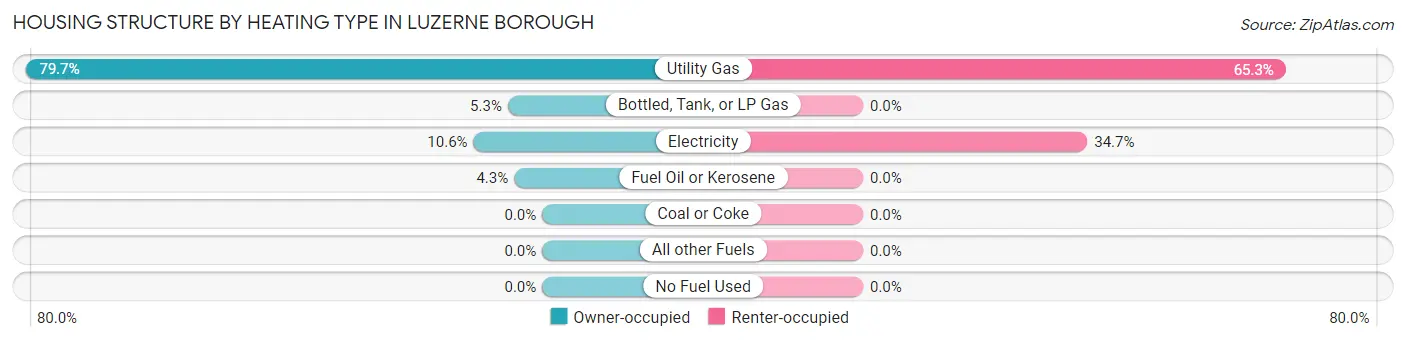
| Heating Type | Owner-occupied | Renter-occupied |
| Utility Gas | 661 (79.7%) | 375 (65.3%) |
| Bottled, Tank, or LP Gas | 44 (5.3%) | 0 (0.0%) |
| Electricity | 88 (10.6%) | 199 (34.7%) |
| Fuel Oil or Kerosene | 36 (4.3%) | 0 (0.0%) |
| Coal or Coke | 0 (0.0%) | 0 (0.0%) |
| All other Fuels | 0 (0.0%) | 0 (0.0%) |
| No Fuel Used | 0 (0.0%) | 0 (0.0%) |
| Total | 829 (100.0%) | 574 (100.0%) |
Household Vehicle Usage in Luzerne borough
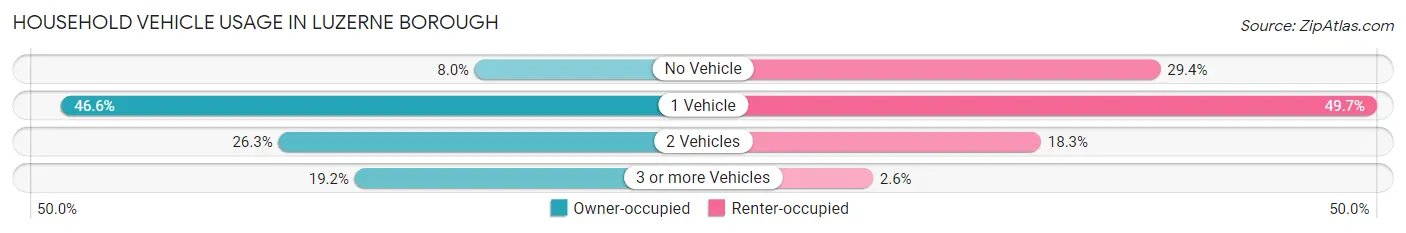
| Vehicles per Household | Owner-occupied | Renter-occupied |
| No Vehicle | 66 (8.0%) | 169 (29.4%) |
| 1 Vehicle | 386 (46.6%) | 285 (49.6%) |
| 2 Vehicles | 218 (26.3%) | 105 (18.3%) |
| 3 or more Vehicles | 159 (19.2%) | 15 (2.6%) |
| Total | 829 (100.0%) | 574 (100.0%) |
Real Estate & Mortgages in Luzerne borough
Real Estate and Mortgage Overview in Luzerne borough
| Characteristic | Without Mortgage | With Mortgage |
| Housing Units | 360 | 469 |
| Median Property Value | $75,500 | $116,700 |
| Median Household Income | $45,862 | $67 |
| Monthly Housing Costs | $491 | $0 |
| Real Estate Taxes | $1,726 | $0 |
Property Value by Mortgage Status in Luzerne borough
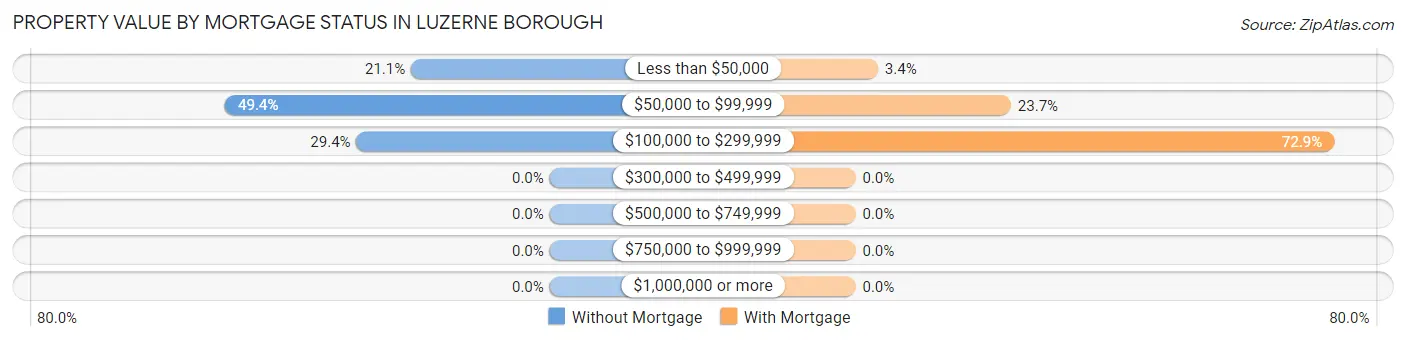
| Property Value | Without Mortgage | With Mortgage |
| Less than $50,000 | 76 (21.1%) | 16 (3.4%) |
| $50,000 to $99,999 | 178 (49.4%) | 111 (23.7%) |
| $100,000 to $299,999 | 106 (29.4%) | 342 (72.9%) |
| $300,000 to $499,999 | 0 (0.0%) | 0 (0.0%) |
| $500,000 to $749,999 | 0 (0.0%) | 0 (0.0%) |
| $750,000 to $999,999 | 0 (0.0%) | 0 (0.0%) |
| $1,000,000 or more | 0 (0.0%) | 0 (0.0%) |
| Total | 360 (100.0%) | 469 (100.0%) |
Household Income by Mortgage Status in Luzerne borough
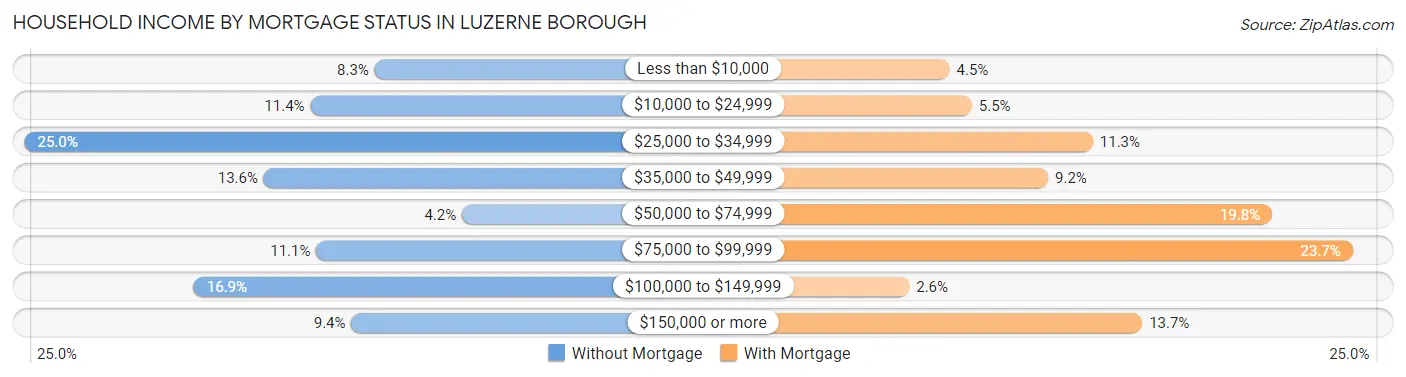
| Household Income | Without Mortgage | With Mortgage |
| Less than $10,000 | 30 (8.3%) | 21 (4.5%) |
| $10,000 to $24,999 | 41 (11.4%) | 26 (5.5%) |
| $25,000 to $34,999 | 90 (25.0%) | 53 (11.3%) |
| $35,000 to $49,999 | 49 (13.6%) | 43 (9.2%) |
| $50,000 to $74,999 | 15 (4.2%) | 93 (19.8%) |
| $75,000 to $99,999 | 40 (11.1%) | 111 (23.7%) |
| $100,000 to $149,999 | 61 (16.9%) | 12 (2.6%) |
| $150,000 or more | 34 (9.4%) | 64 (13.7%) |
| Total | 360 (100.0%) | 469 (100.0%) |
Property Value to Household Income Ratio in Luzerne borough
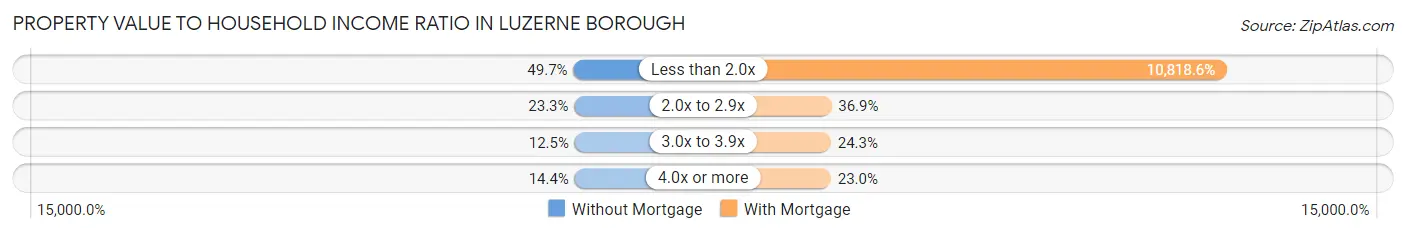
| Value-to-Income Ratio | Without Mortgage | With Mortgage |
| Less than 2.0x | 179 (49.7%) | 50,739 (10,818.6%) |
| 2.0x to 2.9x | 84 (23.3%) | 173 (36.9%) |
| 3.0x to 3.9x | 45 (12.5%) | 114 (24.3%) |
| 4.0x or more | 52 (14.4%) | 108 (23.0%) |
| Total | 360 (100.0%) | 469 (100.0%) |
Real Estate Taxes by Mortgage Status in Luzerne borough
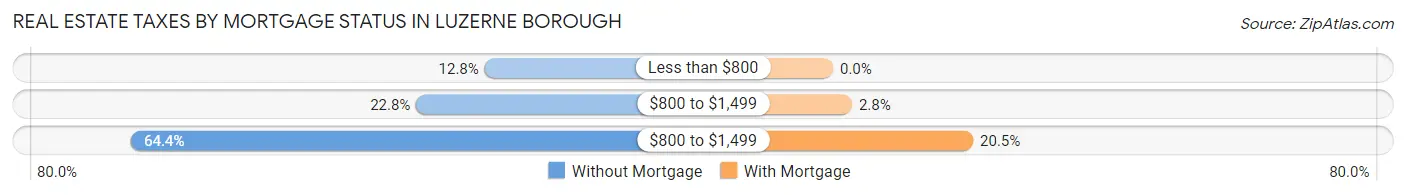
| Property Taxes | Without Mortgage | With Mortgage |
| Less than $800 | 46 (12.8%) | 0 (0.0%) |
| $800 to $1,499 | 82 (22.8%) | 13 (2.8%) |
| $800 to $1,499 | 232 (64.4%) | 96 (20.5%) |
| Total | 360 (100.0%) | 469 (100.0%) |
Health & Disability in Luzerne borough
Health Insurance Coverage by Age in Luzerne borough
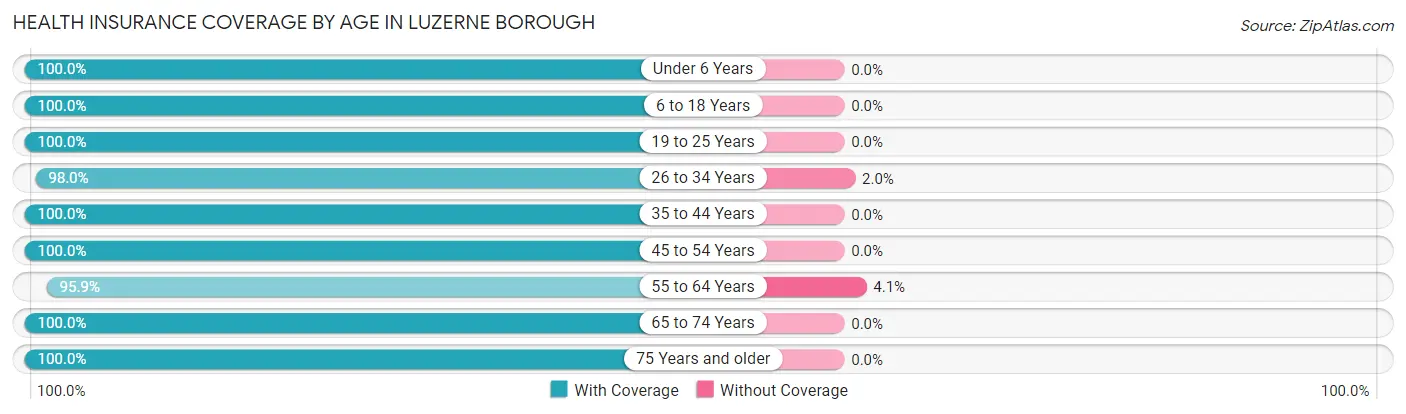
| Age Bracket | With Coverage | Without Coverage |
| Under 6 Years | 240 (100.0%) | 0 (0.0%) |
| 6 to 18 Years | 295 (100.0%) | 0 (0.0%) |
| 19 to 25 Years | 209 (100.0%) | 0 (0.0%) |
| 26 to 34 Years | 292 (98.0%) | 6 (2.0%) |
| 35 to 44 Years | 201 (100.0%) | 0 (0.0%) |
| 45 to 54 Years | 418 (100.0%) | 0 (0.0%) |
| 55 to 64 Years | 420 (95.9%) | 18 (4.1%) |
| 65 to 74 Years | 367 (100.0%) | 0 (0.0%) |
| 75 Years and older | 252 (100.0%) | 0 (0.0%) |
| Total | 2,694 (99.1%) | 24 (0.9%) |
Health Insurance Coverage by Citizenship Status in Luzerne borough

| Citizenship Status | With Coverage | Without Coverage |
| Native Born | 240 (100.0%) | 0 (0.0%) |
| Foreign Born, Citizen | 295 (100.0%) | 0 (0.0%) |
| Foreign Born, not a Citizen | 209 (100.0%) | 0 (0.0%) |
Health Insurance Coverage by Household Income in Luzerne borough
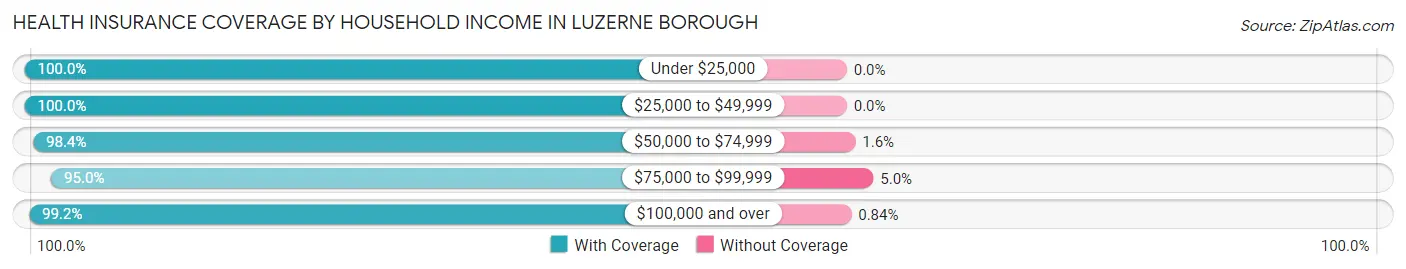
| Household Income | With Coverage | Without Coverage |
| Under $25,000 | 480 (100.0%) | 0 (0.0%) |
| $25,000 to $49,999 | 901 (100.0%) | 0 (0.0%) |
| $50,000 to $74,999 | 368 (98.4%) | 6 (1.6%) |
| $75,000 to $99,999 | 229 (95.0%) | 12 (5.0%) |
| $100,000 and over | 712 (99.2%) | 6 (0.8%) |
Public vs Private Health Insurance Coverage by Age in Luzerne borough
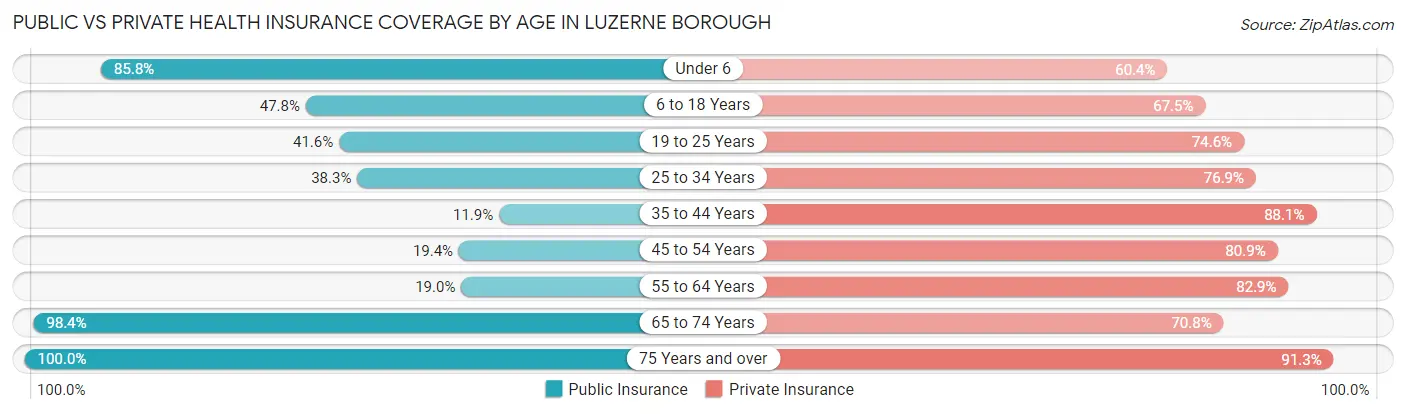
| Age Bracket | Public Insurance | Private Insurance |
| Under 6 | 206 (85.8%) | 145 (60.4%) |
| 6 to 18 Years | 141 (47.8%) | 199 (67.5%) |
| 19 to 25 Years | 87 (41.6%) | 156 (74.6%) |
| 25 to 34 Years | 114 (38.3%) | 229 (76.8%) |
| 35 to 44 Years | 24 (11.9%) | 177 (88.1%) |
| 45 to 54 Years | 81 (19.4%) | 338 (80.9%) |
| 55 to 64 Years | 83 (19.0%) | 363 (82.9%) |
| 65 to 74 Years | 361 (98.4%) | 260 (70.8%) |
| 75 Years and over | 252 (100.0%) | 230 (91.3%) |
| Total | 1,349 (49.6%) | 2,097 (77.1%) |
Disability Status by Sex by Age in Luzerne borough
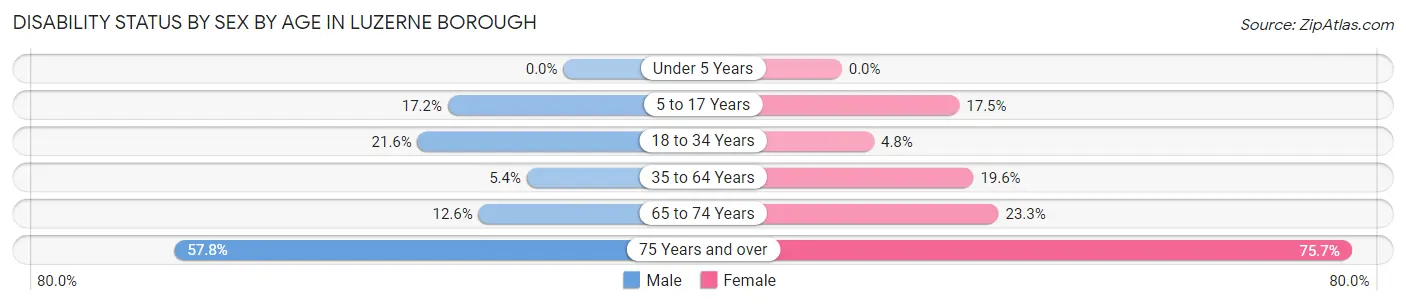
| Age Bracket | Male | Female |
| Under 5 Years | 0 (0.0%) | 0 (0.0%) |
| 5 to 17 Years | 29 (17.2%) | 22 (17.5%) |
| 18 to 34 Years | 74 (21.6%) | 9 (4.8%) |
| 35 to 64 Years | 26 (5.4%) | 113 (19.6%) |
| 65 to 74 Years | 17 (12.6%) | 54 (23.3%) |
| 75 Years and over | 41 (57.8%) | 137 (75.7%) |
Disability Class by Sex by Age in Luzerne borough
Disability Class: Hearing Difficulty
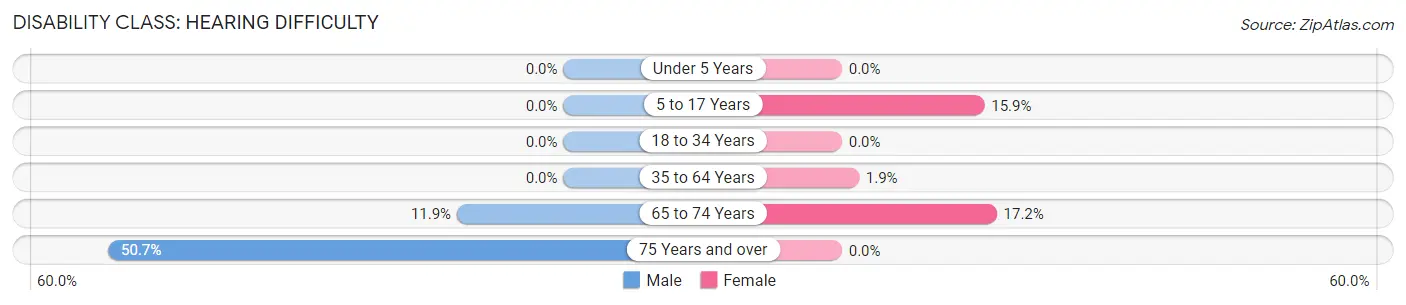
| Age Bracket | Male | Female |
| Under 5 Years | 0 (0.0%) | 0 (0.0%) |
| 5 to 17 Years | 0 (0.0%) | 20 (15.9%) |
| 18 to 34 Years | 0 (0.0%) | 0 (0.0%) |
| 35 to 64 Years | 0 (0.0%) | 11 (1.9%) |
| 65 to 74 Years | 16 (11.8%) | 40 (17.2%) |
| 75 Years and over | 36 (50.7%) | 0 (0.0%) |
Disability Class: Vision Difficulty
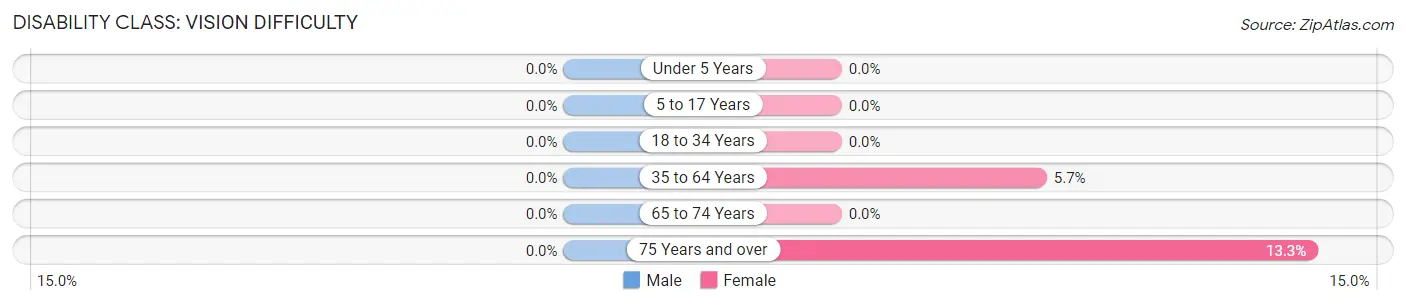
| Age Bracket | Male | Female |
| Under 5 Years | 0 (0.0%) | 0 (0.0%) |
| 5 to 17 Years | 0 (0.0%) | 0 (0.0%) |
| 18 to 34 Years | 0 (0.0%) | 0 (0.0%) |
| 35 to 64 Years | 0 (0.0%) | 33 (5.7%) |
| 65 to 74 Years | 0 (0.0%) | 0 (0.0%) |
| 75 Years and over | 0 (0.0%) | 24 (13.3%) |
Disability Class: Cognitive Difficulty
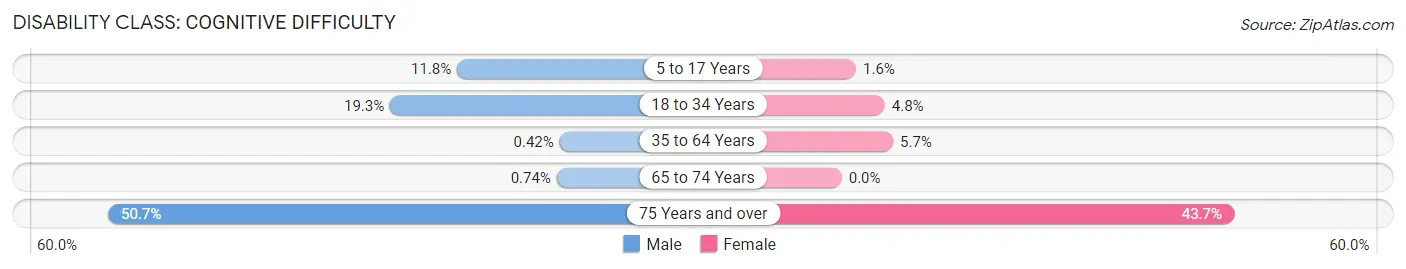
| Age Bracket | Male | Female |
| 5 to 17 Years | 20 (11.8%) | 2 (1.6%) |
| 18 to 34 Years | 66 (19.3%) | 9 (4.8%) |
| 35 to 64 Years | 2 (0.4%) | 33 (5.7%) |
| 65 to 74 Years | 1 (0.7%) | 0 (0.0%) |
| 75 Years and over | 36 (50.7%) | 79 (43.6%) |
Disability Class: Ambulatory Difficulty
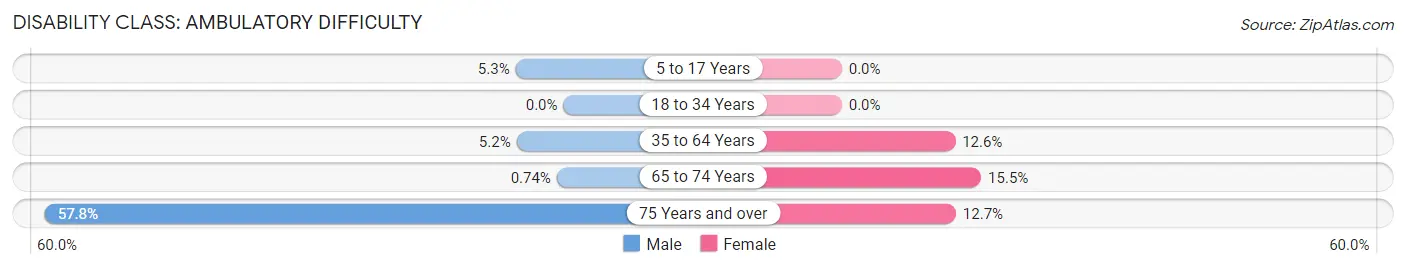
| Age Bracket | Male | Female |
| 5 to 17 Years | 9 (5.3%) | 0 (0.0%) |
| 18 to 34 Years | 0 (0.0%) | 0 (0.0%) |
| 35 to 64 Years | 25 (5.2%) | 73 (12.6%) |
| 65 to 74 Years | 1 (0.7%) | 36 (15.5%) |
| 75 Years and over | 41 (57.8%) | 23 (12.7%) |
Disability Class: Self-Care Difficulty
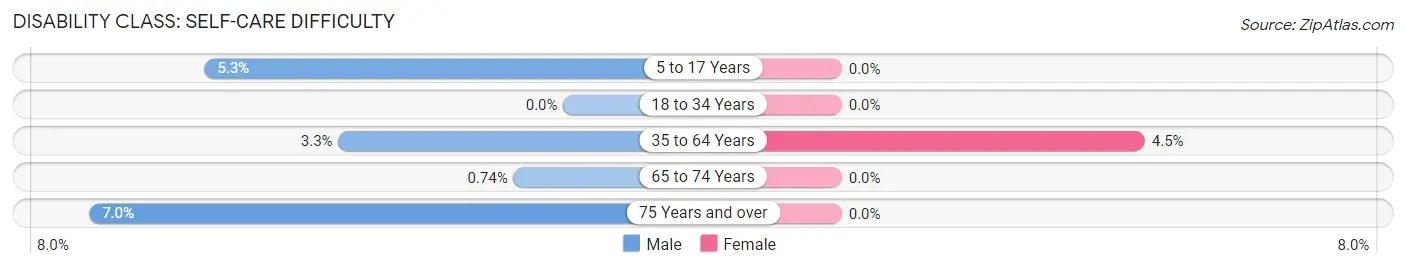
| Age Bracket | Male | Female |
| 5 to 17 Years | 9 (5.3%) | 0 (0.0%) |
| 18 to 34 Years | 0 (0.0%) | 0 (0.0%) |
| 35 to 64 Years | 16 (3.3%) | 26 (4.5%) |
| 65 to 74 Years | 1 (0.7%) | 0 (0.0%) |
| 75 Years and over | 5 (7.0%) | 0 (0.0%) |
Technology Access in Luzerne borough
Computing Device Access in Luzerne borough
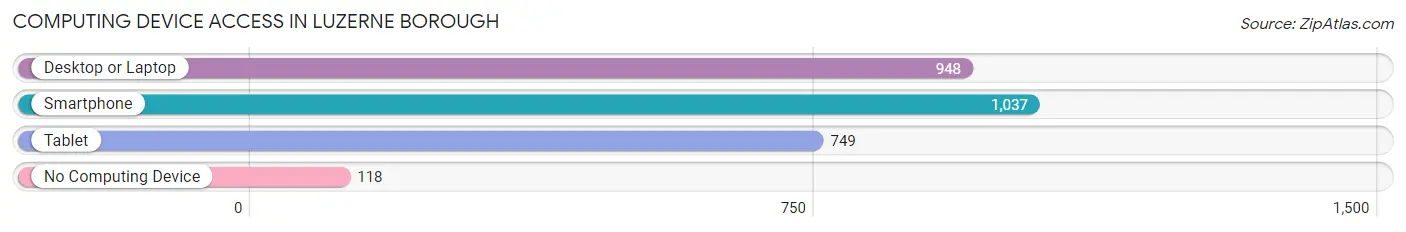
| Device Type | # Households | % Households |
| Desktop or Laptop | 948 | 67.6% |
| Smartphone | 1,037 | 73.9% |
| Tablet | 749 | 53.4% |
| No Computing Device | 118 | 8.4% |
| Total | 1,403 | 100.0% |
Internet Access in Luzerne borough
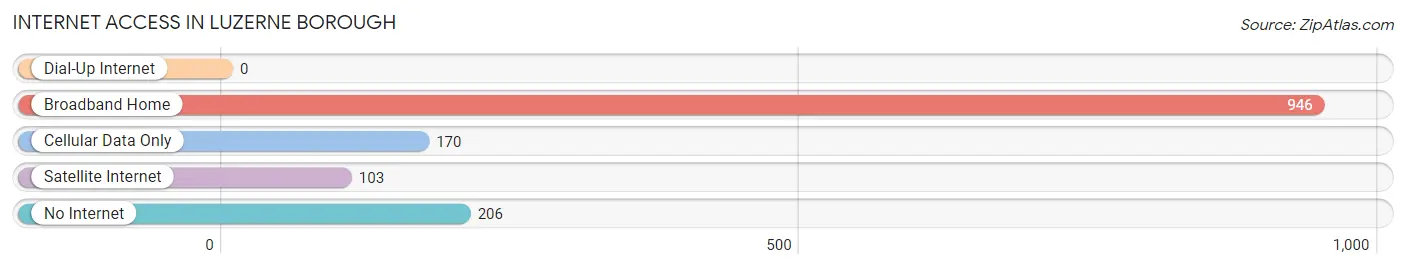
| Internet Type | # Households | % Households |
| Dial-Up Internet | 0 | 0.0% |
| Broadband Home | 946 | 67.4% |
| Cellular Data Only | 170 | 12.1% |
| Satellite Internet | 103 | 7.3% |
| No Internet | 206 | 14.7% |
| Total | 1,403 | 100.0% |
Luzerne borough Summary
Luzerne Borough is a small borough located in Luzerne County, Pennsylvania. It is situated in the Wyoming Valley, a region of the Appalachian Mountains. The borough is located in the heart of the Wyoming Valley, and is bordered by the Susquehanna River to the north, the Lackawanna River to the east, and the Nescopeck Creek to the south. The borough is home to a population of approximately 1,500 people.
History
Luzerne Borough was founded in 1845 by a group of settlers from Wilkes-Barre. The borough was named after the French explorer, Louis de Luzerne, who explored the area in the late 1700s. The borough was originally part of the larger town of Wilkes-Barre, but was incorporated as its own borough in 1845.
The borough was an important center of industry in the late 19th and early 20th centuries. The borough was home to several coal mines, as well as a number of factories and mills. The borough was also home to a number of churches, including the First Presbyterian Church, which was founded in 1845.
Geography
Luzerne Borough is located in the Wyoming Valley of northeastern Pennsylvania. The borough is situated in the heart of the valley, and is bordered by the Susquehanna River to the north, the Lackawanna River to the east, and the Nescopeck Creek to the south. The borough is located approximately 10 miles south of Wilkes-Barre, and is approximately 30 miles north of Scranton.
The borough is located in a hilly region of the Appalachian Mountains. The terrain is mostly wooded, with some open fields and meadows. The borough is located at an elevation of approximately 1,000 feet above sea level.
Economy
The economy of Luzerne Borough is largely based on the service industry. The borough is home to a number of restaurants, bars, and other businesses that cater to the local population. The borough is also home to a number of small manufacturing businesses, as well as a number of retail stores.
The borough is also home to a number of small businesses, including a number of antique stores, art galleries, and other specialty shops. The borough is also home to a number of professional services, such as lawyers, accountants, and other professionals.
Demographics
As of the 2010 census, the population of Luzerne Borough was 1,521. The racial makeup of the borough was 97.3% White, 0.7% African American, 0.2% Native American, 0.3% Asian, 0.1% Pacific Islander, 0.3% from other races, and 1.3% from two or more races. Hispanic or Latino of any race were 1.3% of the population.
The median household income in the borough was $37,917, and the median family income was $45,625. The per capita income for the borough was $19,945. About 11.3% of families and 14.2% of the population were below the poverty line, including 22.2% of those under age 18 and 8.3% of those age 65 or over.
Common Questions
What is Per Capita Income in Luzerne borough?
Per Capita income in Luzerne borough is $29,488.
What is the Median Family Income in Luzerne borough?
Median Family Income in Luzerne borough is $52,045.
What is the Median Household income in Luzerne borough?
Median Household Income in Luzerne borough is $39,471.
What is Income or Wage Gap in Luzerne borough?
Income or Wage Gap in Luzerne borough is 26.2%.
Women in Luzerne borough earn 73.8 cents for every dollar earned by a man.
What is Inequality or Gini Index in Luzerne borough?
Inequality or Gini Index in Luzerne borough is 0.46.
What is the Total Population of Luzerne borough?
Total Population of Luzerne borough is 2,718.
What is the Total Male Population of Luzerne borough?
Total Male Population of Luzerne borough is 1,362.
What is the Total Female Population of Luzerne borough?
Total Female Population of Luzerne borough is 1,356.
What is the Ratio of Males per 100 Females in Luzerne borough?
There are 100.44 Males per 100 Females in Luzerne borough.
What is the Ratio of Females per 100 Males in Luzerne borough?
There are 99.56 Females per 100 Males in Luzerne borough.
What is the Median Population Age in Luzerne borough?
Median Population Age in Luzerne borough is 49.4 Years.
What is the Average Family Size in Luzerne borough
Average Family Size in Luzerne borough is 2.8 People.
What is the Average Household Size in Luzerne borough
Average Household Size in Luzerne borough is 1.9 People.
How Large is the Labor Force in Luzerne borough?
There are 1,476 People in the Labor Forcein in Luzerne borough.
What is the Percentage of People in the Labor Force in Luzerne borough?
63.6% of People are in the Labor Force in Luzerne borough.
What is the Unemployment Rate in Luzerne borough?
Unemployment Rate in Luzerne borough is 7.1%.