Mattawana, PA Map & Demographics
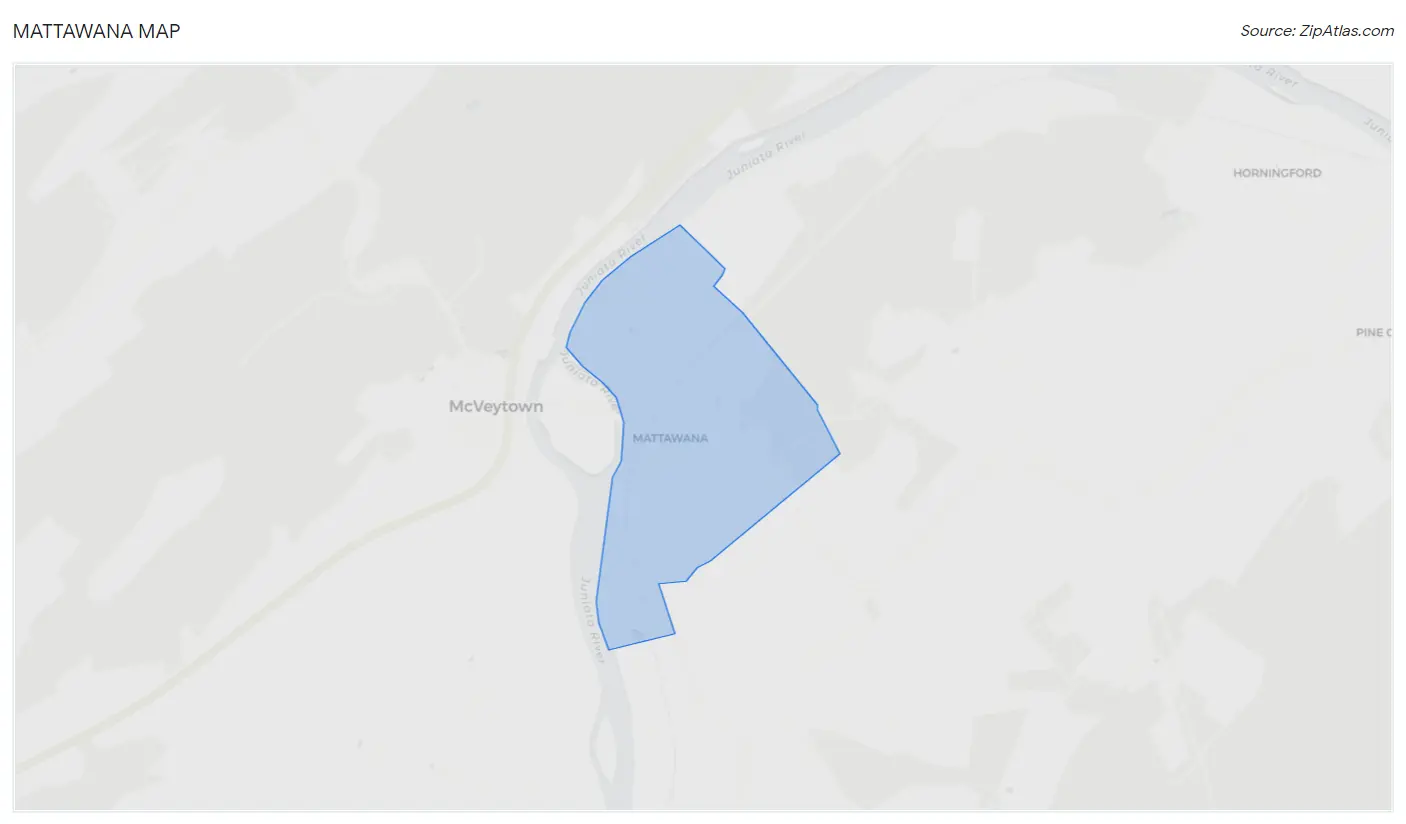
Mattawana Map
Mattawana Overview
$25,703
PER CAPITA INCOME
$86,528
AVG FAMILY INCOME
$81,667
AVG HOUSEHOLD INCOME
3.0%
WAGE / INCOME GAP [ % ]
97.0¢/ $1
WAGE / INCOME GAP [ $ ]
0.30
INEQUALITY / GINI INDEX
398
TOTAL POPULATION
206
MALE POPULATION
192
FEMALE POPULATION
107.29
MALES / 100 FEMALES
93.20
FEMALES / 100 MALES
31.9
MEDIAN AGE
3.3
AVG FAMILY SIZE
3.2
AVG HOUSEHOLD SIZE
187
LABOR FORCE [ PEOPLE ]
70.3%
PERCENT IN LABOR FORCE
Mattawana Zip Codes
Income in Mattawana
Income Overview in Mattawana
Per Capita Income in Mattawana is $25,703, while median incomes of families and households are $86,528 and $81,667 respectively.
| Characteristic | Number | Measure |
| Per Capita Income | 398 | $25,703 |
| Median Family Income | 111 | $86,528 |
| Mean Family Income | 111 | $87,571 |
| Median Household Income | 124 | $81,667 |
| Mean Household Income | 124 | $83,054 |
| Income Deficit | 111 | $0 |
| Wage / Income Gap (%) | 398 | 2.96% |
| Wage / Income Gap ($) | 398 | 97.04¢ per $1 |
| Gini / Inequality Index | 398 | 0.30 |
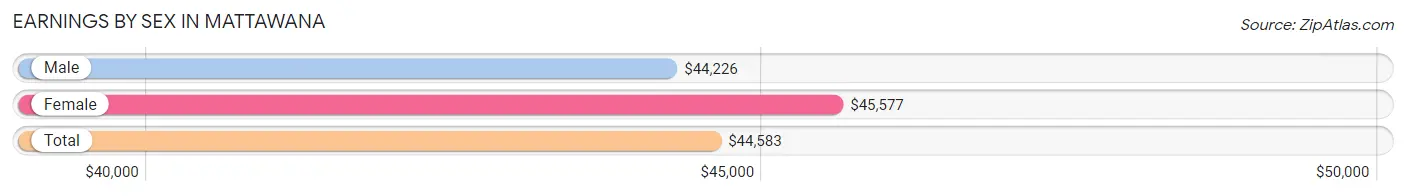
Earnings by Sex in Mattawana
Average Earnings in Mattawana are $44,583, $44,226 for men and $45,577 for women, a difference of 3.0%.
| Sex | Number | Average Earnings |
| Male | 111 (59.4%) | $44,226 |
| Female | 76 (40.6%) | $45,577 |
| Total | 187 (100.0%) | $44,583 |
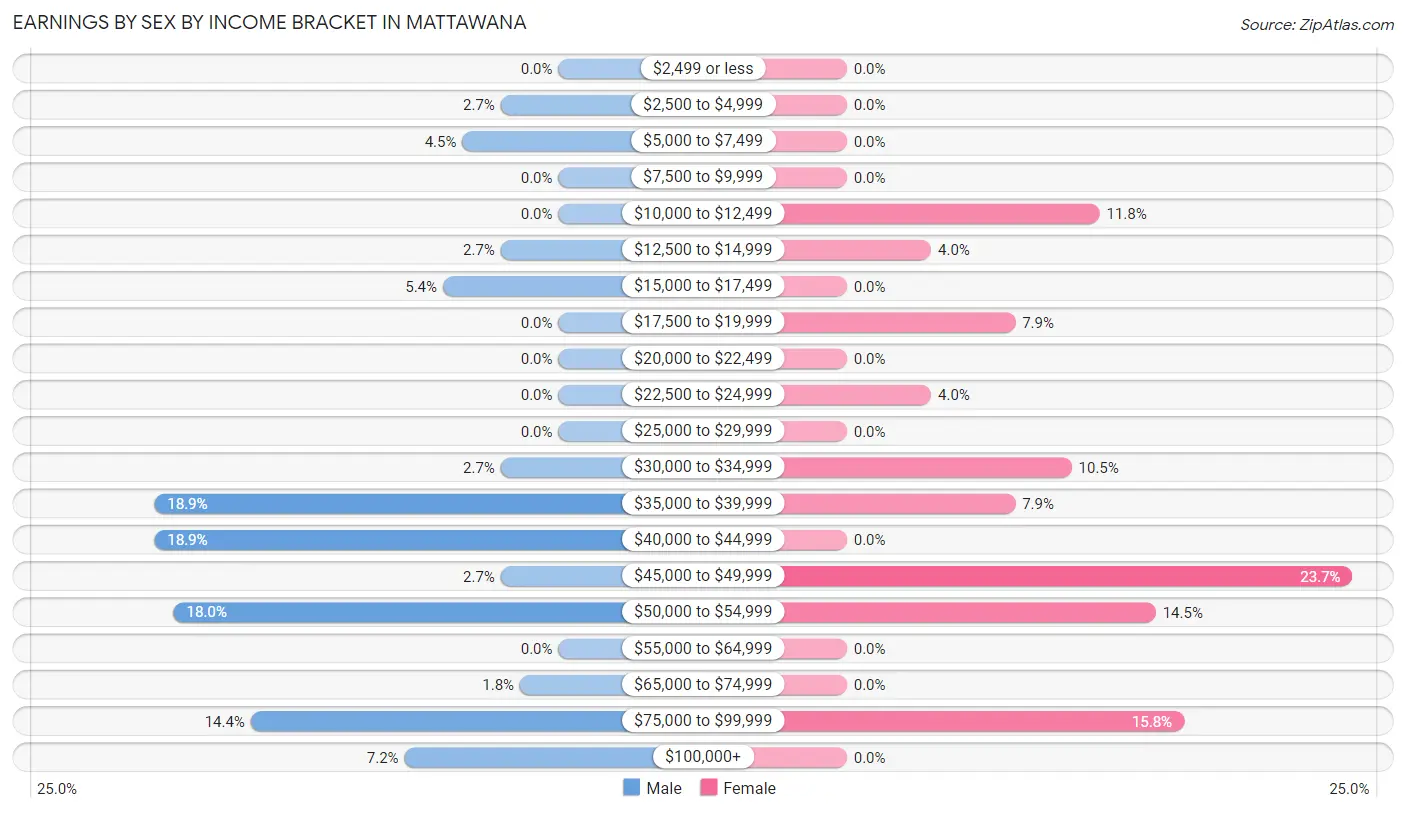
Earnings by Sex by Income Bracket in Mattawana
The most common earnings brackets in Mattawana are $35,000 to $39,999 for men (21 | 18.9%) and $45,000 to $49,999 for women (18 | 23.7%).
| Income | Male | Female |
| $2,499 or less | 0 (0.0%) | 0 (0.0%) |
| $2,500 to $4,999 | 3 (2.7%) | 0 (0.0%) |
| $5,000 to $7,499 | 5 (4.5%) | 0 (0.0%) |
| $7,500 to $9,999 | 0 (0.0%) | 0 (0.0%) |
| $10,000 to $12,499 | 0 (0.0%) | 9 (11.8%) |
| $12,500 to $14,999 | 3 (2.7%) | 3 (4.0%) |
| $15,000 to $17,499 | 6 (5.4%) | 0 (0.0%) |
| $17,500 to $19,999 | 0 (0.0%) | 6 (7.9%) |
| $20,000 to $22,499 | 0 (0.0%) | 0 (0.0%) |
| $22,500 to $24,999 | 0 (0.0%) | 3 (4.0%) |
| $25,000 to $29,999 | 0 (0.0%) | 0 (0.0%) |
| $30,000 to $34,999 | 3 (2.7%) | 8 (10.5%) |
| $35,000 to $39,999 | 21 (18.9%) | 6 (7.9%) |
| $40,000 to $44,999 | 21 (18.9%) | 0 (0.0%) |
| $45,000 to $49,999 | 3 (2.7%) | 18 (23.7%) |
| $50,000 to $54,999 | 20 (18.0%) | 11 (14.5%) |
| $55,000 to $64,999 | 0 (0.0%) | 0 (0.0%) |
| $65,000 to $74,999 | 2 (1.8%) | 0 (0.0%) |
| $75,000 to $99,999 | 16 (14.4%) | 12 (15.8%) |
| $100,000+ | 8 (7.2%) | 0 (0.0%) |
| Total | 111 (100.0%) | 76 (100.0%) |
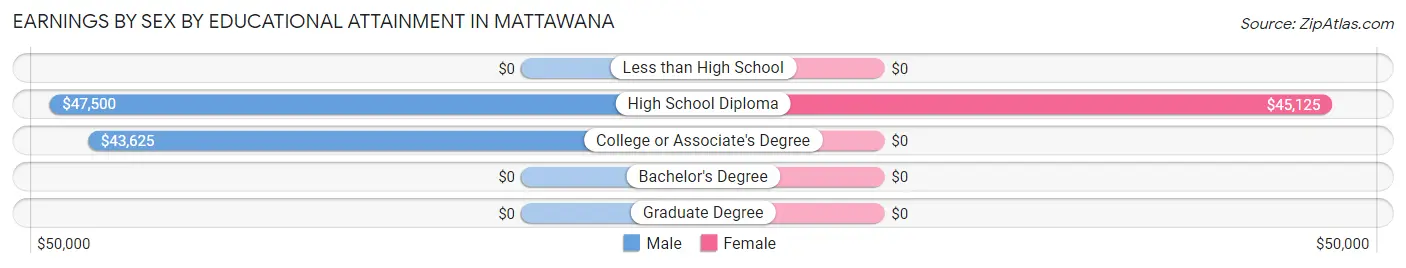
Earnings by Sex by Educational Attainment in Mattawana
Average earnings in Mattawana are $50,278 for men and $47,019 for women, a difference of 6.5%. Men with an educational attainment of high school diploma enjoy the highest average annual earnings of $47,500, while those with college or associate's degree education earn the least with $43,625. Women with an educational attainment of high school diploma earn the most with the average annual earnings of $45,125, while those with high school diploma education have the smallest earnings of $45,125.
| Educational Attainment | Male Income | Female Income |
| Less than High School | - | - |
| High School Diploma | $47,500 | $45,125 |
| College or Associate's Degree | $43,625 | $0 |
| Bachelor's Degree | - | - |
| Graduate Degree | - | - |
| Total | $50,278 | $47,019 |
Family Income in Mattawana
Family Income Brackets in Mattawana
According to the Mattawana family income data, there are 36 families falling into the $50,000 to $74,999 income range, which is the most common income bracket and makes up 32.4% of all families.
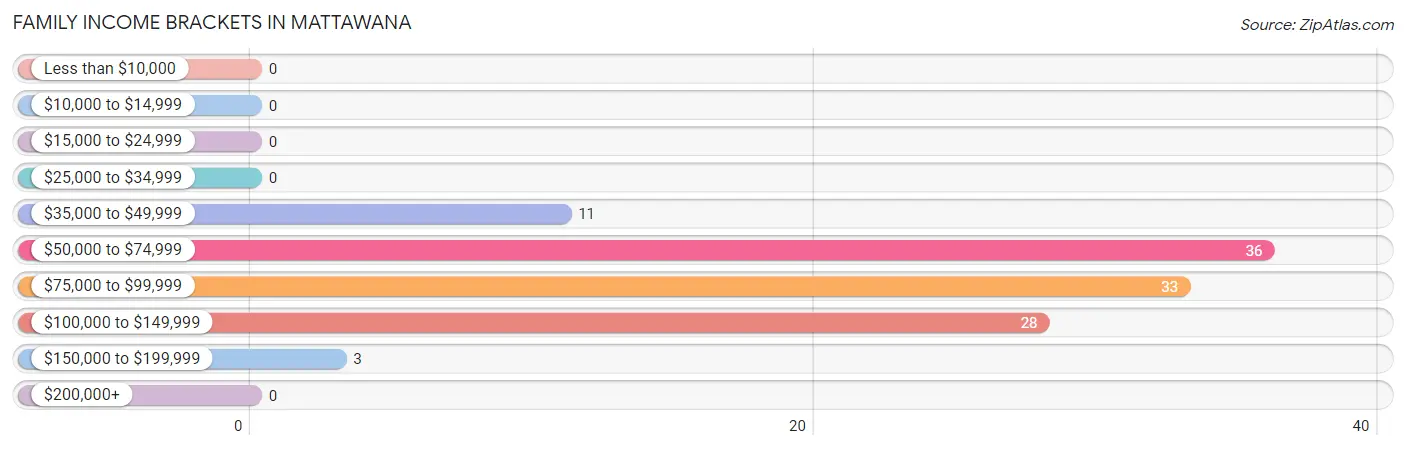
| Income Bracket | # Families | % Families |
| Less than $10,000 | 0 | 0.0% |
| $10,000 to $14,999 | 0 | 0.0% |
| $15,000 to $24,999 | 0 | 0.0% |
| $25,000 to $34,999 | 0 | 0.0% |
| $35,000 to $49,999 | 11 | 9.9% |
| $50,000 to $74,999 | 36 | 32.4% |
| $75,000 to $99,999 | 33 | 29.7% |
| $100,000 to $149,999 | 28 | 25.2% |
| $150,000 to $199,999 | 3 | 2.7% |
| $200,000+ | 0 | 0.0% |
Family Income by Famaliy Size in Mattawana
3-person families (30 | 27.0%) account for the highest median family income in Mattawana with $121,875 per family, while 3-person families (30 | 27.0%) have the highest median income of $40,625 per family member.
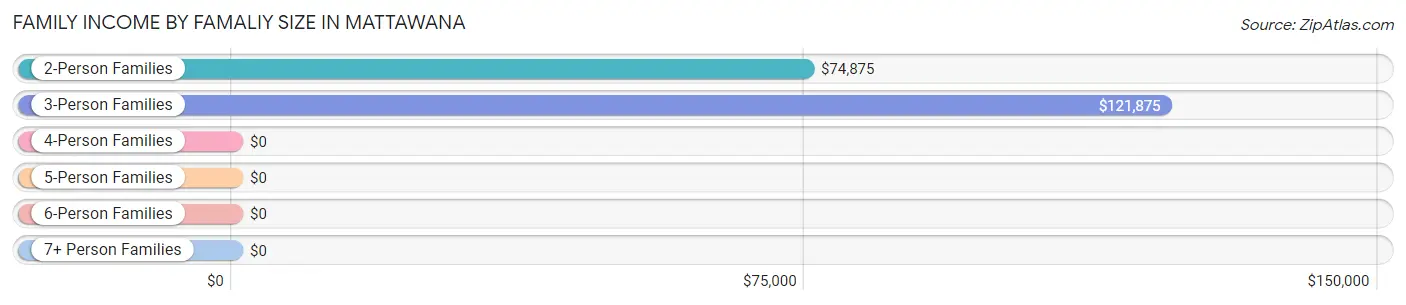
| Income Bracket | # Families | Median Income |
| 2-Person Families | 51 (46.0%) | $74,875 |
| 3-Person Families | 30 (27.0%) | $121,875 |
| 4-Person Families | 6 (5.4%) | $0 |
| 5-Person Families | 3 (2.7%) | $0 |
| 6-Person Families | 12 (10.8%) | $0 |
| 7+ Person Families | 9 (8.1%) | $0 |
| Total | 111 (100.0%) | $86,528 |
Family Income by Number of Earners in Mattawana
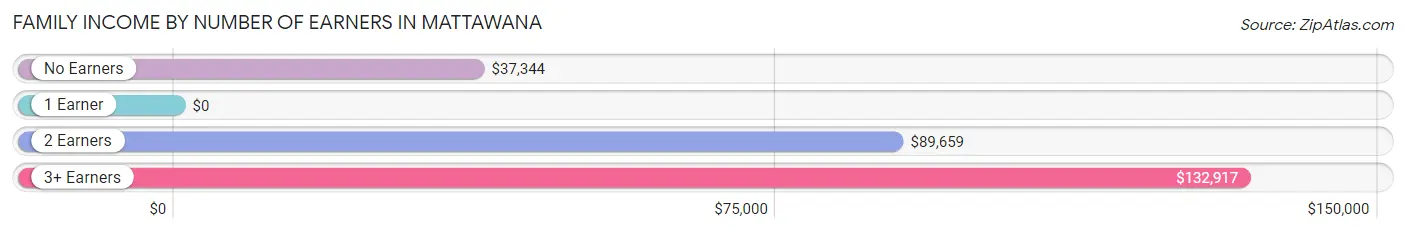
| Number of Earners | # Families | Median Income |
| No Earners | 15 (13.5%) | $37,344 |
| 1 Earner | 40 (36.0%) | $0 |
| 2 Earners | 45 (40.5%) | $89,659 |
| 3+ Earners | 11 (9.9%) | $132,917 |
| Total | 111 (100.0%) | $86,528 |
Household Income in Mattawana
Household Income Brackets in Mattawana
With 37 households falling in the category, the $100,000 to $149,999 income range is the most frequent in Mattawana, accounting for 29.8% of all households.
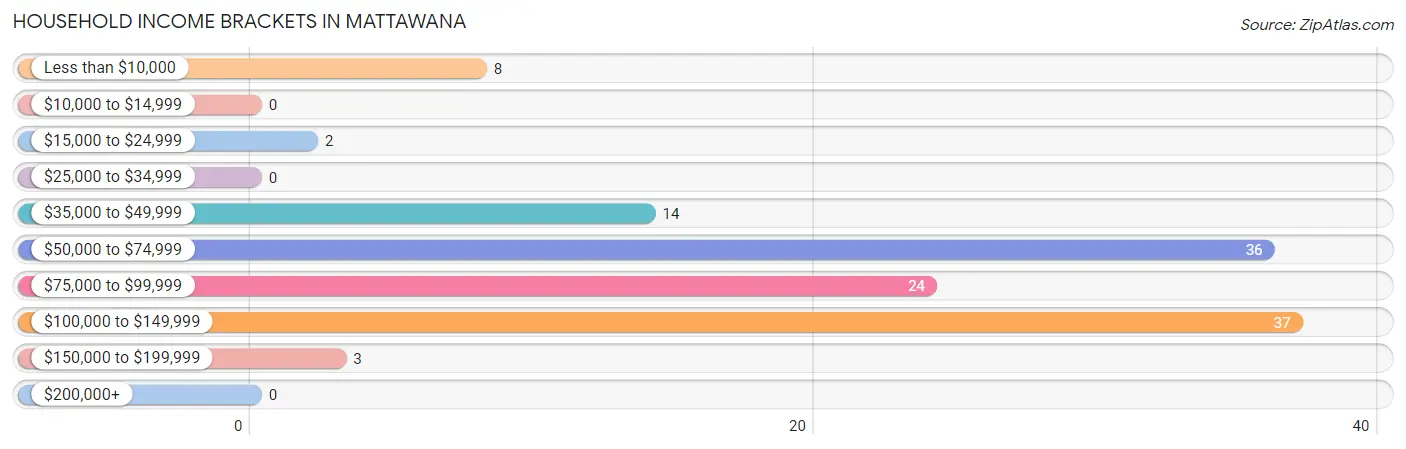
| Income Bracket | # Households | % Households |
| Less than $10,000 | 8 | 6.5% |
| $10,000 to $14,999 | 0 | 0.0% |
| $15,000 to $24,999 | 2 | 1.6% |
| $25,000 to $34,999 | 0 | 0.0% |
| $35,000 to $49,999 | 14 | 11.3% |
| $50,000 to $74,999 | 36 | 29.0% |
| $75,000 to $99,999 | 24 | 19.4% |
| $100,000 to $149,999 | 37 | 29.8% |
| $150,000 to $199,999 | 3 | 2.4% |
| $200,000+ | 0 | 0.0% |
Household Income by Householder Age in Mattawana
The median household income in Mattawana is $81,667, with the highest median household income of $88,523 found in the 45 to 64 years age bracket for the primary householder. A total of 43 households (34.7%) fall into this category. Meanwhile, the 15 to 24 years age bracket for the primary householder has the lowest median household income of $0, with 7 households (5.7%) in this group.
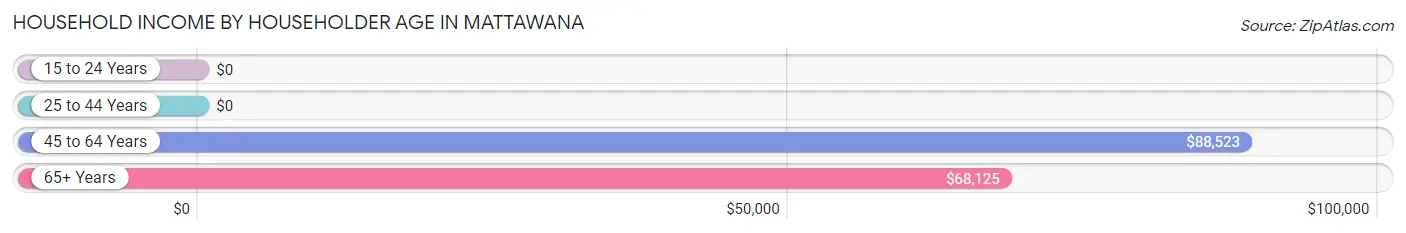
| Income Bracket | # Households | Median Income |
| 15 to 24 Years | 7 (5.7%) | $0 |
| 25 to 44 Years | 47 (37.9%) | $0 |
| 45 to 64 Years | 43 (34.7%) | $88,523 |
| 65+ Years | 27 (21.8%) | $68,125 |
| Total | 124 (100.0%) | $81,667 |
Poverty in Mattawana
Income Below Poverty by Sex and Age in Mattawana
With 3.9% poverty level for males and 5.2% for females among the residents of Mattawana, 45 to 54 year old males and 25 to 34 year old females are the most vulnerable to poverty, with 8 males (66.7%) and 10 females (47.6%) in their respective age groups living below the poverty level.
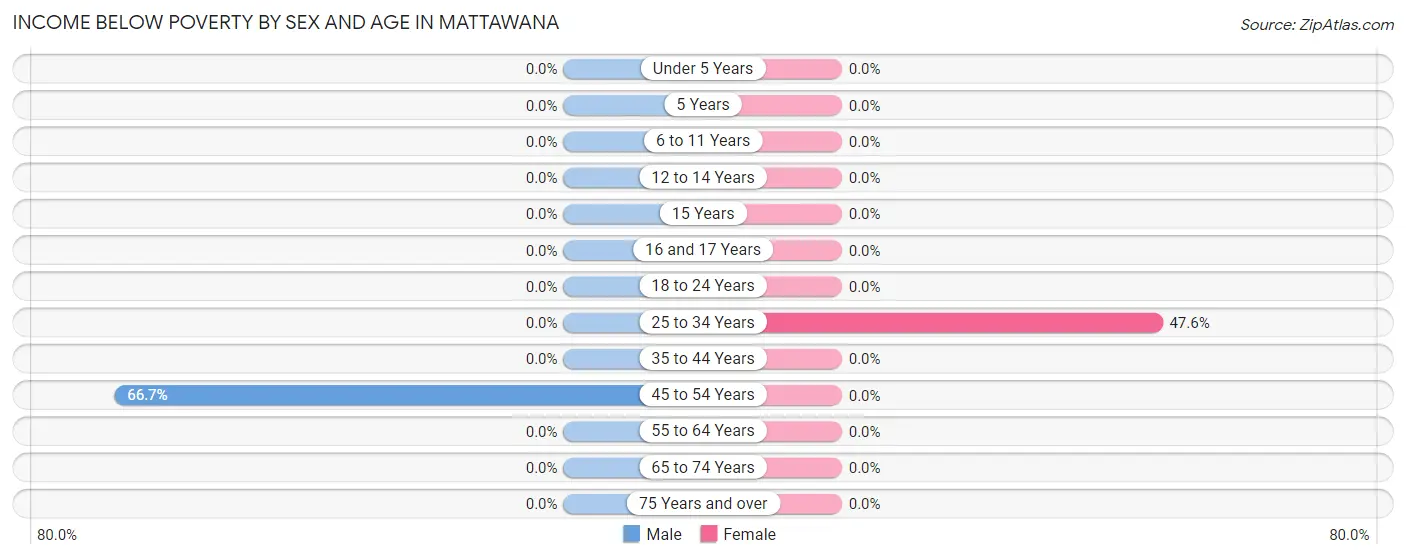
| Age Bracket | Male | Female |
| Under 5 Years | 0 (0.0%) | 0 (0.0%) |
| 5 Years | 0 (0.0%) | 0 (0.0%) |
| 6 to 11 Years | 0 (0.0%) | 0 (0.0%) |
| 12 to 14 Years | 0 (0.0%) | 0 (0.0%) |
| 15 Years | 0 (0.0%) | 0 (0.0%) |
| 16 and 17 Years | 0 (0.0%) | 0 (0.0%) |
| 18 to 24 Years | 0 (0.0%) | 0 (0.0%) |
| 25 to 34 Years | 0 (0.0%) | 10 (47.6%) |
| 35 to 44 Years | 0 (0.0%) | 0 (0.0%) |
| 45 to 54 Years | 8 (66.7%) | 0 (0.0%) |
| 55 to 64 Years | 0 (0.0%) | 0 (0.0%) |
| 65 to 74 Years | 0 (0.0%) | 0 (0.0%) |
| 75 Years and over | 0 (0.0%) | 0 (0.0%) |
| Total | 8 (3.9%) | 10 (5.2%) |
Income Above Poverty by Sex and Age in Mattawana
According to the poverty statistics in Mattawana, males aged under 5 years and females aged 5 years are the age groups that are most secure financially, with 100.0% of males and 100.0% of females in these age groups living above the poverty line.
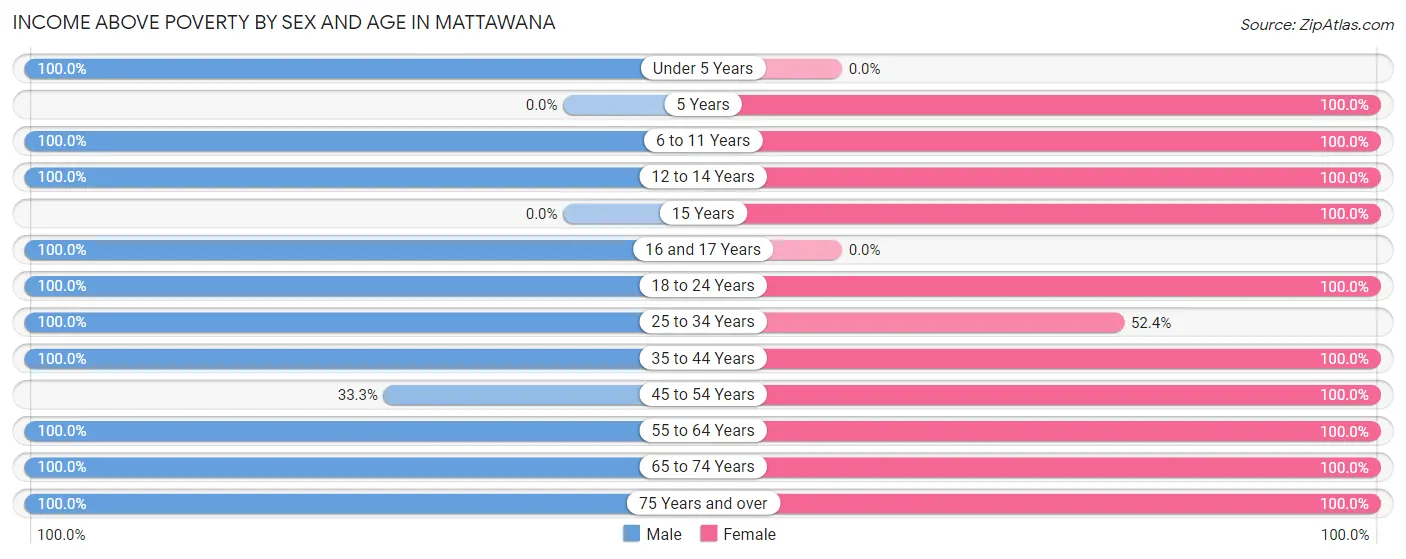
| Age Bracket | Male | Female |
| Under 5 Years | 12 (100.0%) | 0 (0.0%) |
| 5 Years | 0 (0.0%) | 9 (100.0%) |
| 6 to 11 Years | 43 (100.0%) | 38 (100.0%) |
| 12 to 14 Years | 14 (100.0%) | 3 (100.0%) |
| 15 Years | 0 (0.0%) | 13 (100.0%) |
| 16 and 17 Years | 3 (100.0%) | 0 (0.0%) |
| 18 to 24 Years | 18 (100.0%) | 15 (100.0%) |
| 25 to 34 Years | 18 (100.0%) | 11 (52.4%) |
| 35 to 44 Years | 34 (100.0%) | 18 (100.0%) |
| 45 to 54 Years | 4 (33.3%) | 20 (100.0%) |
| 55 to 64 Years | 27 (100.0%) | 35 (100.0%) |
| 65 to 74 Years | 23 (100.0%) | 18 (100.0%) |
| 75 Years and over | 2 (100.0%) | 2 (100.0%) |
| Total | 198 (96.1%) | 182 (94.8%) |
Income Below Poverty Among Married-Couple Families in Mattawana
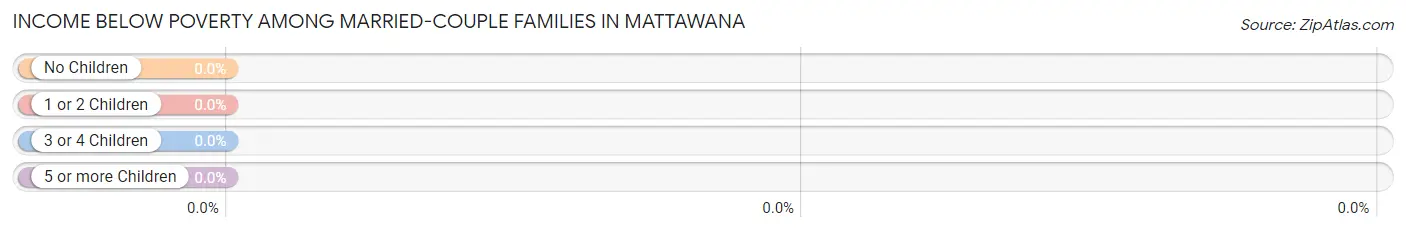
| Children | Above Poverty | Below Poverty |
| No Children | 57 (100.0%) | 0 (0.0%) |
| 1 or 2 Children | 20 (100.0%) | 0 (0.0%) |
| 3 or 4 Children | 0 (0.0%) | 0 (0.0%) |
| 5 or more Children | 9 (100.0%) | 0 (0.0%) |
| Total | 86 (100.0%) | 0 (0.0%) |
Income Below Poverty Among Single-Parent Households in Mattawana
| Children | Single Father | Single Mother |
| No Children | 0 (0.0%) | 0 (0.0%) |
| 1 or 2 Children | 0 (0.0%) | 0 (0.0%) |
| 3 or 4 Children | 0 (0.0%) | 0 (0.0%) |
| 5 or more Children | 0 (0.0%) | 0 (0.0%) |
| Total | 0 (0.0%) | 0 (0.0%) |
Income Below Poverty Among Married-Couple vs Single-Parent Households in Mattawana
| Children | Married-Couple Families | Single-Parent Households |
| No Children | 0 (0.0%) | 0 (0.0%) |
| 1 or 2 Children | 0 (0.0%) | 0 (0.0%) |
| 3 or 4 Children | 0 (0.0%) | 0 (0.0%) |
| 5 or more Children | 0 (0.0%) | 0 (0.0%) |
| Total | 0 (0.0%) | 0 (0.0%) |
Race in Mattawana
The most populous races in Mattawana are White / Caucasian (386 | 97.0%), and Asian (12 | 3.0%).
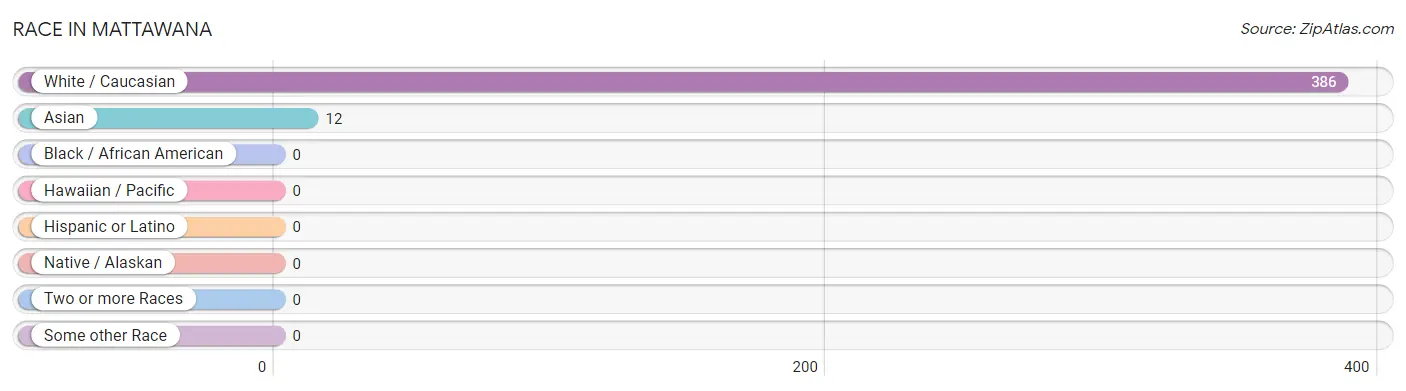
| Race | # Population | % Population |
| Asian | 12 | 3.0% |
| Black / African American | 0 | 0.0% |
| Hawaiian / Pacific | 0 | 0.0% |
| Hispanic or Latino | 0 | 0.0% |
| Native / Alaskan | 0 | 0.0% |
| White / Caucasian | 386 | 97.0% |
| Two or more Races | 0 | 0.0% |
| Some other Race | 0 | 0.0% |
| Total | 398 | 100.0% |
Ancestry in Mattawana
The most populous ancestries reported in Mattawana are German (122 | 30.6%), American (79 | 19.9%), Danish (39 | 9.8%), Pennsylvania German (29 | 7.3%), and Swiss (22 | 5.5%), together accounting for 73.1% of all Mattawana residents.
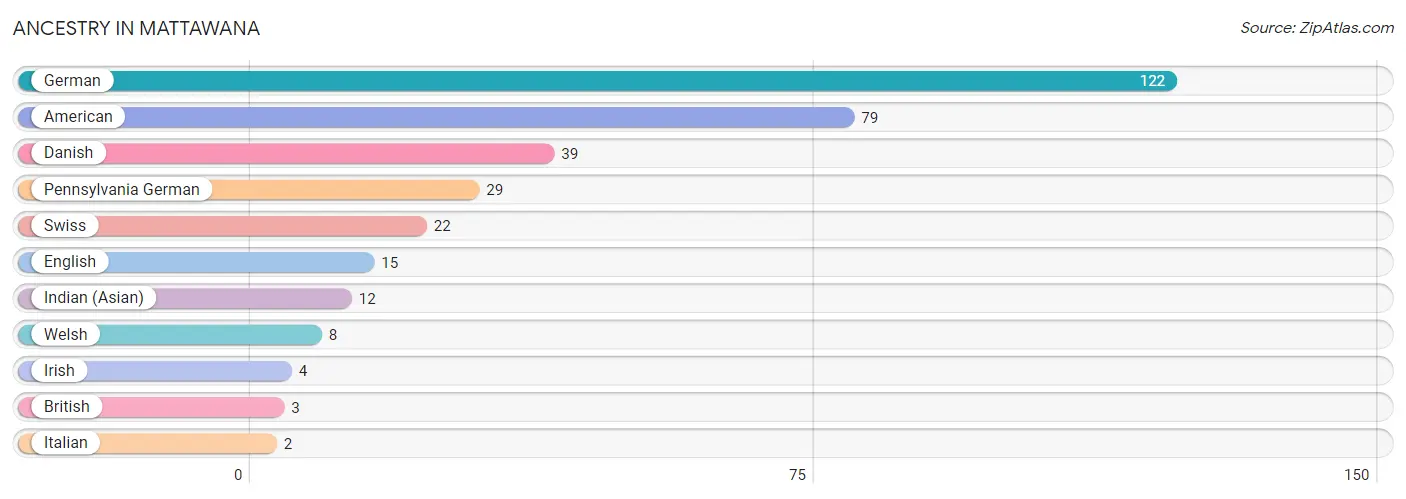
| Ancestry | # Population | % Population |
| American | 79 | 19.9% |
| British | 3 | 0.7% |
| Danish | 39 | 9.8% |
| English | 15 | 3.8% |
| German | 122 | 30.6% |
| Indian (Asian) | 12 | 3.0% |
| Irish | 4 | 1.0% |
| Italian | 2 | 0.5% |
| Pennsylvania German | 29 | 7.3% |
| Swiss | 22 | 5.5% |
| Welsh | 8 | 2.0% | View All 11 Rows |
Immigrants in Mattawana
The most numerous immigrant groups reported in Mattawana came from Asia (3 | 0.7%), South Eastern Asia (3 | 0.7%), and Thailand (3 | 0.7%), together accounting for 2.2% of all Mattawana residents.
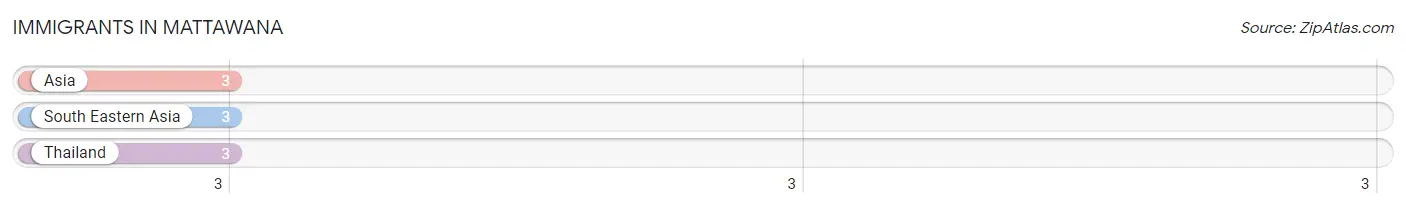
| Immigration Origin | # Population | % Population |
| Asia | 3 | 0.7% |
| South Eastern Asia | 3 | 0.7% |
| Thailand | 3 | 0.7% | View All 3 Rows |
Sex and Age in Mattawana
Sex and Age in Mattawana
The most populous age groups in Mattawana are 10 to 14 Years (31 | 15.0%) for men and 5 to 9 Years (47 | 24.5%) for women.
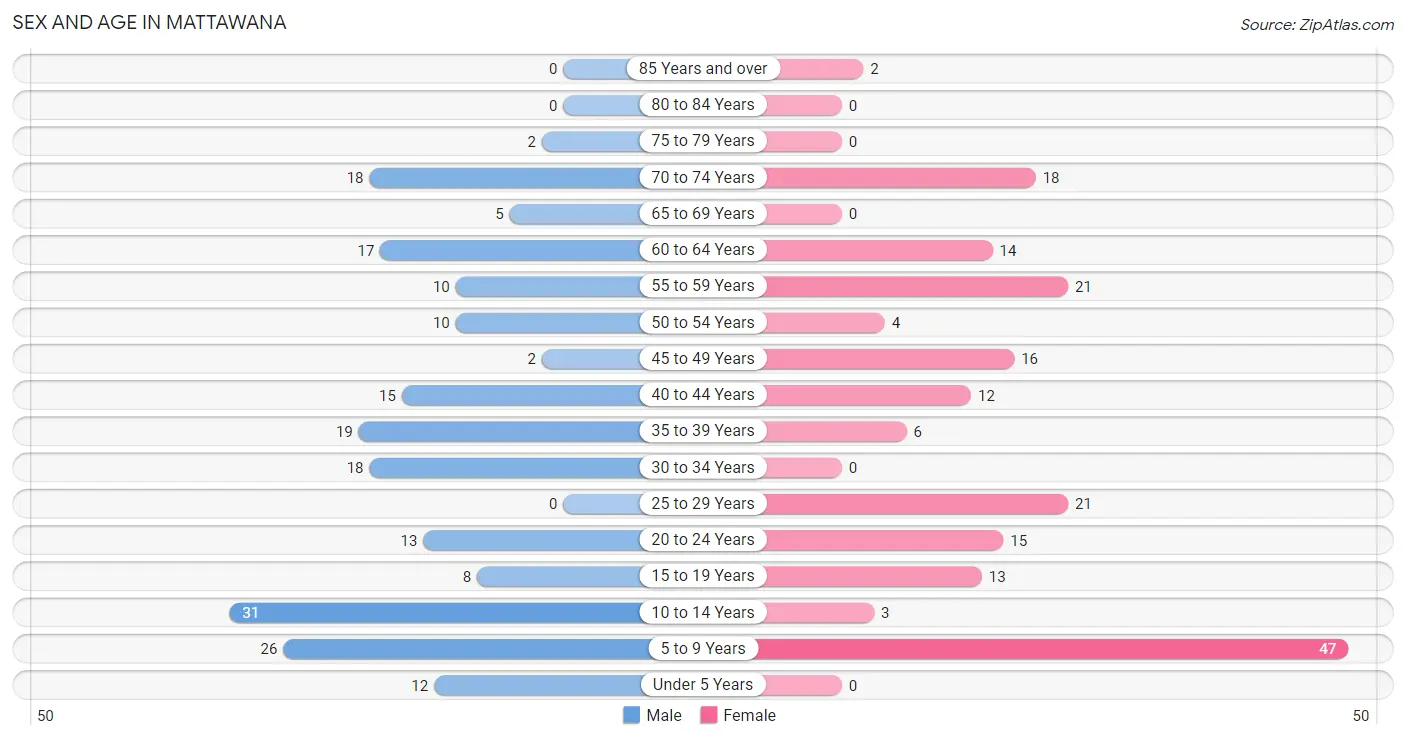
| Age Bracket | Male | Female |
| Under 5 Years | 12 (5.8%) | 0 (0.0%) |
| 5 to 9 Years | 26 (12.6%) | 47 (24.5%) |
| 10 to 14 Years | 31 (15.0%) | 3 (1.6%) |
| 15 to 19 Years | 8 (3.9%) | 13 (6.8%) |
| 20 to 24 Years | 13 (6.3%) | 15 (7.8%) |
| 25 to 29 Years | 0 (0.0%) | 21 (10.9%) |
| 30 to 34 Years | 18 (8.7%) | 0 (0.0%) |
| 35 to 39 Years | 19 (9.2%) | 6 (3.1%) |
| 40 to 44 Years | 15 (7.3%) | 12 (6.2%) |
| 45 to 49 Years | 2 (1.0%) | 16 (8.3%) |
| 50 to 54 Years | 10 (4.9%) | 4 (2.1%) |
| 55 to 59 Years | 10 (4.9%) | 21 (10.9%) |
| 60 to 64 Years | 17 (8.3%) | 14 (7.3%) |
| 65 to 69 Years | 5 (2.4%) | 0 (0.0%) |
| 70 to 74 Years | 18 (8.7%) | 18 (9.4%) |
| 75 to 79 Years | 2 (1.0%) | 0 (0.0%) |
| 80 to 84 Years | 0 (0.0%) | 0 (0.0%) |
| 85 Years and over | 0 (0.0%) | 2 (1.0%) |
| Total | 206 (100.0%) | 192 (100.0%) |
Families and Households in Mattawana
Median Family Size in Mattawana
The median family size in Mattawana is 3.29 persons per family, with single female/mother families (9 | 8.1%) accounting for the largest median family size of 6.22 persons per family. On the other hand, single male/father families (16 | 14.4%) represent the smallest median family size with 2.44 persons per family.
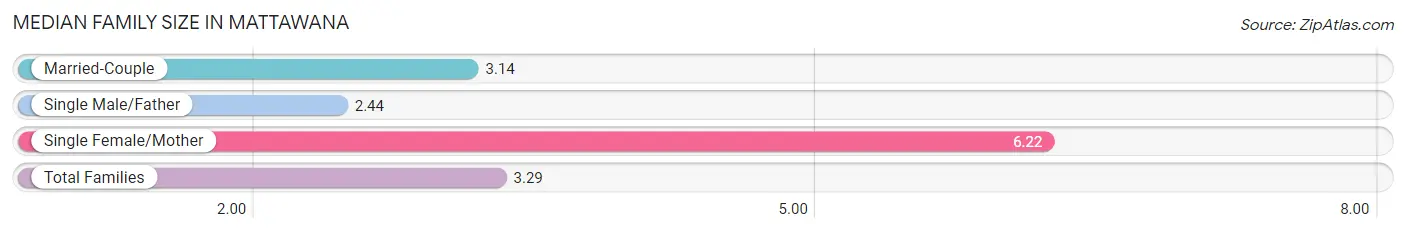
| Family Type | # Families | Family Size |
| Married-Couple | 86 (77.5%) | 3.14 |
| Single Male/Father | 16 (14.4%) | 2.44 |
| Single Female/Mother | 9 (8.1%) | 6.22 |
| Total Families | 111 (100.0%) | 3.29 |
Median Household Size in Mattawana
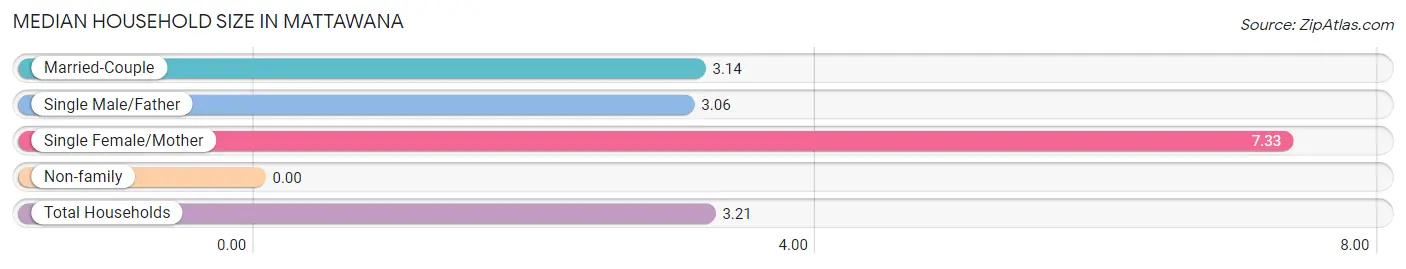
| Household Type | # Households | Household Size |
| Married-Couple | 86 (69.4%) | 3.14 |
| Single Male/Father | 16 (12.9%) | 3.06 |
| Single Female/Mother | 9 (7.3%) | 7.33 |
| Non-family | 13 (10.5%) | - |
| Total Households | 124 (100.0%) | 3.21 |
Household Size by Marriage Status in Mattawana
Out of a total of 124 households in Mattawana, 111 (89.5%) are family households, while 13 (10.5%) are nonfamily households. The most numerous type of family households are 2-person households, comprising 51, and the most common type of nonfamily households are 1-person households, comprising 13.
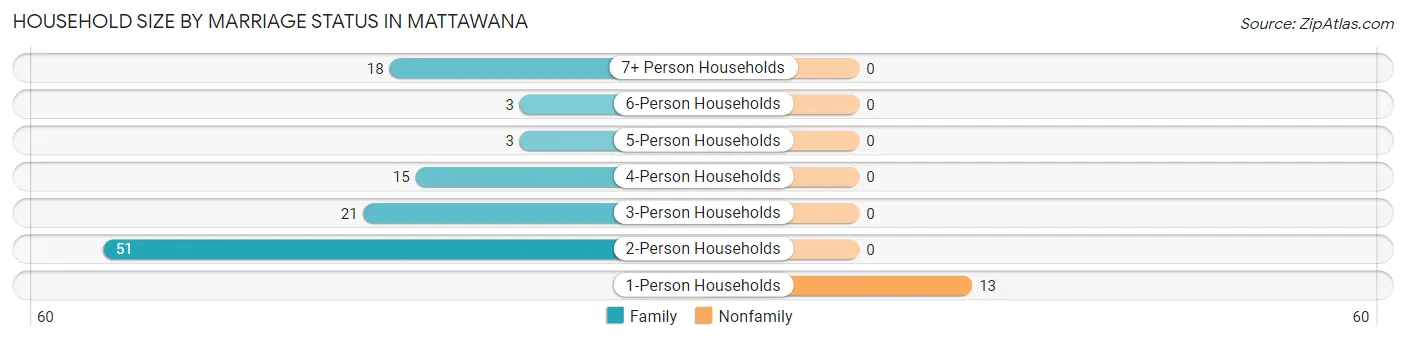
| Household Size | Family Households | Nonfamily Households |
| 1-Person Households | - | 13 (10.5%) |
| 2-Person Households | 51 (41.1%) | 0 (0.0%) |
| 3-Person Households | 21 (16.9%) | 0 (0.0%) |
| 4-Person Households | 15 (12.1%) | 0 (0.0%) |
| 5-Person Households | 3 (2.4%) | 0 (0.0%) |
| 6-Person Households | 3 (2.4%) | 0 (0.0%) |
| 7+ Person Households | 18 (14.5%) | 0 (0.0%) |
| Total | 111 (89.5%) | 13 (10.5%) |
Female Fertility in Mattawana
Fertility by Age in Mattawana
| Age Bracket | Women with Births | Births / 1,000 Women |
| 15 to 19 years | 0 (0.0%) | 0.0 |
| 20 to 34 years | 0 (0.0%) | 0.0 |
| 35 to 50 years | 0 (0.0%) | 0.0 |
| Total | 0 (0.0%) | 0.0 |
Fertility by Age by Marriage Status in Mattawana
| Age Bracket | Married | Unmarried |
| 15 to 19 years | 0 (0.0%) | 0 (0.0%) |
| 20 to 34 years | 0 (0.0%) | 0 (0.0%) |
| 35 to 50 years | 0 (0.0%) | 0 (0.0%) |
| Total | 0 (0.0%) | 0 (0.0%) |
Fertility by Education in Mattawana
| Educational Attainment | Women with Births | Births / 1,000 Women |
| Less than High School | 0 (0.0%) | 0.0 |
| High School Diploma | 0 (0.0%) | 0.0 |
| College or Associate's Degree | 0 (0.0%) | 0.0 |
| Bachelor's Degree | 0 (0.0%) | 0.0 |
| Graduate Degree | 0 (0.0%) | 0.0 |
| Total | 0 (0.0%) | 0.0 |
Fertility by Education by Marriage Status in Mattawana
| Educational Attainment | Married | Unmarried |
| Less than High School | 0 (0.0%) | 0 (0.0%) |
| High School Diploma | 0 (0.0%) | 0 (0.0%) |
| College or Associate's Degree | 0 (0.0%) | 0 (0.0%) |
| Bachelor's Degree | 0 (0.0%) | 0 (0.0%) |
| Graduate Degree | 0 (0.0%) | 0 (0.0%) |
| Total | 0 (0.0%) | 0 (0.0%) |
Employment Characteristics in Mattawana
Employment by Class of Employer in Mattawana
Among the 187 employed individuals in Mattawana, private company employees (156 | 83.4%), self-employed (not incorporated) (23 | 12.3%), and not-for-profit organizations (5 | 2.7%) make up the most common classes of employment.
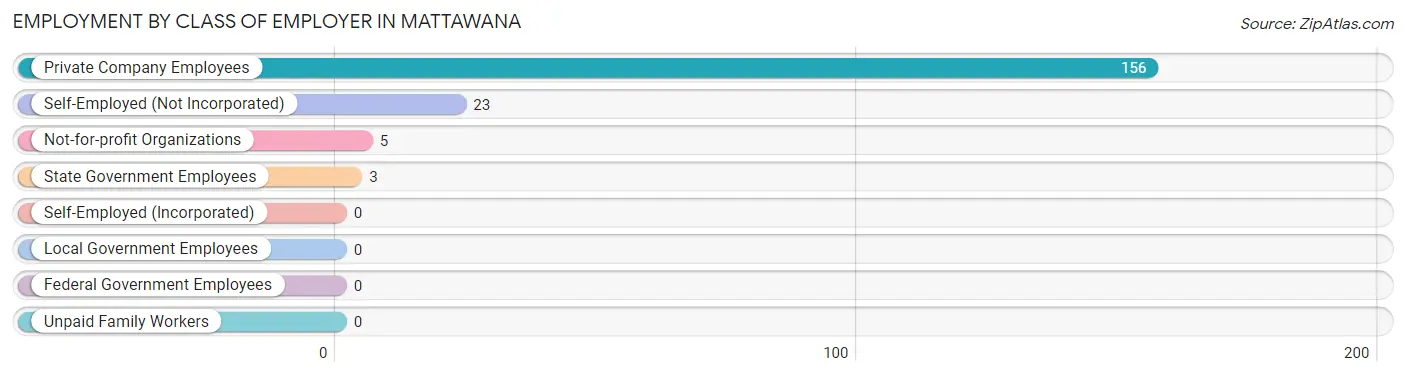
| Employer Class | # Employees | % Employees |
| Private Company Employees | 156 | 83.4% |
| Self-Employed (Incorporated) | 0 | 0.0% |
| Self-Employed (Not Incorporated) | 23 | 12.3% |
| Not-for-profit Organizations | 5 | 2.7% |
| Local Government Employees | 0 | 0.0% |
| State Government Employees | 3 | 1.6% |
| Federal Government Employees | 0 | 0.0% |
| Unpaid Family Workers | 0 | 0.0% |
| Total | 187 | 100.0% |
Employment Status by Age in Mattawana
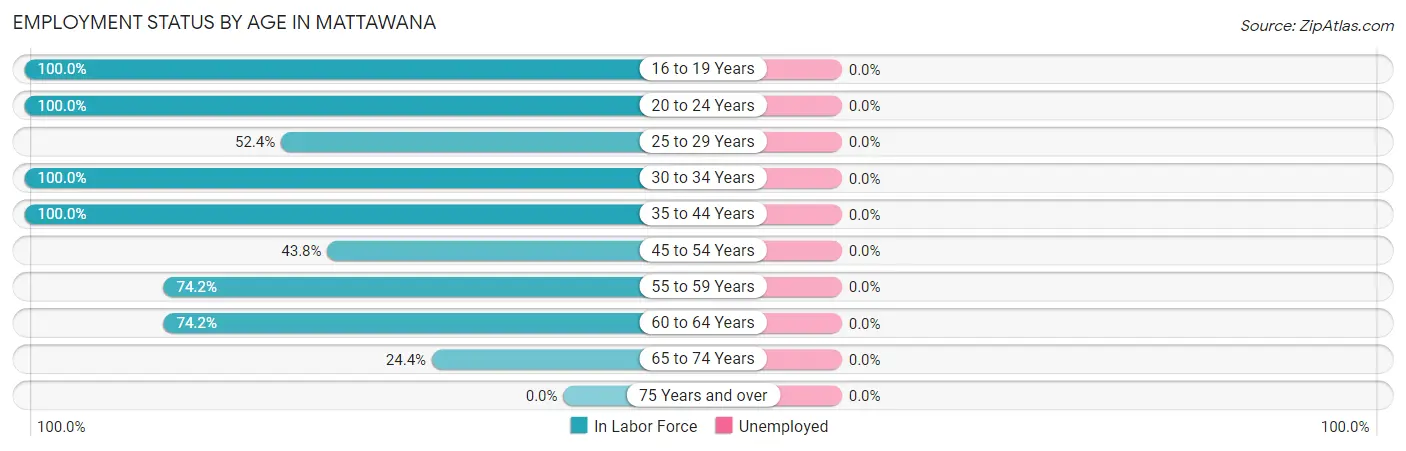
| Age Bracket | In Labor Force | Unemployed |
| 16 to 19 Years | 8 (100.0%) | 0 (0.0%) |
| 20 to 24 Years | 28 (100.0%) | 0 (0.0%) |
| 25 to 29 Years | 11 (52.4%) | 0 (0.0%) |
| 30 to 34 Years | 18 (100.0%) | 0 (0.0%) |
| 35 to 44 Years | 52 (100.0%) | 0 (0.0%) |
| 45 to 54 Years | 14 (43.8%) | 0 (0.0%) |
| 55 to 59 Years | 23 (74.2%) | 0 (0.0%) |
| 60 to 64 Years | 23 (74.2%) | 0 (0.0%) |
| 65 to 74 Years | 10 (24.4%) | 0 (0.0%) |
| 75 Years and over | 0 (0.0%) | 0 (0.0%) |
| Total | 187 (70.3%) | 0 (0.0%) |
Employment Status by Educational Attainment in Mattawana
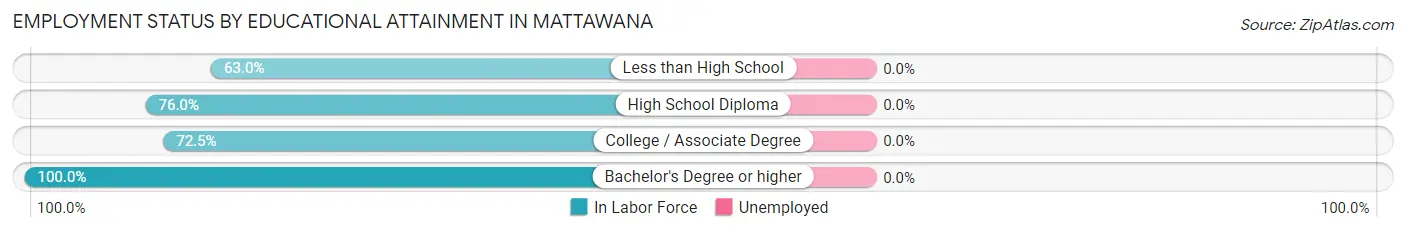
| Educational Attainment | In Labor Force | Unemployed |
| Less than High School | 17 (63.0%) | 0 (0.0%) |
| High School Diploma | 73 (76.0%) | 0 (0.0%) |
| College / Associate Degree | 29 (72.5%) | 0 (0.0%) |
| Bachelor's Degree or higher | 22 (100.0%) | 0 (0.0%) |
| Total | 141 (76.2%) | 0 (0.0%) |
Employment Occupations by Sex in Mattawana
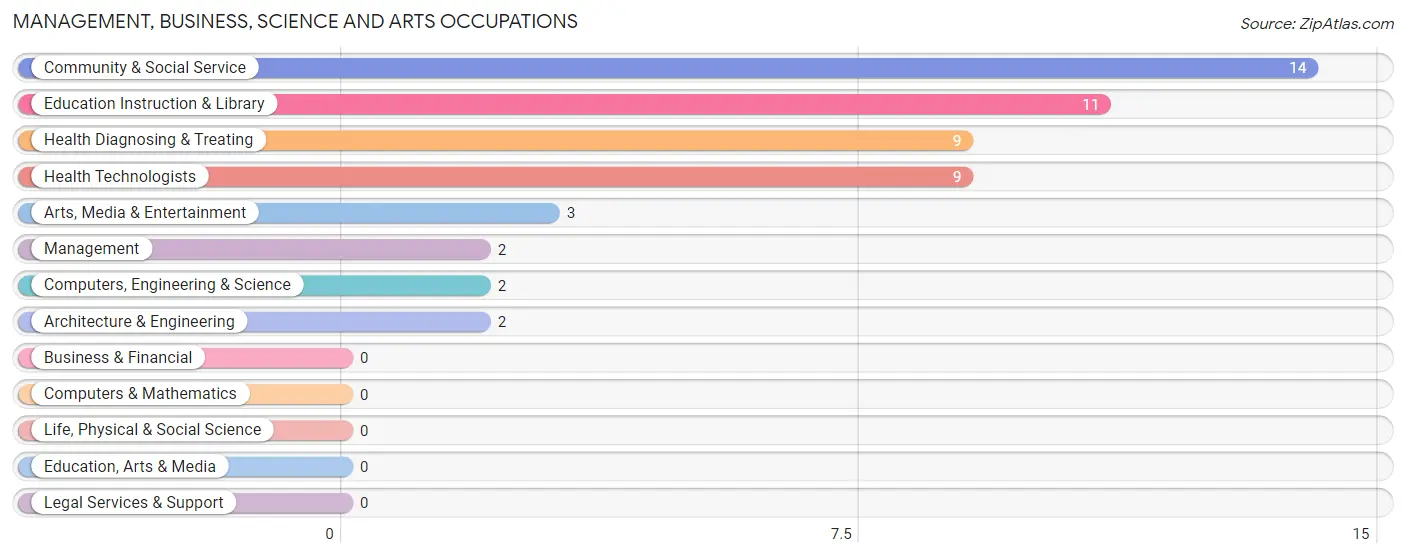
Management, Business, Science and Arts Occupations
The most common Management, Business, Science and Arts occupations in Mattawana are Community & Social Service (14 | 7.5%), Education Instruction & Library (11 | 5.9%), Health Diagnosing & Treating (9 | 4.8%), Health Technologists (9 | 4.8%), and Arts, Media & Entertainment (3 | 1.6%).
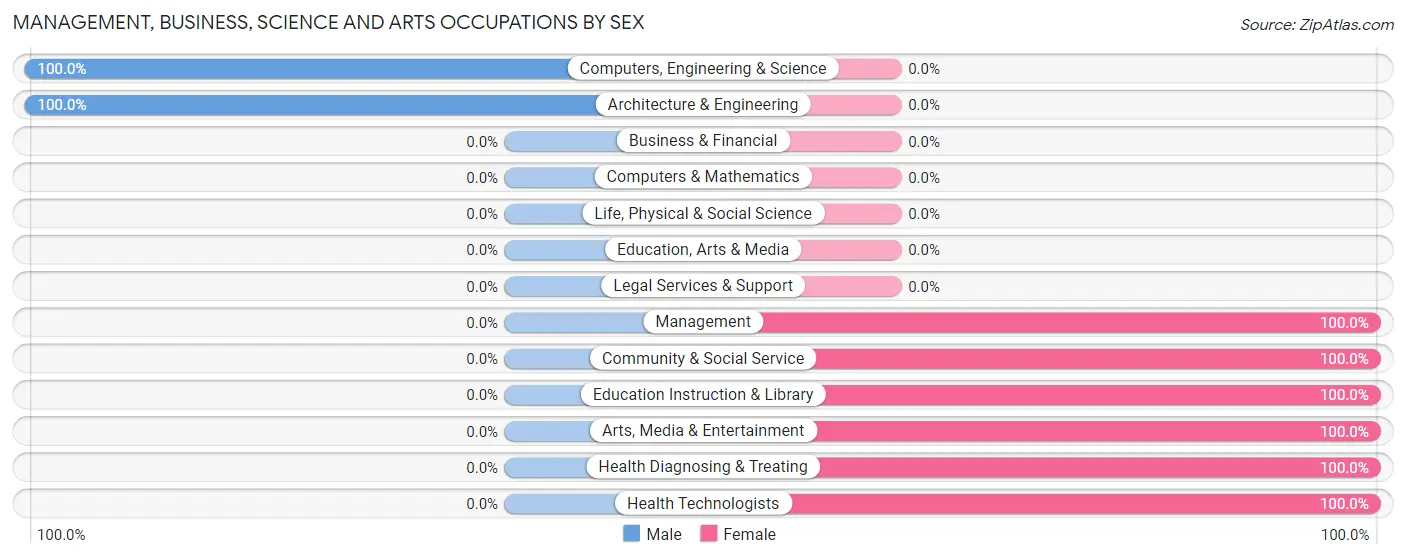
Management, Business, Science and Arts Occupations by Sex
Within the Management, Business, Science and Arts occupations in Mattawana, the most male-oriented occupations are Computers, Engineering & Science (100.0%), and Architecture & Engineering (100.0%), while the most female-oriented occupations are Management (100.0%), Community & Social Service (100.0%), and Education Instruction & Library (100.0%).
| Occupation | Male | Female |
| Management | 0 (0.0%) | 2 (100.0%) |
| Business & Financial | 0 (0.0%) | 0 (0.0%) |
| Computers, Engineering & Science | 2 (100.0%) | 0 (0.0%) |
| Computers & Mathematics | 0 (0.0%) | 0 (0.0%) |
| Architecture & Engineering | 2 (100.0%) | 0 (0.0%) |
| Life, Physical & Social Science | 0 (0.0%) | 0 (0.0%) |
| Community & Social Service | 0 (0.0%) | 14 (100.0%) |
| Education, Arts & Media | 0 (0.0%) | 0 (0.0%) |
| Legal Services & Support | 0 (0.0%) | 0 (0.0%) |
| Education Instruction & Library | 0 (0.0%) | 11 (100.0%) |
| Arts, Media & Entertainment | 0 (0.0%) | 3 (100.0%) |
| Health Diagnosing & Treating | 0 (0.0%) | 9 (100.0%) |
| Health Technologists | 0 (0.0%) | 9 (100.0%) |
| Total (Category) | 2 (7.4%) | 25 (92.6%) |
| Total (Overall) | 111 (59.4%) | 76 (40.6%) |
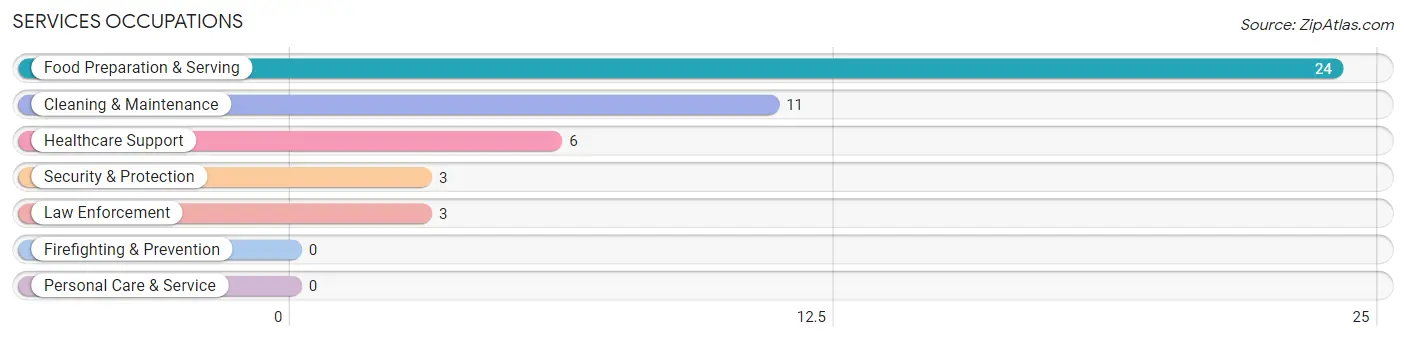
Services Occupations
The most common Services occupations in Mattawana are Food Preparation & Serving (24 | 12.8%), Cleaning & Maintenance (11 | 5.9%), Healthcare Support (6 | 3.2%), Security & Protection (3 | 1.6%), and Law Enforcement (3 | 1.6%).
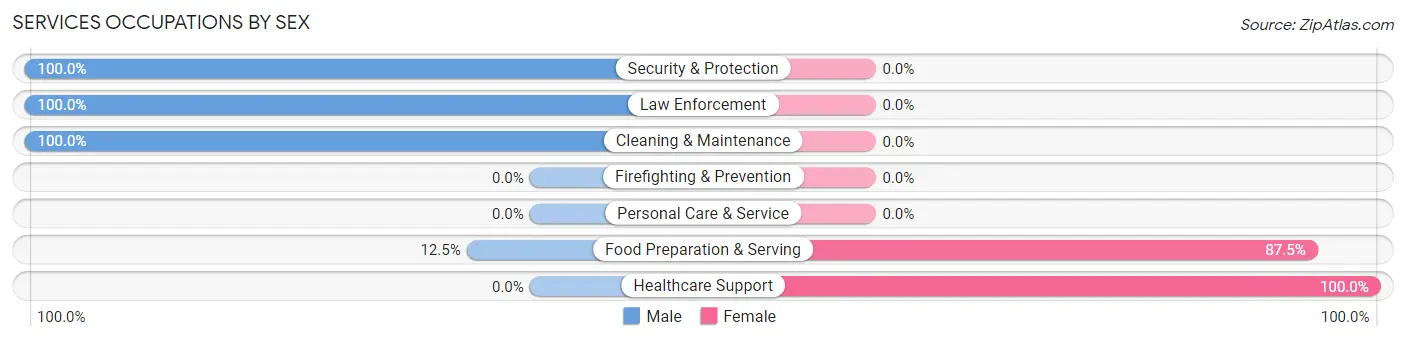
Services Occupations by Sex
Within the Services occupations in Mattawana, the most male-oriented occupations are Security & Protection (100.0%), Law Enforcement (100.0%), and Cleaning & Maintenance (100.0%), while the most female-oriented occupations are Healthcare Support (100.0%), and Food Preparation & Serving (87.5%).
| Occupation | Male | Female |
| Healthcare Support | 0 (0.0%) | 6 (100.0%) |
| Security & Protection | 3 (100.0%) | 0 (0.0%) |
| Firefighting & Prevention | 0 (0.0%) | 0 (0.0%) |
| Law Enforcement | 3 (100.0%) | 0 (0.0%) |
| Food Preparation & Serving | 3 (12.5%) | 21 (87.5%) |
| Cleaning & Maintenance | 11 (100.0%) | 0 (0.0%) |
| Personal Care & Service | 0 (0.0%) | 0 (0.0%) |
| Total (Category) | 17 (38.6%) | 27 (61.4%) |
| Total (Overall) | 111 (59.4%) | 76 (40.6%) |
Sales and Office Occupations
The most common Sales and Office occupations in Mattawana are Office & Administration (26 | 13.9%), and Sales & Related (9 | 4.8%).
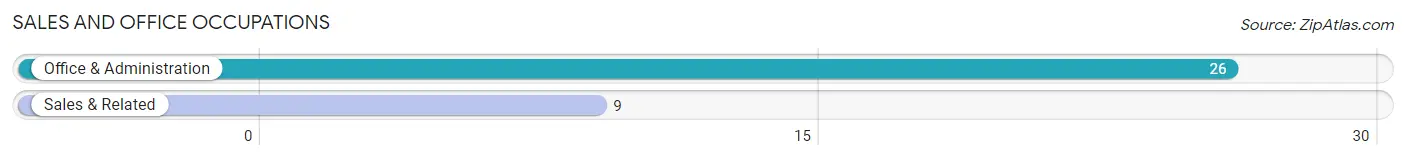
Sales and Office Occupations by Sex
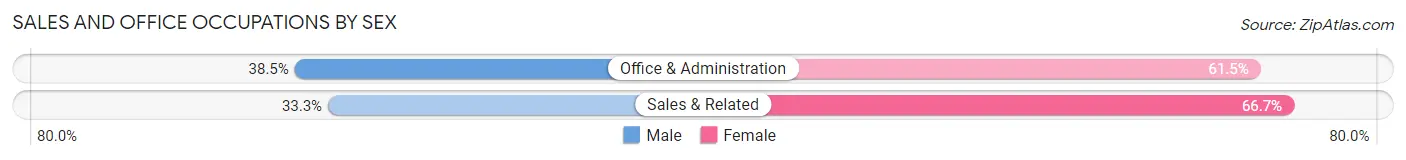
| Occupation | Male | Female |
| Sales & Related | 3 (33.3%) | 6 (66.7%) |
| Office & Administration | 10 (38.5%) | 16 (61.5%) |
| Total (Category) | 13 (37.1%) | 22 (62.9%) |
| Total (Overall) | 111 (59.4%) | 76 (40.6%) |
Natural Resources, Construction and Maintenance Occupations
The most common Natural Resources, Construction and Maintenance occupations in Mattawana are Installation, Maintenance & Repair (16 | 8.6%), and Construction & Extraction (8 | 4.3%).
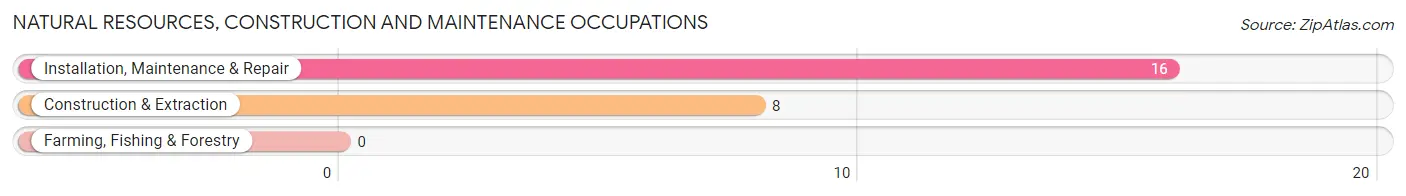
Natural Resources, Construction and Maintenance Occupations by Sex
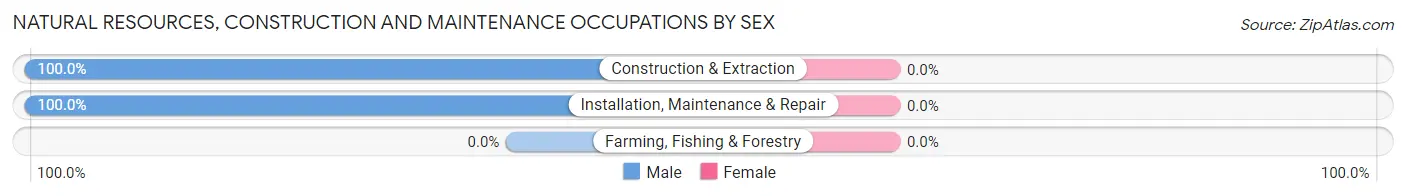
| Occupation | Male | Female |
| Farming, Fishing & Forestry | 0 (0.0%) | 0 (0.0%) |
| Construction & Extraction | 8 (100.0%) | 0 (0.0%) |
| Installation, Maintenance & Repair | 16 (100.0%) | 0 (0.0%) |
| Total (Category) | 24 (100.0%) | 0 (0.0%) |
| Total (Overall) | 111 (59.4%) | 76 (40.6%) |
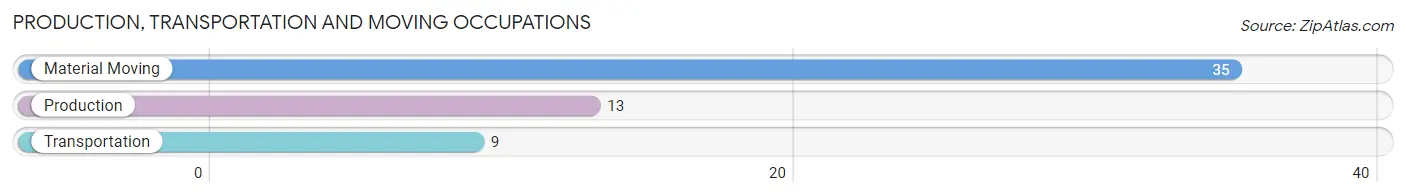
Production, Transportation and Moving Occupations
The most common Production, Transportation and Moving occupations in Mattawana are Material Moving (35 | 18.7%), Production (13 | 7.0%), and Transportation (9 | 4.8%).
Production, Transportation and Moving Occupations by Sex
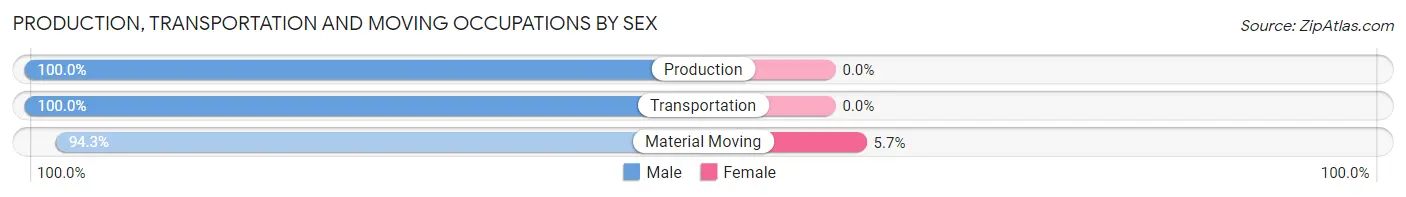
| Occupation | Male | Female |
| Production | 13 (100.0%) | 0 (0.0%) |
| Transportation | 9 (100.0%) | 0 (0.0%) |
| Material Moving | 33 (94.3%) | 2 (5.7%) |
| Total (Category) | 55 (96.5%) | 2 (3.5%) |
| Total (Overall) | 111 (59.4%) | 76 (40.6%) |
Employment Industries by Sex in Mattawana
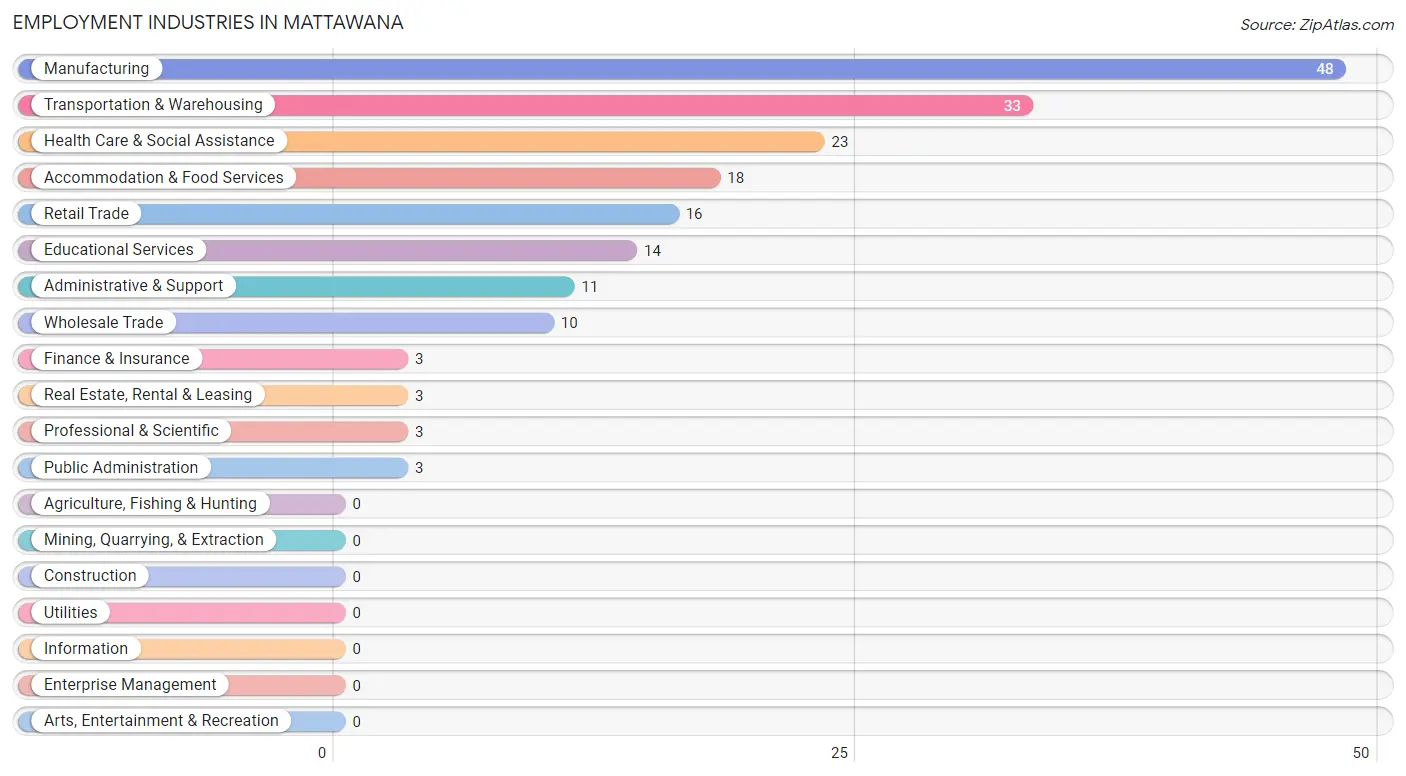
Employment Industries in Mattawana
The major employment industries in Mattawana include Manufacturing (48 | 25.7%), Transportation & Warehousing (33 | 17.6%), Health Care & Social Assistance (23 | 12.3%), Accommodation & Food Services (18 | 9.6%), and Retail Trade (16 | 8.6%).
Employment Industries by Sex in Mattawana
The Mattawana industries that see more men than women are Wholesale Trade (100.0%), Real Estate, Rental & Leasing (100.0%), and Administrative & Support (100.0%), whereas the industries that tend to have a higher number of women are Finance & Insurance (100.0%), Professional & Scientific (100.0%), and Educational Services (100.0%).
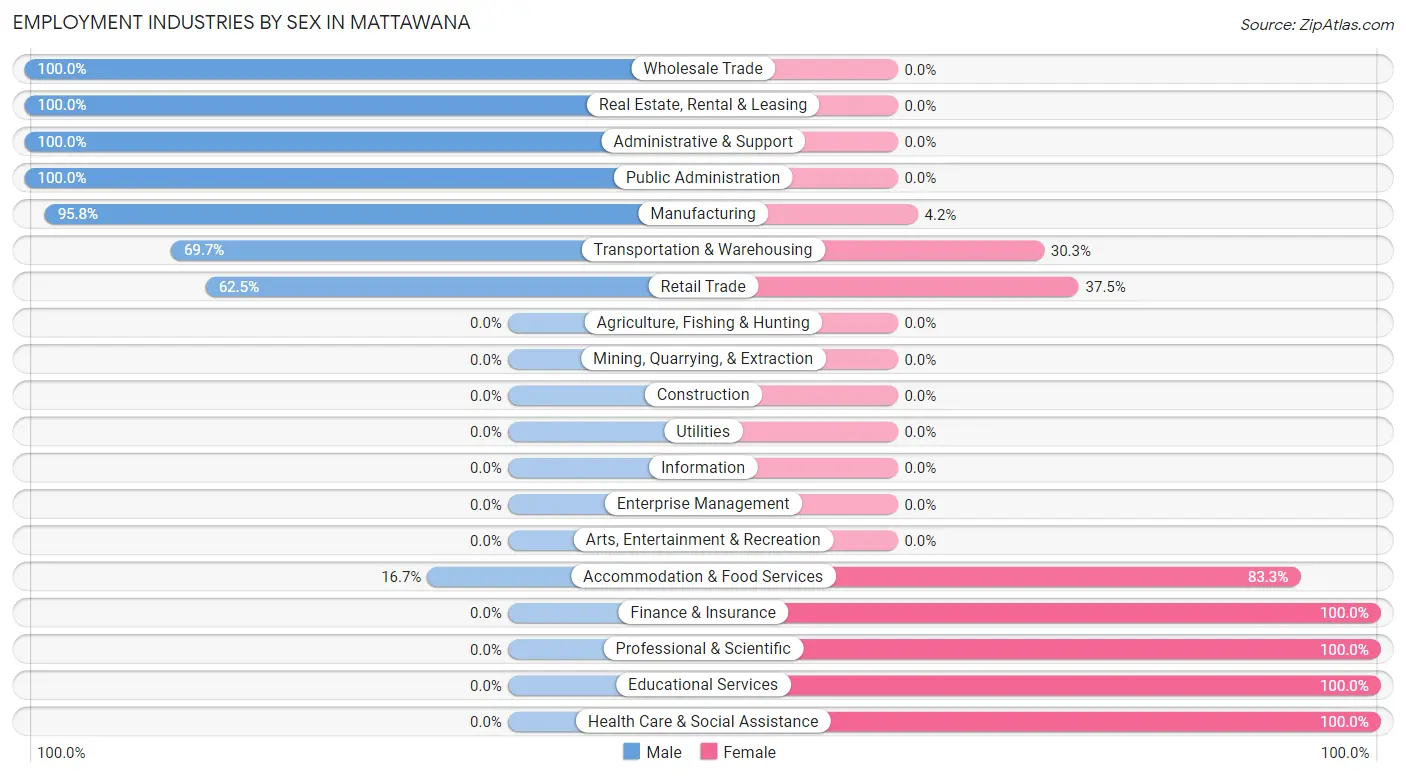
| Industry | Male | Female |
| Agriculture, Fishing & Hunting | 0 (0.0%) | 0 (0.0%) |
| Mining, Quarrying, & Extraction | 0 (0.0%) | 0 (0.0%) |
| Construction | 0 (0.0%) | 0 (0.0%) |
| Manufacturing | 46 (95.8%) | 2 (4.2%) |
| Wholesale Trade | 10 (100.0%) | 0 (0.0%) |
| Retail Trade | 10 (62.5%) | 6 (37.5%) |
| Transportation & Warehousing | 23 (69.7%) | 10 (30.3%) |
| Utilities | 0 (0.0%) | 0 (0.0%) |
| Information | 0 (0.0%) | 0 (0.0%) |
| Finance & Insurance | 0 (0.0%) | 3 (100.0%) |
| Real Estate, Rental & Leasing | 3 (100.0%) | 0 (0.0%) |
| Professional & Scientific | 0 (0.0%) | 3 (100.0%) |
| Enterprise Management | 0 (0.0%) | 0 (0.0%) |
| Administrative & Support | 11 (100.0%) | 0 (0.0%) |
| Educational Services | 0 (0.0%) | 14 (100.0%) |
| Health Care & Social Assistance | 0 (0.0%) | 23 (100.0%) |
| Arts, Entertainment & Recreation | 0 (0.0%) | 0 (0.0%) |
| Accommodation & Food Services | 3 (16.7%) | 15 (83.3%) |
| Public Administration | 3 (100.0%) | 0 (0.0%) |
| Total | 111 (59.4%) | 76 (40.6%) |
Education in Mattawana
School Enrollment in Mattawana
The most common levels of schooling among the 110 students in Mattawana are elementary school (56 | 50.9%), middle school (34 | 30.9%), and high school (9 | 8.2%).
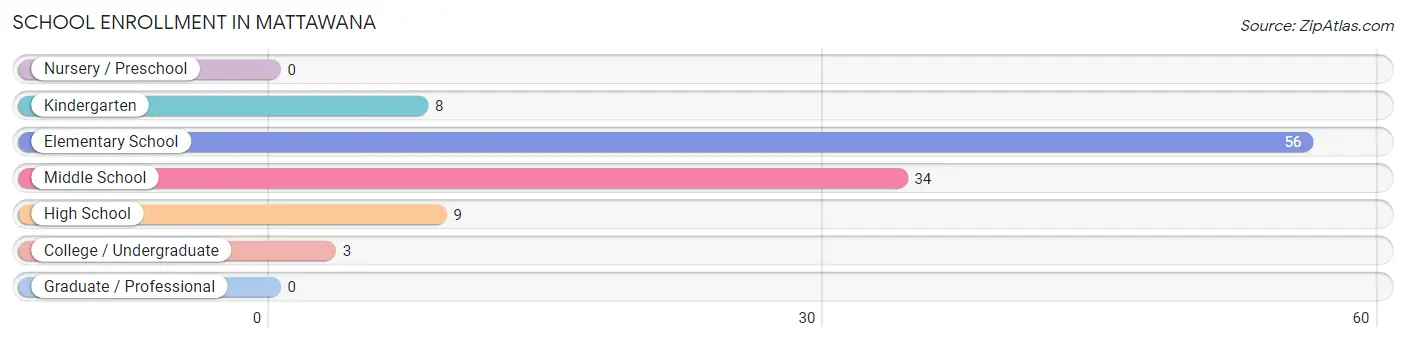
| School Level | # Students | % Students |
| Nursery / Preschool | 0 | 0.0% |
| Kindergarten | 8 | 7.3% |
| Elementary School | 56 | 50.9% |
| Middle School | 34 | 30.9% |
| High School | 9 | 8.2% |
| College / Undergraduate | 3 | 2.7% |
| Graduate / Professional | 0 | 0.0% |
| Total | 110 | 100.0% |
School Enrollment by Age by Funding Source in Mattawana
Out of a total of 110 students who are enrolled in schools in Mattawana, 31 (28.2%) attend a private institution, while the remaining 79 (71.8%) are enrolled in public schools. The age group of 20 to 24 year olds has the highest likelihood of being enrolled in private schools, with 3 (100.0% in the age bracket) enrolled. Conversely, the age group of 15 to 17 year olds has the lowest likelihood of being enrolled in a private school, with 4 (100.0% in the age bracket) attending a public institution.
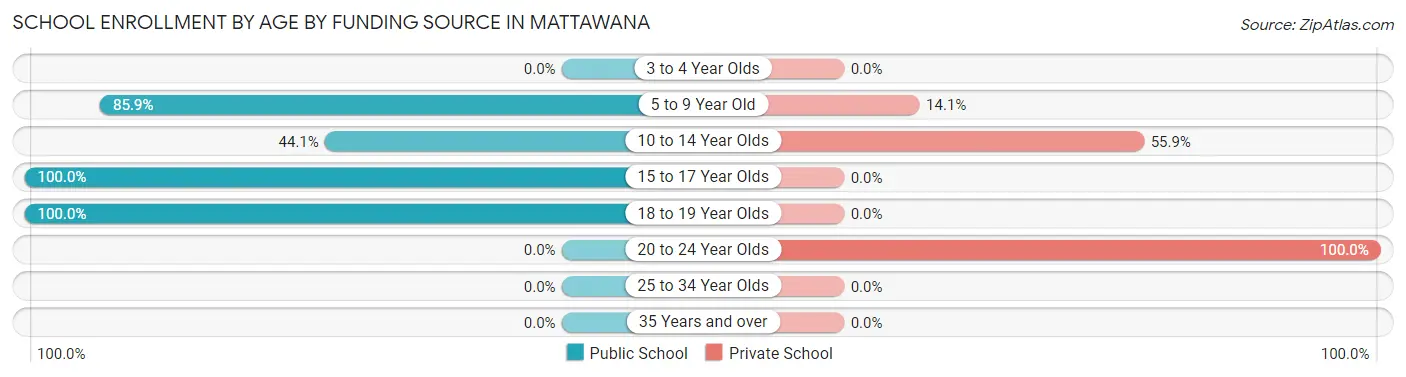
| Age Bracket | Public School | Private School |
| 3 to 4 Year Olds | 0 (0.0%) | 0 (0.0%) |
| 5 to 9 Year Old | 55 (85.9%) | 9 (14.1%) |
| 10 to 14 Year Olds | 15 (44.1%) | 19 (55.9%) |
| 15 to 17 Year Olds | 4 (100.0%) | 0 (0.0%) |
| 18 to 19 Year Olds | 5 (100.0%) | 0 (0.0%) |
| 20 to 24 Year Olds | 0 (0.0%) | 3 (100.0%) |
| 25 to 34 Year Olds | 0 (0.0%) | 0 (0.0%) |
| 35 Years and over | 0 (0.0%) | 0 (0.0%) |
| Total | 79 (71.8%) | 31 (28.2%) |
Educational Attainment by Field of Study in Mattawana
Arts & humanities (14 | 56.0%), computers & mathematics (8 | 32.0%), and education (3 | 12.0%) are the most common fields of study among 25 individuals in Mattawana who have obtained a bachelor's degree or higher.
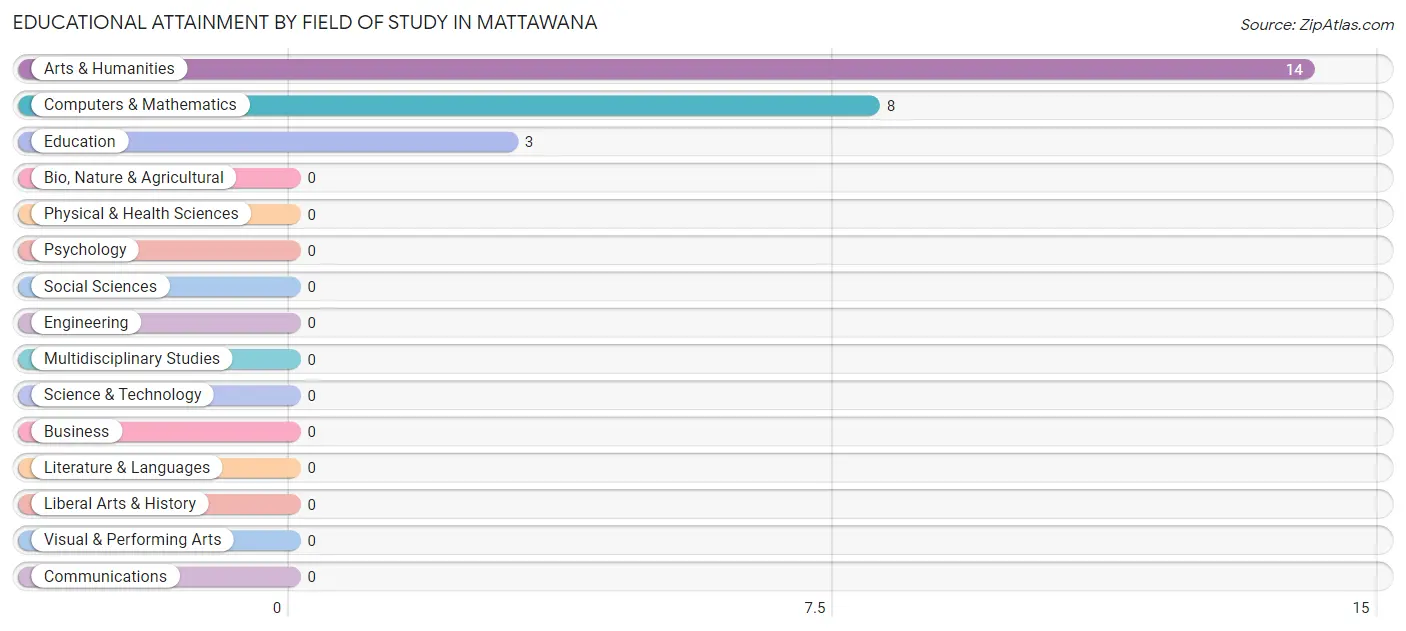
| Field of Study | # Graduates | % Graduates |
| Computers & Mathematics | 8 | 32.0% |
| Bio, Nature & Agricultural | 0 | 0.0% |
| Physical & Health Sciences | 0 | 0.0% |
| Psychology | 0 | 0.0% |
| Social Sciences | 0 | 0.0% |
| Engineering | 0 | 0.0% |
| Multidisciplinary Studies | 0 | 0.0% |
| Science & Technology | 0 | 0.0% |
| Business | 0 | 0.0% |
| Education | 3 | 12.0% |
| Literature & Languages | 0 | 0.0% |
| Liberal Arts & History | 0 | 0.0% |
| Visual & Performing Arts | 0 | 0.0% |
| Communications | 0 | 0.0% |
| Arts & Humanities | 14 | 56.0% |
| Total | 25 | 100.0% |
Transportation & Commute in Mattawana
Vehicle Availability by Sex in Mattawana
The most prevalent vehicle ownership categories in Mattawana are males with 2 vehicles (56, accounting for 50.4%) and females with 2 vehicles (38, making up 73.7%).
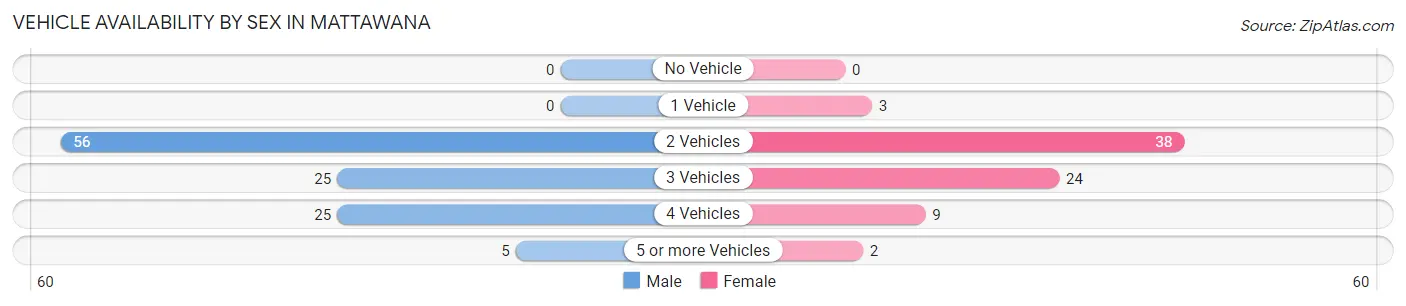
| Vehicles Available | Male | Female |
| No Vehicle | 0 (0.0%) | 0 (0.0%) |
| 1 Vehicle | 0 (0.0%) | 3 (4.0%) |
| 2 Vehicles | 56 (50.4%) | 38 (50.0%) |
| 3 Vehicles | 25 (22.5%) | 24 (31.6%) |
| 4 Vehicles | 25 (22.5%) | 9 (11.8%) |
| 5 or more Vehicles | 5 (4.5%) | 2 (2.6%) |
| Total | 111 (100.0%) | 76 (100.0%) |
Commute Time in Mattawana
The most frequently occuring commute durations in Mattawana are 20 to 24 minutes (58 commuters, 35.4%), 30 to 34 minutes (54 commuters, 32.9%), and 15 to 19 minutes (22 commuters, 13.4%).
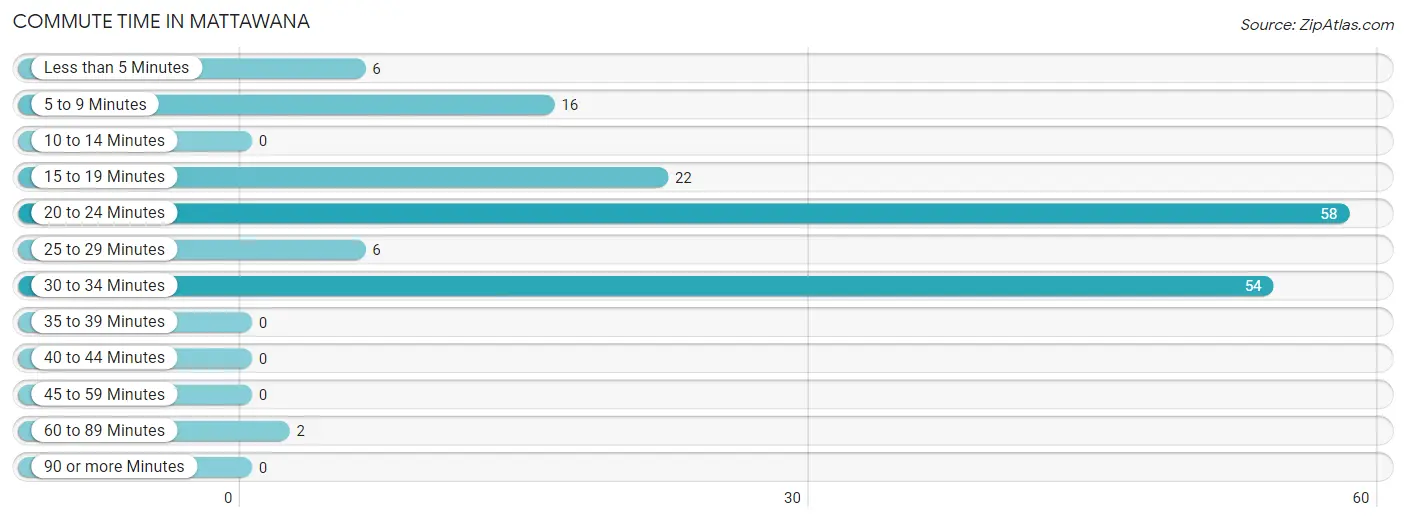
| Commute Time | # Commuters | % Commuters |
| Less than 5 Minutes | 6 | 3.7% |
| 5 to 9 Minutes | 16 | 9.8% |
| 10 to 14 Minutes | 0 | 0.0% |
| 15 to 19 Minutes | 22 | 13.4% |
| 20 to 24 Minutes | 58 | 35.4% |
| 25 to 29 Minutes | 6 | 3.7% |
| 30 to 34 Minutes | 54 | 32.9% |
| 35 to 39 Minutes | 0 | 0.0% |
| 40 to 44 Minutes | 0 | 0.0% |
| 45 to 59 Minutes | 0 | 0.0% |
| 60 to 89 Minutes | 2 | 1.2% |
| 90 or more Minutes | 0 | 0.0% |
Commute Time by Sex in Mattawana
The most common commute times in Mattawana are 20 to 24 minutes (38 commuters, 41.8%) for males and 30 to 34 minutes (27 commuters, 37.0%) for females.
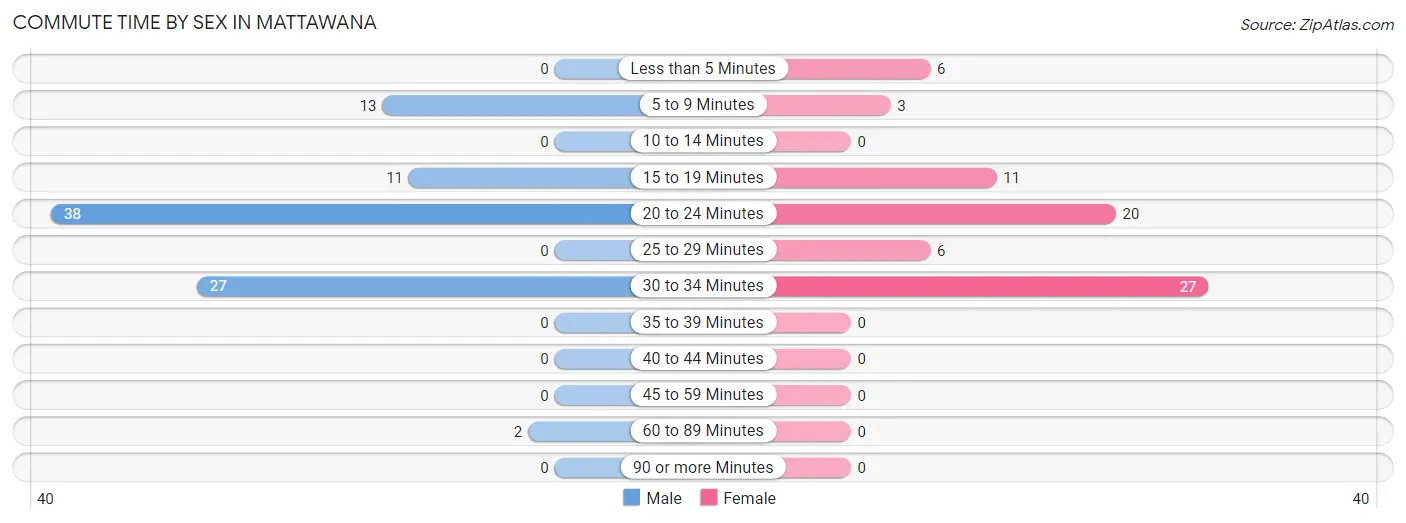
| Commute Time | Male | Female |
| Less than 5 Minutes | 0 (0.0%) | 6 (8.2%) |
| 5 to 9 Minutes | 13 (14.3%) | 3 (4.1%) |
| 10 to 14 Minutes | 0 (0.0%) | 0 (0.0%) |
| 15 to 19 Minutes | 11 (12.1%) | 11 (15.1%) |
| 20 to 24 Minutes | 38 (41.8%) | 20 (27.4%) |
| 25 to 29 Minutes | 0 (0.0%) | 6 (8.2%) |
| 30 to 34 Minutes | 27 (29.7%) | 27 (37.0%) |
| 35 to 39 Minutes | 0 (0.0%) | 0 (0.0%) |
| 40 to 44 Minutes | 0 (0.0%) | 0 (0.0%) |
| 45 to 59 Minutes | 0 (0.0%) | 0 (0.0%) |
| 60 to 89 Minutes | 2 (2.2%) | 0 (0.0%) |
| 90 or more Minutes | 0 (0.0%) | 0 (0.0%) |
Time of Departure to Work by Sex in Mattawana
The most frequent times of departure to work in Mattawana are 7:00 AM to 7:29 AM (27, 29.7%) for males and 7:00 AM to 7:29 AM (30, 41.1%) for females.
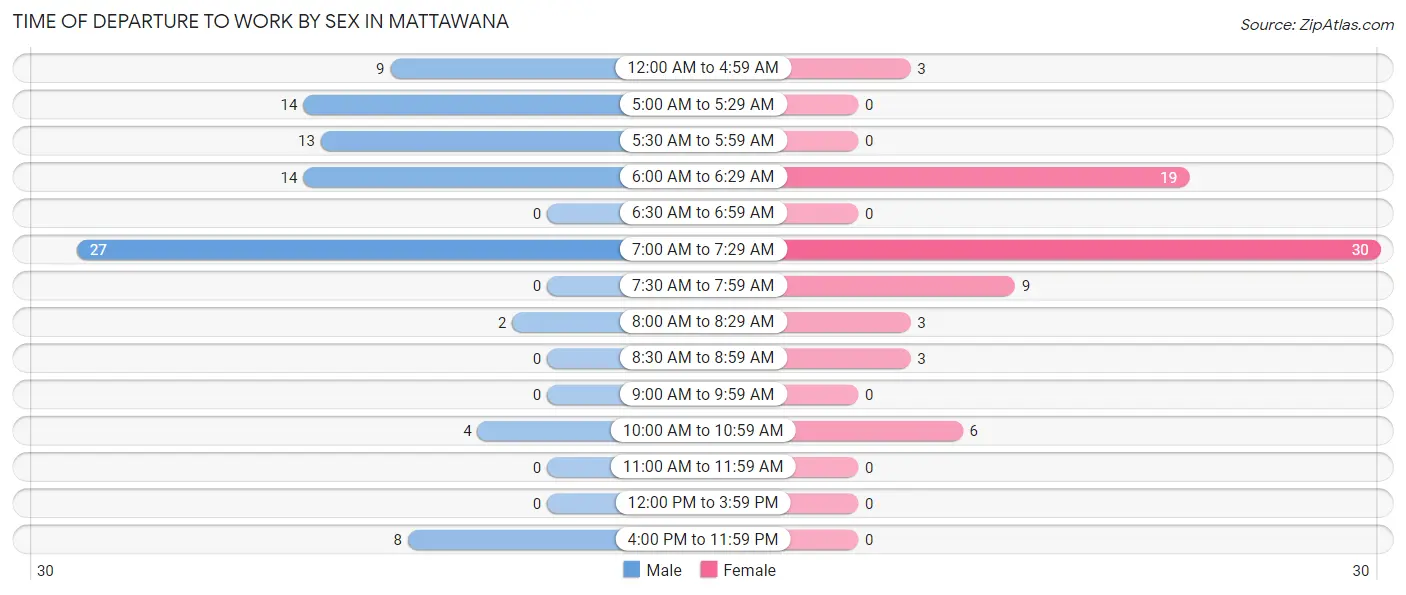
| Time of Departure | Male | Female |
| 12:00 AM to 4:59 AM | 9 (9.9%) | 3 (4.1%) |
| 5:00 AM to 5:29 AM | 14 (15.4%) | 0 (0.0%) |
| 5:30 AM to 5:59 AM | 13 (14.3%) | 0 (0.0%) |
| 6:00 AM to 6:29 AM | 14 (15.4%) | 19 (26.0%) |
| 6:30 AM to 6:59 AM | 0 (0.0%) | 0 (0.0%) |
| 7:00 AM to 7:29 AM | 27 (29.7%) | 30 (41.1%) |
| 7:30 AM to 7:59 AM | 0 (0.0%) | 9 (12.3%) |
| 8:00 AM to 8:29 AM | 2 (2.2%) | 3 (4.1%) |
| 8:30 AM to 8:59 AM | 0 (0.0%) | 3 (4.1%) |
| 9:00 AM to 9:59 AM | 0 (0.0%) | 0 (0.0%) |
| 10:00 AM to 10:59 AM | 4 (4.4%) | 6 (8.2%) |
| 11:00 AM to 11:59 AM | 0 (0.0%) | 0 (0.0%) |
| 12:00 PM to 3:59 PM | 0 (0.0%) | 0 (0.0%) |
| 4:00 PM to 11:59 PM | 8 (8.8%) | 0 (0.0%) |
| Total | 91 (100.0%) | 73 (100.0%) |
Housing Occupancy in Mattawana
Occupancy by Ownership in Mattawana
Of the total 124 dwellings in Mattawana, owner-occupied units account for 105 (84.7%), while renter-occupied units make up 19 (15.3%).
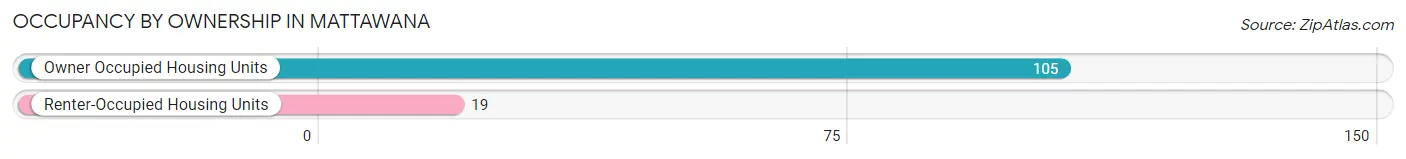
| Occupancy | # Housing Units | % Housing Units |
| Owner Occupied Housing Units | 105 | 84.7% |
| Renter-Occupied Housing Units | 19 | 15.3% |
| Total Occupied Housing Units | 124 | 100.0% |
Occupancy by Household Size in Mattawana
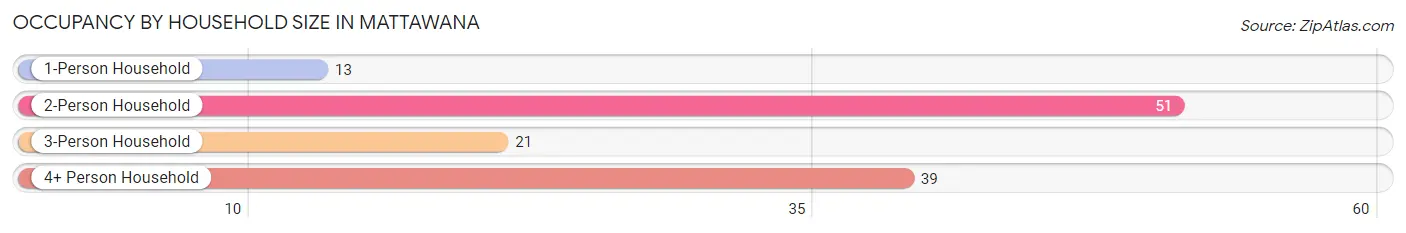
| Household Size | # Housing Units | % Housing Units |
| 1-Person Household | 13 | 10.5% |
| 2-Person Household | 51 | 41.1% |
| 3-Person Household | 21 | 16.9% |
| 4+ Person Household | 39 | 31.5% |
| Total Housing Units | 124 | 100.0% |
Occupancy by Ownership by Household Size in Mattawana
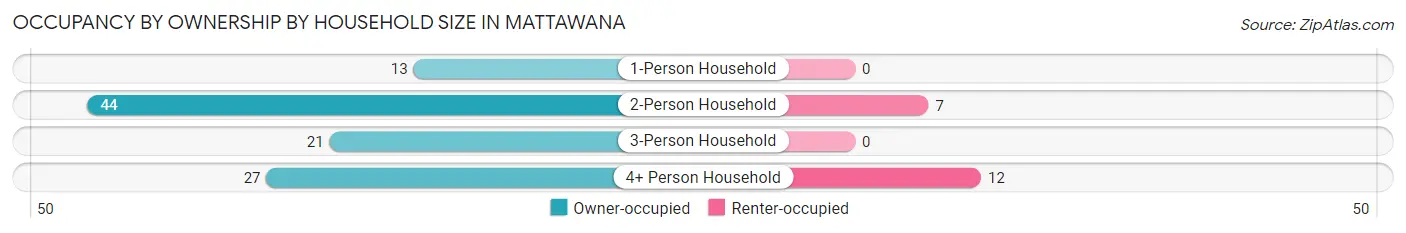
| Household Size | Owner-occupied | Renter-occupied |
| 1-Person Household | 13 (100.0%) | 0 (0.0%) |
| 2-Person Household | 44 (86.3%) | 7 (13.7%) |
| 3-Person Household | 21 (100.0%) | 0 (0.0%) |
| 4+ Person Household | 27 (69.2%) | 12 (30.8%) |
| Total Housing Units | 105 (84.7%) | 19 (15.3%) |
Occupancy by Educational Attainment in Mattawana
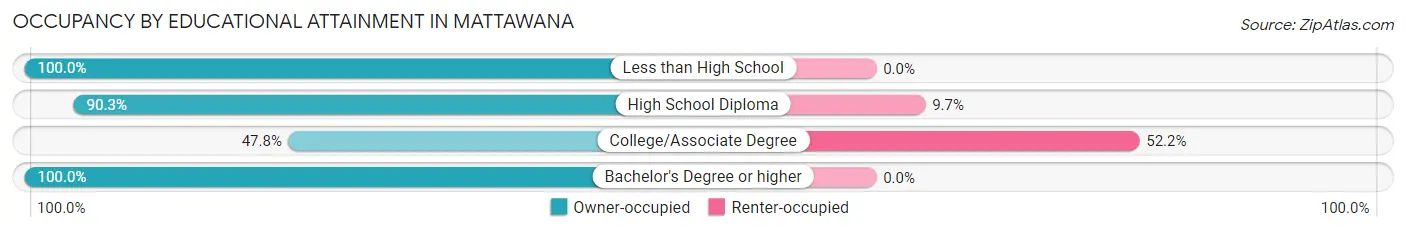
| Household Size | Owner-occupied | Renter-occupied |
| Less than High School | 15 (100.0%) | 0 (0.0%) |
| High School Diploma | 65 (90.3%) | 7 (9.7%) |
| College/Associate Degree | 11 (47.8%) | 12 (52.2%) |
| Bachelor's Degree or higher | 14 (100.0%) | 0 (0.0%) |
Occupancy by Age of Householder in Mattawana
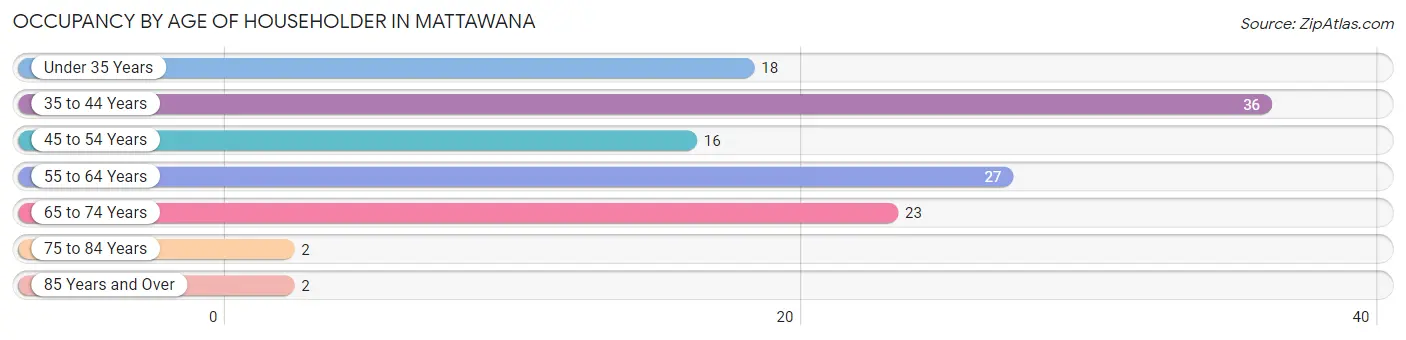
| Age Bracket | # Households | % Households |
| Under 35 Years | 18 | 14.5% |
| 35 to 44 Years | 36 | 29.0% |
| 45 to 54 Years | 16 | 12.9% |
| 55 to 64 Years | 27 | 21.8% |
| 65 to 74 Years | 23 | 18.5% |
| 75 to 84 Years | 2 | 1.6% |
| 85 Years and Over | 2 | 1.6% |
| Total | 124 | 100.0% |
Housing Finances in Mattawana
Median Income by Occupancy in Mattawana
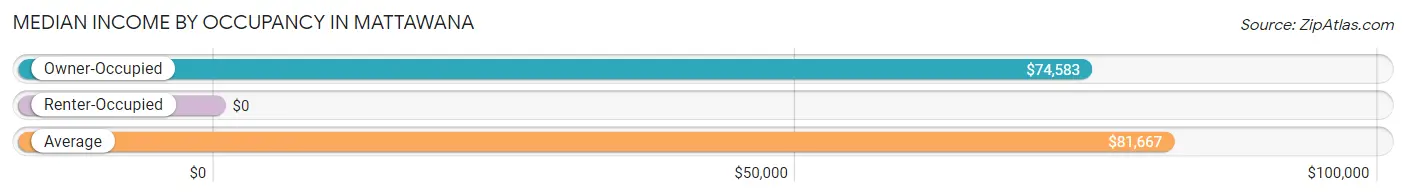
| Occupancy Type | # Households | Median Income |
| Owner-Occupied | 105 (84.7%) | $74,583 |
| Renter-Occupied | 19 (15.3%) | $0 |
| Average | 124 (100.0%) | $81,667 |
Occupancy by Householder Income Bracket in Mattawana
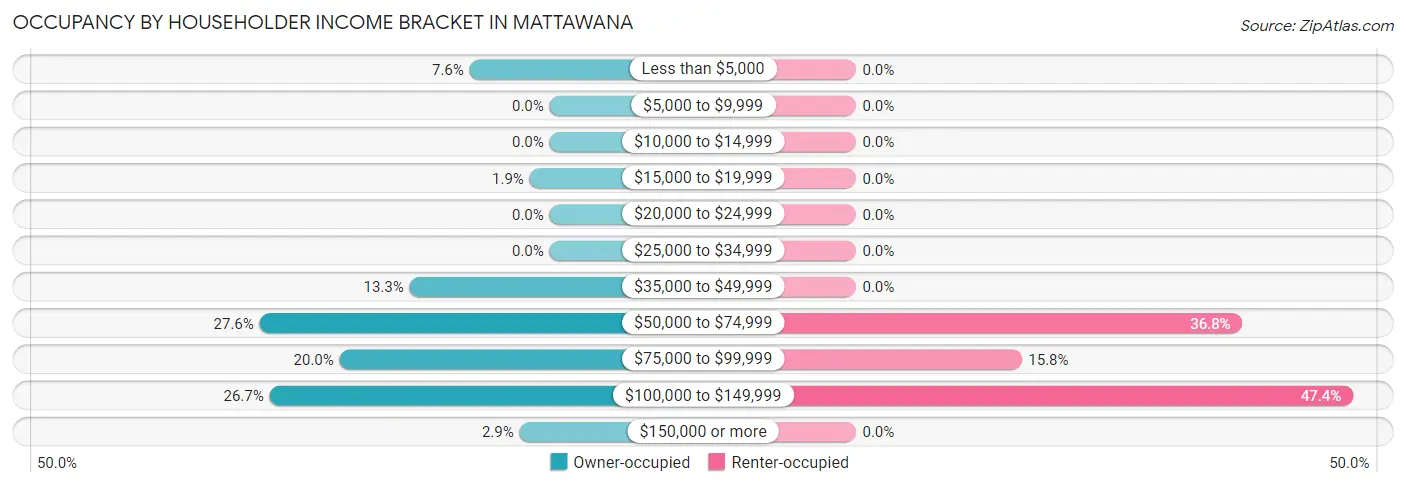
| Income Bracket | Owner-occupied | Renter-occupied |
| Less than $5,000 | 8 (7.6%) | 0 (0.0%) |
| $5,000 to $9,999 | 0 (0.0%) | 0 (0.0%) |
| $10,000 to $14,999 | 0 (0.0%) | 0 (0.0%) |
| $15,000 to $19,999 | 2 (1.9%) | 0 (0.0%) |
| $20,000 to $24,999 | 0 (0.0%) | 0 (0.0%) |
| $25,000 to $34,999 | 0 (0.0%) | 0 (0.0%) |
| $35,000 to $49,999 | 14 (13.3%) | 0 (0.0%) |
| $50,000 to $74,999 | 29 (27.6%) | 7 (36.8%) |
| $75,000 to $99,999 | 21 (20.0%) | 3 (15.8%) |
| $100,000 to $149,999 | 28 (26.7%) | 9 (47.4%) |
| $150,000 or more | 3 (2.9%) | 0 (0.0%) |
| Total | 105 (100.0%) | 19 (100.0%) |
Monthly Housing Cost Tiers in Mattawana
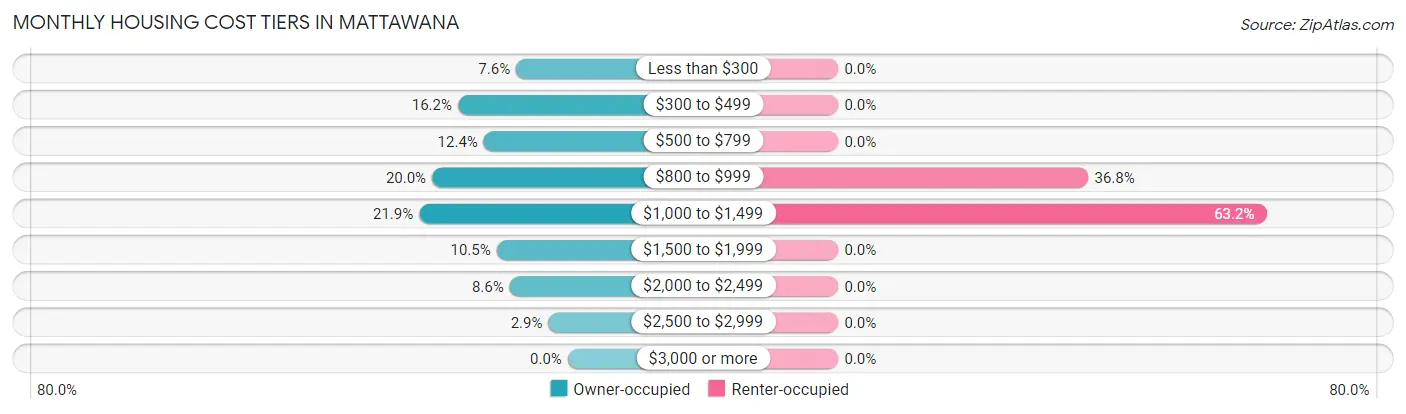
| Monthly Cost | Owner-occupied | Renter-occupied |
| Less than $300 | 8 (7.6%) | 0 (0.0%) |
| $300 to $499 | 17 (16.2%) | 0 (0.0%) |
| $500 to $799 | 13 (12.4%) | 0 (0.0%) |
| $800 to $999 | 21 (20.0%) | 7 (36.8%) |
| $1,000 to $1,499 | 23 (21.9%) | 12 (63.2%) |
| $1,500 to $1,999 | 11 (10.5%) | 0 (0.0%) |
| $2,000 to $2,499 | 9 (8.6%) | 0 (0.0%) |
| $2,500 to $2,999 | 3 (2.9%) | 0 (0.0%) |
| $3,000 or more | 0 (0.0%) | 0 (0.0%) |
| Total | 105 (100.0%) | 19 (100.0%) |
Physical Housing Characteristics in Mattawana
Housing Structures in Mattawana
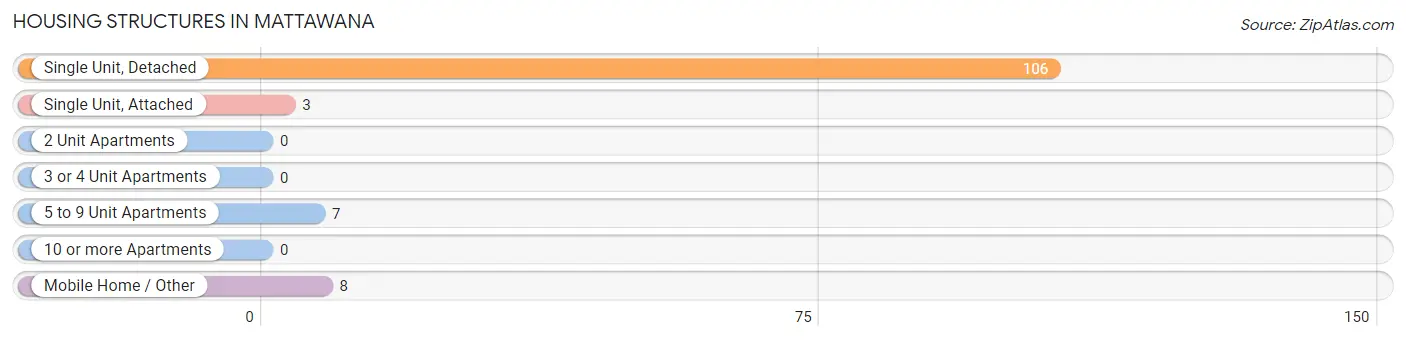
| Structure Type | # Housing Units | % Housing Units |
| Single Unit, Detached | 106 | 85.5% |
| Single Unit, Attached | 3 | 2.4% |
| 2 Unit Apartments | 0 | 0.0% |
| 3 or 4 Unit Apartments | 0 | 0.0% |
| 5 to 9 Unit Apartments | 7 | 5.7% |
| 10 or more Apartments | 0 | 0.0% |
| Mobile Home / Other | 8 | 6.5% |
| Total | 124 | 100.0% |
Housing Structures by Occupancy in Mattawana
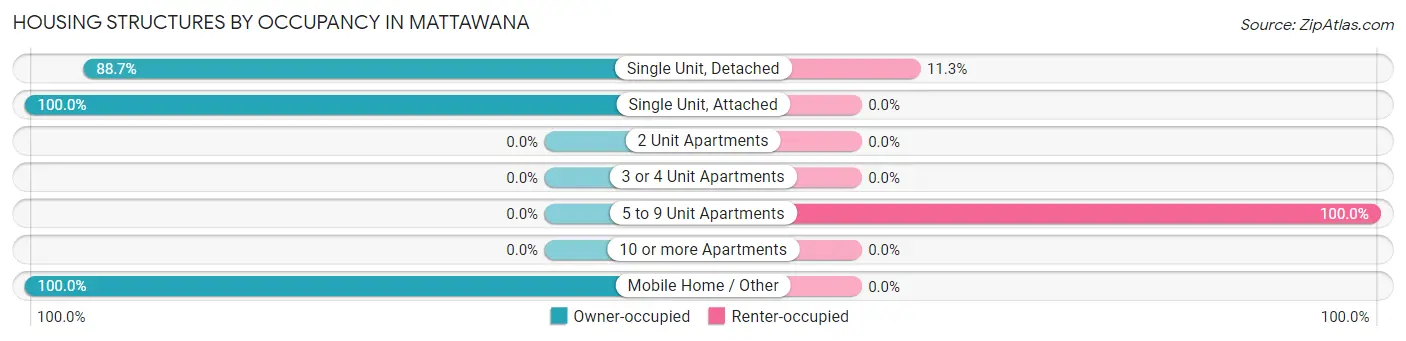
| Structure Type | Owner-occupied | Renter-occupied |
| Single Unit, Detached | 94 (88.7%) | 12 (11.3%) |
| Single Unit, Attached | 3 (100.0%) | 0 (0.0%) |
| 2 Unit Apartments | 0 (0.0%) | 0 (0.0%) |
| 3 or 4 Unit Apartments | 0 (0.0%) | 0 (0.0%) |
| 5 to 9 Unit Apartments | 0 (0.0%) | 7 (100.0%) |
| 10 or more Apartments | 0 (0.0%) | 0 (0.0%) |
| Mobile Home / Other | 8 (100.0%) | 0 (0.0%) |
| Total | 105 (84.7%) | 19 (15.3%) |
Housing Structures by Number of Rooms in Mattawana

| Number of Rooms | Owner-occupied | Renter-occupied |
| 1 Room | 0 (0.0%) | 0 (0.0%) |
| 2 or 3 Rooms | 8 (7.6%) | 7 (36.8%) |
| 4 or 5 Rooms | 26 (24.8%) | 0 (0.0%) |
| 6 or 7 Rooms | 33 (31.4%) | 12 (63.2%) |
| 8 or more Rooms | 38 (36.2%) | 0 (0.0%) |
| Total | 105 (100.0%) | 19 (100.0%) |
Housing Structure by Heating Type in Mattawana
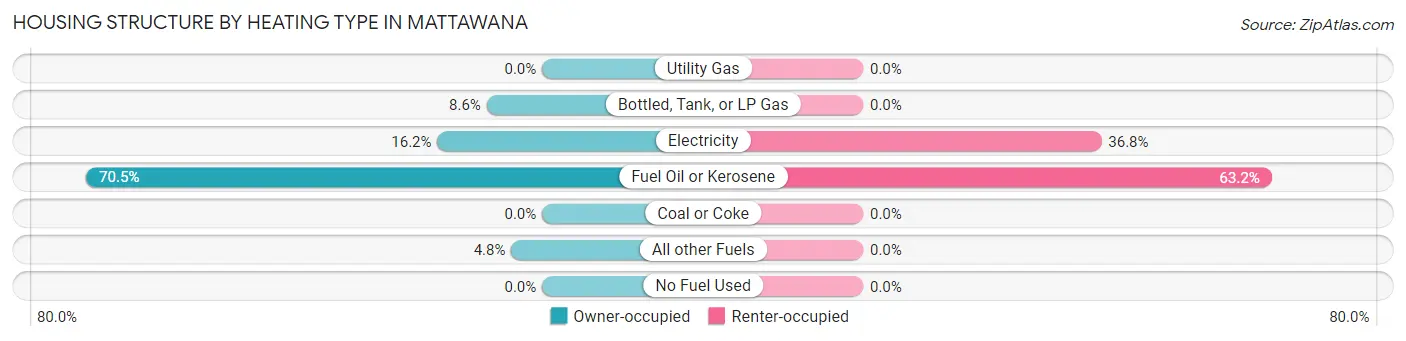
| Heating Type | Owner-occupied | Renter-occupied |
| Utility Gas | 0 (0.0%) | 0 (0.0%) |
| Bottled, Tank, or LP Gas | 9 (8.6%) | 0 (0.0%) |
| Electricity | 17 (16.2%) | 7 (36.8%) |
| Fuel Oil or Kerosene | 74 (70.5%) | 12 (63.2%) |
| Coal or Coke | 0 (0.0%) | 0 (0.0%) |
| All other Fuels | 5 (4.8%) | 0 (0.0%) |
| No Fuel Used | 0 (0.0%) | 0 (0.0%) |
| Total | 105 (100.0%) | 19 (100.0%) |
Household Vehicle Usage in Mattawana
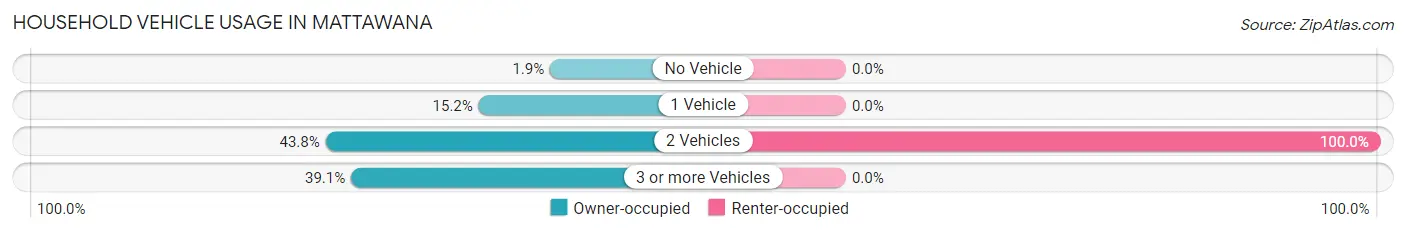
| Vehicles per Household | Owner-occupied | Renter-occupied |
| No Vehicle | 2 (1.9%) | 0 (0.0%) |
| 1 Vehicle | 16 (15.2%) | 0 (0.0%) |
| 2 Vehicles | 46 (43.8%) | 19 (100.0%) |
| 3 or more Vehicles | 41 (39.1%) | 0 (0.0%) |
| Total | 105 (100.0%) | 19 (100.0%) |
Real Estate & Mortgages in Mattawana
Real Estate and Mortgage Overview in Mattawana
| Characteristic | Without Mortgage | With Mortgage |
| Housing Units | 43 | 62 |
| Median Property Value | $137,500 | $118,200 |
| Median Household Income | $88,295 | $3 |
| Monthly Housing Costs | $430 | $0 |
| Real Estate Taxes | $1,692 | $2 |
Property Value by Mortgage Status in Mattawana
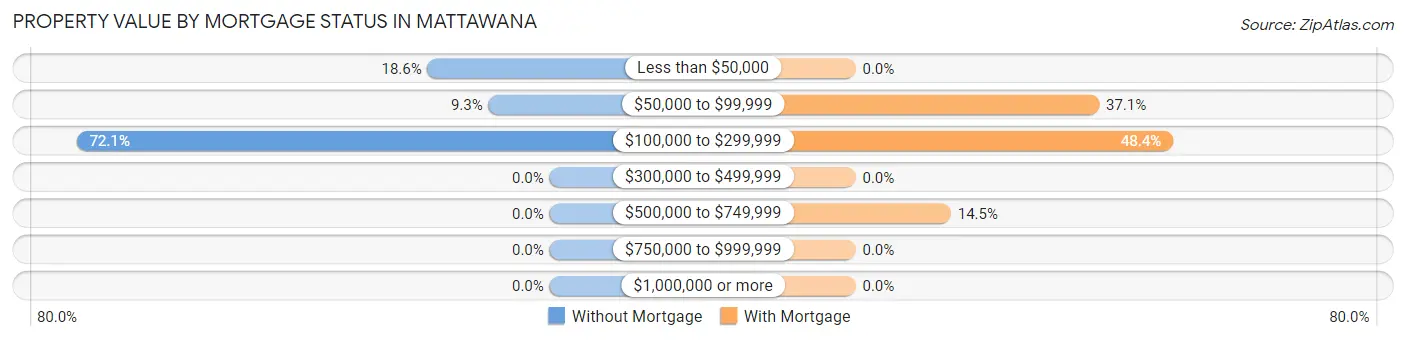
| Property Value | Without Mortgage | With Mortgage |
| Less than $50,000 | 8 (18.6%) | 0 (0.0%) |
| $50,000 to $99,999 | 4 (9.3%) | 23 (37.1%) |
| $100,000 to $299,999 | 31 (72.1%) | 30 (48.4%) |
| $300,000 to $499,999 | 0 (0.0%) | 0 (0.0%) |
| $500,000 to $749,999 | 0 (0.0%) | 9 (14.5%) |
| $750,000 to $999,999 | 0 (0.0%) | 0 (0.0%) |
| $1,000,000 or more | 0 (0.0%) | 0 (0.0%) |
| Total | 43 (100.0%) | 62 (100.0%) |
Household Income by Mortgage Status in Mattawana
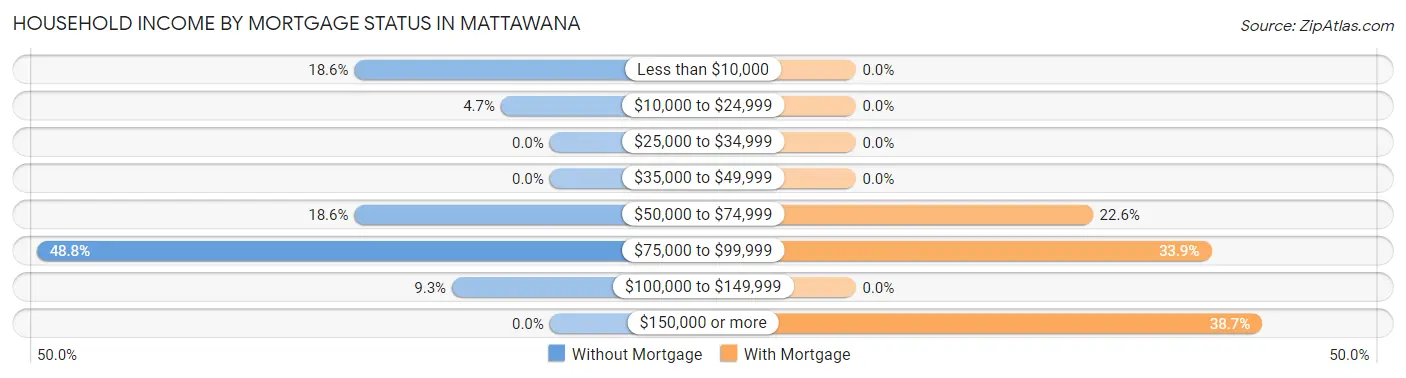
| Household Income | Without Mortgage | With Mortgage |
| Less than $10,000 | 8 (18.6%) | 0 (0.0%) |
| $10,000 to $24,999 | 2 (4.6%) | 0 (0.0%) |
| $25,000 to $34,999 | 0 (0.0%) | 0 (0.0%) |
| $35,000 to $49,999 | 0 (0.0%) | 0 (0.0%) |
| $50,000 to $74,999 | 8 (18.6%) | 14 (22.6%) |
| $75,000 to $99,999 | 21 (48.8%) | 21 (33.9%) |
| $100,000 to $149,999 | 4 (9.3%) | 0 (0.0%) |
| $150,000 or more | 0 (0.0%) | 24 (38.7%) |
| Total | 43 (100.0%) | 62 (100.0%) |
Property Value to Household Income Ratio in Mattawana
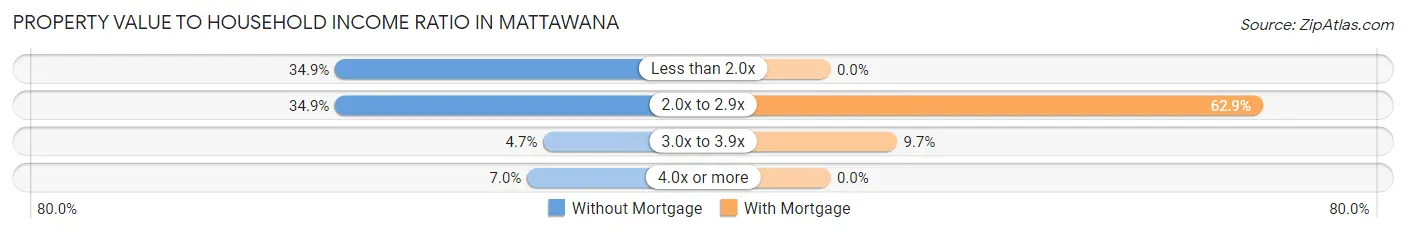
| Value-to-Income Ratio | Without Mortgage | With Mortgage |
| Less than 2.0x | 15 (34.9%) | 0 (0.0%) |
| 2.0x to 2.9x | 15 (34.9%) | 39 (62.9%) |
| 3.0x to 3.9x | 2 (4.6%) | 6 (9.7%) |
| 4.0x or more | 3 (7.0%) | 0 (0.0%) |
| Total | 43 (100.0%) | 62 (100.0%) |
Real Estate Taxes by Mortgage Status in Mattawana
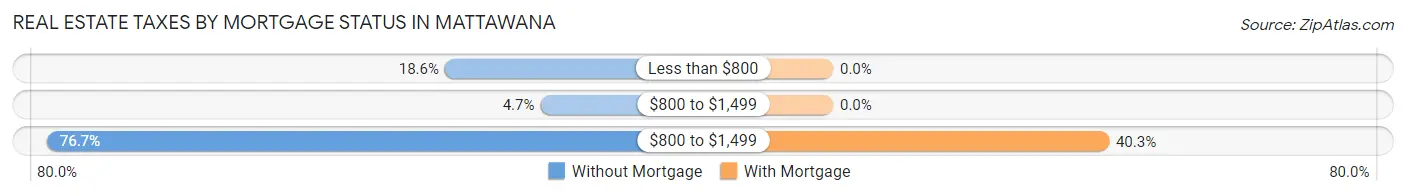
| Property Taxes | Without Mortgage | With Mortgage |
| Less than $800 | 8 (18.6%) | 0 (0.0%) |
| $800 to $1,499 | 2 (4.6%) | 0 (0.0%) |
| $800 to $1,499 | 33 (76.7%) | 25 (40.3%) |
| Total | 43 (100.0%) | 62 (100.0%) |
Health & Disability in Mattawana
Health Insurance Coverage by Age in Mattawana
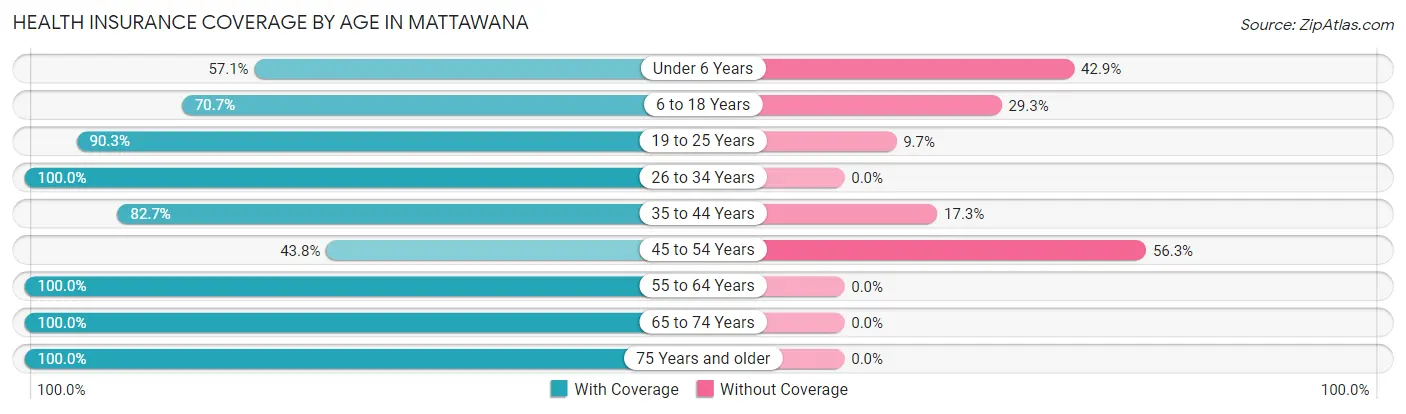
| Age Bracket | With Coverage | Without Coverage |
| Under 6 Years | 12 (57.1%) | 9 (42.9%) |
| 6 to 18 Years | 82 (70.7%) | 34 (29.3%) |
| 19 to 25 Years | 28 (90.3%) | 3 (9.7%) |
| 26 to 34 Years | 39 (100.0%) | 0 (0.0%) |
| 35 to 44 Years | 43 (82.7%) | 9 (17.3%) |
| 45 to 54 Years | 14 (43.8%) | 18 (56.2%) |
| 55 to 64 Years | 62 (100.0%) | 0 (0.0%) |
| 65 to 74 Years | 41 (100.0%) | 0 (0.0%) |
| 75 Years and older | 4 (100.0%) | 0 (0.0%) |
| Total | 325 (81.7%) | 73 (18.3%) |
Health Insurance Coverage by Citizenship Status in Mattawana
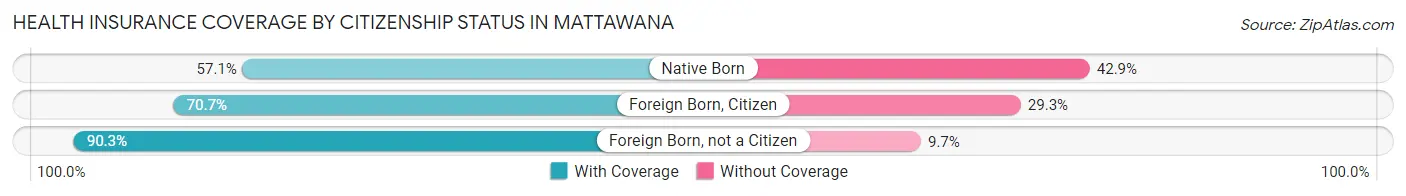
| Citizenship Status | With Coverage | Without Coverage |
| Native Born | 12 (57.1%) | 9 (42.9%) |
| Foreign Born, Citizen | 82 (70.7%) | 34 (29.3%) |
| Foreign Born, not a Citizen | 28 (90.3%) | 3 (9.7%) |
Health Insurance Coverage by Household Income in Mattawana
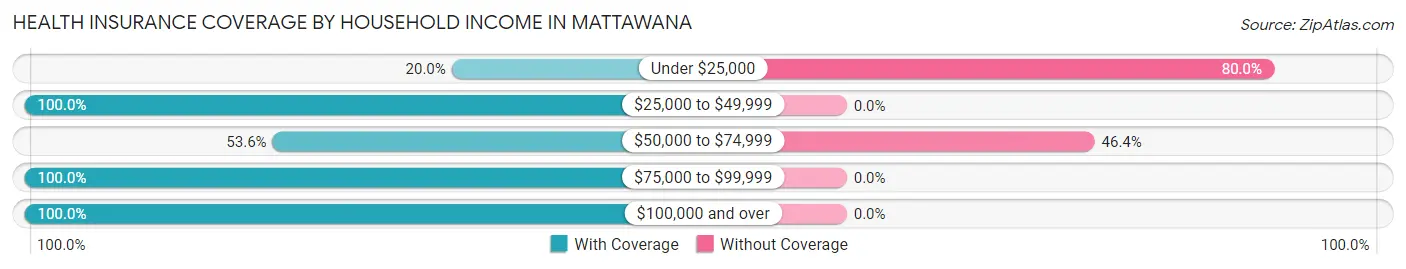
| Household Income | With Coverage | Without Coverage |
| Under $25,000 | 2 (20.0%) | 8 (80.0%) |
| $25,000 to $49,999 | 24 (100.0%) | 0 (0.0%) |
| $50,000 to $74,999 | 75 (53.6%) | 65 (46.4%) |
| $75,000 to $99,999 | 53 (100.0%) | 0 (0.0%) |
| $100,000 and over | 171 (100.0%) | 0 (0.0%) |
Public vs Private Health Insurance Coverage by Age in Mattawana
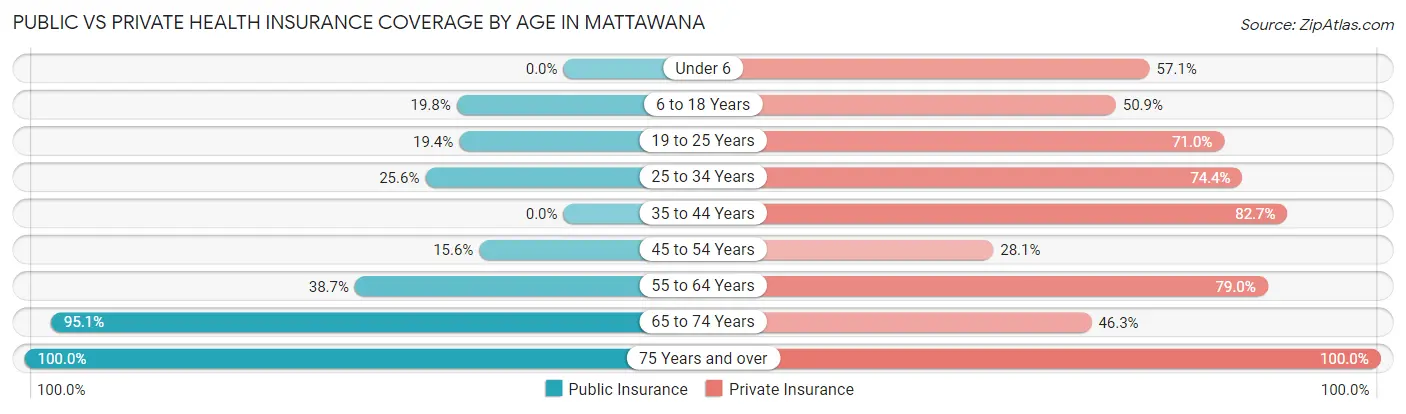
| Age Bracket | Public Insurance | Private Insurance |
| Under 6 | 0 (0.0%) | 12 (57.1%) |
| 6 to 18 Years | 23 (19.8%) | 59 (50.9%) |
| 19 to 25 Years | 6 (19.4%) | 22 (71.0%) |
| 25 to 34 Years | 10 (25.6%) | 29 (74.4%) |
| 35 to 44 Years | 0 (0.0%) | 43 (82.7%) |
| 45 to 54 Years | 5 (15.6%) | 9 (28.1%) |
| 55 to 64 Years | 24 (38.7%) | 49 (79.0%) |
| 65 to 74 Years | 39 (95.1%) | 19 (46.3%) |
| 75 Years and over | 4 (100.0%) | 4 (100.0%) |
| Total | 111 (27.9%) | 246 (61.8%) |
Disability Status by Sex by Age in Mattawana
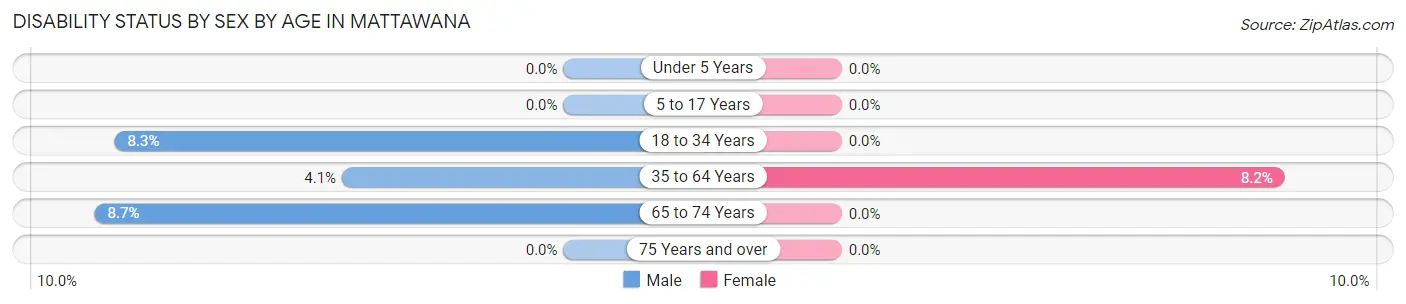
| Age Bracket | Male | Female |
| Under 5 Years | 0 (0.0%) | 0 (0.0%) |
| 5 to 17 Years | 0 (0.0%) | 0 (0.0%) |
| 18 to 34 Years | 3 (8.3%) | 0 (0.0%) |
| 35 to 64 Years | 3 (4.1%) | 6 (8.2%) |
| 65 to 74 Years | 2 (8.7%) | 0 (0.0%) |
| 75 Years and over | 0 (0.0%) | 0 (0.0%) |
Disability Class by Sex by Age in Mattawana
Disability Class: Hearing Difficulty
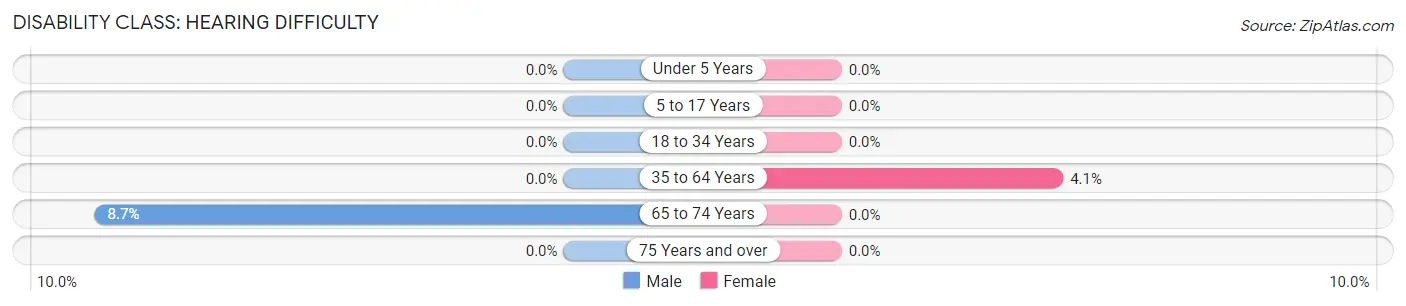
| Age Bracket | Male | Female |
| Under 5 Years | 0 (0.0%) | 0 (0.0%) |
| 5 to 17 Years | 0 (0.0%) | 0 (0.0%) |
| 18 to 34 Years | 0 (0.0%) | 0 (0.0%) |
| 35 to 64 Years | 0 (0.0%) | 3 (4.1%) |
| 65 to 74 Years | 2 (8.7%) | 0 (0.0%) |
| 75 Years and over | 0 (0.0%) | 0 (0.0%) |
Disability Class: Vision Difficulty
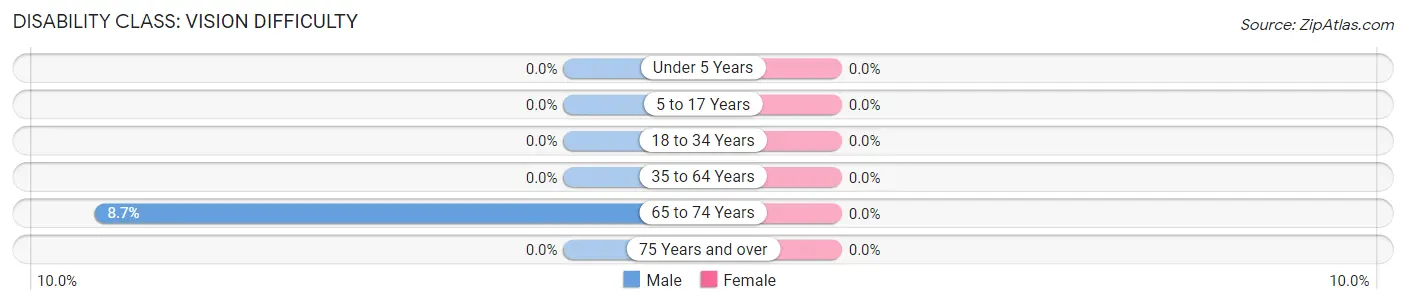
| Age Bracket | Male | Female |
| Under 5 Years | 0 (0.0%) | 0 (0.0%) |
| 5 to 17 Years | 0 (0.0%) | 0 (0.0%) |
| 18 to 34 Years | 0 (0.0%) | 0 (0.0%) |
| 35 to 64 Years | 0 (0.0%) | 0 (0.0%) |
| 65 to 74 Years | 2 (8.7%) | 0 (0.0%) |
| 75 Years and over | 0 (0.0%) | 0 (0.0%) |
Disability Class: Cognitive Difficulty
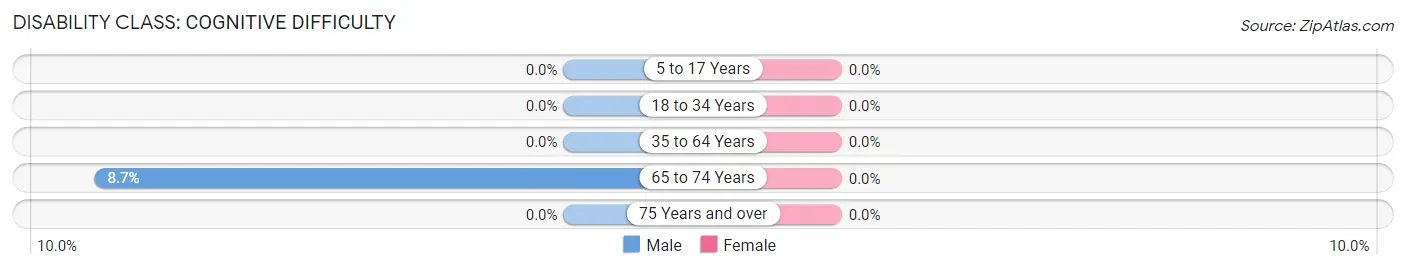
| Age Bracket | Male | Female |
| 5 to 17 Years | 0 (0.0%) | 0 (0.0%) |
| 18 to 34 Years | 0 (0.0%) | 0 (0.0%) |
| 35 to 64 Years | 0 (0.0%) | 0 (0.0%) |
| 65 to 74 Years | 2 (8.7%) | 0 (0.0%) |
| 75 Years and over | 0 (0.0%) | 0 (0.0%) |
Disability Class: Ambulatory Difficulty
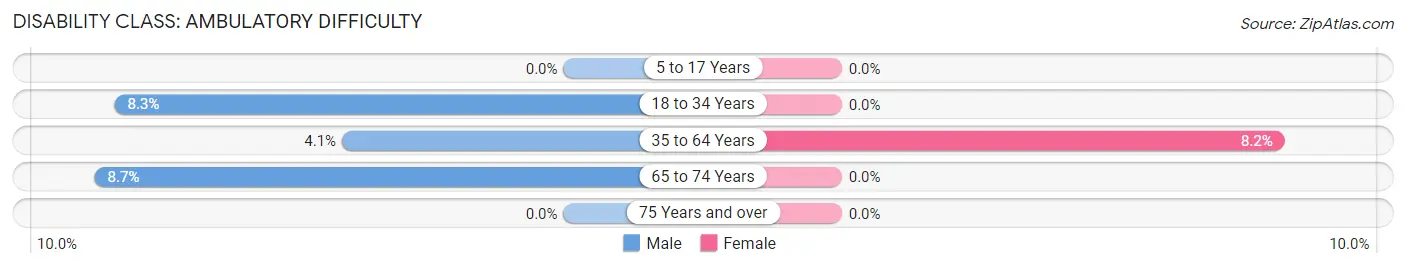
| Age Bracket | Male | Female |
| 5 to 17 Years | 0 (0.0%) | 0 (0.0%) |
| 18 to 34 Years | 3 (8.3%) | 0 (0.0%) |
| 35 to 64 Years | 3 (4.1%) | 6 (8.2%) |
| 65 to 74 Years | 2 (8.7%) | 0 (0.0%) |
| 75 Years and over | 0 (0.0%) | 0 (0.0%) |
Disability Class: Self-Care Difficulty
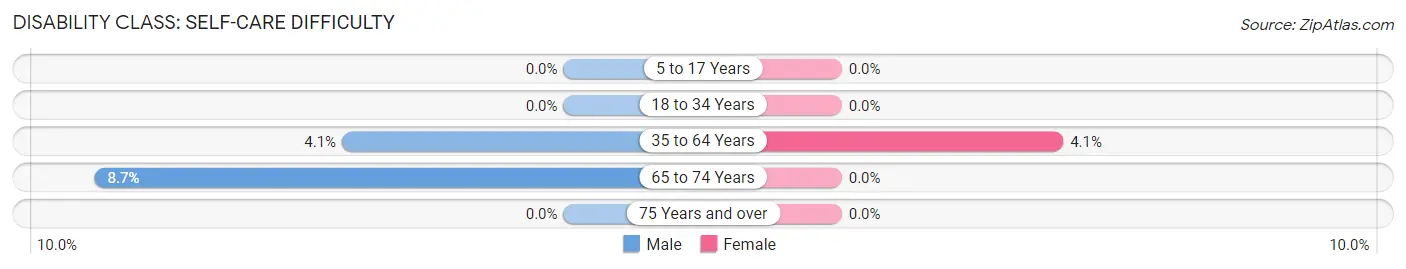
| Age Bracket | Male | Female |
| 5 to 17 Years | 0 (0.0%) | 0 (0.0%) |
| 18 to 34 Years | 0 (0.0%) | 0 (0.0%) |
| 35 to 64 Years | 3 (4.1%) | 3 (4.1%) |
| 65 to 74 Years | 2 (8.7%) | 0 (0.0%) |
| 75 Years and over | 0 (0.0%) | 0 (0.0%) |
Technology Access in Mattawana
Computing Device Access in Mattawana
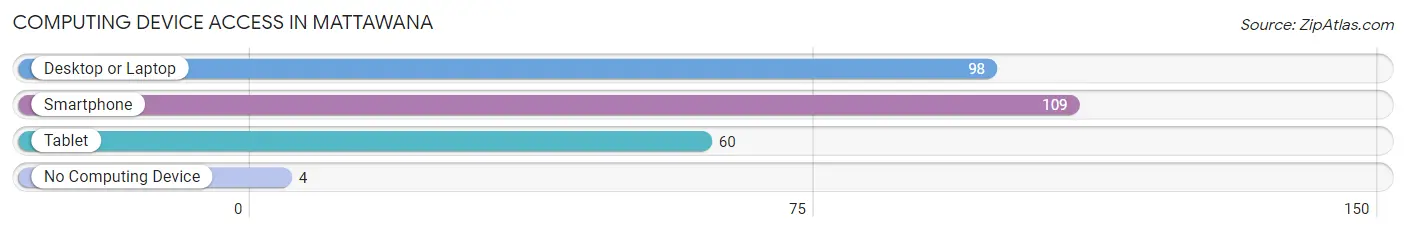
| Device Type | # Households | % Households |
| Desktop or Laptop | 98 | 79.0% |
| Smartphone | 109 | 87.9% |
| Tablet | 60 | 48.4% |
| No Computing Device | 4 | 3.2% |
| Total | 124 | 100.0% |
Internet Access in Mattawana
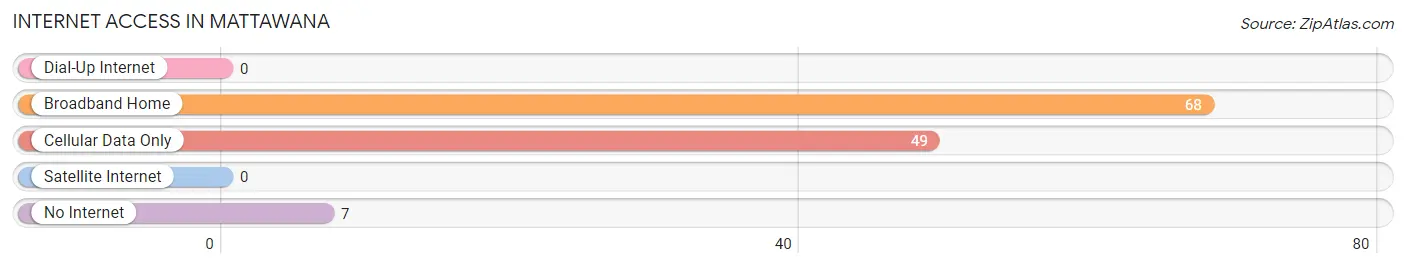
| Internet Type | # Households | % Households |
| Dial-Up Internet | 0 | 0.0% |
| Broadband Home | 68 | 54.8% |
| Cellular Data Only | 49 | 39.5% |
| Satellite Internet | 0 | 0.0% |
| No Internet | 7 | 5.7% |
| Total | 124 | 100.0% |
Mattawana Summary
Mattawana is a small borough located in Mifflin County, Pennsylvania. It is situated in the Juniata River Valley, approximately 10 miles south of Lewistown. The population of Mattawana was 545 at the 2010 census.
History
The area that is now Mattawana was first settled in the late 1700s by German immigrants. The town was originally known as “Mifflinburg” and was part of Mifflin County. In 1845, the town was renamed “Mattawana” after a local Native American chief. The town was officially incorporated in 1876.
In the late 1800s, Mattawana was a thriving industrial center. The town was home to several factories, including a woolen mill, a tannery, a sawmill, and a gristmill. The town also had a railroad station, which connected it to the rest of the county.
In the early 1900s, Mattawana began to decline. The factories closed and the railroad station was abandoned. The population of the town decreased significantly, and by the 1950s, the town was nearly abandoned.
In the late 20th century, Mattawana began to experience a resurgence. The town was revitalized by the construction of a new highway, which connected it to the rest of the county. The population of the town began to increase, and by the 2010 census, the population had reached 545.
Geography
Mattawana is located in the Juniata River Valley, approximately 10 miles south of Lewistown. The town is situated on the banks of the Juniata River, and is surrounded by rolling hills and farmland. The town is located in a rural area, and is home to several small farms.
Economy
The economy of Mattawana is largely based on agriculture. The town is home to several small farms, which produce a variety of crops, including corn, soybeans, and hay. The town is also home to several small businesses, including a grocery store, a hardware store, and a restaurant.
Demographics
As of the 2010 census, the population of Mattawana was 545. The racial makeup of the town was 97.3% White, 0.7% African American, 0.2% Native American, 0.2% Asian, and 1.6% from other races. The median household income was $41,250, and the median family income was $48,750. The per capita income was $19,945. The town had a poverty rate of 11.3%.
Common Questions
What is Per Capita Income in Mattawana?
Per Capita income in Mattawana is $25,703.
What is the Median Family Income in Mattawana?
Median Family Income in Mattawana is $86,528.
What is the Median Household income in Mattawana?
Median Household Income in Mattawana is $81,667.
What is Income or Wage Gap in Mattawana?
Income or Wage Gap in Mattawana is 3.0%.
Women in Mattawana earn 97.0 cents for every dollar earned by a man.
What is Inequality or Gini Index in Mattawana?
Inequality or Gini Index in Mattawana is 0.30.
What is the Total Population of Mattawana?
Total Population of Mattawana is 398.
What is the Total Male Population of Mattawana?
Total Male Population of Mattawana is 206.
What is the Total Female Population of Mattawana?
Total Female Population of Mattawana is 192.
What is the Ratio of Males per 100 Females in Mattawana?
There are 107.29 Males per 100 Females in Mattawana.
What is the Ratio of Females per 100 Males in Mattawana?
There are 93.20 Females per 100 Males in Mattawana.
What is the Median Population Age in Mattawana?
Median Population Age in Mattawana is 31.9 Years.
What is the Average Family Size in Mattawana
Average Family Size in Mattawana is 3.3 People.
What is the Average Household Size in Mattawana
Average Household Size in Mattawana is 3.2 People.
How Large is the Labor Force in Mattawana?
There are 187 People in the Labor Forcein in Mattawana.
What is the Percentage of People in the Labor Force in Mattawana?
70.3% of People are in the Labor Force in Mattawana.