Rote, PA Map & Demographics
Rote Map
Rote Overview
$36,568
PER CAPITA INCOME
$82,361
AVG FAMILY INCOME
$78,456
AVG HOUSEHOLD INCOME
59.5%
WAGE / INCOME GAP [ % ]
40.5¢/ $1
WAGE / INCOME GAP [ $ ]
0.31
INEQUALITY / GINI INDEX
684
TOTAL POPULATION
410
MALE POPULATION
274
FEMALE POPULATION
149.64
MALES / 100 FEMALES
66.83
FEMALES / 100 MALES
45.1
MEDIAN AGE
2.8
AVG FAMILY SIZE
2.4
AVG HOUSEHOLD SIZE
379
LABOR FORCE [ PEOPLE ]
69.9%
PERCENT IN LABOR FORCE
2.4%
UNEMPLOYMENT RATE
Income in Rote
Income Overview in Rote
Per Capita Income in Rote is $36,568, while median incomes of families and households are $82,361 and $78,456 respectively.
| Characteristic | Number | Measure |
| Per Capita Income | 684 | $36,568 |
| Median Family Income | 225 | $82,361 |
| Mean Family Income | 225 | $100,055 |
| Median Household Income | 285 | $78,456 |
| Mean Household Income | 285 | $90,009 |
| Income Deficit | 225 | $0 |
| Wage / Income Gap (%) | 684 | 59.48% |
| Wage / Income Gap ($) | 684 | 40.52¢ per $1 |
| Gini / Inequality Index | 684 | 0.31 |
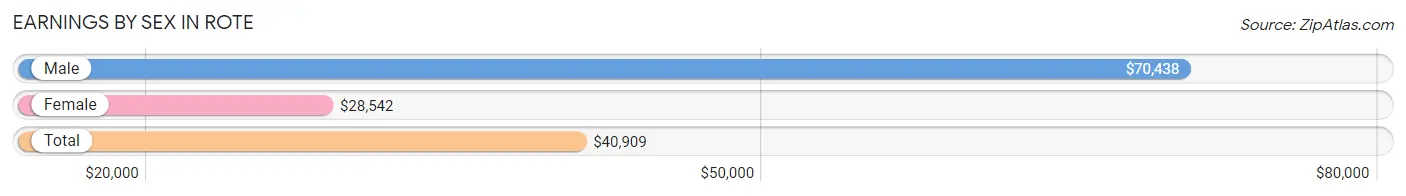
Earnings by Sex in Rote
Average Earnings in Rote are $40,909, $70,438 for men and $28,542 for women, a difference of 59.5%.
| Sex | Number | Average Earnings |
| Male | 235 (60.6%) | $70,438 |
| Female | 153 (39.4%) | $28,542 |
| Total | 388 (100.0%) | $40,909 |
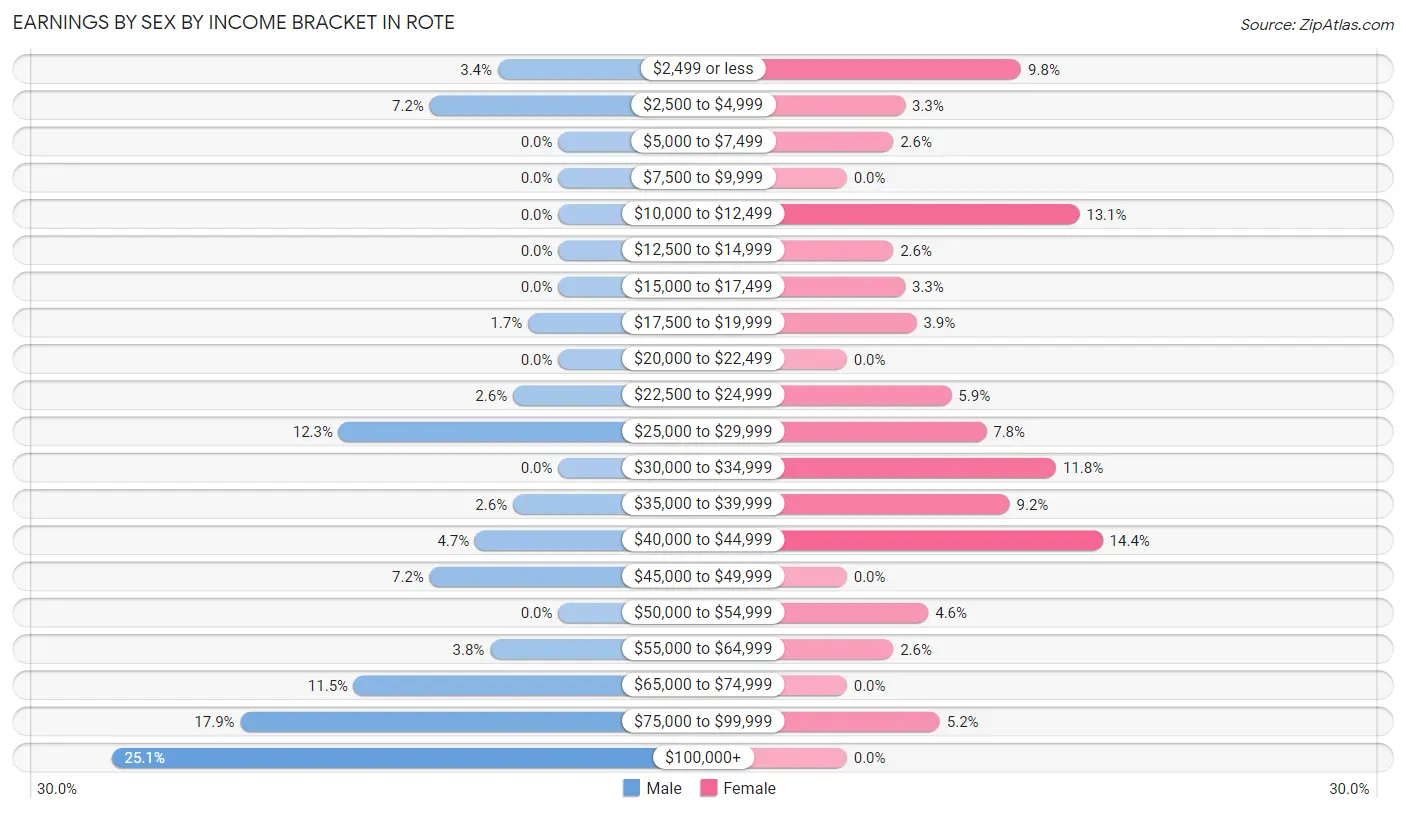
Earnings by Sex by Income Bracket in Rote
The most common earnings brackets in Rote are $100,000+ for men (59 | 25.1%) and $40,000 to $44,999 for women (22 | 14.4%).
| Income | Male | Female |
| $2,499 or less | 8 (3.4%) | 15 (9.8%) |
| $2,500 to $4,999 | 17 (7.2%) | 5 (3.3%) |
| $5,000 to $7,499 | 0 (0.0%) | 4 (2.6%) |
| $7,500 to $9,999 | 0 (0.0%) | 0 (0.0%) |
| $10,000 to $12,499 | 0 (0.0%) | 20 (13.1%) |
| $12,500 to $14,999 | 0 (0.0%) | 4 (2.6%) |
| $15,000 to $17,499 | 0 (0.0%) | 5 (3.3%) |
| $17,500 to $19,999 | 4 (1.7%) | 6 (3.9%) |
| $20,000 to $22,499 | 0 (0.0%) | 0 (0.0%) |
| $22,500 to $24,999 | 6 (2.5%) | 9 (5.9%) |
| $25,000 to $29,999 | 29 (12.3%) | 12 (7.8%) |
| $30,000 to $34,999 | 0 (0.0%) | 18 (11.8%) |
| $35,000 to $39,999 | 6 (2.5%) | 14 (9.1%) |
| $40,000 to $44,999 | 11 (4.7%) | 22 (14.4%) |
| $45,000 to $49,999 | 17 (7.2%) | 0 (0.0%) |
| $50,000 to $54,999 | 0 (0.0%) | 7 (4.6%) |
| $55,000 to $64,999 | 9 (3.8%) | 4 (2.6%) |
| $65,000 to $74,999 | 27 (11.5%) | 0 (0.0%) |
| $75,000 to $99,999 | 42 (17.9%) | 8 (5.2%) |
| $100,000+ | 59 (25.1%) | 0 (0.0%) |
| Total | 235 (100.0%) | 153 (100.0%) |
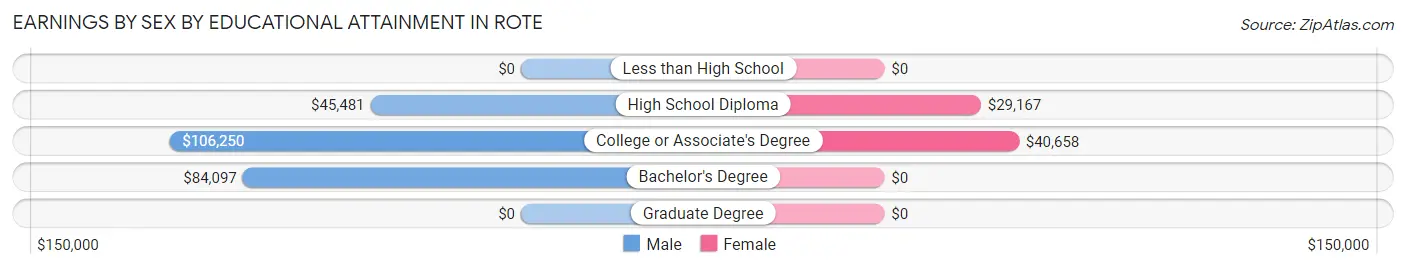
Earnings by Sex by Educational Attainment in Rote
Average earnings in Rote are $71,438 for men and $33,056 for women, a difference of 53.7%. Men with an educational attainment of college or associate's degree enjoy the highest average annual earnings of $106,250, while those with high school diploma education earn the least with $45,481. Women with an educational attainment of college or associate's degree earn the most with the average annual earnings of $40,658, while those with high school diploma education have the smallest earnings of $29,167.
| Educational Attainment | Male Income | Female Income |
| Less than High School | - | - |
| High School Diploma | $45,481 | $29,167 |
| College or Associate's Degree | $106,250 | $40,658 |
| Bachelor's Degree | $84,097 | $0 |
| Graduate Degree | - | - |
| Total | $71,438 | $33,056 |
Family Income in Rote
Family Income Brackets in Rote
According to the Rote family income data, there are 68 families falling into the $75,000 to $99,999 income range, which is the most common income bracket and makes up 30.2% of all families.
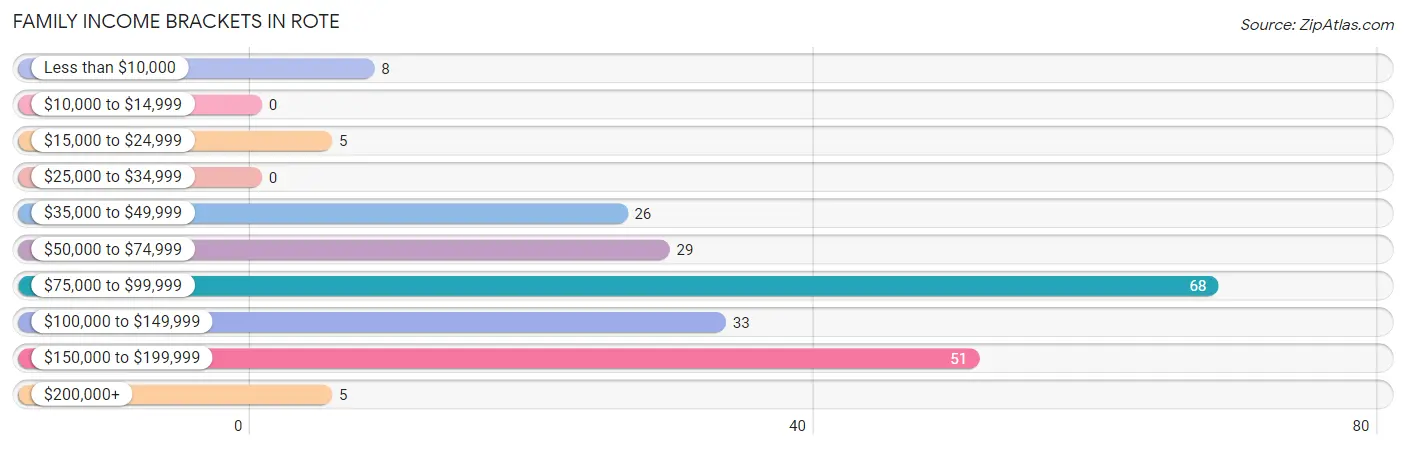
| Income Bracket | # Families | % Families |
| Less than $10,000 | 8 | 3.6% |
| $10,000 to $14,999 | 0 | 0.0% |
| $15,000 to $24,999 | 5 | 2.2% |
| $25,000 to $34,999 | 0 | 0.0% |
| $35,000 to $49,999 | 26 | 11.6% |
| $50,000 to $74,999 | 29 | 12.9% |
| $75,000 to $99,999 | 68 | 30.2% |
| $100,000 to $149,999 | 33 | 14.7% |
| $150,000 to $199,999 | 51 | 22.7% |
| $200,000+ | 5 | 2.2% |
Family Income by Famaliy Size in Rote
3-person families (133 | 59.1%) account for the highest median family income in Rote with $127,212 per family, while 3-person families (133 | 59.1%) have the highest median income of $42,404 per family member.
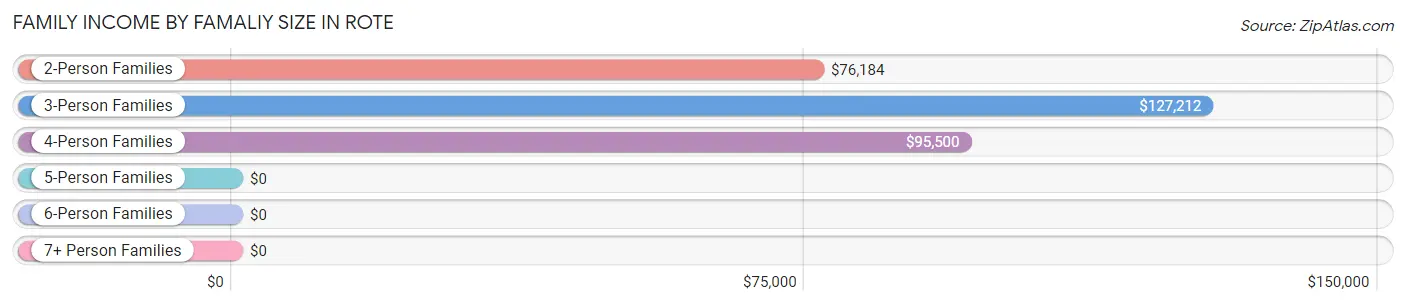
| Income Bracket | # Families | Median Income |
| 2-Person Families | 54 (24.0%) | $76,184 |
| 3-Person Families | 133 (59.1%) | $127,212 |
| 4-Person Families | 30 (13.3%) | $95,500 |
| 5-Person Families | 0 (0.0%) | $0 |
| 6-Person Families | 8 (3.6%) | $0 |
| 7+ Person Families | 0 (0.0%) | $0 |
| Total | 225 (100.0%) | $82,361 |
Family Income by Number of Earners in Rote
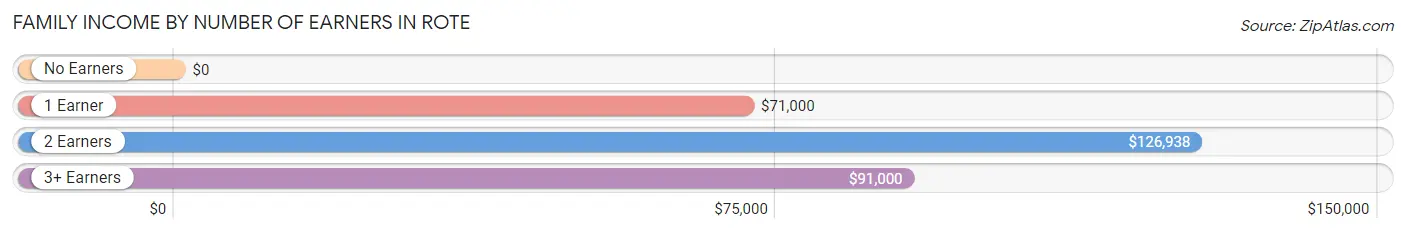
| Number of Earners | # Families | Median Income |
| No Earners | 20 (8.9%) | $0 |
| 1 Earner | 62 (27.6%) | $71,000 |
| 2 Earners | 119 (52.9%) | $126,938 |
| 3+ Earners | 24 (10.7%) | $91,000 |
| Total | 225 (100.0%) | $82,361 |
Household Income in Rote
Household Income Brackets in Rote
With 79 households falling in the category, the $75,000 to $99,999 income range is the most frequent in Rote, accounting for 27.7% of all households.
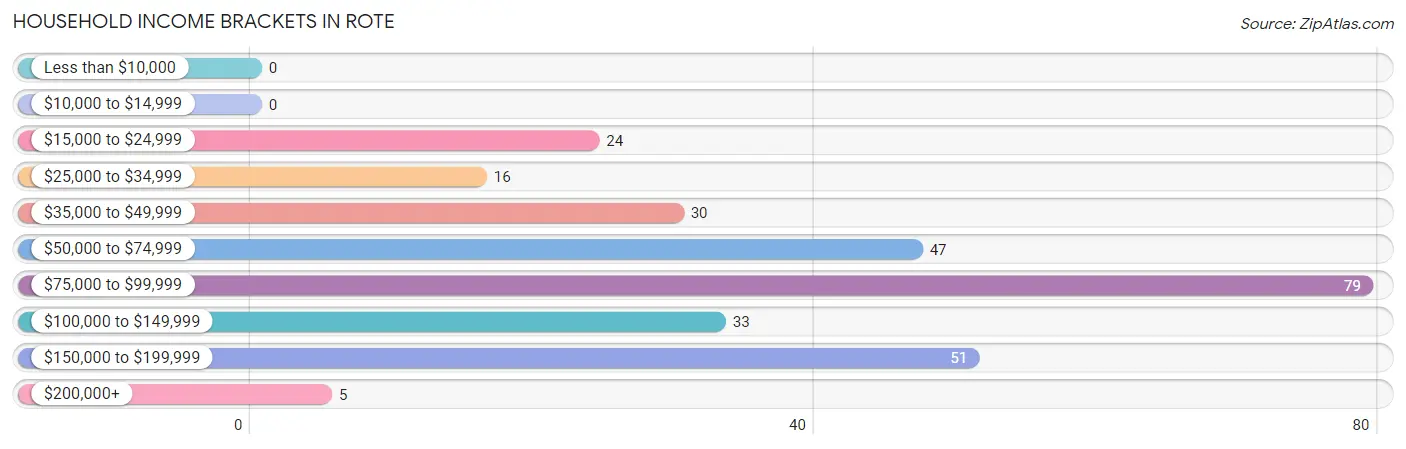
| Income Bracket | # Households | % Households |
| Less than $10,000 | 0 | 0.0% |
| $10,000 to $14,999 | 0 | 0.0% |
| $15,000 to $24,999 | 24 | 8.4% |
| $25,000 to $34,999 | 16 | 5.6% |
| $35,000 to $49,999 | 30 | 10.5% |
| $50,000 to $74,999 | 47 | 16.5% |
| $75,000 to $99,999 | 79 | 27.7% |
| $100,000 to $149,999 | 33 | 11.6% |
| $150,000 to $199,999 | 51 | 17.9% |
| $200,000+ | 5 | 1.8% |
Household Income by Householder Age in Rote
The median household income in Rote is $78,456, with the highest median household income of $121,875 found in the 45 to 64 years age bracket for the primary householder. A total of 158 households (55.4%) fall into this category.
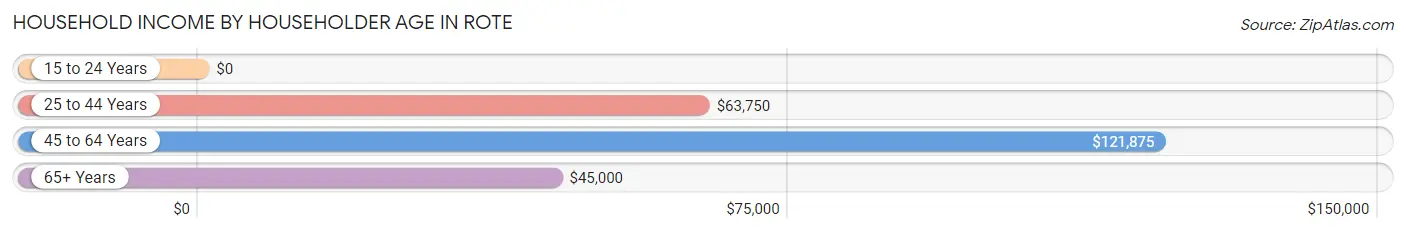
| Income Bracket | # Households | Median Income |
| 15 to 24 Years | 0 (0.0%) | $0 |
| 25 to 44 Years | 61 (21.4%) | $63,750 |
| 45 to 64 Years | 158 (55.4%) | $121,875 |
| 65+ Years | 66 (23.2%) | $45,000 |
| Total | 285 (100.0%) | $78,456 |
Poverty in Rote
Income Below Poverty by Sex and Age in Rote
With 4.9% poverty level for males and 9.1% for females among the residents of Rote, under 5 year old males and 6 to 11 year old females are the most vulnerable to poverty, with 6 males (30.0%) and 19 females (39.6%) in their respective age groups living below the poverty level.
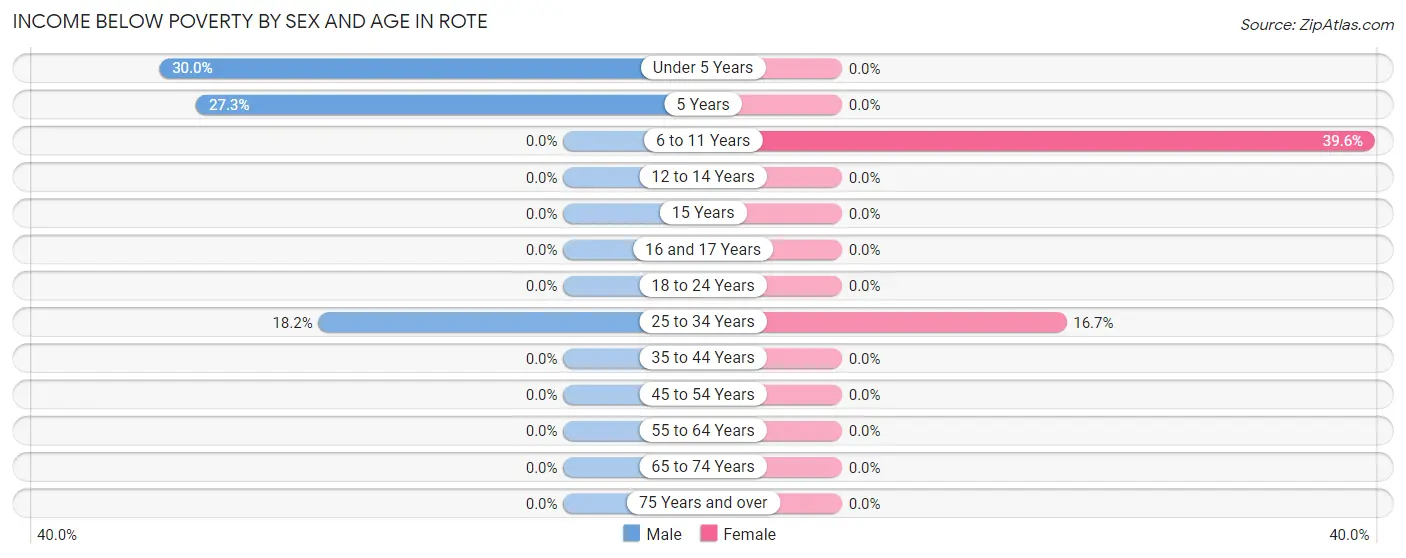
| Age Bracket | Male | Female |
| Under 5 Years | 6 (30.0%) | 0 (0.0%) |
| 5 Years | 6 (27.3%) | 0 (0.0%) |
| 6 to 11 Years | 0 (0.0%) | 19 (39.6%) |
| 12 to 14 Years | 0 (0.0%) | 0 (0.0%) |
| 15 Years | 0 (0.0%) | 0 (0.0%) |
| 16 and 17 Years | 0 (0.0%) | 0 (0.0%) |
| 18 to 24 Years | 0 (0.0%) | 0 (0.0%) |
| 25 to 34 Years | 8 (18.2%) | 6 (16.7%) |
| 35 to 44 Years | 0 (0.0%) | 0 (0.0%) |
| 45 to 54 Years | 0 (0.0%) | 0 (0.0%) |
| 55 to 64 Years | 0 (0.0%) | 0 (0.0%) |
| 65 to 74 Years | 0 (0.0%) | 0 (0.0%) |
| 75 Years and over | 0 (0.0%) | 0 (0.0%) |
| Total | 20 (4.9%) | 25 (9.1%) |
Income Above Poverty by Sex and Age in Rote
According to the poverty statistics in Rote, males aged 6 to 11 years and females aged under 5 years are the age groups that are most secure financially, with 100.0% of males and 100.0% of females in these age groups living above the poverty line.
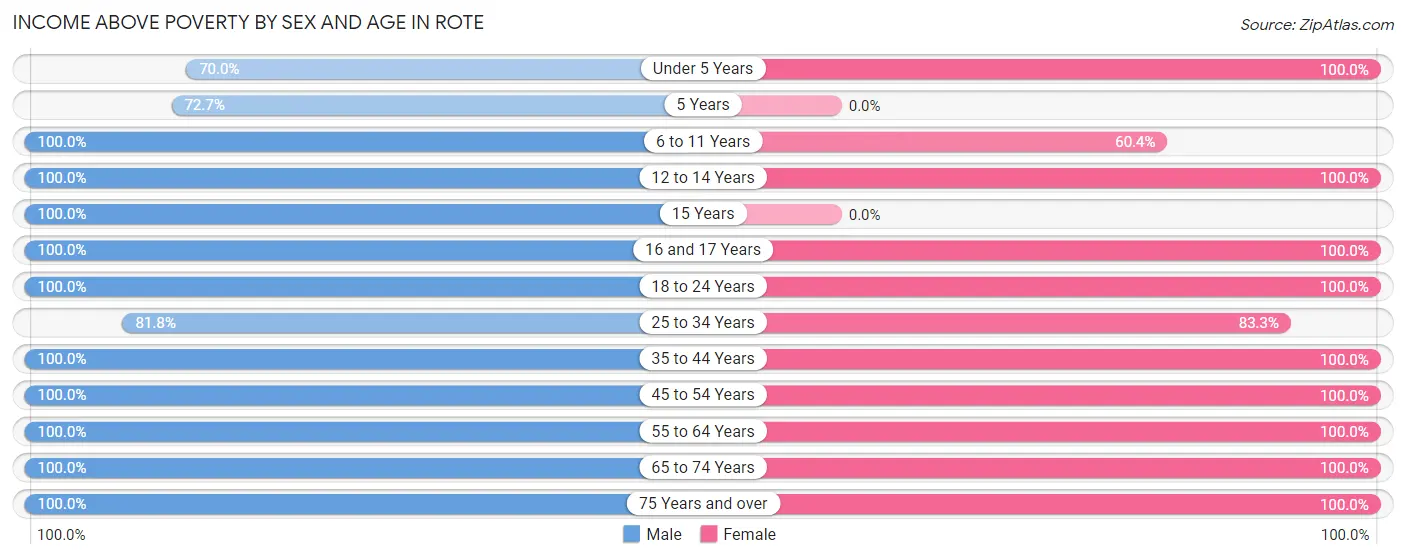
| Age Bracket | Male | Female |
| Under 5 Years | 14 (70.0%) | 6 (100.0%) |
| 5 Years | 16 (72.7%) | 0 (0.0%) |
| 6 to 11 Years | 22 (100.0%) | 29 (60.4%) |
| 12 to 14 Years | 15 (100.0%) | 5 (100.0%) |
| 15 Years | 4 (100.0%) | 0 (0.0%) |
| 16 and 17 Years | 29 (100.0%) | 4 (100.0%) |
| 18 to 24 Years | 16 (100.0%) | 11 (100.0%) |
| 25 to 34 Years | 36 (81.8%) | 30 (83.3%) |
| 35 to 44 Years | 33 (100.0%) | 25 (100.0%) |
| 45 to 54 Years | 88 (100.0%) | 49 (100.0%) |
| 55 to 64 Years | 69 (100.0%) | 46 (100.0%) |
| 65 to 74 Years | 21 (100.0%) | 14 (100.0%) |
| 75 Years and over | 27 (100.0%) | 30 (100.0%) |
| Total | 390 (95.1%) | 249 (90.9%) |
Income Below Poverty Among Married-Couple Families in Rote
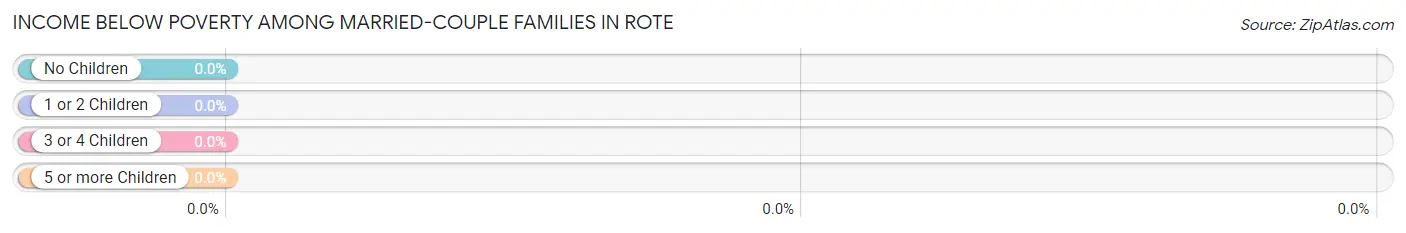
| Children | Above Poverty | Below Poverty |
| No Children | 87 (100.0%) | 0 (0.0%) |
| 1 or 2 Children | 69 (100.0%) | 0 (0.0%) |
| 3 or 4 Children | 0 (0.0%) | 0 (0.0%) |
| 5 or more Children | 0 (0.0%) | 0 (0.0%) |
| Total | 156 (100.0%) | 0 (0.0%) |
Income Below Poverty Among Single-Parent Households in Rote
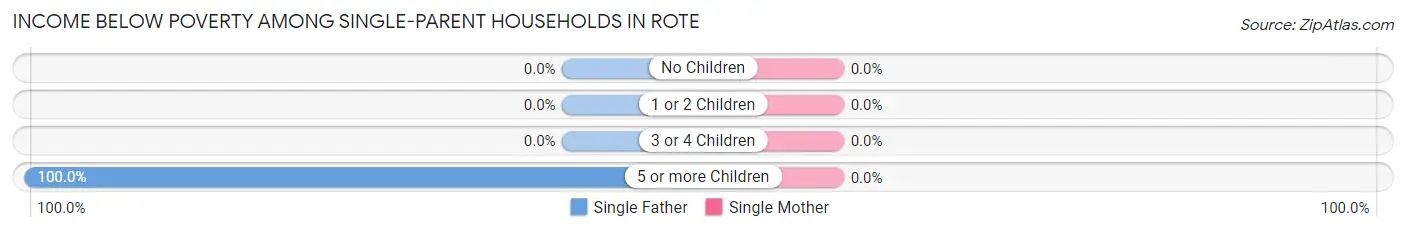
| Children | Single Father | Single Mother |
| No Children | 0 (0.0%) | 0 (0.0%) |
| 1 or 2 Children | 0 (0.0%) | 0 (0.0%) |
| 3 or 4 Children | 0 (0.0%) | 0 (0.0%) |
| 5 or more Children | 8 (100.0%) | 0 (0.0%) |
| Total | 8 (11.6%) | 0 (0.0%) |
Income Below Poverty Among Married-Couple vs Single-Parent Households in Rote
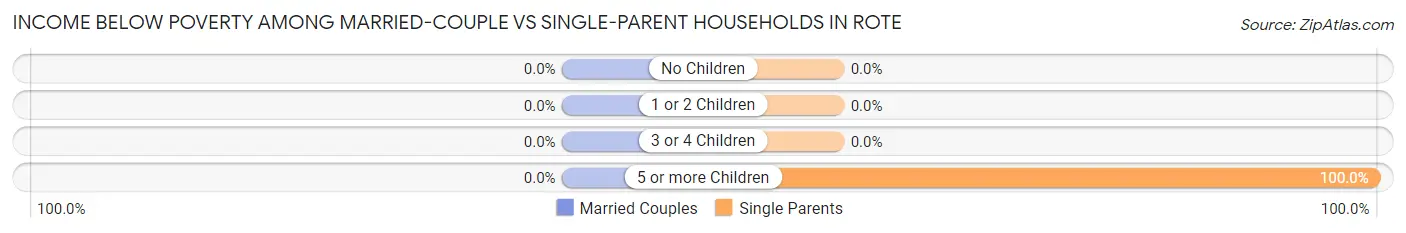
| Children | Married-Couple Families | Single-Parent Households |
| No Children | 0 (0.0%) | 0 (0.0%) |
| 1 or 2 Children | 0 (0.0%) | 0 (0.0%) |
| 3 or 4 Children | 0 (0.0%) | 0 (0.0%) |
| 5 or more Children | 0 (0.0%) | 8 (100.0%) |
| Total | 0 (0.0%) | 8 (11.6%) |
Race in Rote
The most populous races in Rote are White / Caucasian (667 | 97.5%), Asian (8 | 1.2%), and Some other Race (5 | 0.7%).
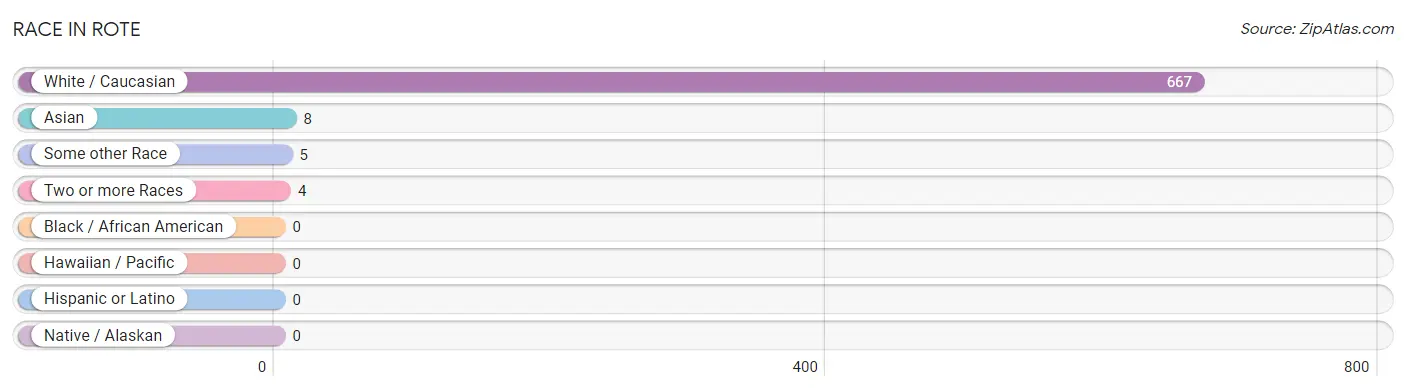
| Race | # Population | % Population |
| Asian | 8 | 1.2% |
| Black / African American | 0 | 0.0% |
| Hawaiian / Pacific | 0 | 0.0% |
| Hispanic or Latino | 0 | 0.0% |
| Native / Alaskan | 0 | 0.0% |
| White / Caucasian | 667 | 97.5% |
| Two or more Races | 4 | 0.6% |
| Some other Race | 5 | 0.7% |
| Total | 684 | 100.0% |
Ancestry in Rote
The most populous ancestries reported in Rote are German (232 | 33.9%), Irish (105 | 15.3%), English (48 | 7.0%), Swiss (27 | 4.0%), and American (24 | 3.5%), together accounting for 63.8% of all Rote residents.
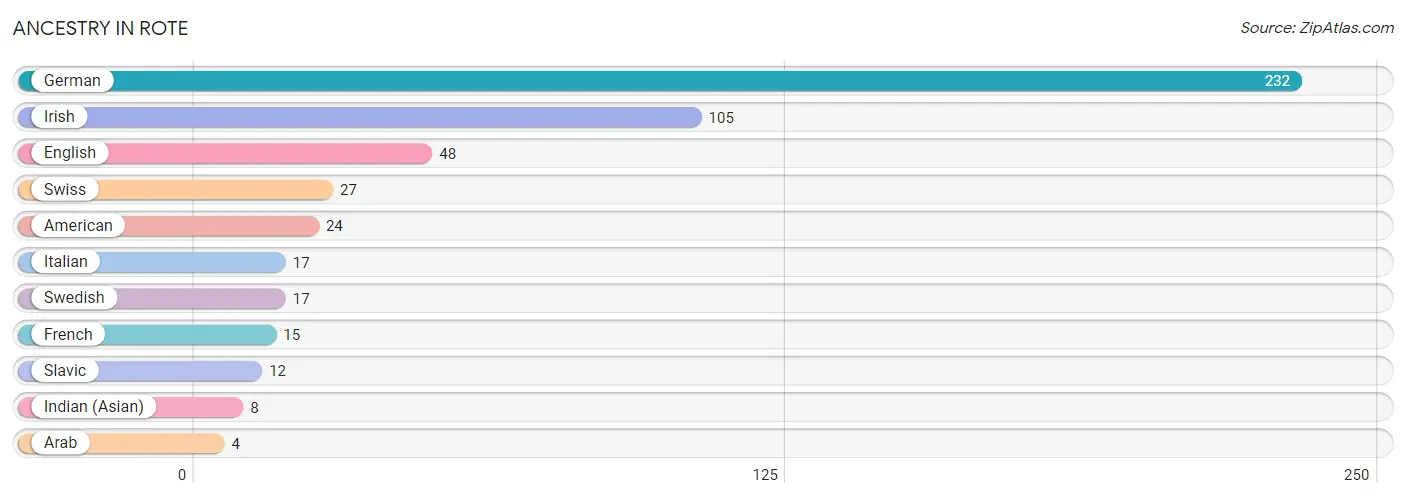
| Ancestry | # Population | % Population |
| American | 24 | 3.5% |
| Arab | 4 | 0.6% |
| English | 48 | 7.0% |
| French | 15 | 2.2% |
| German | 232 | 33.9% |
| Indian (Asian) | 8 | 1.2% |
| Irish | 105 | 15.3% |
| Italian | 17 | 2.5% |
| Slavic | 12 | 1.8% |
| Swedish | 17 | 2.5% |
| Swiss | 27 | 4.0% | View All 11 Rows |
Immigrants in Rote

| Immigration Origin | # Population | % Population | View All 0 Rows |
Sex and Age in Rote
Sex and Age in Rote
The most populous age groups in Rote are 45 to 49 Years (74 | 18.0%) for men and 60 to 64 Years (42 | 15.3%) for women.
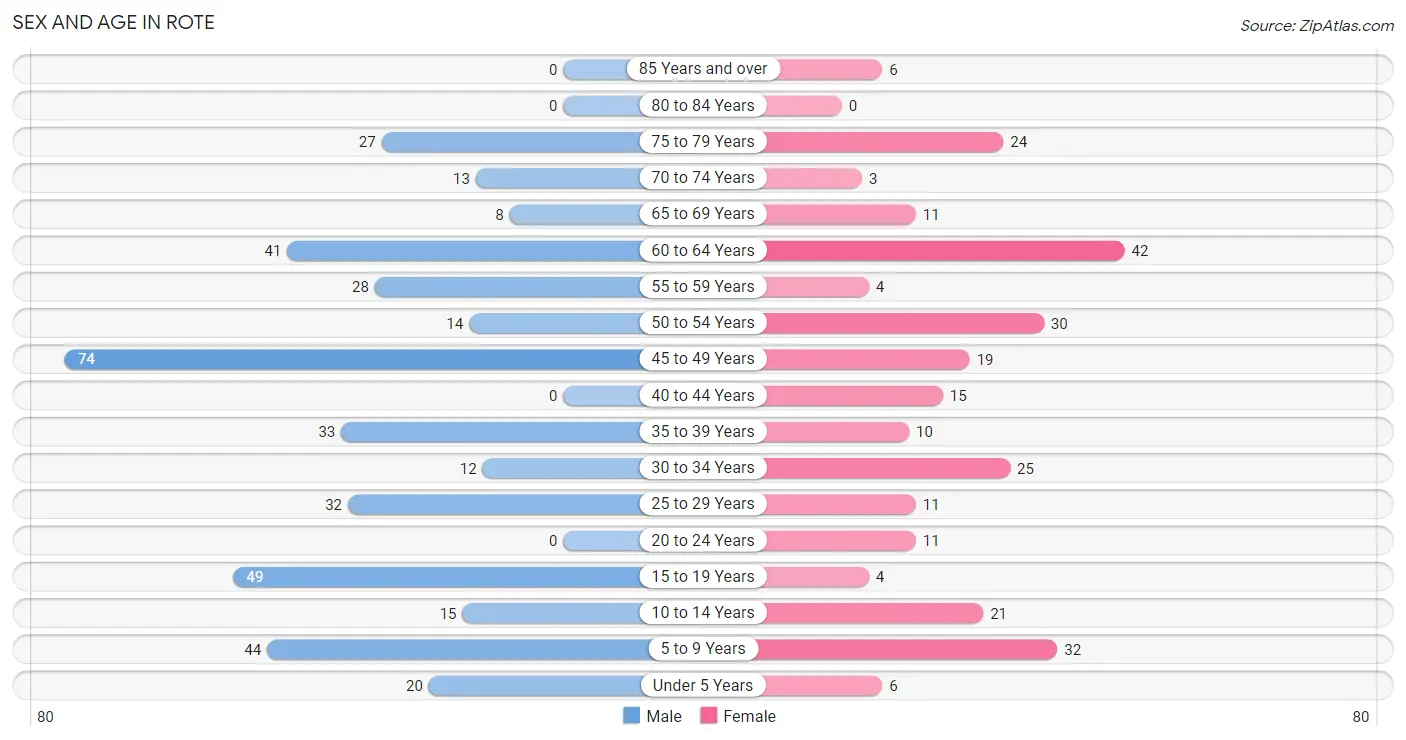
| Age Bracket | Male | Female |
| Under 5 Years | 20 (4.9%) | 6 (2.2%) |
| 5 to 9 Years | 44 (10.7%) | 32 (11.7%) |
| 10 to 14 Years | 15 (3.7%) | 21 (7.7%) |
| 15 to 19 Years | 49 (11.9%) | 4 (1.5%) |
| 20 to 24 Years | 0 (0.0%) | 11 (4.0%) |
| 25 to 29 Years | 32 (7.8%) | 11 (4.0%) |
| 30 to 34 Years | 12 (2.9%) | 25 (9.1%) |
| 35 to 39 Years | 33 (8.1%) | 10 (3.6%) |
| 40 to 44 Years | 0 (0.0%) | 15 (5.5%) |
| 45 to 49 Years | 74 (18.0%) | 19 (6.9%) |
| 50 to 54 Years | 14 (3.4%) | 30 (11.0%) |
| 55 to 59 Years | 28 (6.8%) | 4 (1.5%) |
| 60 to 64 Years | 41 (10.0%) | 42 (15.3%) |
| 65 to 69 Years | 8 (1.9%) | 11 (4.0%) |
| 70 to 74 Years | 13 (3.2%) | 3 (1.1%) |
| 75 to 79 Years | 27 (6.6%) | 24 (8.8%) |
| 80 to 84 Years | 0 (0.0%) | 0 (0.0%) |
| 85 Years and over | 0 (0.0%) | 6 (2.2%) |
| Total | 410 (100.0%) | 274 (100.0%) |
Families and Households in Rote
Median Family Size in Rote
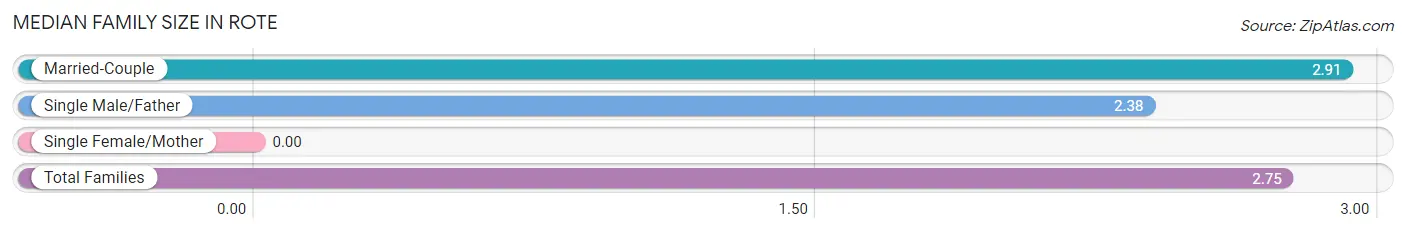
| Family Type | # Families | Family Size |
| Married-Couple | 156 (69.3%) | 2.91 |
| Single Male/Father | 69 (30.7%) | 2.38 |
| Single Female/Mother | 0 (0.0%) | - |
| Total Families | 225 (100.0%) | 2.75 |
Median Household Size in Rote
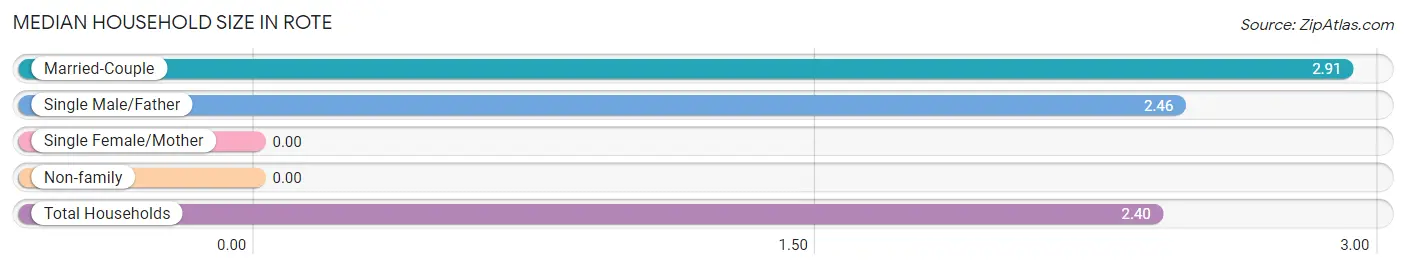
| Household Type | # Households | Household Size |
| Married-Couple | 156 (54.7%) | 2.91 |
| Single Male/Father | 69 (24.2%) | 2.46 |
| Single Female/Mother | 0 (0.0%) | - |
| Non-family | 60 (21.0%) | - |
| Total Households | 285 (100.0%) | 2.40 |
Household Size by Marriage Status in Rote
Out of a total of 285 households in Rote, 225 (78.9%) are family households, while 60 (21.0%) are nonfamily households. The most numerous type of family households are 3-person households, comprising 133, and the most common type of nonfamily households are 1-person households, comprising 60.
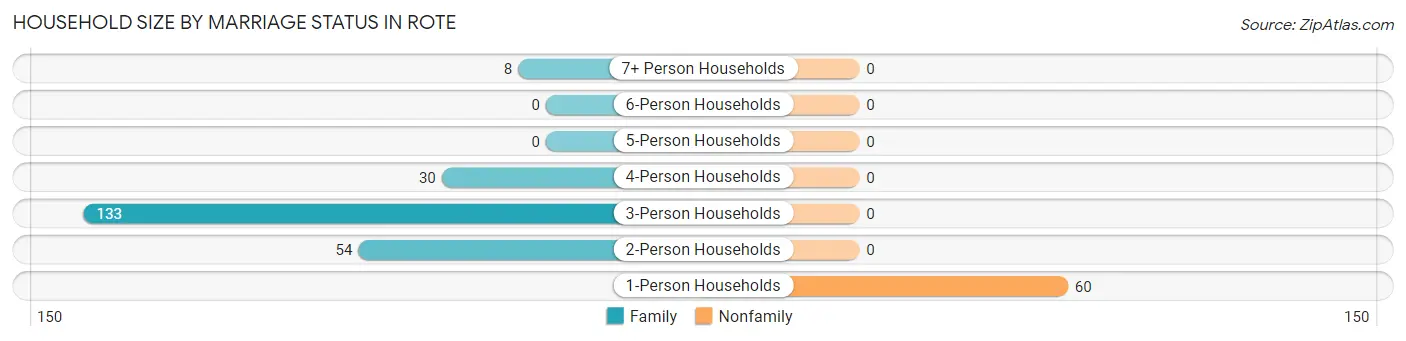
| Household Size | Family Households | Nonfamily Households |
| 1-Person Households | - | 60 (21.0%) |
| 2-Person Households | 54 (19.0%) | 0 (0.0%) |
| 3-Person Households | 133 (46.7%) | 0 (0.0%) |
| 4-Person Households | 30 (10.5%) | 0 (0.0%) |
| 5-Person Households | 0 (0.0%) | 0 (0.0%) |
| 6-Person Households | 0 (0.0%) | 0 (0.0%) |
| 7+ Person Households | 8 (2.8%) | 0 (0.0%) |
| Total | 225 (78.9%) | 60 (21.0%) |
Female Fertility in Rote
Fertility by Age in Rote
Average fertility rate in Rote is 61.0 births per 1,000 women. Women in the age bracket of 20 to 34 years have the highest fertility rate with 128.0 births per 1,000 women. Women in the age bracket of 20 to 34 years acount for 100.0% of all women with births.
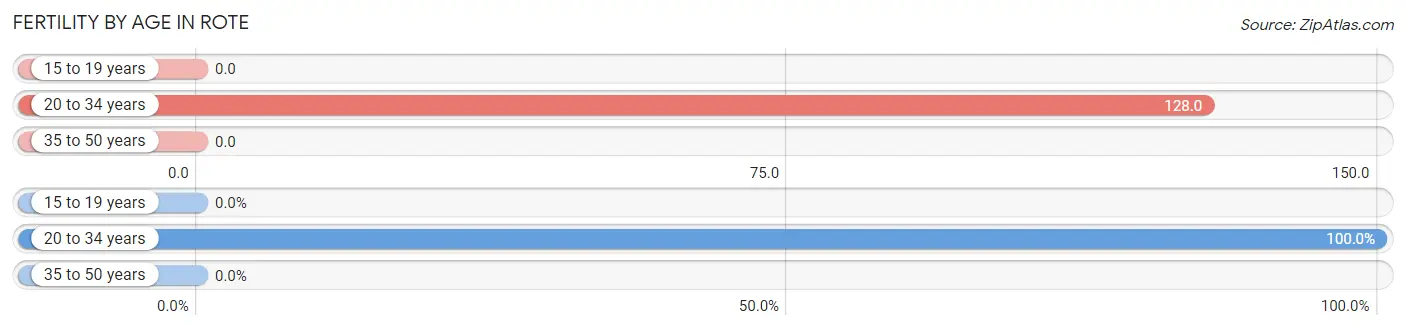
| Age Bracket | Women with Births | Births / 1,000 Women |
| 15 to 19 years | 0 (0.0%) | 0.0 |
| 20 to 34 years | 6 (100.0%) | 128.0 |
| 35 to 50 years | 0 (0.0%) | 0.0 |
| Total | 6 (100.0%) | 61.0 |
Fertility by Age by Marriage Status in Rote
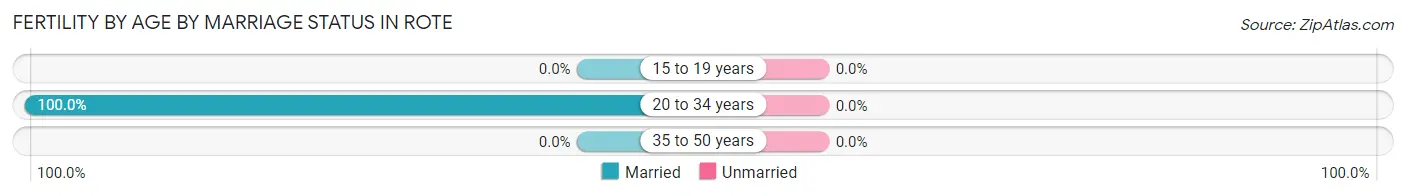
| Age Bracket | Married | Unmarried |
| 15 to 19 years | 0 (0.0%) | 0 (0.0%) |
| 20 to 34 years | 6 (100.0%) | 0 (0.0%) |
| 35 to 50 years | 0 (0.0%) | 0 (0.0%) |
| Total | 6 (100.0%) | 0 (0.0%) |
Fertility by Education in Rote
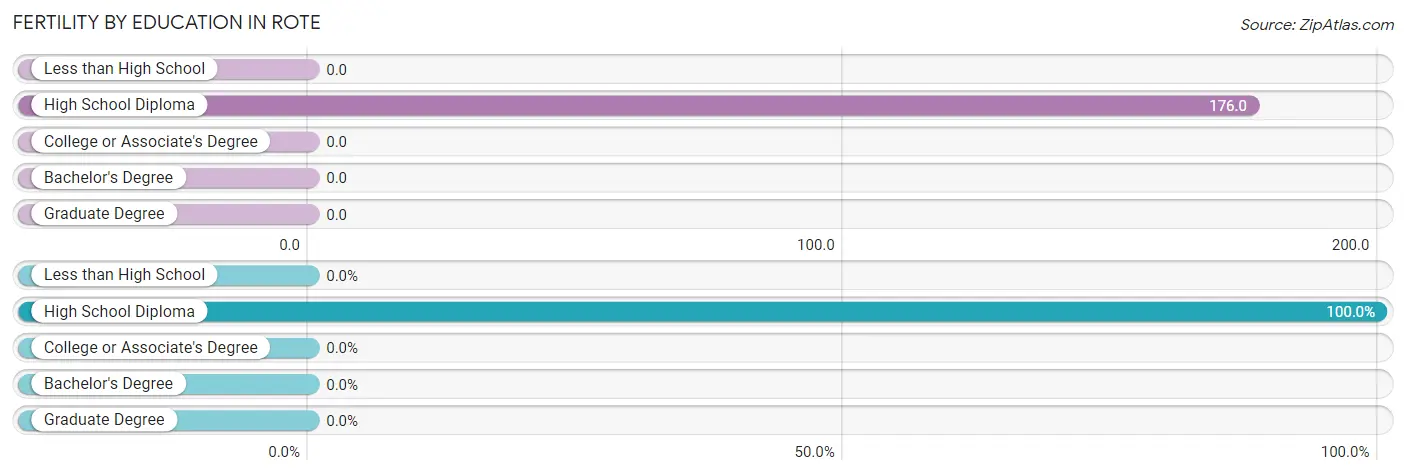
| Educational Attainment | Women with Births | Births / 1,000 Women |
| Less than High School | 0 (0.0%) | 0.0 |
| High School Diploma | 6 (100.0%) | 176.0 |
| College or Associate's Degree | 0 (0.0%) | 0.0 |
| Bachelor's Degree | 0 (0.0%) | 0.0 |
| Graduate Degree | 0 (0.0%) | 0.0 |
| Total | 6 (100.0%) | 61.0 |
Fertility by Education by Marriage Status in Rote
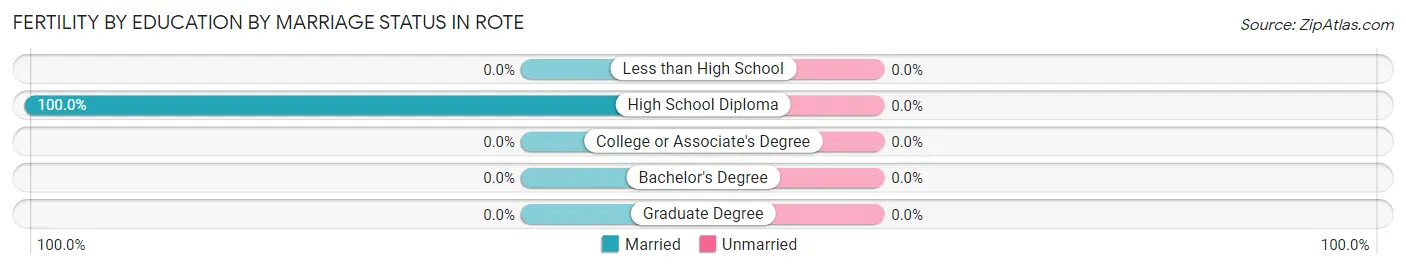
| Educational Attainment | Married | Unmarried |
| Less than High School | 0 (0.0%) | 0 (0.0%) |
| High School Diploma | 6 (100.0%) | 0 (0.0%) |
| College or Associate's Degree | 0 (0.0%) | 0 (0.0%) |
| Bachelor's Degree | 0 (0.0%) | 0 (0.0%) |
| Graduate Degree | 0 (0.0%) | 0 (0.0%) |
| Total | 6 (100.0%) | 0 (0.0%) |
Employment Characteristics in Rote
Employment by Class of Employer in Rote
Among the 366 employed individuals in Rote, private company employees (265 | 72.4%), not-for-profit organizations (33 | 9.0%), and state government employees (28 | 7.6%) make up the most common classes of employment.
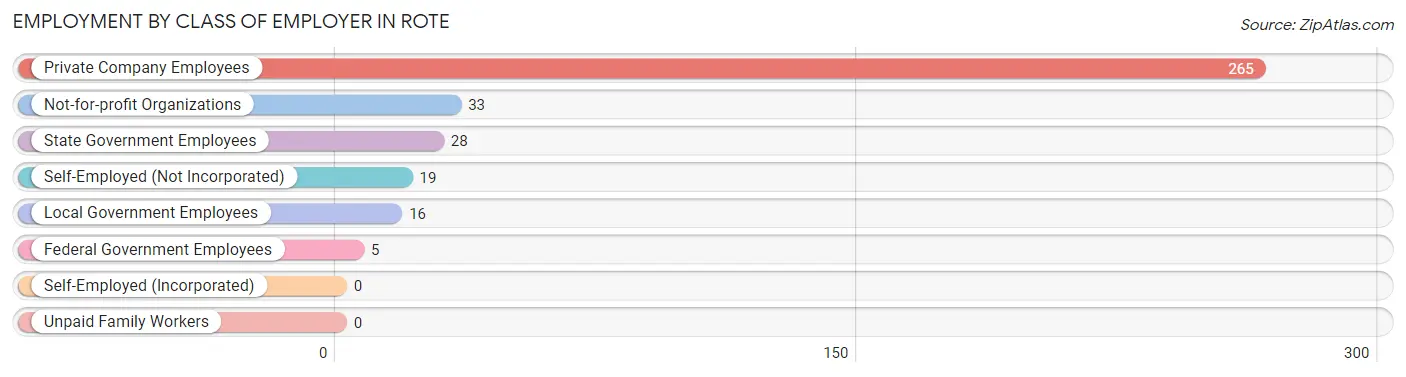
| Employer Class | # Employees | % Employees |
| Private Company Employees | 265 | 72.4% |
| Self-Employed (Incorporated) | 0 | 0.0% |
| Self-Employed (Not Incorporated) | 19 | 5.2% |
| Not-for-profit Organizations | 33 | 9.0% |
| Local Government Employees | 16 | 4.4% |
| State Government Employees | 28 | 7.6% |
| Federal Government Employees | 5 | 1.4% |
| Unpaid Family Workers | 0 | 0.0% |
| Total | 366 | 100.0% |
Employment Status by Age in Rote
According to the labor force statistics for Rote, out of the total population over 16 years of age (542), 69.9% or 379 individuals are in the labor force, with 2.4% or 9 of them unemployed. The age group with the highest labor force participation rate is 20 to 24 years, with 100.0% or 11 individuals in the labor force. Within the labor force, the 55 to 59 years age range has the highest percentage of unemployed individuals, with 14.8% or 4 of them being unemployed.
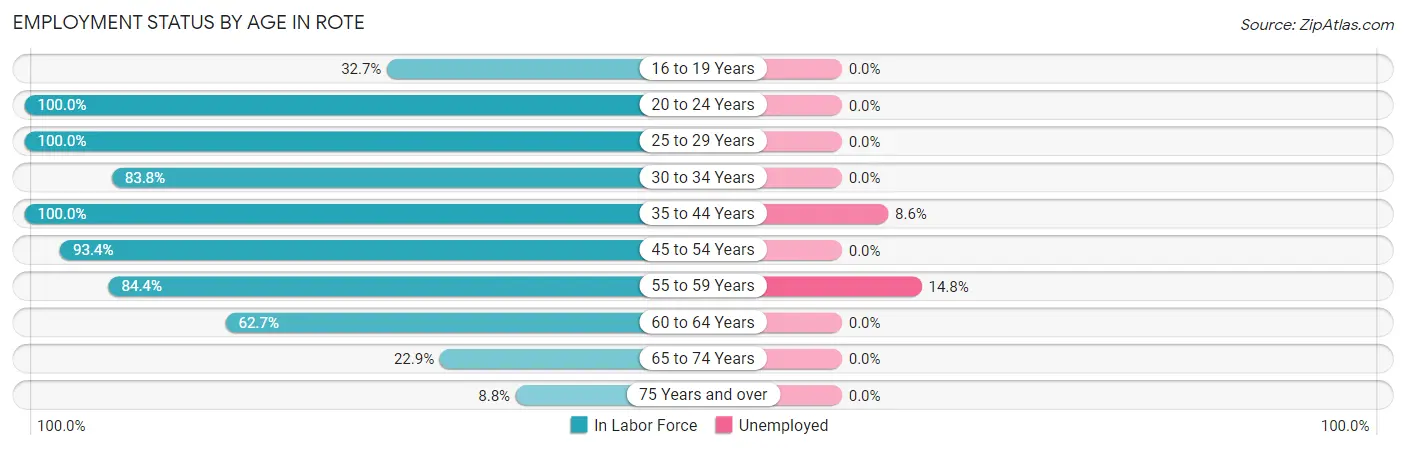
| Age Bracket | In Labor Force | Unemployed |
| 16 to 19 Years | 16 (32.7%) | 0 (0.0%) |
| 20 to 24 Years | 11 (100.0%) | 0 (0.0%) |
| 25 to 29 Years | 43 (100.0%) | 0 (0.0%) |
| 30 to 34 Years | 31 (83.8%) | 0 (0.0%) |
| 35 to 44 Years | 58 (100.0%) | 5 (8.6%) |
| 45 to 54 Years | 128 (93.4%) | 0 (0.0%) |
| 55 to 59 Years | 27 (84.4%) | 4 (14.8%) |
| 60 to 64 Years | 52 (62.7%) | 0 (0.0%) |
| 65 to 74 Years | 8 (22.9%) | 0 (0.0%) |
| 75 Years and over | 5 (8.8%) | 0 (0.0%) |
| Total | 379 (69.9%) | 9 (2.4%) |
Employment Status by Educational Attainment in Rote
According to labor force statistics for Rote, 86.9% of individuals (339) out of the total population between 25 and 64 years of age (390) are in the labor force, with 2.7% or 9 of them being unemployed. The group with the highest labor force participation rate are those with the educational attainment of bachelor's degree or higher, with 100.0% or 46 individuals in the labor force. Within the labor force, individuals with college / associate degree education have the highest percentage of unemployment, with 3.8% or 5 of them being unemployed.
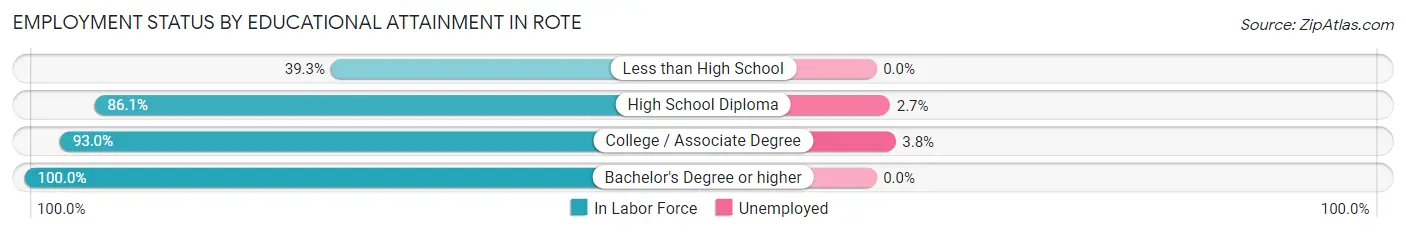
| Educational Attainment | In Labor Force | Unemployed |
| Less than High School | 11 (39.3%) | 0 (0.0%) |
| High School Diploma | 149 (86.1%) | 5 (2.7%) |
| College / Associate Degree | 133 (93.0%) | 5 (3.8%) |
| Bachelor's Degree or higher | 46 (100.0%) | 0 (0.0%) |
| Total | 339 (86.9%) | 11 (2.7%) |
Employment Occupations by Sex in Rote
Management, Business, Science and Arts Occupations
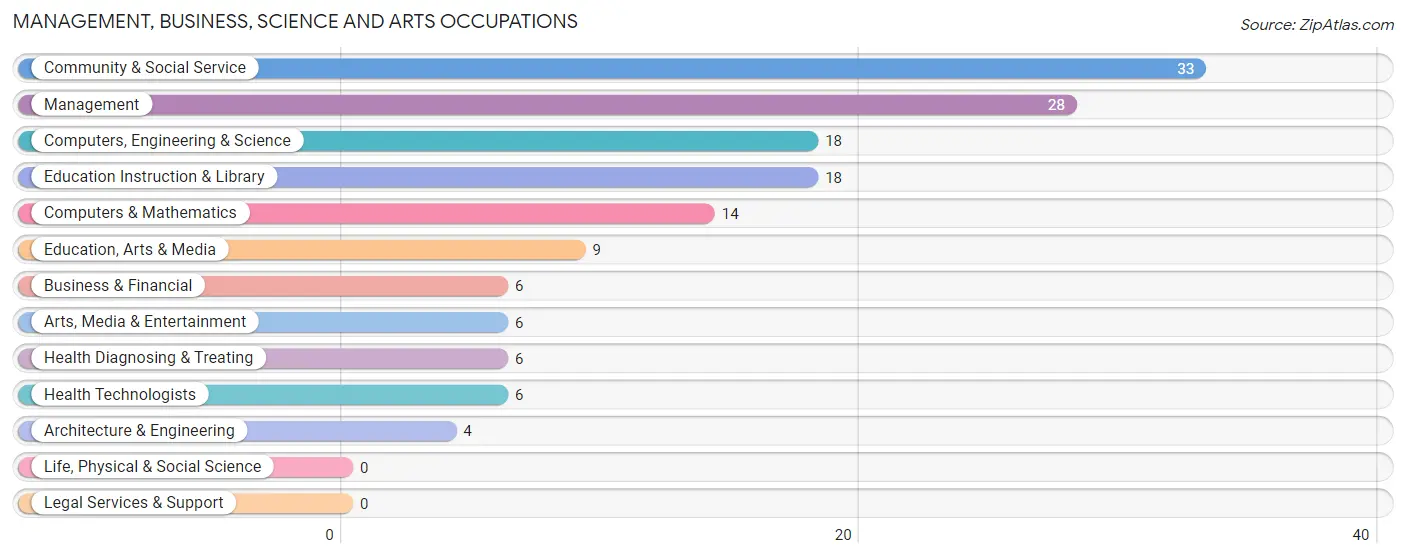
The most common Management, Business, Science and Arts occupations in Rote are Community & Social Service (33 | 8.9%), Management (28 | 7.6%), Computers, Engineering & Science (18 | 4.9%), Education Instruction & Library (18 | 4.9%), and Computers & Mathematics (14 | 3.8%).
Management, Business, Science and Arts Occupations by Sex
Within the Management, Business, Science and Arts occupations in Rote, the most male-oriented occupations are Management (100.0%), Computers, Engineering & Science (100.0%), and Computers & Mathematics (100.0%), while the most female-oriented occupations are Business & Financial (100.0%), Education, Arts & Media (100.0%), and Health Diagnosing & Treating (100.0%).
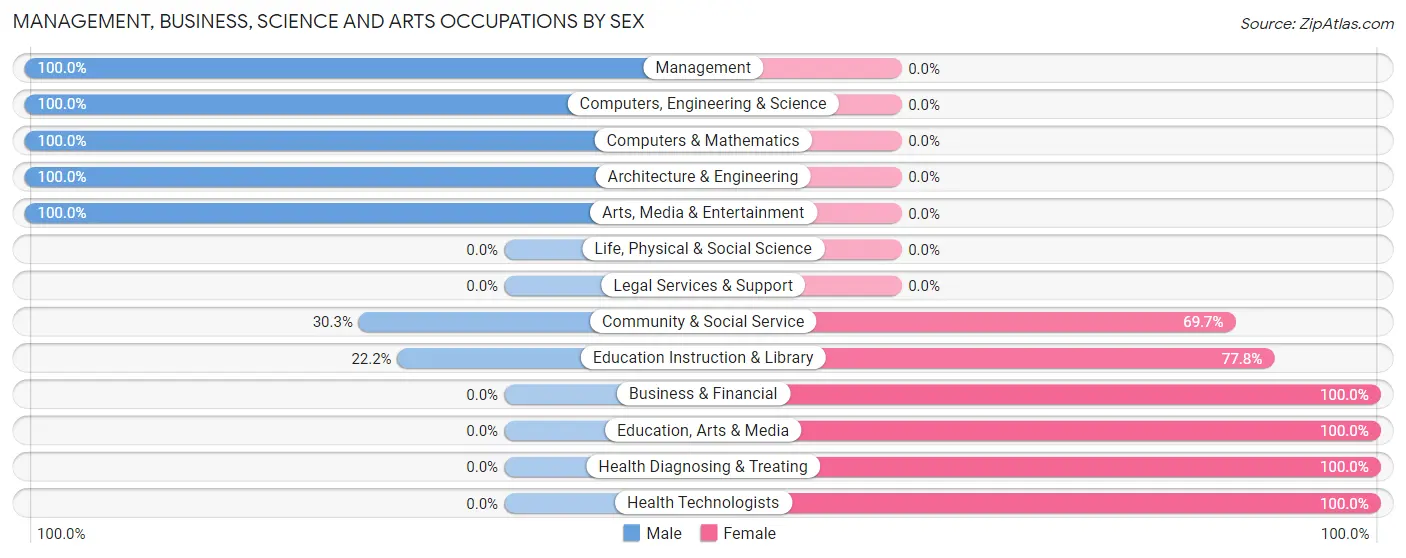
| Occupation | Male | Female |
| Management | 28 (100.0%) | 0 (0.0%) |
| Business & Financial | 0 (0.0%) | 6 (100.0%) |
| Computers, Engineering & Science | 18 (100.0%) | 0 (0.0%) |
| Computers & Mathematics | 14 (100.0%) | 0 (0.0%) |
| Architecture & Engineering | 4 (100.0%) | 0 (0.0%) |
| Life, Physical & Social Science | 0 (0.0%) | 0 (0.0%) |
| Community & Social Service | 10 (30.3%) | 23 (69.7%) |
| Education, Arts & Media | 0 (0.0%) | 9 (100.0%) |
| Legal Services & Support | 0 (0.0%) | 0 (0.0%) |
| Education Instruction & Library | 4 (22.2%) | 14 (77.8%) |
| Arts, Media & Entertainment | 6 (100.0%) | 0 (0.0%) |
| Health Diagnosing & Treating | 0 (0.0%) | 6 (100.0%) |
| Health Technologists | 0 (0.0%) | 6 (100.0%) |
| Total (Category) | 56 (61.5%) | 35 (38.5%) |
| Total (Overall) | 226 (61.1%) | 144 (38.9%) |
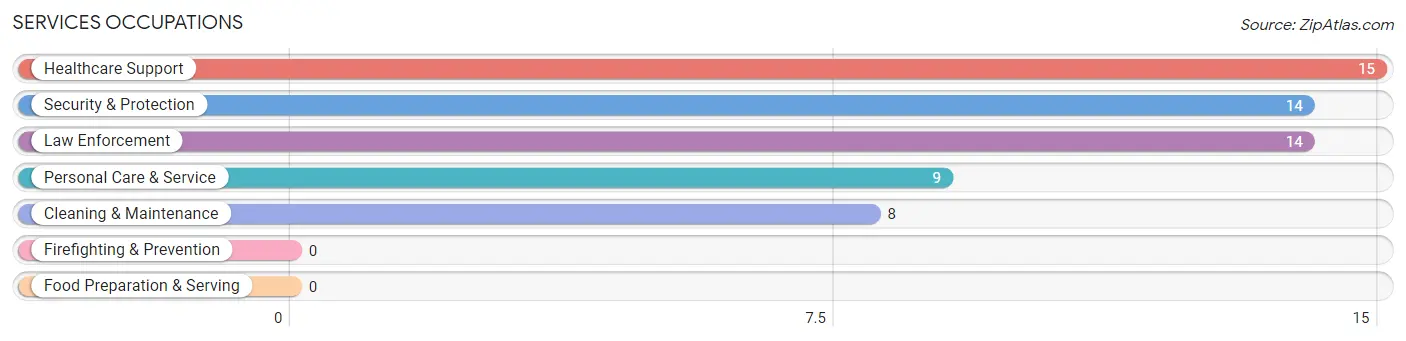
Services Occupations
The most common Services occupations in Rote are Healthcare Support (15 | 4.1%), Security & Protection (14 | 3.8%), Law Enforcement (14 | 3.8%), Personal Care & Service (9 | 2.4%), and Cleaning & Maintenance (8 | 2.2%).
Services Occupations by Sex
Within the Services occupations in Rote, the most male-oriented occupations are Security & Protection (100.0%), Law Enforcement (100.0%), and Cleaning & Maintenance (50.0%), while the most female-oriented occupations are Healthcare Support (100.0%), Personal Care & Service (100.0%), and Cleaning & Maintenance (50.0%).
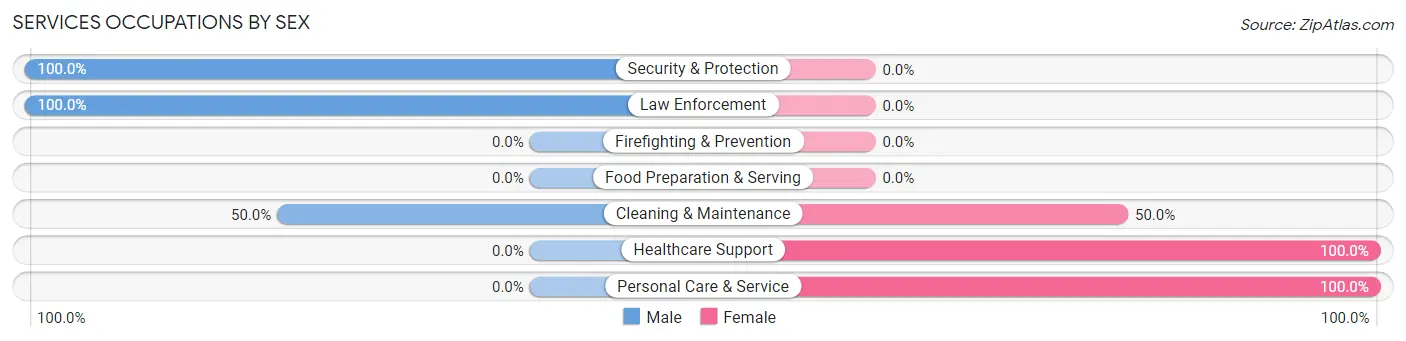
| Occupation | Male | Female |
| Healthcare Support | 0 (0.0%) | 15 (100.0%) |
| Security & Protection | 14 (100.0%) | 0 (0.0%) |
| Firefighting & Prevention | 0 (0.0%) | 0 (0.0%) |
| Law Enforcement | 14 (100.0%) | 0 (0.0%) |
| Food Preparation & Serving | 0 (0.0%) | 0 (0.0%) |
| Cleaning & Maintenance | 4 (50.0%) | 4 (50.0%) |
| Personal Care & Service | 0 (0.0%) | 9 (100.0%) |
| Total (Category) | 18 (39.1%) | 28 (60.9%) |
| Total (Overall) | 226 (61.1%) | 144 (38.9%) |
Sales and Office Occupations
The most common Sales and Office occupations in Rote are Sales & Related (36 | 9.7%), and Office & Administration (31 | 8.4%).
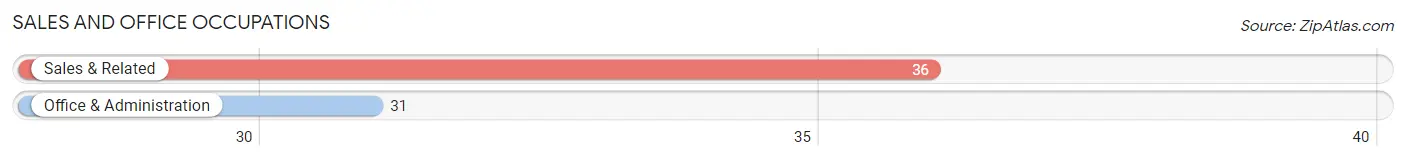
Sales and Office Occupations by Sex
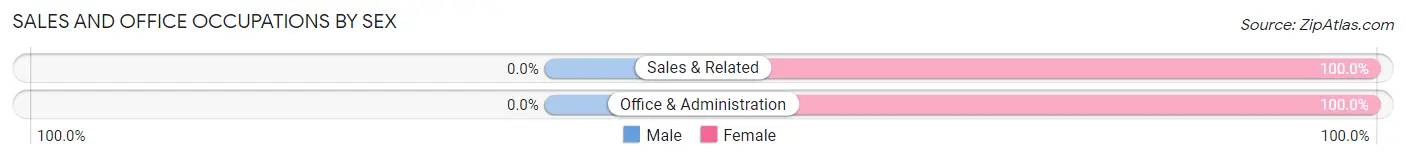
| Occupation | Male | Female |
| Sales & Related | 0 (0.0%) | 36 (100.0%) |
| Office & Administration | 0 (0.0%) | 31 (100.0%) |
| Total (Category) | 0 (0.0%) | 67 (100.0%) |
| Total (Overall) | 226 (61.1%) | 144 (38.9%) |
Natural Resources, Construction and Maintenance Occupations
The most common Natural Resources, Construction and Maintenance occupations in Rote are Construction & Extraction (43 | 11.6%), and Installation, Maintenance & Repair (13 | 3.5%).
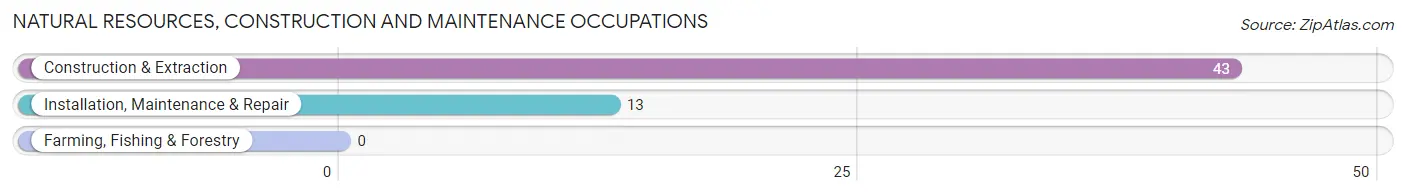
Natural Resources, Construction and Maintenance Occupations by Sex
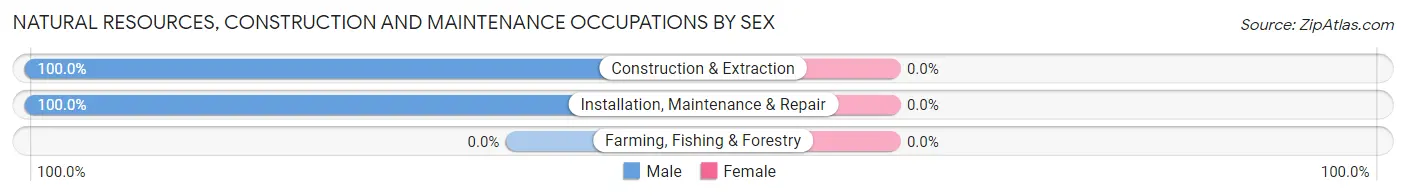
| Occupation | Male | Female |
| Farming, Fishing & Forestry | 0 (0.0%) | 0 (0.0%) |
| Construction & Extraction | 43 (100.0%) | 0 (0.0%) |
| Installation, Maintenance & Repair | 13 (100.0%) | 0 (0.0%) |
| Total (Category) | 56 (100.0%) | 0 (0.0%) |
| Total (Overall) | 226 (61.1%) | 144 (38.9%) |
Production, Transportation and Moving Occupations
The most common Production, Transportation and Moving occupations in Rote are Production (52 | 14.1%), Material Moving (46 | 12.4%), and Transportation (12 | 3.2%).
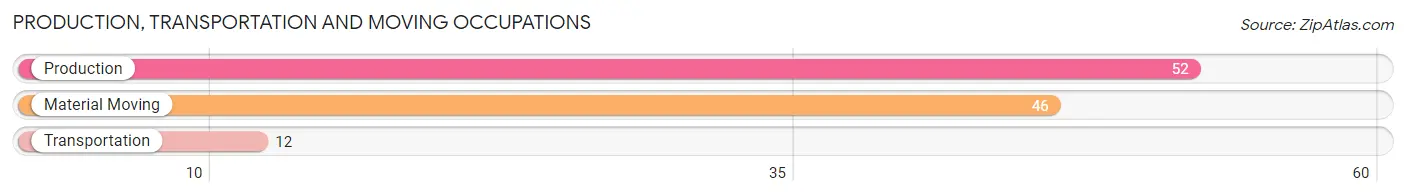
Production, Transportation and Moving Occupations by Sex

| Occupation | Male | Female |
| Production | 52 (100.0%) | 0 (0.0%) |
| Transportation | 12 (100.0%) | 0 (0.0%) |
| Material Moving | 32 (69.6%) | 14 (30.4%) |
| Total (Category) | 96 (87.3%) | 14 (12.7%) |
| Total (Overall) | 226 (61.1%) | 144 (38.9%) |
Employment Industries by Sex in Rote
Employment Industries in Rote
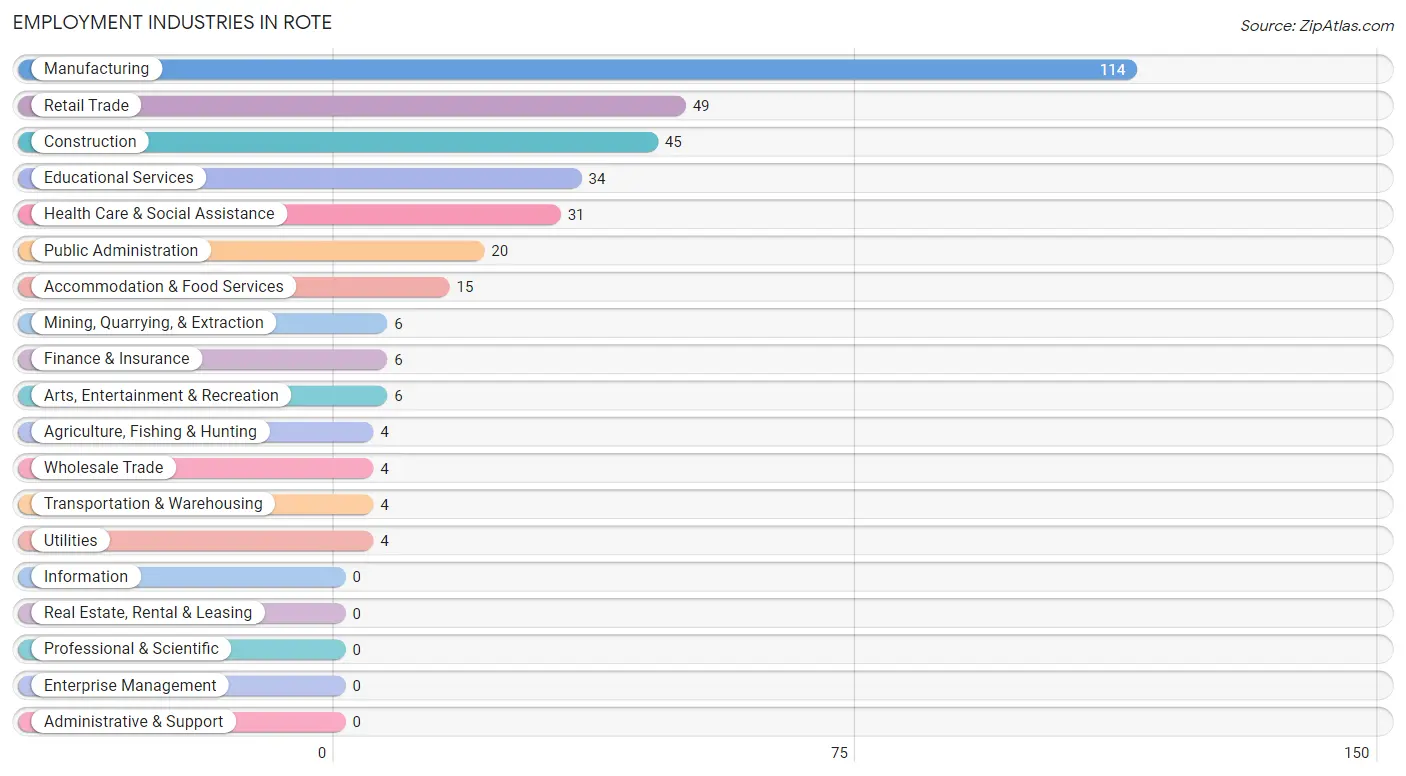
The major employment industries in Rote include Manufacturing (114 | 30.8%), Retail Trade (49 | 13.2%), Construction (45 | 12.2%), Educational Services (34 | 9.2%), and Health Care & Social Assistance (31 | 8.4%).
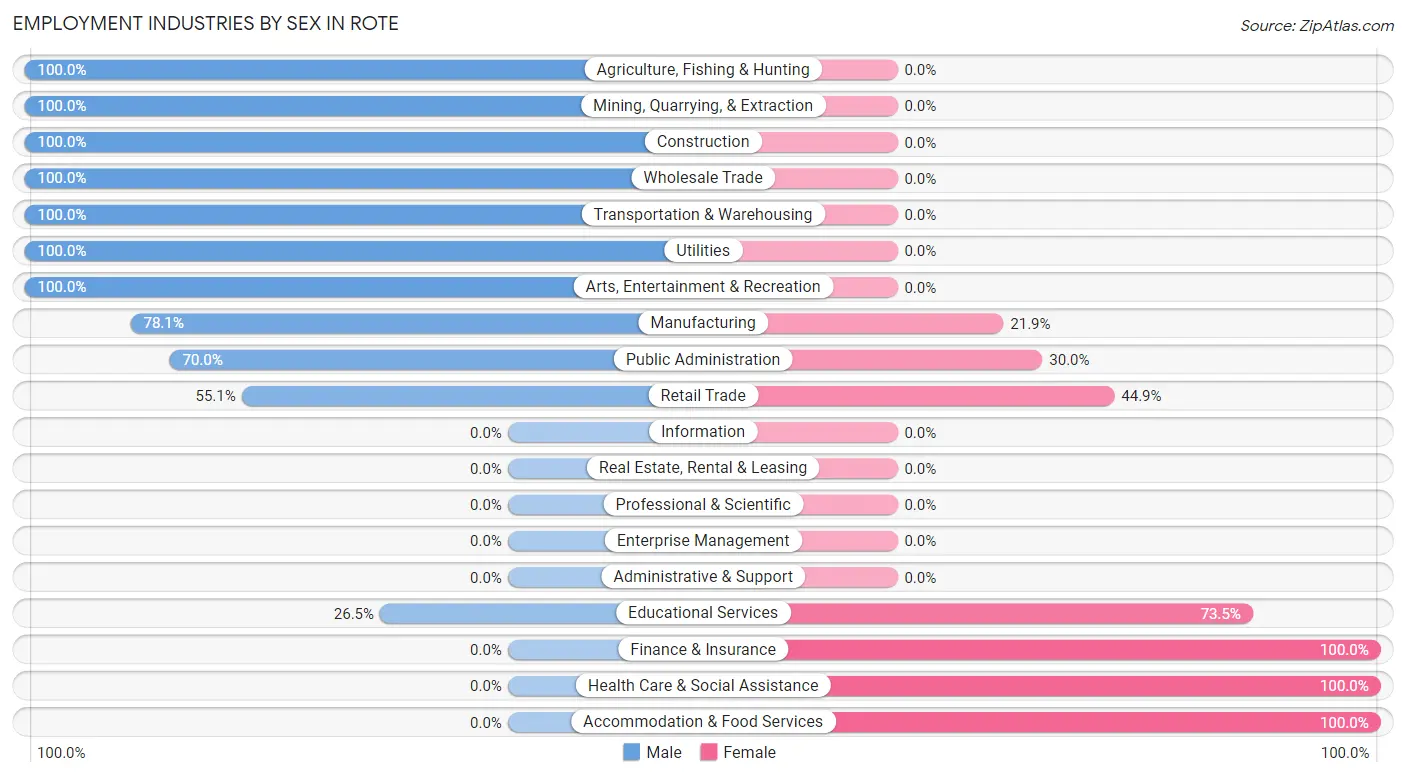
Employment Industries by Sex in Rote
The Rote industries that see more men than women are Agriculture, Fishing & Hunting (100.0%), Mining, Quarrying, & Extraction (100.0%), and Construction (100.0%), whereas the industries that tend to have a higher number of women are Finance & Insurance (100.0%), Health Care & Social Assistance (100.0%), and Accommodation & Food Services (100.0%).
| Industry | Male | Female |
| Agriculture, Fishing & Hunting | 4 (100.0%) | 0 (0.0%) |
| Mining, Quarrying, & Extraction | 6 (100.0%) | 0 (0.0%) |
| Construction | 45 (100.0%) | 0 (0.0%) |
| Manufacturing | 89 (78.1%) | 25 (21.9%) |
| Wholesale Trade | 4 (100.0%) | 0 (0.0%) |
| Retail Trade | 27 (55.1%) | 22 (44.9%) |
| Transportation & Warehousing | 4 (100.0%) | 0 (0.0%) |
| Utilities | 4 (100.0%) | 0 (0.0%) |
| Information | 0 (0.0%) | 0 (0.0%) |
| Finance & Insurance | 0 (0.0%) | 6 (100.0%) |
| Real Estate, Rental & Leasing | 0 (0.0%) | 0 (0.0%) |
| Professional & Scientific | 0 (0.0%) | 0 (0.0%) |
| Enterprise Management | 0 (0.0%) | 0 (0.0%) |
| Administrative & Support | 0 (0.0%) | 0 (0.0%) |
| Educational Services | 9 (26.5%) | 25 (73.5%) |
| Health Care & Social Assistance | 0 (0.0%) | 31 (100.0%) |
| Arts, Entertainment & Recreation | 6 (100.0%) | 0 (0.0%) |
| Accommodation & Food Services | 0 (0.0%) | 15 (100.0%) |
| Public Administration | 14 (70.0%) | 6 (30.0%) |
| Total | 226 (61.1%) | 144 (38.9%) |
Education in Rote
School Enrollment in Rote
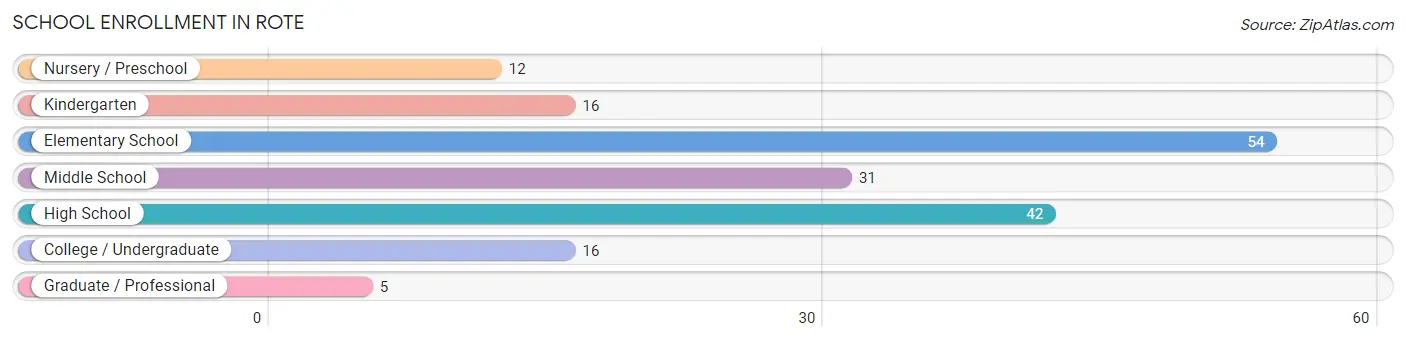
The most common levels of schooling among the 176 students in Rote are elementary school (54 | 30.7%), high school (42 | 23.9%), and middle school (31 | 17.6%).
| School Level | # Students | % Students |
| Nursery / Preschool | 12 | 6.8% |
| Kindergarten | 16 | 9.1% |
| Elementary School | 54 | 30.7% |
| Middle School | 31 | 17.6% |
| High School | 42 | 23.9% |
| College / Undergraduate | 16 | 9.1% |
| Graduate / Professional | 5 | 2.8% |
| Total | 176 | 100.0% |
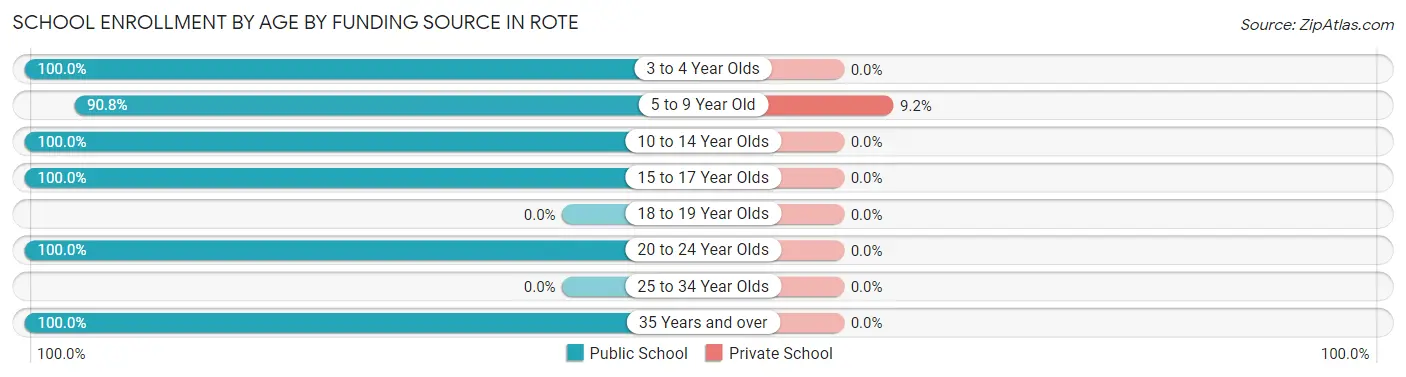
School Enrollment by Age by Funding Source in Rote
Out of a total of 176 students who are enrolled in schools in Rote, 7 (4.0%) attend a private institution, while the remaining 169 (96.0%) are enrolled in public schools. The age group of 5 to 9 year old has the highest likelihood of being enrolled in private schools, with 7 (9.2% in the age bracket) enrolled. Conversely, the age group of 3 to 4 year olds has the lowest likelihood of being enrolled in a private school, with 6 (100.0% in the age bracket) attending a public institution.
| Age Bracket | Public School | Private School |
| 3 to 4 Year Olds | 6 (100.0%) | 0 (0.0%) |
| 5 to 9 Year Old | 69 (90.8%) | 7 (9.2%) |
| 10 to 14 Year Olds | 36 (100.0%) | 0 (0.0%) |
| 15 to 17 Year Olds | 37 (100.0%) | 0 (0.0%) |
| 18 to 19 Year Olds | 0 (0.0%) | 0 (0.0%) |
| 20 to 24 Year Olds | 11 (100.0%) | 0 (0.0%) |
| 25 to 34 Year Olds | 0 (0.0%) | 0 (0.0%) |
| 35 Years and over | 10 (100.0%) | 0 (0.0%) |
| Total | 169 (96.0%) | 7 (4.0%) |
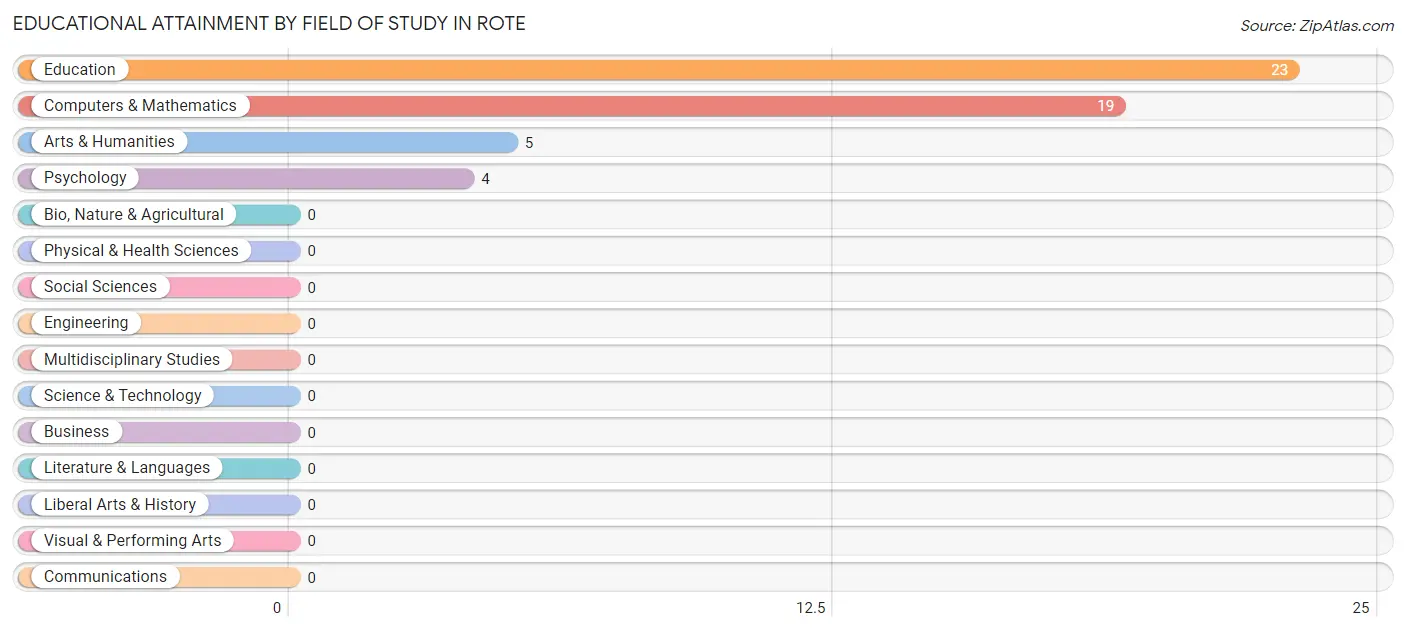
Educational Attainment by Field of Study in Rote
Education (23 | 45.1%), computers & mathematics (19 | 37.2%), arts & humanities (5 | 9.8%), and psychology (4 | 7.8%) are the most common fields of study among 51 individuals in Rote who have obtained a bachelor's degree or higher.
| Field of Study | # Graduates | % Graduates |
| Computers & Mathematics | 19 | 37.2% |
| Bio, Nature & Agricultural | 0 | 0.0% |
| Physical & Health Sciences | 0 | 0.0% |
| Psychology | 4 | 7.8% |
| Social Sciences | 0 | 0.0% |
| Engineering | 0 | 0.0% |
| Multidisciplinary Studies | 0 | 0.0% |
| Science & Technology | 0 | 0.0% |
| Business | 0 | 0.0% |
| Education | 23 | 45.1% |
| Literature & Languages | 0 | 0.0% |
| Liberal Arts & History | 0 | 0.0% |
| Visual & Performing Arts | 0 | 0.0% |
| Communications | 0 | 0.0% |
| Arts & Humanities | 5 | 9.8% |
| Total | 51 | 100.0% |
Transportation & Commute in Rote
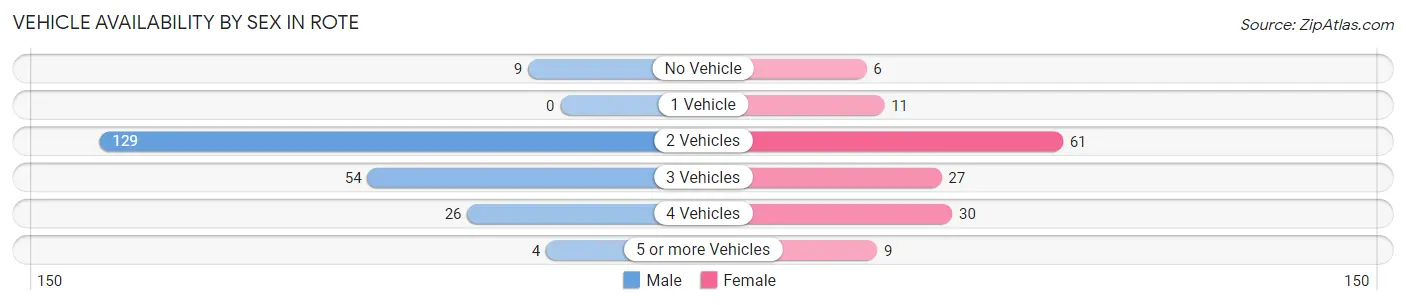
Vehicle Availability by Sex in Rote
The most prevalent vehicle ownership categories in Rote are males with 2 vehicles (129, accounting for 58.1%) and females with 2 vehicles (61, making up 89.6%).
| Vehicles Available | Male | Female |
| No Vehicle | 9 (4.1%) | 6 (4.2%) |
| 1 Vehicle | 0 (0.0%) | 11 (7.6%) |
| 2 Vehicles | 129 (58.1%) | 61 (42.4%) |
| 3 Vehicles | 54 (24.3%) | 27 (18.8%) |
| 4 Vehicles | 26 (11.7%) | 30 (20.8%) |
| 5 or more Vehicles | 4 (1.8%) | 9 (6.2%) |
| Total | 222 (100.0%) | 144 (100.0%) |
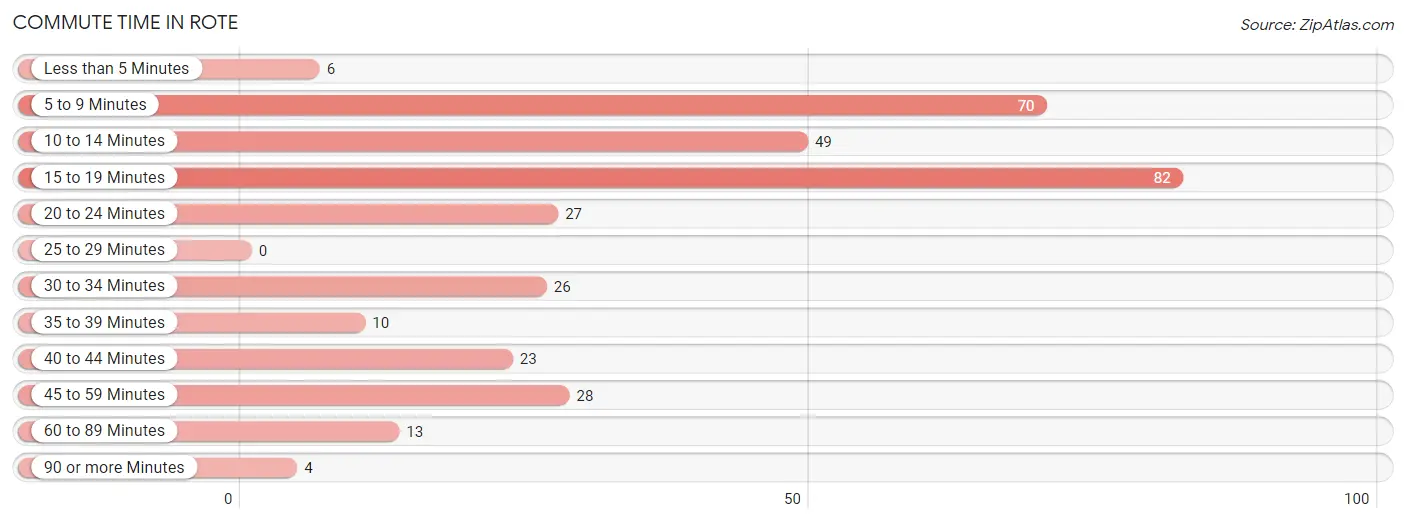
Commute Time in Rote
The most frequently occuring commute durations in Rote are 15 to 19 minutes (82 commuters, 24.3%), 5 to 9 minutes (70 commuters, 20.7%), and 10 to 14 minutes (49 commuters, 14.5%).
| Commute Time | # Commuters | % Commuters |
| Less than 5 Minutes | 6 | 1.8% |
| 5 to 9 Minutes | 70 | 20.7% |
| 10 to 14 Minutes | 49 | 14.5% |
| 15 to 19 Minutes | 82 | 24.3% |
| 20 to 24 Minutes | 27 | 8.0% |
| 25 to 29 Minutes | 0 | 0.0% |
| 30 to 34 Minutes | 26 | 7.7% |
| 35 to 39 Minutes | 10 | 3.0% |
| 40 to 44 Minutes | 23 | 6.8% |
| 45 to 59 Minutes | 28 | 8.3% |
| 60 to 89 Minutes | 13 | 3.8% |
| 90 or more Minutes | 4 | 1.2% |
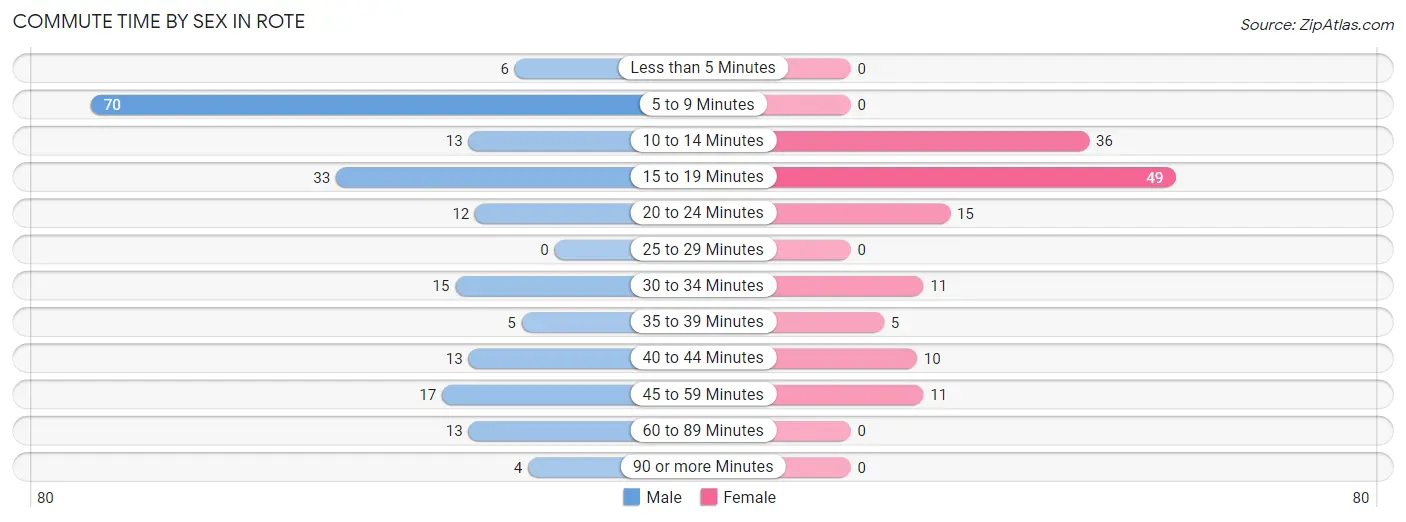
Commute Time by Sex in Rote
The most common commute times in Rote are 5 to 9 minutes (70 commuters, 34.8%) for males and 15 to 19 minutes (49 commuters, 35.8%) for females.
| Commute Time | Male | Female |
| Less than 5 Minutes | 6 (3.0%) | 0 (0.0%) |
| 5 to 9 Minutes | 70 (34.8%) | 0 (0.0%) |
| 10 to 14 Minutes | 13 (6.5%) | 36 (26.3%) |
| 15 to 19 Minutes | 33 (16.4%) | 49 (35.8%) |
| 20 to 24 Minutes | 12 (6.0%) | 15 (11.0%) |
| 25 to 29 Minutes | 0 (0.0%) | 0 (0.0%) |
| 30 to 34 Minutes | 15 (7.5%) | 11 (8.0%) |
| 35 to 39 Minutes | 5 (2.5%) | 5 (3.6%) |
| 40 to 44 Minutes | 13 (6.5%) | 10 (7.3%) |
| 45 to 59 Minutes | 17 (8.5%) | 11 (8.0%) |
| 60 to 89 Minutes | 13 (6.5%) | 0 (0.0%) |
| 90 or more Minutes | 4 (2.0%) | 0 (0.0%) |
Time of Departure to Work by Sex in Rote
The most frequent times of departure to work in Rote are 6:30 AM to 6:59 AM (71, 35.3%) for males and 7:30 AM to 7:59 AM (37, 27.0%) for females.
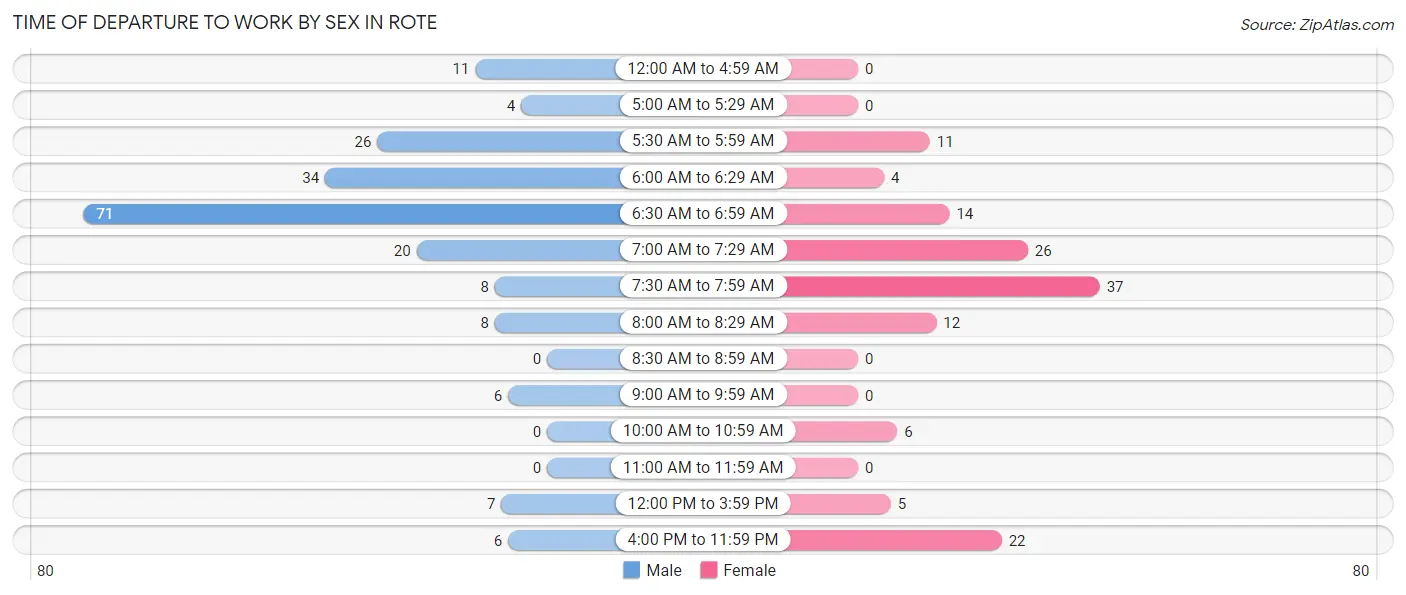
| Time of Departure | Male | Female |
| 12:00 AM to 4:59 AM | 11 (5.5%) | 0 (0.0%) |
| 5:00 AM to 5:29 AM | 4 (2.0%) | 0 (0.0%) |
| 5:30 AM to 5:59 AM | 26 (12.9%) | 11 (8.0%) |
| 6:00 AM to 6:29 AM | 34 (16.9%) | 4 (2.9%) |
| 6:30 AM to 6:59 AM | 71 (35.3%) | 14 (10.2%) |
| 7:00 AM to 7:29 AM | 20 (10.0%) | 26 (19.0%) |
| 7:30 AM to 7:59 AM | 8 (4.0%) | 37 (27.0%) |
| 8:00 AM to 8:29 AM | 8 (4.0%) | 12 (8.8%) |
| 8:30 AM to 8:59 AM | 0 (0.0%) | 0 (0.0%) |
| 9:00 AM to 9:59 AM | 6 (3.0%) | 0 (0.0%) |
| 10:00 AM to 10:59 AM | 0 (0.0%) | 6 (4.4%) |
| 11:00 AM to 11:59 AM | 0 (0.0%) | 0 (0.0%) |
| 12:00 PM to 3:59 PM | 7 (3.5%) | 5 (3.6%) |
| 4:00 PM to 11:59 PM | 6 (3.0%) | 22 (16.1%) |
| Total | 201 (100.0%) | 137 (100.0%) |
Housing Occupancy in Rote
Occupancy by Ownership in Rote
Of the total 285 dwellings in Rote, owner-occupied units account for 270 (94.7%), while renter-occupied units make up 15 (5.3%).
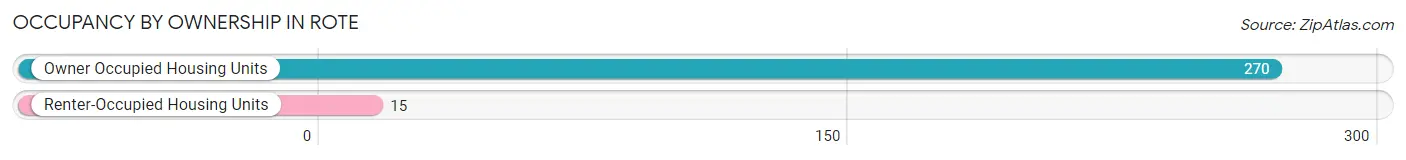
| Occupancy | # Housing Units | % Housing Units |
| Owner Occupied Housing Units | 270 | 94.7% |
| Renter-Occupied Housing Units | 15 | 5.3% |
| Total Occupied Housing Units | 285 | 100.0% |
Occupancy by Household Size in Rote
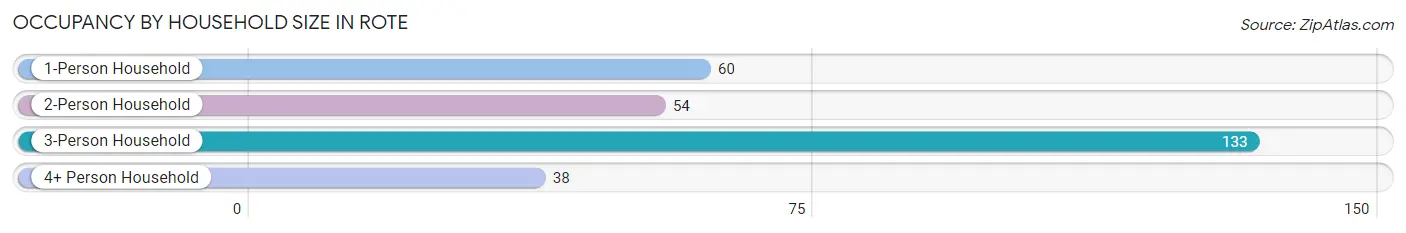
| Household Size | # Housing Units | % Housing Units |
| 1-Person Household | 60 | 21.0% |
| 2-Person Household | 54 | 19.0% |
| 3-Person Household | 133 | 46.7% |
| 4+ Person Household | 38 | 13.3% |
| Total Housing Units | 285 | 100.0% |
Occupancy by Ownership by Household Size in Rote
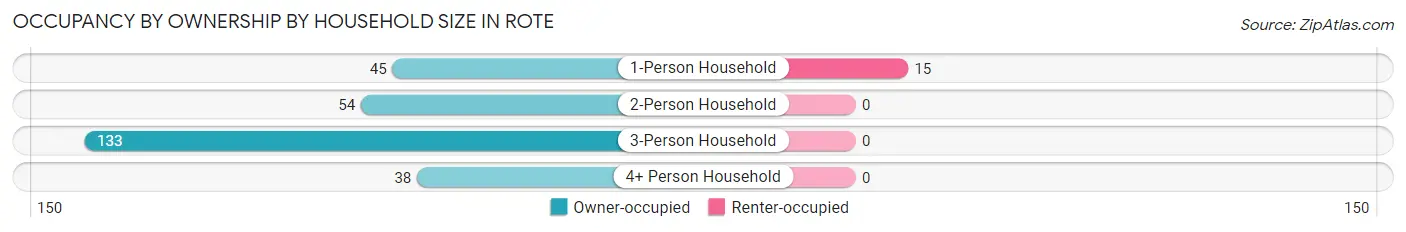
| Household Size | Owner-occupied | Renter-occupied |
| 1-Person Household | 45 (75.0%) | 15 (25.0%) |
| 2-Person Household | 54 (100.0%) | 0 (0.0%) |
| 3-Person Household | 133 (100.0%) | 0 (0.0%) |
| 4+ Person Household | 38 (100.0%) | 0 (0.0%) |
| Total Housing Units | 270 (94.7%) | 15 (5.3%) |
Occupancy by Educational Attainment in Rote
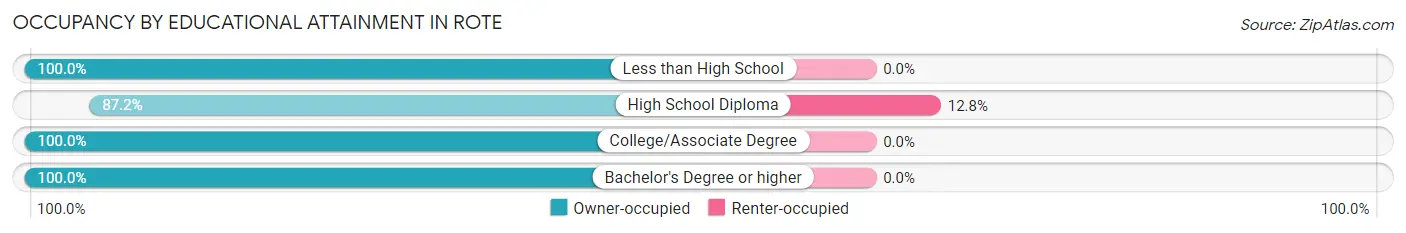
| Household Size | Owner-occupied | Renter-occupied |
| Less than High School | 21 (100.0%) | 0 (0.0%) |
| High School Diploma | 102 (87.2%) | 15 (12.8%) |
| College/Associate Degree | 128 (100.0%) | 0 (0.0%) |
| Bachelor's Degree or higher | 19 (100.0%) | 0 (0.0%) |
Occupancy by Age of Householder in Rote
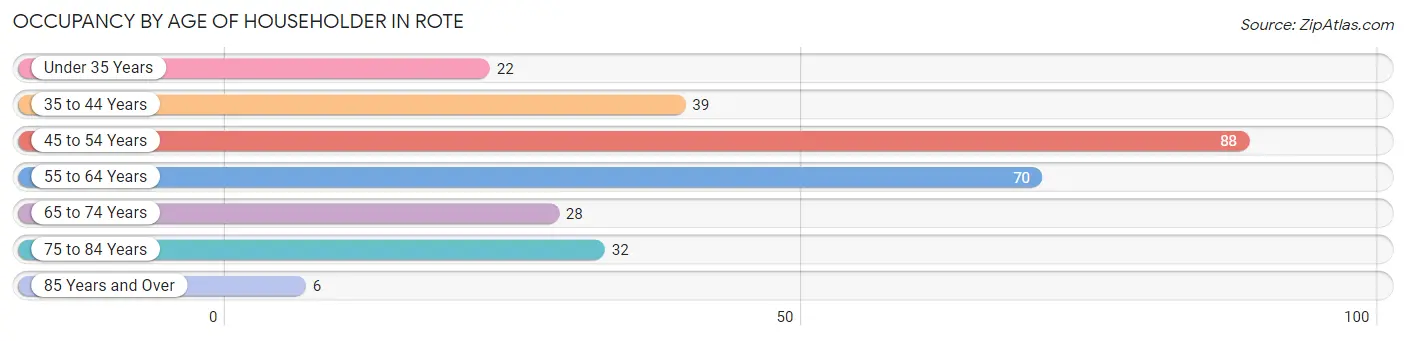
| Age Bracket | # Households | % Households |
| Under 35 Years | 22 | 7.7% |
| 35 to 44 Years | 39 | 13.7% |
| 45 to 54 Years | 88 | 30.9% |
| 55 to 64 Years | 70 | 24.6% |
| 65 to 74 Years | 28 | 9.8% |
| 75 to 84 Years | 32 | 11.2% |
| 85 Years and Over | 6 | 2.1% |
| Total | 285 | 100.0% |
Housing Finances in Rote
Median Income by Occupancy in Rote
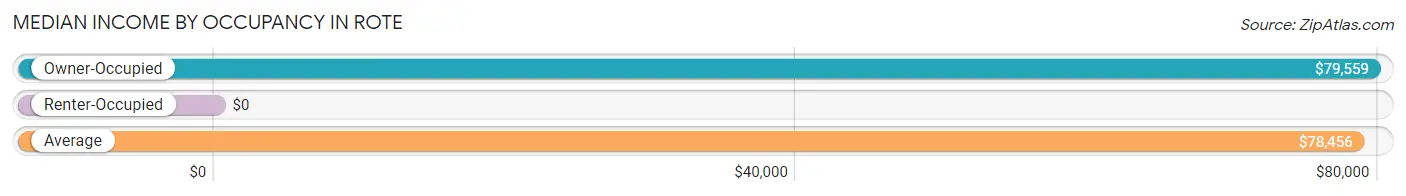
| Occupancy Type | # Households | Median Income |
| Owner-Occupied | 270 (94.7%) | $79,559 |
| Renter-Occupied | 15 (5.3%) | $0 |
| Average | 285 (100.0%) | $78,456 |
Occupancy by Householder Income Bracket in Rote
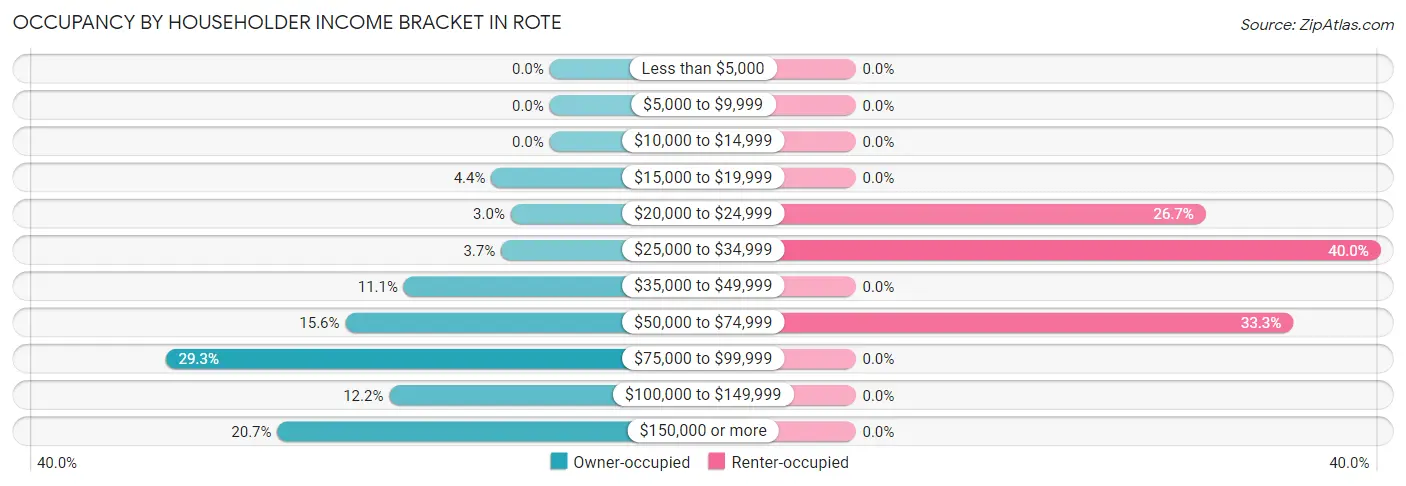
| Income Bracket | Owner-occupied | Renter-occupied |
| Less than $5,000 | 0 (0.0%) | 0 (0.0%) |
| $5,000 to $9,999 | 0 (0.0%) | 0 (0.0%) |
| $10,000 to $14,999 | 0 (0.0%) | 0 (0.0%) |
| $15,000 to $19,999 | 12 (4.4%) | 0 (0.0%) |
| $20,000 to $24,999 | 8 (3.0%) | 4 (26.7%) |
| $25,000 to $34,999 | 10 (3.7%) | 6 (40.0%) |
| $35,000 to $49,999 | 30 (11.1%) | 0 (0.0%) |
| $50,000 to $74,999 | 42 (15.6%) | 5 (33.3%) |
| $75,000 to $99,999 | 79 (29.3%) | 0 (0.0%) |
| $100,000 to $149,999 | 33 (12.2%) | 0 (0.0%) |
| $150,000 or more | 56 (20.7%) | 0 (0.0%) |
| Total | 270 (100.0%) | 15 (100.0%) |
Monthly Housing Cost Tiers in Rote
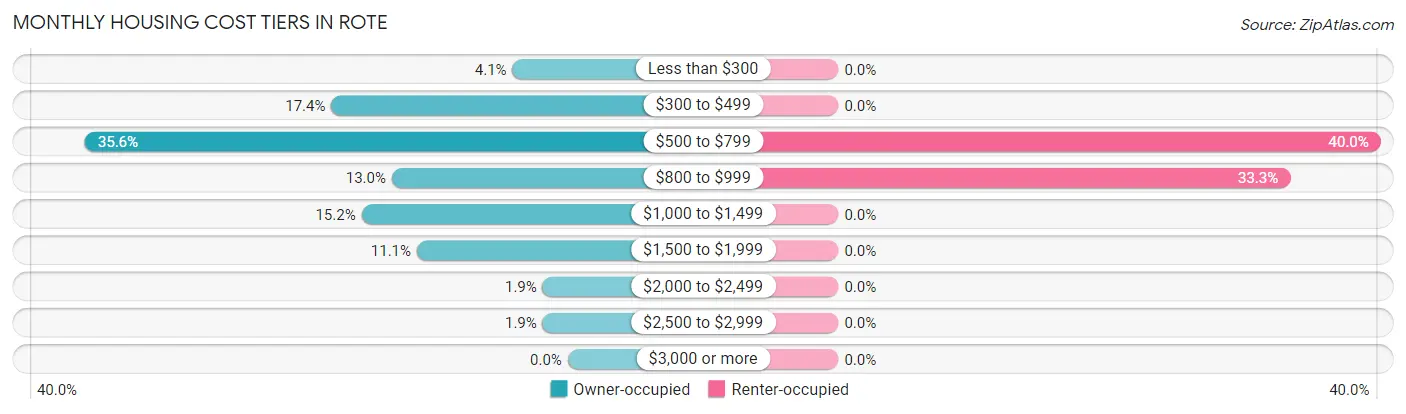
| Monthly Cost | Owner-occupied | Renter-occupied |
| Less than $300 | 11 (4.1%) | 0 (0.0%) |
| $300 to $499 | 47 (17.4%) | 0 (0.0%) |
| $500 to $799 | 96 (35.6%) | 6 (40.0%) |
| $800 to $999 | 35 (13.0%) | 5 (33.3%) |
| $1,000 to $1,499 | 41 (15.2%) | 0 (0.0%) |
| $1,500 to $1,999 | 30 (11.1%) | 0 (0.0%) |
| $2,000 to $2,499 | 5 (1.8%) | 0 (0.0%) |
| $2,500 to $2,999 | 5 (1.8%) | 0 (0.0%) |
| $3,000 or more | 0 (0.0%) | 0 (0.0%) |
| Total | 270 (100.0%) | 15 (100.0%) |
Physical Housing Characteristics in Rote
Housing Structures in Rote
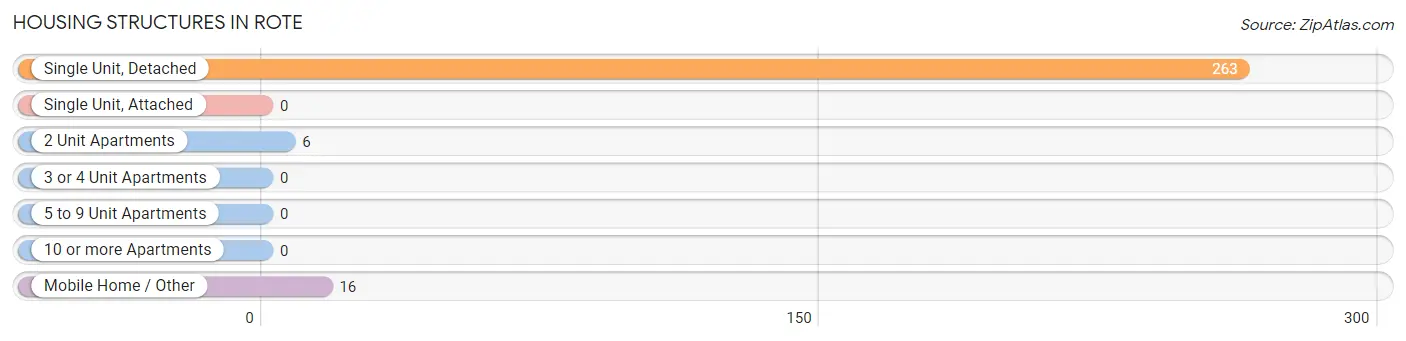
| Structure Type | # Housing Units | % Housing Units |
| Single Unit, Detached | 263 | 92.3% |
| Single Unit, Attached | 0 | 0.0% |
| 2 Unit Apartments | 6 | 2.1% |
| 3 or 4 Unit Apartments | 0 | 0.0% |
| 5 to 9 Unit Apartments | 0 | 0.0% |
| 10 or more Apartments | 0 | 0.0% |
| Mobile Home / Other | 16 | 5.6% |
| Total | 285 | 100.0% |
Housing Structures by Occupancy in Rote
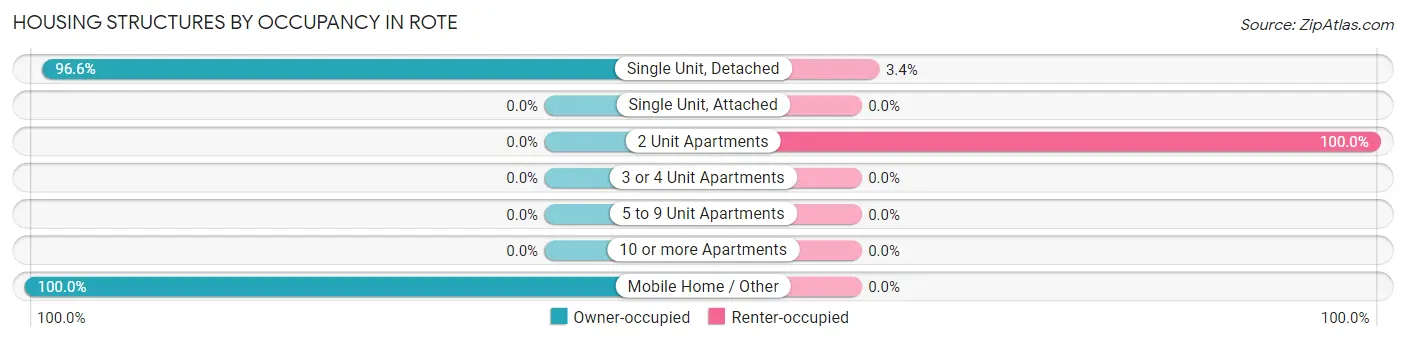
| Structure Type | Owner-occupied | Renter-occupied |
| Single Unit, Detached | 254 (96.6%) | 9 (3.4%) |
| Single Unit, Attached | 0 (0.0%) | 0 (0.0%) |
| 2 Unit Apartments | 0 (0.0%) | 6 (100.0%) |
| 3 or 4 Unit Apartments | 0 (0.0%) | 0 (0.0%) |
| 5 to 9 Unit Apartments | 0 (0.0%) | 0 (0.0%) |
| 10 or more Apartments | 0 (0.0%) | 0 (0.0%) |
| Mobile Home / Other | 16 (100.0%) | 0 (0.0%) |
| Total | 270 (94.7%) | 15 (5.3%) |
Housing Structures by Number of Rooms in Rote
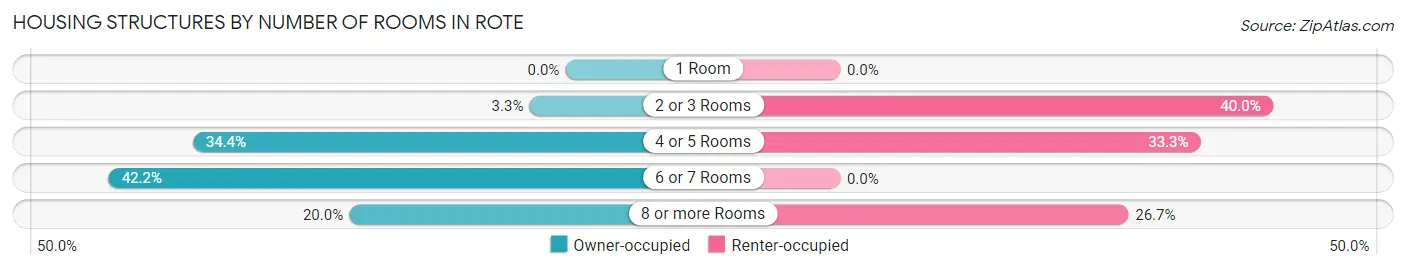
| Number of Rooms | Owner-occupied | Renter-occupied |
| 1 Room | 0 (0.0%) | 0 (0.0%) |
| 2 or 3 Rooms | 9 (3.3%) | 6 (40.0%) |
| 4 or 5 Rooms | 93 (34.4%) | 5 (33.3%) |
| 6 or 7 Rooms | 114 (42.2%) | 0 (0.0%) |
| 8 or more Rooms | 54 (20.0%) | 4 (26.7%) |
| Total | 270 (100.0%) | 15 (100.0%) |
Housing Structure by Heating Type in Rote
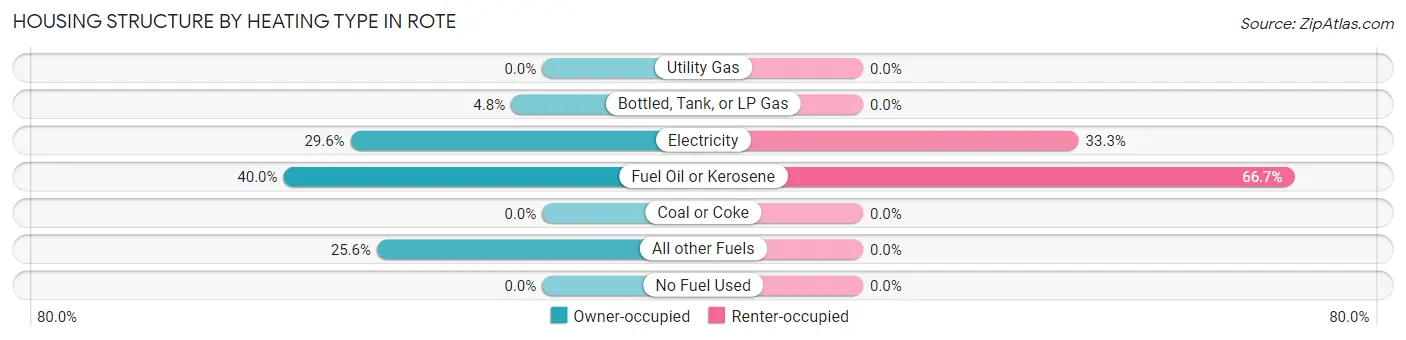
| Heating Type | Owner-occupied | Renter-occupied |
| Utility Gas | 0 (0.0%) | 0 (0.0%) |
| Bottled, Tank, or LP Gas | 13 (4.8%) | 0 (0.0%) |
| Electricity | 80 (29.6%) | 5 (33.3%) |
| Fuel Oil or Kerosene | 108 (40.0%) | 10 (66.7%) |
| Coal or Coke | 0 (0.0%) | 0 (0.0%) |
| All other Fuels | 69 (25.6%) | 0 (0.0%) |
| No Fuel Used | 0 (0.0%) | 0 (0.0%) |
| Total | 270 (100.0%) | 15 (100.0%) |
Household Vehicle Usage in Rote
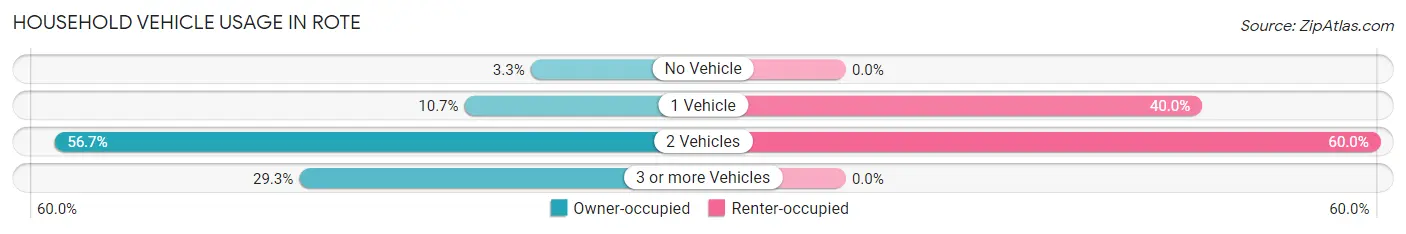
| Vehicles per Household | Owner-occupied | Renter-occupied |
| No Vehicle | 9 (3.3%) | 0 (0.0%) |
| 1 Vehicle | 29 (10.7%) | 6 (40.0%) |
| 2 Vehicles | 153 (56.7%) | 9 (60.0%) |
| 3 or more Vehicles | 79 (29.3%) | 0 (0.0%) |
| Total | 270 (100.0%) | 15 (100.0%) |
Real Estate & Mortgages in Rote
Real Estate and Mortgage Overview in Rote
| Characteristic | Without Mortgage | With Mortgage |
| Housing Units | 107 | 163 |
| Median Property Value | $155,600 | $208,800 |
| Median Household Income | $77,868 | $51 |
| Monthly Housing Costs | $490 | $0 |
| Real Estate Taxes | $2,029 | $0 |
Property Value by Mortgage Status in Rote
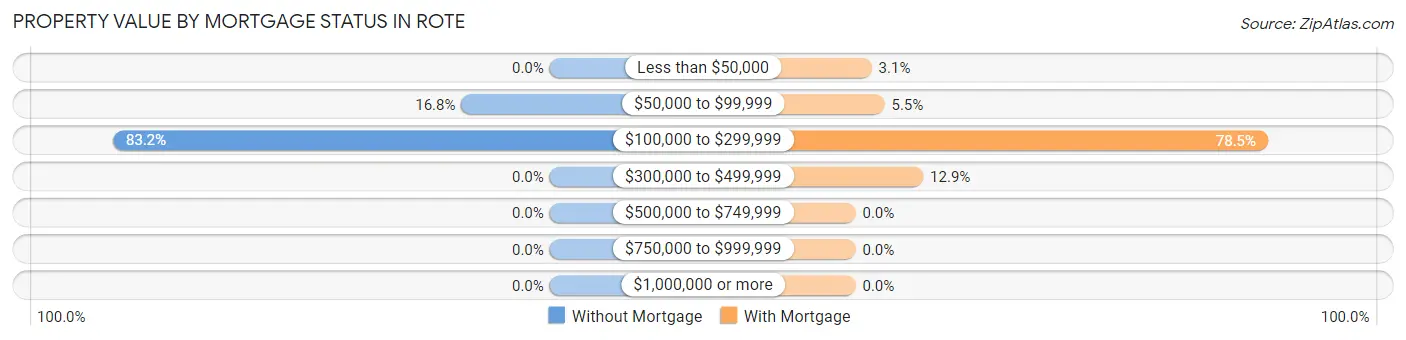
| Property Value | Without Mortgage | With Mortgage |
| Less than $50,000 | 0 (0.0%) | 5 (3.1%) |
| $50,000 to $99,999 | 18 (16.8%) | 9 (5.5%) |
| $100,000 to $299,999 | 89 (83.2%) | 128 (78.5%) |
| $300,000 to $499,999 | 0 (0.0%) | 21 (12.9%) |
| $500,000 to $749,999 | 0 (0.0%) | 0 (0.0%) |
| $750,000 to $999,999 | 0 (0.0%) | 0 (0.0%) |
| $1,000,000 or more | 0 (0.0%) | 0 (0.0%) |
| Total | 107 (100.0%) | 163 (100.0%) |
Household Income by Mortgage Status in Rote
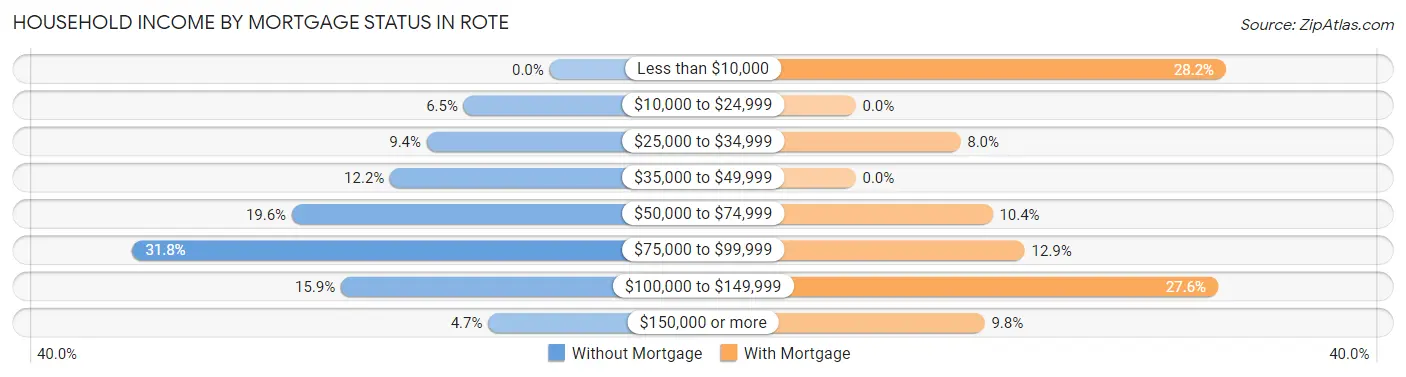
| Household Income | Without Mortgage | With Mortgage |
| Less than $10,000 | 0 (0.0%) | 46 (28.2%) |
| $10,000 to $24,999 | 7 (6.5%) | 0 (0.0%) |
| $25,000 to $34,999 | 10 (9.3%) | 13 (8.0%) |
| $35,000 to $49,999 | 13 (12.1%) | 0 (0.0%) |
| $50,000 to $74,999 | 21 (19.6%) | 17 (10.4%) |
| $75,000 to $99,999 | 34 (31.8%) | 21 (12.9%) |
| $100,000 to $149,999 | 17 (15.9%) | 45 (27.6%) |
| $150,000 or more | 5 (4.7%) | 16 (9.8%) |
| Total | 107 (100.0%) | 163 (100.0%) |
Property Value to Household Income Ratio in Rote
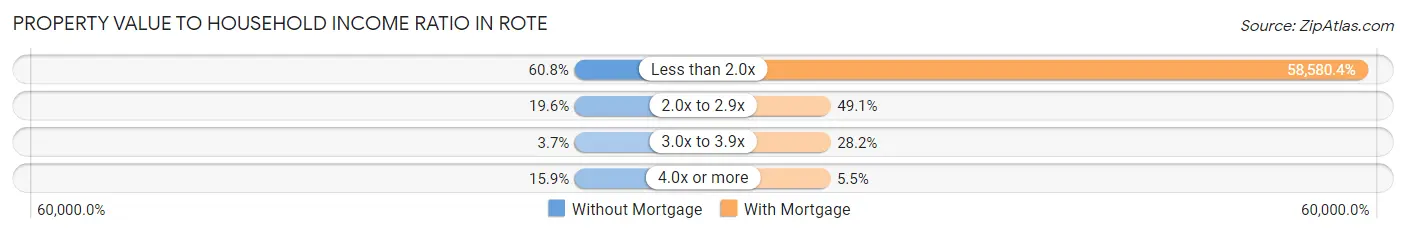
| Value-to-Income Ratio | Without Mortgage | With Mortgage |
| Less than 2.0x | 65 (60.8%) | 95,486 (58,580.4%) |
| 2.0x to 2.9x | 21 (19.6%) | 80 (49.1%) |
| 3.0x to 3.9x | 4 (3.7%) | 46 (28.2%) |
| 4.0x or more | 17 (15.9%) | 9 (5.5%) |
| Total | 107 (100.0%) | 163 (100.0%) |
Real Estate Taxes by Mortgage Status in Rote
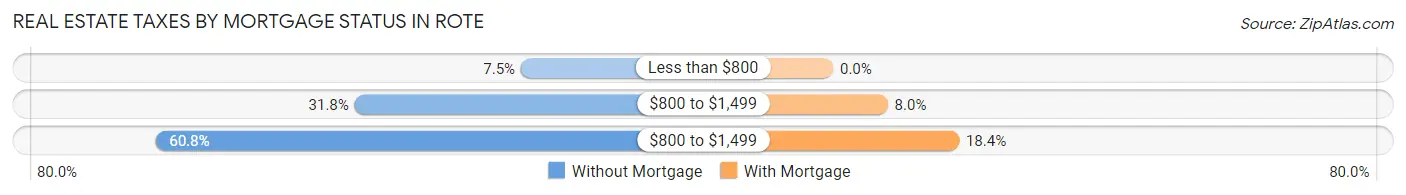
| Property Taxes | Without Mortgage | With Mortgage |
| Less than $800 | 8 (7.5%) | 0 (0.0%) |
| $800 to $1,499 | 34 (31.8%) | 13 (8.0%) |
| $800 to $1,499 | 65 (60.8%) | 30 (18.4%) |
| Total | 107 (100.0%) | 163 (100.0%) |
Health & Disability in Rote
Health Insurance Coverage by Age in Rote
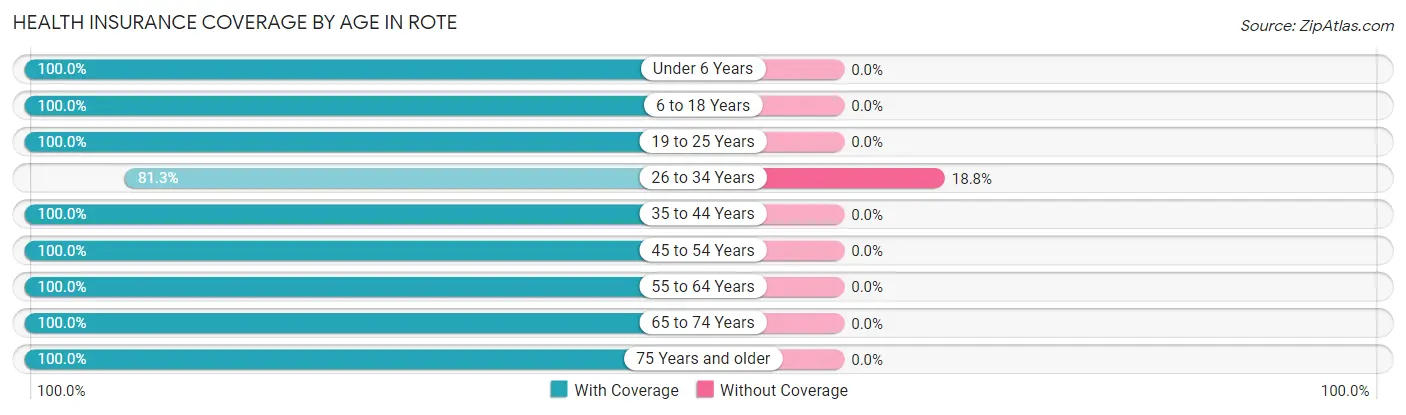
| Age Bracket | With Coverage | Without Coverage |
| Under 6 Years | 48 (100.0%) | 0 (0.0%) |
| 6 to 18 Years | 127 (100.0%) | 0 (0.0%) |
| 19 to 25 Years | 27 (100.0%) | 0 (0.0%) |
| 26 to 34 Years | 65 (81.2%) | 15 (18.8%) |
| 35 to 44 Years | 58 (100.0%) | 0 (0.0%) |
| 45 to 54 Years | 137 (100.0%) | 0 (0.0%) |
| 55 to 64 Years | 115 (100.0%) | 0 (0.0%) |
| 65 to 74 Years | 35 (100.0%) | 0 (0.0%) |
| 75 Years and older | 57 (100.0%) | 0 (0.0%) |
| Total | 669 (97.8%) | 15 (2.2%) |
Health Insurance Coverage by Citizenship Status in Rote
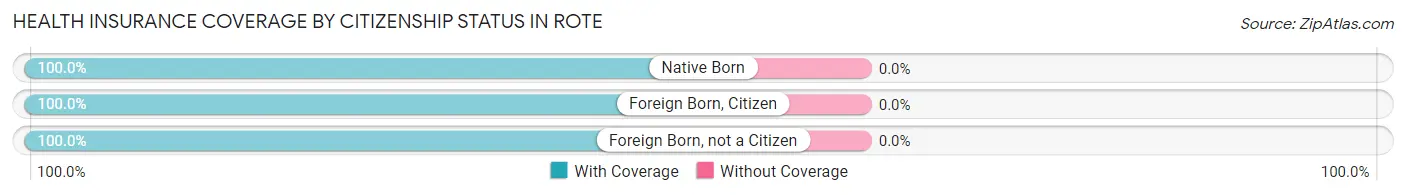
| Citizenship Status | With Coverage | Without Coverage |
| Native Born | 48 (100.0%) | 0 (0.0%) |
| Foreign Born, Citizen | 127 (100.0%) | 0 (0.0%) |
| Foreign Born, not a Citizen | 27 (100.0%) | 0 (0.0%) |
Health Insurance Coverage by Household Income in Rote
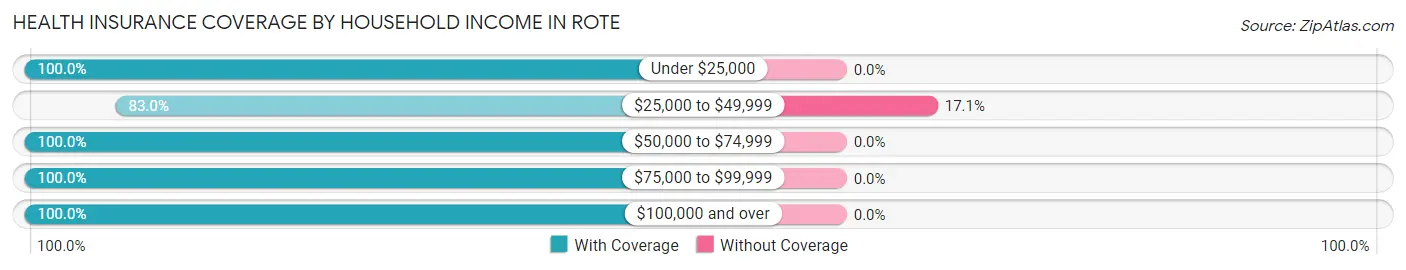
| Household Income | With Coverage | Without Coverage |
| Under $25,000 | 66 (100.0%) | 0 (0.0%) |
| $25,000 to $49,999 | 73 (83.0%) | 15 (17.1%) |
| $50,000 to $74,999 | 116 (100.0%) | 0 (0.0%) |
| $75,000 to $99,999 | 192 (100.0%) | 0 (0.0%) |
| $100,000 and over | 222 (100.0%) | 0 (0.0%) |
Public vs Private Health Insurance Coverage by Age in Rote
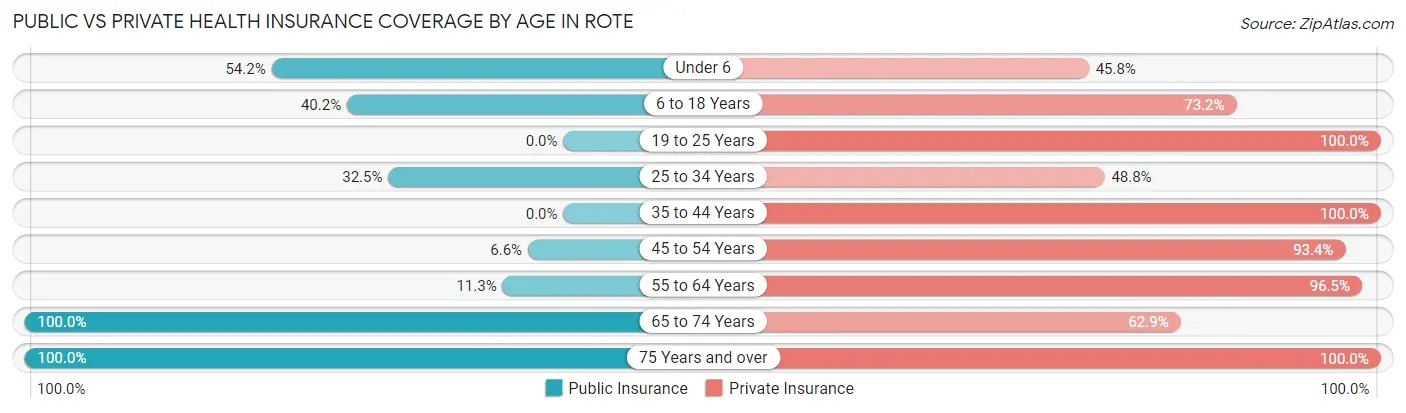
| Age Bracket | Public Insurance | Private Insurance |
| Under 6 | 26 (54.2%) | 22 (45.8%) |
| 6 to 18 Years | 51 (40.2%) | 93 (73.2%) |
| 19 to 25 Years | 0 (0.0%) | 27 (100.0%) |
| 25 to 34 Years | 26 (32.5%) | 39 (48.7%) |
| 35 to 44 Years | 0 (0.0%) | 58 (100.0%) |
| 45 to 54 Years | 9 (6.6%) | 128 (93.4%) |
| 55 to 64 Years | 13 (11.3%) | 111 (96.5%) |
| 65 to 74 Years | 35 (100.0%) | 22 (62.9%) |
| 75 Years and over | 57 (100.0%) | 57 (100.0%) |
| Total | 217 (31.7%) | 557 (81.4%) |
Disability Status by Sex by Age in Rote
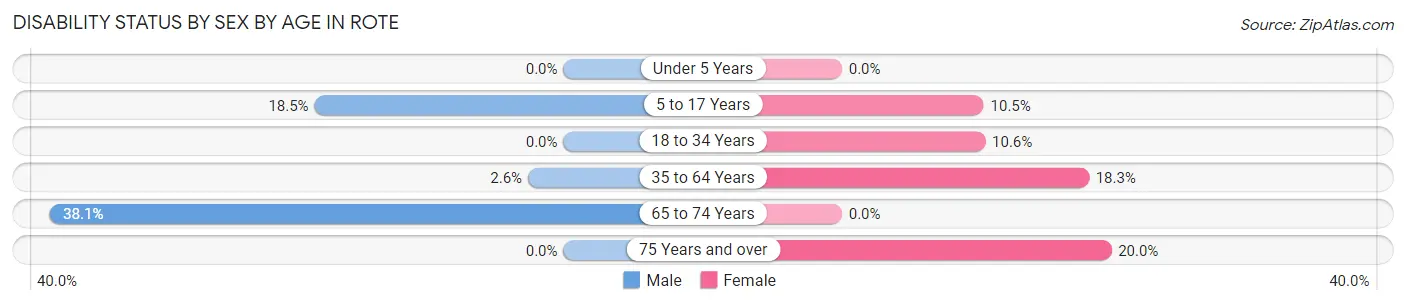
| Age Bracket | Male | Female |
| Under 5 Years | 0 (0.0%) | 0 (0.0%) |
| 5 to 17 Years | 17 (18.5%) | 6 (10.5%) |
| 18 to 34 Years | 0 (0.0%) | 5 (10.6%) |
| 35 to 64 Years | 5 (2.6%) | 22 (18.3%) |
| 65 to 74 Years | 8 (38.1%) | 0 (0.0%) |
| 75 Years and over | 0 (0.0%) | 6 (20.0%) |
Disability Class by Sex by Age in Rote
Disability Class: Hearing Difficulty
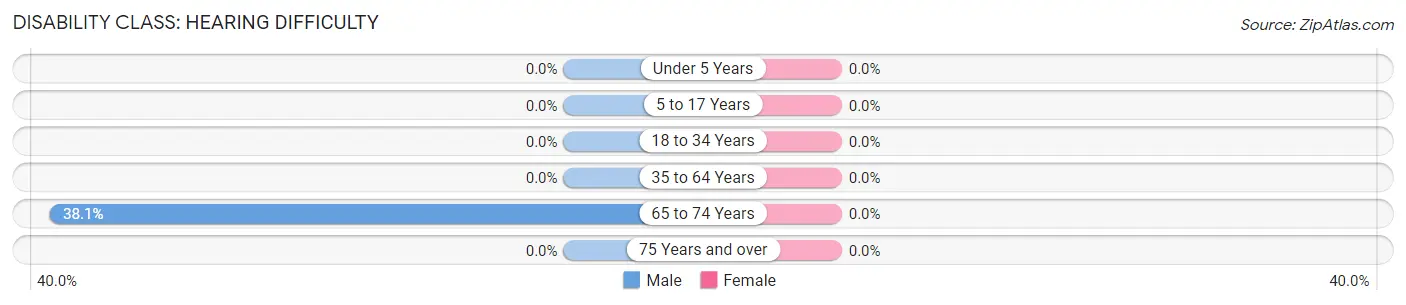
| Age Bracket | Male | Female |
| Under 5 Years | 0 (0.0%) | 0 (0.0%) |
| 5 to 17 Years | 0 (0.0%) | 0 (0.0%) |
| 18 to 34 Years | 0 (0.0%) | 0 (0.0%) |
| 35 to 64 Years | 0 (0.0%) | 0 (0.0%) |
| 65 to 74 Years | 8 (38.1%) | 0 (0.0%) |
| 75 Years and over | 0 (0.0%) | 0 (0.0%) |
Disability Class: Vision Difficulty
| Age Bracket | Male | Female |
| Under 5 Years | 0 (0.0%) | 0 (0.0%) |
| 5 to 17 Years | 0 (0.0%) | 0 (0.0%) |
| 18 to 34 Years | 0 (0.0%) | 0 (0.0%) |
| 35 to 64 Years | 0 (0.0%) | 0 (0.0%) |
| 65 to 74 Years | 0 (0.0%) | 0 (0.0%) |
| 75 Years and over | 0 (0.0%) | 0 (0.0%) |
Disability Class: Cognitive Difficulty
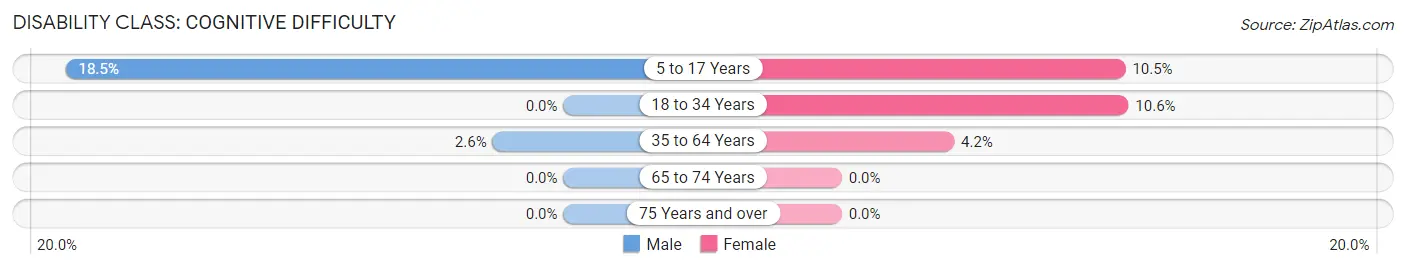
| Age Bracket | Male | Female |
| 5 to 17 Years | 17 (18.5%) | 6 (10.5%) |
| 18 to 34 Years | 0 (0.0%) | 5 (10.6%) |
| 35 to 64 Years | 5 (2.6%) | 5 (4.2%) |
| 65 to 74 Years | 0 (0.0%) | 0 (0.0%) |
| 75 Years and over | 0 (0.0%) | 0 (0.0%) |
Disability Class: Ambulatory Difficulty
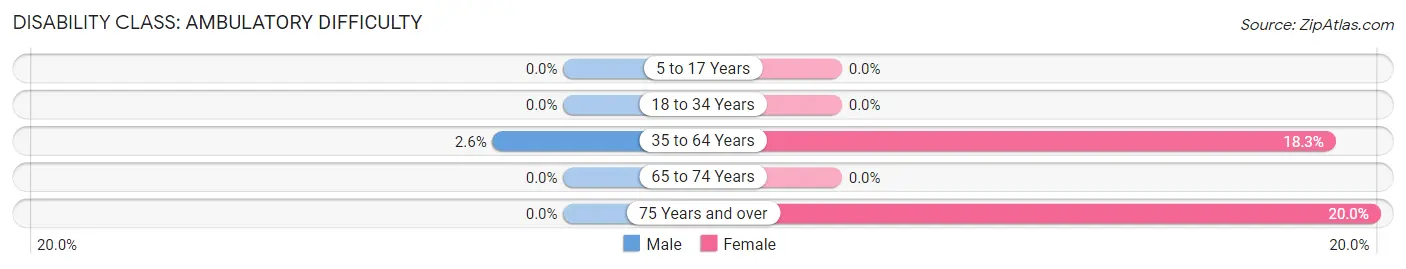
| Age Bracket | Male | Female |
| 5 to 17 Years | 0 (0.0%) | 0 (0.0%) |
| 18 to 34 Years | 0 (0.0%) | 0 (0.0%) |
| 35 to 64 Years | 5 (2.6%) | 22 (18.3%) |
| 65 to 74 Years | 0 (0.0%) | 0 (0.0%) |
| 75 Years and over | 0 (0.0%) | 6 (20.0%) |
Disability Class: Self-Care Difficulty
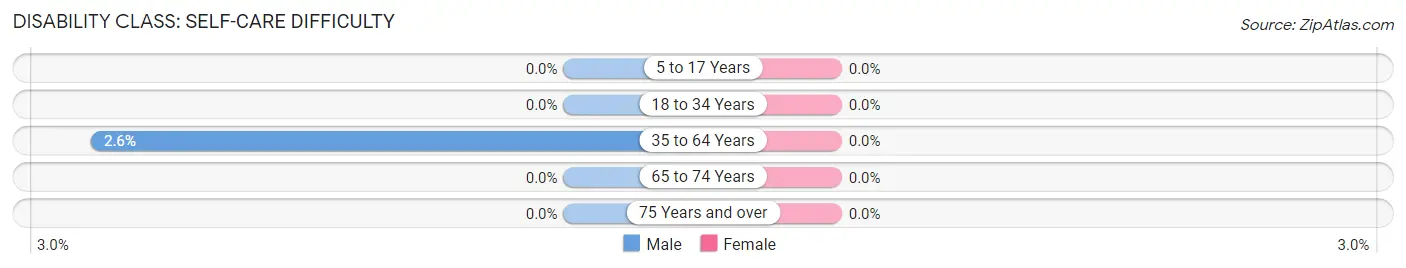
| Age Bracket | Male | Female |
| 5 to 17 Years | 0 (0.0%) | 0 (0.0%) |
| 18 to 34 Years | 0 (0.0%) | 0 (0.0%) |
| 35 to 64 Years | 5 (2.6%) | 0 (0.0%) |
| 65 to 74 Years | 0 (0.0%) | 0 (0.0%) |
| 75 Years and over | 0 (0.0%) | 0 (0.0%) |
Technology Access in Rote
Computing Device Access in Rote
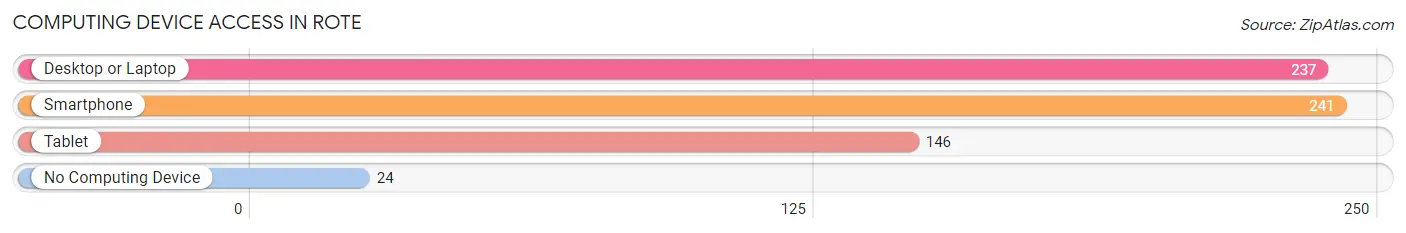
| Device Type | # Households | % Households |
| Desktop or Laptop | 237 | 83.2% |
| Smartphone | 241 | 84.6% |
| Tablet | 146 | 51.2% |
| No Computing Device | 24 | 8.4% |
| Total | 285 | 100.0% |
Internet Access in Rote
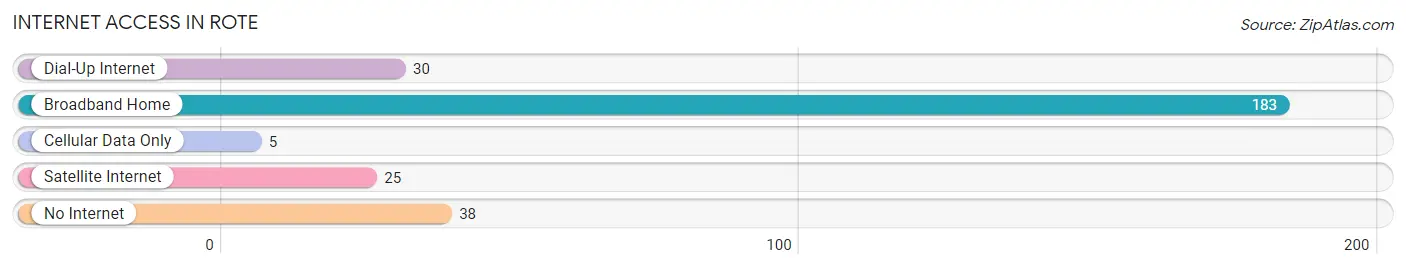
| Internet Type | # Households | % Households |
| Dial-Up Internet | 30 | 10.5% |
| Broadband Home | 183 | 64.2% |
| Cellular Data Only | 5 | 1.8% |
| Satellite Internet | 25 | 8.8% |
| No Internet | 38 | 13.3% |
| Total | 285 | 100.0% |
Rote Summary
Rote is a small island located in the eastern part of Indonesia, in the province of East Nusa Tenggara. It is the largest island in the province and is located about 500 kilometers east of the provincial capital, Kupang. The island is about 25 kilometers long and 15 kilometers wide, and has an area of about 300 square kilometers.
Geography
Rote is a volcanic island, with a rugged terrain and steep cliffs. The highest point on the island is Mount Rote, which is 890 meters above sea level. The island is surrounded by coral reefs, and is home to a variety of marine life, including dolphins, turtles, and dugongs. The island is also home to a variety of birds, including the endemic Rote Myzomela.
The climate of Rote is tropical, with temperatures ranging from 24 to 32 degrees Celsius. The island receives an average of 2,000 millimeters of rainfall per year, with the wet season occurring from October to April.
History
Rote has been inhabited since at least the 15th century, when it was part of the Majapahit Empire. In the 16th century, the island was colonized by the Portuguese, who established a trading post on the island. The Dutch East India Company took control of the island in 1646, and it remained under Dutch control until Indonesia declared its independence in 1945.
Economy
The economy of Rote is largely based on agriculture, with the main crops being rice, corn, cassava, and peanuts. Fishing is also an important part of the economy, with the main catches being tuna, mackerel, and sardines. Tourism is also an important part of the economy, with the island being a popular destination for divers and snorkelers.
Demographics
As of 2020, the population of Rote was estimated to be around 50,000. The majority of the population is ethnically Rote, with the remainder being migrants from other parts of Indonesia. The majority of the population is Christian, with a small minority of Muslims. The official language of the island is Indonesian, although Rote is also spoken by some of the island's inhabitants.
Common Questions
What is Per Capita Income in Rote?
Per Capita income in Rote is $36,568.
What is the Median Family Income in Rote?
Median Family Income in Rote is $82,361.
What is the Median Household income in Rote?
Median Household Income in Rote is $78,456.
What is Income or Wage Gap in Rote?
Income or Wage Gap in Rote is 59.5%.
Women in Rote earn 40.5 cents for every dollar earned by a man.
What is Inequality or Gini Index in Rote?
Inequality or Gini Index in Rote is 0.31.
What is the Total Population of Rote?
Total Population of Rote is 684.
What is the Total Male Population of Rote?
Total Male Population of Rote is 410.
What is the Total Female Population of Rote?
Total Female Population of Rote is 274.
What is the Ratio of Males per 100 Females in Rote?
There are 149.64 Males per 100 Females in Rote.
What is the Ratio of Females per 100 Males in Rote?
There are 66.83 Females per 100 Males in Rote.
What is the Median Population Age in Rote?
Median Population Age in Rote is 45.1 Years.
What is the Average Family Size in Rote
Average Family Size in Rote is 2.8 People.
What is the Average Household Size in Rote
Average Household Size in Rote is 2.4 People.
How Large is the Labor Force in Rote?
There are 379 People in the Labor Forcein in Rote.
What is the Percentage of People in the Labor Force in Rote?
69.9% of People are in the Labor Force in Rote.
What is the Unemployment Rate in Rote?
Unemployment Rate in Rote is 2.4%.