Conneautville borough, PA Map & Demographics
Conneautville borough Overview
$22,864
PER CAPITA INCOME
$52,222
AVG FAMILY INCOME
$49,167
AVG HOUSEHOLD INCOME
43.1%
WAGE / INCOME GAP [ % ]
56.9¢/ $1
WAGE / INCOME GAP [ $ ]
0.39
INEQUALITY / GINI INDEX
745
TOTAL POPULATION
380
MALE POPULATION
365
FEMALE POPULATION
104.11
MALES / 100 FEMALES
96.05
FEMALES / 100 MALES
38.5
MEDIAN AGE
2.8
AVG FAMILY SIZE
2.5
AVG HOUSEHOLD SIZE
372
LABOR FORCE [ PEOPLE ]
63.7%
PERCENT IN LABOR FORCE
20.7%
UNEMPLOYMENT RATE
Income in Conneautville borough
Income Overview in Conneautville borough
Per Capita Income in Conneautville borough is $22,864, while median incomes of families and households are $52,222 and $49,167 respectively.
| Characteristic | Number | Measure |
| Per Capita Income | 745 | $22,864 |
| Median Family Income | 186 | $52,222 |
| Mean Family Income | 186 | $59,316 |
| Median Household Income | 302 | $49,167 |
| Mean Household Income | 302 | $53,902 |
| Income Deficit | 186 | $0 |
| Wage / Income Gap (%) | 745 | 43.12% |
| Wage / Income Gap ($) | 745 | 56.88¢ per $1 |
| Gini / Inequality Index | 745 | 0.39 |
Earnings by Sex in Conneautville borough
Average Earnings in Conneautville borough are $33,241, $46,151 for men and $26,250 for women, a difference of 43.1%.
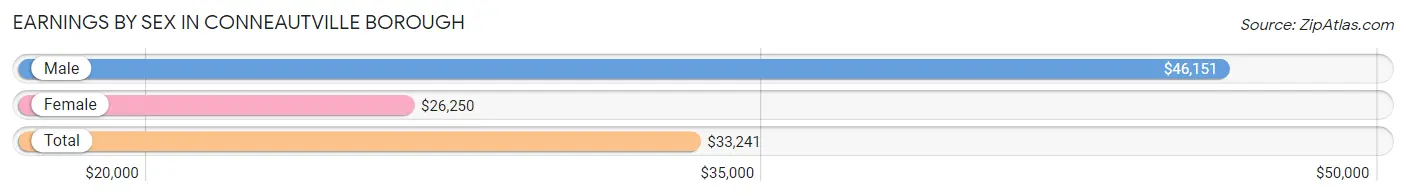
| Sex | Number | Average Earnings |
| Male | 167 (47.7%) | $46,151 |
| Female | 183 (52.3%) | $26,250 |
| Total | 350 (100.0%) | $33,241 |
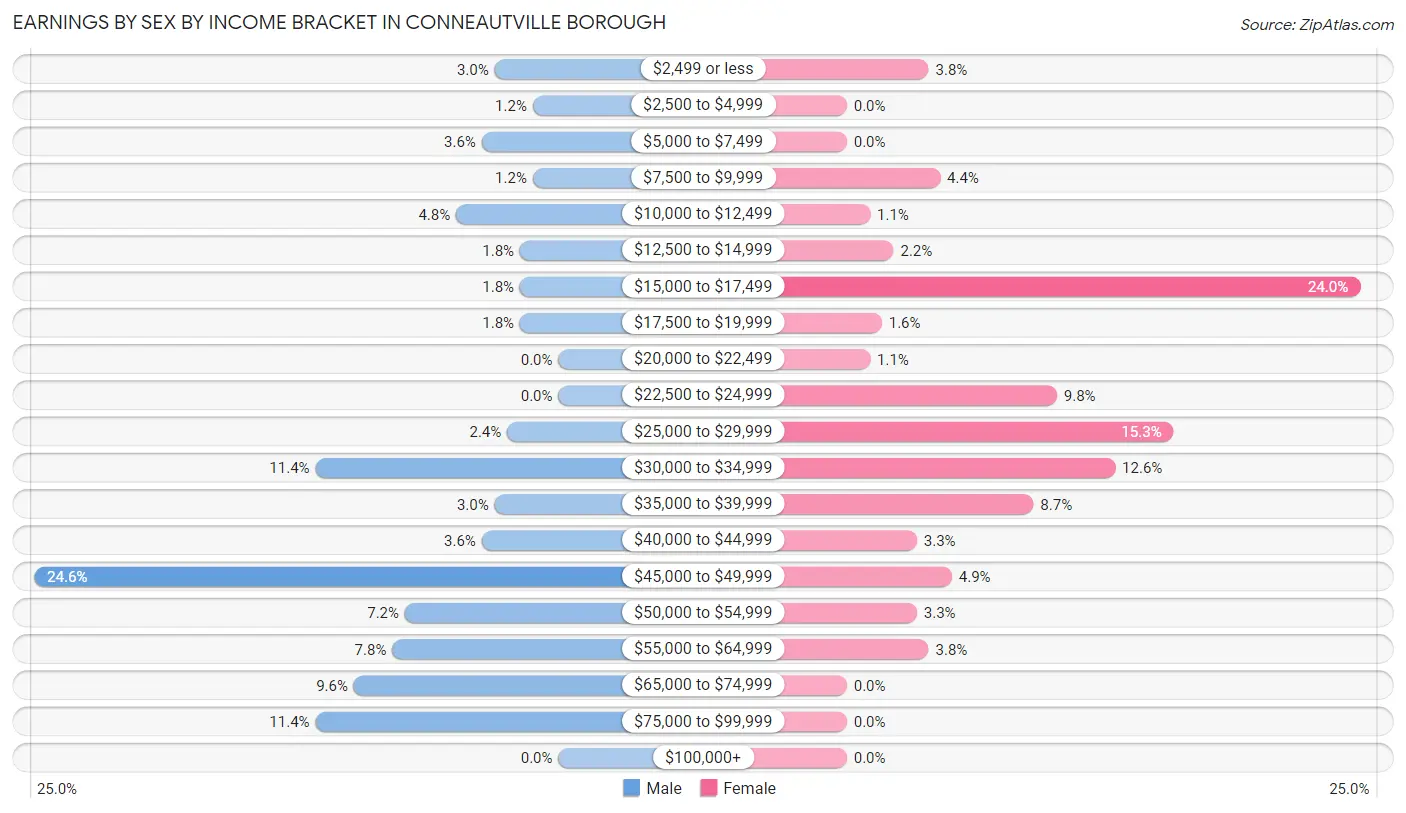
Earnings by Sex by Income Bracket in Conneautville borough
The most common earnings brackets in Conneautville borough are $45,000 to $49,999 for men (41 | 24.5%) and $15,000 to $17,499 for women (44 | 24.0%).
| Income | Male | Female |
| $2,499 or less | 5 (3.0%) | 7 (3.8%) |
| $2,500 to $4,999 | 2 (1.2%) | 0 (0.0%) |
| $5,000 to $7,499 | 6 (3.6%) | 0 (0.0%) |
| $7,500 to $9,999 | 2 (1.2%) | 8 (4.4%) |
| $10,000 to $12,499 | 8 (4.8%) | 2 (1.1%) |
| $12,500 to $14,999 | 3 (1.8%) | 4 (2.2%) |
| $15,000 to $17,499 | 3 (1.8%) | 44 (24.0%) |
| $17,500 to $19,999 | 3 (1.8%) | 3 (1.6%) |
| $20,000 to $22,499 | 0 (0.0%) | 2 (1.1%) |
| $22,500 to $24,999 | 0 (0.0%) | 18 (9.8%) |
| $25,000 to $29,999 | 4 (2.4%) | 28 (15.3%) |
| $30,000 to $34,999 | 19 (11.4%) | 23 (12.6%) |
| $35,000 to $39,999 | 5 (3.0%) | 16 (8.7%) |
| $40,000 to $44,999 | 6 (3.6%) | 6 (3.3%) |
| $45,000 to $49,999 | 41 (24.5%) | 9 (4.9%) |
| $50,000 to $54,999 | 12 (7.2%) | 6 (3.3%) |
| $55,000 to $64,999 | 13 (7.8%) | 7 (3.8%) |
| $65,000 to $74,999 | 16 (9.6%) | 0 (0.0%) |
| $75,000 to $99,999 | 19 (11.4%) | 0 (0.0%) |
| $100,000+ | 0 (0.0%) | 0 (0.0%) |
| Total | 167 (100.0%) | 183 (100.0%) |
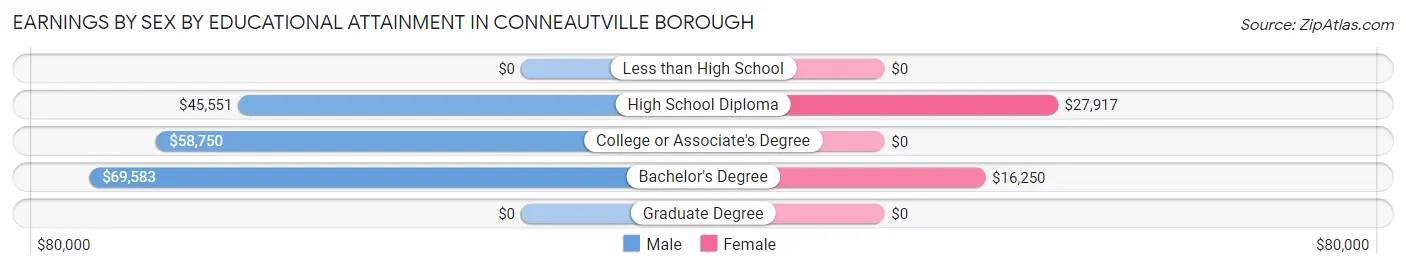
Earnings by Sex by Educational Attainment in Conneautville borough
Average earnings in Conneautville borough are $46,544 for men and $26,964 for women, a difference of 42.1%. Men with an educational attainment of bachelor's degree enjoy the highest average annual earnings of $69,583, while those with high school diploma education earn the least with $45,551. Women with an educational attainment of high school diploma earn the most with the average annual earnings of $27,917, while those with bachelor's degree education have the smallest earnings of $16,250.
| Educational Attainment | Male Income | Female Income |
| Less than High School | - | - |
| High School Diploma | $45,551 | $27,917 |
| College or Associate's Degree | $58,750 | $0 |
| Bachelor's Degree | $69,583 | $16,250 |
| Graduate Degree | - | - |
| Total | $46,544 | $26,964 |
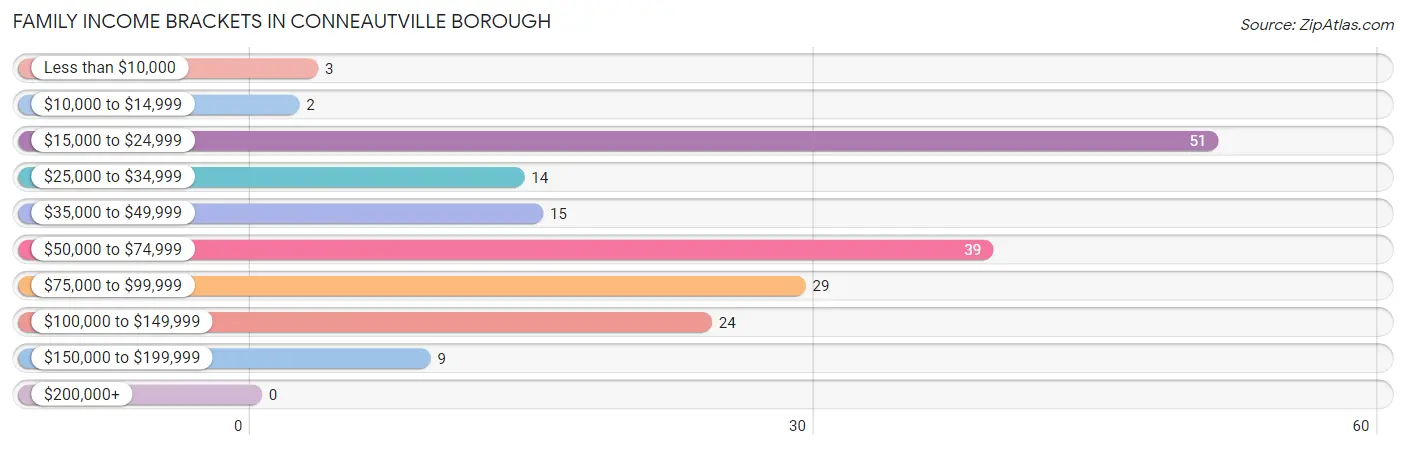
Family Income in Conneautville borough
Family Income Brackets in Conneautville borough
According to the Conneautville borough family income data, there are 51 families falling into the $15,000 to $24,999 income range, which is the most common income bracket and makes up 27.4% of all families.
| Income Bracket | # Families | % Families |
| Less than $10,000 | 3 | 1.6% |
| $10,000 to $14,999 | 2 | 1.1% |
| $15,000 to $24,999 | 51 | 27.4% |
| $25,000 to $34,999 | 14 | 7.5% |
| $35,000 to $49,999 | 15 | 8.1% |
| $50,000 to $74,999 | 39 | 21.0% |
| $75,000 to $99,999 | 29 | 15.6% |
| $100,000 to $149,999 | 24 | 12.9% |
| $150,000 to $199,999 | 9 | 4.8% |
| $200,000+ | 0 | 0.0% |
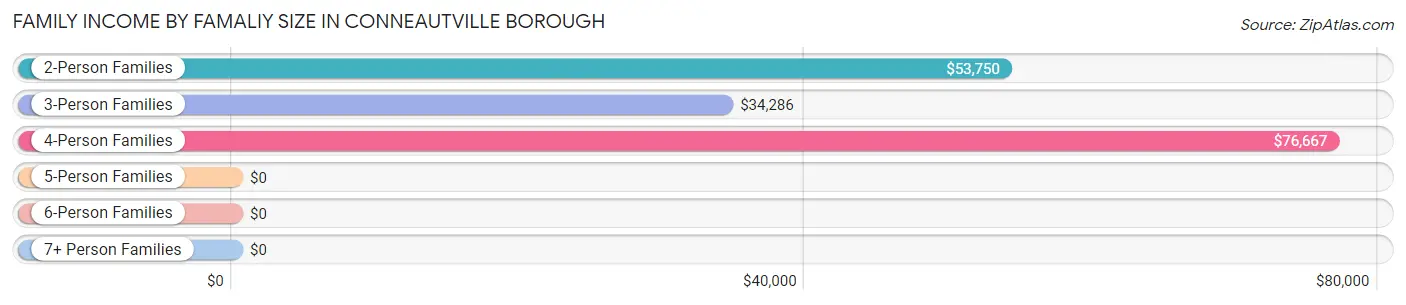
Family Income by Famaliy Size in Conneautville borough
4-person families (12 | 6.5%) account for the highest median family income in Conneautville borough with $76,667 per family, while 2-person families (70 | 37.6%) have the highest median income of $26,875 per family member.
| Income Bracket | # Families | Median Income |
| 2-Person Families | 70 (37.6%) | $53,750 |
| 3-Person Families | 92 (49.5%) | $34,286 |
| 4-Person Families | 12 (6.5%) | $76,667 |
| 5-Person Families | 6 (3.2%) | $0 |
| 6-Person Families | 6 (3.2%) | $0 |
| 7+ Person Families | 0 (0.0%) | $0 |
| Total | 186 (100.0%) | $52,222 |
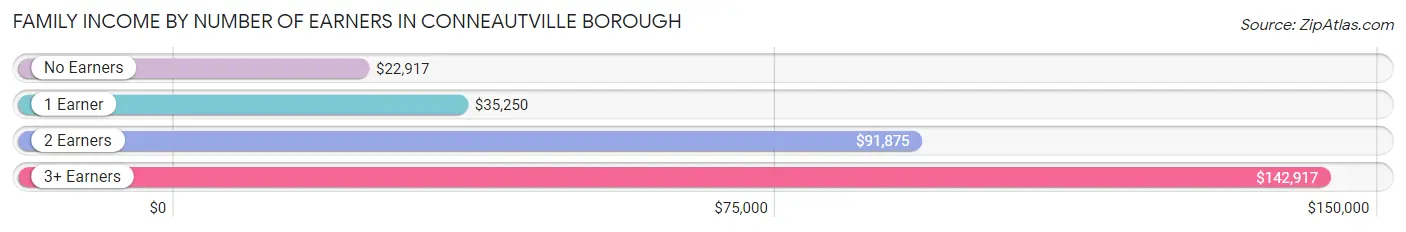
Family Income by Number of Earners in Conneautville borough
The median family income in Conneautville borough is $52,222, with families comprising 3+ earners (11) having the highest median family income of $142,917, while families with no earners (31) have the lowest median family income of $22,917, accounting for 5.9% and 16.7% of families, respectively.
| Number of Earners | # Families | Median Income |
| No Earners | 31 (16.7%) | $22,917 |
| 1 Earner | 93 (50.0%) | $35,250 |
| 2 Earners | 51 (27.4%) | $91,875 |
| 3+ Earners | 11 (5.9%) | $142,917 |
| Total | 186 (100.0%) | $52,222 |
Household Income in Conneautville borough
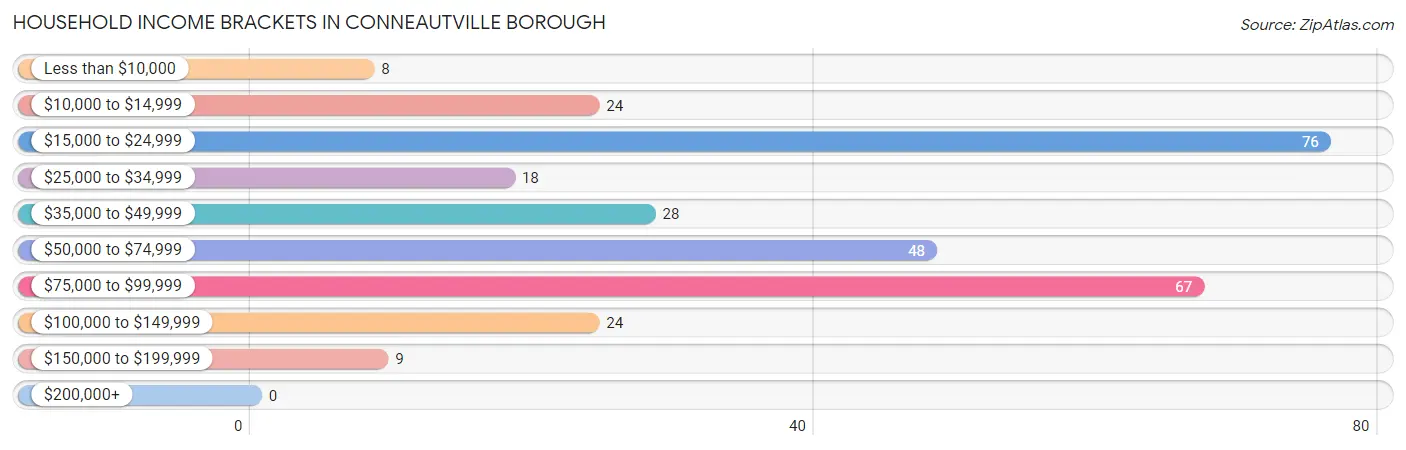
Household Income Brackets in Conneautville borough
With 76 households falling in the category, the $15,000 to $24,999 income range is the most frequent in Conneautville borough, accounting for 25.2% of all households.
| Income Bracket | # Households | % Households |
| Less than $10,000 | 8 | 2.6% |
| $10,000 to $14,999 | 24 | 7.9% |
| $15,000 to $24,999 | 76 | 25.2% |
| $25,000 to $34,999 | 18 | 6.0% |
| $35,000 to $49,999 | 28 | 9.3% |
| $50,000 to $74,999 | 48 | 15.9% |
| $75,000 to $99,999 | 67 | 22.2% |
| $100,000 to $149,999 | 24 | 7.9% |
| $150,000 to $199,999 | 9 | 3.0% |
| $200,000+ | 0 | 0.0% |
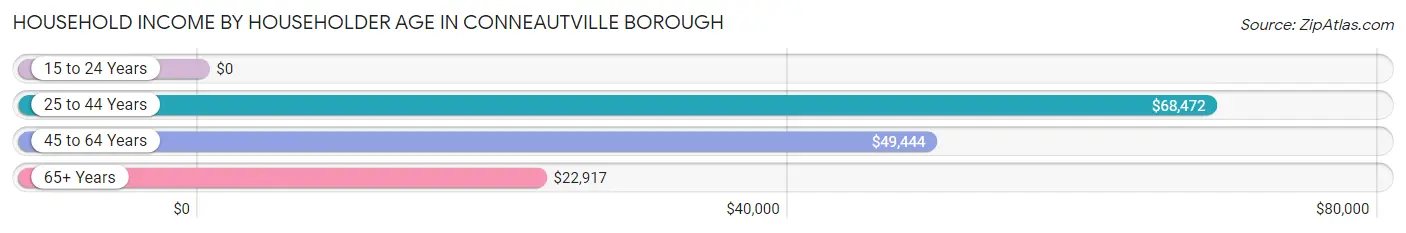
Household Income by Householder Age in Conneautville borough
The median household income in Conneautville borough is $49,167, with the highest median household income of $68,472 found in the 25 to 44 years age bracket for the primary householder. A total of 113 households (37.4%) fall into this category. Meanwhile, the 15 to 24 years age bracket for the primary householder has the lowest median household income of $0, with 4 households (1.3%) in this group.
| Income Bracket | # Households | Median Income |
| 15 to 24 Years | 4 (1.3%) | $0 |
| 25 to 44 Years | 113 (37.4%) | $68,472 |
| 45 to 64 Years | 106 (35.1%) | $49,444 |
| 65+ Years | 79 (26.2%) | $22,917 |
| Total | 302 (100.0%) | $49,167 |
Poverty in Conneautville borough
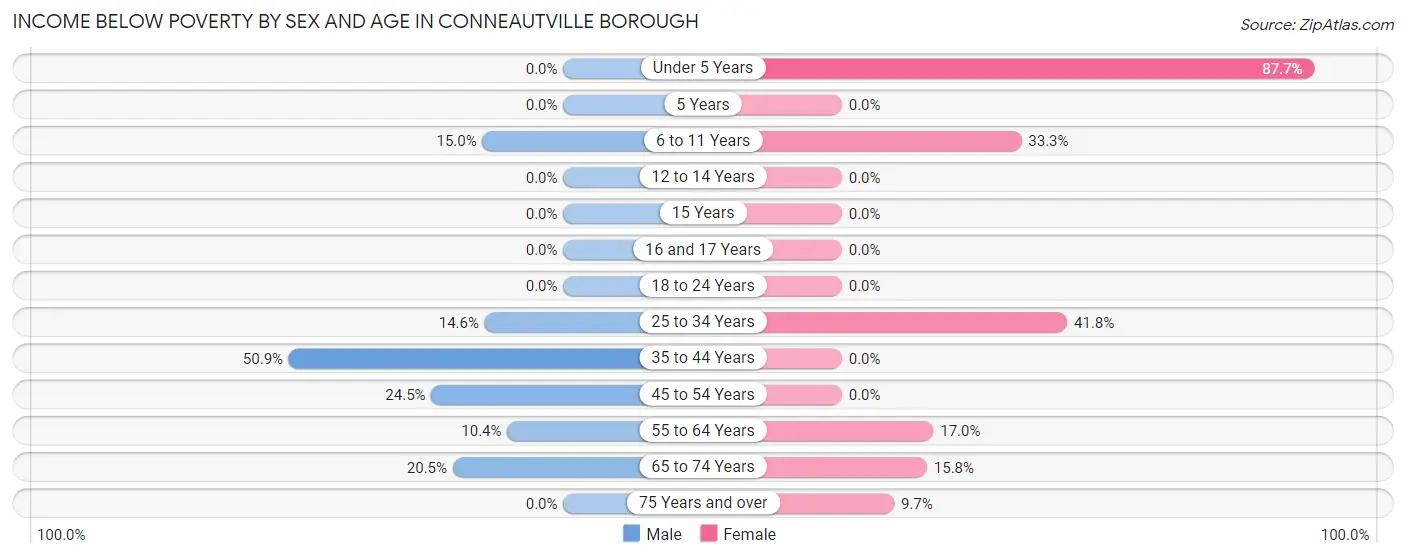
Income Below Poverty by Sex and Age in Conneautville borough
With 18.0% poverty level for males and 32.0% for females among the residents of Conneautville borough, 35 to 44 year old males and under 5 year old females are the most vulnerable to poverty, with 27 males (50.9%) and 50 females (87.7%) in their respective age groups living below the poverty level.
| Age Bracket | Male | Female |
| Under 5 Years | 0 (0.0%) | 50 (87.7%) |
| 5 Years | 0 (0.0%) | 0 (0.0%) |
| 6 to 11 Years | 6 (15.0%) | 2 (33.3%) |
| 12 to 14 Years | 0 (0.0%) | 0 (0.0%) |
| 15 Years | 0 (0.0%) | 0 (0.0%) |
| 16 and 17 Years | 0 (0.0%) | 0 (0.0%) |
| 18 to 24 Years | 0 (0.0%) | 0 (0.0%) |
| 25 to 34 Years | 7 (14.6%) | 46 (41.8%) |
| 35 to 44 Years | 27 (50.9%) | 0 (0.0%) |
| 45 to 54 Years | 12 (24.5%) | 0 (0.0%) |
| 55 to 64 Years | 8 (10.4%) | 9 (17.0%) |
| 65 to 74 Years | 8 (20.5%) | 6 (15.8%) |
| 75 Years and over | 0 (0.0%) | 3 (9.7%) |
| Total | 68 (18.0%) | 116 (32.0%) |
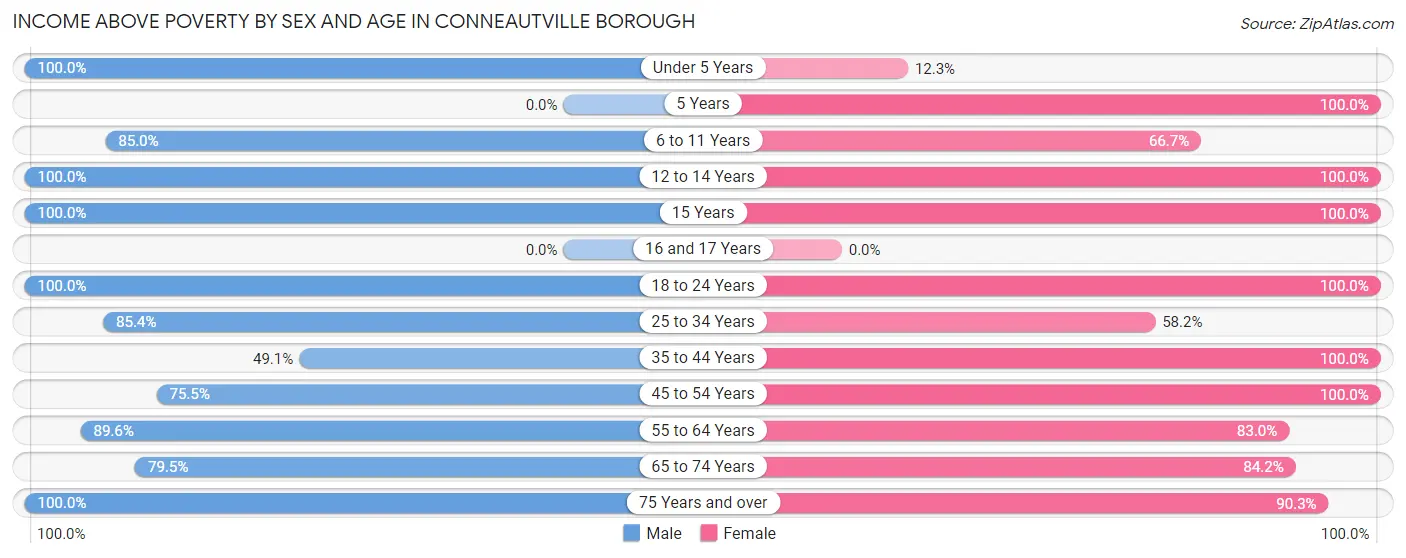
Income Above Poverty by Sex and Age in Conneautville borough
According to the poverty statistics in Conneautville borough, males aged under 5 years and females aged 5 years are the age groups that are most secure financially, with 100.0% of males and 100.0% of females in these age groups living above the poverty line.
| Age Bracket | Male | Female |
| Under 5 Years | 21 (100.0%) | 7 (12.3%) |
| 5 Years | 0 (0.0%) | 8 (100.0%) |
| 6 to 11 Years | 34 (85.0%) | 4 (66.7%) |
| 12 to 14 Years | 10 (100.0%) | 3 (100.0%) |
| 15 Years | 7 (100.0%) | 5 (100.0%) |
| 16 and 17 Years | 0 (0.0%) | 0 (0.0%) |
| 18 to 24 Years | 18 (100.0%) | 10 (100.0%) |
| 25 to 34 Years | 41 (85.4%) | 64 (58.2%) |
| 35 to 44 Years | 26 (49.1%) | 20 (100.0%) |
| 45 to 54 Years | 37 (75.5%) | 22 (100.0%) |
| 55 to 64 Years | 69 (89.6%) | 44 (83.0%) |
| 65 to 74 Years | 31 (79.5%) | 32 (84.2%) |
| 75 Years and over | 16 (100.0%) | 28 (90.3%) |
| Total | 310 (82.0%) | 247 (68.0%) |
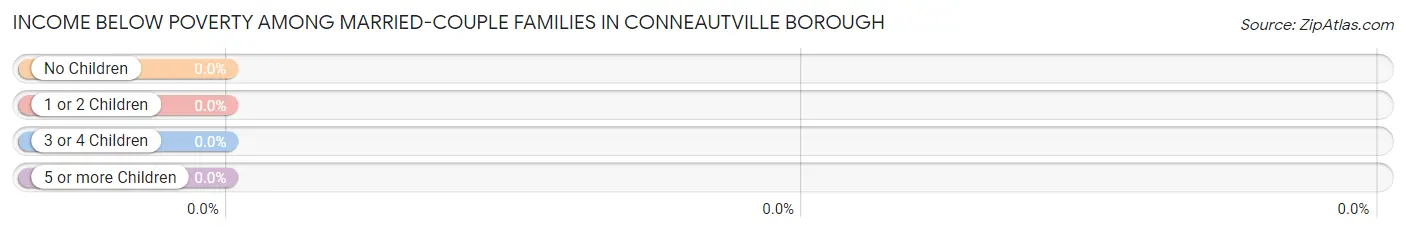
Income Below Poverty Among Married-Couple Families in Conneautville borough
| Children | Above Poverty | Below Poverty |
| No Children | 67 (100.0%) | 0 (0.0%) |
| 1 or 2 Children | 35 (100.0%) | 0 (0.0%) |
| 3 or 4 Children | 10 (100.0%) | 0 (0.0%) |
| 5 or more Children | 0 (0.0%) | 0 (0.0%) |
| Total | 112 (100.0%) | 0 (0.0%) |
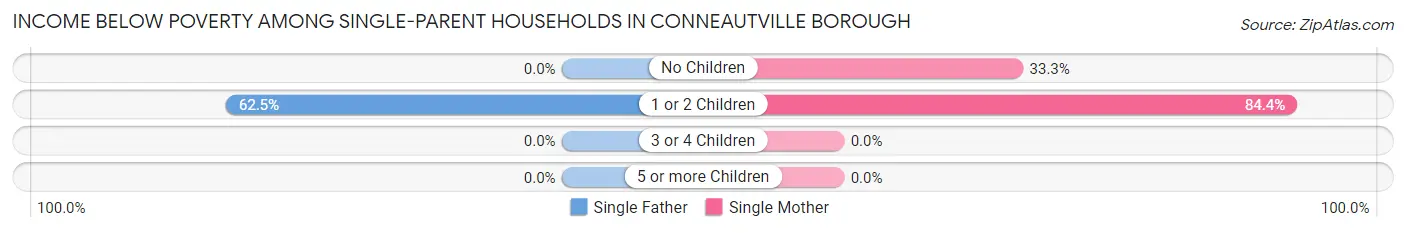
Income Below Poverty Among Single-Parent Households in Conneautville borough
According to the poverty data in Conneautville borough, 21.7% or 5 single-father households and 78.4% or 40 single-mother households are living below the poverty line. Among single-father households, those with 1 or 2 children have the highest poverty rate, with 5 households (62.5%) experiencing poverty. Likewise, among single-mother households, those with 1 or 2 children have the highest poverty rate, with 38 households (84.4%) falling below the poverty line.
| Children | Single Father | Single Mother |
| No Children | 0 (0.0%) | 2 (33.3%) |
| 1 or 2 Children | 5 (62.5%) | 38 (84.4%) |
| 3 or 4 Children | 0 (0.0%) | 0 (0.0%) |
| 5 or more Children | 0 (0.0%) | 0 (0.0%) |
| Total | 5 (21.7%) | 40 (78.4%) |
Income Below Poverty Among Married-Couple vs Single-Parent Households in Conneautville borough
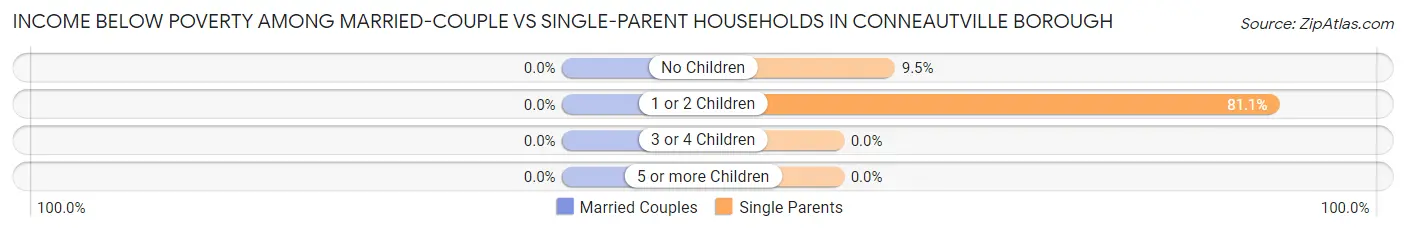
| Children | Married-Couple Families | Single-Parent Households |
| No Children | 0 (0.0%) | 2 (9.5%) |
| 1 or 2 Children | 0 (0.0%) | 43 (81.1%) |
| 3 or 4 Children | 0 (0.0%) | 0 (0.0%) |
| 5 or more Children | 0 (0.0%) | 0 (0.0%) |
| Total | 0 (0.0%) | 45 (60.8%) |
Race in Conneautville borough
The most populous races in Conneautville borough are White / Caucasian (728 | 97.7%), Black / African American (13 | 1.7%), and Two or more Races (4 | 0.5%).
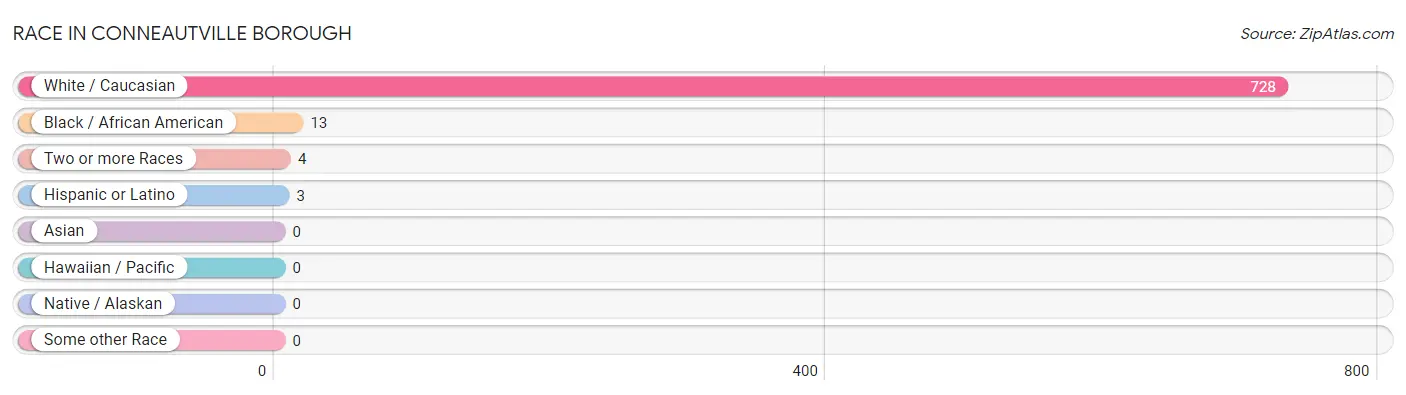
| Race | # Population | % Population |
| Asian | 0 | 0.0% |
| Black / African American | 13 | 1.7% |
| Hawaiian / Pacific | 0 | 0.0% |
| Hispanic or Latino | 3 | 0.4% |
| Native / Alaskan | 0 | 0.0% |
| White / Caucasian | 728 | 97.7% |
| Two or more Races | 4 | 0.5% |
| Some other Race | 0 | 0.0% |
| Total | 745 | 100.0% |
Ancestry in Conneautville borough
The most populous ancestries reported in Conneautville borough are German (204 | 27.4%), Polish (147 | 19.7%), Irish (125 | 16.8%), English (75 | 10.1%), and French Canadian (50 | 6.7%), together accounting for 80.7% of all Conneautville borough residents.
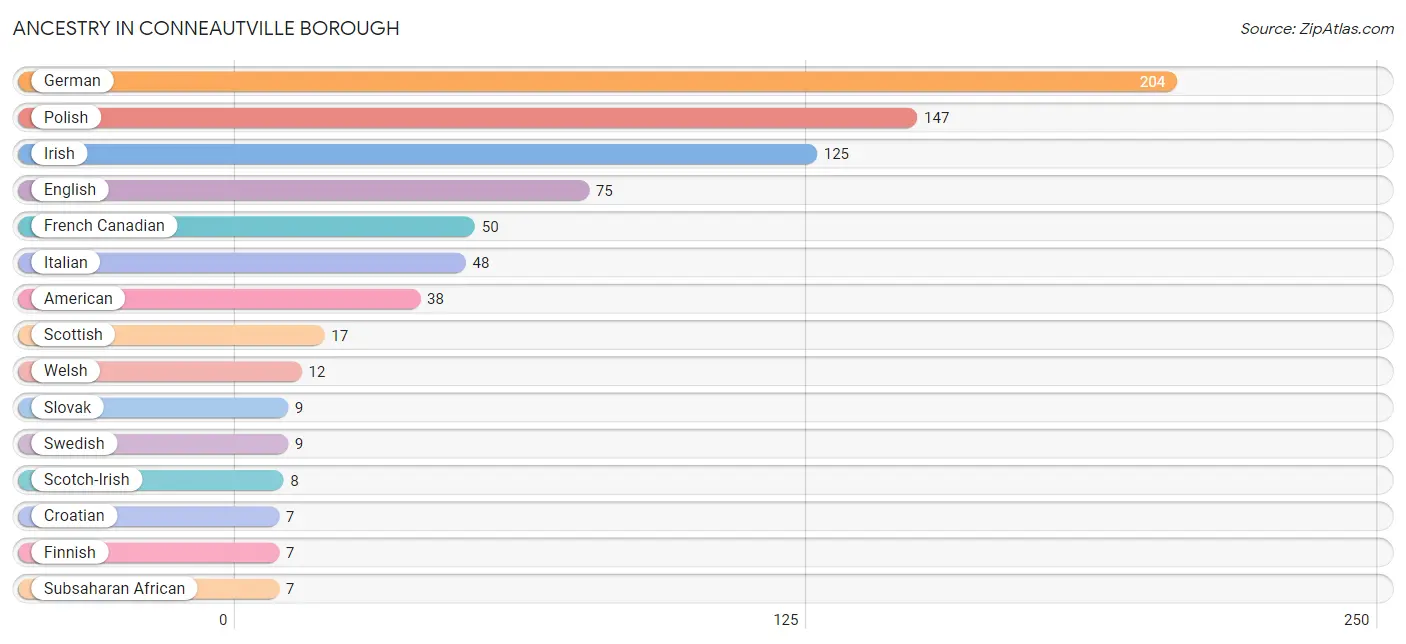
| Ancestry | # Population | % Population |
| American | 38 | 5.1% |
| British | 4 | 0.5% |
| Croatian | 7 | 0.9% |
| Czechoslovakian | 4 | 0.5% |
| English | 75 | 10.1% |
| European | 2 | 0.3% |
| Finnish | 7 | 0.9% |
| French | 3 | 0.4% |
| French Canadian | 50 | 6.7% |
| German | 204 | 27.4% |
| Hungarian | 2 | 0.3% |
| Irish | 125 | 16.8% |
| Italian | 48 | 6.4% |
| Mexican | 3 | 0.4% |
| Polish | 147 | 19.7% |
| Russian | 4 | 0.5% |
| Scotch-Irish | 8 | 1.1% |
| Scottish | 17 | 2.3% |
| Slovak | 9 | 1.2% |
| Subsaharan African | 7 | 0.9% |
| Swedish | 9 | 1.2% |
| Ukrainian | 4 | 0.5% |
| Welsh | 12 | 1.6% | View All 23 Rows |
Immigrants in Conneautville borough
The most numerous immigrant groups reported in Conneautville borough came from Africa (4 | 0.5%), Cameroon (4 | 0.5%), and Middle Africa (4 | 0.5%), together accounting for 1.6% of all Conneautville borough residents.
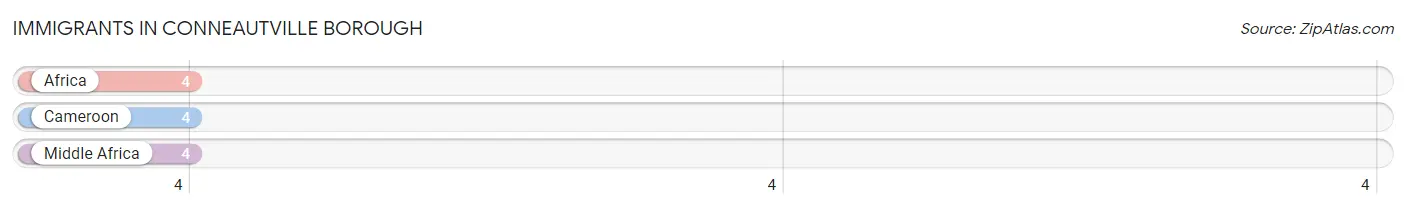
| Immigration Origin | # Population | % Population |
| Africa | 4 | 0.5% |
| Cameroon | 4 | 0.5% |
| Middle Africa | 4 | 0.5% | View All 3 Rows |
Sex and Age in Conneautville borough
Sex and Age in Conneautville borough
The most populous age groups in Conneautville borough are 55 to 59 Years (45 | 11.8%) for men and 25 to 29 Years (101 | 27.7%) for women.
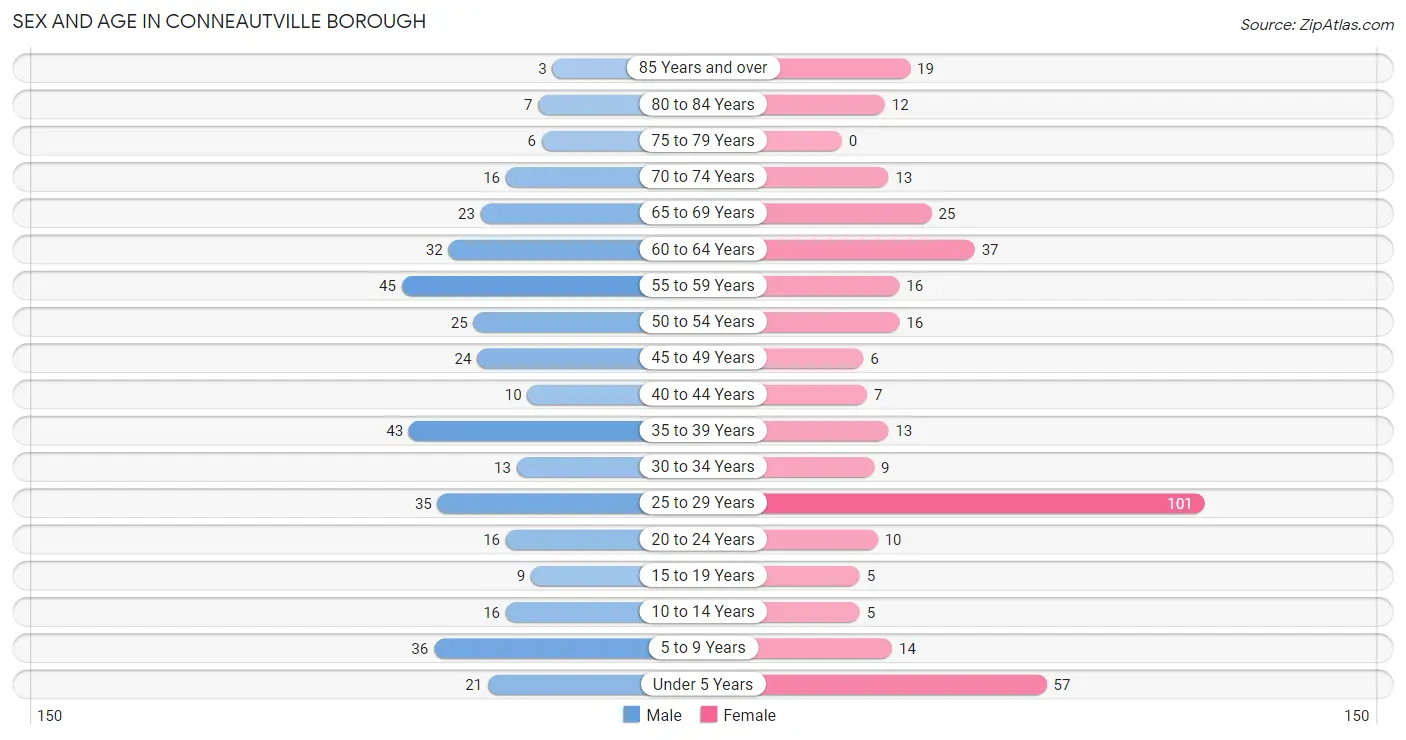
| Age Bracket | Male | Female |
| Under 5 Years | 21 (5.5%) | 57 (15.6%) |
| 5 to 9 Years | 36 (9.5%) | 14 (3.8%) |
| 10 to 14 Years | 16 (4.2%) | 5 (1.4%) |
| 15 to 19 Years | 9 (2.4%) | 5 (1.4%) |
| 20 to 24 Years | 16 (4.2%) | 10 (2.7%) |
| 25 to 29 Years | 35 (9.2%) | 101 (27.7%) |
| 30 to 34 Years | 13 (3.4%) | 9 (2.5%) |
| 35 to 39 Years | 43 (11.3%) | 13 (3.6%) |
| 40 to 44 Years | 10 (2.6%) | 7 (1.9%) |
| 45 to 49 Years | 24 (6.3%) | 6 (1.6%) |
| 50 to 54 Years | 25 (6.6%) | 16 (4.4%) |
| 55 to 59 Years | 45 (11.8%) | 16 (4.4%) |
| 60 to 64 Years | 32 (8.4%) | 37 (10.1%) |
| 65 to 69 Years | 23 (6.0%) | 25 (6.9%) |
| 70 to 74 Years | 16 (4.2%) | 13 (3.6%) |
| 75 to 79 Years | 6 (1.6%) | 0 (0.0%) |
| 80 to 84 Years | 7 (1.8%) | 12 (3.3%) |
| 85 Years and over | 3 (0.8%) | 19 (5.2%) |
| Total | 380 (100.0%) | 365 (100.0%) |
Families and Households in Conneautville borough
Median Family Size in Conneautville borough
The median family size in Conneautville borough is 2.80 persons per family, with married-couple families (112 | 60.2%) accounting for the largest median family size of 2.96 persons per family. On the other hand, single male/father families (23 | 12.4%) represent the smallest median family size with 2.48 persons per family.
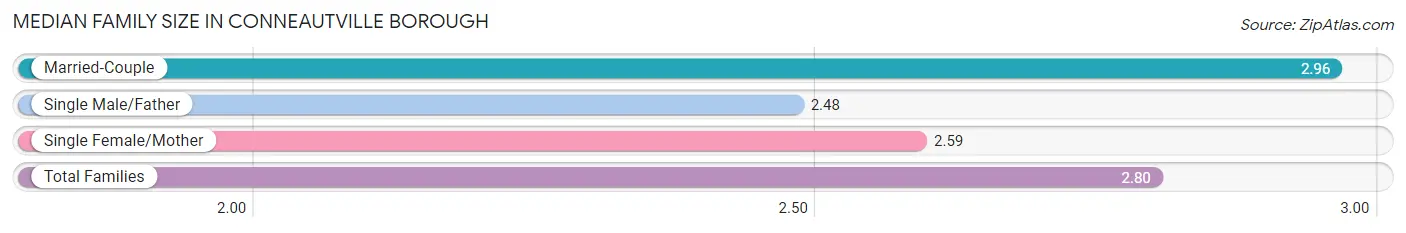
| Family Type | # Families | Family Size |
| Married-Couple | 112 (60.2%) | 2.96 |
| Single Male/Father | 23 (12.4%) | 2.48 |
| Single Female/Mother | 51 (27.4%) | 2.59 |
| Total Families | 186 (100.0%) | 2.80 |
Median Household Size in Conneautville borough
The median household size in Conneautville borough is 2.47 persons per household, with single female/mother households (51 | 16.9%) accounting for the largest median household size of 3.31 persons per household. non-family households (116 | 38.4%) represent the smallest median household size with 1.44 persons per household.
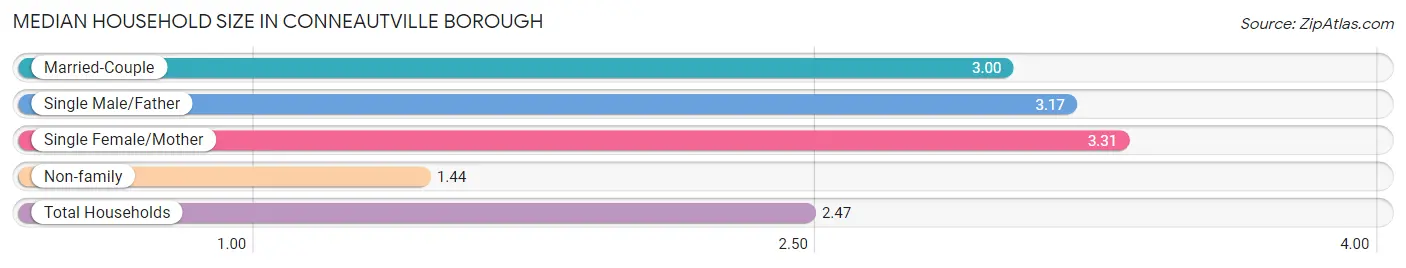
| Household Type | # Households | Household Size |
| Married-Couple | 112 (37.1%) | 3.00 |
| Single Male/Father | 23 (7.6%) | 3.17 |
| Single Female/Mother | 51 (16.9%) | 3.31 |
| Non-family | 116 (38.4%) | 1.44 |
| Total Households | 302 (100.0%) | 2.47 |
Household Size by Marriage Status in Conneautville borough
Out of a total of 302 households in Conneautville borough, 186 (61.6%) are family households, while 116 (38.4%) are nonfamily households. The most numerous type of family households are 2-person households, comprising 59, and the most common type of nonfamily households are 1-person households, comprising 74.
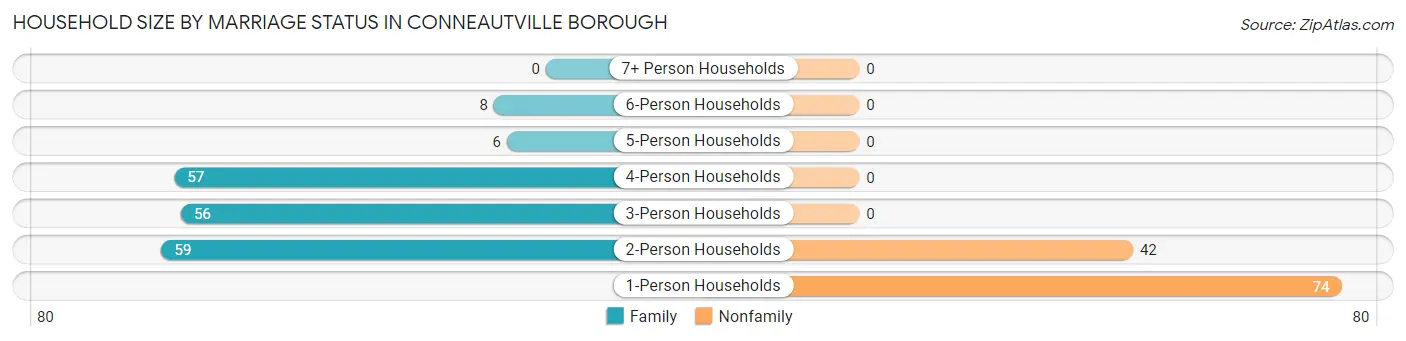
| Household Size | Family Households | Nonfamily Households |
| 1-Person Households | - | 74 (24.5%) |
| 2-Person Households | 59 (19.5%) | 42 (13.9%) |
| 3-Person Households | 56 (18.5%) | 0 (0.0%) |
| 4-Person Households | 57 (18.9%) | 0 (0.0%) |
| 5-Person Households | 6 (2.0%) | 0 (0.0%) |
| 6-Person Households | 8 (2.6%) | 0 (0.0%) |
| 7+ Person Households | 0 (0.0%) | 0 (0.0%) |
| Total | 186 (61.6%) | 116 (38.4%) |
Female Fertility in Conneautville borough
Fertility by Age in Conneautville borough
Average fertility rate in Conneautville borough is 39.0 births per 1,000 women. Women in the age bracket of 20 to 34 years have the highest fertility rate with 50.0 births per 1,000 women. Women in the age bracket of 20 to 34 years acount for 100.0% of all women with births.
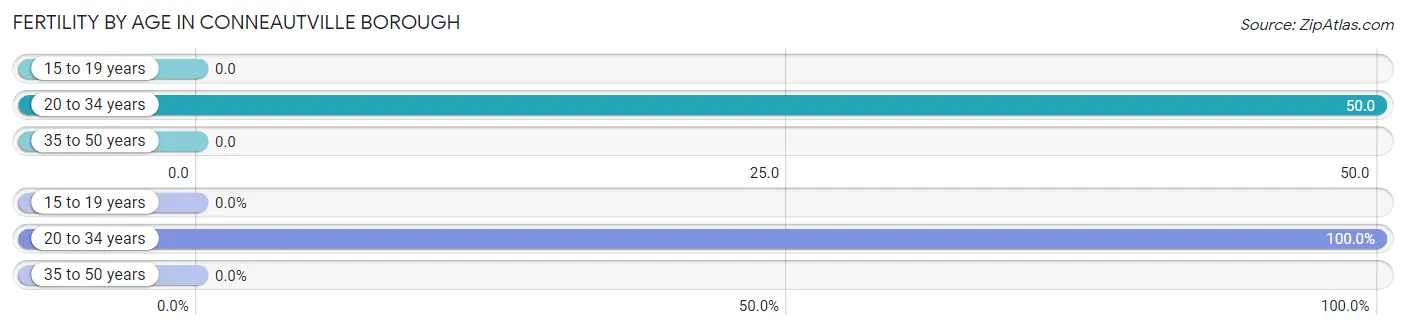
| Age Bracket | Women with Births | Births / 1,000 Women |
| 15 to 19 years | 0 (0.0%) | 0.0 |
| 20 to 34 years | 6 (100.0%) | 50.0 |
| 35 to 50 years | 0 (0.0%) | 0.0 |
| Total | 6 (100.0%) | 39.0 |
Fertility by Age by Marriage Status in Conneautville borough
66.7% of women with births (6) in Conneautville borough are married. The highest percentage of unmarried women with births falls into 20 to 34 years age bracket with 33.3% of them unmarried at the time of birth, while the lowest percentage of unmarried women with births belong to 20 to 34 years age bracket with 33.3% of them unmarried.
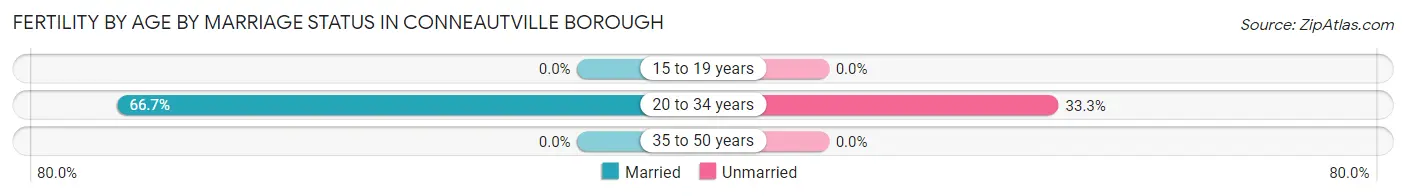
| Age Bracket | Married | Unmarried |
| 15 to 19 years | 0 (0.0%) | 0 (0.0%) |
| 20 to 34 years | 4 (66.7%) | 2 (33.3%) |
| 35 to 50 years | 0 (0.0%) | 0 (0.0%) |
| Total | 4 (66.7%) | 2 (33.3%) |
Fertility by Education in Conneautville borough
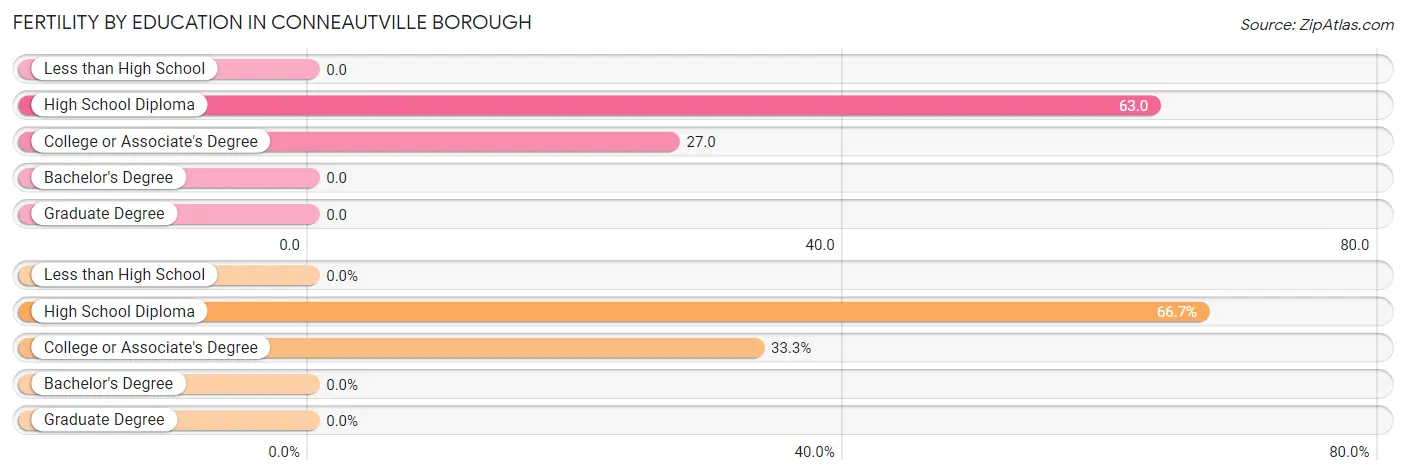
| Educational Attainment | Women with Births | Births / 1,000 Women |
| Less than High School | 0 (0.0%) | 0.0 |
| High School Diploma | 4 (66.7%) | 63.0 |
| College or Associate's Degree | 2 (33.3%) | 27.0 |
| Bachelor's Degree | 0 (0.0%) | 0.0 |
| Graduate Degree | 0 (0.0%) | 0.0 |
| Total | 6 (100.0%) | 39.0 |
Fertility by Education by Marriage Status in Conneautville borough
33.3% of women with births in Conneautville borough are unmarried. Women with the educational attainment of high school diploma are most likely to be married with 100.0% of them married at childbirth, while women with the educational attainment of college or associate's degree are least likely to be married with 100.0% of them unmarried at childbirth.
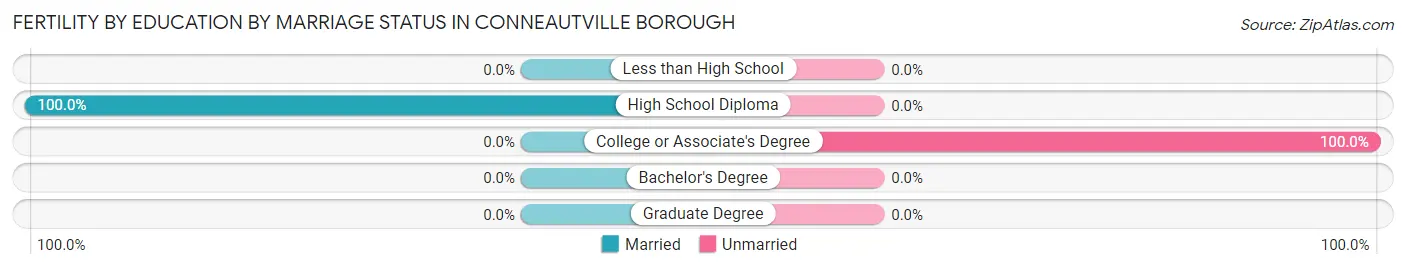
| Educational Attainment | Married | Unmarried |
| Less than High School | 0 (0.0%) | 0 (0.0%) |
| High School Diploma | 4 (100.0%) | 0 (0.0%) |
| College or Associate's Degree | 0 (0.0%) | 2 (100.0%) |
| Bachelor's Degree | 0 (0.0%) | 0 (0.0%) |
| Graduate Degree | 0 (0.0%) | 0 (0.0%) |
| Total | 4 (66.7%) | 2 (33.3%) |
Employment Characteristics in Conneautville borough
Employment by Class of Employer in Conneautville borough
Among the 295 employed individuals in Conneautville borough, private company employees (194 | 65.8%), not-for-profit organizations (59 | 20.0%), and local government employees (19 | 6.4%) make up the most common classes of employment.
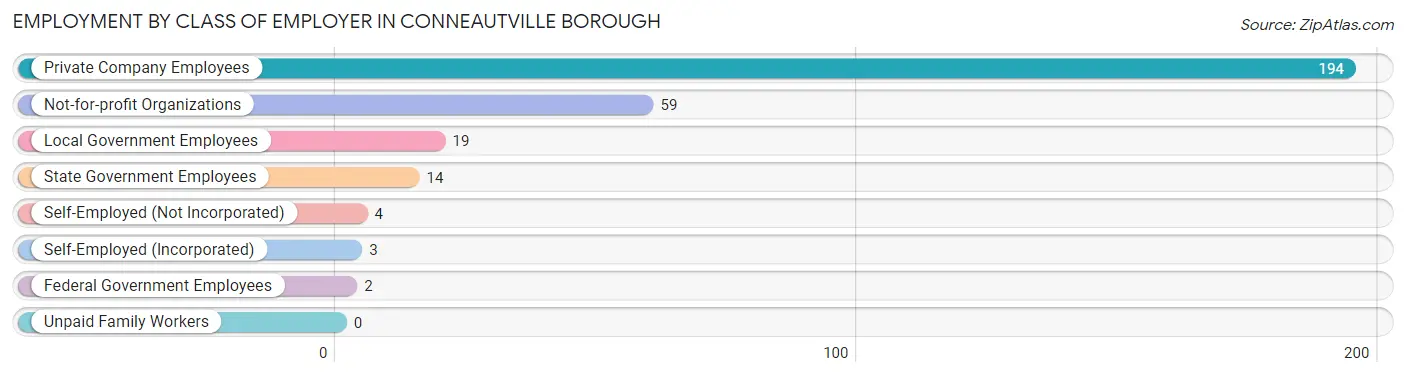
| Employer Class | # Employees | % Employees |
| Private Company Employees | 194 | 65.8% |
| Self-Employed (Incorporated) | 3 | 1.0% |
| Self-Employed (Not Incorporated) | 4 | 1.4% |
| Not-for-profit Organizations | 59 | 20.0% |
| Local Government Employees | 19 | 6.4% |
| State Government Employees | 14 | 4.8% |
| Federal Government Employees | 2 | 0.7% |
| Unpaid Family Workers | 0 | 0.0% |
| Total | 295 | 100.0% |
Employment Status by Age in Conneautville borough
According to the labor force statistics for Conneautville borough, out of the total population over 16 years of age (584), 63.7% or 372 individuals are in the labor force, with 20.7% or 77 of them unemployed. The age group with the highest labor force participation rate is 35 to 44 years, with 98.6% or 72 individuals in the labor force. Within the labor force, the 55 to 59 years age range has the highest percentage of unemployed individuals, with 70.6% or 36 of them being unemployed.
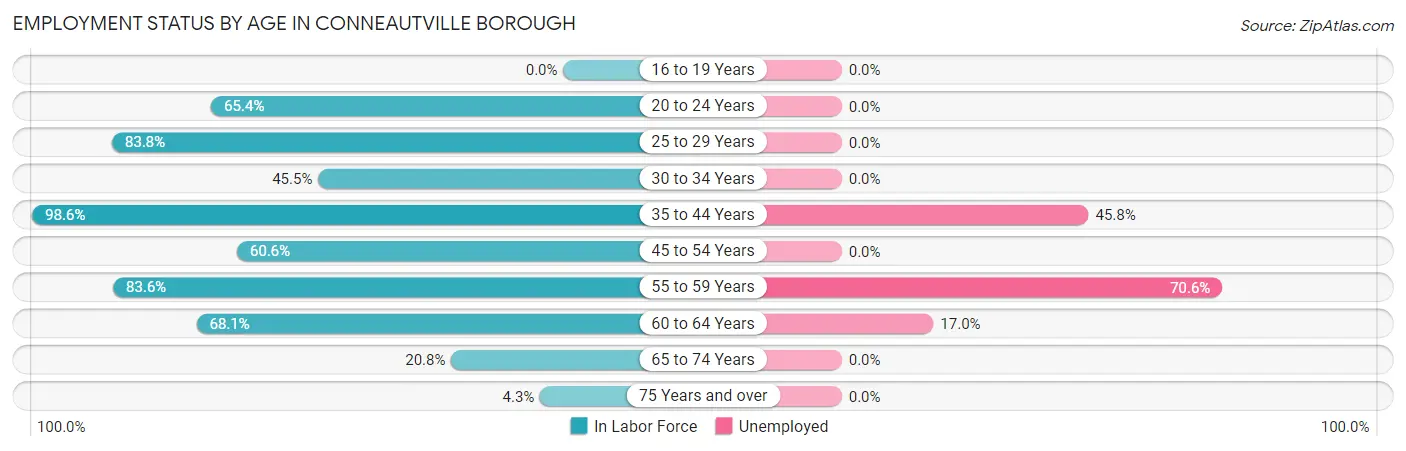
| Age Bracket | In Labor Force | Unemployed |
| 16 to 19 Years | 0 (0.0%) | 0 (0.0%) |
| 20 to 24 Years | 17 (65.4%) | 0 (0.0%) |
| 25 to 29 Years | 114 (83.8%) | 0 (0.0%) |
| 30 to 34 Years | 10 (45.5%) | 0 (0.0%) |
| 35 to 44 Years | 72 (98.6%) | 33 (45.8%) |
| 45 to 54 Years | 43 (60.6%) | 0 (0.0%) |
| 55 to 59 Years | 51 (83.6%) | 36 (70.6%) |
| 60 to 64 Years | 47 (68.1%) | 8 (17.0%) |
| 65 to 74 Years | 16 (20.8%) | 0 (0.0%) |
| 75 Years and over | 2 (4.3%) | 0 (0.0%) |
| Total | 372 (63.7%) | 77 (20.7%) |
Employment Status by Educational Attainment in Conneautville borough
According to labor force statistics for Conneautville borough, 78.0% of individuals (337) out of the total population between 25 and 64 years of age (432) are in the labor force, with 22.8% or 77 of them being unemployed. The group with the highest labor force participation rate are those with the educational attainment of bachelor's degree or higher, with 93.0% or 40 individuals in the labor force. Within the labor force, individuals with less than high school education have the highest percentage of unemployment, with 79.4% or 27 of them being unemployed.
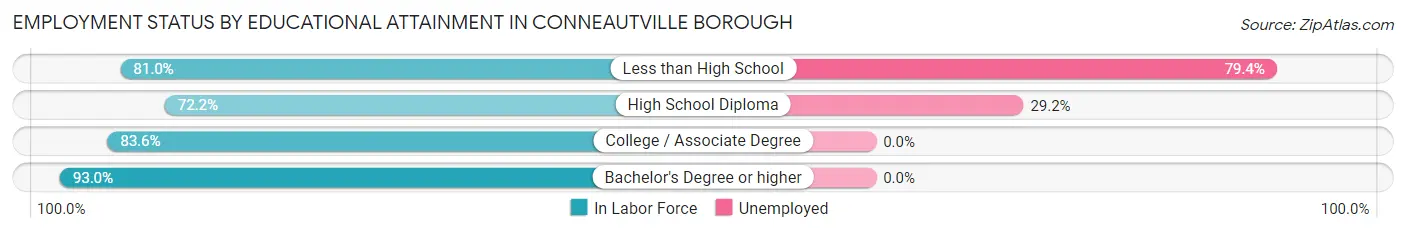
| Educational Attainment | In Labor Force | Unemployed |
| Less than High School | 34 (81.0%) | 33 (79.4%) |
| High School Diploma | 171 (72.2%) | 69 (29.2%) |
| College / Associate Degree | 92 (83.6%) | 0 (0.0%) |
| Bachelor's Degree or higher | 40 (93.0%) | 0 (0.0%) |
| Total | 337 (78.0%) | 98 (22.8%) |
Employment Occupations by Sex in Conneautville borough
Management, Business, Science and Arts Occupations
The most common Management, Business, Science and Arts occupations in Conneautville borough are Management (35 | 11.9%), Community & Social Service (20 | 6.8%), Education Instruction & Library (14 | 4.8%), Health Diagnosing & Treating (14 | 4.8%), and Computers, Engineering & Science (12 | 4.1%).
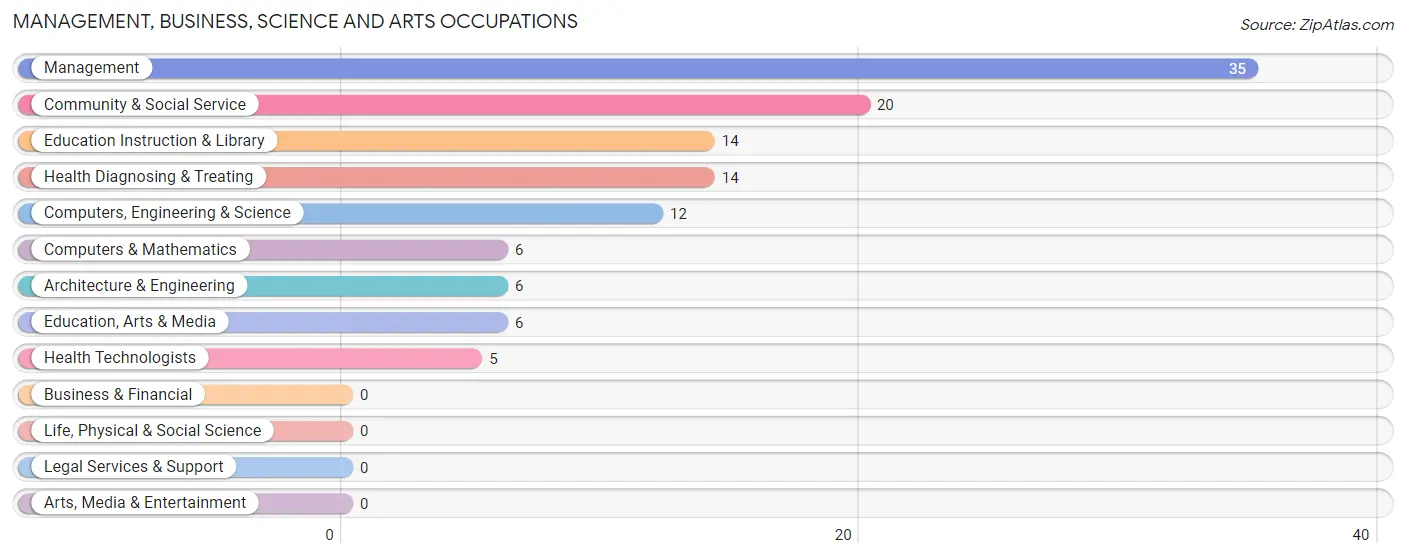
Management, Business, Science and Arts Occupations by Sex
Within the Management, Business, Science and Arts occupations in Conneautville borough, the most male-oriented occupations are Architecture & Engineering (100.0%), Computers, Engineering & Science (66.7%), and Education Instruction & Library (64.3%), while the most female-oriented occupations are Education, Arts & Media (100.0%), Health Diagnosing & Treating (100.0%), and Health Technologists (100.0%).
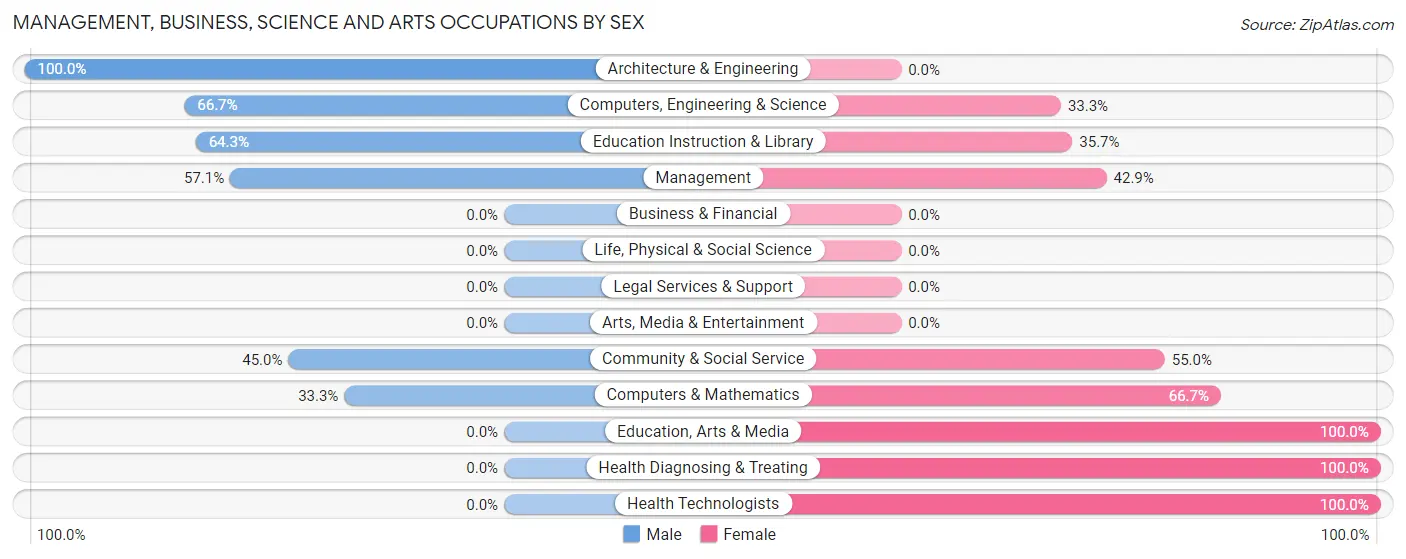
| Occupation | Male | Female |
| Management | 20 (57.1%) | 15 (42.9%) |
| Business & Financial | 0 (0.0%) | 0 (0.0%) |
| Computers, Engineering & Science | 8 (66.7%) | 4 (33.3%) |
| Computers & Mathematics | 2 (33.3%) | 4 (66.7%) |
| Architecture & Engineering | 6 (100.0%) | 0 (0.0%) |
| Life, Physical & Social Science | 0 (0.0%) | 0 (0.0%) |
| Community & Social Service | 9 (45.0%) | 11 (55.0%) |
| Education, Arts & Media | 0 (0.0%) | 6 (100.0%) |
| Legal Services & Support | 0 (0.0%) | 0 (0.0%) |
| Education Instruction & Library | 9 (64.3%) | 5 (35.7%) |
| Arts, Media & Entertainment | 0 (0.0%) | 0 (0.0%) |
| Health Diagnosing & Treating | 0 (0.0%) | 14 (100.0%) |
| Health Technologists | 0 (0.0%) | 5 (100.0%) |
| Total (Category) | 37 (45.7%) | 44 (54.3%) |
| Total (Overall) | 120 (40.7%) | 175 (59.3%) |
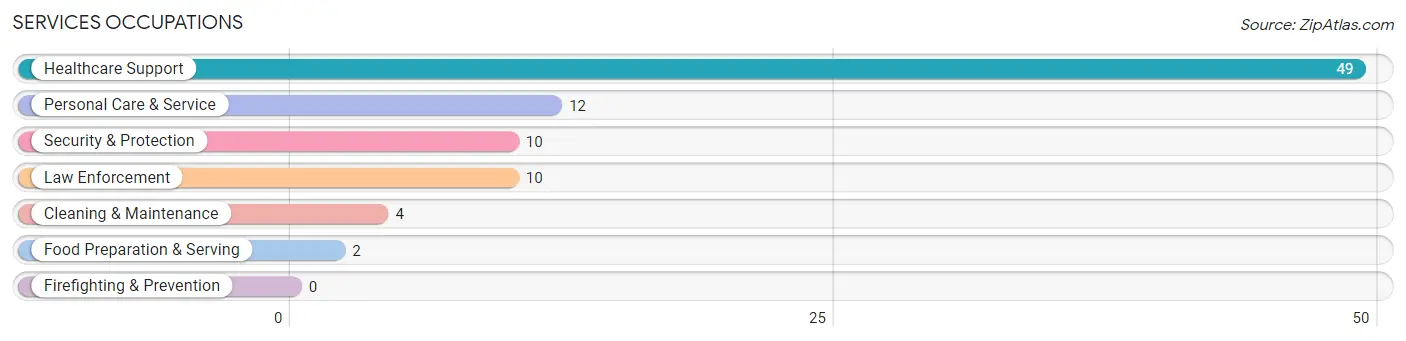
Services Occupations
The most common Services occupations in Conneautville borough are Healthcare Support (49 | 16.6%), Personal Care & Service (12 | 4.1%), Security & Protection (10 | 3.4%), Law Enforcement (10 | 3.4%), and Cleaning & Maintenance (4 | 1.4%).
Services Occupations by Sex
Within the Services occupations in Conneautville borough, the most male-oriented occupations are Security & Protection (100.0%), Law Enforcement (100.0%), and Cleaning & Maintenance (75.0%), while the most female-oriented occupations are Healthcare Support (100.0%), Food Preparation & Serving (100.0%), and Personal Care & Service (100.0%).
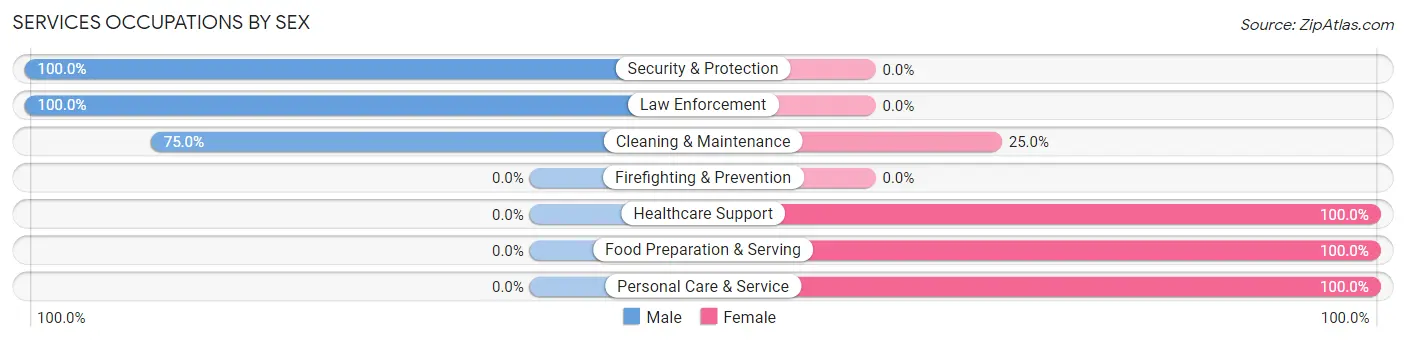
| Occupation | Male | Female |
| Healthcare Support | 0 (0.0%) | 49 (100.0%) |
| Security & Protection | 10 (100.0%) | 0 (0.0%) |
| Firefighting & Prevention | 0 (0.0%) | 0 (0.0%) |
| Law Enforcement | 10 (100.0%) | 0 (0.0%) |
| Food Preparation & Serving | 0 (0.0%) | 2 (100.0%) |
| Cleaning & Maintenance | 3 (75.0%) | 1 (25.0%) |
| Personal Care & Service | 0 (0.0%) | 12 (100.0%) |
| Total (Category) | 13 (16.9%) | 64 (83.1%) |
| Total (Overall) | 120 (40.7%) | 175 (59.3%) |
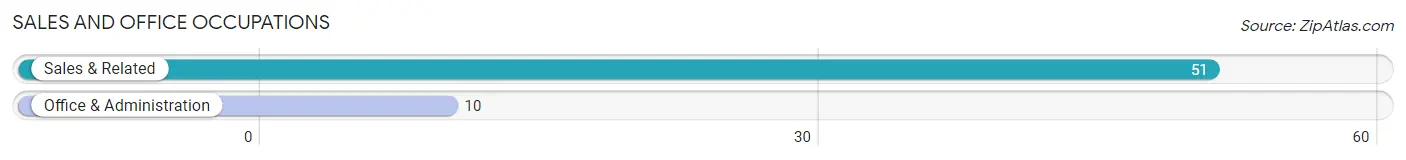
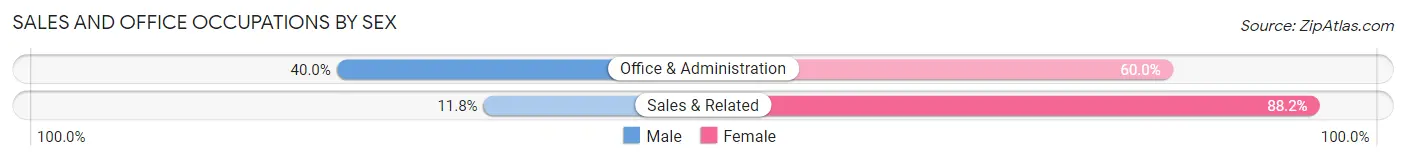
Sales and Office Occupations
The most common Sales and Office occupations in Conneautville borough are Sales & Related (51 | 17.3%), and Office & Administration (10 | 3.4%).
Sales and Office Occupations by Sex
| Occupation | Male | Female |
| Sales & Related | 6 (11.8%) | 45 (88.2%) |
| Office & Administration | 4 (40.0%) | 6 (60.0%) |
| Total (Category) | 10 (16.4%) | 51 (83.6%) |
| Total (Overall) | 120 (40.7%) | 175 (59.3%) |
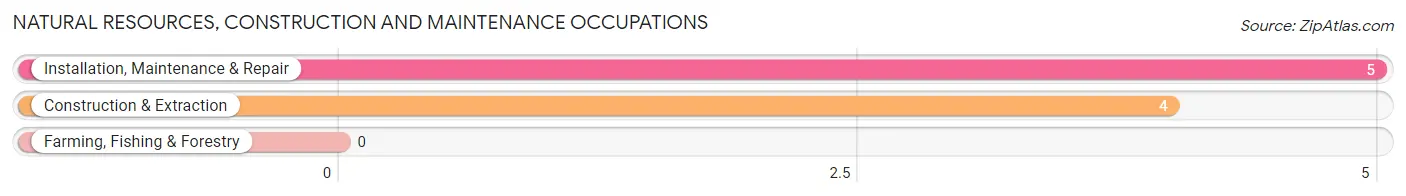
Natural Resources, Construction and Maintenance Occupations
The most common Natural Resources, Construction and Maintenance occupations in Conneautville borough are Installation, Maintenance & Repair (5 | 1.7%), and Construction & Extraction (4 | 1.4%).
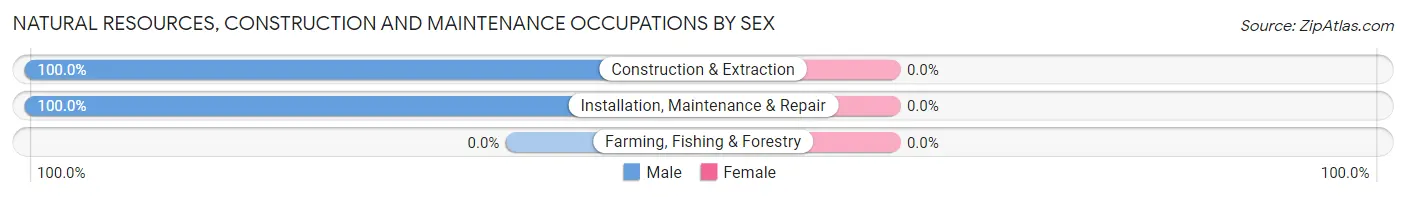
Natural Resources, Construction and Maintenance Occupations by Sex
| Occupation | Male | Female |
| Farming, Fishing & Forestry | 0 (0.0%) | 0 (0.0%) |
| Construction & Extraction | 4 (100.0%) | 0 (0.0%) |
| Installation, Maintenance & Repair | 5 (100.0%) | 0 (0.0%) |
| Total (Category) | 9 (100.0%) | 0 (0.0%) |
| Total (Overall) | 120 (40.7%) | 175 (59.3%) |
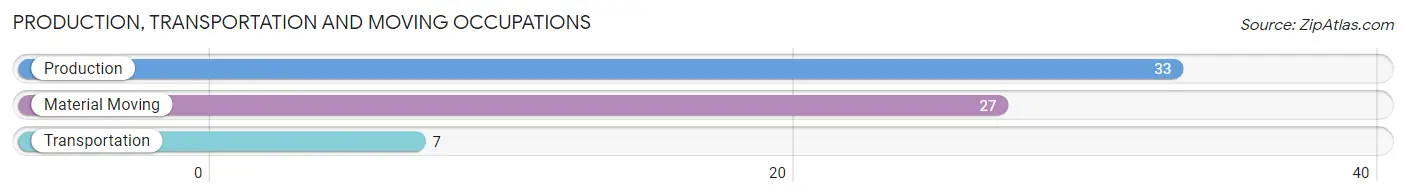
Production, Transportation and Moving Occupations
The most common Production, Transportation and Moving occupations in Conneautville borough are Production (33 | 11.2%), Material Moving (27 | 9.1%), and Transportation (7 | 2.4%).
Production, Transportation and Moving Occupations by Sex
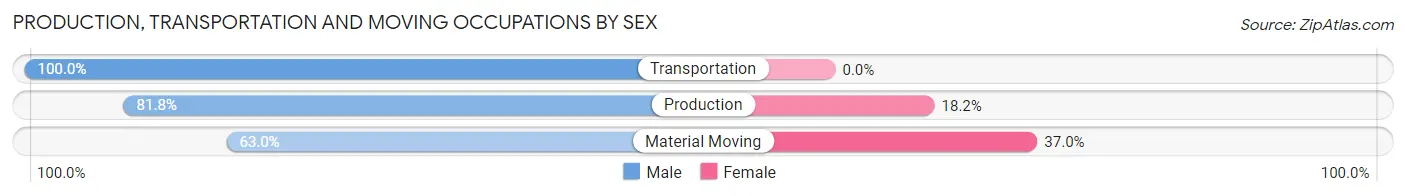
| Occupation | Male | Female |
| Production | 27 (81.8%) | 6 (18.2%) |
| Transportation | 7 (100.0%) | 0 (0.0%) |
| Material Moving | 17 (63.0%) | 10 (37.0%) |
| Total (Category) | 51 (76.1%) | 16 (23.9%) |
| Total (Overall) | 120 (40.7%) | 175 (59.3%) |
Employment Industries by Sex in Conneautville borough
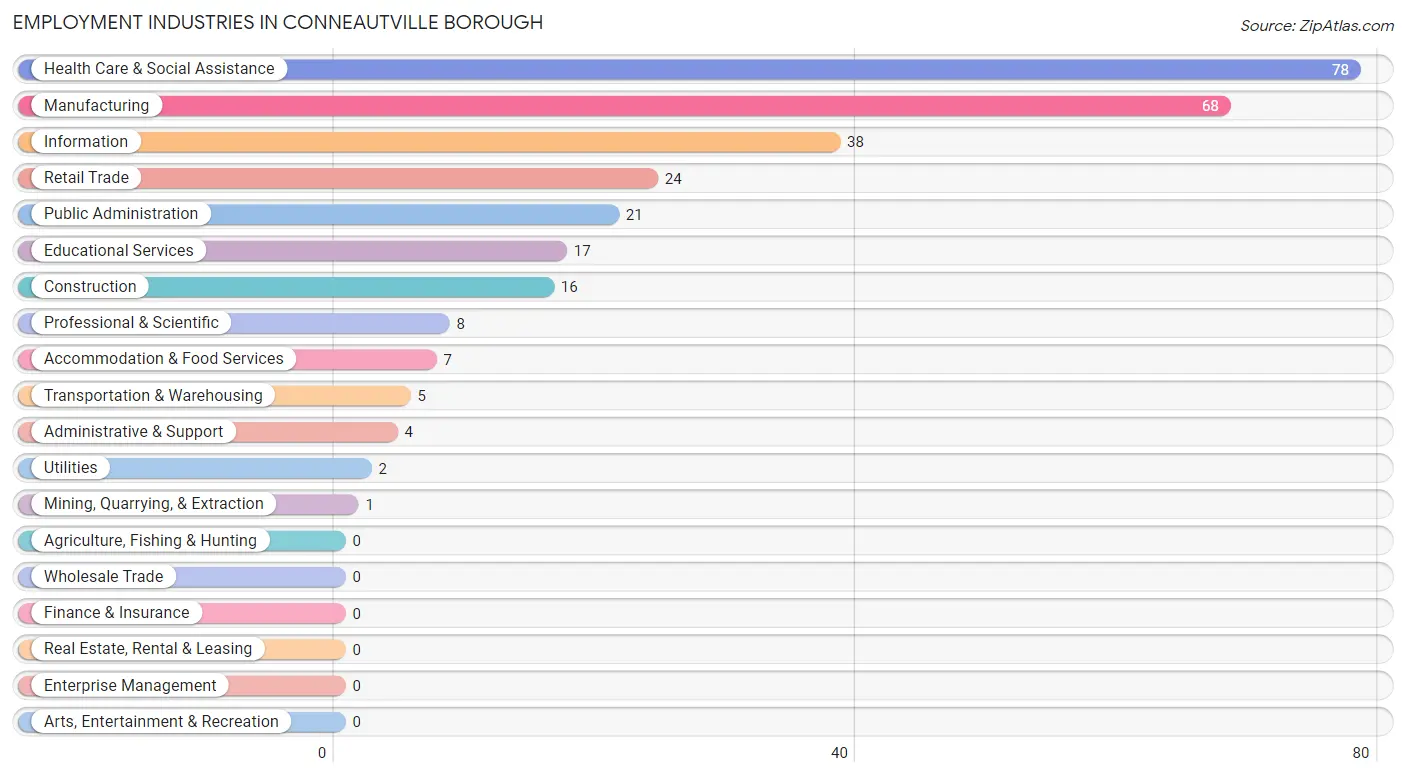
Employment Industries in Conneautville borough
The major employment industries in Conneautville borough include Health Care & Social Assistance (78 | 26.4%), Manufacturing (68 | 23.1%), Information (38 | 12.9%), Retail Trade (24 | 8.1%), and Public Administration (21 | 7.1%).
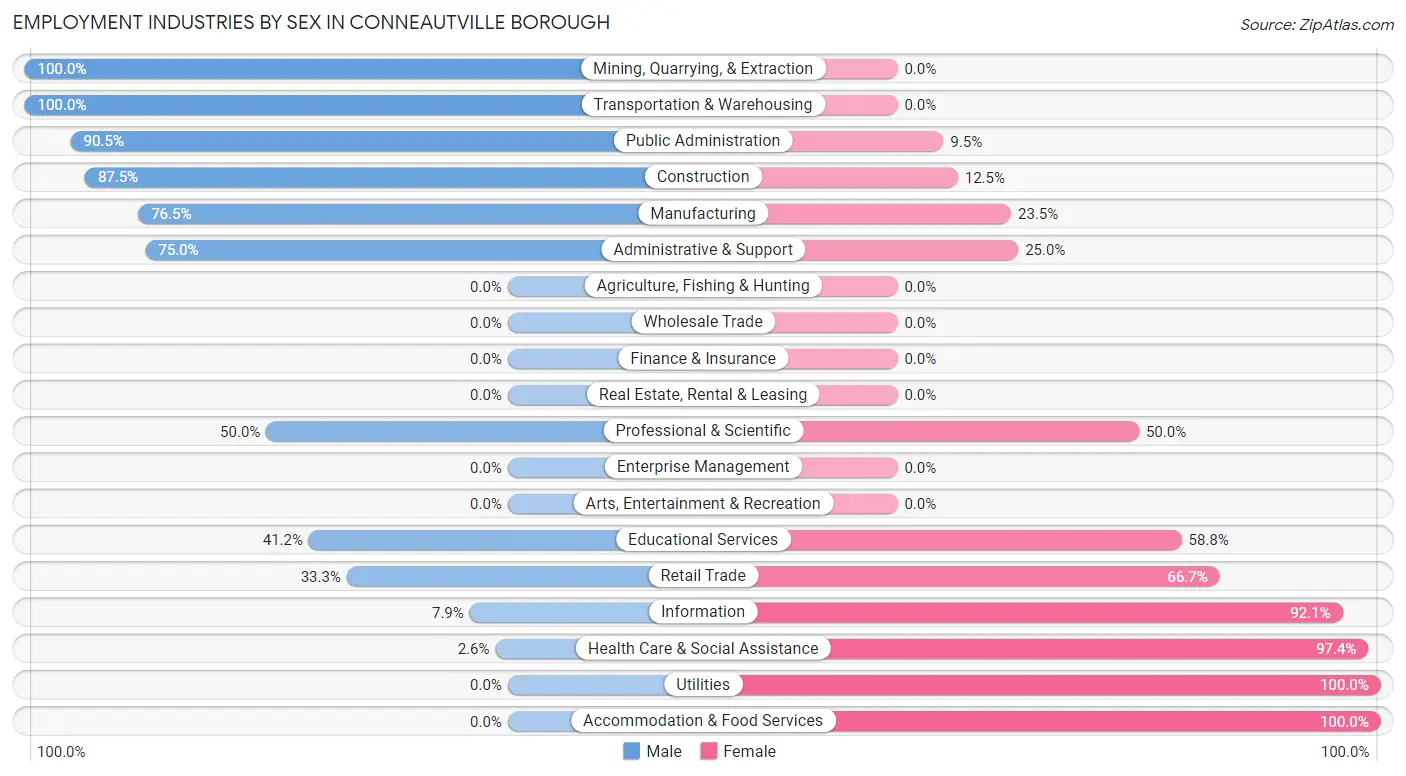
Employment Industries by Sex in Conneautville borough
The Conneautville borough industries that see more men than women are Mining, Quarrying, & Extraction (100.0%), Transportation & Warehousing (100.0%), and Public Administration (90.5%), whereas the industries that tend to have a higher number of women are Utilities (100.0%), Accommodation & Food Services (100.0%), and Health Care & Social Assistance (97.4%).
| Industry | Male | Female |
| Agriculture, Fishing & Hunting | 0 (0.0%) | 0 (0.0%) |
| Mining, Quarrying, & Extraction | 1 (100.0%) | 0 (0.0%) |
| Construction | 14 (87.5%) | 2 (12.5%) |
| Manufacturing | 52 (76.5%) | 16 (23.5%) |
| Wholesale Trade | 0 (0.0%) | 0 (0.0%) |
| Retail Trade | 8 (33.3%) | 16 (66.7%) |
| Transportation & Warehousing | 5 (100.0%) | 0 (0.0%) |
| Utilities | 0 (0.0%) | 2 (100.0%) |
| Information | 3 (7.9%) | 35 (92.1%) |
| Finance & Insurance | 0 (0.0%) | 0 (0.0%) |
| Real Estate, Rental & Leasing | 0 (0.0%) | 0 (0.0%) |
| Professional & Scientific | 4 (50.0%) | 4 (50.0%) |
| Enterprise Management | 0 (0.0%) | 0 (0.0%) |
| Administrative & Support | 3 (75.0%) | 1 (25.0%) |
| Educational Services | 7 (41.2%) | 10 (58.8%) |
| Health Care & Social Assistance | 2 (2.6%) | 76 (97.4%) |
| Arts, Entertainment & Recreation | 0 (0.0%) | 0 (0.0%) |
| Accommodation & Food Services | 0 (0.0%) | 7 (100.0%) |
| Public Administration | 19 (90.5%) | 2 (9.5%) |
| Total | 120 (40.7%) | 175 (59.3%) |
Education in Conneautville borough
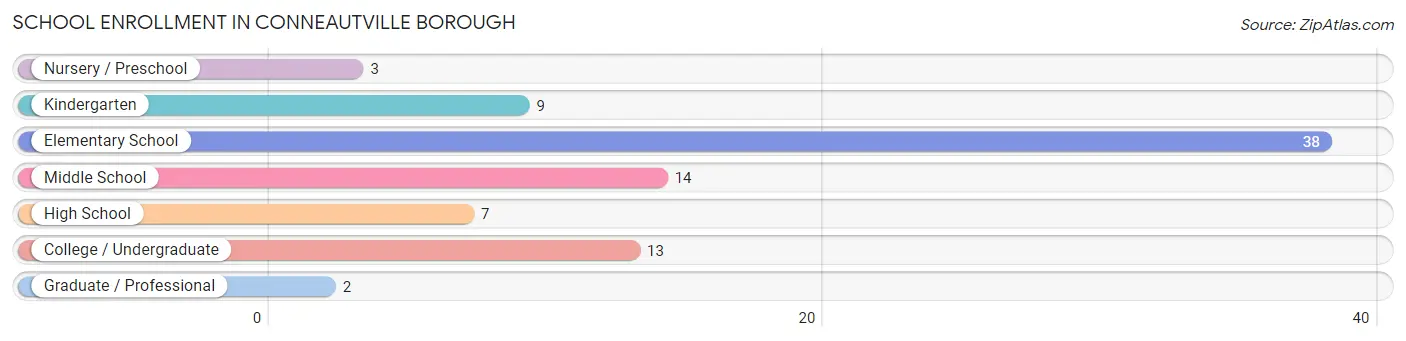
School Enrollment in Conneautville borough
The most common levels of schooling among the 86 students in Conneautville borough are elementary school (38 | 44.2%), middle school (14 | 16.3%), and college / undergraduate (13 | 15.1%).
| School Level | # Students | % Students |
| Nursery / Preschool | 3 | 3.5% |
| Kindergarten | 9 | 10.5% |
| Elementary School | 38 | 44.2% |
| Middle School | 14 | 16.3% |
| High School | 7 | 8.1% |
| College / Undergraduate | 13 | 15.1% |
| Graduate / Professional | 2 | 2.3% |
| Total | 86 | 100.0% |
School Enrollment by Age by Funding Source in Conneautville borough
Out of a total of 86 students who are enrolled in schools in Conneautville borough, 7 (8.1%) attend a private institution, while the remaining 79 (91.9%) are enrolled in public schools. The age group of 18 to 19 year olds has the highest likelihood of being enrolled in private schools, with 2 (100.0% in the age bracket) enrolled. Conversely, the age group of 3 to 4 year olds has the lowest likelihood of being enrolled in a private school, with 3 (100.0% in the age bracket) attending a public institution.
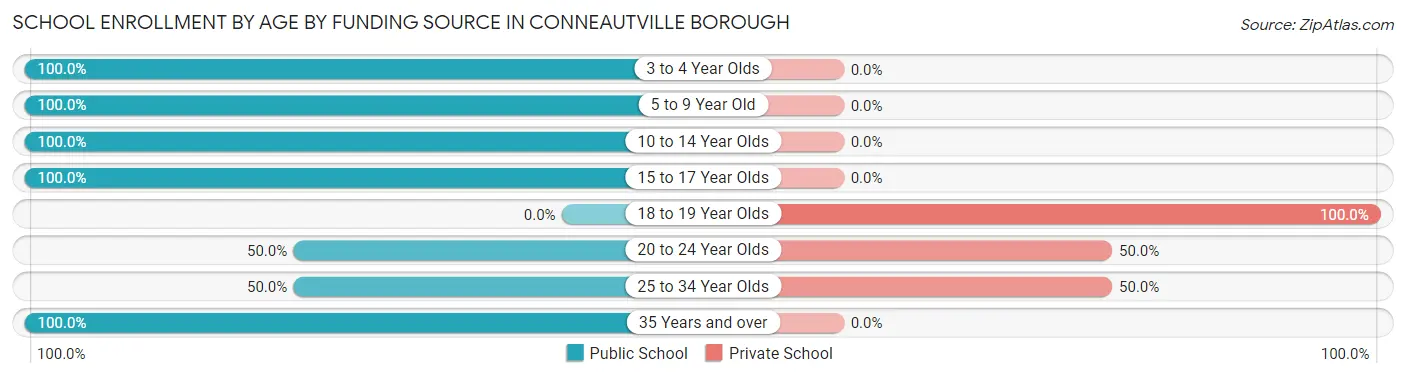
| Age Bracket | Public School | Private School |
| 3 to 4 Year Olds | 3 (100.0%) | 0 (0.0%) |
| 5 to 9 Year Old | 45 (100.0%) | 0 (0.0%) |
| 10 to 14 Year Olds | 16 (100.0%) | 0 (0.0%) |
| 15 to 17 Year Olds | 7 (100.0%) | 0 (0.0%) |
| 18 to 19 Year Olds | 0 (0.0%) | 2 (100.0%) |
| 20 to 24 Year Olds | 3 (50.0%) | 3 (50.0%) |
| 25 to 34 Year Olds | 2 (50.0%) | 2 (50.0%) |
| 35 Years and over | 3 (100.0%) | 0 (0.0%) |
| Total | 79 (91.9%) | 7 (8.1%) |
Educational Attainment by Field of Study in Conneautville borough
Education (14 | 22.6%), computers & mathematics (11 | 17.7%), science & technology (11 | 17.7%), business (11 | 17.7%), and communications (4 | 6.5%) are the most common fields of study among 62 individuals in Conneautville borough who have obtained a bachelor's degree or higher.
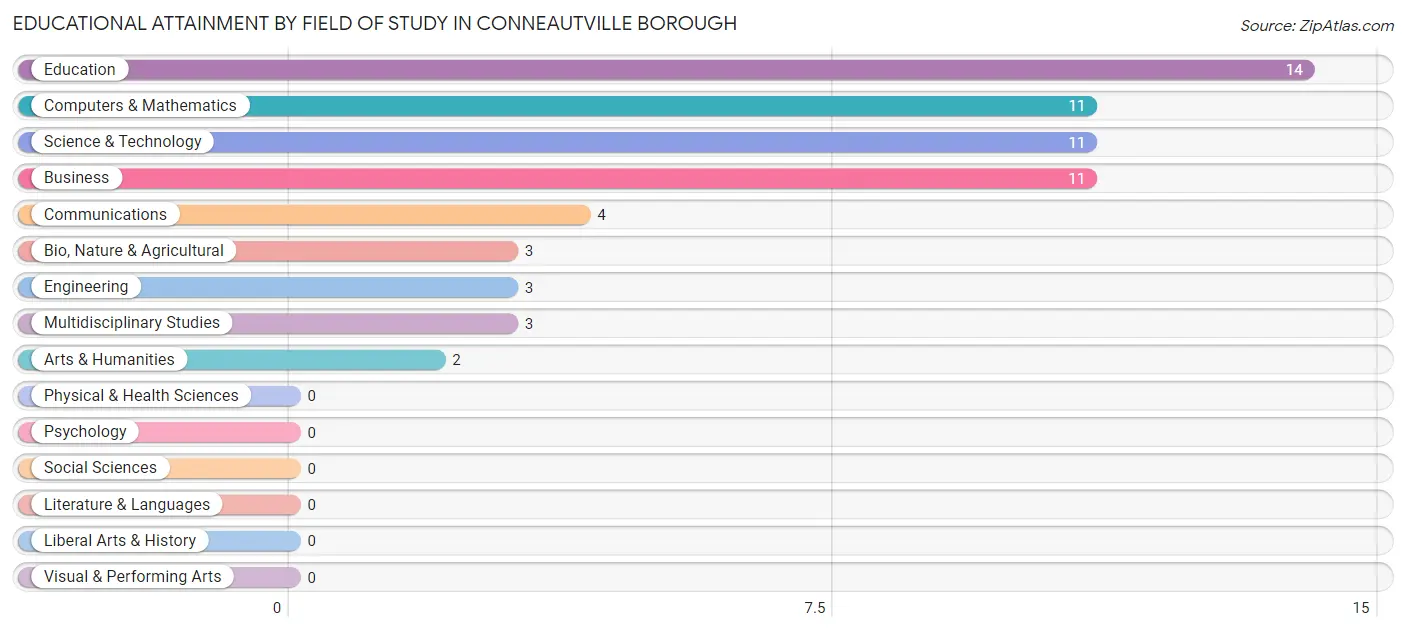
| Field of Study | # Graduates | % Graduates |
| Computers & Mathematics | 11 | 17.7% |
| Bio, Nature & Agricultural | 3 | 4.8% |
| Physical & Health Sciences | 0 | 0.0% |
| Psychology | 0 | 0.0% |
| Social Sciences | 0 | 0.0% |
| Engineering | 3 | 4.8% |
| Multidisciplinary Studies | 3 | 4.8% |
| Science & Technology | 11 | 17.7% |
| Business | 11 | 17.7% |
| Education | 14 | 22.6% |
| Literature & Languages | 0 | 0.0% |
| Liberal Arts & History | 0 | 0.0% |
| Visual & Performing Arts | 0 | 0.0% |
| Communications | 4 | 6.5% |
| Arts & Humanities | 2 | 3.2% |
| Total | 62 | 100.0% |
Transportation & Commute in Conneautville borough
Vehicle Availability by Sex in Conneautville borough
The most prevalent vehicle ownership categories in Conneautville borough are males with 2 vehicles (75, accounting for 62.5%) and females with 2 vehicles (103, making up 42.9%).
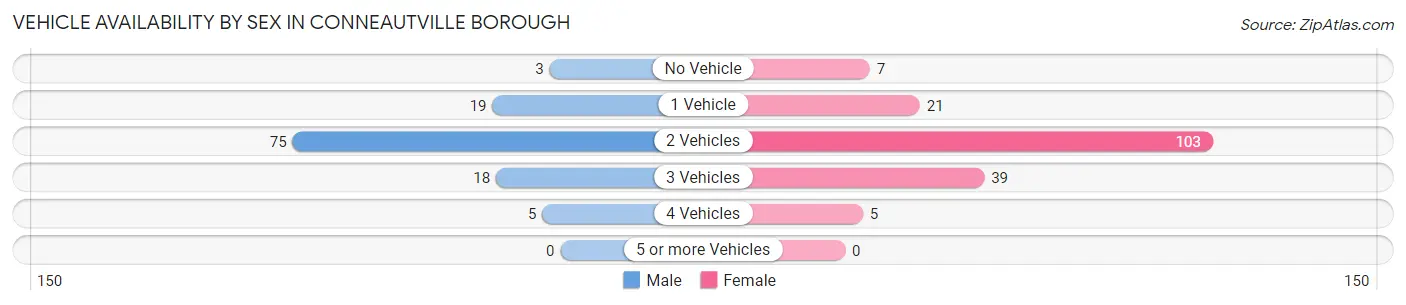
| Vehicles Available | Male | Female |
| No Vehicle | 3 (2.5%) | 7 (4.0%) |
| 1 Vehicle | 19 (15.8%) | 21 (12.0%) |
| 2 Vehicles | 75 (62.5%) | 103 (58.9%) |
| 3 Vehicles | 18 (15.0%) | 39 (22.3%) |
| 4 Vehicles | 5 (4.2%) | 5 (2.9%) |
| 5 or more Vehicles | 0 (0.0%) | 0 (0.0%) |
| Total | 120 (100.0%) | 175 (100.0%) |
Commute Time in Conneautville borough
The most frequently occuring commute durations in Conneautville borough are 25 to 29 minutes (64 commuters, 22.2%), 30 to 34 minutes (64 commuters, 22.2%), and less than 5 minutes (45 commuters, 15.6%).
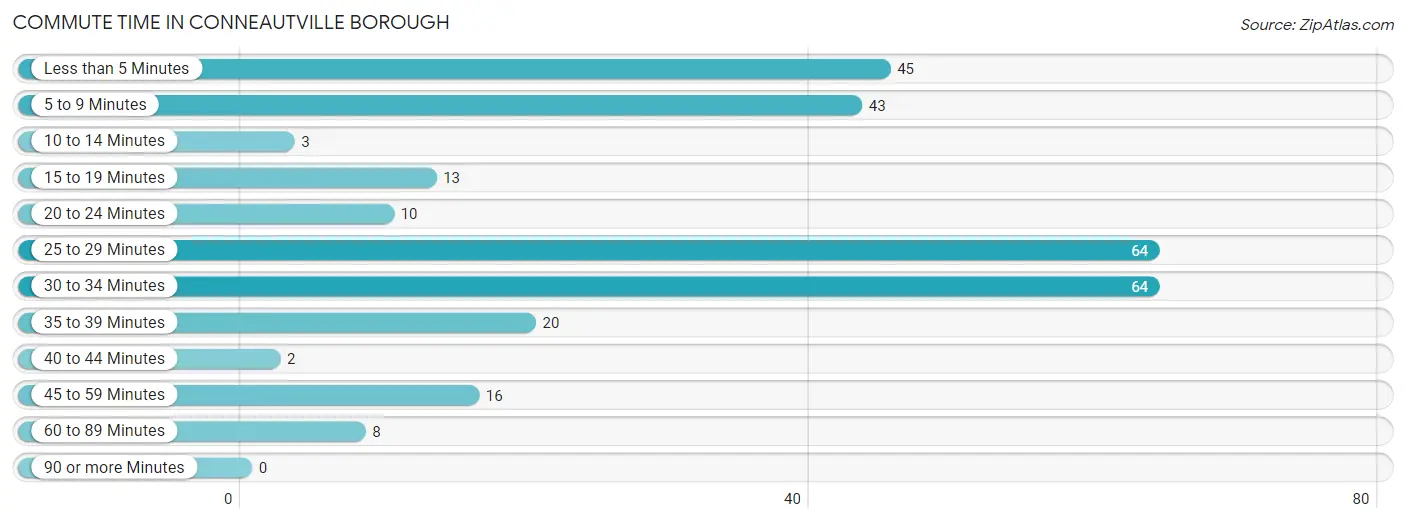
| Commute Time | # Commuters | % Commuters |
| Less than 5 Minutes | 45 | 15.6% |
| 5 to 9 Minutes | 43 | 14.9% |
| 10 to 14 Minutes | 3 | 1.0% |
| 15 to 19 Minutes | 13 | 4.5% |
| 20 to 24 Minutes | 10 | 3.5% |
| 25 to 29 Minutes | 64 | 22.2% |
| 30 to 34 Minutes | 64 | 22.2% |
| 35 to 39 Minutes | 20 | 6.9% |
| 40 to 44 Minutes | 2 | 0.7% |
| 45 to 59 Minutes | 16 | 5.6% |
| 60 to 89 Minutes | 8 | 2.8% |
| 90 or more Minutes | 0 | 0.0% |
Commute Time by Sex in Conneautville borough
The most common commute times in Conneautville borough are 30 to 34 minutes (30 commuters, 26.1%) for males and 25 to 29 minutes (50 commuters, 28.9%) for females.
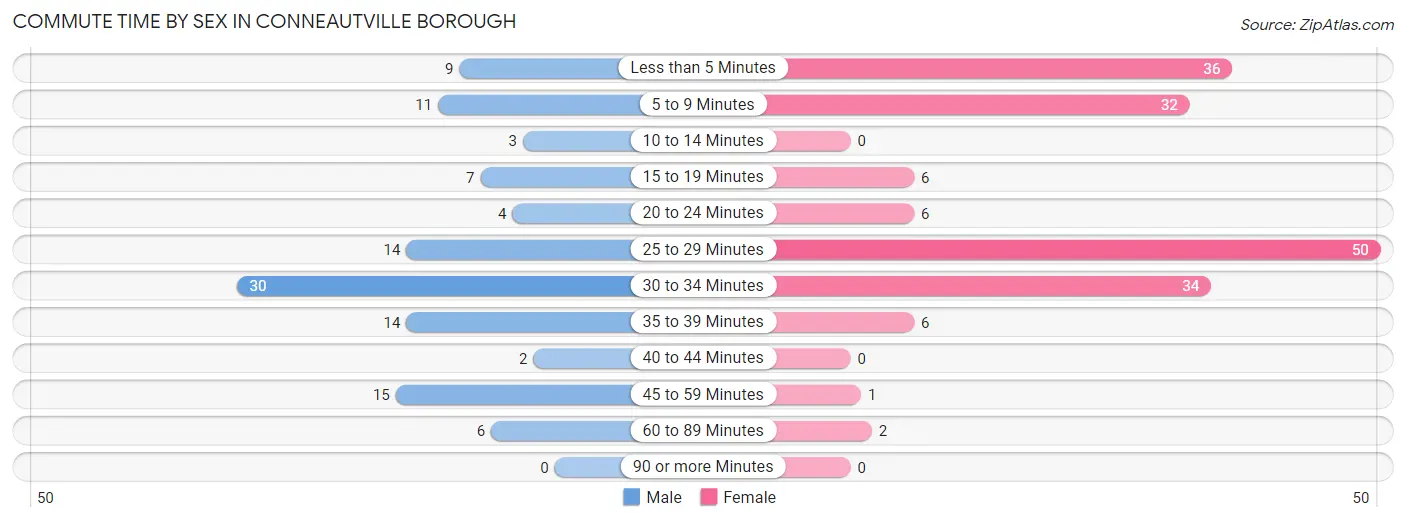
| Commute Time | Male | Female |
| Less than 5 Minutes | 9 (7.8%) | 36 (20.8%) |
| 5 to 9 Minutes | 11 (9.6%) | 32 (18.5%) |
| 10 to 14 Minutes | 3 (2.6%) | 0 (0.0%) |
| 15 to 19 Minutes | 7 (6.1%) | 6 (3.5%) |
| 20 to 24 Minutes | 4 (3.5%) | 6 (3.5%) |
| 25 to 29 Minutes | 14 (12.2%) | 50 (28.9%) |
| 30 to 34 Minutes | 30 (26.1%) | 34 (19.7%) |
| 35 to 39 Minutes | 14 (12.2%) | 6 (3.5%) |
| 40 to 44 Minutes | 2 (1.7%) | 0 (0.0%) |
| 45 to 59 Minutes | 15 (13.0%) | 1 (0.6%) |
| 60 to 89 Minutes | 6 (5.2%) | 2 (1.2%) |
| 90 or more Minutes | 0 (0.0%) | 0 (0.0%) |
Time of Departure to Work by Sex in Conneautville borough
The most frequent times of departure to work in Conneautville borough are 5:30 AM to 5:59 AM (23, 20.0%) for males and 4:00 PM to 11:59 PM (80, 46.2%) for females.
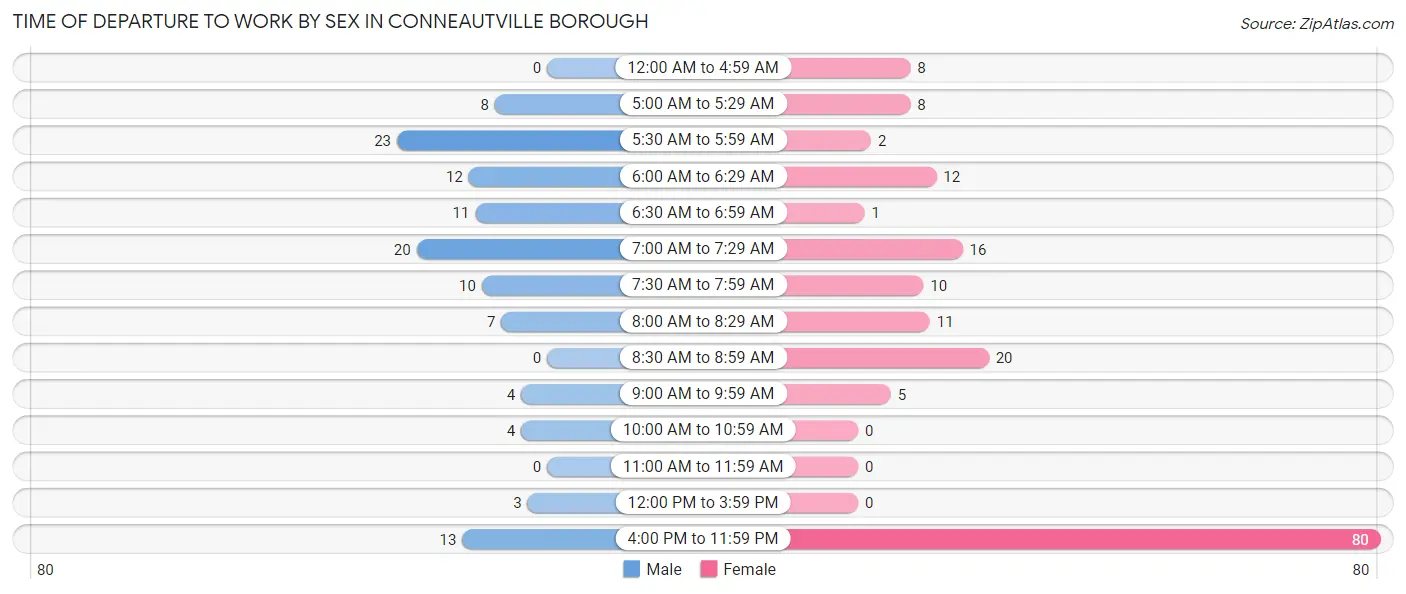
| Time of Departure | Male | Female |
| 12:00 AM to 4:59 AM | 0 (0.0%) | 8 (4.6%) |
| 5:00 AM to 5:29 AM | 8 (7.0%) | 8 (4.6%) |
| 5:30 AM to 5:59 AM | 23 (20.0%) | 2 (1.2%) |
| 6:00 AM to 6:29 AM | 12 (10.4%) | 12 (6.9%) |
| 6:30 AM to 6:59 AM | 11 (9.6%) | 1 (0.6%) |
| 7:00 AM to 7:29 AM | 20 (17.4%) | 16 (9.2%) |
| 7:30 AM to 7:59 AM | 10 (8.7%) | 10 (5.8%) |
| 8:00 AM to 8:29 AM | 7 (6.1%) | 11 (6.4%) |
| 8:30 AM to 8:59 AM | 0 (0.0%) | 20 (11.6%) |
| 9:00 AM to 9:59 AM | 4 (3.5%) | 5 (2.9%) |
| 10:00 AM to 10:59 AM | 4 (3.5%) | 0 (0.0%) |
| 11:00 AM to 11:59 AM | 0 (0.0%) | 0 (0.0%) |
| 12:00 PM to 3:59 PM | 3 (2.6%) | 0 (0.0%) |
| 4:00 PM to 11:59 PM | 13 (11.3%) | 80 (46.2%) |
| Total | 115 (100.0%) | 173 (100.0%) |
Housing Occupancy in Conneautville borough
Occupancy by Ownership in Conneautville borough
Of the total 302 dwellings in Conneautville borough, owner-occupied units account for 174 (57.6%), while renter-occupied units make up 128 (42.4%).
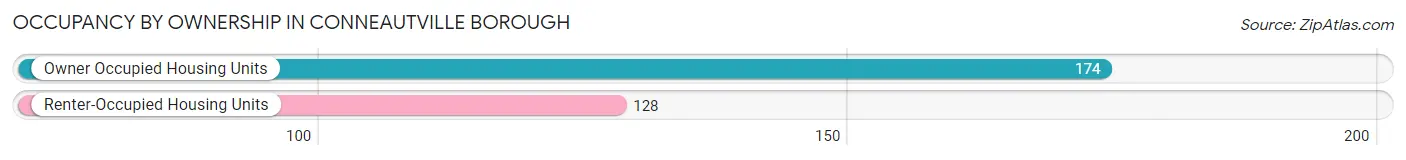
| Occupancy | # Housing Units | % Housing Units |
| Owner Occupied Housing Units | 174 | 57.6% |
| Renter-Occupied Housing Units | 128 | 42.4% |
| Total Occupied Housing Units | 302 | 100.0% |
Occupancy by Household Size in Conneautville borough
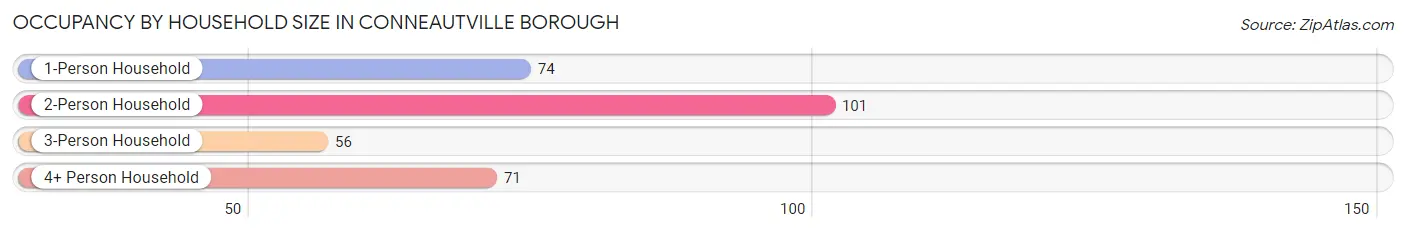
| Household Size | # Housing Units | % Housing Units |
| 1-Person Household | 74 | 24.5% |
| 2-Person Household | 101 | 33.4% |
| 3-Person Household | 56 | 18.5% |
| 4+ Person Household | 71 | 23.5% |
| Total Housing Units | 302 | 100.0% |
Occupancy by Ownership by Household Size in Conneautville borough
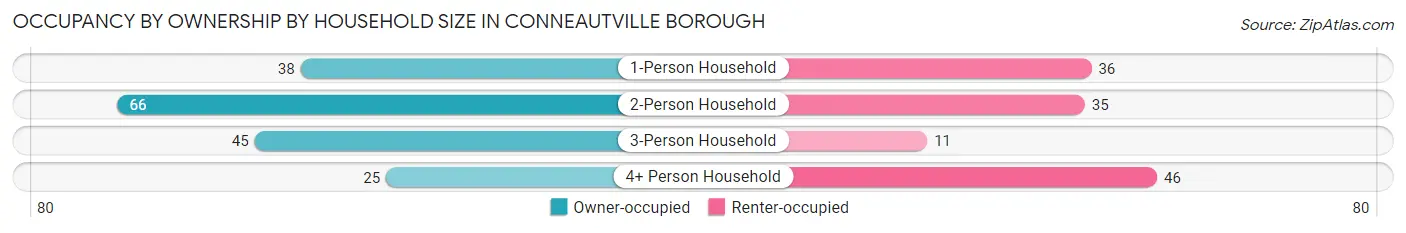
| Household Size | Owner-occupied | Renter-occupied |
| 1-Person Household | 38 (51.3%) | 36 (48.6%) |
| 2-Person Household | 66 (65.3%) | 35 (34.6%) |
| 3-Person Household | 45 (80.4%) | 11 (19.6%) |
| 4+ Person Household | 25 (35.2%) | 46 (64.8%) |
| Total Housing Units | 174 (57.6%) | 128 (42.4%) |
Occupancy by Educational Attainment in Conneautville borough
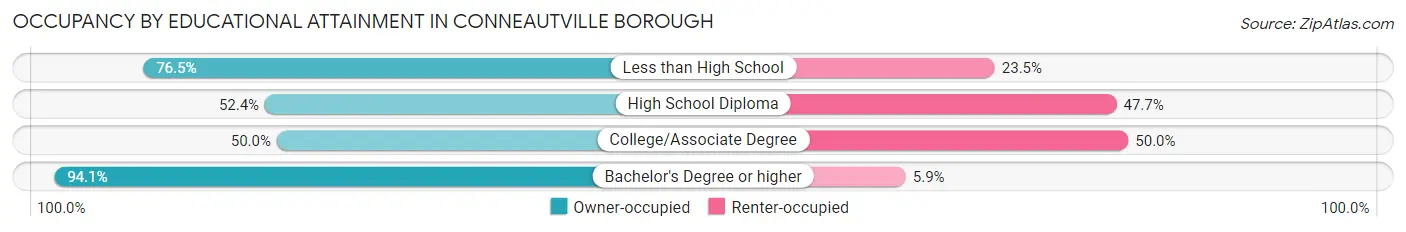
| Household Size | Owner-occupied | Renter-occupied |
| Less than High School | 13 (76.5%) | 4 (23.5%) |
| High School Diploma | 78 (52.3%) | 71 (47.6%) |
| College/Associate Degree | 51 (50.0%) | 51 (50.0%) |
| Bachelor's Degree or higher | 32 (94.1%) | 2 (5.9%) |
Occupancy by Age of Householder in Conneautville borough
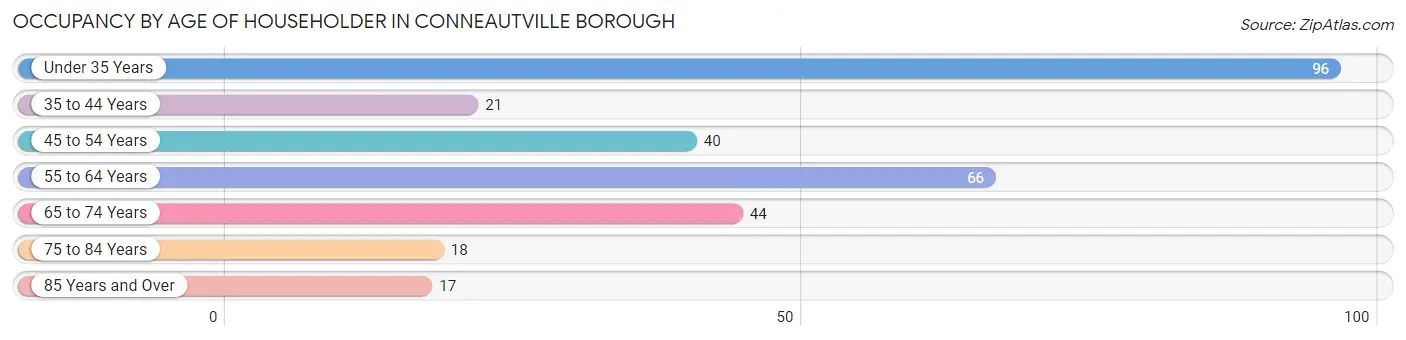
| Age Bracket | # Households | % Households |
| Under 35 Years | 96 | 31.8% |
| 35 to 44 Years | 21 | 7.0% |
| 45 to 54 Years | 40 | 13.3% |
| 55 to 64 Years | 66 | 21.8% |
| 65 to 74 Years | 44 | 14.6% |
| 75 to 84 Years | 18 | 6.0% |
| 85 Years and Over | 17 | 5.6% |
| Total | 302 | 100.0% |
Housing Finances in Conneautville borough
Median Income by Occupancy in Conneautville borough
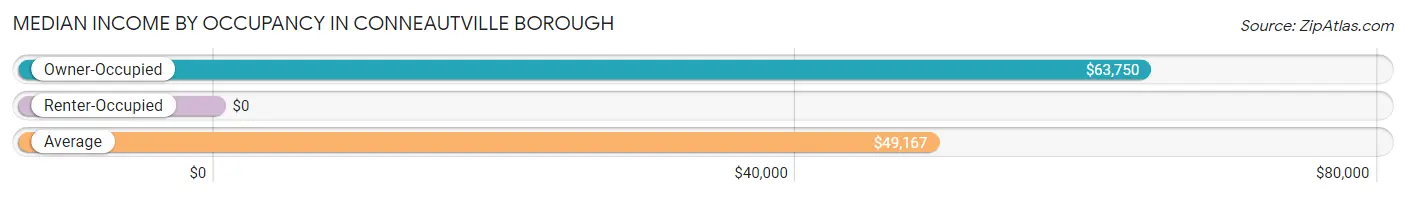
| Occupancy Type | # Households | Median Income |
| Owner-Occupied | 174 (57.6%) | $63,750 |
| Renter-Occupied | 128 (42.4%) | $0 |
| Average | 302 (100.0%) | $49,167 |
Occupancy by Householder Income Bracket in Conneautville borough
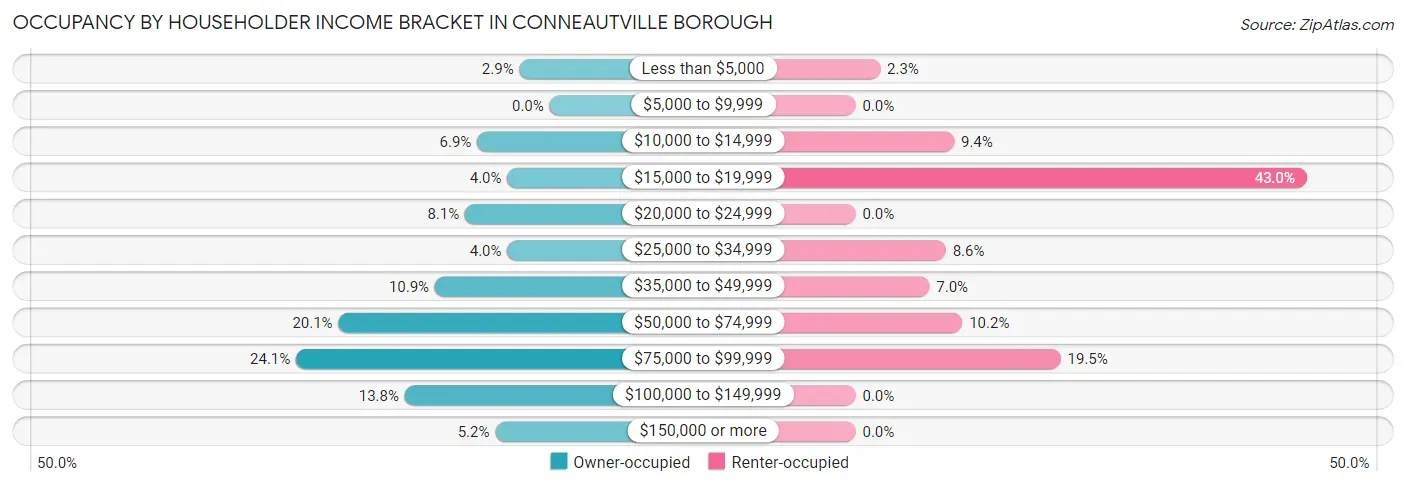
| Income Bracket | Owner-occupied | Renter-occupied |
| Less than $5,000 | 5 (2.9%) | 3 (2.3%) |
| $5,000 to $9,999 | 0 (0.0%) | 0 (0.0%) |
| $10,000 to $14,999 | 12 (6.9%) | 12 (9.4%) |
| $15,000 to $19,999 | 7 (4.0%) | 55 (43.0%) |
| $20,000 to $24,999 | 14 (8.1%) | 0 (0.0%) |
| $25,000 to $34,999 | 7 (4.0%) | 11 (8.6%) |
| $35,000 to $49,999 | 19 (10.9%) | 9 (7.0%) |
| $50,000 to $74,999 | 35 (20.1%) | 13 (10.2%) |
| $75,000 to $99,999 | 42 (24.1%) | 25 (19.5%) |
| $100,000 to $149,999 | 24 (13.8%) | 0 (0.0%) |
| $150,000 or more | 9 (5.2%) | 0 (0.0%) |
| Total | 174 (100.0%) | 128 (100.0%) |
Monthly Housing Cost Tiers in Conneautville borough
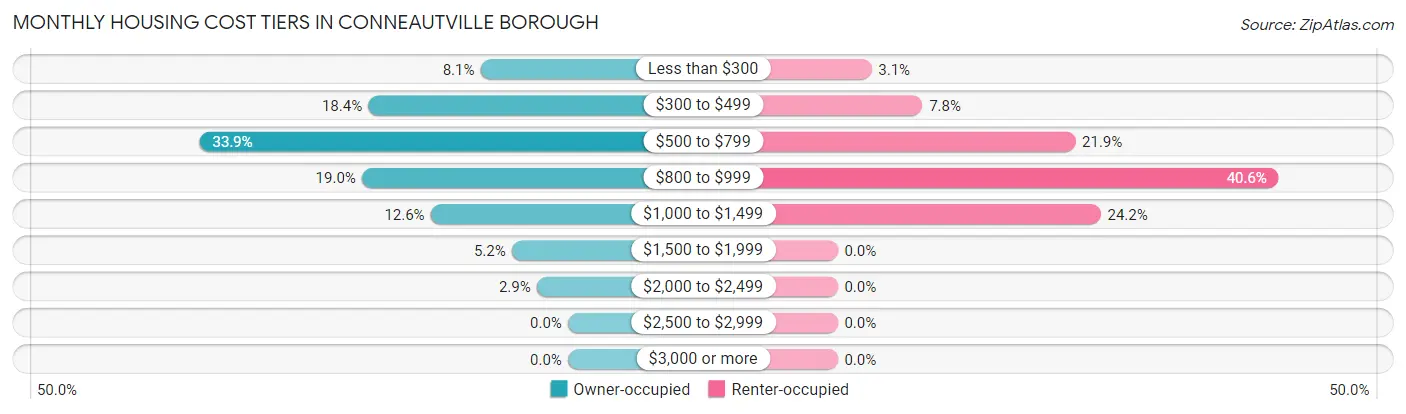
| Monthly Cost | Owner-occupied | Renter-occupied |
| Less than $300 | 14 (8.1%) | 4 (3.1%) |
| $300 to $499 | 32 (18.4%) | 10 (7.8%) |
| $500 to $799 | 59 (33.9%) | 28 (21.9%) |
| $800 to $999 | 33 (19.0%) | 52 (40.6%) |
| $1,000 to $1,499 | 22 (12.6%) | 31 (24.2%) |
| $1,500 to $1,999 | 9 (5.2%) | 0 (0.0%) |
| $2,000 to $2,499 | 5 (2.9%) | 0 (0.0%) |
| $2,500 to $2,999 | 0 (0.0%) | 0 (0.0%) |
| $3,000 or more | 0 (0.0%) | 0 (0.0%) |
| Total | 174 (100.0%) | 128 (100.0%) |
Physical Housing Characteristics in Conneautville borough
Housing Structures in Conneautville borough
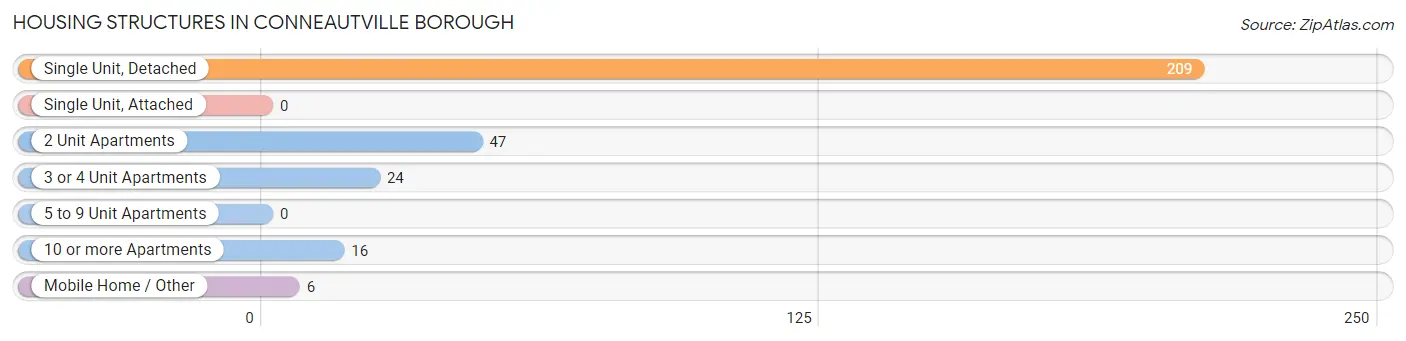
| Structure Type | # Housing Units | % Housing Units |
| Single Unit, Detached | 209 | 69.2% |
| Single Unit, Attached | 0 | 0.0% |
| 2 Unit Apartments | 47 | 15.6% |
| 3 or 4 Unit Apartments | 24 | 8.0% |
| 5 to 9 Unit Apartments | 0 | 0.0% |
| 10 or more Apartments | 16 | 5.3% |
| Mobile Home / Other | 6 | 2.0% |
| Total | 302 | 100.0% |
Housing Structures by Occupancy in Conneautville borough
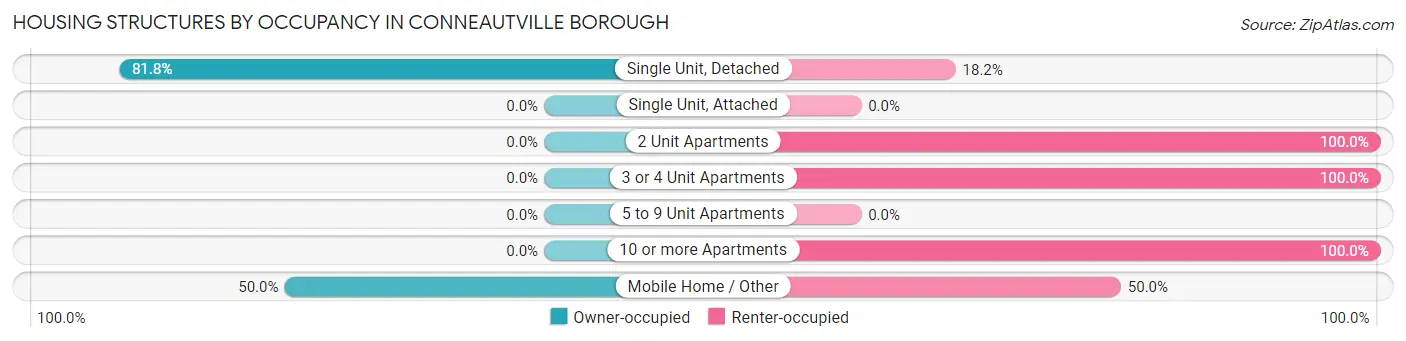
| Structure Type | Owner-occupied | Renter-occupied |
| Single Unit, Detached | 171 (81.8%) | 38 (18.2%) |
| Single Unit, Attached | 0 (0.0%) | 0 (0.0%) |
| 2 Unit Apartments | 0 (0.0%) | 47 (100.0%) |
| 3 or 4 Unit Apartments | 0 (0.0%) | 24 (100.0%) |
| 5 to 9 Unit Apartments | 0 (0.0%) | 0 (0.0%) |
| 10 or more Apartments | 0 (0.0%) | 16 (100.0%) |
| Mobile Home / Other | 3 (50.0%) | 3 (50.0%) |
| Total | 174 (57.6%) | 128 (42.4%) |
Housing Structures by Number of Rooms in Conneautville borough
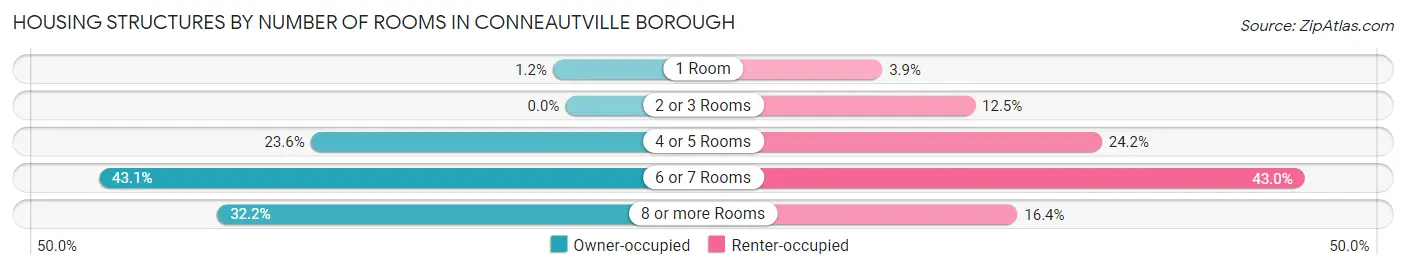
| Number of Rooms | Owner-occupied | Renter-occupied |
| 1 Room | 2 (1.1%) | 5 (3.9%) |
| 2 or 3 Rooms | 0 (0.0%) | 16 (12.5%) |
| 4 or 5 Rooms | 41 (23.6%) | 31 (24.2%) |
| 6 or 7 Rooms | 75 (43.1%) | 55 (43.0%) |
| 8 or more Rooms | 56 (32.2%) | 21 (16.4%) |
| Total | 174 (100.0%) | 128 (100.0%) |
Housing Structure by Heating Type in Conneautville borough
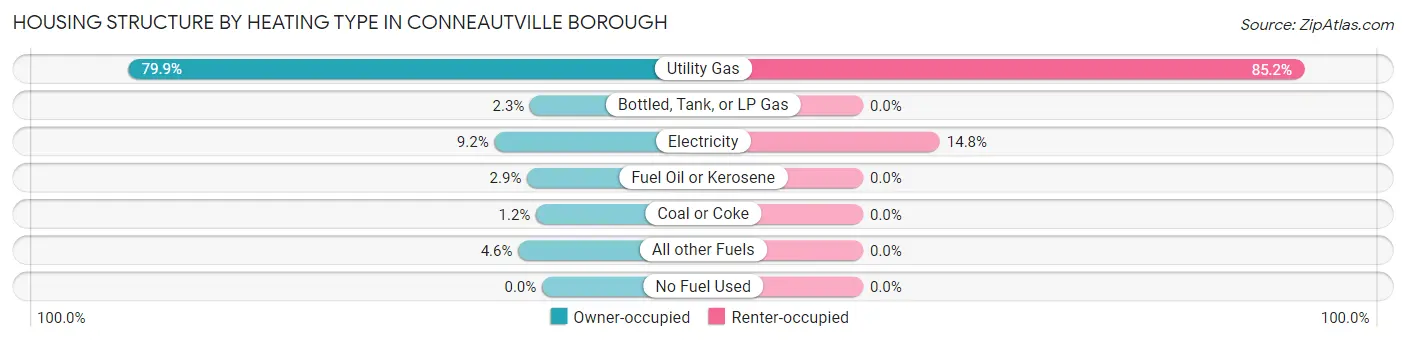
| Heating Type | Owner-occupied | Renter-occupied |
| Utility Gas | 139 (79.9%) | 109 (85.2%) |
| Bottled, Tank, or LP Gas | 4 (2.3%) | 0 (0.0%) |
| Electricity | 16 (9.2%) | 19 (14.8%) |
| Fuel Oil or Kerosene | 5 (2.9%) | 0 (0.0%) |
| Coal or Coke | 2 (1.1%) | 0 (0.0%) |
| All other Fuels | 8 (4.6%) | 0 (0.0%) |
| No Fuel Used | 0 (0.0%) | 0 (0.0%) |
| Total | 174 (100.0%) | 128 (100.0%) |
Household Vehicle Usage in Conneautville borough
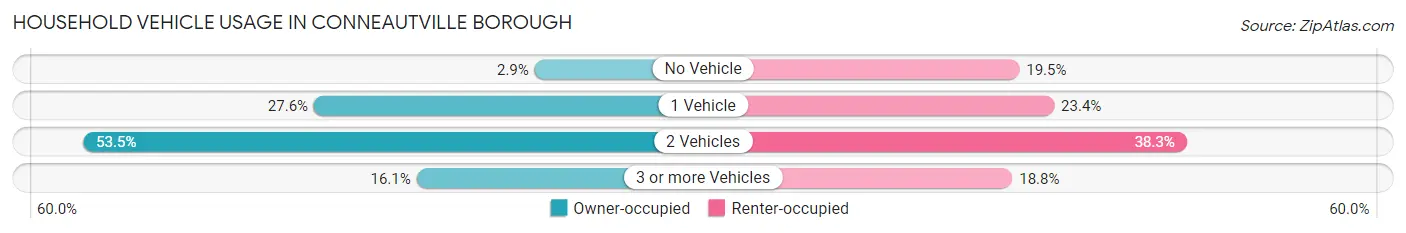
| Vehicles per Household | Owner-occupied | Renter-occupied |
| No Vehicle | 5 (2.9%) | 25 (19.5%) |
| 1 Vehicle | 48 (27.6%) | 30 (23.4%) |
| 2 Vehicles | 93 (53.4%) | 49 (38.3%) |
| 3 or more Vehicles | 28 (16.1%) | 24 (18.8%) |
| Total | 174 (100.0%) | 128 (100.0%) |
Real Estate & Mortgages in Conneautville borough
Real Estate and Mortgage Overview in Conneautville borough
| Characteristic | Without Mortgage | With Mortgage |
| Housing Units | 81 | 93 |
| Median Property Value | $123,400 | $92,900 |
| Median Household Income | $46,875 | $6 |
| Monthly Housing Costs | $485 | $0 |
| Real Estate Taxes | $1,202 | $2 |
Property Value by Mortgage Status in Conneautville borough
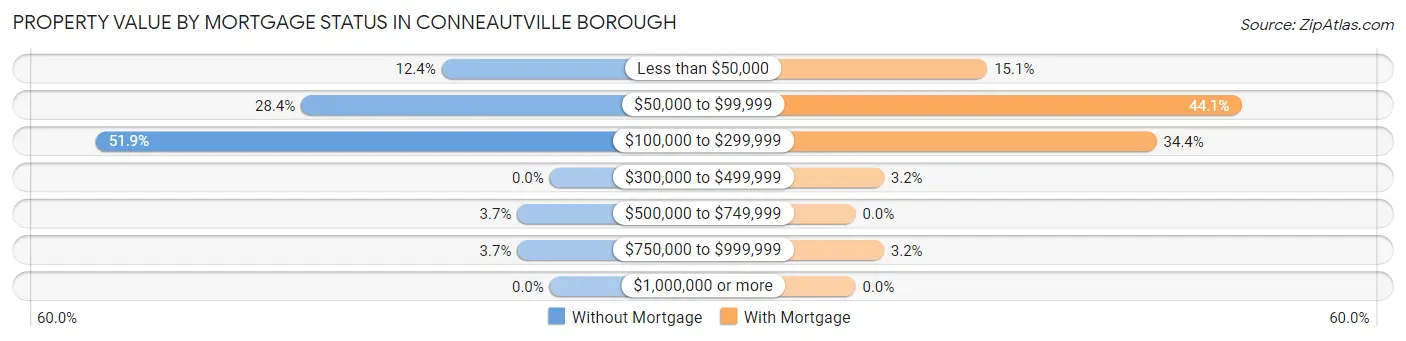
| Property Value | Without Mortgage | With Mortgage |
| Less than $50,000 | 10 (12.3%) | 14 (15.0%) |
| $50,000 to $99,999 | 23 (28.4%) | 41 (44.1%) |
| $100,000 to $299,999 | 42 (51.8%) | 32 (34.4%) |
| $300,000 to $499,999 | 0 (0.0%) | 3 (3.2%) |
| $500,000 to $749,999 | 3 (3.7%) | 0 (0.0%) |
| $750,000 to $999,999 | 3 (3.7%) | 3 (3.2%) |
| $1,000,000 or more | 0 (0.0%) | 0 (0.0%) |
| Total | 81 (100.0%) | 93 (100.0%) |
Household Income by Mortgage Status in Conneautville borough
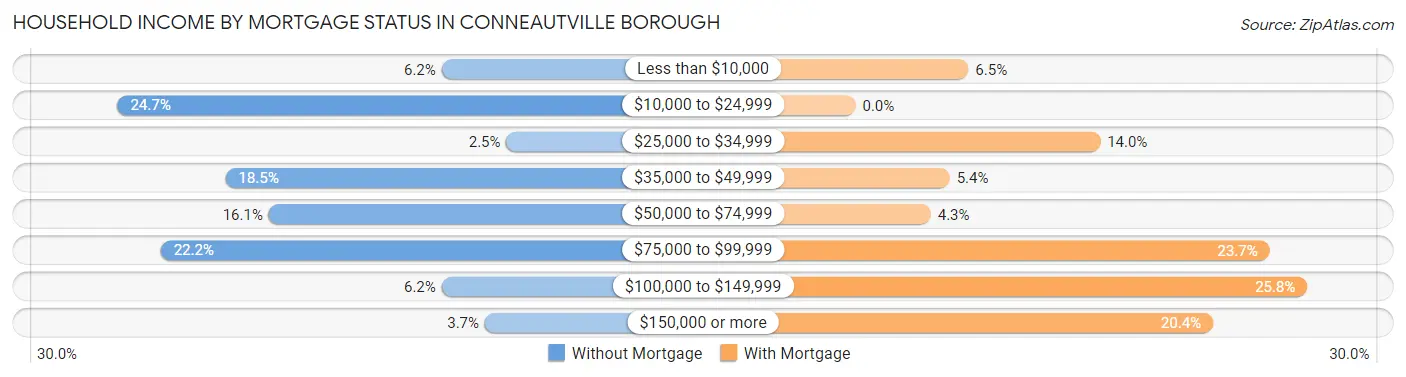
| Household Income | Without Mortgage | With Mortgage |
| Less than $10,000 | 5 (6.2%) | 6 (6.5%) |
| $10,000 to $24,999 | 20 (24.7%) | 0 (0.0%) |
| $25,000 to $34,999 | 2 (2.5%) | 13 (14.0%) |
| $35,000 to $49,999 | 15 (18.5%) | 5 (5.4%) |
| $50,000 to $74,999 | 13 (16.1%) | 4 (4.3%) |
| $75,000 to $99,999 | 18 (22.2%) | 22 (23.7%) |
| $100,000 to $149,999 | 5 (6.2%) | 24 (25.8%) |
| $150,000 or more | 3 (3.7%) | 19 (20.4%) |
| Total | 81 (100.0%) | 93 (100.0%) |
Property Value to Household Income Ratio in Conneautville borough
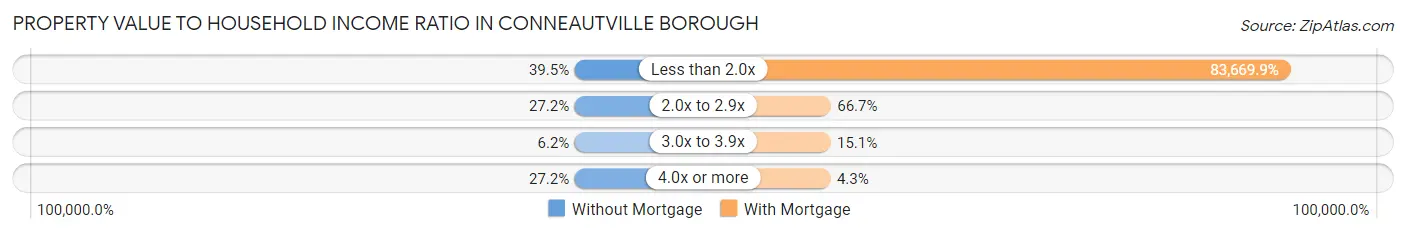
| Value-to-Income Ratio | Without Mortgage | With Mortgage |
| Less than 2.0x | 32 (39.5%) | 77,813 (83,669.9%) |
| 2.0x to 2.9x | 22 (27.2%) | 62 (66.7%) |
| 3.0x to 3.9x | 5 (6.2%) | 14 (15.0%) |
| 4.0x or more | 22 (27.2%) | 4 (4.3%) |
| Total | 81 (100.0%) | 93 (100.0%) |
Real Estate Taxes by Mortgage Status in Conneautville borough
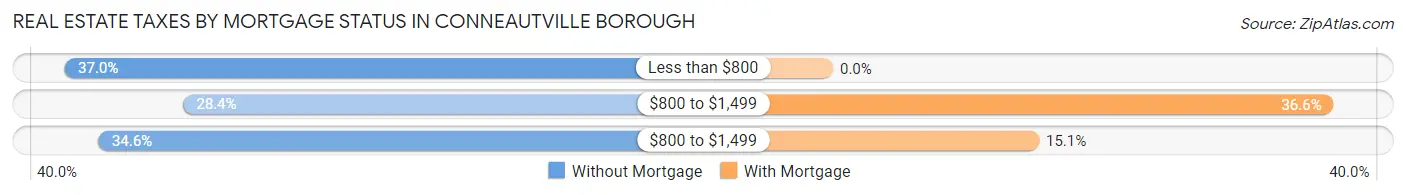
| Property Taxes | Without Mortgage | With Mortgage |
| Less than $800 | 30 (37.0%) | 0 (0.0%) |
| $800 to $1,499 | 23 (28.4%) | 34 (36.6%) |
| $800 to $1,499 | 28 (34.6%) | 14 (15.0%) |
| Total | 81 (100.0%) | 93 (100.0%) |
Health & Disability in Conneautville borough
Health Insurance Coverage by Age in Conneautville borough
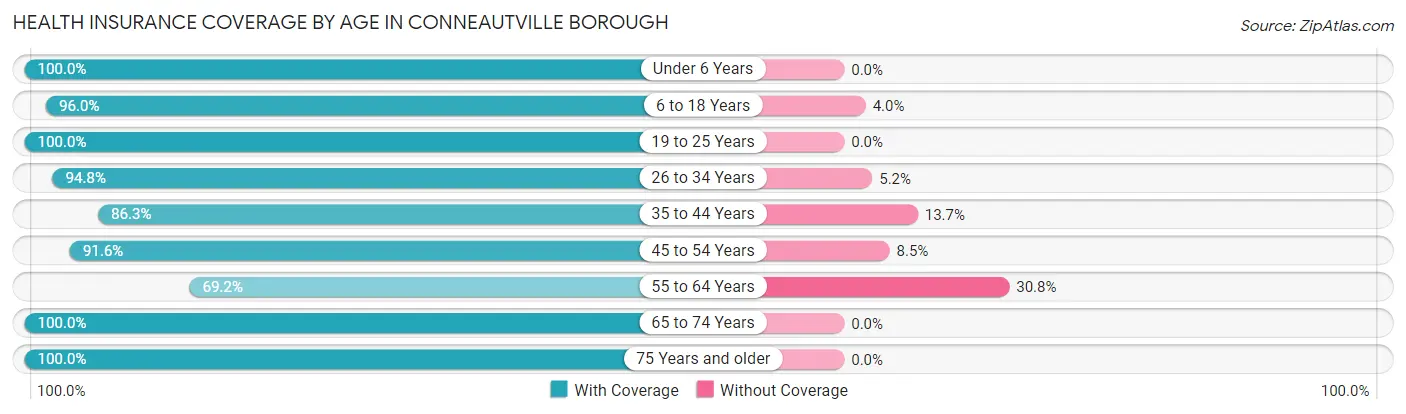
| Age Bracket | With Coverage | Without Coverage |
| Under 6 Years | 86 (100.0%) | 0 (0.0%) |
| 6 to 18 Years | 72 (96.0%) | 3 (4.0%) |
| 19 to 25 Years | 52 (100.0%) | 0 (0.0%) |
| 26 to 34 Years | 127 (94.8%) | 7 (5.2%) |
| 35 to 44 Years | 63 (86.3%) | 10 (13.7%) |
| 45 to 54 Years | 65 (91.5%) | 6 (8.5%) |
| 55 to 64 Years | 90 (69.2%) | 40 (30.8%) |
| 65 to 74 Years | 77 (100.0%) | 0 (0.0%) |
| 75 Years and older | 47 (100.0%) | 0 (0.0%) |
| Total | 679 (91.1%) | 66 (8.9%) |
Health Insurance Coverage by Citizenship Status in Conneautville borough
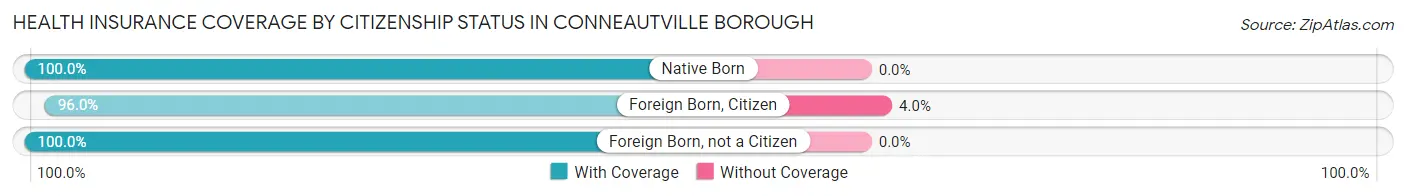
| Citizenship Status | With Coverage | Without Coverage |
| Native Born | 86 (100.0%) | 0 (0.0%) |
| Foreign Born, Citizen | 72 (96.0%) | 3 (4.0%) |
| Foreign Born, not a Citizen | 52 (100.0%) | 0 (0.0%) |
Health Insurance Coverage by Household Income in Conneautville borough
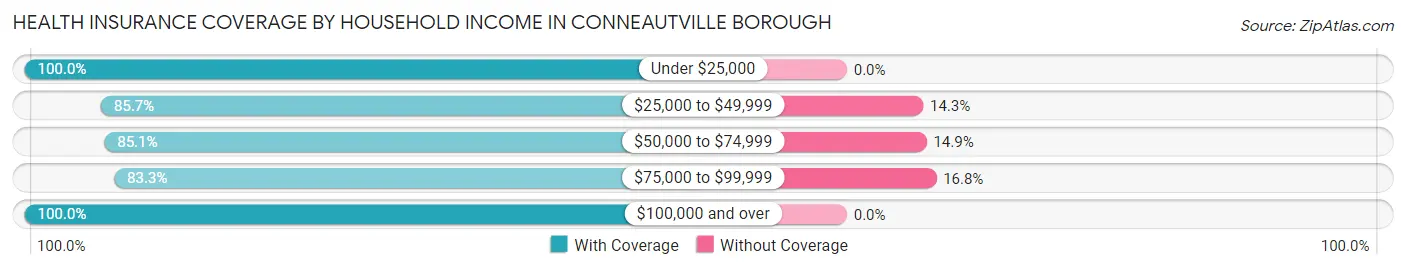
| Household Income | With Coverage | Without Coverage |
| Under $25,000 | 227 (100.0%) | 0 (0.0%) |
| $25,000 to $49,999 | 72 (85.7%) | 12 (14.3%) |
| $50,000 to $74,999 | 114 (85.1%) | 20 (14.9%) |
| $75,000 to $99,999 | 169 (83.3%) | 34 (16.8%) |
| $100,000 and over | 97 (100.0%) | 0 (0.0%) |
Public vs Private Health Insurance Coverage by Age in Conneautville borough
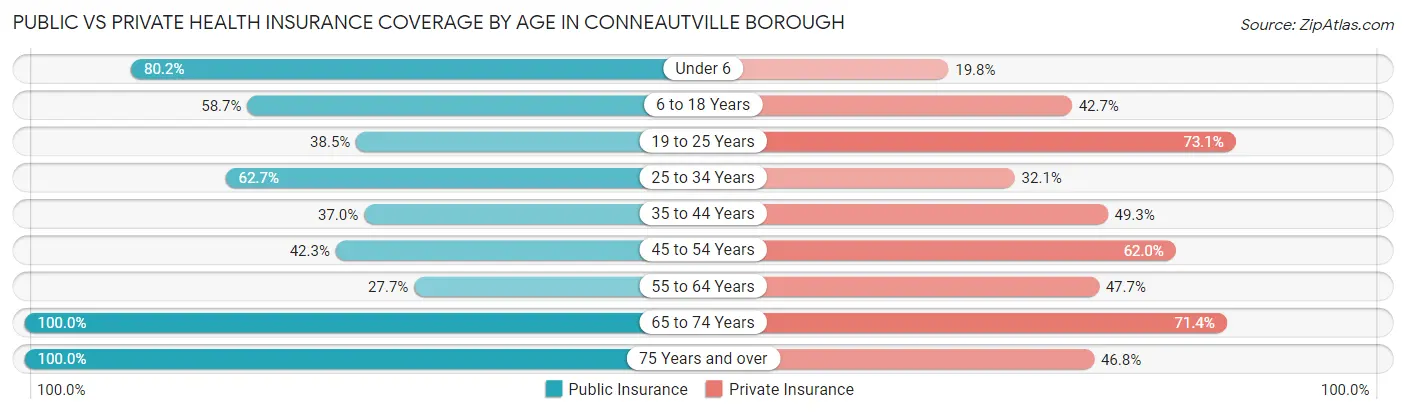
| Age Bracket | Public Insurance | Private Insurance |
| Under 6 | 69 (80.2%) | 17 (19.8%) |
| 6 to 18 Years | 44 (58.7%) | 32 (42.7%) |
| 19 to 25 Years | 20 (38.5%) | 38 (73.1%) |
| 25 to 34 Years | 84 (62.7%) | 43 (32.1%) |
| 35 to 44 Years | 27 (37.0%) | 36 (49.3%) |
| 45 to 54 Years | 30 (42.2%) | 44 (62.0%) |
| 55 to 64 Years | 36 (27.7%) | 62 (47.7%) |
| 65 to 74 Years | 77 (100.0%) | 55 (71.4%) |
| 75 Years and over | 47 (100.0%) | 22 (46.8%) |
| Total | 434 (58.3%) | 349 (46.9%) |
Disability Status by Sex by Age in Conneautville borough
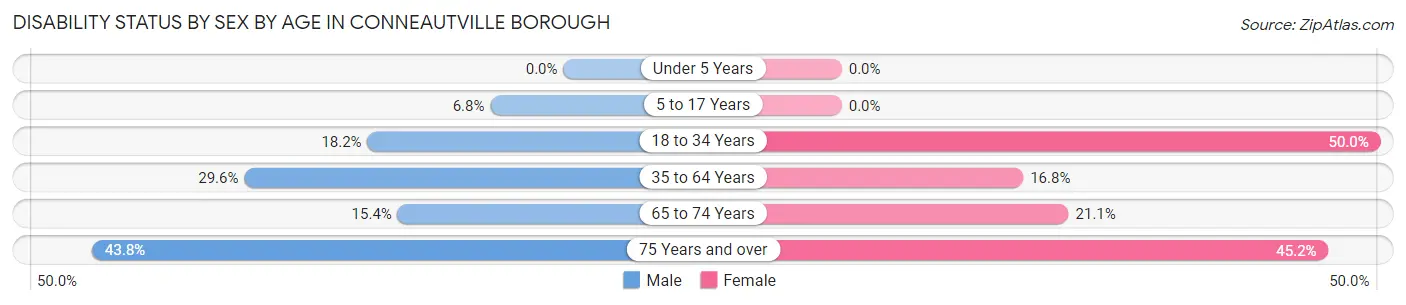
| Age Bracket | Male | Female |
| Under 5 Years | 0 (0.0%) | 0 (0.0%) |
| 5 to 17 Years | 4 (6.8%) | 0 (0.0%) |
| 18 to 34 Years | 12 (18.2%) | 60 (50.0%) |
| 35 to 64 Years | 53 (29.6%) | 16 (16.8%) |
| 65 to 74 Years | 6 (15.4%) | 8 (21.0%) |
| 75 Years and over | 7 (43.8%) | 14 (45.2%) |
Disability Class by Sex by Age in Conneautville borough
Disability Class: Hearing Difficulty
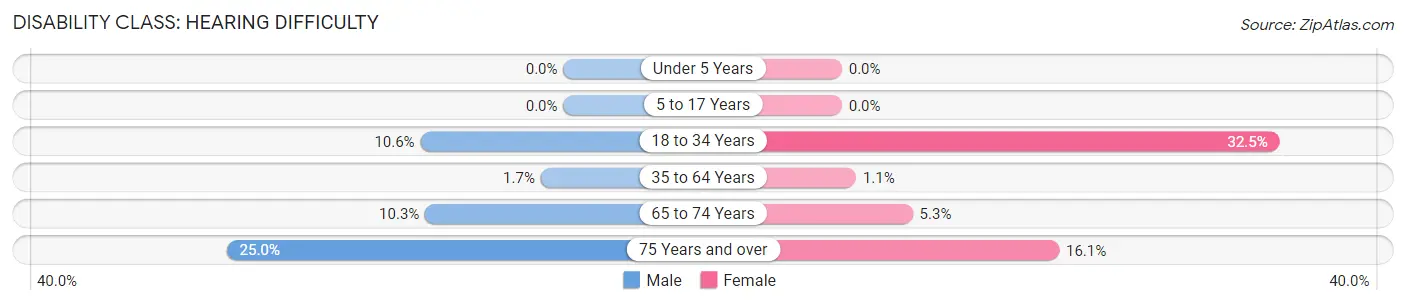
| Age Bracket | Male | Female |
| Under 5 Years | 0 (0.0%) | 0 (0.0%) |
| 5 to 17 Years | 0 (0.0%) | 0 (0.0%) |
| 18 to 34 Years | 7 (10.6%) | 39 (32.5%) |
| 35 to 64 Years | 3 (1.7%) | 1 (1.1%) |
| 65 to 74 Years | 4 (10.3%) | 2 (5.3%) |
| 75 Years and over | 4 (25.0%) | 5 (16.1%) |
Disability Class: Vision Difficulty
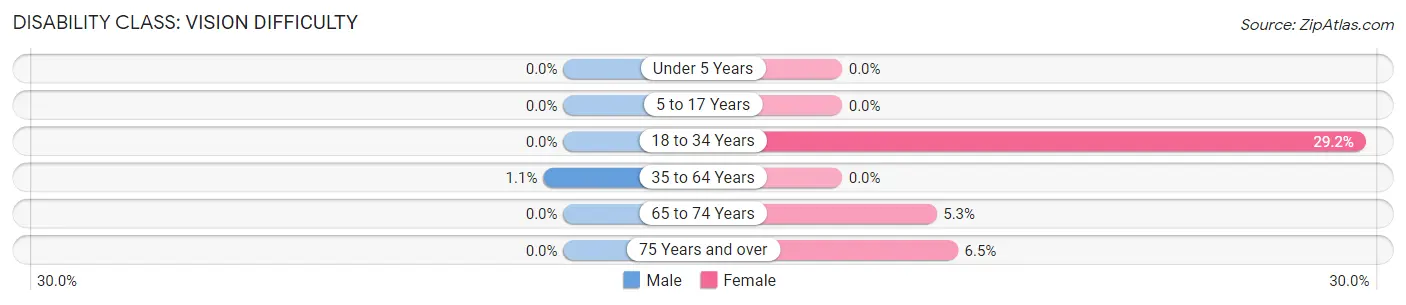
| Age Bracket | Male | Female |
| Under 5 Years | 0 (0.0%) | 0 (0.0%) |
| 5 to 17 Years | 0 (0.0%) | 0 (0.0%) |
| 18 to 34 Years | 0 (0.0%) | 35 (29.2%) |
| 35 to 64 Years | 2 (1.1%) | 0 (0.0%) |
| 65 to 74 Years | 0 (0.0%) | 2 (5.3%) |
| 75 Years and over | 0 (0.0%) | 2 (6.5%) |
Disability Class: Cognitive Difficulty
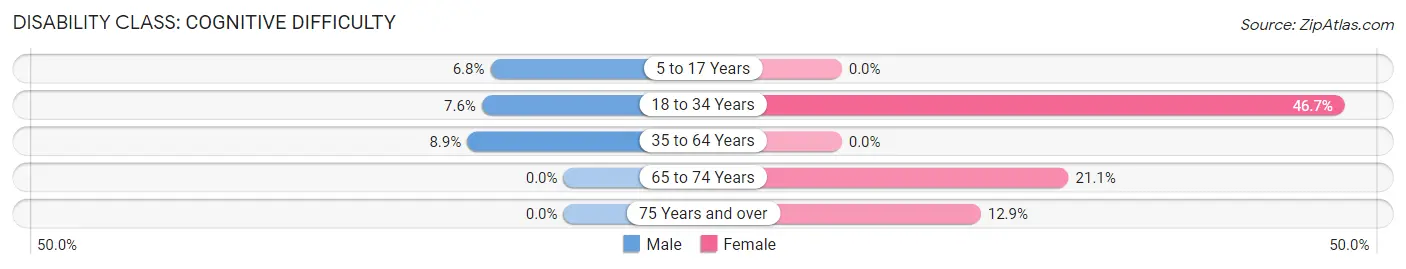
| Age Bracket | Male | Female |
| 5 to 17 Years | 4 (6.8%) | 0 (0.0%) |
| 18 to 34 Years | 5 (7.6%) | 56 (46.7%) |
| 35 to 64 Years | 16 (8.9%) | 0 (0.0%) |
| 65 to 74 Years | 0 (0.0%) | 8 (21.0%) |
| 75 Years and over | 0 (0.0%) | 4 (12.9%) |
Disability Class: Ambulatory Difficulty
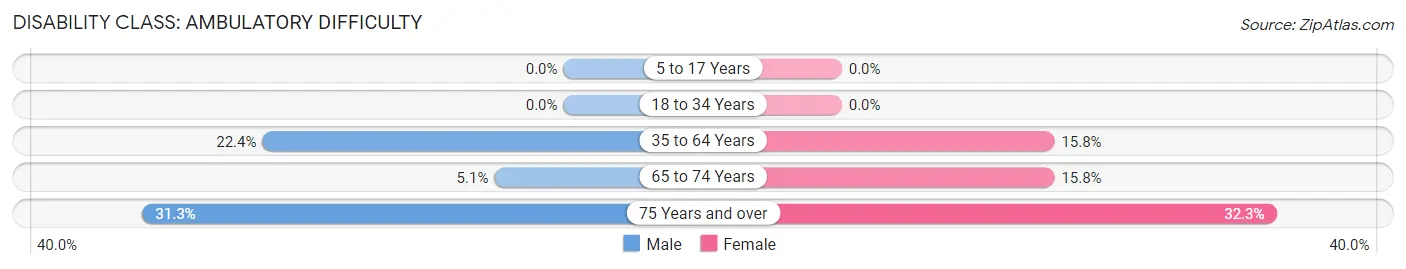
| Age Bracket | Male | Female |
| 5 to 17 Years | 0 (0.0%) | 0 (0.0%) |
| 18 to 34 Years | 0 (0.0%) | 0 (0.0%) |
| 35 to 64 Years | 40 (22.4%) | 15 (15.8%) |
| 65 to 74 Years | 2 (5.1%) | 6 (15.8%) |
| 75 Years and over | 5 (31.2%) | 10 (32.3%) |
Disability Class: Self-Care Difficulty
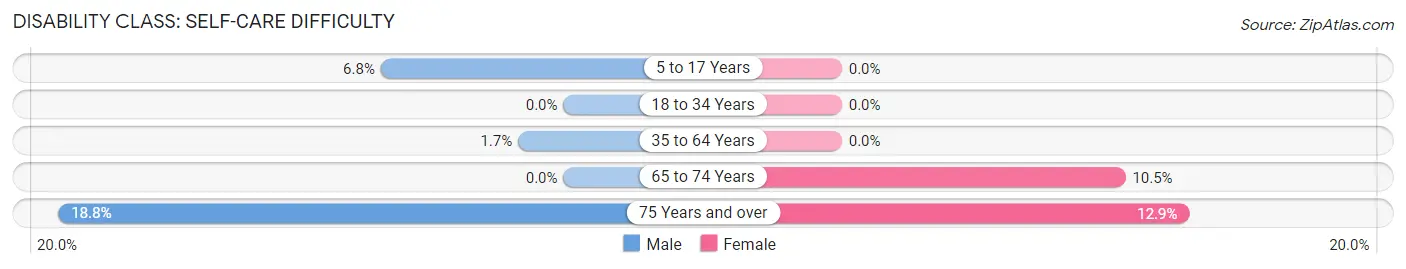
| Age Bracket | Male | Female |
| 5 to 17 Years | 4 (6.8%) | 0 (0.0%) |
| 18 to 34 Years | 0 (0.0%) | 0 (0.0%) |
| 35 to 64 Years | 3 (1.7%) | 0 (0.0%) |
| 65 to 74 Years | 0 (0.0%) | 4 (10.5%) |
| 75 Years and over | 3 (18.8%) | 4 (12.9%) |
Technology Access in Conneautville borough
Computing Device Access in Conneautville borough
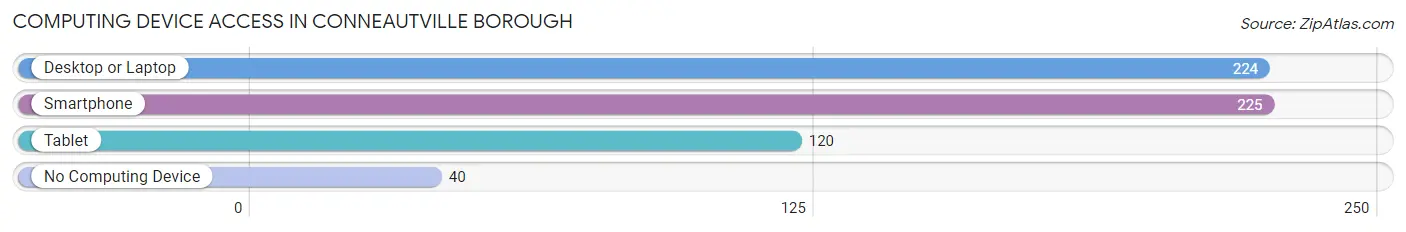
| Device Type | # Households | % Households |
| Desktop or Laptop | 224 | 74.2% |
| Smartphone | 225 | 74.5% |
| Tablet | 120 | 39.7% |
| No Computing Device | 40 | 13.3% |
| Total | 302 | 100.0% |
Internet Access in Conneautville borough
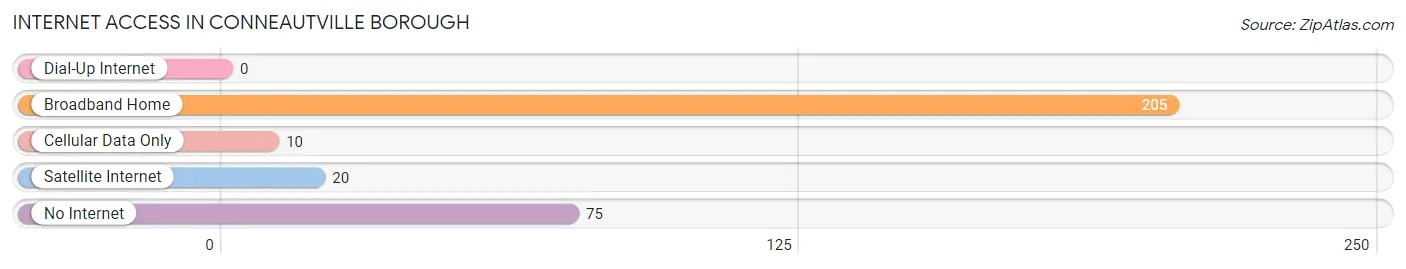
| Internet Type | # Households | % Households |
| Dial-Up Internet | 0 | 0.0% |
| Broadband Home | 205 | 67.9% |
| Cellular Data Only | 10 | 3.3% |
| Satellite Internet | 20 | 6.6% |
| No Internet | 75 | 24.8% |
| Total | 302 | 100.0% |
Conneautville borough Summary
Conneautville Borough is a small borough located in Crawford County, Pennsylvania. It is situated along the banks of French Creek, approximately 20 miles south of Erie. The population of Conneautville Borough was 1,093 at the 2010 census.
History
Conneautville Borough was founded in 1832 by a group of settlers from Connecticut. The town was named after the nearby Conneaut Creek, which was named after the Native American tribe that lived in the area. The first settlers were primarily farmers and the town quickly grew to become a thriving agricultural community.
In 1845, the first post office was established in Conneautville. The town was incorporated as a borough in 1854. During the late 19th century, the town experienced a period of growth and prosperity. Several businesses were established, including a sawmill, a grist mill, a tannery, and a brickyard.
In the early 20th century, the town experienced a decline in population as many of its residents moved away in search of better economic opportunities. However, the town has experienced a resurgence in recent years, with many new businesses and residents moving to the area.
Geography
Conneautville Borough is located at 41°37'45"N 80°17'45"W (41.629167, -80.295833). According to the United States Census Bureau, the borough has a total area of 0.7 square miles (1.8 km2), all of it land.
The borough is located in the French Creek Valley, which is part of the larger Lake Erie watershed. The borough is bordered by Conneaut Township to the north, East Fallowfield Township to the east, and Summit Township to the south and west.
Economy
Conneautville Borough is primarily a residential community, with most of its residents commuting to nearby towns and cities for work. The borough does have a few small businesses, including a grocery store, a hardware store, and a few restaurants.
The borough is also home to several manufacturing companies, including a plastics manufacturer, a metal fabricator, and a machine shop. The borough is also home to a number of farms, which produce a variety of crops, including corn, soybeans, and hay.
Demographics
As of the 2010 census, there were 1,093 people, 441 households, and 298 families residing in the borough. The population density was 1,541.7 people per square mile (595.2/km2). There were 471 housing units at an average density of 667.9 per square mile (258.2/km2). The racial makeup of the borough was 97.7% White, 0.3% African American, 0.2% Native American, 0.2% Asian, 0.1% from other races, and 1.5% from two or more races. Hispanic or Latino of any race were 0.7% of the population.
There were 441 households, out of which 28.2% had children under the age of 18 living with them, 51.6% were married couples living together, 10.2% had a female householder with no husband present, and 33.7% were non-families. 29.2% of all households were made up of individuals, and 14.3% had someone living alone who was 65 years of age or older. The average household size was 2.47 and the average family size was 3.04.
In the borough, the population was spread out, with 24.2% under the age of 18, 7.2% from 18 to 24, 25.7% from 25 to 44, 25.2% from 45 to 64, and 17.7% who were 65 years of age or older. The median age was 40 years. For every 100 females, there were 92.2 males. For every 100 females age 18 and over, there were 88.2 males.
The median income for a household in the borough was $35,000, and the median income for a family was $41,250. Males had a median income of $31,250 versus $21,250 for females. The per capita income for the borough was $17,845. About 8.2% of families and 10.2% of the population were below the poverty line, including 14.3% of those under age 18 and 8.3% of those age 65 or over.
Common Questions
What is Per Capita Income in Conneautville borough?
Per Capita income in Conneautville borough is $22,864.
What is the Median Family Income in Conneautville borough?
Median Family Income in Conneautville borough is $52,222.
What is the Median Household income in Conneautville borough?
Median Household Income in Conneautville borough is $49,167.
What is Income or Wage Gap in Conneautville borough?
Income or Wage Gap in Conneautville borough is 43.1%.
Women in Conneautville borough earn 56.9 cents for every dollar earned by a man.
What is Inequality or Gini Index in Conneautville borough?
Inequality or Gini Index in Conneautville borough is 0.39.
What is the Total Population of Conneautville borough?
Total Population of Conneautville borough is 745.
What is the Total Male Population of Conneautville borough?
Total Male Population of Conneautville borough is 380.
What is the Total Female Population of Conneautville borough?
Total Female Population of Conneautville borough is 365.
What is the Ratio of Males per 100 Females in Conneautville borough?
There are 104.11 Males per 100 Females in Conneautville borough.
What is the Ratio of Females per 100 Males in Conneautville borough?
There are 96.05 Females per 100 Males in Conneautville borough.
What is the Median Population Age in Conneautville borough?
Median Population Age in Conneautville borough is 38.5 Years.
What is the Average Family Size in Conneautville borough
Average Family Size in Conneautville borough is 2.8 People.
What is the Average Household Size in Conneautville borough
Average Household Size in Conneautville borough is 2.5 People.
How Large is the Labor Force in Conneautville borough?
There are 372 People in the Labor Forcein in Conneautville borough.
What is the Percentage of People in the Labor Force in Conneautville borough?
63.7% of People are in the Labor Force in Conneautville borough.
What is the Unemployment Rate in Conneautville borough?
Unemployment Rate in Conneautville borough is 20.7%.