Wilmore borough, PA Map & Demographics
Wilmore borough Overview
$22,702
PER CAPITA INCOME
$61,500
AVG FAMILY INCOME
27.5%
WAGE / INCOME GAP [ % ]
72.5¢/ $1
WAGE / INCOME GAP [ $ ]
0.40
INEQUALITY / GINI INDEX
390
TOTAL POPULATION
169
MALE POPULATION
221
FEMALE POPULATION
76.47
MALES / 100 FEMALES
130.77
FEMALES / 100 MALES
34.2
MEDIAN AGE
3.7
AVG FAMILY SIZE
3.5
AVG HOUSEHOLD SIZE
152
LABOR FORCE [ PEOPLE ]
50.2%
PERCENT IN LABOR FORCE
1.3%
UNEMPLOYMENT RATE
Income in Wilmore borough
Income Overview in Wilmore borough
| Characteristic | Number | Measure |
| Per Capita Income | 390 | $22,702 |
| Median Family Income | 86 | $61,500 |
| Mean Family Income | 86 | $76,483 |
| Median Household Income | 111 | $0 |
| Mean Household Income | 111 | $73,331 |
| Income Deficit | 86 | $0 |
| Wage / Income Gap (%) | 390 | 27.51% |
| Wage / Income Gap ($) | 390 | 72.49¢ per $1 |
| Gini / Inequality Index | 390 | 0.40 |
Earnings by Sex in Wilmore borough
Average Earnings in Wilmore borough are $32,321, $41,875 for men and $30,357 for women, a difference of 27.5%.
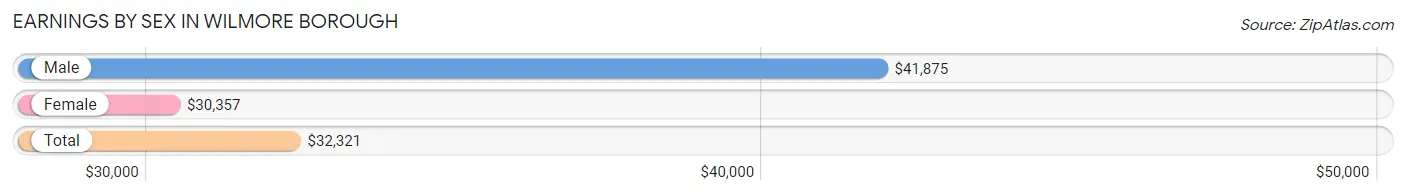
| Sex | Number | Average Earnings |
| Male | 75 (44.4%) | $41,875 |
| Female | 94 (55.6%) | $30,357 |
| Total | 169 (100.0%) | $32,321 |
Earnings by Sex by Income Bracket in Wilmore borough
The most common earnings brackets in Wilmore borough are $40,000 to $44,999 for men (12 | 16.0%) and $30,000 to $34,999 for women (12 | 12.8%).
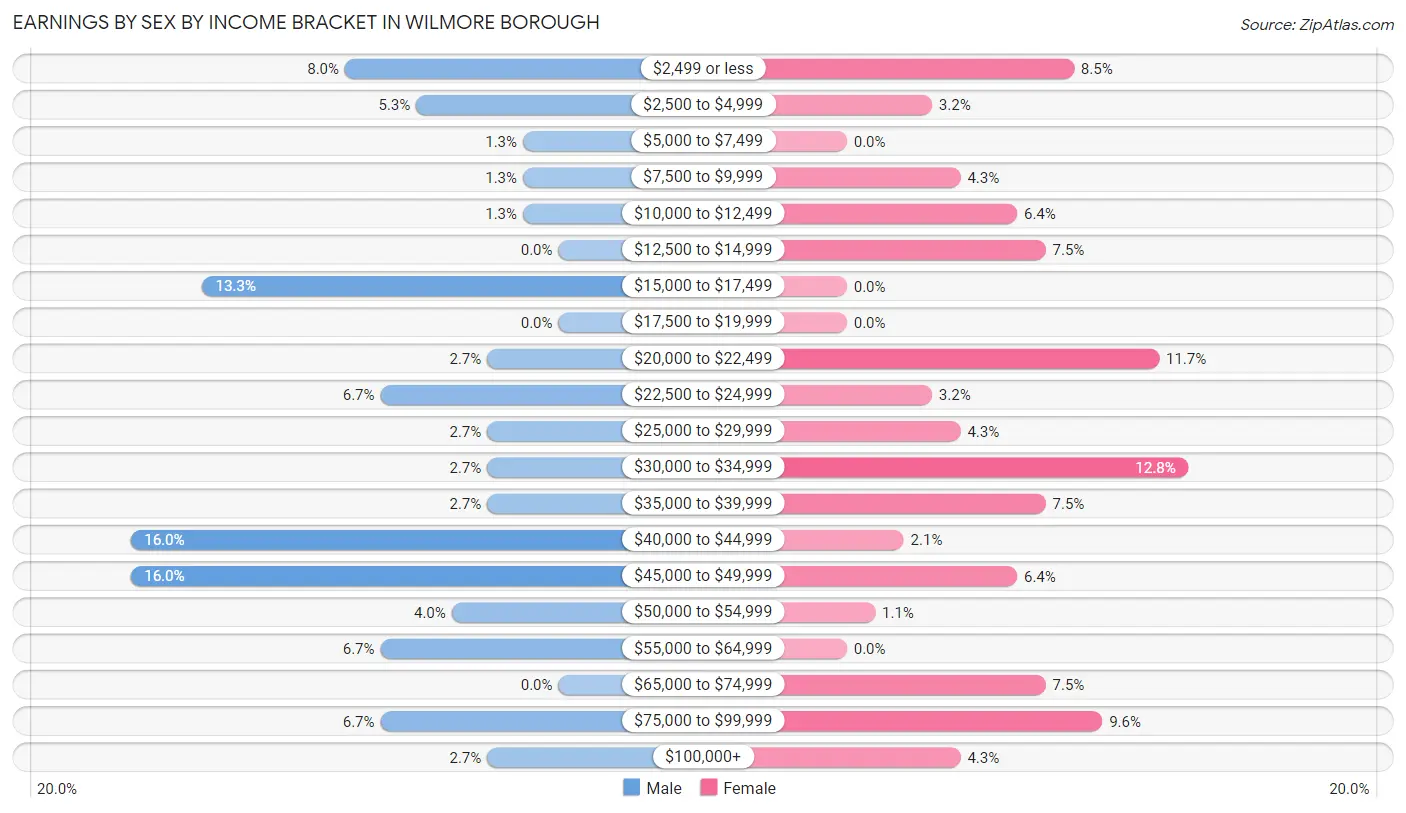
| Income | Male | Female |
| $2,499 or less | 6 (8.0%) | 8 (8.5%) |
| $2,500 to $4,999 | 4 (5.3%) | 3 (3.2%) |
| $5,000 to $7,499 | 1 (1.3%) | 0 (0.0%) |
| $7,500 to $9,999 | 1 (1.3%) | 4 (4.3%) |
| $10,000 to $12,499 | 1 (1.3%) | 6 (6.4%) |
| $12,500 to $14,999 | 0 (0.0%) | 7 (7.4%) |
| $15,000 to $17,499 | 10 (13.3%) | 0 (0.0%) |
| $17,500 to $19,999 | 0 (0.0%) | 0 (0.0%) |
| $20,000 to $22,499 | 2 (2.7%) | 11 (11.7%) |
| $22,500 to $24,999 | 5 (6.7%) | 3 (3.2%) |
| $25,000 to $29,999 | 2 (2.7%) | 4 (4.3%) |
| $30,000 to $34,999 | 2 (2.7%) | 12 (12.8%) |
| $35,000 to $39,999 | 2 (2.7%) | 7 (7.4%) |
| $40,000 to $44,999 | 12 (16.0%) | 2 (2.1%) |
| $45,000 to $49,999 | 12 (16.0%) | 6 (6.4%) |
| $50,000 to $54,999 | 3 (4.0%) | 1 (1.1%) |
| $55,000 to $64,999 | 5 (6.7%) | 0 (0.0%) |
| $65,000 to $74,999 | 0 (0.0%) | 7 (7.4%) |
| $75,000 to $99,999 | 5 (6.7%) | 9 (9.6%) |
| $100,000+ | 2 (2.7%) | 4 (4.3%) |
| Total | 75 (100.0%) | 94 (100.0%) |
Earnings by Sex by Educational Attainment in Wilmore borough
Average earnings in Wilmore borough are $41,875 for men and $30,714 for women, a difference of 26.7%. Men with an educational attainment of bachelor's degree enjoy the highest average annual earnings of $50,625, while those with college or associate's degree education earn the least with $43,750. Women with an educational attainment of graduate degree earn the most with the average annual earnings of $68,750, while those with high school diploma education have the smallest earnings of $21,458.
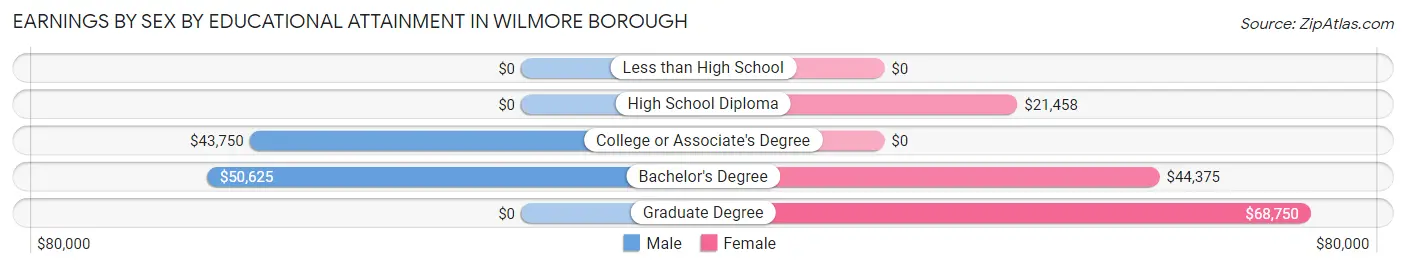
| Educational Attainment | Male Income | Female Income |
| Less than High School | - | - |
| High School Diploma | - | - |
| College or Associate's Degree | $43,750 | $0 |
| Bachelor's Degree | $50,625 | $44,375 |
| Graduate Degree | - | - |
| Total | $41,875 | $30,714 |
Family Income in Wilmore borough
Family Income Brackets in Wilmore borough
According to the Wilmore borough family income data, there are 17 families falling into the $50,000 to $74,999 income range, which is the most common income bracket and makes up 19.8% of all families.
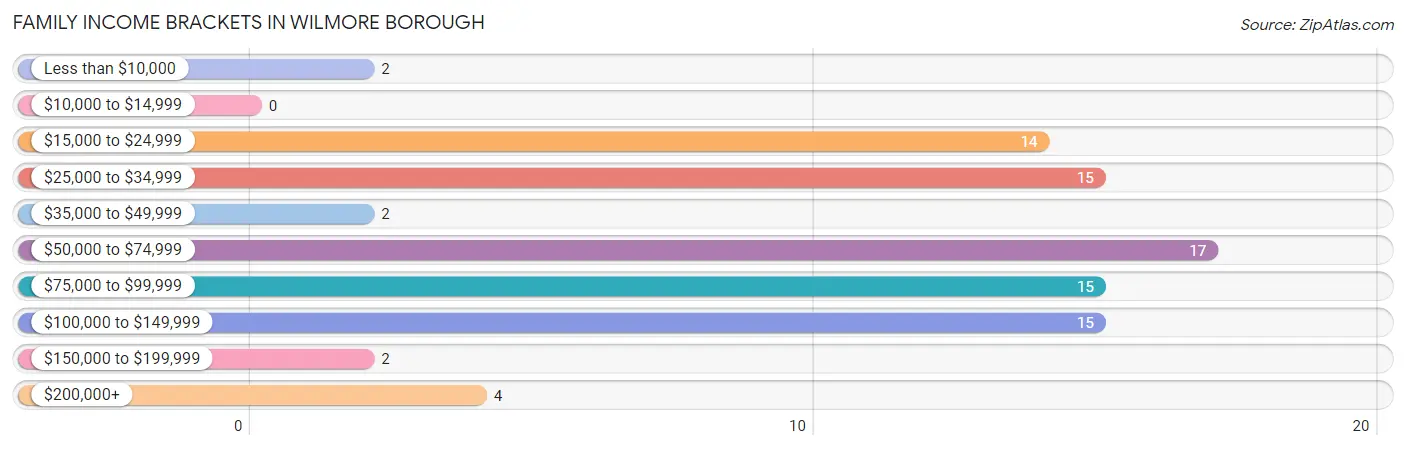
| Income Bracket | # Families | % Families |
| Less than $10,000 | 2 | 2.3% |
| $10,000 to $14,999 | 0 | 0.0% |
| $15,000 to $24,999 | 14 | 16.3% |
| $25,000 to $34,999 | 15 | 17.4% |
| $35,000 to $49,999 | 2 | 2.3% |
| $50,000 to $74,999 | 17 | 19.8% |
| $75,000 to $99,999 | 15 | 17.4% |
| $100,000 to $149,999 | 15 | 17.4% |
| $150,000 to $199,999 | 2 | 2.3% |
| $200,000+ | 4 | 4.7% |
Family Income by Famaliy Size in Wilmore borough
3-person families (16 | 18.6%) account for the highest median family income in Wilmore borough with $122,500 per family, while 3-person families (16 | 18.6%) have the highest median income of $40,833 per family member.
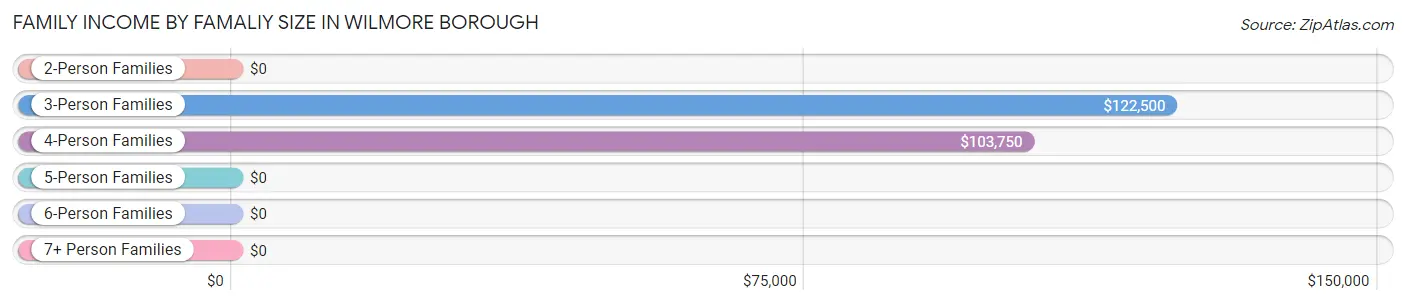
| Income Bracket | # Families | Median Income |
| 2-Person Families | 45 (52.3%) | $0 |
| 3-Person Families | 16 (18.6%) | $122,500 |
| 4-Person Families | 13 (15.1%) | $103,750 |
| 5-Person Families | 5 (5.8%) | $0 |
| 6-Person Families | 5 (5.8%) | $0 |
| 7+ Person Families | 2 (2.3%) | $0 |
| Total | 86 (100.0%) | $61,500 |
Family Income by Number of Earners in Wilmore borough
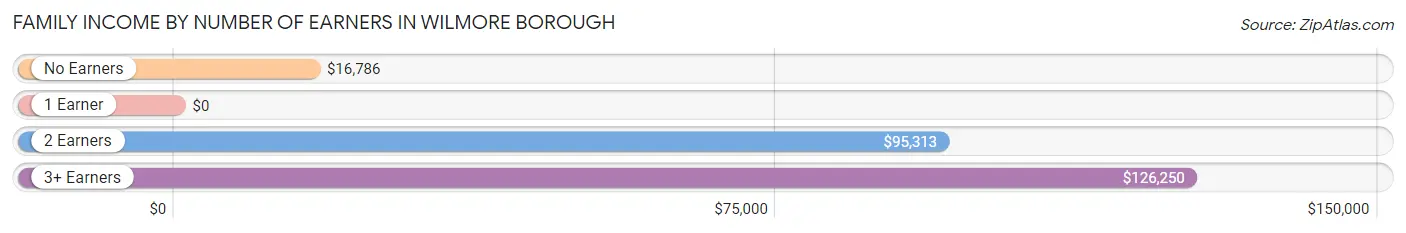
| Number of Earners | # Families | Median Income |
| No Earners | 24 (27.9%) | $16,786 |
| 1 Earner | 19 (22.1%) | $0 |
| 2 Earners | 31 (36.0%) | $95,313 |
| 3+ Earners | 12 (14.0%) | $126,250 |
| Total | 86 (100.0%) | $61,500 |
Household Income in Wilmore borough
Household Income Brackets in Wilmore borough
With 26 households falling in the category, the $100,000 to $149,999 income range is the most frequent in Wilmore borough, accounting for 23.4% of all households. In contrast, only 2 households (1.8%) fall into the less than $10,000 income bracket, making it the least populous group.
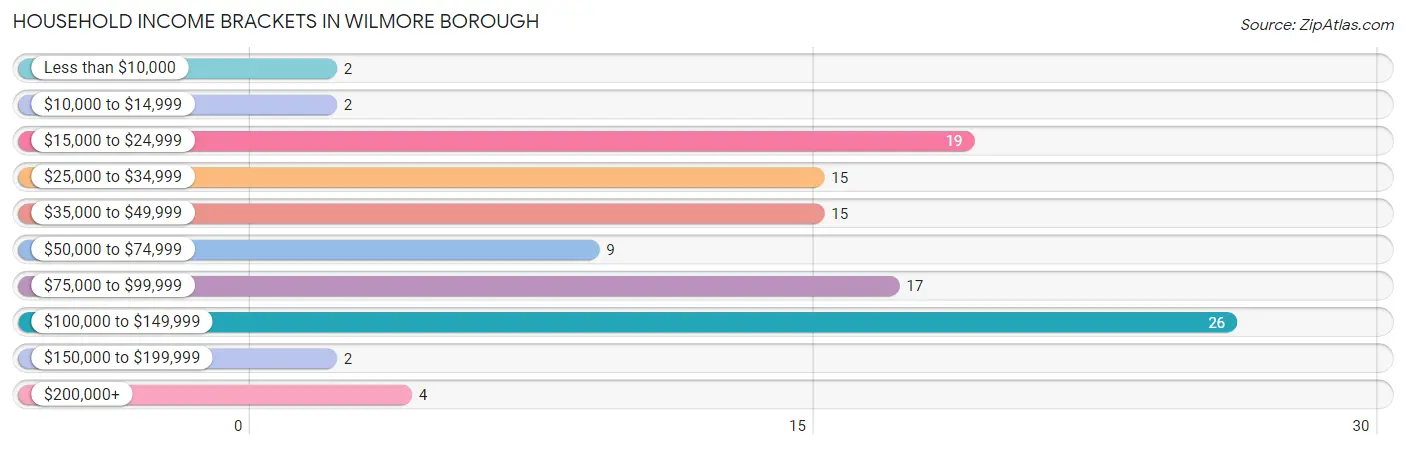
| Income Bracket | # Households | % Households |
| Less than $10,000 | 2 | 1.8% |
| $10,000 to $14,999 | 2 | 1.8% |
| $15,000 to $24,999 | 19 | 17.1% |
| $25,000 to $34,999 | 15 | 13.5% |
| $35,000 to $49,999 | 15 | 13.5% |
| $50,000 to $74,999 | 9 | 8.1% |
| $75,000 to $99,999 | 17 | 15.3% |
| $100,000 to $149,999 | 26 | 23.4% |
| $150,000 to $199,999 | 2 | 1.8% |
| $200,000+ | 4 | 3.6% |
Household Income by Householder Age in Wilmore borough
The median household income in Wilmore borough is $0, with the highest median household income of $102,500 found in the 25 to 44 years age bracket for the primary householder. A total of 22 households (19.8%) fall into this category. Meanwhile, the 15 to 24 years age bracket for the primary householder has the lowest median household income of $0, with 9 households (8.1%) in this group.
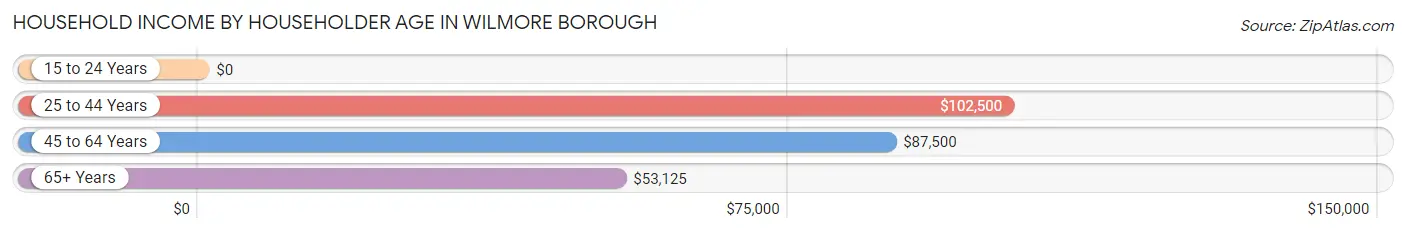
| Income Bracket | # Households | Median Income |
| 15 to 24 Years | 9 (8.1%) | $0 |
| 25 to 44 Years | 22 (19.8%) | $102,500 |
| 45 to 64 Years | 52 (46.9%) | $87,500 |
| 65+ Years | 28 (25.2%) | $53,125 |
| Total | 111 (100.0%) | $0 |
Poverty in Wilmore borough
Income Below Poverty by Sex and Age in Wilmore borough
With 14.8% poverty level for males and 40.7% for females among the residents of Wilmore borough, 55 to 64 year old males and 16 and 17 year old females are the most vulnerable to poverty, with 13 males (40.6%) and 12 females (92.3%) in their respective age groups living below the poverty level.
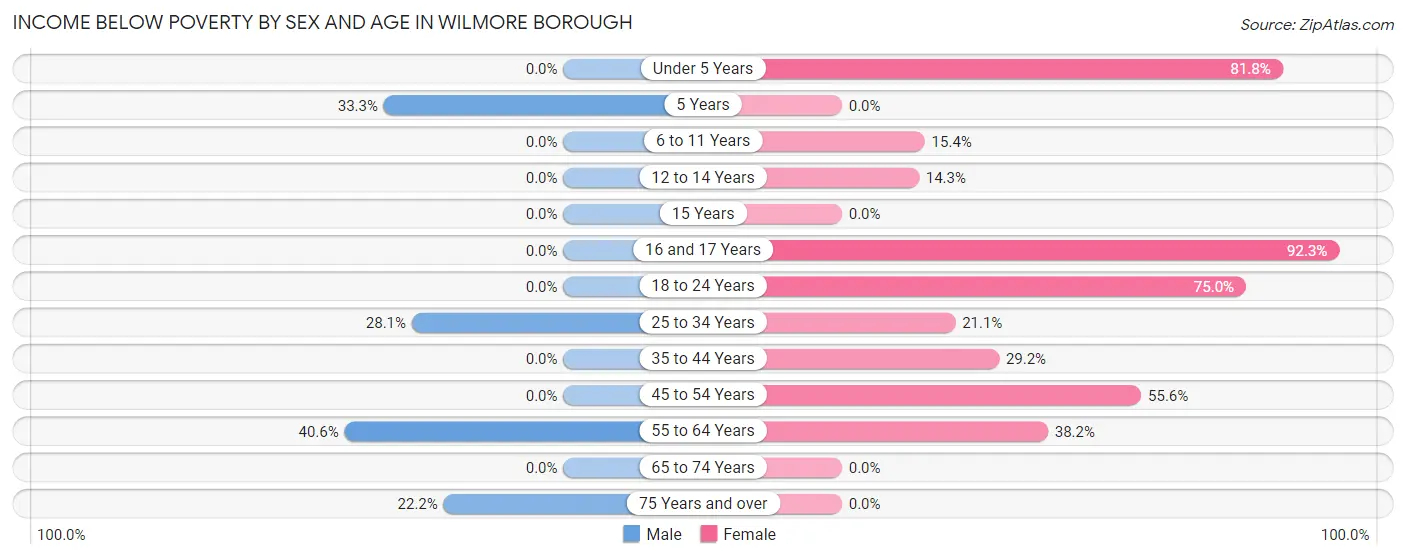
| Age Bracket | Male | Female |
| Under 5 Years | 0 (0.0%) | 18 (81.8%) |
| 5 Years | 1 (33.3%) | 0 (0.0%) |
| 6 to 11 Years | 0 (0.0%) | 2 (15.4%) |
| 12 to 14 Years | 0 (0.0%) | 1 (14.3%) |
| 15 Years | 0 (0.0%) | 0 (0.0%) |
| 16 and 17 Years | 0 (0.0%) | 12 (92.3%) |
| 18 to 24 Years | 0 (0.0%) | 12 (75.0%) |
| 25 to 34 Years | 9 (28.1%) | 8 (21.0%) |
| 35 to 44 Years | 0 (0.0%) | 7 (29.2%) |
| 45 to 54 Years | 0 (0.0%) | 15 (55.6%) |
| 55 to 64 Years | 13 (40.6%) | 13 (38.2%) |
| 65 to 74 Years | 0 (0.0%) | 0 (0.0%) |
| 75 Years and over | 2 (22.2%) | 0 (0.0%) |
| Total | 25 (14.8%) | 88 (40.7%) |
Income Above Poverty by Sex and Age in Wilmore borough
According to the poverty statistics in Wilmore borough, males aged under 5 years and females aged 65 to 74 years are the age groups that are most secure financially, with 100.0% of males and 100.0% of females in these age groups living above the poverty line.
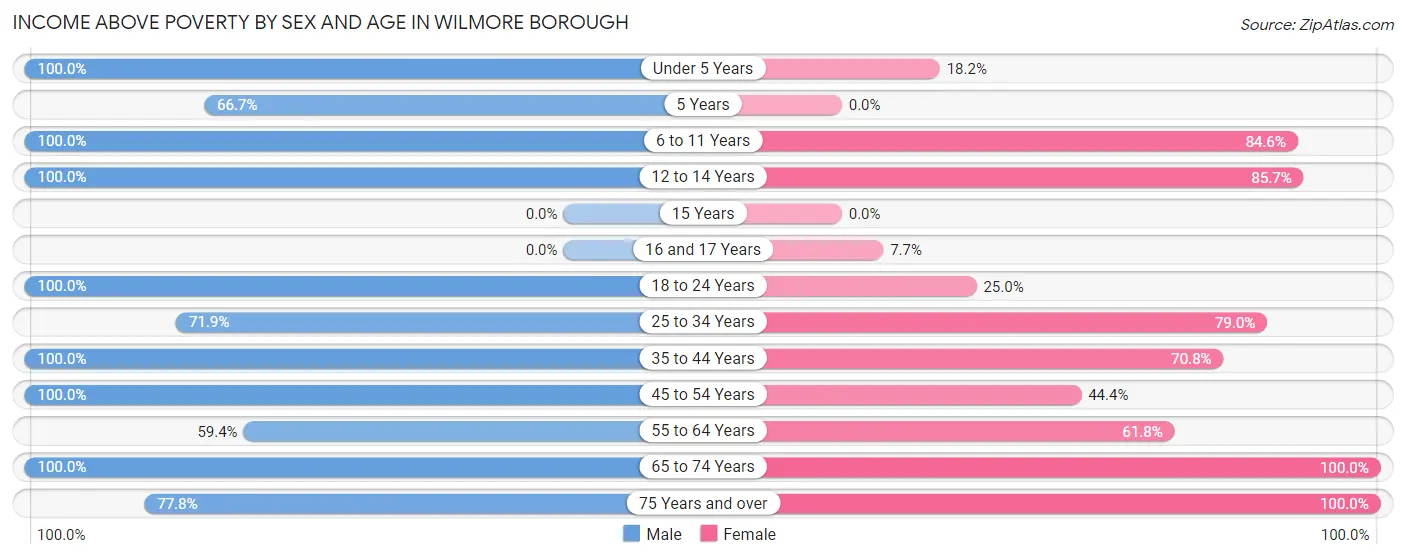
| Age Bracket | Male | Female |
| Under 5 Years | 12 (100.0%) | 4 (18.2%) |
| 5 Years | 2 (66.7%) | 0 (0.0%) |
| 6 to 11 Years | 10 (100.0%) | 11 (84.6%) |
| 12 to 14 Years | 15 (100.0%) | 6 (85.7%) |
| 15 Years | 0 (0.0%) | 0 (0.0%) |
| 16 and 17 Years | 0 (0.0%) | 1 (7.7%) |
| 18 to 24 Years | 13 (100.0%) | 4 (25.0%) |
| 25 to 34 Years | 23 (71.9%) | 30 (78.9%) |
| 35 to 44 Years | 13 (100.0%) | 17 (70.8%) |
| 45 to 54 Years | 11 (100.0%) | 12 (44.4%) |
| 55 to 64 Years | 19 (59.4%) | 21 (61.8%) |
| 65 to 74 Years | 19 (100.0%) | 16 (100.0%) |
| 75 Years and over | 7 (77.8%) | 6 (100.0%) |
| Total | 144 (85.2%) | 128 (59.3%) |
Income Below Poverty Among Married-Couple Families in Wilmore borough
The poverty statistics for married-couple families in Wilmore borough show that 17.8% or 13 of the total 73 families live below the poverty line. Families with no children have the highest poverty rate of 21.8%, comprising of 12 families. On the other hand, families with 3 or 4 children have the lowest poverty rate of 0.0%, which includes 0 families.
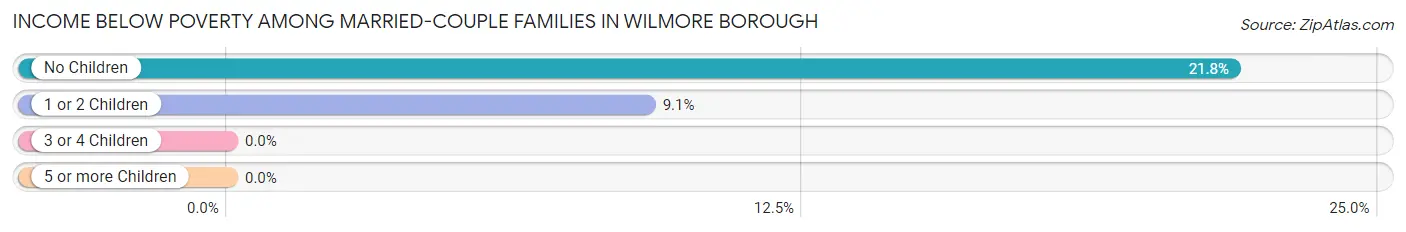
| Children | Above Poverty | Below Poverty |
| No Children | 43 (78.2%) | 12 (21.8%) |
| 1 or 2 Children | 10 (90.9%) | 1 (9.1%) |
| 3 or 4 Children | 5 (100.0%) | 0 (0.0%) |
| 5 or more Children | 2 (100.0%) | 0 (0.0%) |
| Total | 60 (82.2%) | 13 (17.8%) |
Income Below Poverty Among Single-Parent Households in Wilmore borough
According to the poverty data in Wilmore borough, 100.0% or 2 single-father households and 18.2% or 2 single-mother households are living below the poverty line. Among single-father households, those with 1 or 2 children have the highest poverty rate, with 2 households (100.0%) experiencing poverty. Likewise, among single-mother households, those with 3 or 4 children have the highest poverty rate, with 2 households (50.0%) falling below the poverty line.
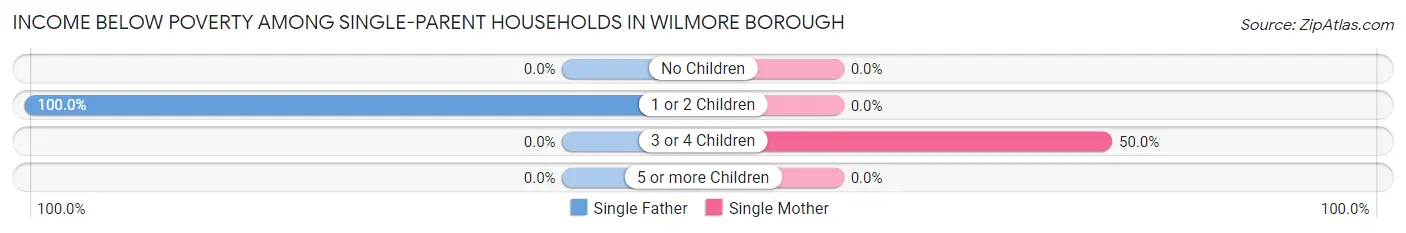
| Children | Single Father | Single Mother |
| No Children | 0 (0.0%) | 0 (0.0%) |
| 1 or 2 Children | 2 (100.0%) | 0 (0.0%) |
| 3 or 4 Children | 0 (0.0%) | 2 (50.0%) |
| 5 or more Children | 0 (0.0%) | 0 (0.0%) |
| Total | 2 (100.0%) | 2 (18.2%) |
Income Below Poverty Among Married-Couple vs Single-Parent Households in Wilmore borough
The poverty data for Wilmore borough shows that 13 of the married-couple family households (17.8%) and 4 of the single-parent households (30.8%) are living below the poverty level. Within the married-couple family households, those with no children have the highest poverty rate, with 12 households (21.8%) falling below the poverty line. Among the single-parent households, those with 3 or 4 children have the highest poverty rate, with 2 household (50.0%) living below poverty.
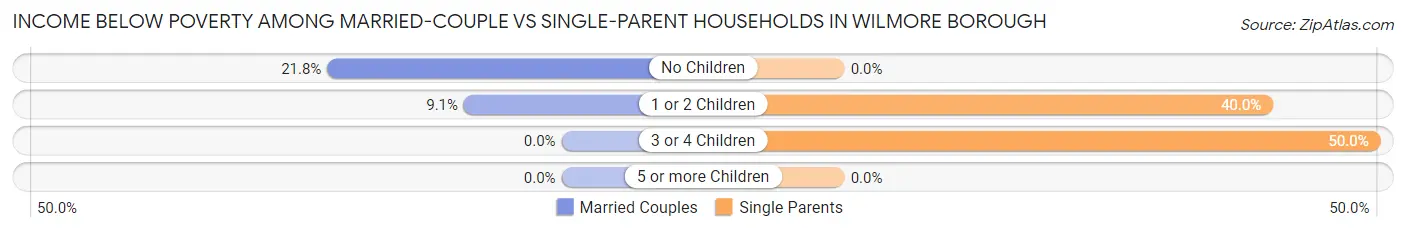
| Children | Married-Couple Families | Single-Parent Households |
| No Children | 12 (21.8%) | 0 (0.0%) |
| 1 or 2 Children | 1 (9.1%) | 2 (40.0%) |
| 3 or 4 Children | 0 (0.0%) | 2 (50.0%) |
| 5 or more Children | 0 (0.0%) | 0 (0.0%) |
| Total | 13 (17.8%) | 4 (30.8%) |
Race in Wilmore borough
The most populous races in Wilmore borough are White / Caucasian (387 | 99.2%), Hispanic or Latino (3 | 0.8%), and Two or more Races (3 | 0.8%).
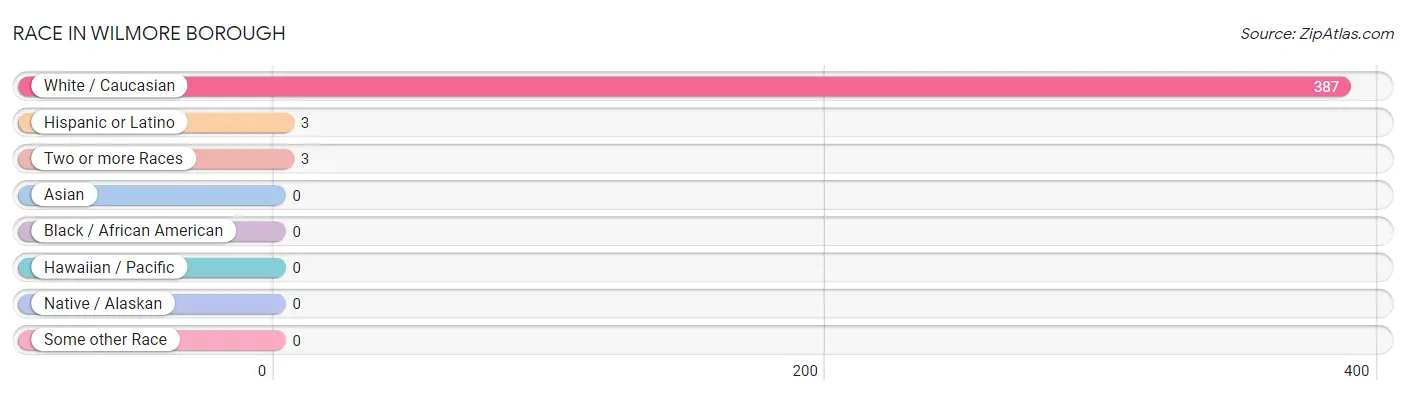
| Race | # Population | % Population |
| Asian | 0 | 0.0% |
| Black / African American | 0 | 0.0% |
| Hawaiian / Pacific | 0 | 0.0% |
| Hispanic or Latino | 3 | 0.8% |
| Native / Alaskan | 0 | 0.0% |
| White / Caucasian | 387 | 99.2% |
| Two or more Races | 3 | 0.8% |
| Some other Race | 0 | 0.0% |
| Total | 390 | 100.0% |
Ancestry in Wilmore borough
The most populous ancestries reported in Wilmore borough are German (145 | 37.2%), Arab (53 | 13.6%), Scotch-Irish (53 | 13.6%), Irish (51 | 13.1%), and Polish (29 | 7.4%), together accounting for 84.9% of all Wilmore borough residents.
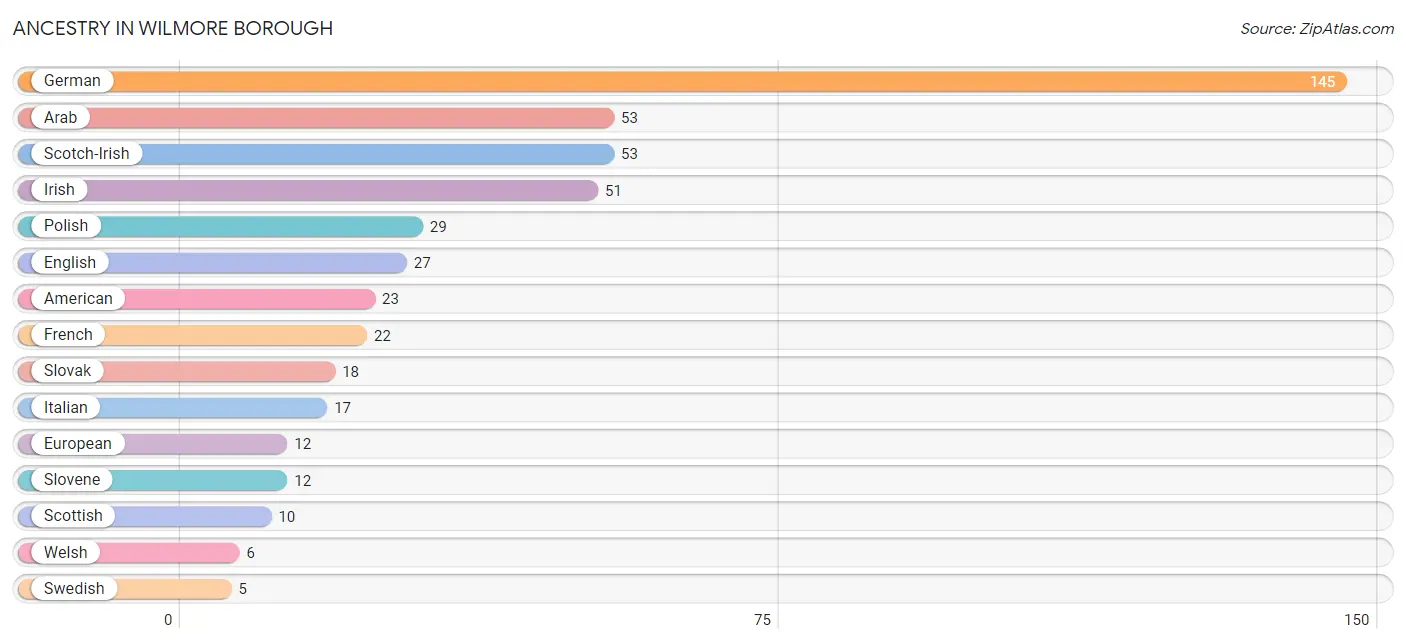
| Ancestry | # Population | % Population |
| American | 23 | 5.9% |
| Arab | 53 | 13.6% |
| Austrian | 2 | 0.5% |
| Croatian | 2 | 0.5% |
| English | 27 | 6.9% |
| European | 12 | 3.1% |
| French | 22 | 5.6% |
| German | 145 | 37.2% |
| Greek | 4 | 1.0% |
| Hungarian | 4 | 1.0% |
| Irish | 51 | 13.1% |
| Italian | 17 | 4.4% |
| Polish | 29 | 7.4% |
| Puerto Rican | 3 | 0.8% |
| Scotch-Irish | 53 | 13.6% |
| Scottish | 10 | 2.6% |
| Slavic | 4 | 1.0% |
| Slovak | 18 | 4.6% |
| Slovene | 12 | 3.1% |
| Swedish | 5 | 1.3% |
| Welsh | 6 | 1.5% | View All 21 Rows |
Immigrants in Wilmore borough

| Immigration Origin | # Population | % Population | View All 0 Rows |
Sex and Age in Wilmore borough
Sex and Age in Wilmore borough
The most populous age groups in Wilmore borough are 60 to 64 Years (26 | 15.4%) for men and 60 to 64 Years (24 | 10.9%) for women.
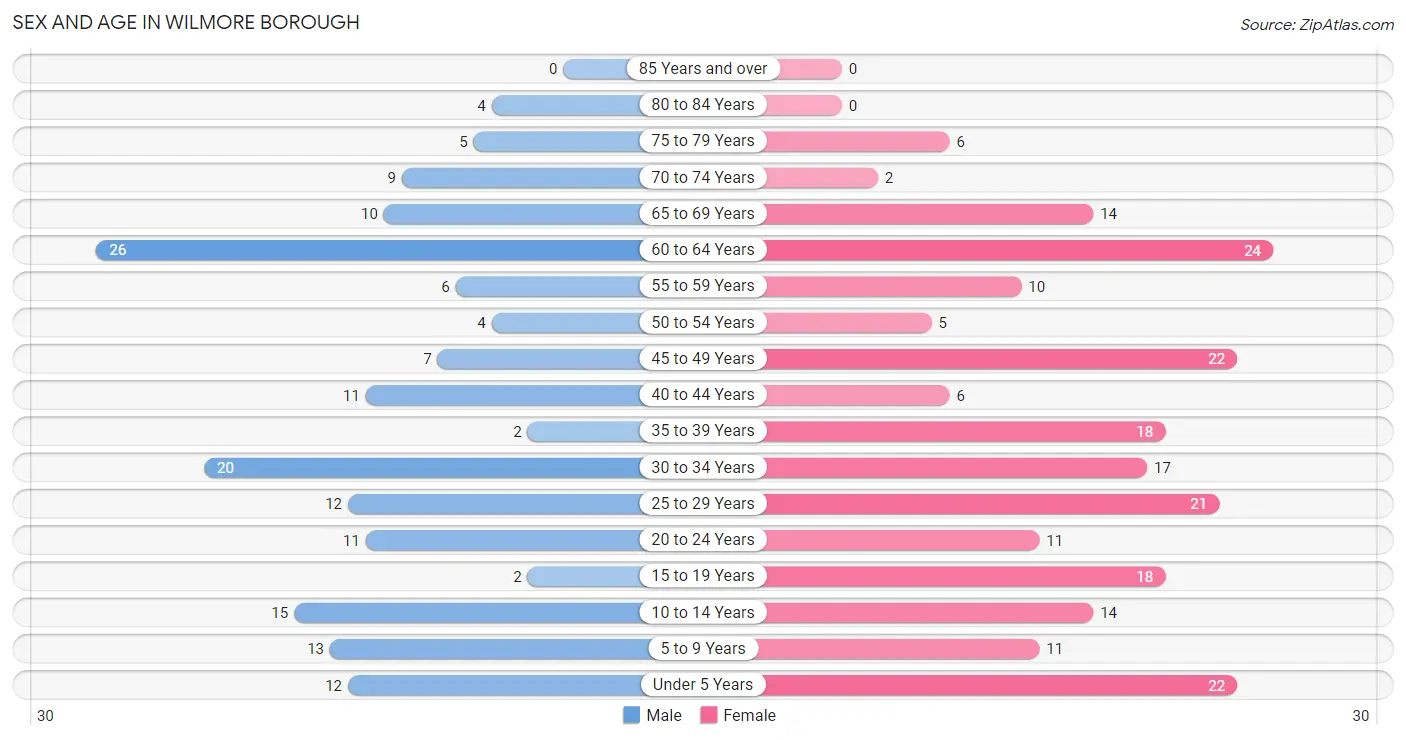
| Age Bracket | Male | Female |
| Under 5 Years | 12 (7.1%) | 22 (10.0%) |
| 5 to 9 Years | 13 (7.7%) | 11 (5.0%) |
| 10 to 14 Years | 15 (8.9%) | 14 (6.3%) |
| 15 to 19 Years | 2 (1.2%) | 18 (8.1%) |
| 20 to 24 Years | 11 (6.5%) | 11 (5.0%) |
| 25 to 29 Years | 12 (7.1%) | 21 (9.5%) |
| 30 to 34 Years | 20 (11.8%) | 17 (7.7%) |
| 35 to 39 Years | 2 (1.2%) | 18 (8.1%) |
| 40 to 44 Years | 11 (6.5%) | 6 (2.7%) |
| 45 to 49 Years | 7 (4.1%) | 22 (10.0%) |
| 50 to 54 Years | 4 (2.4%) | 5 (2.3%) |
| 55 to 59 Years | 6 (3.5%) | 10 (4.5%) |
| 60 to 64 Years | 26 (15.4%) | 24 (10.9%) |
| 65 to 69 Years | 10 (5.9%) | 14 (6.3%) |
| 70 to 74 Years | 9 (5.3%) | 2 (0.9%) |
| 75 to 79 Years | 5 (3.0%) | 6 (2.7%) |
| 80 to 84 Years | 4 (2.4%) | 0 (0.0%) |
| 85 Years and over | 0 (0.0%) | 0 (0.0%) |
| Total | 169 (100.0%) | 221 (100.0%) |
Families and Households in Wilmore borough
Median Family Size in Wilmore borough
The median family size in Wilmore borough is 3.72 persons per family, with married-couple families (73 | 84.9%) accounting for the largest median family size of 3.85 persons per family. On the other hand, single male/father families (2 | 2.3%) represent the smallest median family size with 2.00 persons per family.
| Family Type | # Families | Family Size |
| Married-Couple | 73 (84.9%) | 3.85 |
| Single Male/Father | 2 (2.3%) | 2.00 |
| Single Female/Mother | 11 (12.8%) | 3.18 |
| Total Families | 86 (100.0%) | 3.72 |
Median Household Size in Wilmore borough
The median household size in Wilmore borough is 3.51 persons per household, with married-couple households (73 | 65.8%) accounting for the largest median household size of 4.11 persons per household. non-family households (25 | 22.5%) represent the smallest median household size with 1.88 persons per household.
| Household Type | # Households | Household Size |
| Married-Couple | 73 (65.8%) | 4.11 |
| Single Male/Father | 2 (1.8%) | 2.00 |
| Single Female/Mother | 11 (9.9%) | 3.55 |
| Non-family | 25 (22.5%) | 1.88 |
| Total Households | 111 (100.0%) | 3.51 |
Household Size by Marriage Status in Wilmore borough
Out of a total of 111 households in Wilmore borough, 86 (77.5%) are family households, while 25 (22.5%) are nonfamily households. The most numerous type of family households are 2-person households, comprising 45, and the most common type of nonfamily households are 1-person households, comprising 11.
| Household Size | Family Households | Nonfamily Households |
| 1-Person Households | - | 11 (9.9%) |
| 2-Person Households | 45 (40.5%) | 10 (9.0%) |
| 3-Person Households | 15 (13.5%) | 4 (3.6%) |
| 4-Person Households | 12 (10.8%) | 0 (0.0%) |
| 5-Person Households | 7 (6.3%) | 0 (0.0%) |
| 6-Person Households | 0 (0.0%) | 0 (0.0%) |
| 7+ Person Households | 7 (6.3%) | 0 (0.0%) |
| Total | 86 (77.5%) | 25 (22.5%) |
Female Fertility in Wilmore borough
Fertility by Age in Wilmore borough
| Age Bracket | Women with Births | Births / 1,000 Women |
| 15 to 19 years | 0 (0.0%) | 0.0 |
| 20 to 34 years | 0 (0.0%) | 0.0 |
| 35 to 50 years | 0 (0.0%) | 0.0 |
| Total | 0 (0.0%) | 0.0 |
Fertility by Age by Marriage Status in Wilmore borough
| Age Bracket | Married | Unmarried |
| 15 to 19 years | 0 (0.0%) | 0 (0.0%) |
| 20 to 34 years | 0 (0.0%) | 0 (0.0%) |
| 35 to 50 years | 0 (0.0%) | 0 (0.0%) |
| Total | 0 (0.0%) | 0 (0.0%) |
Fertility by Education in Wilmore borough
| Educational Attainment | Women with Births | Births / 1,000 Women |
| Less than High School | 0 (0.0%) | 0.0 |
| High School Diploma | 0 (0.0%) | 0.0 |
| College or Associate's Degree | 0 (0.0%) | 0.0 |
| Bachelor's Degree | 0 (0.0%) | 0.0 |
| Graduate Degree | 0 (0.0%) | 0.0 |
| Total | 0 (0.0%) | 0.0 |
Fertility by Education by Marriage Status in Wilmore borough
| Educational Attainment | Married | Unmarried |
| Less than High School | 0 (0.0%) | 0 (0.0%) |
| High School Diploma | 0 (0.0%) | 0 (0.0%) |
| College or Associate's Degree | 0 (0.0%) | 0 (0.0%) |
| Bachelor's Degree | 0 (0.0%) | 0 (0.0%) |
| Graduate Degree | 0 (0.0%) | 0 (0.0%) |
| Total | 0 (0.0%) | 0 (0.0%) |
Employment Characteristics in Wilmore borough
Employment by Class of Employer in Wilmore borough
Among the 146 employed individuals in Wilmore borough, private company employees (87 | 59.6%), not-for-profit organizations (22 | 15.1%), and local government employees (14 | 9.6%) make up the most common classes of employment.
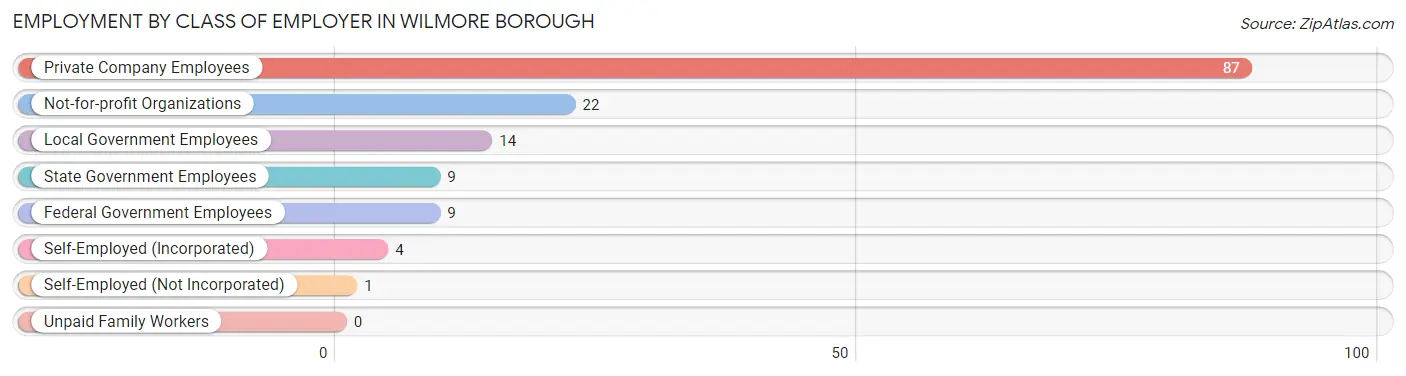
| Employer Class | # Employees | % Employees |
| Private Company Employees | 87 | 59.6% |
| Self-Employed (Incorporated) | 4 | 2.7% |
| Self-Employed (Not Incorporated) | 1 | 0.7% |
| Not-for-profit Organizations | 22 | 15.1% |
| Local Government Employees | 14 | 9.6% |
| State Government Employees | 9 | 6.2% |
| Federal Government Employees | 9 | 6.2% |
| Unpaid Family Workers | 0 | 0.0% |
| Total | 146 | 100.0% |
Employment Status by Age in Wilmore borough
According to the labor force statistics for Wilmore borough, out of the total population over 16 years of age (303), 50.2% or 152 individuals are in the labor force, with 1.3% or 2 of them unemployed. The age group with the highest labor force participation rate is 55 to 59 years, with 87.5% or 14 individuals in the labor force. Within the labor force, the 30 to 34 years age range has the highest percentage of unemployed individuals, with 6.9% or 2 of them being unemployed.
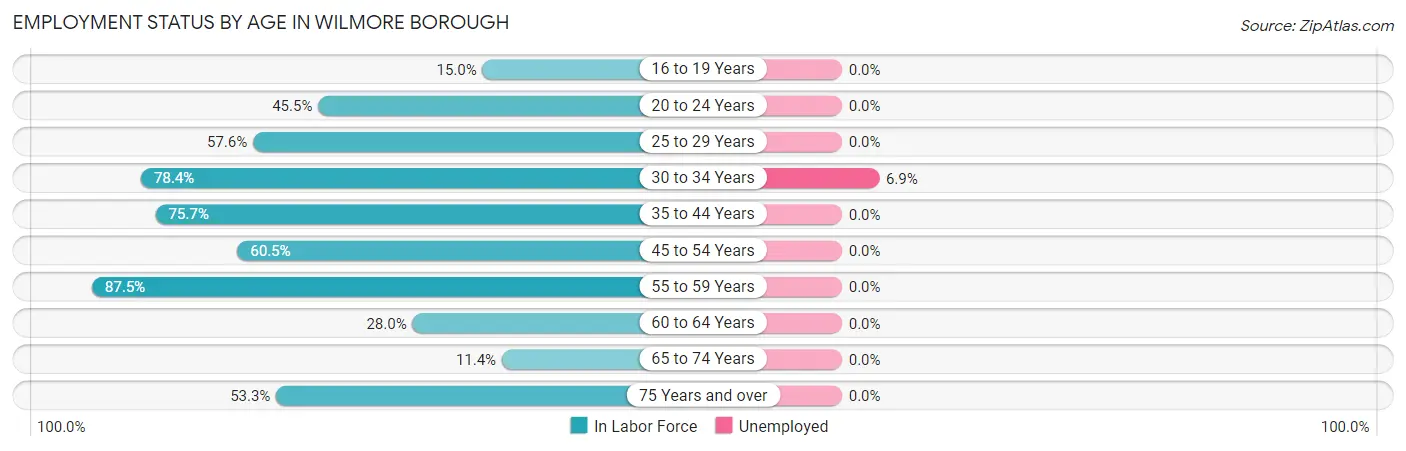
| Age Bracket | In Labor Force | Unemployed |
| 16 to 19 Years | 3 (15.0%) | 0 (0.0%) |
| 20 to 24 Years | 10 (45.5%) | 0 (0.0%) |
| 25 to 29 Years | 19 (57.6%) | 0 (0.0%) |
| 30 to 34 Years | 29 (78.4%) | 2 (6.9%) |
| 35 to 44 Years | 28 (75.7%) | 0 (0.0%) |
| 45 to 54 Years | 23 (60.5%) | 0 (0.0%) |
| 55 to 59 Years | 14 (87.5%) | 0 (0.0%) |
| 60 to 64 Years | 14 (28.0%) | 0 (0.0%) |
| 65 to 74 Years | 4 (11.4%) | 0 (0.0%) |
| 75 Years and over | 8 (53.3%) | 0 (0.0%) |
| Total | 152 (50.2%) | 2 (1.3%) |
Employment Status by Educational Attainment in Wilmore borough
According to labor force statistics for Wilmore borough, 60.2% of individuals (127) out of the total population between 25 and 64 years of age (211) are in the labor force, with 1.6% or 2 of them being unemployed. The group with the highest labor force participation rate are those with the educational attainment of college / associate degree, with 91.5% or 43 individuals in the labor force. Within the labor force, individuals with college / associate degree education have the highest percentage of unemployment, with 4.7% or 2 of them being unemployed.
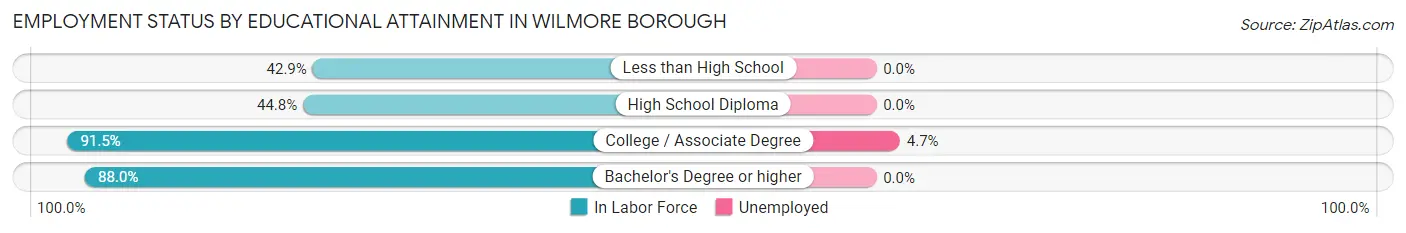
| Educational Attainment | In Labor Force | Unemployed |
| Less than High School | 6 (42.9%) | 0 (0.0%) |
| High School Diploma | 56 (44.8%) | 0 (0.0%) |
| College / Associate Degree | 43 (91.5%) | 2 (4.7%) |
| Bachelor's Degree or higher | 22 (88.0%) | 0 (0.0%) |
| Total | 127 (60.2%) | 3 (1.6%) |
Employment Occupations by Sex in Wilmore borough
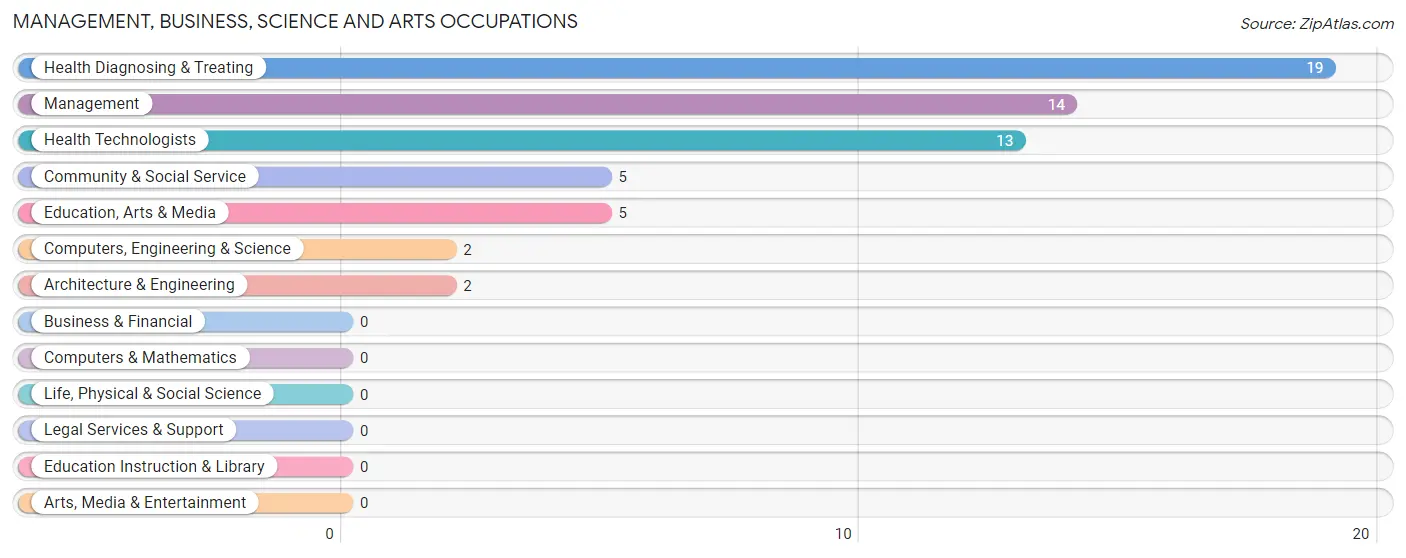
Management, Business, Science and Arts Occupations
The most common Management, Business, Science and Arts occupations in Wilmore borough are Health Diagnosing & Treating (19 | 12.7%), Management (14 | 9.3%), Health Technologists (13 | 8.7%), Community & Social Service (5 | 3.3%), and Education, Arts & Media (5 | 3.3%).
Management, Business, Science and Arts Occupations by Sex
Within the Management, Business, Science and Arts occupations in Wilmore borough, the most male-oriented occupations are Computers, Engineering & Science (100.0%), Architecture & Engineering (100.0%), and Management (92.9%), while the most female-oriented occupations are Health Diagnosing & Treating (100.0%), Health Technologists (100.0%), and Community & Social Service (60.0%).
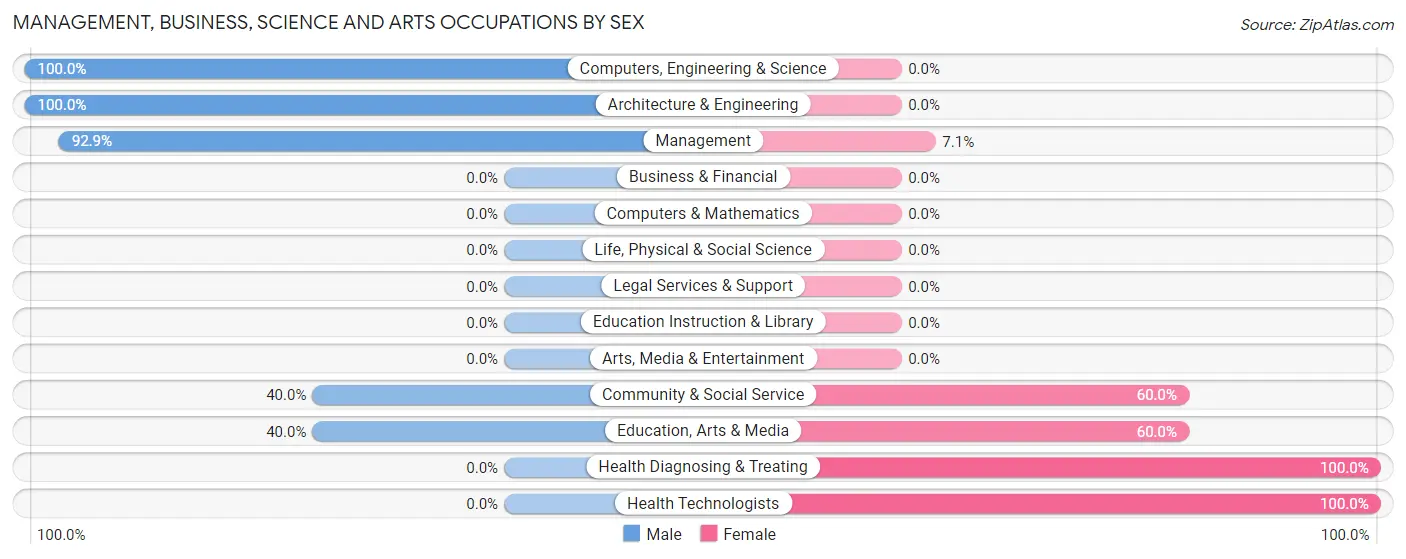
| Occupation | Male | Female |
| Management | 13 (92.9%) | 1 (7.1%) |
| Business & Financial | 0 (0.0%) | 0 (0.0%) |
| Computers, Engineering & Science | 2 (100.0%) | 0 (0.0%) |
| Computers & Mathematics | 0 (0.0%) | 0 (0.0%) |
| Architecture & Engineering | 2 (100.0%) | 0 (0.0%) |
| Life, Physical & Social Science | 0 (0.0%) | 0 (0.0%) |
| Community & Social Service | 2 (40.0%) | 3 (60.0%) |
| Education, Arts & Media | 2 (40.0%) | 3 (60.0%) |
| Legal Services & Support | 0 (0.0%) | 0 (0.0%) |
| Education Instruction & Library | 0 (0.0%) | 0 (0.0%) |
| Arts, Media & Entertainment | 0 (0.0%) | 0 (0.0%) |
| Health Diagnosing & Treating | 0 (0.0%) | 19 (100.0%) |
| Health Technologists | 0 (0.0%) | 13 (100.0%) |
| Total (Category) | 17 (42.5%) | 23 (57.5%) |
| Total (Overall) | 69 (46.0%) | 81 (54.0%) |
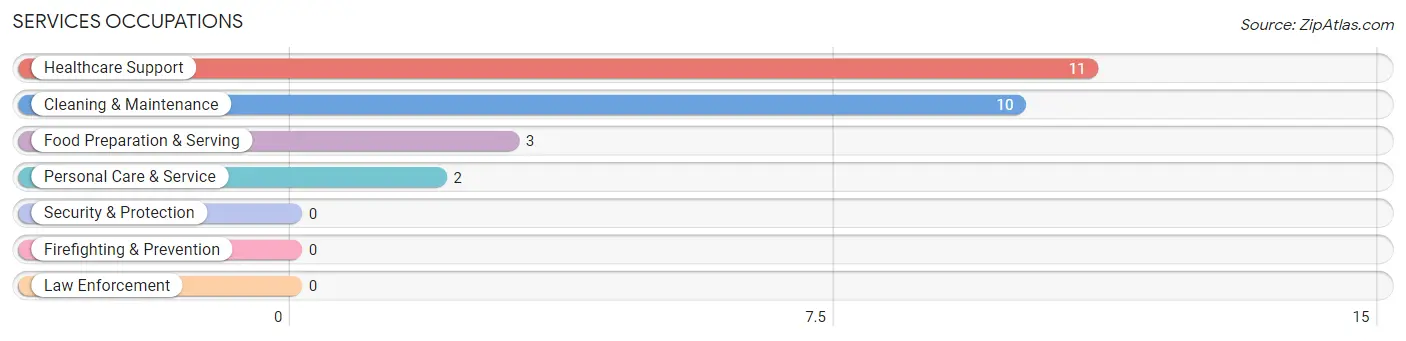
Services Occupations
The most common Services occupations in Wilmore borough are Healthcare Support (11 | 7.3%), Cleaning & Maintenance (10 | 6.7%), Food Preparation & Serving (3 | 2.0%), and Personal Care & Service (2 | 1.3%).
Services Occupations by Sex
Within the Services occupations in Wilmore borough, the most male-oriented occupations are Cleaning & Maintenance (60.0%), and Food Preparation & Serving (33.3%), while the most female-oriented occupations are Healthcare Support (100.0%), Personal Care & Service (100.0%), and Food Preparation & Serving (66.7%).
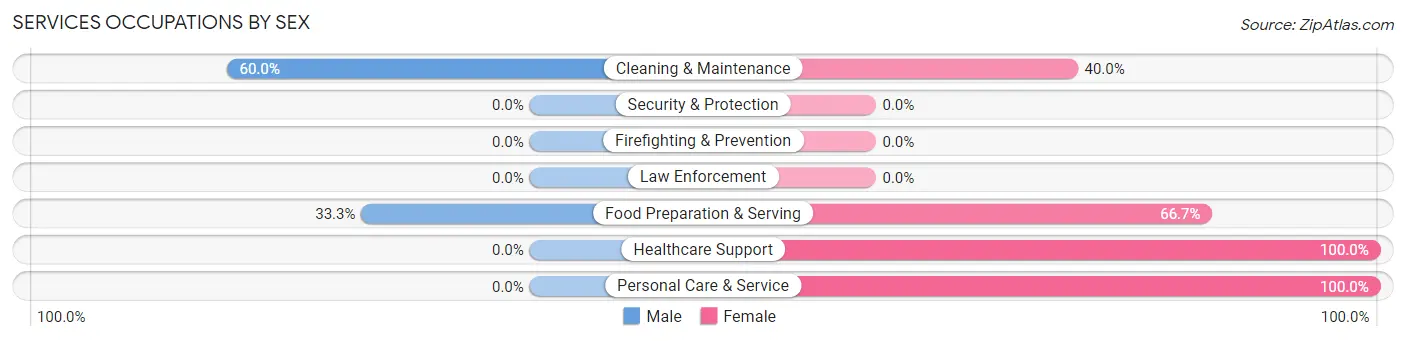
| Occupation | Male | Female |
| Healthcare Support | 0 (0.0%) | 11 (100.0%) |
| Security & Protection | 0 (0.0%) | 0 (0.0%) |
| Firefighting & Prevention | 0 (0.0%) | 0 (0.0%) |
| Law Enforcement | 0 (0.0%) | 0 (0.0%) |
| Food Preparation & Serving | 1 (33.3%) | 2 (66.7%) |
| Cleaning & Maintenance | 6 (60.0%) | 4 (40.0%) |
| Personal Care & Service | 0 (0.0%) | 2 (100.0%) |
| Total (Category) | 7 (26.9%) | 19 (73.1%) |
| Total (Overall) | 69 (46.0%) | 81 (54.0%) |
Sales and Office Occupations
The most common Sales and Office occupations in Wilmore borough are Office & Administration (27 | 18.0%), and Sales & Related (10 | 6.7%).

Sales and Office Occupations by Sex
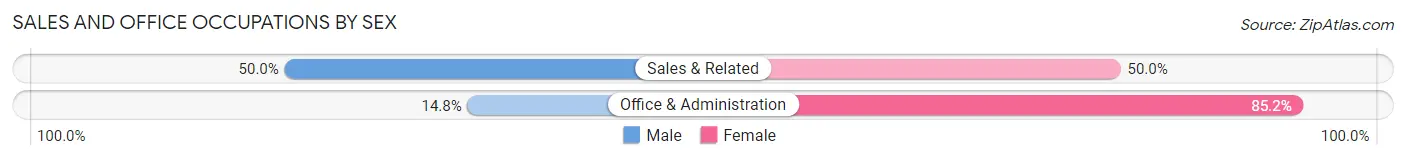
| Occupation | Male | Female |
| Sales & Related | 5 (50.0%) | 5 (50.0%) |
| Office & Administration | 4 (14.8%) | 23 (85.2%) |
| Total (Category) | 9 (24.3%) | 28 (75.7%) |
| Total (Overall) | 69 (46.0%) | 81 (54.0%) |
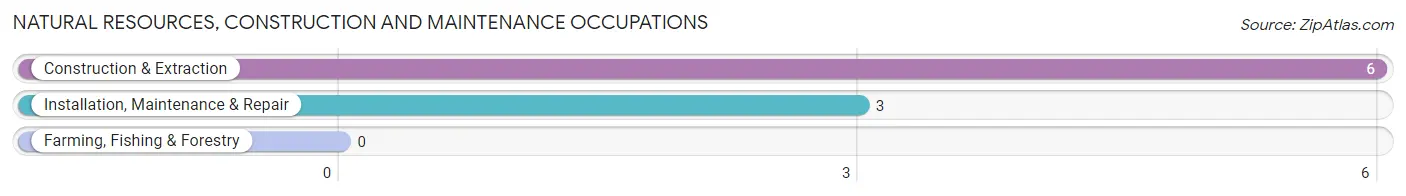
Natural Resources, Construction and Maintenance Occupations
The most common Natural Resources, Construction and Maintenance occupations in Wilmore borough are Construction & Extraction (6 | 4.0%), and Installation, Maintenance & Repair (3 | 2.0%).
Natural Resources, Construction and Maintenance Occupations by Sex
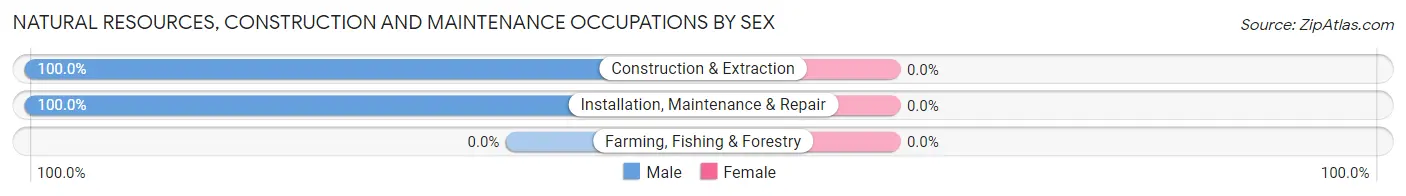
| Occupation | Male | Female |
| Farming, Fishing & Forestry | 0 (0.0%) | 0 (0.0%) |
| Construction & Extraction | 6 (100.0%) | 0 (0.0%) |
| Installation, Maintenance & Repair | 3 (100.0%) | 0 (0.0%) |
| Total (Category) | 9 (100.0%) | 0 (0.0%) |
| Total (Overall) | 69 (46.0%) | 81 (54.0%) |
Production, Transportation and Moving Occupations
The most common Production, Transportation and Moving occupations in Wilmore borough are Production (22 | 14.7%), Transportation (10 | 6.7%), and Material Moving (6 | 4.0%).
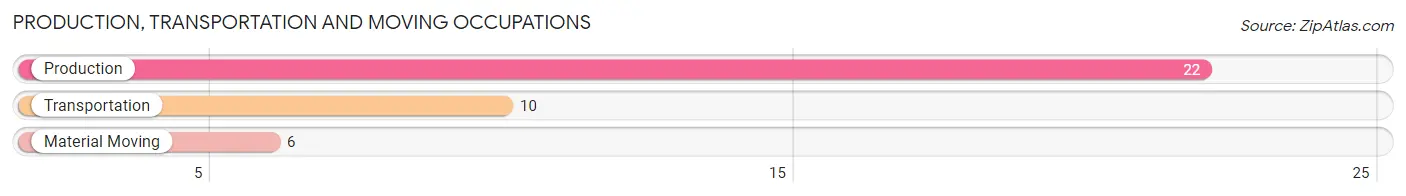
Production, Transportation and Moving Occupations by Sex
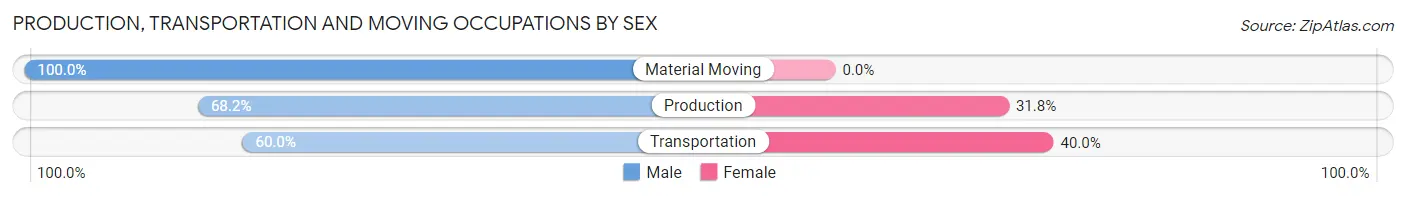
| Occupation | Male | Female |
| Production | 15 (68.2%) | 7 (31.8%) |
| Transportation | 6 (60.0%) | 4 (40.0%) |
| Material Moving | 6 (100.0%) | 0 (0.0%) |
| Total (Category) | 27 (71.1%) | 11 (28.9%) |
| Total (Overall) | 69 (46.0%) | 81 (54.0%) |
Employment Industries by Sex in Wilmore borough
Employment Industries in Wilmore borough
The major employment industries in Wilmore borough include Health Care & Social Assistance (35 | 23.3%), Manufacturing (32 | 21.3%), Public Administration (20 | 13.3%), Construction (11 | 7.3%), and Transportation & Warehousing (11 | 7.3%).
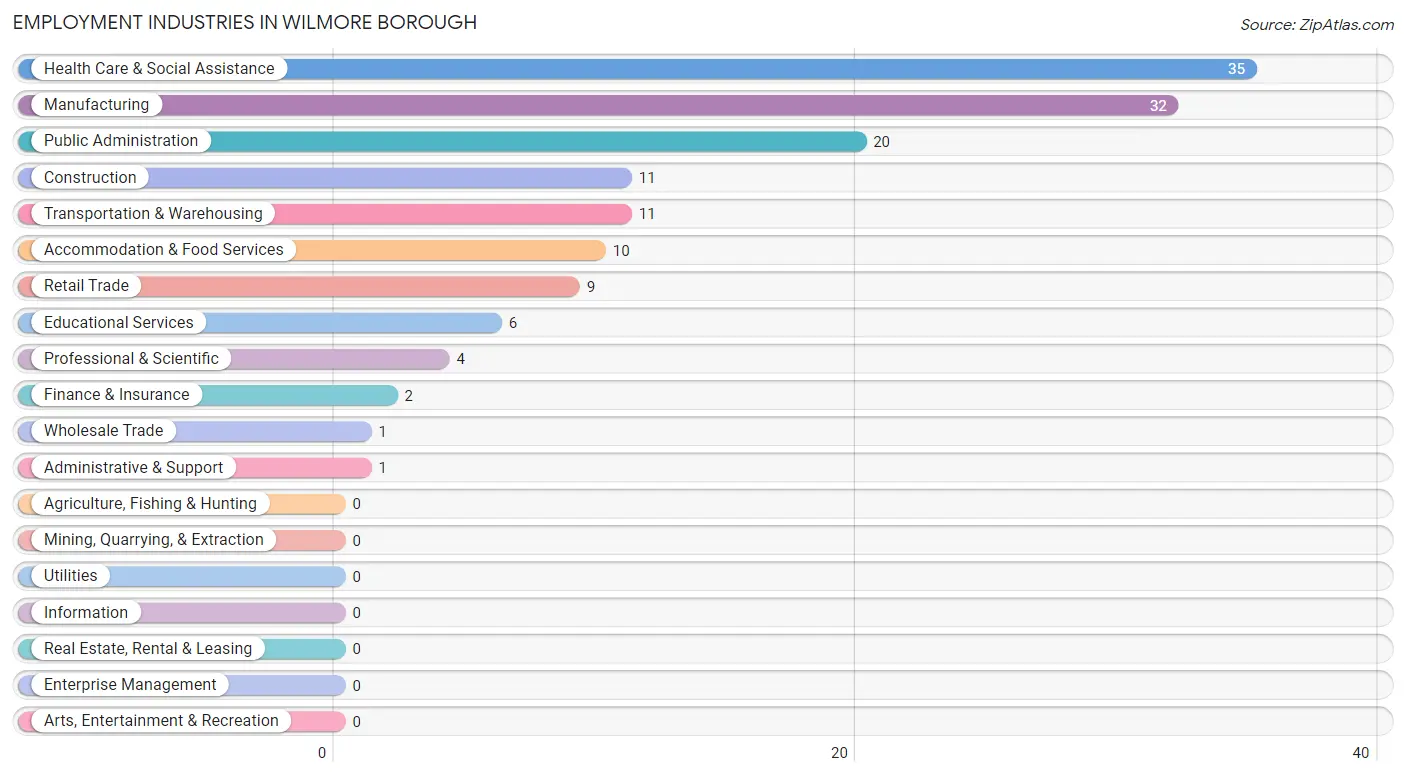
Employment Industries by Sex in Wilmore borough
The Wilmore borough industries that see more men than women are Administrative & Support (100.0%), Construction (81.8%), and Accommodation & Food Services (80.0%), whereas the industries that tend to have a higher number of women are Wholesale Trade (100.0%), Finance & Insurance (100.0%), and Professional & Scientific (100.0%).
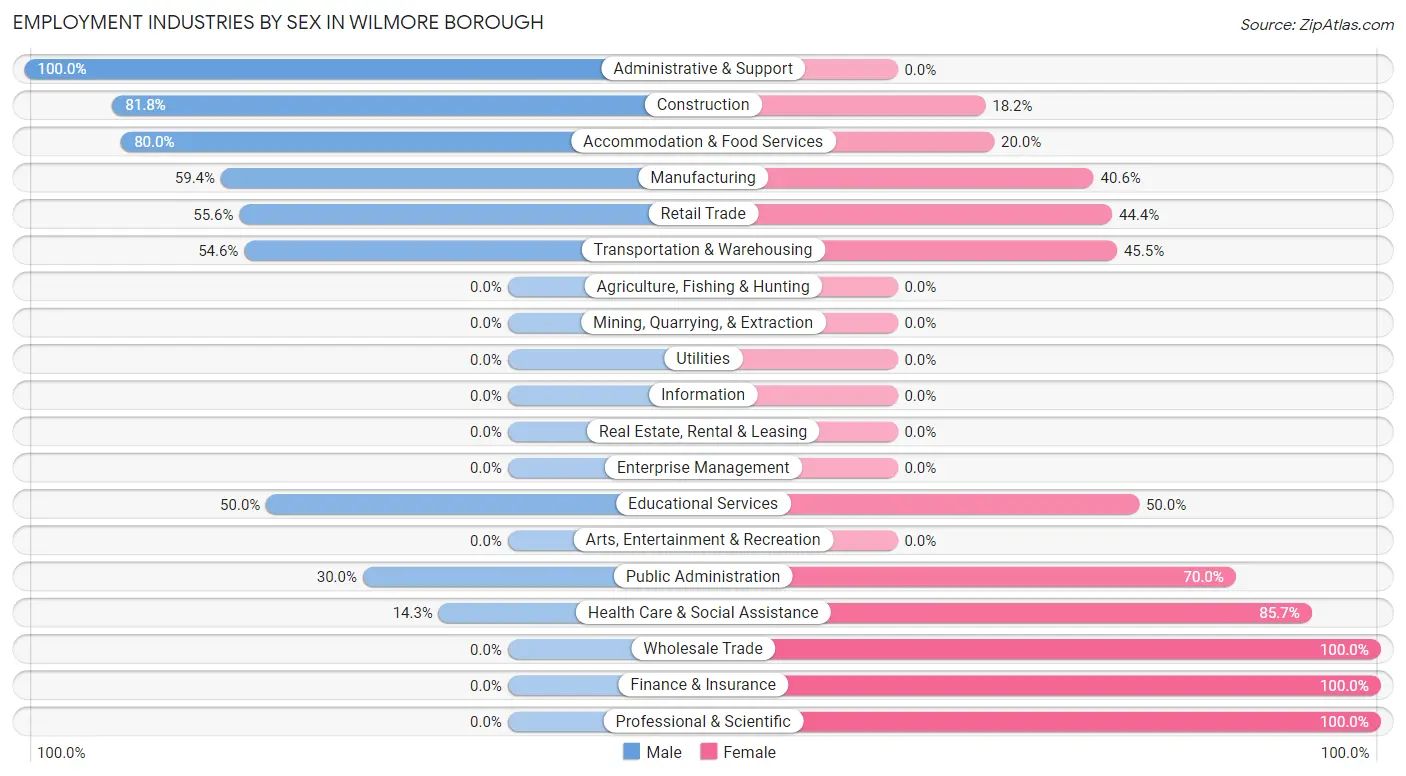
| Industry | Male | Female |
| Agriculture, Fishing & Hunting | 0 (0.0%) | 0 (0.0%) |
| Mining, Quarrying, & Extraction | 0 (0.0%) | 0 (0.0%) |
| Construction | 9 (81.8%) | 2 (18.2%) |
| Manufacturing | 19 (59.4%) | 13 (40.6%) |
| Wholesale Trade | 0 (0.0%) | 1 (100.0%) |
| Retail Trade | 5 (55.6%) | 4 (44.4%) |
| Transportation & Warehousing | 6 (54.5%) | 5 (45.5%) |
| Utilities | 0 (0.0%) | 0 (0.0%) |
| Information | 0 (0.0%) | 0 (0.0%) |
| Finance & Insurance | 0 (0.0%) | 2 (100.0%) |
| Real Estate, Rental & Leasing | 0 (0.0%) | 0 (0.0%) |
| Professional & Scientific | 0 (0.0%) | 4 (100.0%) |
| Enterprise Management | 0 (0.0%) | 0 (0.0%) |
| Administrative & Support | 1 (100.0%) | 0 (0.0%) |
| Educational Services | 3 (50.0%) | 3 (50.0%) |
| Health Care & Social Assistance | 5 (14.3%) | 30 (85.7%) |
| Arts, Entertainment & Recreation | 0 (0.0%) | 0 (0.0%) |
| Accommodation & Food Services | 8 (80.0%) | 2 (20.0%) |
| Public Administration | 6 (30.0%) | 14 (70.0%) |
| Total | 69 (46.0%) | 81 (54.0%) |
Education in Wilmore borough
School Enrollment in Wilmore borough
The most common levels of schooling among the 69 students in Wilmore borough are elementary school (24 | 34.8%), high school (18 | 26.1%), and middle school (13 | 18.8%).
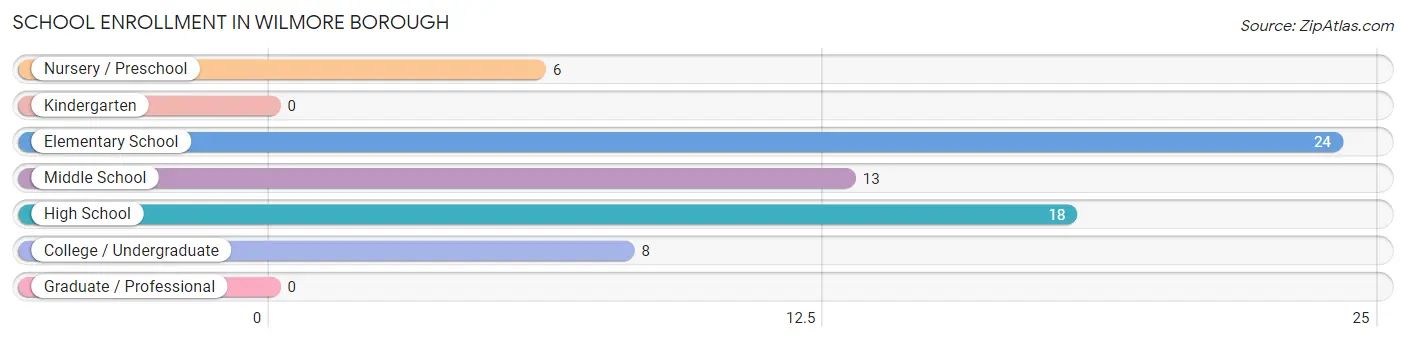
| School Level | # Students | % Students |
| Nursery / Preschool | 6 | 8.7% |
| Kindergarten | 0 | 0.0% |
| Elementary School | 24 | 34.8% |
| Middle School | 13 | 18.8% |
| High School | 18 | 26.1% |
| College / Undergraduate | 8 | 11.6% |
| Graduate / Professional | 0 | 0.0% |
| Total | 69 | 100.0% |
School Enrollment by Age by Funding Source in Wilmore borough
Out of a total of 69 students who are enrolled in schools in Wilmore borough, 7 (10.1%) attend a private institution, while the remaining 62 (89.9%) are enrolled in public schools. The age group of 25 to 34 year olds has the highest likelihood of being enrolled in private schools, with 5 (100.0% in the age bracket) enrolled. Conversely, the age group of 3 to 4 year olds has the lowest likelihood of being enrolled in a private school, with 3 (100.0% in the age bracket) attending a public institution.
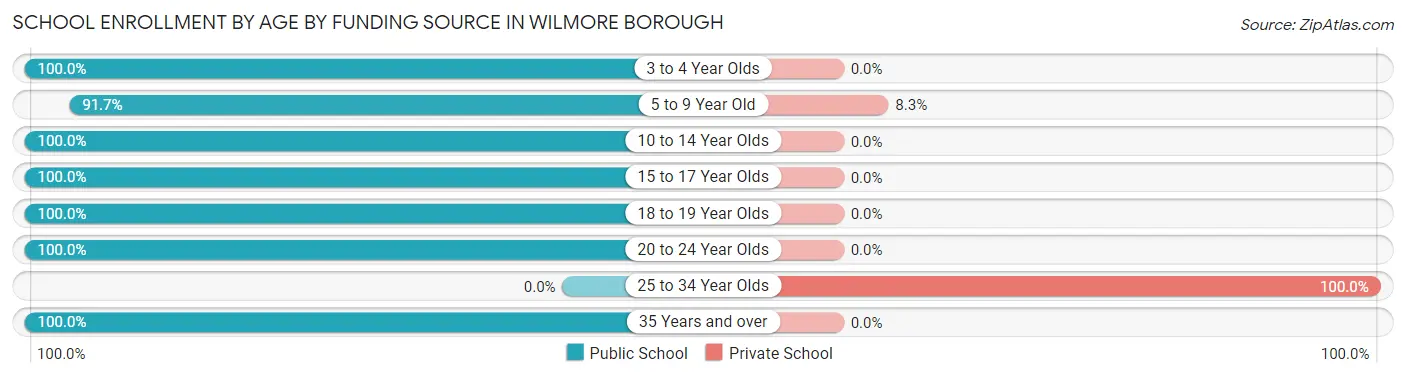
| Age Bracket | Public School | Private School |
| 3 to 4 Year Olds | 3 (100.0%) | 0 (0.0%) |
| 5 to 9 Year Old | 22 (91.7%) | 2 (8.3%) |
| 10 to 14 Year Olds | 29 (100.0%) | 0 (0.0%) |
| 15 to 17 Year Olds | 1 (100.0%) | 0 (0.0%) |
| 18 to 19 Year Olds | 4 (100.0%) | 0 (0.0%) |
| 20 to 24 Year Olds | 1 (100.0%) | 0 (0.0%) |
| 25 to 34 Year Olds | 0 (0.0%) | 5 (100.0%) |
| 35 Years and over | 2 (100.0%) | 0 (0.0%) |
| Total | 62 (89.9%) | 7 (10.1%) |
Educational Attainment by Field of Study in Wilmore borough
Education (9 | 25.7%), computers & mathematics (5 | 14.3%), psychology (4 | 11.4%), business (3 | 8.6%), and communications (3 | 8.6%) are the most common fields of study among 35 individuals in Wilmore borough who have obtained a bachelor's degree or higher.
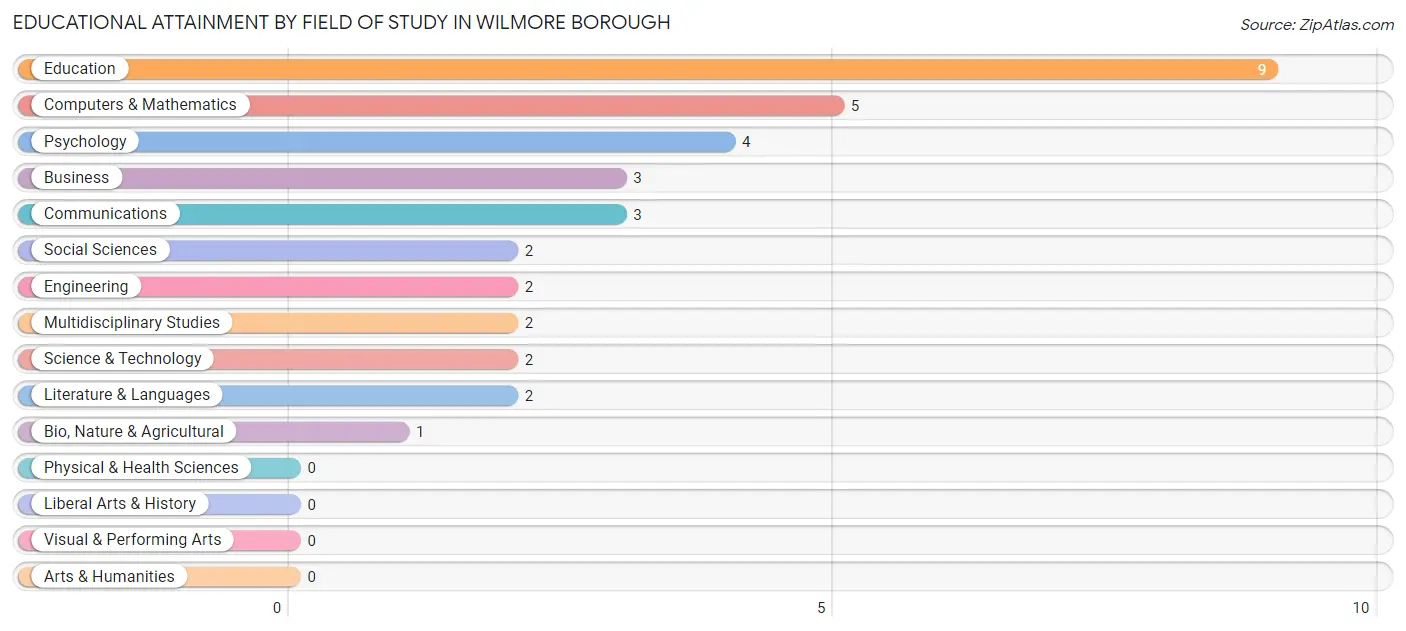
| Field of Study | # Graduates | % Graduates |
| Computers & Mathematics | 5 | 14.3% |
| Bio, Nature & Agricultural | 1 | 2.9% |
| Physical & Health Sciences | 0 | 0.0% |
| Psychology | 4 | 11.4% |
| Social Sciences | 2 | 5.7% |
| Engineering | 2 | 5.7% |
| Multidisciplinary Studies | 2 | 5.7% |
| Science & Technology | 2 | 5.7% |
| Business | 3 | 8.6% |
| Education | 9 | 25.7% |
| Literature & Languages | 2 | 5.7% |
| Liberal Arts & History | 0 | 0.0% |
| Visual & Performing Arts | 0 | 0.0% |
| Communications | 3 | 8.6% |
| Arts & Humanities | 0 | 0.0% |
| Total | 35 | 100.0% |
Transportation & Commute in Wilmore borough
Vehicle Availability by Sex in Wilmore borough
The most prevalent vehicle ownership categories in Wilmore borough are males with 4 vehicles (29, accounting for 42.0%) and females with 4 vehicles (18, making up 37.7%).
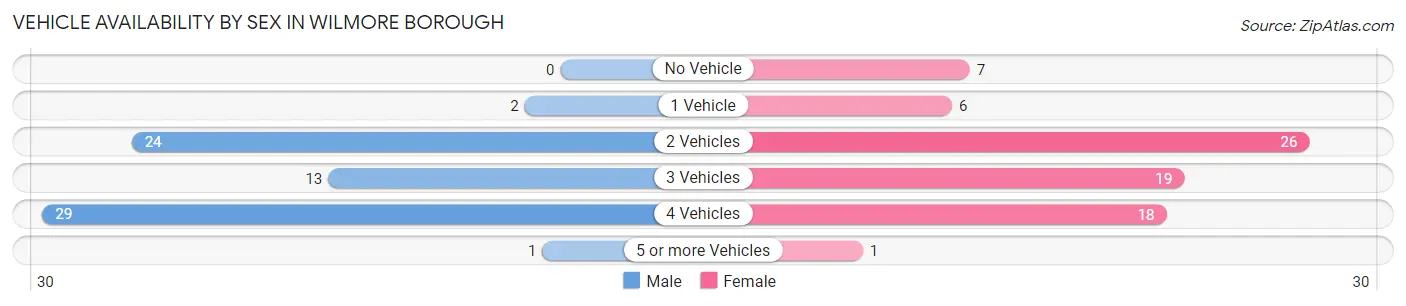
| Vehicles Available | Male | Female |
| No Vehicle | 0 (0.0%) | 7 (9.1%) |
| 1 Vehicle | 2 (2.9%) | 6 (7.8%) |
| 2 Vehicles | 24 (34.8%) | 26 (33.8%) |
| 3 Vehicles | 13 (18.8%) | 19 (24.7%) |
| 4 Vehicles | 29 (42.0%) | 18 (23.4%) |
| 5 or more Vehicles | 1 (1.5%) | 1 (1.3%) |
| Total | 69 (100.0%) | 77 (100.0%) |
Commute Time in Wilmore borough
The most frequently occuring commute durations in Wilmore borough are 10 to 14 minutes (46 commuters, 35.1%), 30 to 34 minutes (24 commuters, 18.3%), and 15 to 19 minutes (19 commuters, 14.5%).
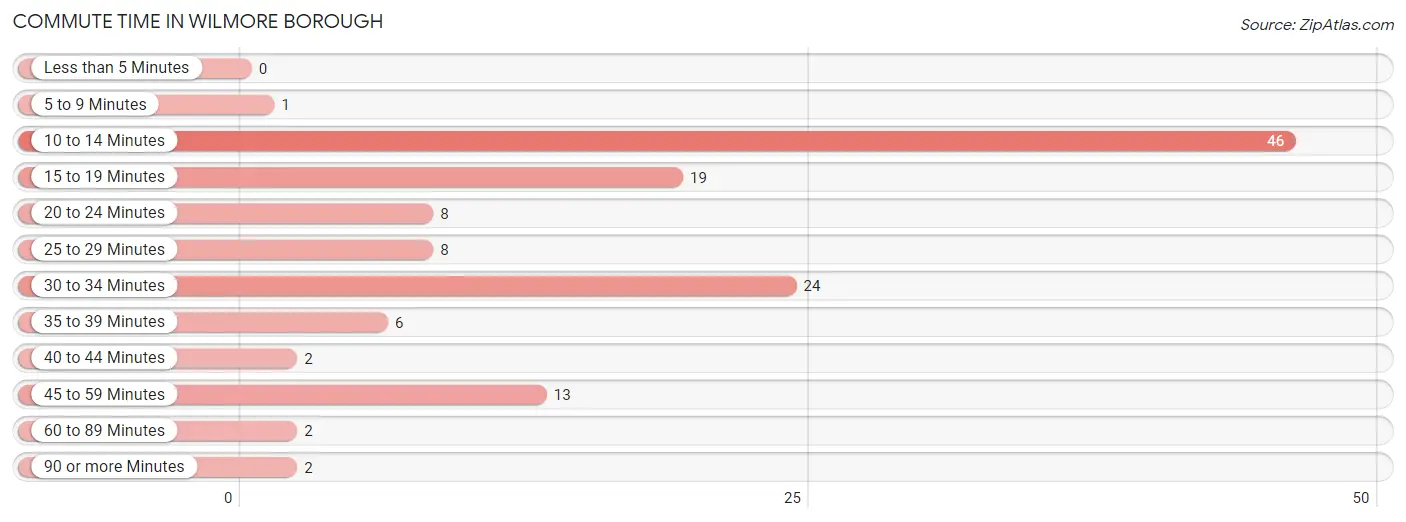
| Commute Time | # Commuters | % Commuters |
| Less than 5 Minutes | 0 | 0.0% |
| 5 to 9 Minutes | 1 | 0.8% |
| 10 to 14 Minutes | 46 | 35.1% |
| 15 to 19 Minutes | 19 | 14.5% |
| 20 to 24 Minutes | 8 | 6.1% |
| 25 to 29 Minutes | 8 | 6.1% |
| 30 to 34 Minutes | 24 | 18.3% |
| 35 to 39 Minutes | 6 | 4.6% |
| 40 to 44 Minutes | 2 | 1.5% |
| 45 to 59 Minutes | 13 | 9.9% |
| 60 to 89 Minutes | 2 | 1.5% |
| 90 or more Minutes | 2 | 1.5% |
Commute Time by Sex in Wilmore borough
The most common commute times in Wilmore borough are 10 to 14 minutes (20 commuters, 31.2%) for males and 10 to 14 minutes (26 commuters, 38.8%) for females.
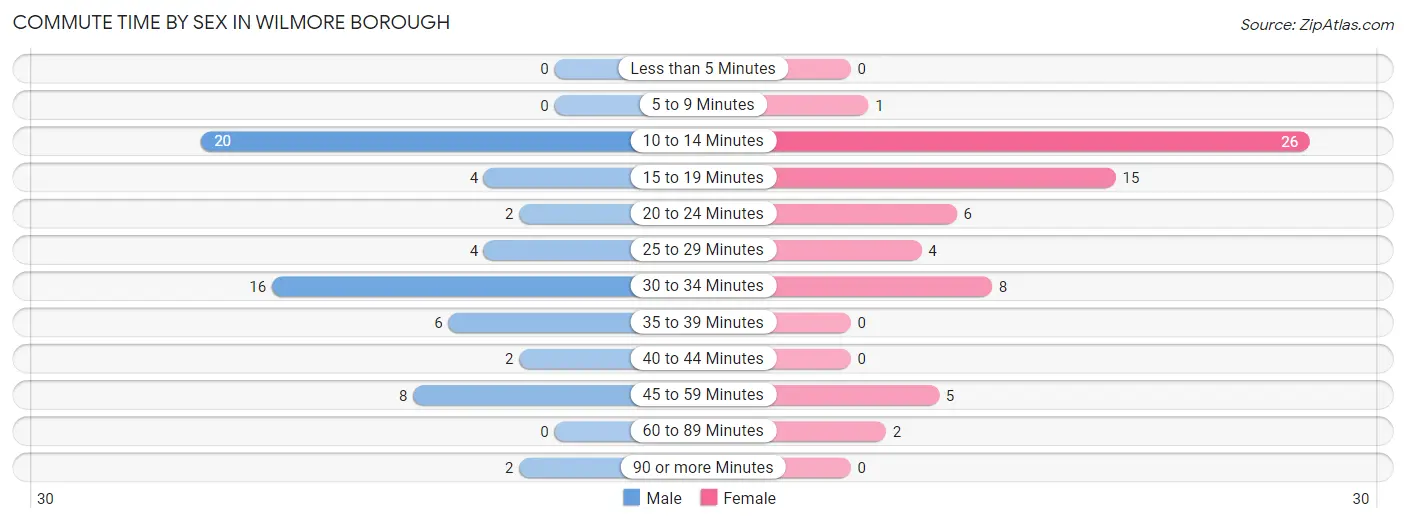
| Commute Time | Male | Female |
| Less than 5 Minutes | 0 (0.0%) | 0 (0.0%) |
| 5 to 9 Minutes | 0 (0.0%) | 1 (1.5%) |
| 10 to 14 Minutes | 20 (31.2%) | 26 (38.8%) |
| 15 to 19 Minutes | 4 (6.2%) | 15 (22.4%) |
| 20 to 24 Minutes | 2 (3.1%) | 6 (9.0%) |
| 25 to 29 Minutes | 4 (6.2%) | 4 (6.0%) |
| 30 to 34 Minutes | 16 (25.0%) | 8 (11.9%) |
| 35 to 39 Minutes | 6 (9.4%) | 0 (0.0%) |
| 40 to 44 Minutes | 2 (3.1%) | 0 (0.0%) |
| 45 to 59 Minutes | 8 (12.5%) | 5 (7.5%) |
| 60 to 89 Minutes | 0 (0.0%) | 2 (3.0%) |
| 90 or more Minutes | 2 (3.1%) | 0 (0.0%) |
Time of Departure to Work by Sex in Wilmore borough
The most frequent times of departure to work in Wilmore borough are 7:00 AM to 7:29 AM (11, 17.2%) for males and 6:30 AM to 6:59 AM (18, 26.9%) for females.
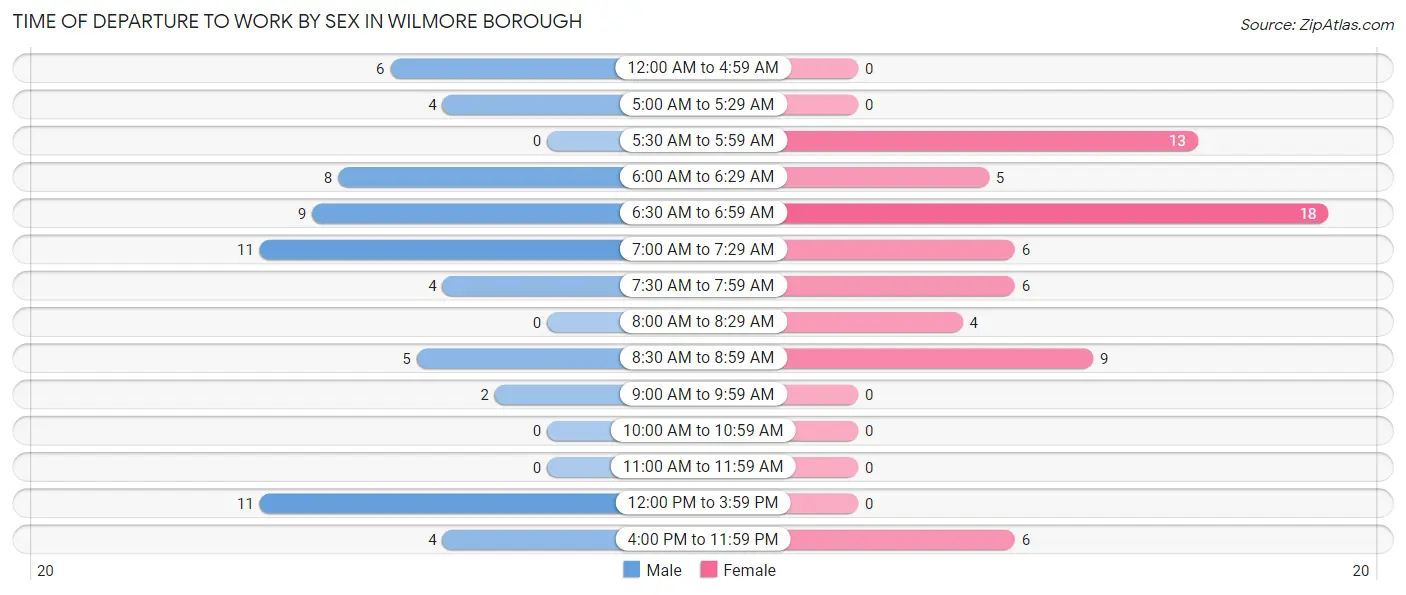
| Time of Departure | Male | Female |
| 12:00 AM to 4:59 AM | 6 (9.4%) | 0 (0.0%) |
| 5:00 AM to 5:29 AM | 4 (6.2%) | 0 (0.0%) |
| 5:30 AM to 5:59 AM | 0 (0.0%) | 13 (19.4%) |
| 6:00 AM to 6:29 AM | 8 (12.5%) | 5 (7.5%) |
| 6:30 AM to 6:59 AM | 9 (14.1%) | 18 (26.9%) |
| 7:00 AM to 7:29 AM | 11 (17.2%) | 6 (9.0%) |
| 7:30 AM to 7:59 AM | 4 (6.2%) | 6 (9.0%) |
| 8:00 AM to 8:29 AM | 0 (0.0%) | 4 (6.0%) |
| 8:30 AM to 8:59 AM | 5 (7.8%) | 9 (13.4%) |
| 9:00 AM to 9:59 AM | 2 (3.1%) | 0 (0.0%) |
| 10:00 AM to 10:59 AM | 0 (0.0%) | 0 (0.0%) |
| 11:00 AM to 11:59 AM | 0 (0.0%) | 0 (0.0%) |
| 12:00 PM to 3:59 PM | 11 (17.2%) | 0 (0.0%) |
| 4:00 PM to 11:59 PM | 4 (6.2%) | 6 (9.0%) |
| Total | 64 (100.0%) | 67 (100.0%) |
Housing Occupancy in Wilmore borough
Occupancy by Ownership in Wilmore borough
Of the total 111 dwellings in Wilmore borough, owner-occupied units account for 90 (81.1%), while renter-occupied units make up 21 (18.9%).
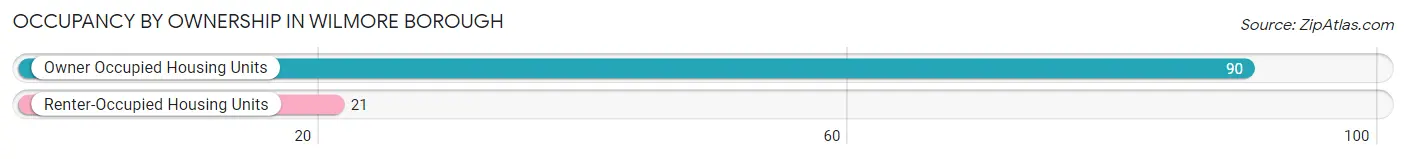
| Occupancy | # Housing Units | % Housing Units |
| Owner Occupied Housing Units | 90 | 81.1% |
| Renter-Occupied Housing Units | 21 | 18.9% |
| Total Occupied Housing Units | 111 | 100.0% |
Occupancy by Household Size in Wilmore borough
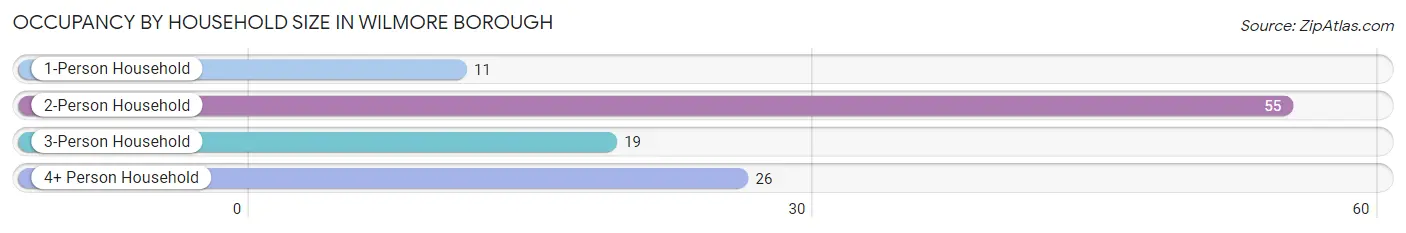
| Household Size | # Housing Units | % Housing Units |
| 1-Person Household | 11 | 9.9% |
| 2-Person Household | 55 | 49.5% |
| 3-Person Household | 19 | 17.1% |
| 4+ Person Household | 26 | 23.4% |
| Total Housing Units | 111 | 100.0% |
Occupancy by Ownership by Household Size in Wilmore borough
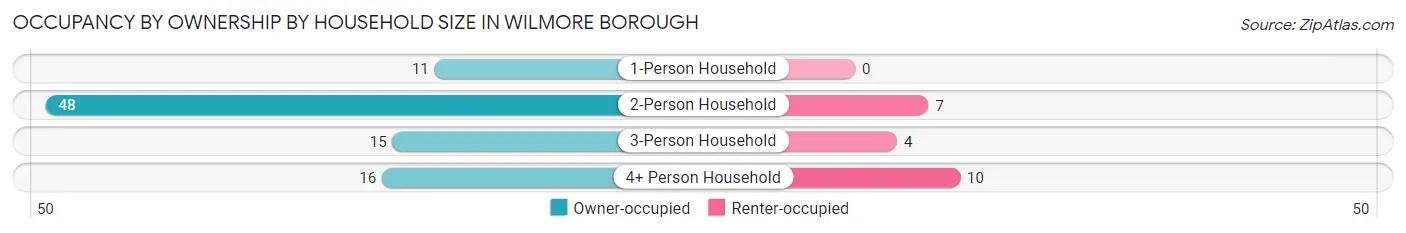
| Household Size | Owner-occupied | Renter-occupied |
| 1-Person Household | 11 (100.0%) | 0 (0.0%) |
| 2-Person Household | 48 (87.3%) | 7 (12.7%) |
| 3-Person Household | 15 (78.9%) | 4 (21.0%) |
| 4+ Person Household | 16 (61.5%) | 10 (38.5%) |
| Total Housing Units | 90 (81.1%) | 21 (18.9%) |
Occupancy by Educational Attainment in Wilmore borough
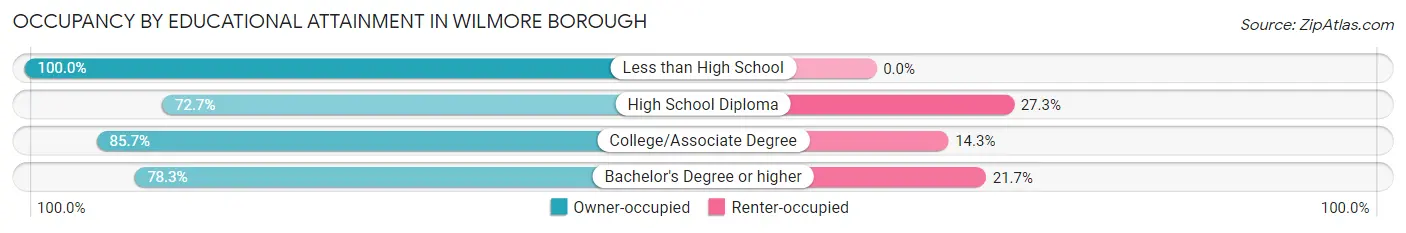
| Household Size | Owner-occupied | Renter-occupied |
| Less than High School | 16 (100.0%) | 0 (0.0%) |
| High School Diploma | 32 (72.7%) | 12 (27.3%) |
| College/Associate Degree | 24 (85.7%) | 4 (14.3%) |
| Bachelor's Degree or higher | 18 (78.3%) | 5 (21.7%) |
Occupancy by Age of Householder in Wilmore borough
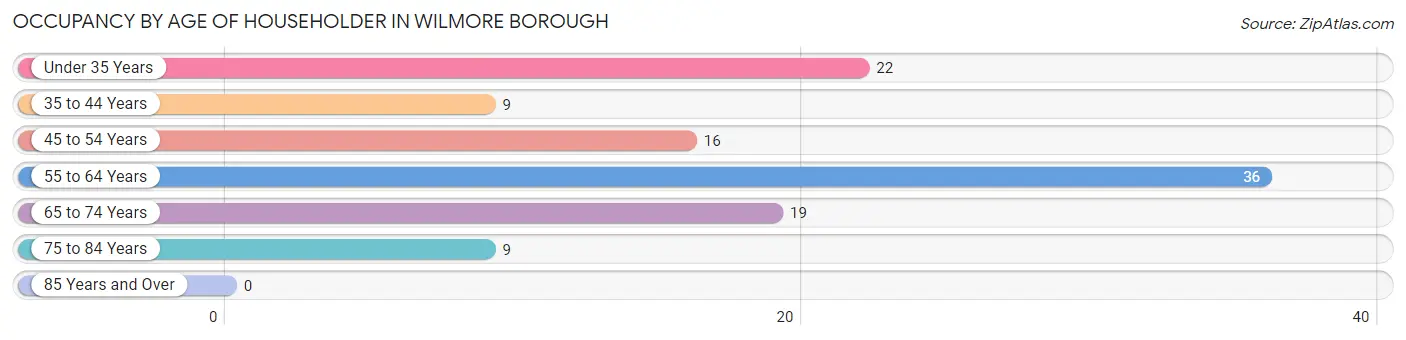
| Age Bracket | # Households | % Households |
| Under 35 Years | 22 | 19.8% |
| 35 to 44 Years | 9 | 8.1% |
| 45 to 54 Years | 16 | 14.4% |
| 55 to 64 Years | 36 | 32.4% |
| 65 to 74 Years | 19 | 17.1% |
| 75 to 84 Years | 9 | 8.1% |
| 85 Years and Over | 0 | 0.0% |
| Total | 111 | 100.0% |
Housing Finances in Wilmore borough
Median Income by Occupancy in Wilmore borough
| Occupancy Type | # Households | Median Income |
| Owner-Occupied | 90 (81.1%) | $0 |
| Renter-Occupied | 21 (18.9%) | $0 |
| Average | 111 (100.0%) | $0 |
Occupancy by Householder Income Bracket in Wilmore borough
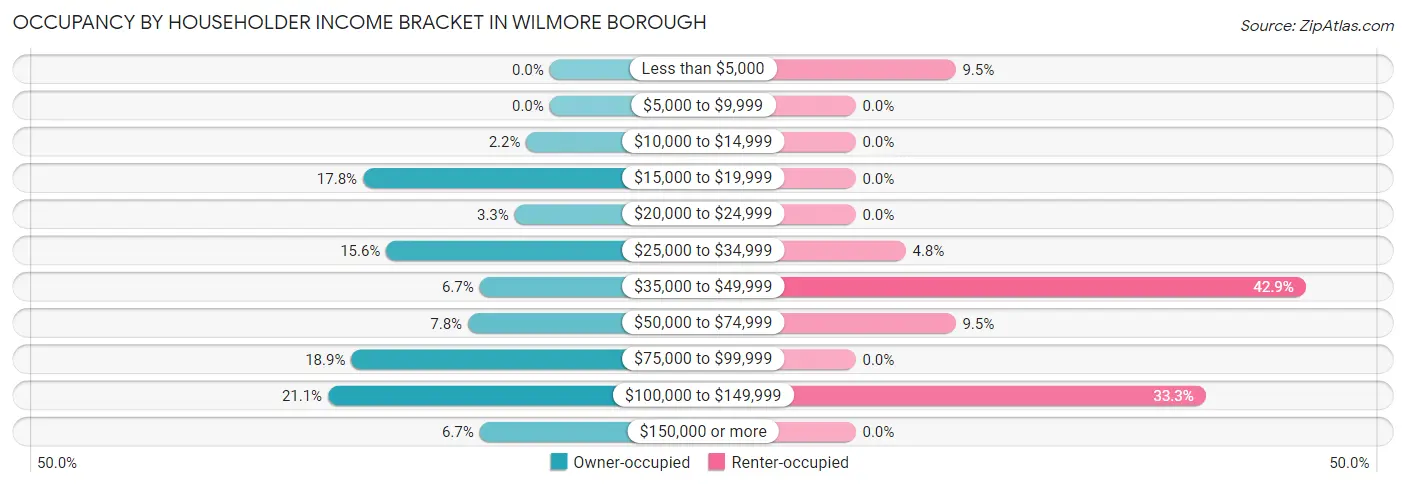
| Income Bracket | Owner-occupied | Renter-occupied |
| Less than $5,000 | 0 (0.0%) | 2 (9.5%) |
| $5,000 to $9,999 | 0 (0.0%) | 0 (0.0%) |
| $10,000 to $14,999 | 2 (2.2%) | 0 (0.0%) |
| $15,000 to $19,999 | 16 (17.8%) | 0 (0.0%) |
| $20,000 to $24,999 | 3 (3.3%) | 0 (0.0%) |
| $25,000 to $34,999 | 14 (15.6%) | 1 (4.8%) |
| $35,000 to $49,999 | 6 (6.7%) | 9 (42.9%) |
| $50,000 to $74,999 | 7 (7.8%) | 2 (9.5%) |
| $75,000 to $99,999 | 17 (18.9%) | 0 (0.0%) |
| $100,000 to $149,999 | 19 (21.1%) | 7 (33.3%) |
| $150,000 or more | 6 (6.7%) | 0 (0.0%) |
| Total | 90 (100.0%) | 21 (100.0%) |
Monthly Housing Cost Tiers in Wilmore borough
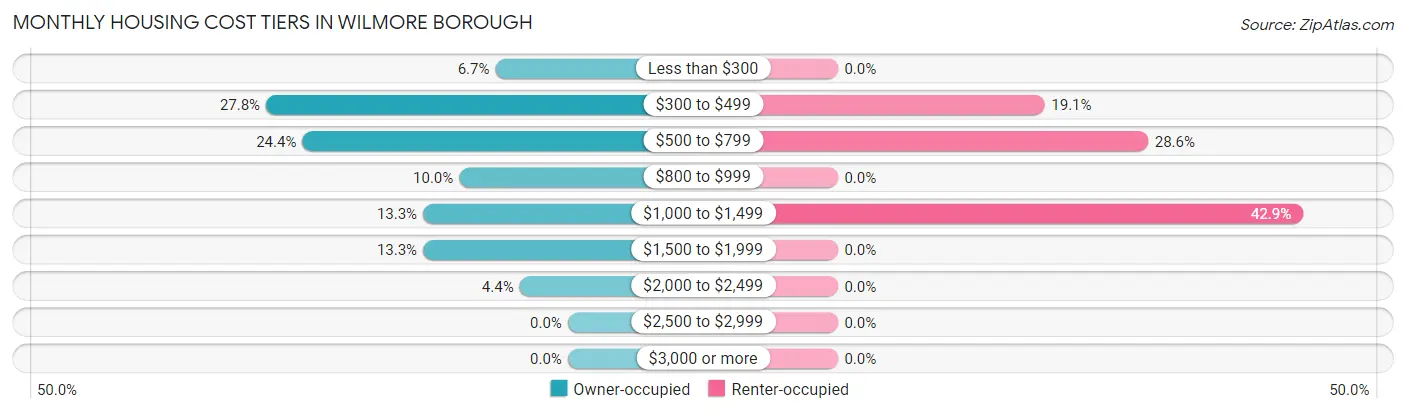
| Monthly Cost | Owner-occupied | Renter-occupied |
| Less than $300 | 6 (6.7%) | 0 (0.0%) |
| $300 to $499 | 25 (27.8%) | 4 (19.1%) |
| $500 to $799 | 22 (24.4%) | 6 (28.6%) |
| $800 to $999 | 9 (10.0%) | 0 (0.0%) |
| $1,000 to $1,499 | 12 (13.3%) | 9 (42.9%) |
| $1,500 to $1,999 | 12 (13.3%) | 0 (0.0%) |
| $2,000 to $2,499 | 4 (4.4%) | 0 (0.0%) |
| $2,500 to $2,999 | 0 (0.0%) | 0 (0.0%) |
| $3,000 or more | 0 (0.0%) | 0 (0.0%) |
| Total | 90 (100.0%) | 21 (100.0%) |
Physical Housing Characteristics in Wilmore borough
Housing Structures in Wilmore borough
| Structure Type | # Housing Units | % Housing Units |
| Single Unit, Detached | 106 | 95.5% |
| Single Unit, Attached | 0 | 0.0% |
| 2 Unit Apartments | 3 | 2.7% |
| 3 or 4 Unit Apartments | 1 | 0.9% |
| 5 to 9 Unit Apartments | 0 | 0.0% |
| 10 or more Apartments | 0 | 0.0% |
| Mobile Home / Other | 1 | 0.9% |
| Total | 111 | 100.0% |
Housing Structures by Occupancy in Wilmore borough
| Structure Type | Owner-occupied | Renter-occupied |
| Single Unit, Detached | 88 (83.0%) | 18 (17.0%) |
| Single Unit, Attached | 0 (0.0%) | 0 (0.0%) |
| 2 Unit Apartments | 1 (33.3%) | 2 (66.7%) |
| 3 or 4 Unit Apartments | 0 (0.0%) | 1 (100.0%) |
| 5 to 9 Unit Apartments | 0 (0.0%) | 0 (0.0%) |
| 10 or more Apartments | 0 (0.0%) | 0 (0.0%) |
| Mobile Home / Other | 1 (100.0%) | 0 (0.0%) |
| Total | 90 (81.1%) | 21 (18.9%) |
Housing Structures by Number of Rooms in Wilmore borough
| Number of Rooms | Owner-occupied | Renter-occupied |
| 1 Room | 0 (0.0%) | 0 (0.0%) |
| 2 or 3 Rooms | 0 (0.0%) | 0 (0.0%) |
| 4 or 5 Rooms | 20 (22.2%) | 3 (14.3%) |
| 6 or 7 Rooms | 46 (51.1%) | 6 (28.6%) |
| 8 or more Rooms | 24 (26.7%) | 12 (57.1%) |
| Total | 90 (100.0%) | 21 (100.0%) |
Housing Structure by Heating Type in Wilmore borough
| Heating Type | Owner-occupied | Renter-occupied |
| Utility Gas | 0 (0.0%) | 0 (0.0%) |
| Bottled, Tank, or LP Gas | 0 (0.0%) | 0 (0.0%) |
| Electricity | 15 (16.7%) | 3 (14.3%) |
| Fuel Oil or Kerosene | 60 (66.7%) | 18 (85.7%) |
| Coal or Coke | 7 (7.8%) | 0 (0.0%) |
| All other Fuels | 8 (8.9%) | 0 (0.0%) |
| No Fuel Used | 0 (0.0%) | 0 (0.0%) |
| Total | 90 (100.0%) | 21 (100.0%) |
Household Vehicle Usage in Wilmore borough
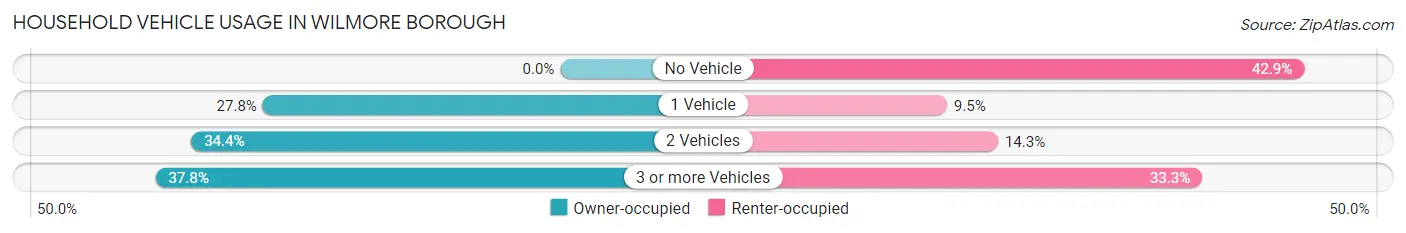
| Vehicles per Household | Owner-occupied | Renter-occupied |
| No Vehicle | 0 (0.0%) | 9 (42.9%) |
| 1 Vehicle | 25 (27.8%) | 2 (9.5%) |
| 2 Vehicles | 31 (34.4%) | 3 (14.3%) |
| 3 or more Vehicles | 34 (37.8%) | 7 (33.3%) |
| Total | 90 (100.0%) | 21 (100.0%) |
Real Estate & Mortgages in Wilmore borough
Real Estate and Mortgage Overview in Wilmore borough
| Characteristic | Without Mortgage | With Mortgage |
| Housing Units | 37 | 53 |
| Median Property Value | $90,600 | $121,100 |
| Median Household Income | $34,875 | $6 |
| Monthly Housing Costs | $431 | $0 |
| Real Estate Taxes | $944 | $0 |
Property Value by Mortgage Status in Wilmore borough
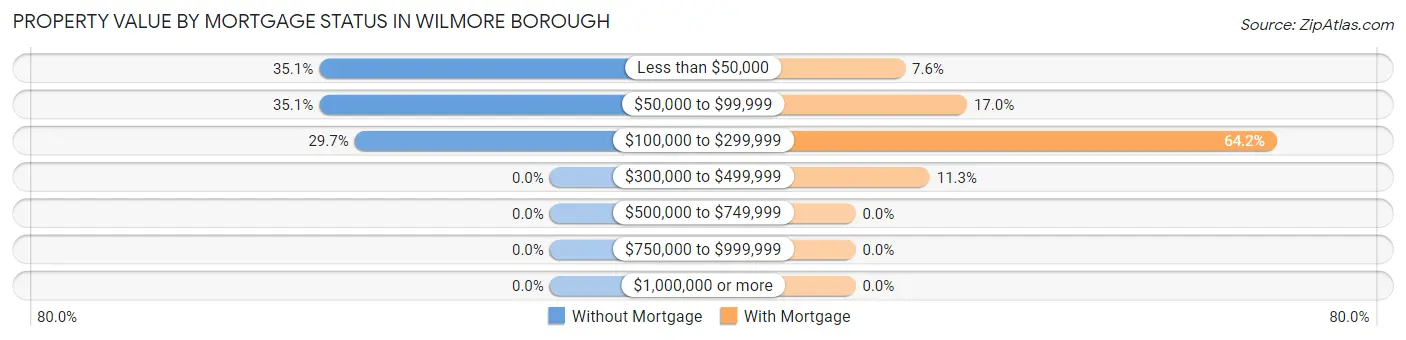
| Property Value | Without Mortgage | With Mortgage |
| Less than $50,000 | 13 (35.1%) | 4 (7.5%) |
| $50,000 to $99,999 | 13 (35.1%) | 9 (17.0%) |
| $100,000 to $299,999 | 11 (29.7%) | 34 (64.1%) |
| $300,000 to $499,999 | 0 (0.0%) | 6 (11.3%) |
| $500,000 to $749,999 | 0 (0.0%) | 0 (0.0%) |
| $750,000 to $999,999 | 0 (0.0%) | 0 (0.0%) |
| $1,000,000 or more | 0 (0.0%) | 0 (0.0%) |
| Total | 37 (100.0%) | 53 (100.0%) |
Household Income by Mortgage Status in Wilmore borough
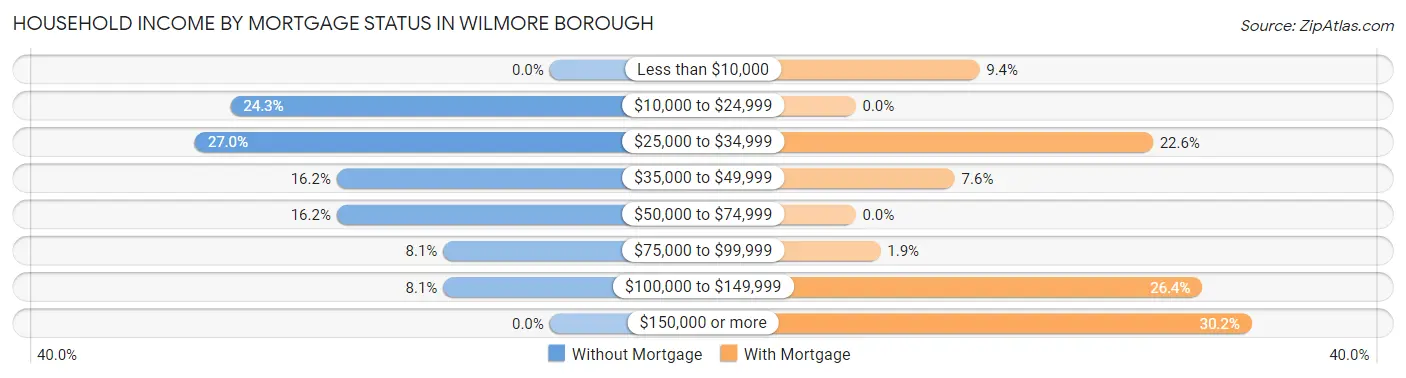
| Household Income | Without Mortgage | With Mortgage |
| Less than $10,000 | 0 (0.0%) | 5 (9.4%) |
| $10,000 to $24,999 | 9 (24.3%) | 0 (0.0%) |
| $25,000 to $34,999 | 10 (27.0%) | 12 (22.6%) |
| $35,000 to $49,999 | 6 (16.2%) | 4 (7.5%) |
| $50,000 to $74,999 | 6 (16.2%) | 0 (0.0%) |
| $75,000 to $99,999 | 3 (8.1%) | 1 (1.9%) |
| $100,000 to $149,999 | 3 (8.1%) | 14 (26.4%) |
| $150,000 or more | 0 (0.0%) | 16 (30.2%) |
| Total | 37 (100.0%) | 53 (100.0%) |
Property Value to Household Income Ratio in Wilmore borough
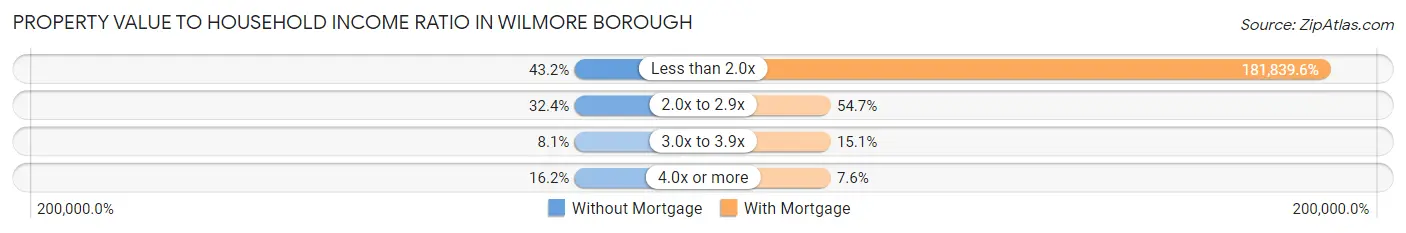
| Value-to-Income Ratio | Without Mortgage | With Mortgage |
| Less than 2.0x | 16 (43.2%) | 96,375 (181,839.6%) |
| 2.0x to 2.9x | 12 (32.4%) | 29 (54.7%) |
| 3.0x to 3.9x | 3 (8.1%) | 8 (15.1%) |
| 4.0x or more | 6 (16.2%) | 4 (7.5%) |
| Total | 37 (100.0%) | 53 (100.0%) |
Real Estate Taxes by Mortgage Status in Wilmore borough
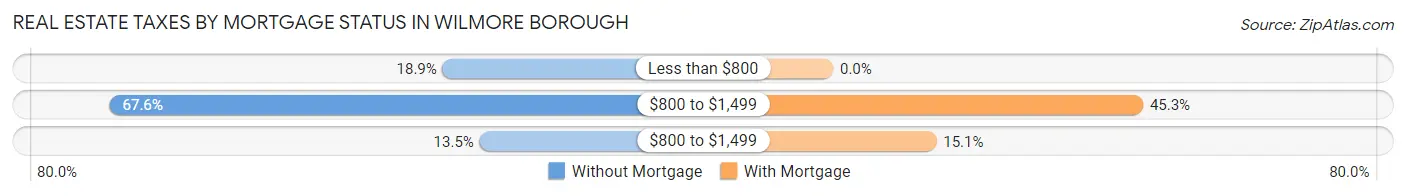
| Property Taxes | Without Mortgage | With Mortgage |
| Less than $800 | 7 (18.9%) | 0 (0.0%) |
| $800 to $1,499 | 25 (67.6%) | 24 (45.3%) |
| $800 to $1,499 | 5 (13.5%) | 8 (15.1%) |
| Total | 37 (100.0%) | 53 (100.0%) |
Health & Disability in Wilmore borough
Health Insurance Coverage by Age in Wilmore borough
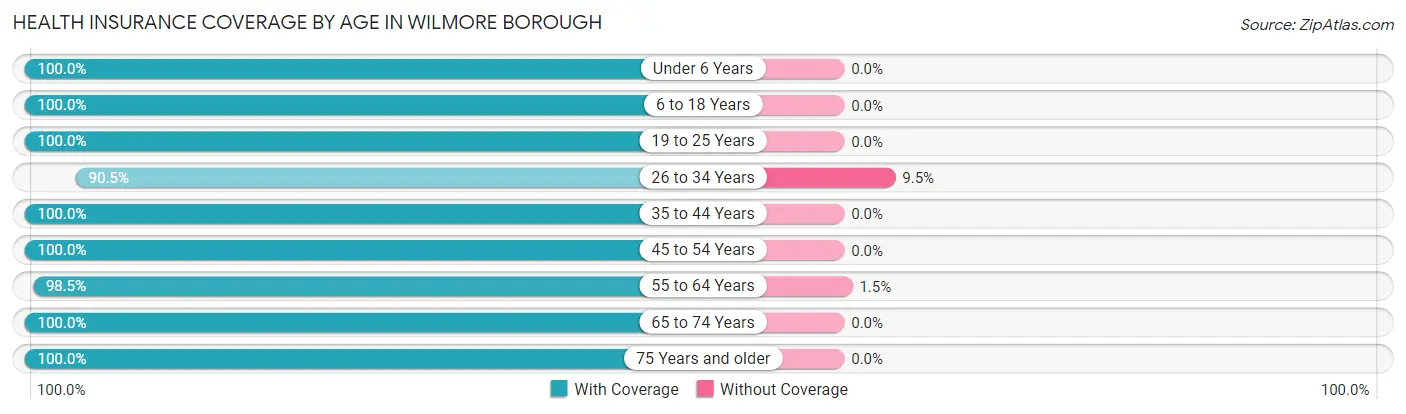
| Age Bracket | With Coverage | Without Coverage |
| Under 6 Years | 37 (100.0%) | 0 (0.0%) |
| 6 to 18 Years | 65 (100.0%) | 0 (0.0%) |
| 19 to 25 Years | 34 (100.0%) | 0 (0.0%) |
| 26 to 34 Years | 57 (90.5%) | 6 (9.5%) |
| 35 to 44 Years | 37 (100.0%) | 0 (0.0%) |
| 45 to 54 Years | 38 (100.0%) | 0 (0.0%) |
| 55 to 64 Years | 65 (98.5%) | 1 (1.5%) |
| 65 to 74 Years | 35 (100.0%) | 0 (0.0%) |
| 75 Years and older | 15 (100.0%) | 0 (0.0%) |
| Total | 383 (98.2%) | 7 (1.8%) |
Health Insurance Coverage by Citizenship Status in Wilmore borough
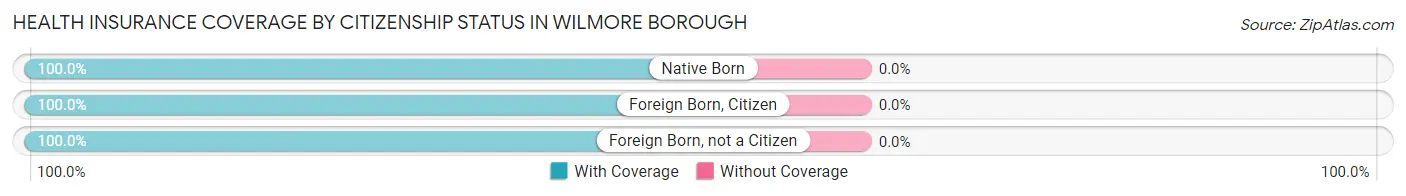
| Citizenship Status | With Coverage | Without Coverage |
| Native Born | 37 (100.0%) | 0 (0.0%) |
| Foreign Born, Citizen | 65 (100.0%) | 0 (0.0%) |
| Foreign Born, not a Citizen | 34 (100.0%) | 0 (0.0%) |
Health Insurance Coverage by Household Income in Wilmore borough
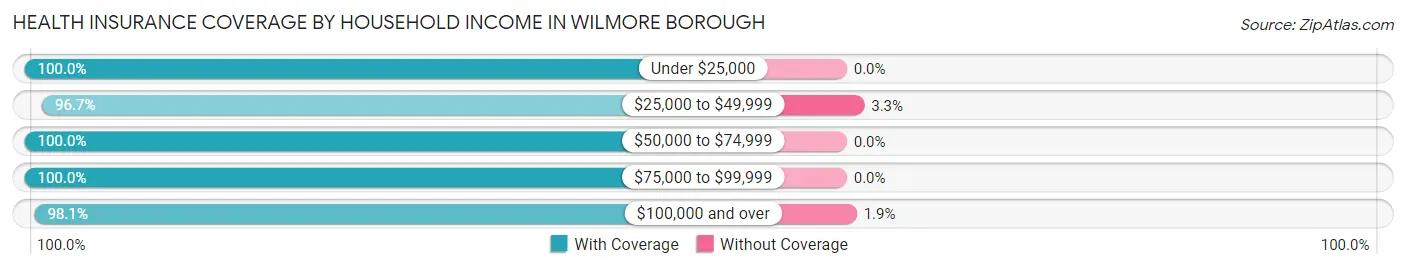
| Household Income | With Coverage | Without Coverage |
| Under $25,000 | 43 (100.0%) | 0 (0.0%) |
| $25,000 to $49,999 | 118 (96.7%) | 4 (3.3%) |
| $50,000 to $74,999 | 23 (100.0%) | 0 (0.0%) |
| $75,000 to $99,999 | 41 (100.0%) | 0 (0.0%) |
| $100,000 and over | 158 (98.1%) | 3 (1.9%) |
Public vs Private Health Insurance Coverage by Age in Wilmore borough

| Age Bracket | Public Insurance | Private Insurance |
| Under 6 | 27 (73.0%) | 10 (27.0%) |
| 6 to 18 Years | 37 (56.9%) | 44 (67.7%) |
| 19 to 25 Years | 16 (47.1%) | 18 (52.9%) |
| 25 to 34 Years | 34 (54.0%) | 23 (36.5%) |
| 35 to 44 Years | 22 (59.5%) | 15 (40.5%) |
| 45 to 54 Years | 18 (47.4%) | 37 (97.4%) |
| 55 to 64 Years | 38 (57.6%) | 28 (42.4%) |
| 65 to 74 Years | 35 (100.0%) | 35 (100.0%) |
| 75 Years and over | 14 (93.3%) | 3 (20.0%) |
| Total | 241 (61.8%) | 213 (54.6%) |
Disability Status by Sex by Age in Wilmore borough
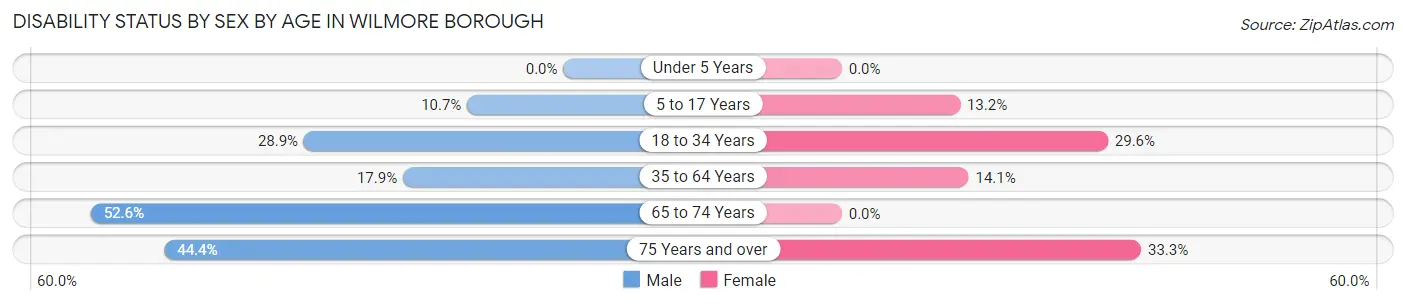
| Age Bracket | Male | Female |
| Under 5 Years | 0 (0.0%) | 0 (0.0%) |
| 5 to 17 Years | 3 (10.7%) | 5 (13.2%) |
| 18 to 34 Years | 13 (28.9%) | 16 (29.6%) |
| 35 to 64 Years | 10 (17.9%) | 12 (14.1%) |
| 65 to 74 Years | 10 (52.6%) | 0 (0.0%) |
| 75 Years and over | 4 (44.4%) | 2 (33.3%) |
Disability Class by Sex by Age in Wilmore borough
Disability Class: Hearing Difficulty
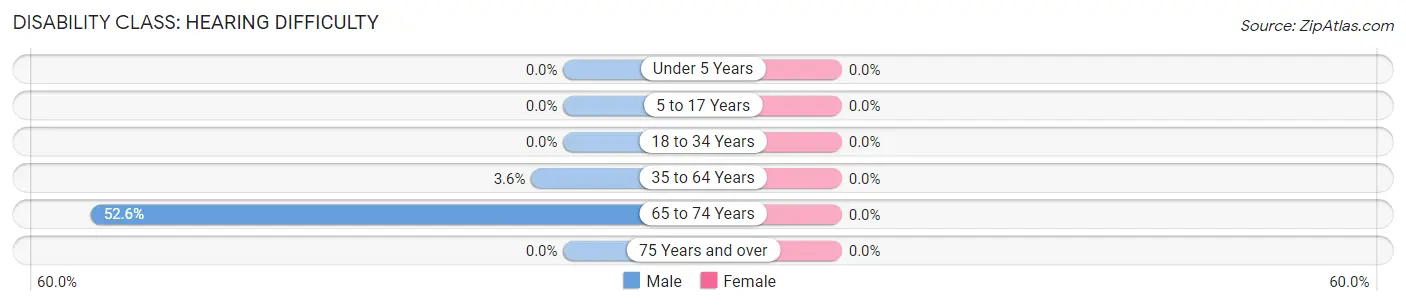
| Age Bracket | Male | Female |
| Under 5 Years | 0 (0.0%) | 0 (0.0%) |
| 5 to 17 Years | 0 (0.0%) | 0 (0.0%) |
| 18 to 34 Years | 0 (0.0%) | 0 (0.0%) |
| 35 to 64 Years | 2 (3.6%) | 0 (0.0%) |
| 65 to 74 Years | 10 (52.6%) | 0 (0.0%) |
| 75 Years and over | 0 (0.0%) | 0 (0.0%) |
Disability Class: Vision Difficulty
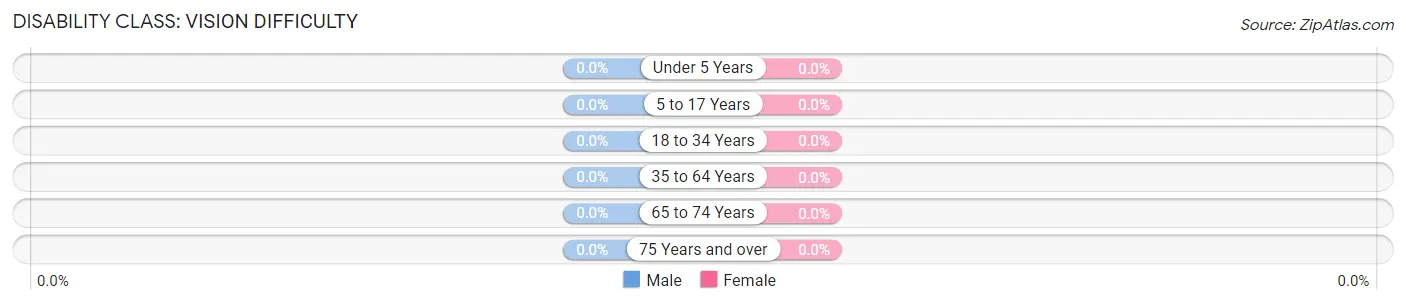
| Age Bracket | Male | Female |
| Under 5 Years | 0 (0.0%) | 0 (0.0%) |
| 5 to 17 Years | 0 (0.0%) | 0 (0.0%) |
| 18 to 34 Years | 0 (0.0%) | 0 (0.0%) |
| 35 to 64 Years | 0 (0.0%) | 0 (0.0%) |
| 65 to 74 Years | 0 (0.0%) | 0 (0.0%) |
| 75 Years and over | 0 (0.0%) | 0 (0.0%) |
Disability Class: Cognitive Difficulty
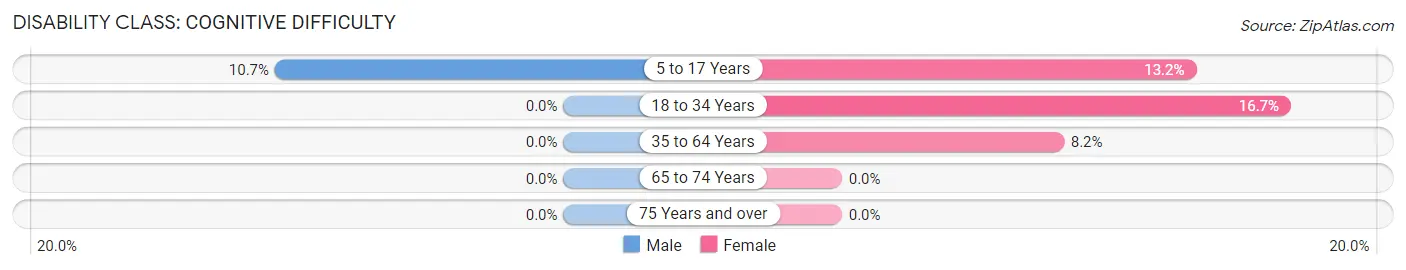
| Age Bracket | Male | Female |
| 5 to 17 Years | 3 (10.7%) | 5 (13.2%) |
| 18 to 34 Years | 0 (0.0%) | 9 (16.7%) |
| 35 to 64 Years | 0 (0.0%) | 7 (8.2%) |
| 65 to 74 Years | 0 (0.0%) | 0 (0.0%) |
| 75 Years and over | 0 (0.0%) | 0 (0.0%) |
Disability Class: Ambulatory Difficulty
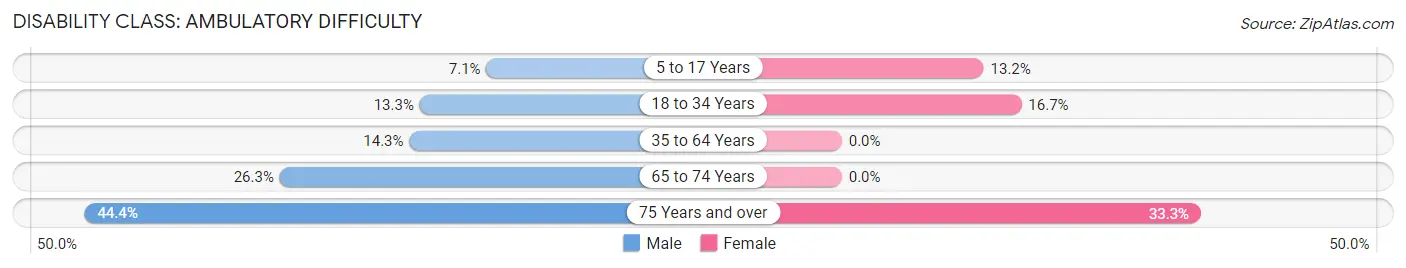
| Age Bracket | Male | Female |
| 5 to 17 Years | 2 (7.1%) | 5 (13.2%) |
| 18 to 34 Years | 6 (13.3%) | 9 (16.7%) |
| 35 to 64 Years | 8 (14.3%) | 0 (0.0%) |
| 65 to 74 Years | 5 (26.3%) | 0 (0.0%) |
| 75 Years and over | 4 (44.4%) | 2 (33.3%) |
Disability Class: Self-Care Difficulty
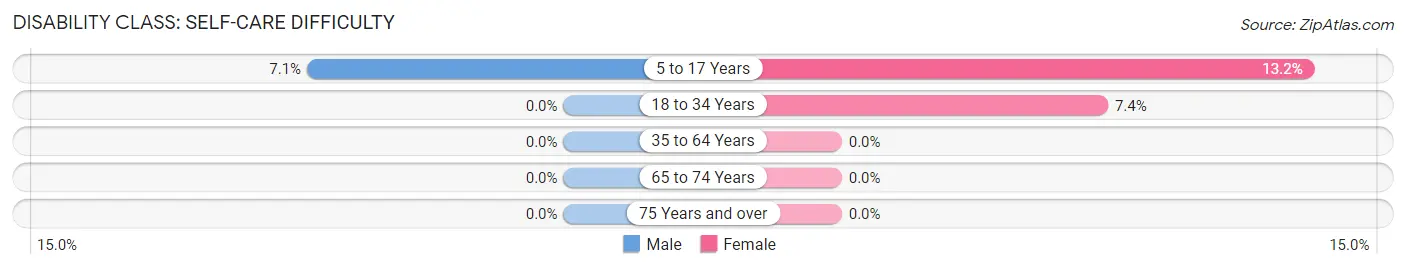
| Age Bracket | Male | Female |
| 5 to 17 Years | 2 (7.1%) | 5 (13.2%) |
| 18 to 34 Years | 0 (0.0%) | 4 (7.4%) |
| 35 to 64 Years | 0 (0.0%) | 0 (0.0%) |
| 65 to 74 Years | 0 (0.0%) | 0 (0.0%) |
| 75 Years and over | 0 (0.0%) | 0 (0.0%) |
Technology Access in Wilmore borough
Computing Device Access in Wilmore borough
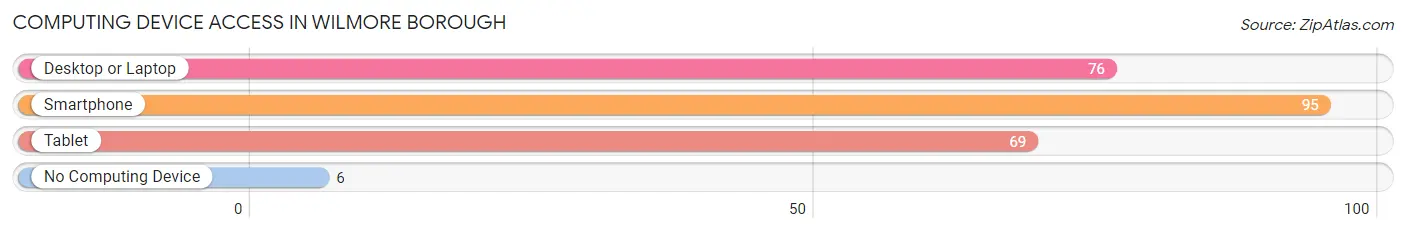
| Device Type | # Households | % Households |
| Desktop or Laptop | 76 | 68.5% |
| Smartphone | 95 | 85.6% |
| Tablet | 69 | 62.2% |
| No Computing Device | 6 | 5.4% |
| Total | 111 | 100.0% |
Internet Access in Wilmore borough
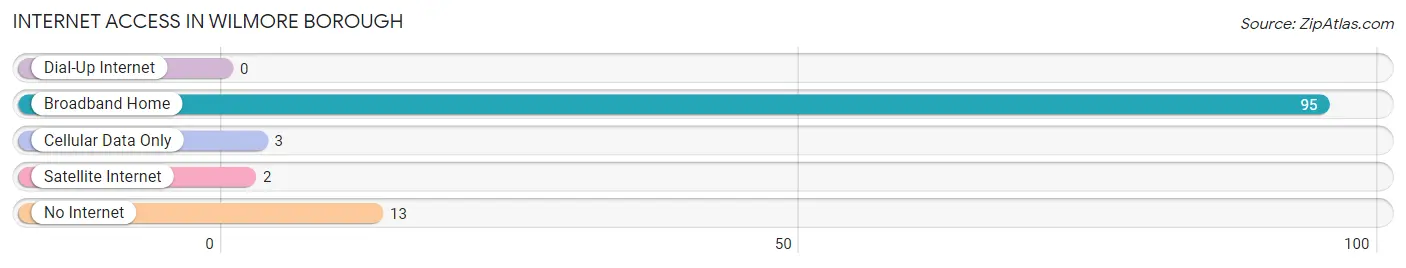
| Internet Type | # Households | % Households |
| Dial-Up Internet | 0 | 0.0% |
| Broadband Home | 95 | 85.6% |
| Cellular Data Only | 3 | 2.7% |
| Satellite Internet | 2 | 1.8% |
| No Internet | 13 | 11.7% |
| Total | 111 | 100.0% |
Wilmore borough Summary
Wilmore Borough is a small borough located in Cambria County, Pennsylvania. It is situated in the foothills of the Allegheny Mountains, approximately 10 miles east of Johnstown. The borough was founded in 1876 and is home to a population of approximately 1,000 people.
History
The area that is now Wilmore Borough was originally inhabited by the Native American Susquehannock tribe. The first European settlers arrived in the area in the late 1700s and early 1800s. The first settler in the area was John Wilmore, who arrived in 1820 and established a sawmill and gristmill. The area was known as Wilmore’s Mill until 1876, when it was incorporated as Wilmore Borough.
The borough was an important stop on the Pennsylvania Railroad, which ran through the area from 1881 to 1971. The railroad provided a vital link to the outside world and helped to spur economic growth in the area. The borough was also home to several coal mines, which provided employment for many of the residents.
Geography
Wilmore Borough is located in the foothills of the Allegheny Mountains in Cambria County, Pennsylvania. The borough is situated at an elevation of 1,400 feet and covers an area of 0.6 square miles. The borough is bordered by the townships of Conemaugh, Jackson, and West Taylor.
The borough is located in a rural area and is surrounded by rolling hills and forests. The borough is home to several small streams, including the Little Conemaugh River, which flows through the borough.
Economy
The economy of Wilmore Borough is largely based on agriculture and tourism. The borough is home to several small farms, which produce a variety of crops, including corn, soybeans, and hay. The borough is also home to several small businesses, including a grocery store, a hardware store, and a restaurant.
The borough is also a popular tourist destination, as it is located near several popular attractions, including the Johnstown Flood National Memorial and the Flight 93 National Memorial. The borough is also home to several parks, including Wilmore Park, which features a playground, picnic areas, and a walking trail.
Demographics
As of the 2010 census, Wilmore Borough had a population of 1,000 people. The racial makeup of the borough was 97.2% White, 0.7% African American, 0.2% Native American, 0.2% Asian, and 1.7% from other races. The median household income was $37,500, and the median family income was $45,000.
The borough is home to a large number of families, with approximately 40% of households having children under the age of 18. The borough is also home to a large number of elderly residents, with approximately 20% of the population over the age of 65. The borough is served by the Conemaugh Valley School District.
Common Questions
What is Per Capita Income in Wilmore borough?
Per Capita income in Wilmore borough is $22,702.
What is the Median Family Income in Wilmore borough?
Median Family Income in Wilmore borough is $61,500.
What is Income or Wage Gap in Wilmore borough?
Income or Wage Gap in Wilmore borough is 27.5%.
Women in Wilmore borough earn 72.5 cents for every dollar earned by a man.
What is Inequality or Gini Index in Wilmore borough?
Inequality or Gini Index in Wilmore borough is 0.40.
What is the Total Population of Wilmore borough?
Total Population of Wilmore borough is 390.
What is the Total Male Population of Wilmore borough?
Total Male Population of Wilmore borough is 169.
What is the Total Female Population of Wilmore borough?
Total Female Population of Wilmore borough is 221.
What is the Ratio of Males per 100 Females in Wilmore borough?
There are 76.47 Males per 100 Females in Wilmore borough.
What is the Ratio of Females per 100 Males in Wilmore borough?
There are 130.77 Females per 100 Males in Wilmore borough.
What is the Median Population Age in Wilmore borough?
Median Population Age in Wilmore borough is 34.2 Years.
What is the Average Family Size in Wilmore borough
Average Family Size in Wilmore borough is 3.7 People.
What is the Average Household Size in Wilmore borough
Average Household Size in Wilmore borough is 3.5 People.
How Large is the Labor Force in Wilmore borough?
There are 152 People in the Labor Forcein in Wilmore borough.
What is the Percentage of People in the Labor Force in Wilmore borough?
50.2% of People are in the Labor Force in Wilmore borough.
What is the Unemployment Rate in Wilmore borough?
Unemployment Rate in Wilmore borough is 1.3%.