Troy borough, PA Map & Demographics
Troy borough Overview
$28,929
PER CAPITA INCOME
$72,426
AVG FAMILY INCOME
$47,992
AVG HOUSEHOLD INCOME
45.8%
WAGE / INCOME GAP [ % ]
54.2¢/ $1
WAGE / INCOME GAP [ $ ]
$15,511
FAMILY INCOME DEFICIT
0.48
INEQUALITY / GINI INDEX
1,431
TOTAL POPULATION
629
MALE POPULATION
802
FEMALE POPULATION
78.43
MALES / 100 FEMALES
127.50
FEMALES / 100 MALES
41.2
MEDIAN AGE
3.1
AVG FAMILY SIZE
2.3
AVG HOUSEHOLD SIZE
647
LABOR FORCE [ PEOPLE ]
49.7%
PERCENT IN LABOR FORCE
1.1%
UNEMPLOYMENT RATE
Income in Troy borough
Income Overview in Troy borough
Per Capita Income in Troy borough is $28,929, while median incomes of families and households are $72,426 and $47,992 respectively.
| Characteristic | Number | Measure |
| Per Capita Income | 1,431 | $28,929 |
| Median Family Income | 301 | $72,426 |
| Mean Family Income | 301 | $89,039 |
| Median Household Income | 577 | $47,992 |
| Mean Household Income | 577 | $65,067 |
| Income Deficit | 301 | $15,511 |
| Wage / Income Gap (%) | 1,431 | 45.80% |
| Wage / Income Gap ($) | 1,431 | 54.20¢ per $1 |
| Gini / Inequality Index | 1,431 | 0.48 |
Earnings by Sex in Troy borough
Average Earnings in Troy borough are $29,470, $41,250 for men and $22,356 for women, a difference of 45.8%.
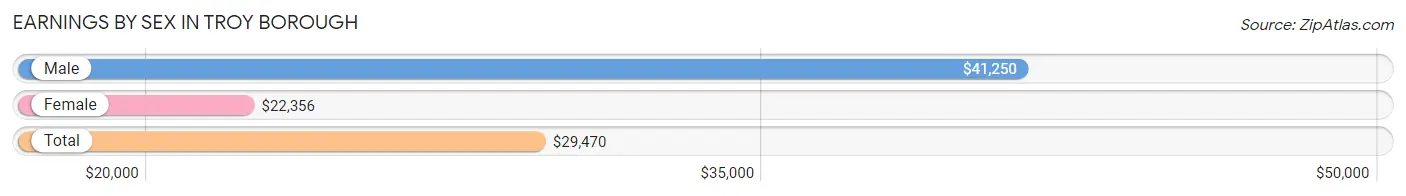
| Sex | Number | Average Earnings |
| Male | 326 (45.2%) | $41,250 |
| Female | 396 (54.8%) | $22,356 |
| Total | 722 (100.0%) | $29,470 |
Earnings by Sex by Income Bracket in Troy borough
The most common earnings brackets in Troy borough are $45,000 to $49,999 for men (37 | 11.4%) and $7,500 to $9,999 for women (68 | 17.2%).
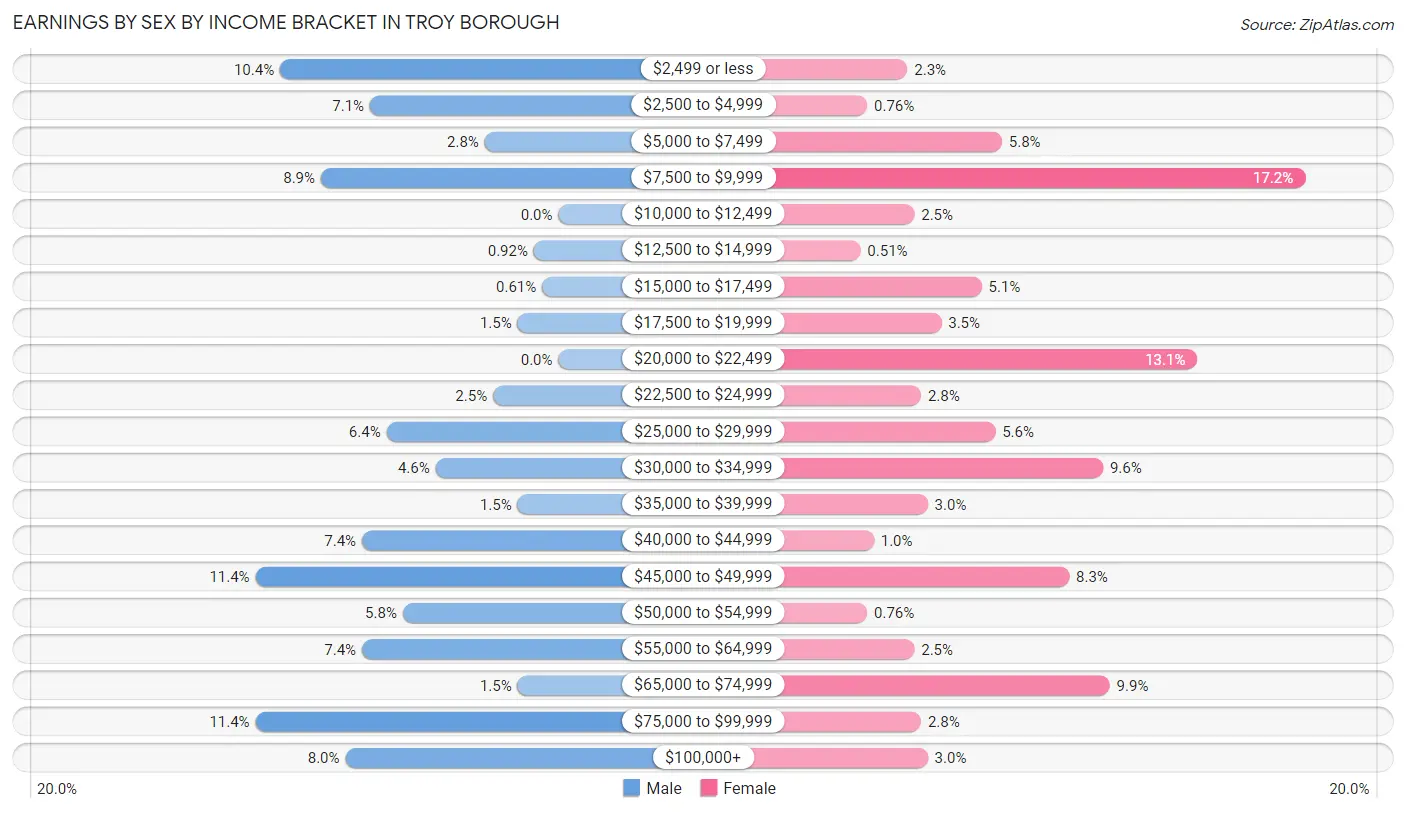
| Income | Male | Female |
| $2,499 or less | 34 (10.4%) | 9 (2.3%) |
| $2,500 to $4,999 | 23 (7.1%) | 3 (0.8%) |
| $5,000 to $7,499 | 9 (2.8%) | 23 (5.8%) |
| $7,500 to $9,999 | 29 (8.9%) | 68 (17.2%) |
| $10,000 to $12,499 | 0 (0.0%) | 10 (2.5%) |
| $12,500 to $14,999 | 3 (0.9%) | 2 (0.5%) |
| $15,000 to $17,499 | 2 (0.6%) | 20 (5.1%) |
| $17,500 to $19,999 | 5 (1.5%) | 14 (3.5%) |
| $20,000 to $22,499 | 0 (0.0%) | 52 (13.1%) |
| $22,500 to $24,999 | 8 (2.5%) | 11 (2.8%) |
| $25,000 to $29,999 | 21 (6.4%) | 22 (5.6%) |
| $30,000 to $34,999 | 15 (4.6%) | 38 (9.6%) |
| $35,000 to $39,999 | 5 (1.5%) | 12 (3.0%) |
| $40,000 to $44,999 | 24 (7.4%) | 4 (1.0%) |
| $45,000 to $49,999 | 37 (11.4%) | 33 (8.3%) |
| $50,000 to $54,999 | 19 (5.8%) | 3 (0.8%) |
| $55,000 to $64,999 | 24 (7.4%) | 10 (2.5%) |
| $65,000 to $74,999 | 5 (1.5%) | 39 (9.9%) |
| $75,000 to $99,999 | 37 (11.4%) | 11 (2.8%) |
| $100,000+ | 26 (8.0%) | 12 (3.0%) |
| Total | 326 (100.0%) | 396 (100.0%) |
Earnings by Sex by Educational Attainment in Troy borough
Average earnings in Troy borough are $42,153 for men and $30,000 for women, a difference of 28.8%. Men with an educational attainment of college or associate's degree enjoy the highest average annual earnings of $54,375, while those with less than high school education earn the least with $4,348. Women with an educational attainment of graduate degree earn the most with the average annual earnings of $74,479, while those with college or associate's degree education have the smallest earnings of $31,250.
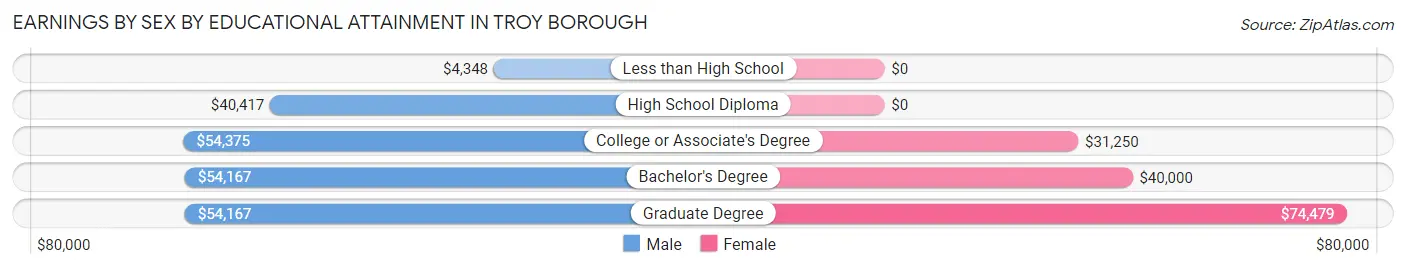
| Educational Attainment | Male Income | Female Income |
| Less than High School | $4,348 | $0 |
| High School Diploma | $40,417 | $0 |
| College or Associate's Degree | $54,375 | $31,250 |
| Bachelor's Degree | $54,167 | $40,000 |
| Graduate Degree | $54,167 | $74,479 |
| Total | $42,153 | $30,000 |
Family Income in Troy borough
Family Income Brackets in Troy borough
According to the Troy borough family income data, there are 64 families falling into the $50,000 to $74,999 income range, which is the most common income bracket and makes up 21.3% of all families. Conversely, the $10,000 to $14,999 income bracket is the least frequent group with only 3 families (1.0%) belonging to this category.
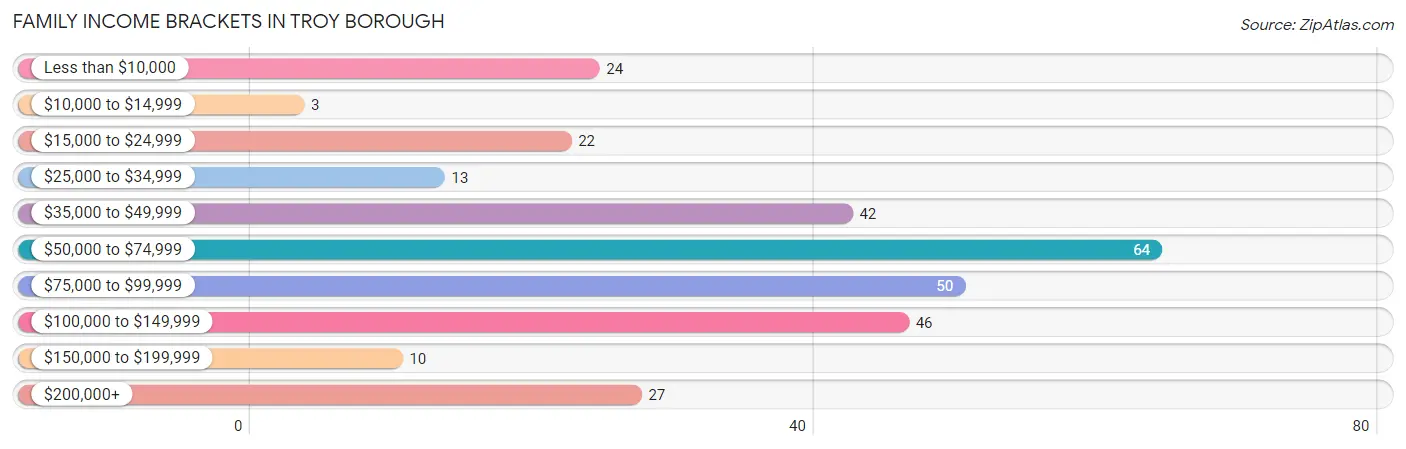
| Income Bracket | # Families | % Families |
| Less than $10,000 | 24 | 8.0% |
| $10,000 to $14,999 | 3 | 1.0% |
| $15,000 to $24,999 | 22 | 7.3% |
| $25,000 to $34,999 | 13 | 4.3% |
| $35,000 to $49,999 | 42 | 14.0% |
| $50,000 to $74,999 | 64 | 21.3% |
| $75,000 to $99,999 | 50 | 16.6% |
| $100,000 to $149,999 | 46 | 15.3% |
| $150,000 to $199,999 | 10 | 3.3% |
| $200,000+ | 27 | 9.0% |
Family Income by Famaliy Size in Troy borough
3-person families (58 | 19.3%) account for the highest median family income in Troy borough with $80,000 per family, while 2-person families (152 | 50.5%) have the highest median income of $35,909 per family member.
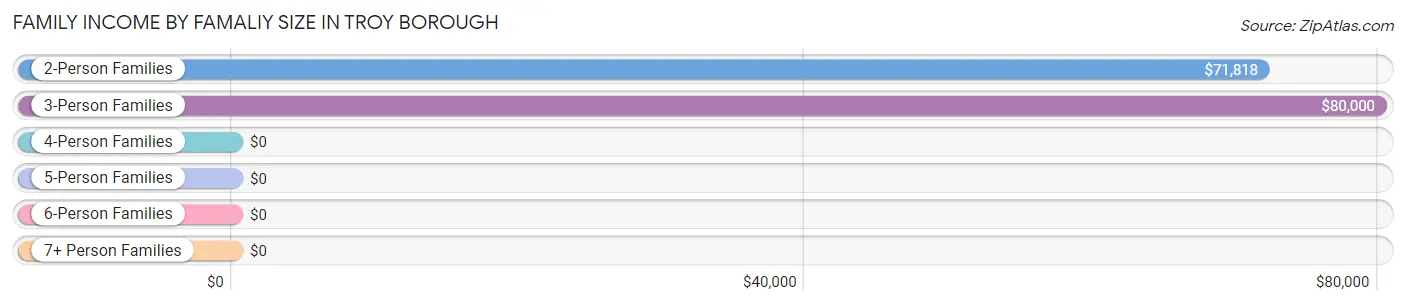
| Income Bracket | # Families | Median Income |
| 2-Person Families | 152 (50.5%) | $71,818 |
| 3-Person Families | 58 (19.3%) | $80,000 |
| 4-Person Families | 78 (25.9%) | $0 |
| 5-Person Families | 7 (2.3%) | $0 |
| 6-Person Families | 6 (2.0%) | $0 |
| 7+ Person Families | 0 (0.0%) | $0 |
| Total | 301 (100.0%) | $72,426 |
Family Income by Number of Earners in Troy borough
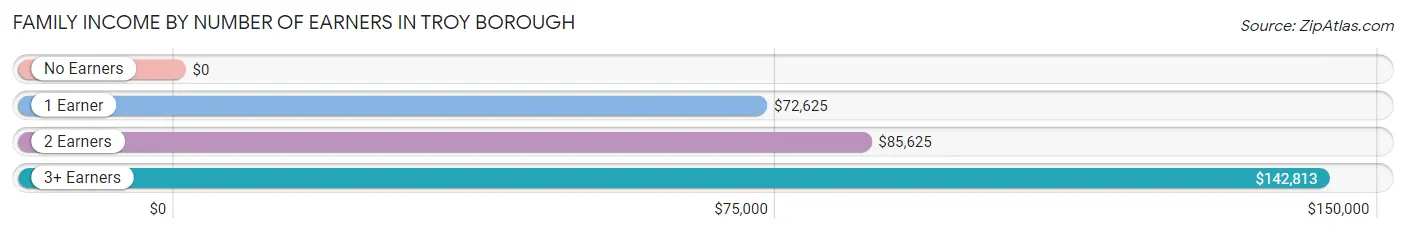
| Number of Earners | # Families | Median Income |
| No Earners | 69 (22.9%) | $0 |
| 1 Earner | 99 (32.9%) | $72,625 |
| 2 Earners | 112 (37.2%) | $85,625 |
| 3+ Earners | 21 (7.0%) | $142,813 |
| Total | 301 (100.0%) | $72,426 |
Household Income in Troy borough
Household Income Brackets in Troy borough
With 89 households falling in the category, the $75,000 to $99,999 income range is the most frequent in Troy borough, accounting for 15.4% of all households. In contrast, only 13 households (2.2%) fall into the $150,000 to $199,999 income bracket, making it the least populous group.
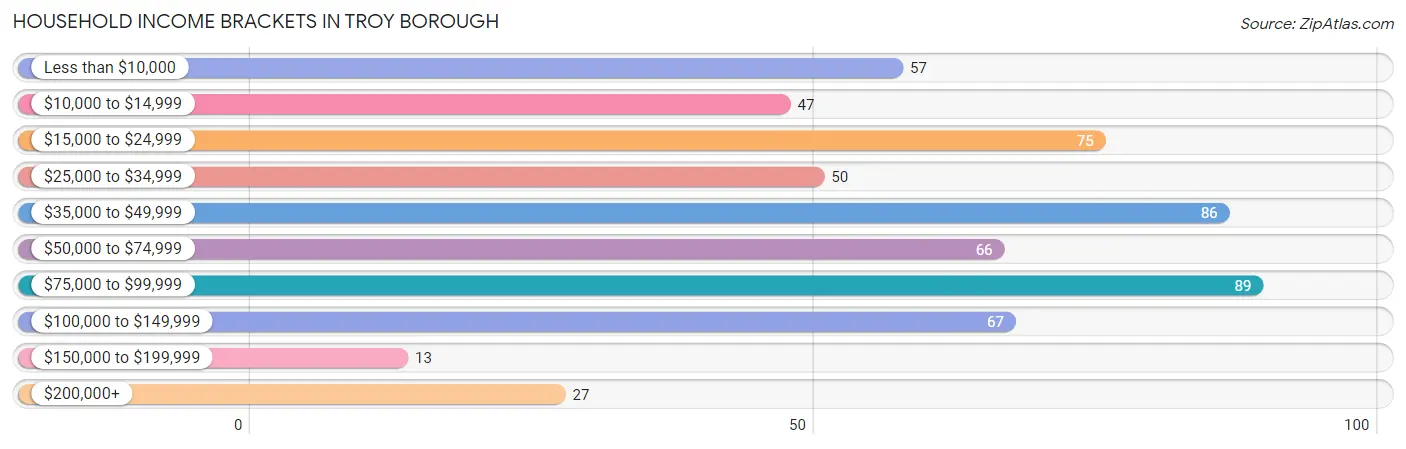
| Income Bracket | # Households | % Households |
| Less than $10,000 | 57 | 9.9% |
| $10,000 to $14,999 | 47 | 8.1% |
| $15,000 to $24,999 | 75 | 13.0% |
| $25,000 to $34,999 | 50 | 8.7% |
| $35,000 to $49,999 | 86 | 14.9% |
| $50,000 to $74,999 | 66 | 11.4% |
| $75,000 to $99,999 | 89 | 15.4% |
| $100,000 to $149,999 | 67 | 11.6% |
| $150,000 to $199,999 | 13 | 2.3% |
| $200,000+ | 27 | 4.7% |
Household Income by Householder Age in Troy borough
The median household income in Troy borough is $47,992, with the highest median household income of $77,344 found in the 25 to 44 years age bracket for the primary householder. A total of 149 households (25.8%) fall into this category. Meanwhile, the 15 to 24 years age bracket for the primary householder has the lowest median household income of $0, with 2 households (0.4%) in this group.
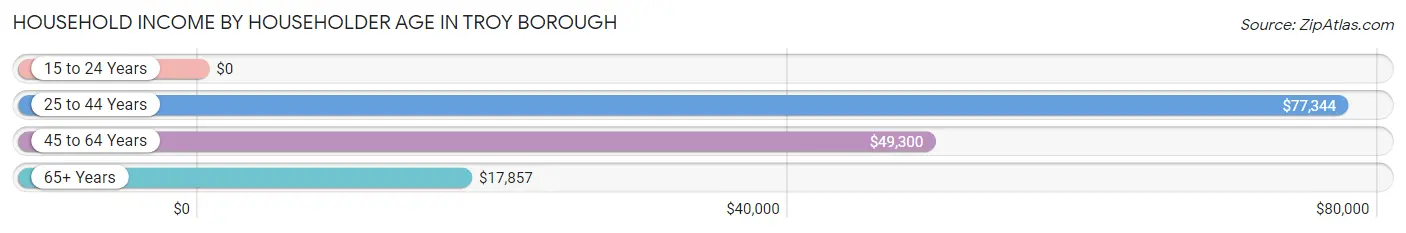
| Income Bracket | # Households | Median Income |
| 15 to 24 Years | 2 (0.4%) | $0 |
| 25 to 44 Years | 149 (25.8%) | $77,344 |
| 45 to 64 Years | 208 (36.0%) | $49,300 |
| 65+ Years | 218 (37.8%) | $17,857 |
| Total | 577 (100.0%) | $47,992 |
Poverty in Troy borough
Income Below Poverty by Sex and Age in Troy borough
With 27.2% poverty level for males and 18.2% for females among the residents of Troy borough, 18 to 24 year old males and 25 to 34 year old females are the most vulnerable to poverty, with 28 males (63.6%) and 62 females (32.8%) in their respective age groups living below the poverty level.
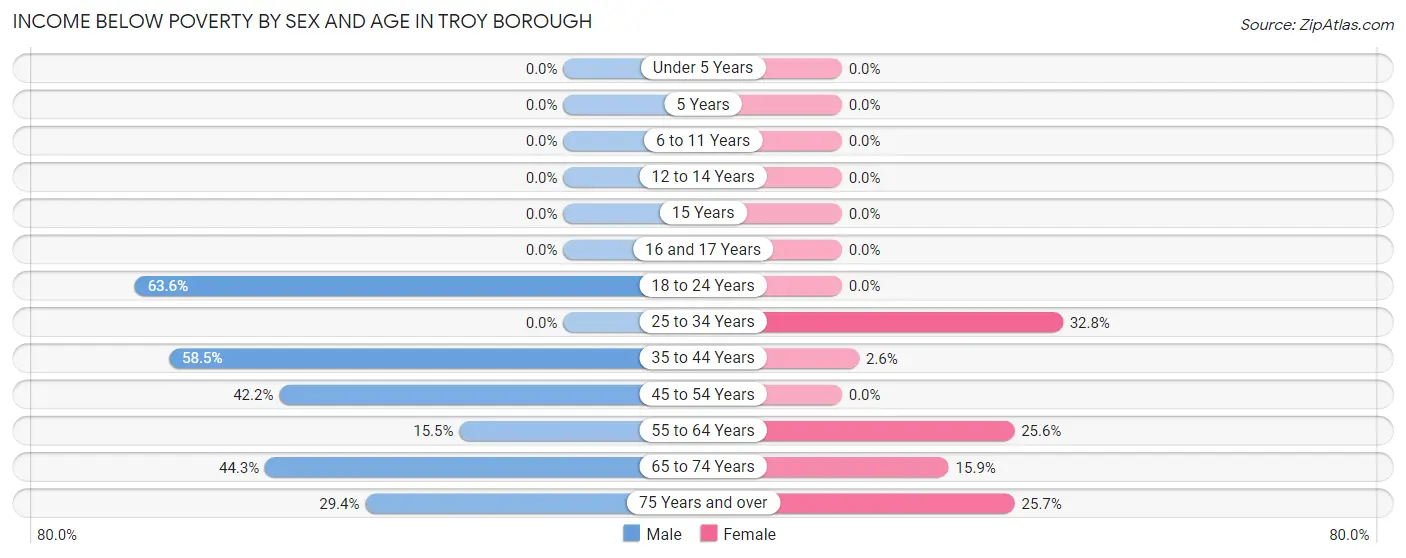
| Age Bracket | Male | Female |
| Under 5 Years | 0 (0.0%) | 0 (0.0%) |
| 5 Years | 0 (0.0%) | 0 (0.0%) |
| 6 to 11 Years | 0 (0.0%) | 0 (0.0%) |
| 12 to 14 Years | 0 (0.0%) | 0 (0.0%) |
| 15 Years | 0 (0.0%) | 0 (0.0%) |
| 16 and 17 Years | 0 (0.0%) | 0 (0.0%) |
| 18 to 24 Years | 28 (63.6%) | 0 (0.0%) |
| 25 to 34 Years | 0 (0.0%) | 62 (32.8%) |
| 35 to 44 Years | 48 (58.5%) | 2 (2.6%) |
| 45 to 54 Years | 27 (42.2%) | 0 (0.0%) |
| 55 to 64 Years | 17 (15.4%) | 43 (25.6%) |
| 65 to 74 Years | 35 (44.3%) | 10 (15.9%) |
| 75 Years and over | 15 (29.4%) | 29 (25.7%) |
| Total | 170 (27.2%) | 146 (18.2%) |
Income Above Poverty by Sex and Age in Troy borough
According to the poverty statistics in Troy borough, males aged under 5 years and females aged under 5 years are the age groups that are most secure financially, with 100.0% of males and 100.0% of females in these age groups living above the poverty line.
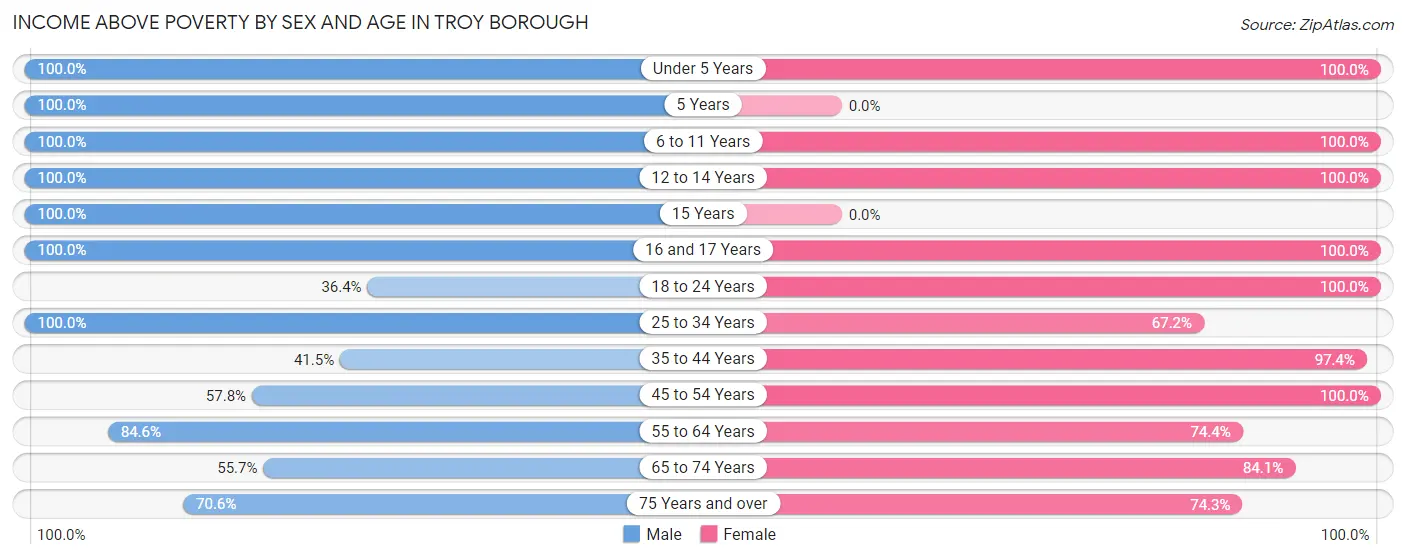
| Age Bracket | Male | Female |
| Under 5 Years | 24 (100.0%) | 11 (100.0%) |
| 5 Years | 16 (100.0%) | 0 (0.0%) |
| 6 to 11 Years | 27 (100.0%) | 29 (100.0%) |
| 12 to 14 Years | 11 (100.0%) | 8 (100.0%) |
| 15 Years | 4 (100.0%) | 0 (0.0%) |
| 16 and 17 Years | 10 (100.0%) | 9 (100.0%) |
| 18 to 24 Years | 16 (36.4%) | 92 (100.0%) |
| 25 to 34 Years | 104 (100.0%) | 127 (67.2%) |
| 35 to 44 Years | 34 (41.5%) | 76 (97.4%) |
| 45 to 54 Years | 37 (57.8%) | 42 (100.0%) |
| 55 to 64 Years | 93 (84.6%) | 125 (74.4%) |
| 65 to 74 Years | 44 (55.7%) | 53 (84.1%) |
| 75 Years and over | 36 (70.6%) | 84 (74.3%) |
| Total | 456 (72.8%) | 656 (81.8%) |
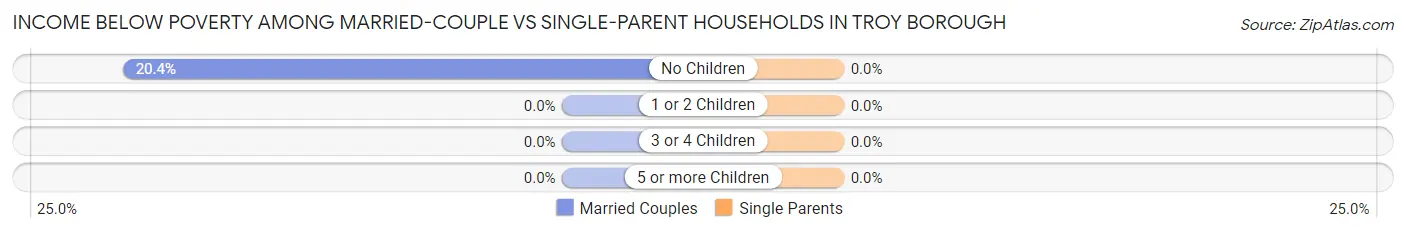
Income Below Poverty Among Married-Couple Families in Troy borough
The poverty statistics for married-couple families in Troy borough show that 15.0% or 38 of the total 254 families live below the poverty line. Families with no children have the highest poverty rate of 20.4%, comprising of 38 families. On the other hand, families with 1 or 2 children have the lowest poverty rate of 0.0%, which includes 0 families.
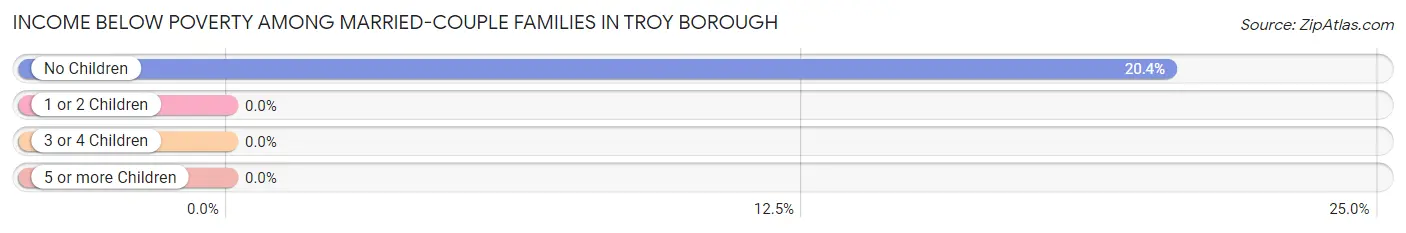
| Children | Above Poverty | Below Poverty |
| No Children | 148 (79.6%) | 38 (20.4%) |
| 1 or 2 Children | 58 (100.0%) | 0 (0.0%) |
| 3 or 4 Children | 10 (100.0%) | 0 (0.0%) |
| 5 or more Children | 0 (0.0%) | 0 (0.0%) |
| Total | 216 (85.0%) | 38 (15.0%) |
Income Below Poverty Among Single-Parent Households in Troy borough
| Children | Single Father | Single Mother |
| No Children | 0 (0.0%) | 0 (0.0%) |
| 1 or 2 Children | 0 (0.0%) | 0 (0.0%) |
| 3 or 4 Children | 0 (0.0%) | 0 (0.0%) |
| 5 or more Children | 0 (0.0%) | 0 (0.0%) |
| Total | 0 (0.0%) | 0 (0.0%) |
Income Below Poverty Among Married-Couple vs Single-Parent Households in Troy borough
| Children | Married-Couple Families | Single-Parent Households |
| No Children | 38 (20.4%) | 0 (0.0%) |
| 1 or 2 Children | 0 (0.0%) | 0 (0.0%) |
| 3 or 4 Children | 0 (0.0%) | 0 (0.0%) |
| 5 or more Children | 0 (0.0%) | 0 (0.0%) |
| Total | 38 (15.0%) | 0 (0.0%) |
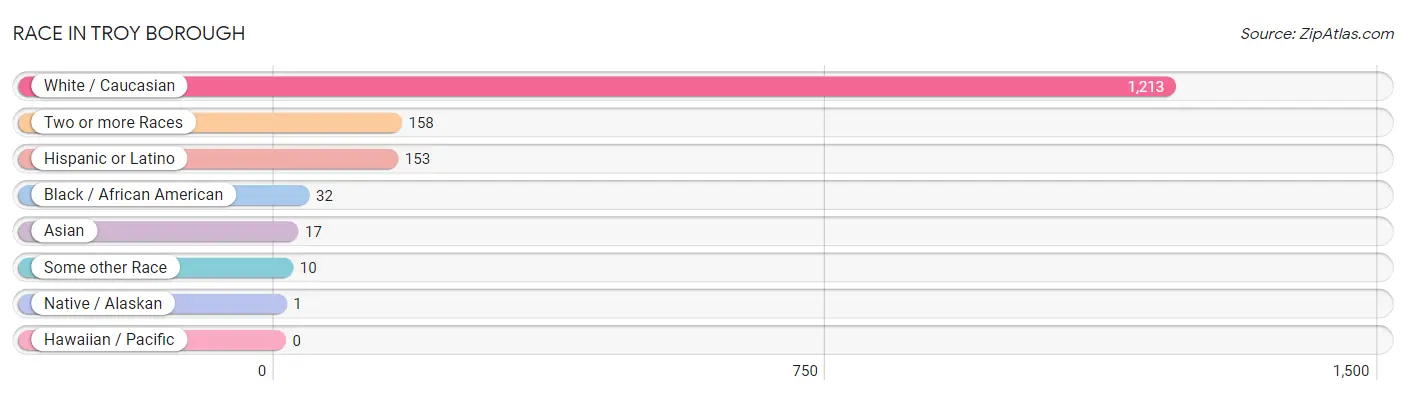
Race in Troy borough
The most populous races in Troy borough are White / Caucasian (1,213 | 84.8%), Two or more Races (158 | 11.0%), and Hispanic or Latino (153 | 10.7%).
| Race | # Population | % Population |
| Asian | 17 | 1.2% |
| Black / African American | 32 | 2.2% |
| Hawaiian / Pacific | 0 | 0.0% |
| Hispanic or Latino | 153 | 10.7% |
| Native / Alaskan | 1 | 0.1% |
| White / Caucasian | 1,213 | 84.8% |
| Two or more Races | 158 | 11.0% |
| Some other Race | 10 | 0.7% |
| Total | 1,431 | 100.0% |
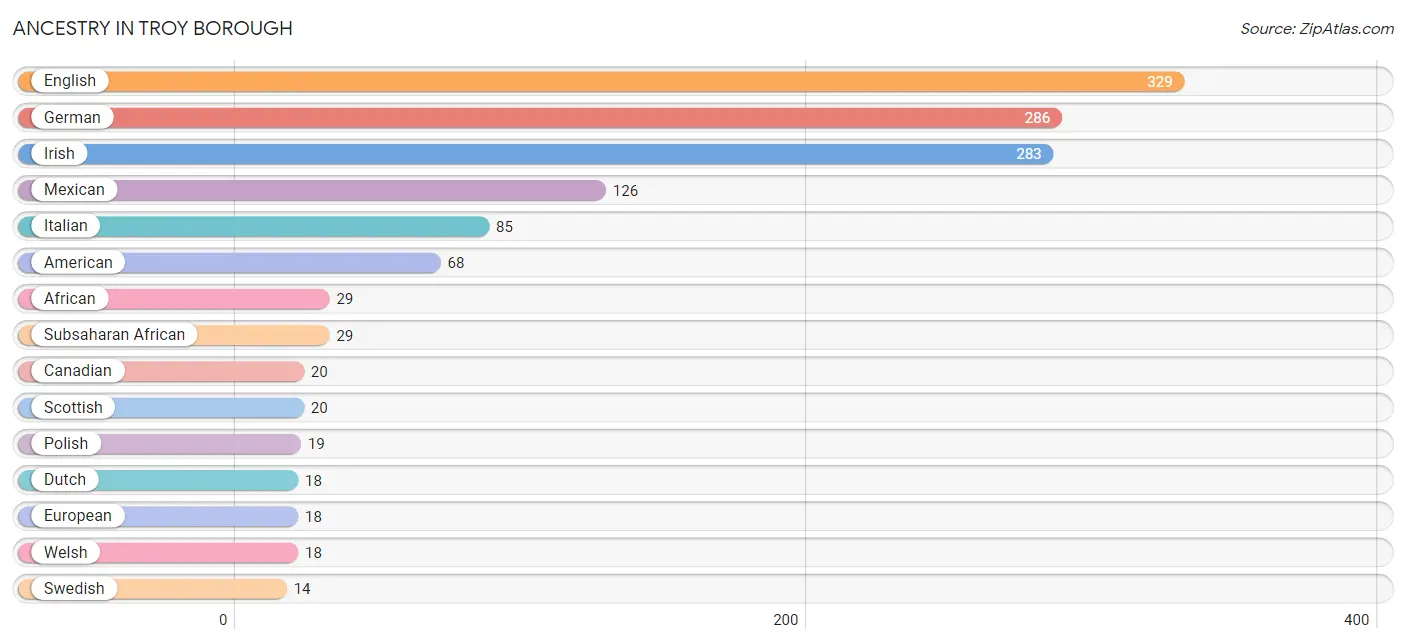
Ancestry in Troy borough
The most populous ancestries reported in Troy borough are English (329 | 23.0%), German (286 | 20.0%), Irish (283 | 19.8%), Mexican (126 | 8.8%), and Italian (85 | 5.9%), together accounting for 77.5% of all Troy borough residents.
| Ancestry | # Population | % Population |
| African | 29 | 2.0% |
| American | 68 | 4.8% |
| Belgian | 3 | 0.2% |
| Bhutanese | 9 | 0.6% |
| British | 12 | 0.8% |
| Canadian | 20 | 1.4% |
| Central American | 10 | 0.7% |
| Central American Indian | 2 | 0.1% |
| Danish | 3 | 0.2% |
| Dutch | 18 | 1.3% |
| Eastern European | 3 | 0.2% |
| English | 329 | 23.0% |
| European | 18 | 1.3% |
| French | 13 | 0.9% |
| French American Indian | 1 | 0.1% |
| German | 286 | 20.0% |
| Greek | 3 | 0.2% |
| Honduran | 10 | 0.7% |
| Irish | 283 | 19.8% |
| Italian | 85 | 5.9% |
| Korean | 8 | 0.6% |
| Mexican | 126 | 8.8% |
| Northern European | 11 | 0.8% |
| Pakistani | 4 | 0.3% |
| Pennsylvania German | 2 | 0.1% |
| Polish | 19 | 1.3% |
| Puerto Rican | 11 | 0.8% |
| Scotch-Irish | 12 | 0.8% |
| Scottish | 20 | 1.4% |
| Seminole | 2 | 0.1% |
| Slovak | 6 | 0.4% |
| Slovene | 4 | 0.3% |
| South American | 6 | 0.4% |
| Subsaharan African | 29 | 2.0% |
| Swedish | 14 | 1.0% |
| Ukrainian | 13 | 0.9% |
| Venezuelan | 6 | 0.4% |
| Welsh | 18 | 1.3% | View All 38 Rows |
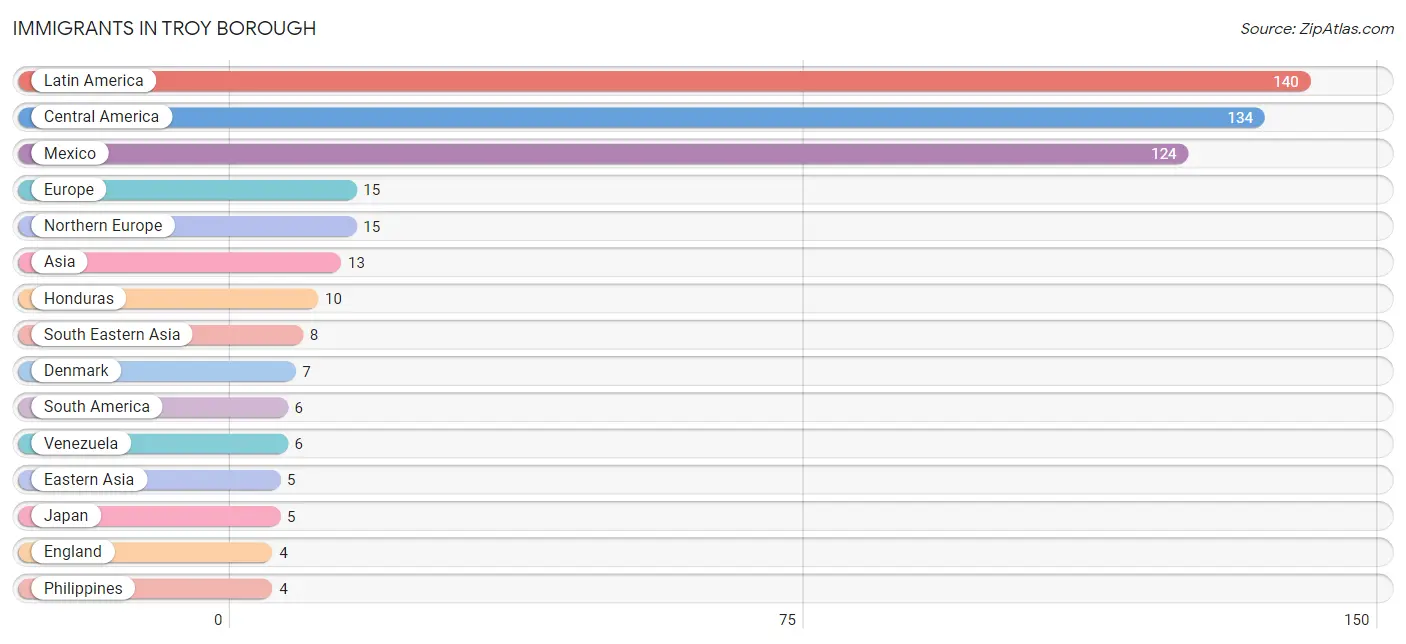
Immigrants in Troy borough
The most numerous immigrant groups reported in Troy borough came from Latin America (140 | 9.8%), Central America (134 | 9.4%), Mexico (124 | 8.7%), Europe (15 | 1.1%), and Northern Europe (15 | 1.1%), together accounting for 29.9% of all Troy borough residents.
| Immigration Origin | # Population | % Population |
| Asia | 13 | 0.9% |
| Central America | 134 | 9.4% |
| Denmark | 7 | 0.5% |
| Eastern Asia | 5 | 0.4% |
| England | 4 | 0.3% |
| Europe | 15 | 1.1% |
| Honduras | 10 | 0.7% |
| Japan | 5 | 0.4% |
| Latin America | 140 | 9.8% |
| Mexico | 124 | 8.7% |
| Northern Europe | 15 | 1.1% |
| Philippines | 4 | 0.3% |
| South America | 6 | 0.4% |
| South Eastern Asia | 8 | 0.6% |
| Thailand | 4 | 0.3% |
| Venezuela | 6 | 0.4% | View All 16 Rows |
Sex and Age in Troy borough
Sex and Age in Troy borough
The most populous age groups in Troy borough are 35 to 39 Years (73 | 11.6%) for men and 30 to 34 Years (130 | 16.2%) for women.
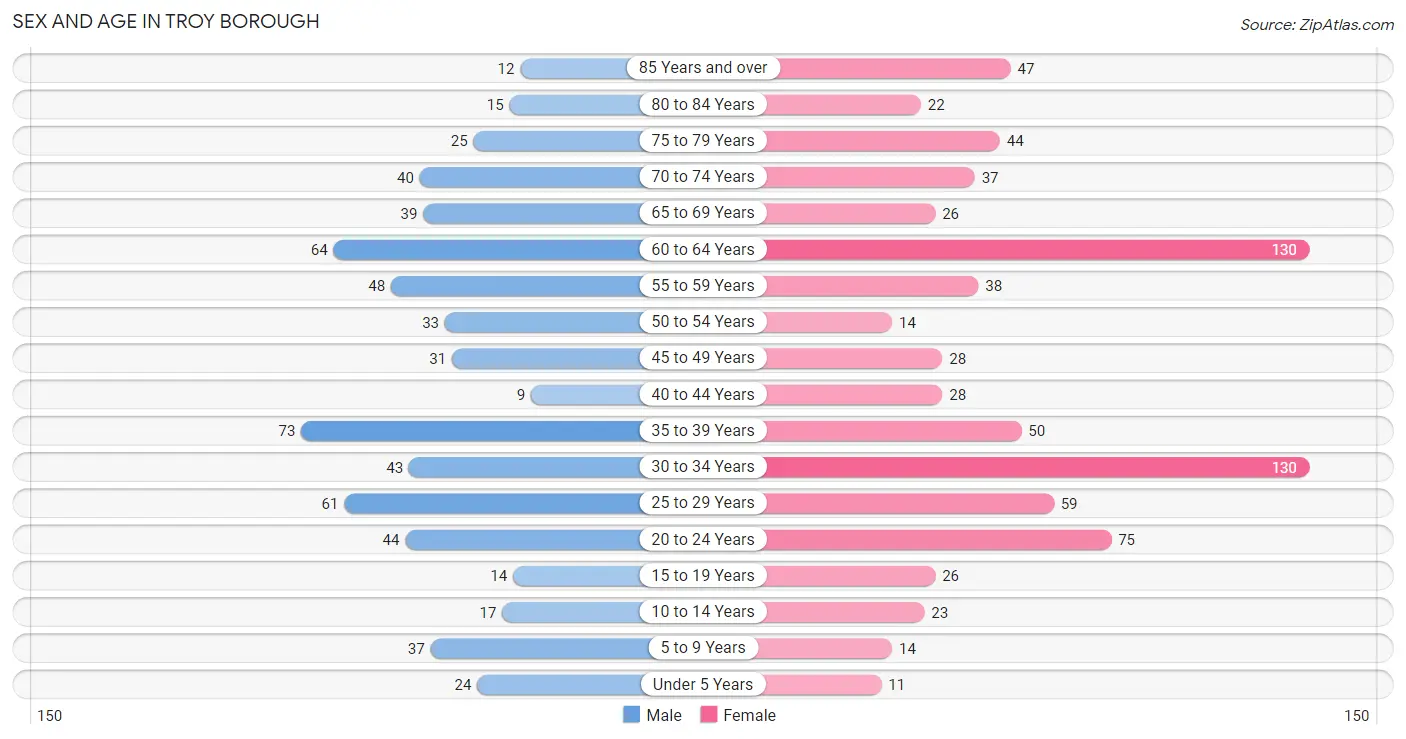
| Age Bracket | Male | Female |
| Under 5 Years | 24 (3.8%) | 11 (1.4%) |
| 5 to 9 Years | 37 (5.9%) | 14 (1.8%) |
| 10 to 14 Years | 17 (2.7%) | 23 (2.9%) |
| 15 to 19 Years | 14 (2.2%) | 26 (3.2%) |
| 20 to 24 Years | 44 (7.0%) | 75 (9.3%) |
| 25 to 29 Years | 61 (9.7%) | 59 (7.4%) |
| 30 to 34 Years | 43 (6.8%) | 130 (16.2%) |
| 35 to 39 Years | 73 (11.6%) | 50 (6.2%) |
| 40 to 44 Years | 9 (1.4%) | 28 (3.5%) |
| 45 to 49 Years | 31 (4.9%) | 28 (3.5%) |
| 50 to 54 Years | 33 (5.2%) | 14 (1.8%) |
| 55 to 59 Years | 48 (7.6%) | 38 (4.7%) |
| 60 to 64 Years | 64 (10.2%) | 130 (16.2%) |
| 65 to 69 Years | 39 (6.2%) | 26 (3.2%) |
| 70 to 74 Years | 40 (6.4%) | 37 (4.6%) |
| 75 to 79 Years | 25 (4.0%) | 44 (5.5%) |
| 80 to 84 Years | 15 (2.4%) | 22 (2.7%) |
| 85 Years and over | 12 (1.9%) | 47 (5.9%) |
| Total | 629 (100.0%) | 802 (100.0%) |
Families and Households in Troy borough
Median Family Size in Troy borough
The median family size in Troy borough is 3.15 persons per family, with single male/father families (13 | 4.3%) accounting for the largest median family size of 5.69 persons per family. On the other hand, single female/mother families (34 | 11.3%) represent the smallest median family size with 2.82 persons per family.
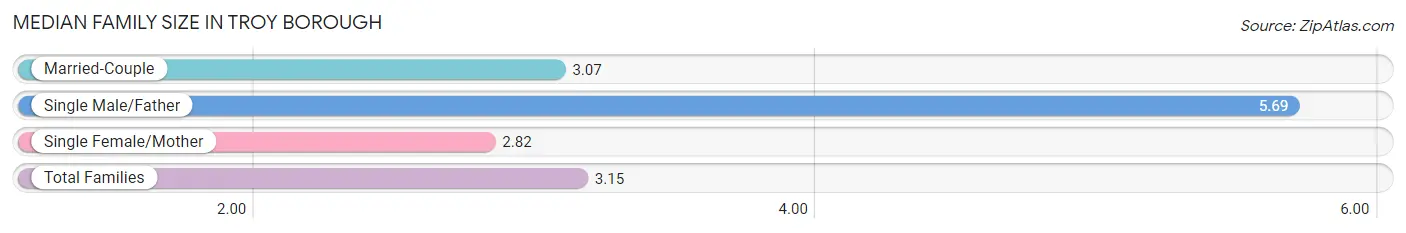
| Family Type | # Families | Family Size |
| Married-Couple | 254 (84.4%) | 3.07 |
| Single Male/Father | 13 (4.3%) | 5.69 |
| Single Female/Mother | 34 (11.3%) | 2.82 |
| Total Families | 301 (100.0%) | 3.15 |
Median Household Size in Troy borough
The median household size in Troy borough is 2.32 persons per household, with single male/father households (13 | 2.2%) accounting for the largest median household size of 11.31 persons per household. non-family households (276 | 47.8%) represent the smallest median household size with 1.11 persons per household.
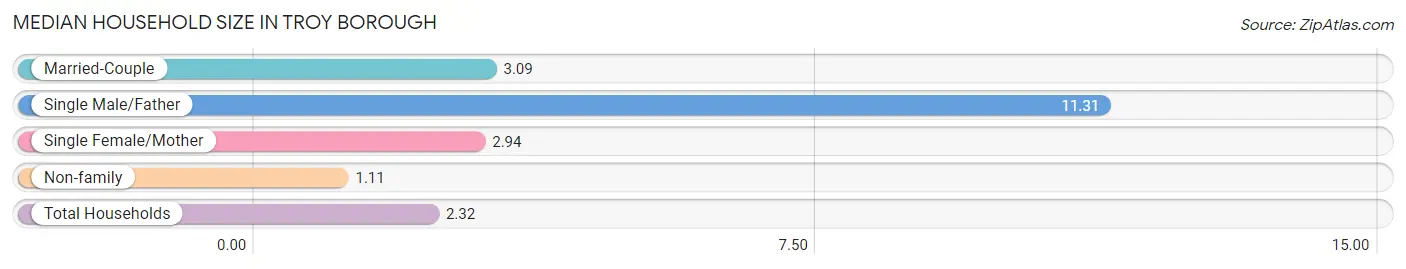
| Household Type | # Households | Household Size |
| Married-Couple | 254 (44.0%) | 3.09 |
| Single Male/Father | 13 (2.2%) | 11.31 |
| Single Female/Mother | 34 (5.9%) | 2.94 |
| Non-family | 276 (47.8%) | 1.11 |
| Total Households | 577 (100.0%) | 2.32 |
Household Size by Marriage Status in Troy borough
Out of a total of 577 households in Troy borough, 301 (52.2%) are family households, while 276 (47.8%) are nonfamily households. The most numerous type of family households are 2-person households, comprising 147, and the most common type of nonfamily households are 1-person households, comprising 252.
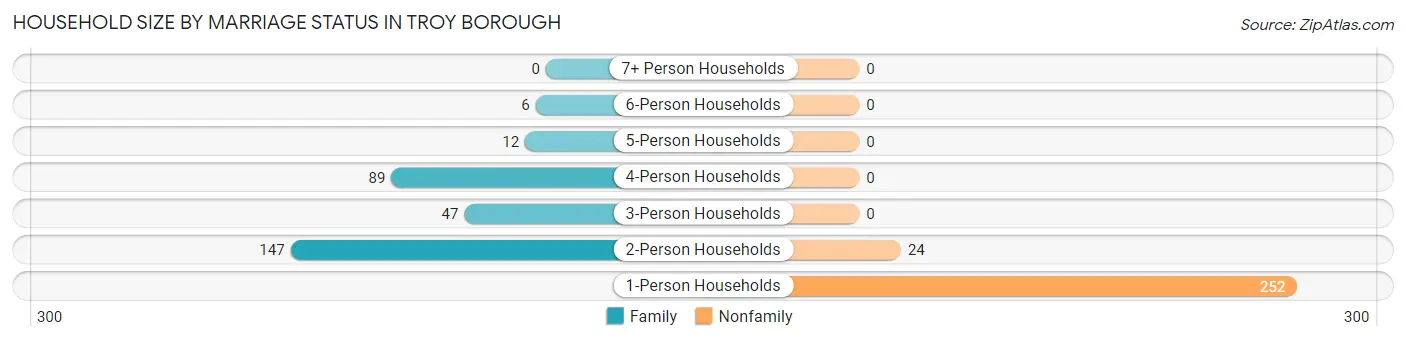
| Household Size | Family Households | Nonfamily Households |
| 1-Person Households | - | 252 (43.7%) |
| 2-Person Households | 147 (25.5%) | 24 (4.2%) |
| 3-Person Households | 47 (8.2%) | 0 (0.0%) |
| 4-Person Households | 89 (15.4%) | 0 (0.0%) |
| 5-Person Households | 12 (2.1%) | 0 (0.0%) |
| 6-Person Households | 6 (1.0%) | 0 (0.0%) |
| 7+ Person Households | 0 (0.0%) | 0 (0.0%) |
| Total | 301 (52.2%) | 276 (47.8%) |
Female Fertility in Troy borough
Fertility by Age in Troy borough
Average fertility rate in Troy borough is 10.0 births per 1,000 women. Women in the age bracket of 20 to 34 years have the highest fertility rate with 15.0 births per 1,000 women. Women in the age bracket of 20 to 34 years acount for 100.0% of all women with births.
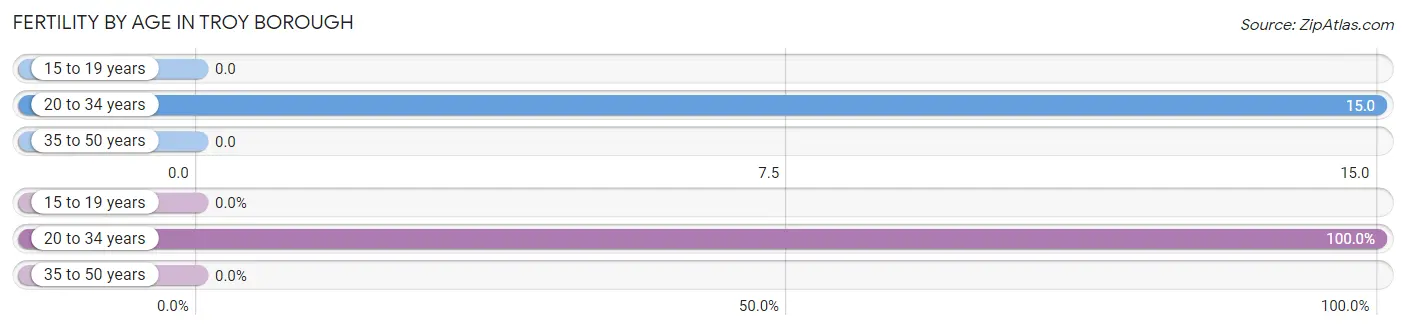
| Age Bracket | Women with Births | Births / 1,000 Women |
| 15 to 19 years | 0 (0.0%) | 0.0 |
| 20 to 34 years | 4 (100.0%) | 15.0 |
| 35 to 50 years | 0 (0.0%) | 0.0 |
| Total | 4 (100.0%) | 10.0 |
Fertility by Age by Marriage Status in Troy borough
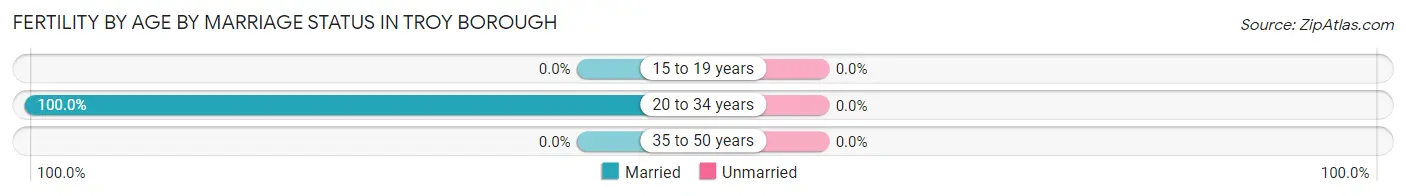
| Age Bracket | Married | Unmarried |
| 15 to 19 years | 0 (0.0%) | 0 (0.0%) |
| 20 to 34 years | 4 (100.0%) | 0 (0.0%) |
| 35 to 50 years | 0 (0.0%) | 0 (0.0%) |
| Total | 4 (100.0%) | 0 (0.0%) |
Fertility by Education in Troy borough
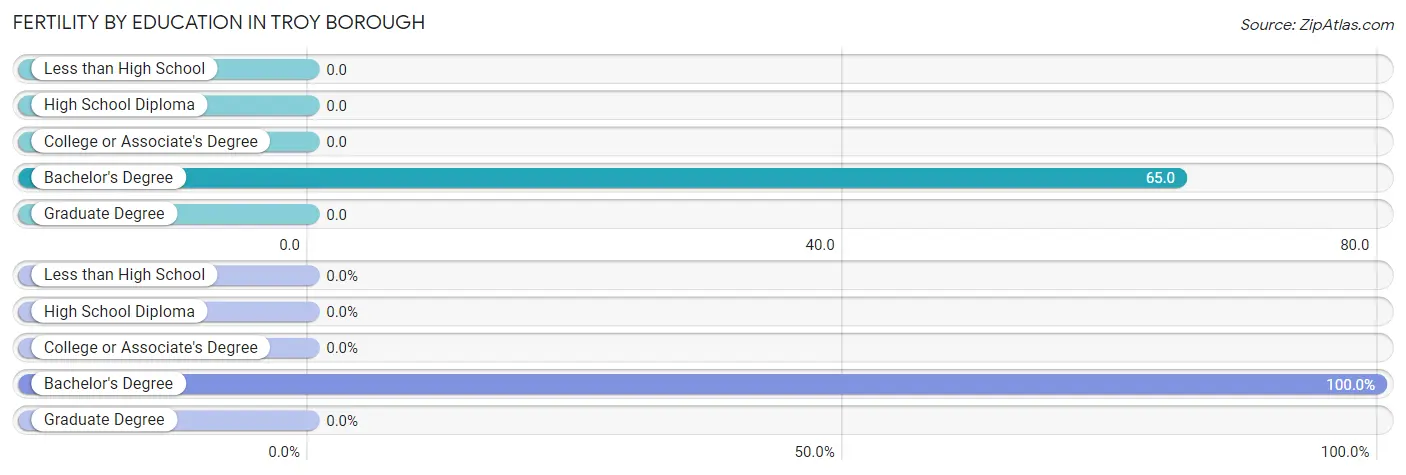
| Educational Attainment | Women with Births | Births / 1,000 Women |
| Less than High School | 0 (0.0%) | 0.0 |
| High School Diploma | 0 (0.0%) | 0.0 |
| College or Associate's Degree | 0 (0.0%) | 0.0 |
| Bachelor's Degree | 4 (100.0%) | 65.0 |
| Graduate Degree | 0 (0.0%) | 0.0 |
| Total | 4 (100.0%) | 10.0 |
Fertility by Education by Marriage Status in Troy borough
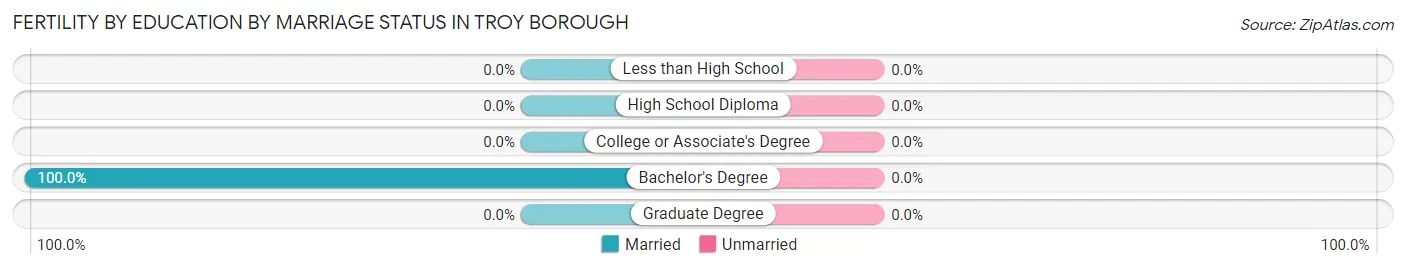
| Educational Attainment | Married | Unmarried |
| Less than High School | 0 (0.0%) | 0 (0.0%) |
| High School Diploma | 0 (0.0%) | 0 (0.0%) |
| College or Associate's Degree | 0 (0.0%) | 0 (0.0%) |
| Bachelor's Degree | 4 (100.0%) | 0 (0.0%) |
| Graduate Degree | 0 (0.0%) | 0 (0.0%) |
| Total | 4 (100.0%) | 0 (0.0%) |
Employment Characteristics in Troy borough
Employment by Class of Employer in Troy borough
Among the 636 employed individuals in Troy borough, private company employees (433 | 68.1%), local government employees (72 | 11.3%), and not-for-profit organizations (68 | 10.7%) make up the most common classes of employment.
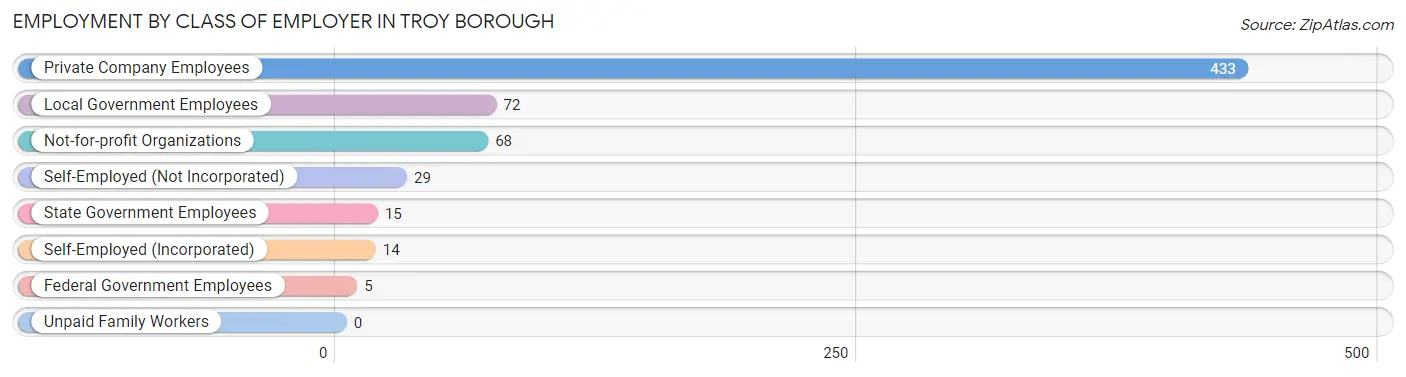
| Employer Class | # Employees | % Employees |
| Private Company Employees | 433 | 68.1% |
| Self-Employed (Incorporated) | 14 | 2.2% |
| Self-Employed (Not Incorporated) | 29 | 4.6% |
| Not-for-profit Organizations | 68 | 10.7% |
| Local Government Employees | 72 | 11.3% |
| State Government Employees | 15 | 2.4% |
| Federal Government Employees | 5 | 0.8% |
| Unpaid Family Workers | 0 | 0.0% |
| Total | 636 | 100.0% |
Employment Status by Age in Troy borough
According to the labor force statistics for Troy borough, out of the total population over 16 years of age (1,301), 49.7% or 647 individuals are in the labor force, with 1.1% or 7 of them unemployed. The age group with the highest labor force participation rate is 45 to 54 years, with 94.3% or 100 individuals in the labor force. Within the labor force, the 20 to 24 years age range has the highest percentage of unemployed individuals, with 4.8% or 4 of them being unemployed.
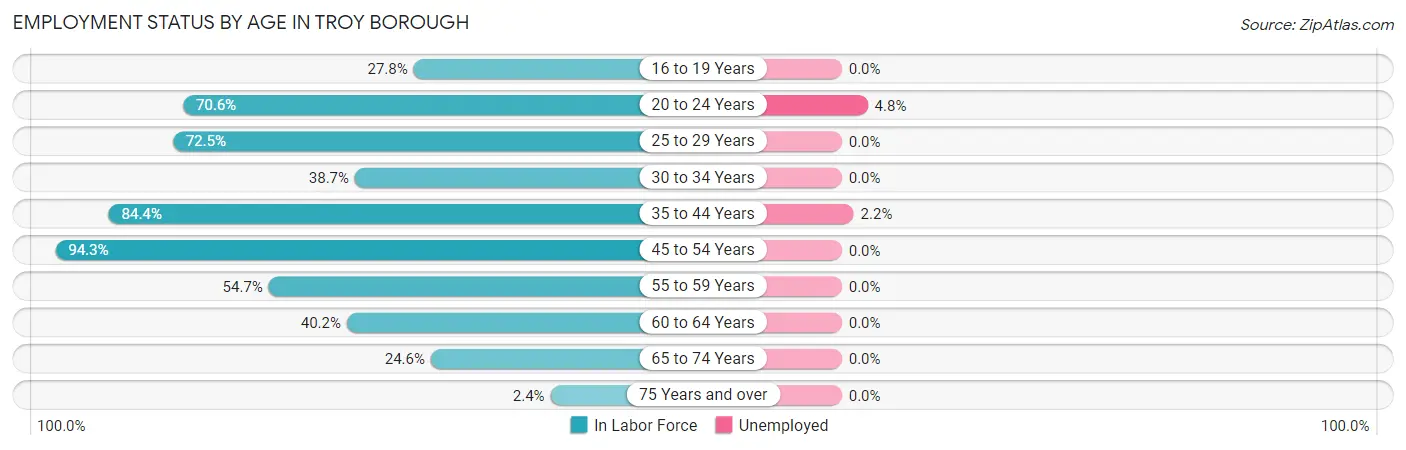
| Age Bracket | In Labor Force | Unemployed |
| 16 to 19 Years | 10 (27.8%) | 0 (0.0%) |
| 20 to 24 Years | 84 (70.6%) | 4 (4.8%) |
| 25 to 29 Years | 87 (72.5%) | 0 (0.0%) |
| 30 to 34 Years | 67 (38.7%) | 0 (0.0%) |
| 35 to 44 Years | 135 (84.4%) | 3 (2.2%) |
| 45 to 54 Years | 100 (94.3%) | 0 (0.0%) |
| 55 to 59 Years | 47 (54.7%) | 0 (0.0%) |
| 60 to 64 Years | 78 (40.2%) | 0 (0.0%) |
| 65 to 74 Years | 35 (24.6%) | 0 (0.0%) |
| 75 Years and over | 4 (2.4%) | 0 (0.0%) |
| Total | 647 (49.7%) | 7 (1.1%) |
Employment Status by Educational Attainment in Troy borough
According to labor force statistics for Troy borough, 61.3% of individuals (514) out of the total population between 25 and 64 years of age (839) are in the labor force, with 0.6% or 3 of them being unemployed. The group with the highest labor force participation rate are those with the educational attainment of bachelor's degree or higher, with 82.4% or 173 individuals in the labor force. Within the labor force, individuals with bachelor's degree or higher education have the highest percentage of unemployment, with 1.7% or 3 of them being unemployed.
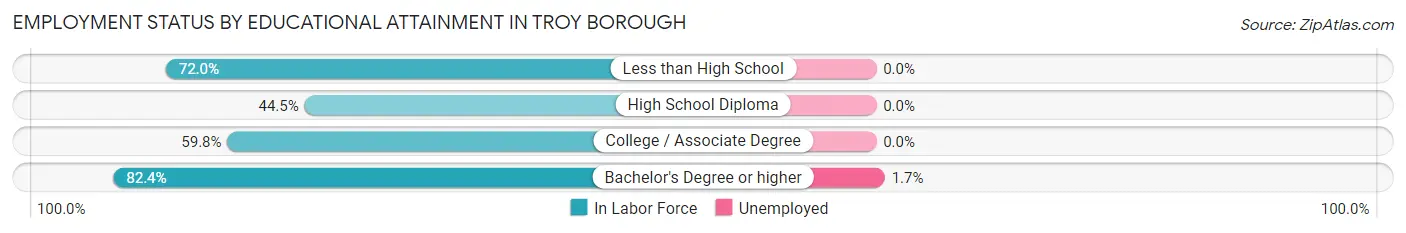
| Educational Attainment | In Labor Force | Unemployed |
| Less than High School | 90 (72.0%) | 0 (0.0%) |
| High School Diploma | 147 (44.5%) | 0 (0.0%) |
| College / Associate Degree | 104 (59.8%) | 0 (0.0%) |
| Bachelor's Degree or higher | 173 (82.4%) | 4 (1.7%) |
| Total | 514 (61.3%) | 5 (0.6%) |
Employment Occupations by Sex in Troy borough
Management, Business, Science and Arts Occupations
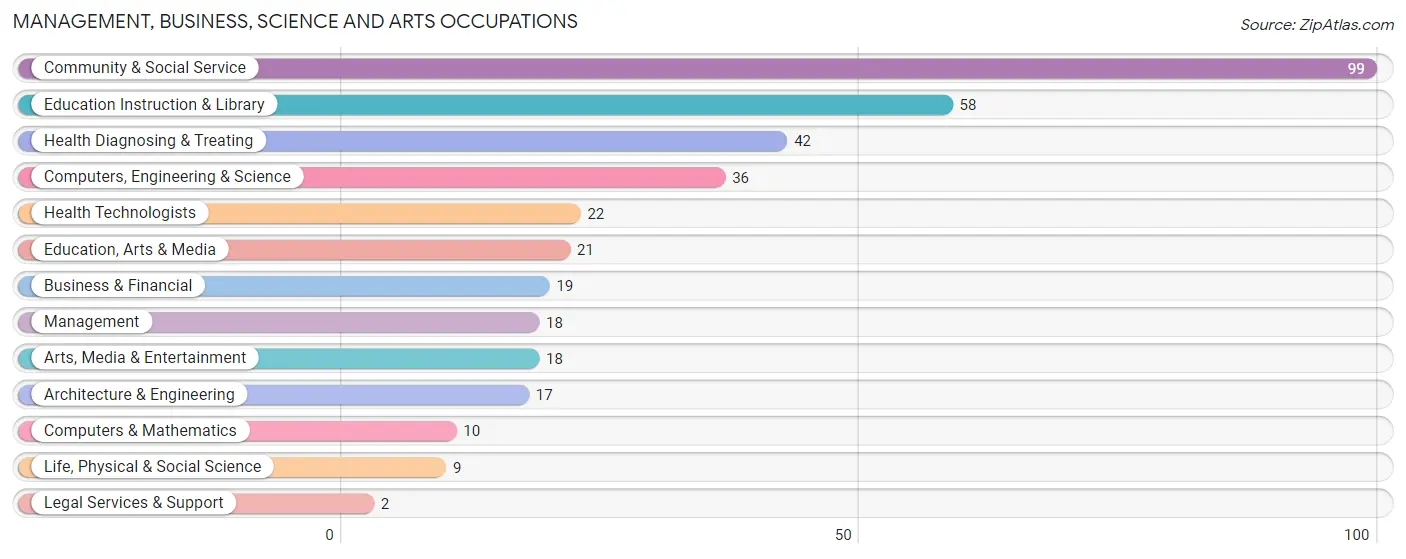
The most common Management, Business, Science and Arts occupations in Troy borough are Community & Social Service (99 | 15.5%), Education Instruction & Library (58 | 9.1%), Health Diagnosing & Treating (42 | 6.6%), Computers, Engineering & Science (36 | 5.6%), and Health Technologists (22 | 3.4%).
Management, Business, Science and Arts Occupations by Sex
Within the Management, Business, Science and Arts occupations in Troy borough, the most male-oriented occupations are Architecture & Engineering (100.0%), Legal Services & Support (100.0%), and Management (77.8%), while the most female-oriented occupations are Arts, Media & Entertainment (94.4%), Education Instruction & Library (91.4%), and Community & Social Service (85.9%).
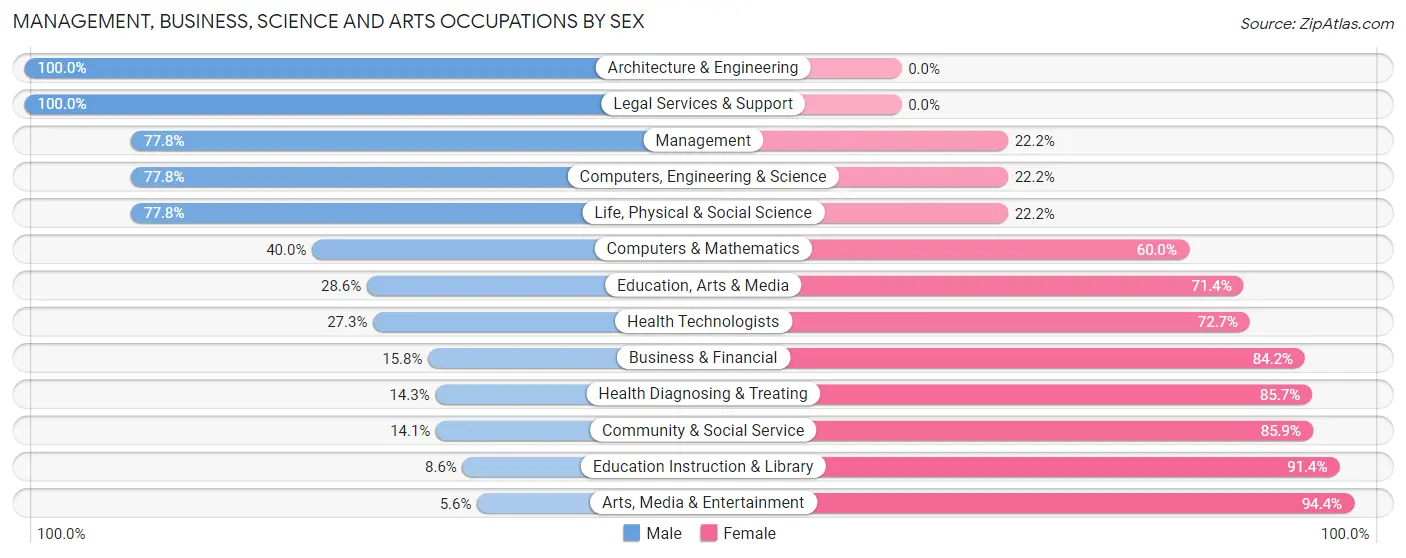
| Occupation | Male | Female |
| Management | 14 (77.8%) | 4 (22.2%) |
| Business & Financial | 3 (15.8%) | 16 (84.2%) |
| Computers, Engineering & Science | 28 (77.8%) | 8 (22.2%) |
| Computers & Mathematics | 4 (40.0%) | 6 (60.0%) |
| Architecture & Engineering | 17 (100.0%) | 0 (0.0%) |
| Life, Physical & Social Science | 7 (77.8%) | 2 (22.2%) |
| Community & Social Service | 14 (14.1%) | 85 (85.9%) |
| Education, Arts & Media | 6 (28.6%) | 15 (71.4%) |
| Legal Services & Support | 2 (100.0%) | 0 (0.0%) |
| Education Instruction & Library | 5 (8.6%) | 53 (91.4%) |
| Arts, Media & Entertainment | 1 (5.6%) | 17 (94.4%) |
| Health Diagnosing & Treating | 6 (14.3%) | 36 (85.7%) |
| Health Technologists | 6 (27.3%) | 16 (72.7%) |
| Total (Category) | 65 (30.4%) | 149 (69.6%) |
| Total (Overall) | 315 (49.2%) | 325 (50.8%) |
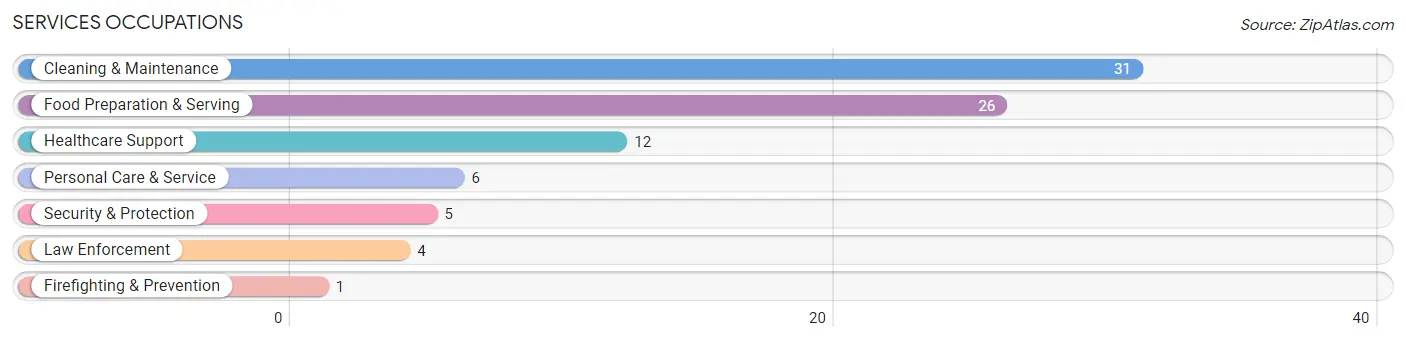
Services Occupations
The most common Services occupations in Troy borough are Cleaning & Maintenance (31 | 4.8%), Food Preparation & Serving (26 | 4.1%), Healthcare Support (12 | 1.9%), Personal Care & Service (6 | 0.9%), and Security & Protection (5 | 0.8%).
Services Occupations by Sex
Within the Services occupations in Troy borough, the most male-oriented occupations are Law Enforcement (100.0%), Security & Protection (80.0%), and Cleaning & Maintenance (38.7%), while the most female-oriented occupations are Firefighting & Prevention (100.0%), Personal Care & Service (100.0%), and Food Preparation & Serving (88.5%).
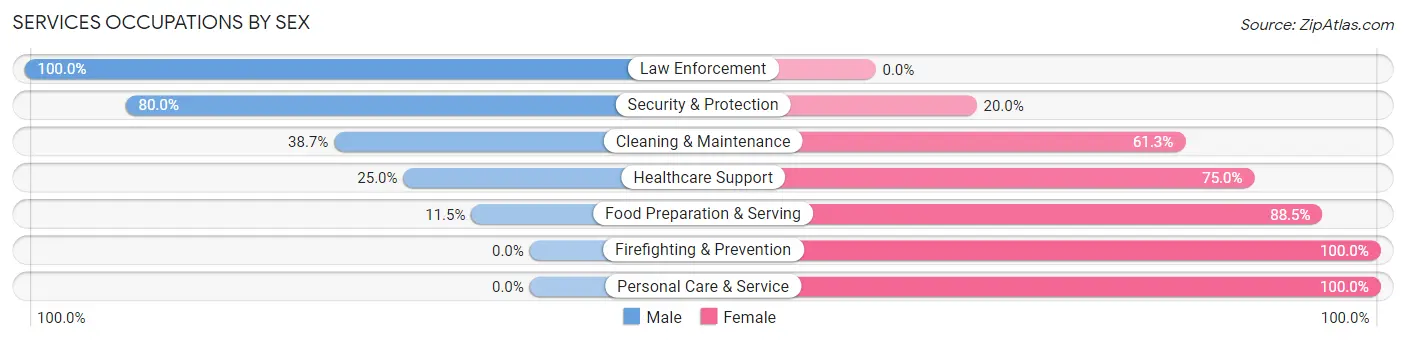
| Occupation | Male | Female |
| Healthcare Support | 3 (25.0%) | 9 (75.0%) |
| Security & Protection | 4 (80.0%) | 1 (20.0%) |
| Firefighting & Prevention | 0 (0.0%) | 1 (100.0%) |
| Law Enforcement | 4 (100.0%) | 0 (0.0%) |
| Food Preparation & Serving | 3 (11.5%) | 23 (88.5%) |
| Cleaning & Maintenance | 12 (38.7%) | 19 (61.3%) |
| Personal Care & Service | 0 (0.0%) | 6 (100.0%) |
| Total (Category) | 22 (27.5%) | 58 (72.5%) |
| Total (Overall) | 315 (49.2%) | 325 (50.8%) |
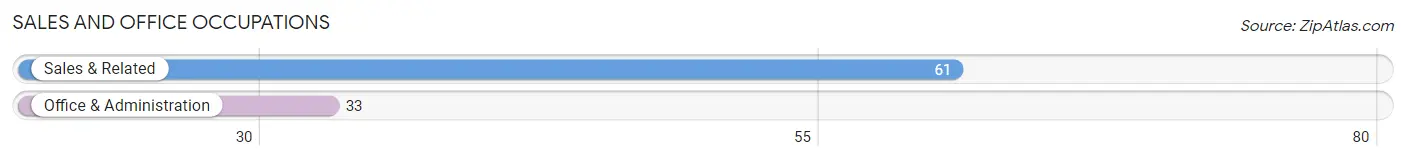
Sales and Office Occupations
The most common Sales and Office occupations in Troy borough are Sales & Related (61 | 9.5%), and Office & Administration (33 | 5.2%).
Sales and Office Occupations by Sex
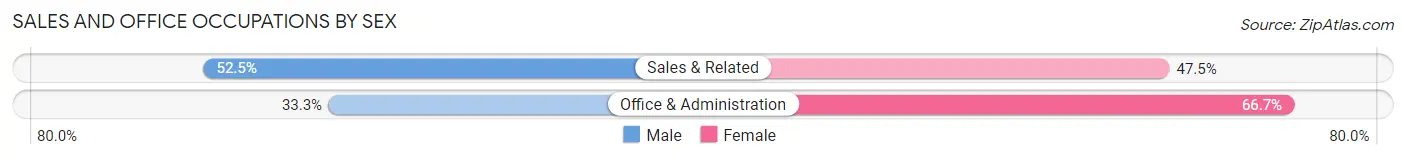
| Occupation | Male | Female |
| Sales & Related | 32 (52.5%) | 29 (47.5%) |
| Office & Administration | 11 (33.3%) | 22 (66.7%) |
| Total (Category) | 43 (45.7%) | 51 (54.3%) |
| Total (Overall) | 315 (49.2%) | 325 (50.8%) |
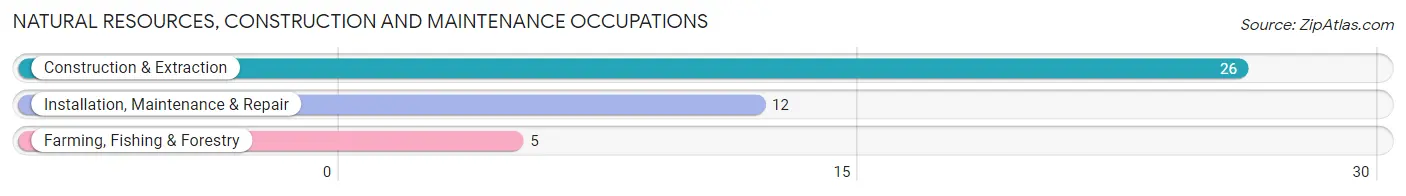
Natural Resources, Construction and Maintenance Occupations
The most common Natural Resources, Construction and Maintenance occupations in Troy borough are Construction & Extraction (26 | 4.1%), Installation, Maintenance & Repair (12 | 1.9%), and Farming, Fishing & Forestry (5 | 0.8%).
Natural Resources, Construction and Maintenance Occupations by Sex

| Occupation | Male | Female |
| Farming, Fishing & Forestry | 2 (40.0%) | 3 (60.0%) |
| Construction & Extraction | 24 (92.3%) | 2 (7.7%) |
| Installation, Maintenance & Repair | 12 (100.0%) | 0 (0.0%) |
| Total (Category) | 38 (88.4%) | 5 (11.6%) |
| Total (Overall) | 315 (49.2%) | 325 (50.8%) |
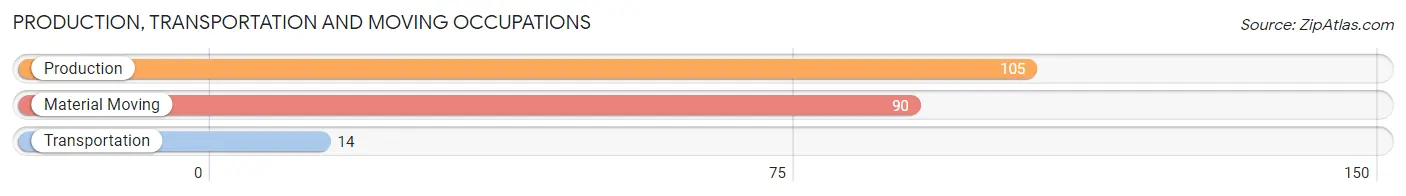
Production, Transportation and Moving Occupations
The most common Production, Transportation and Moving occupations in Troy borough are Production (105 | 16.4%), Material Moving (90 | 14.1%), and Transportation (14 | 2.2%).
Production, Transportation and Moving Occupations by Sex
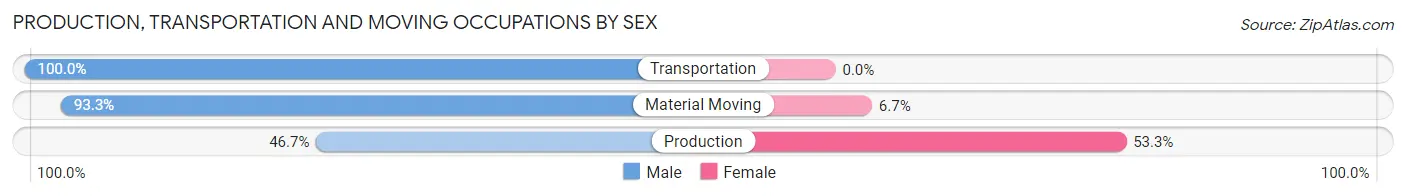
| Occupation | Male | Female |
| Production | 49 (46.7%) | 56 (53.3%) |
| Transportation | 14 (100.0%) | 0 (0.0%) |
| Material Moving | 84 (93.3%) | 6 (6.7%) |
| Total (Category) | 147 (70.3%) | 62 (29.7%) |
| Total (Overall) | 315 (49.2%) | 325 (50.8%) |
Employment Industries by Sex in Troy borough
Employment Industries in Troy borough
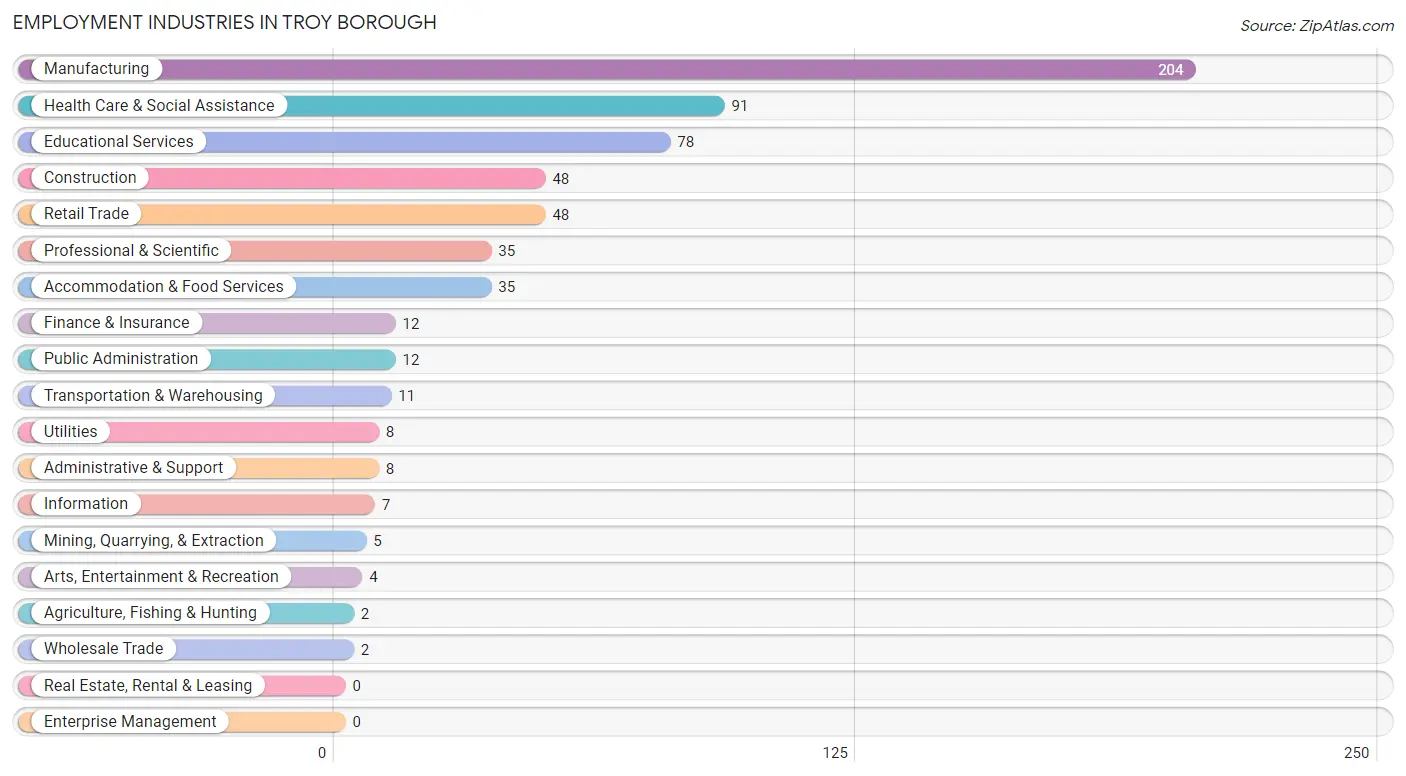
The major employment industries in Troy borough include Manufacturing (204 | 31.9%), Health Care & Social Assistance (91 | 14.2%), Educational Services (78 | 12.2%), Construction (48 | 7.5%), and Retail Trade (48 | 7.5%).
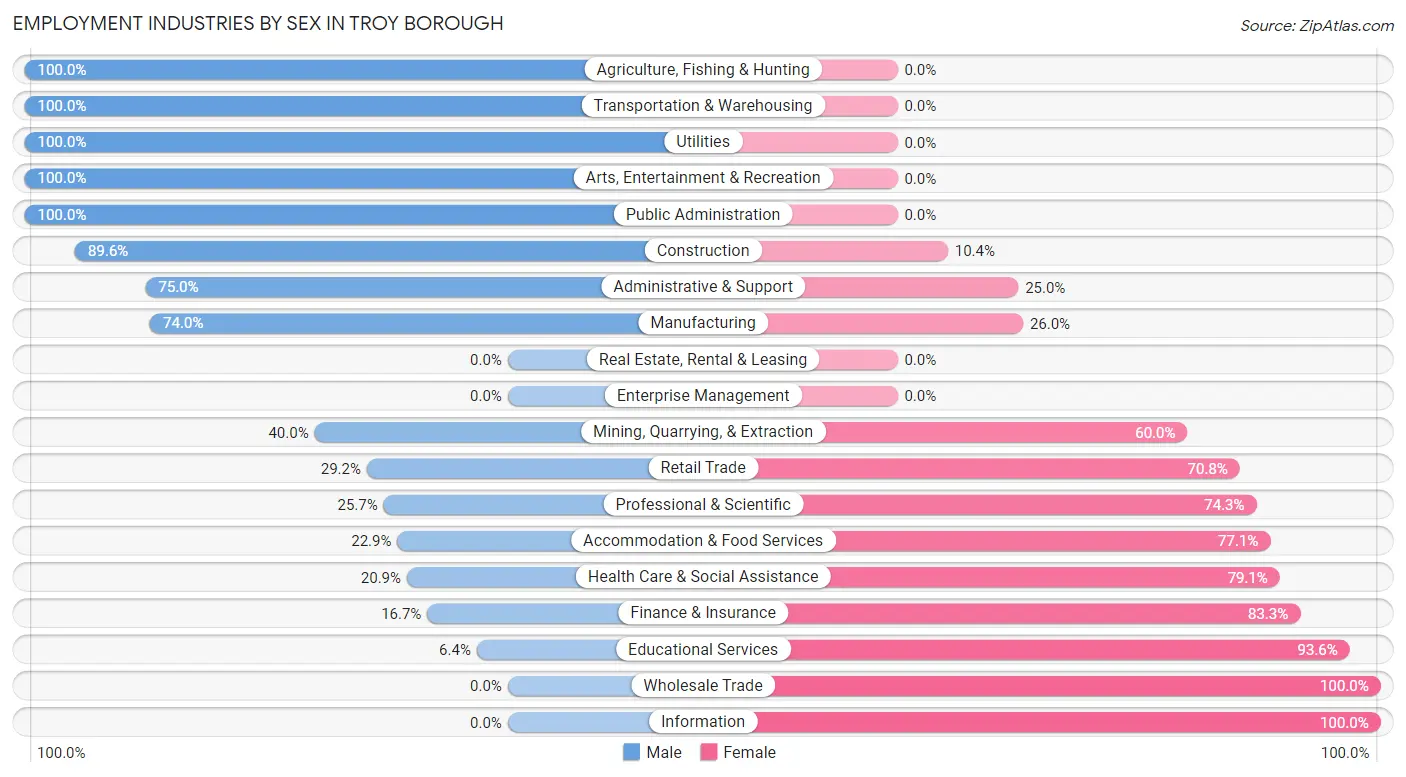
Employment Industries by Sex in Troy borough
The Troy borough industries that see more men than women are Agriculture, Fishing & Hunting (100.0%), Transportation & Warehousing (100.0%), and Utilities (100.0%), whereas the industries that tend to have a higher number of women are Wholesale Trade (100.0%), Information (100.0%), and Educational Services (93.6%).
| Industry | Male | Female |
| Agriculture, Fishing & Hunting | 2 (100.0%) | 0 (0.0%) |
| Mining, Quarrying, & Extraction | 2 (40.0%) | 3 (60.0%) |
| Construction | 43 (89.6%) | 5 (10.4%) |
| Manufacturing | 151 (74.0%) | 53 (26.0%) |
| Wholesale Trade | 0 (0.0%) | 2 (100.0%) |
| Retail Trade | 14 (29.2%) | 34 (70.8%) |
| Transportation & Warehousing | 11 (100.0%) | 0 (0.0%) |
| Utilities | 8 (100.0%) | 0 (0.0%) |
| Information | 0 (0.0%) | 7 (100.0%) |
| Finance & Insurance | 2 (16.7%) | 10 (83.3%) |
| Real Estate, Rental & Leasing | 0 (0.0%) | 0 (0.0%) |
| Professional & Scientific | 9 (25.7%) | 26 (74.3%) |
| Enterprise Management | 0 (0.0%) | 0 (0.0%) |
| Administrative & Support | 6 (75.0%) | 2 (25.0%) |
| Educational Services | 5 (6.4%) | 73 (93.6%) |
| Health Care & Social Assistance | 19 (20.9%) | 72 (79.1%) |
| Arts, Entertainment & Recreation | 4 (100.0%) | 0 (0.0%) |
| Accommodation & Food Services | 8 (22.9%) | 27 (77.1%) |
| Public Administration | 12 (100.0%) | 0 (0.0%) |
| Total | 315 (49.2%) | 325 (50.8%) |
Education in Troy borough
School Enrollment in Troy borough
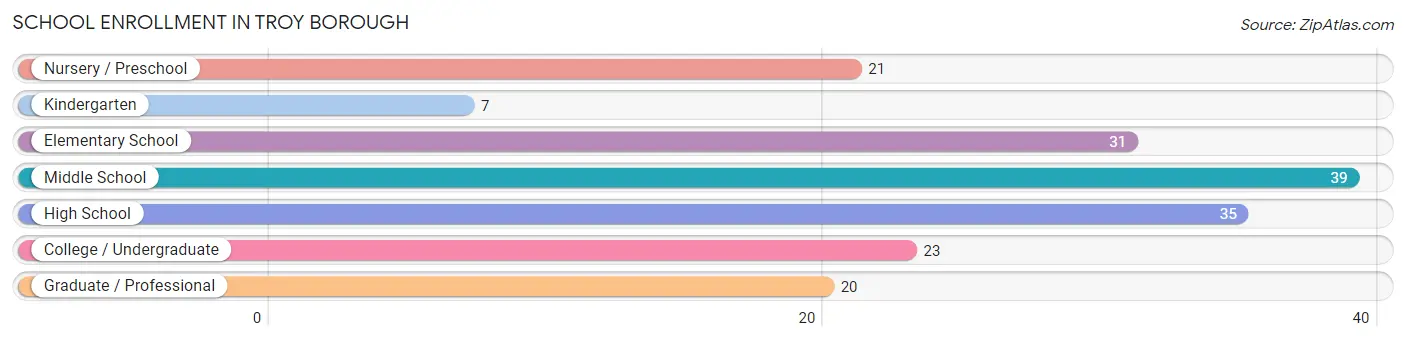
The most common levels of schooling among the 176 students in Troy borough are middle school (39 | 22.2%), high school (35 | 19.9%), and elementary school (31 | 17.6%).
| School Level | # Students | % Students |
| Nursery / Preschool | 21 | 11.9% |
| Kindergarten | 7 | 4.0% |
| Elementary School | 31 | 17.6% |
| Middle School | 39 | 22.2% |
| High School | 35 | 19.9% |
| College / Undergraduate | 23 | 13.1% |
| Graduate / Professional | 20 | 11.4% |
| Total | 176 | 100.0% |
School Enrollment by Age by Funding Source in Troy borough
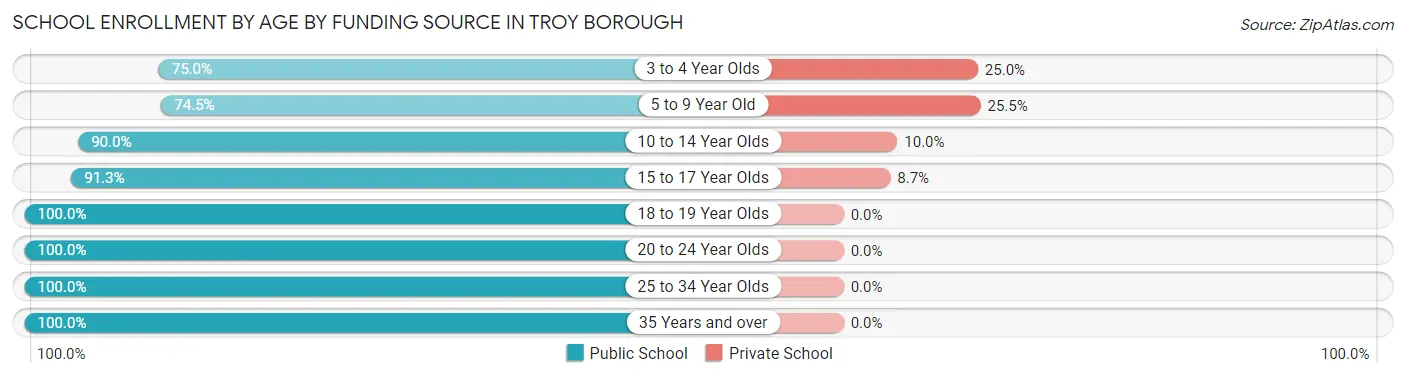
Out of a total of 176 students who are enrolled in schools in Troy borough, 21 (11.9%) attend a private institution, while the remaining 155 (88.1%) are enrolled in public schools. The age group of 5 to 9 year old has the highest likelihood of being enrolled in private schools, with 13 (25.5% in the age bracket) enrolled. Conversely, the age group of 18 to 19 year olds has the lowest likelihood of being enrolled in a private school, with 7 (100.0% in the age bracket) attending a public institution.
| Age Bracket | Public School | Private School |
| 3 to 4 Year Olds | 6 (75.0%) | 2 (25.0%) |
| 5 to 9 Year Old | 38 (74.5%) | 13 (25.5%) |
| 10 to 14 Year Olds | 36 (90.0%) | 4 (10.0%) |
| 15 to 17 Year Olds | 21 (91.3%) | 2 (8.7%) |
| 18 to 19 Year Olds | 7 (100.0%) | 0 (0.0%) |
| 20 to 24 Year Olds | 16 (100.0%) | 0 (0.0%) |
| 25 to 34 Year Olds | 12 (100.0%) | 0 (0.0%) |
| 35 Years and over | 19 (100.0%) | 0 (0.0%) |
| Total | 155 (88.1%) | 21 (11.9%) |
Educational Attainment by Field of Study in Troy borough
Business (41 | 15.1%), education (39 | 14.4%), computers & mathematics (38 | 14.0%), bio, nature & agricultural (29 | 10.7%), and arts & humanities (29 | 10.7%) are the most common fields of study among 271 individuals in Troy borough who have obtained a bachelor's degree or higher.
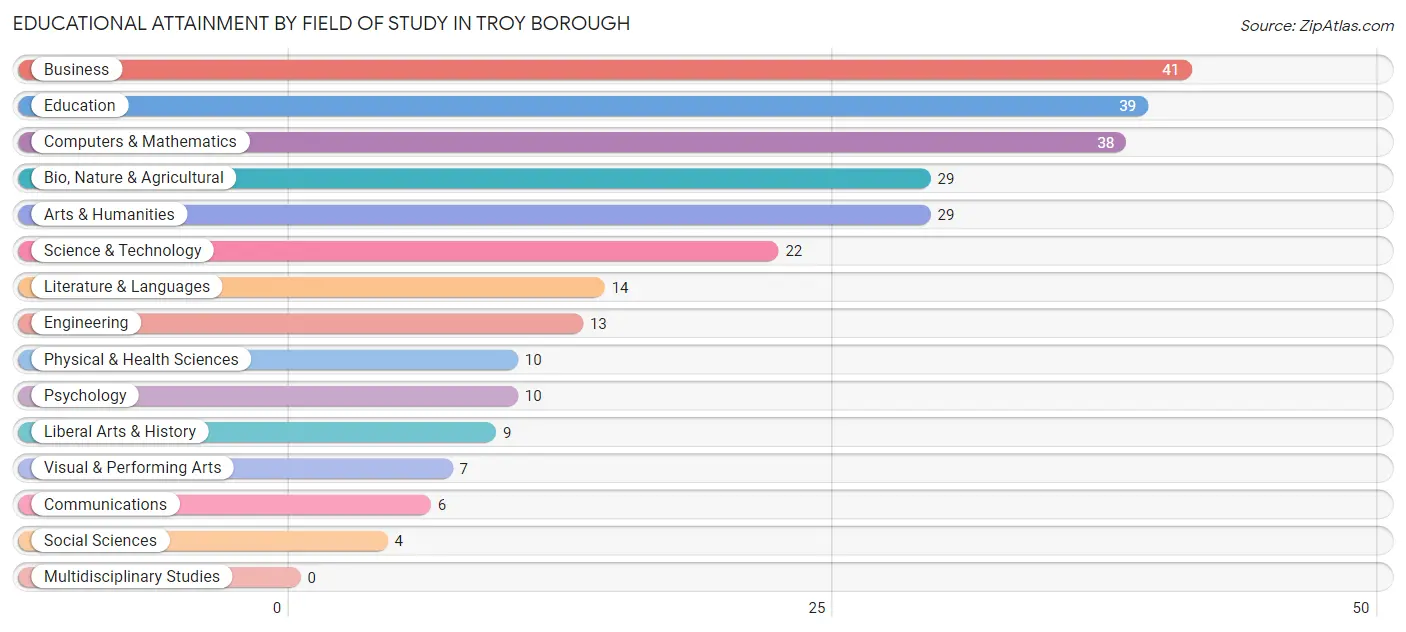
| Field of Study | # Graduates | % Graduates |
| Computers & Mathematics | 38 | 14.0% |
| Bio, Nature & Agricultural | 29 | 10.7% |
| Physical & Health Sciences | 10 | 3.7% |
| Psychology | 10 | 3.7% |
| Social Sciences | 4 | 1.5% |
| Engineering | 13 | 4.8% |
| Multidisciplinary Studies | 0 | 0.0% |
| Science & Technology | 22 | 8.1% |
| Business | 41 | 15.1% |
| Education | 39 | 14.4% |
| Literature & Languages | 14 | 5.2% |
| Liberal Arts & History | 9 | 3.3% |
| Visual & Performing Arts | 7 | 2.6% |
| Communications | 6 | 2.2% |
| Arts & Humanities | 29 | 10.7% |
| Total | 271 | 100.0% |
Transportation & Commute in Troy borough
Vehicle Availability by Sex in Troy borough
The most prevalent vehicle ownership categories in Troy borough are males with 1 vehicle (88, accounting for 27.9%) and females with 1 vehicle (73, making up 27.4%).
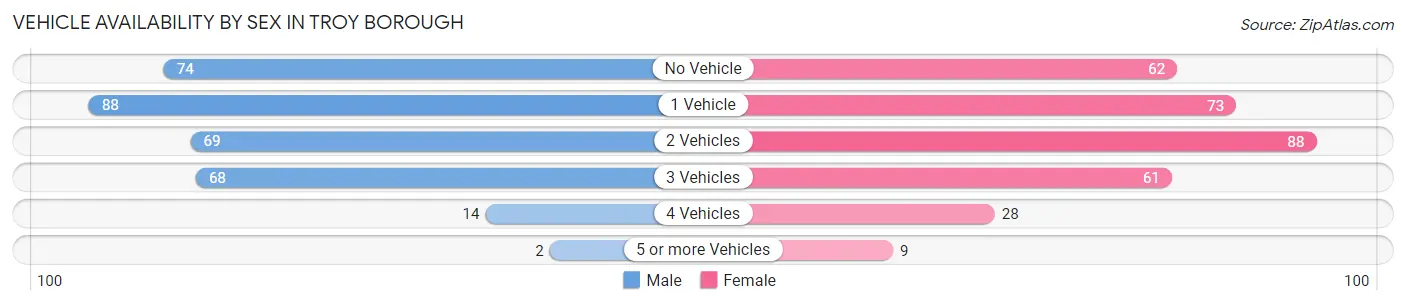
| Vehicles Available | Male | Female |
| No Vehicle | 74 (23.5%) | 62 (19.3%) |
| 1 Vehicle | 88 (27.9%) | 73 (22.7%) |
| 2 Vehicles | 69 (21.9%) | 88 (27.4%) |
| 3 Vehicles | 68 (21.6%) | 61 (19.0%) |
| 4 Vehicles | 14 (4.4%) | 28 (8.7%) |
| 5 or more Vehicles | 2 (0.6%) | 9 (2.8%) |
| Total | 315 (100.0%) | 321 (100.0%) |
Commute Time in Troy borough
The most frequently occuring commute durations in Troy borough are 5 to 9 minutes (218 commuters, 35.9%), less than 5 minutes (78 commuters, 12.9%), and 30 to 34 minutes (76 commuters, 12.5%).
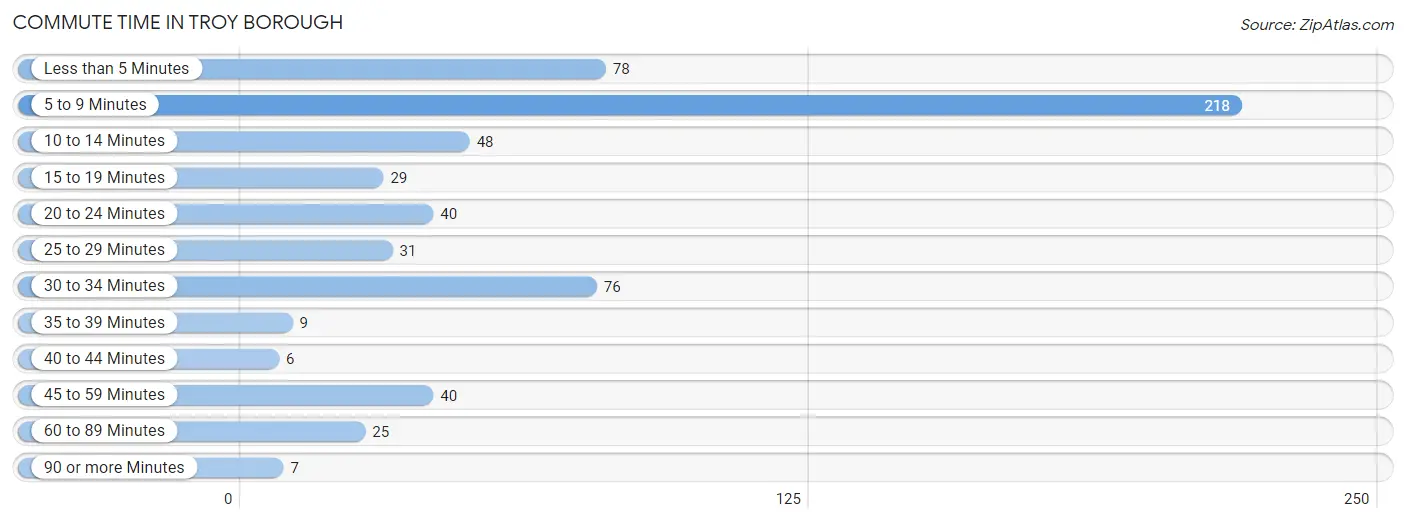
| Commute Time | # Commuters | % Commuters |
| Less than 5 Minutes | 78 | 12.9% |
| 5 to 9 Minutes | 218 | 35.9% |
| 10 to 14 Minutes | 48 | 7.9% |
| 15 to 19 Minutes | 29 | 4.8% |
| 20 to 24 Minutes | 40 | 6.6% |
| 25 to 29 Minutes | 31 | 5.1% |
| 30 to 34 Minutes | 76 | 12.5% |
| 35 to 39 Minutes | 9 | 1.5% |
| 40 to 44 Minutes | 6 | 1.0% |
| 45 to 59 Minutes | 40 | 6.6% |
| 60 to 89 Minutes | 25 | 4.1% |
| 90 or more Minutes | 7 | 1.1% |
Commute Time by Sex in Troy borough
The most common commute times in Troy borough are 5 to 9 minutes (91 commuters, 30.0%) for males and 5 to 9 minutes (127 commuters, 41.8%) for females.
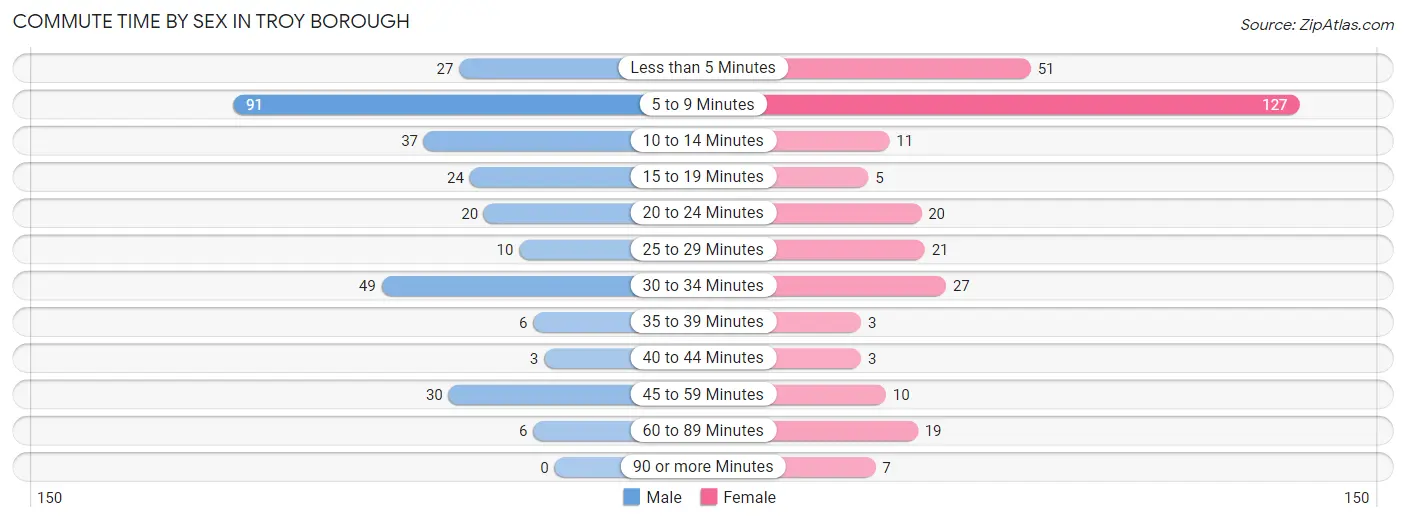
| Commute Time | Male | Female |
| Less than 5 Minutes | 27 (8.9%) | 51 (16.8%) |
| 5 to 9 Minutes | 91 (30.0%) | 127 (41.8%) |
| 10 to 14 Minutes | 37 (12.2%) | 11 (3.6%) |
| 15 to 19 Minutes | 24 (7.9%) | 5 (1.6%) |
| 20 to 24 Minutes | 20 (6.6%) | 20 (6.6%) |
| 25 to 29 Minutes | 10 (3.3%) | 21 (6.9%) |
| 30 to 34 Minutes | 49 (16.2%) | 27 (8.9%) |
| 35 to 39 Minutes | 6 (2.0%) | 3 (1.0%) |
| 40 to 44 Minutes | 3 (1.0%) | 3 (1.0%) |
| 45 to 59 Minutes | 30 (9.9%) | 10 (3.3%) |
| 60 to 89 Minutes | 6 (2.0%) | 19 (6.2%) |
| 90 or more Minutes | 0 (0.0%) | 7 (2.3%) |
Time of Departure to Work by Sex in Troy borough
The most frequent times of departure to work in Troy borough are 5:30 AM to 5:59 AM (112, 37.0%) for males and 5:30 AM to 5:59 AM (61, 20.1%) for females.
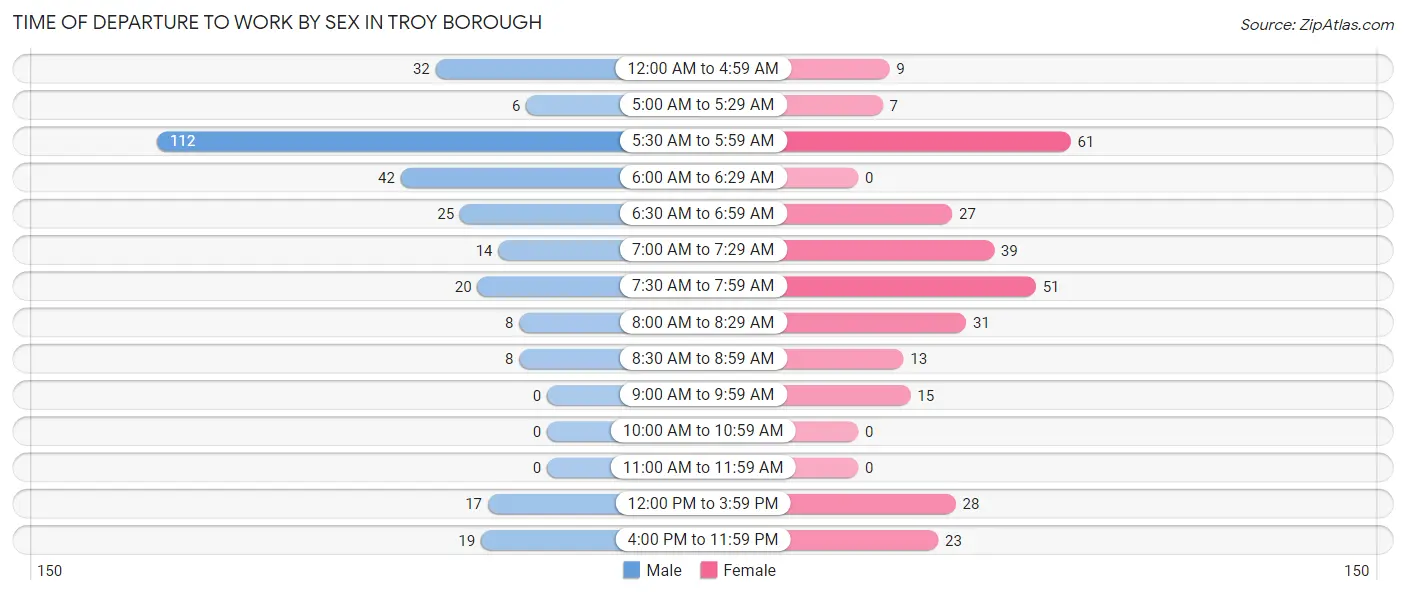
| Time of Departure | Male | Female |
| 12:00 AM to 4:59 AM | 32 (10.6%) | 9 (3.0%) |
| 5:00 AM to 5:29 AM | 6 (2.0%) | 7 (2.3%) |
| 5:30 AM to 5:59 AM | 112 (37.0%) | 61 (20.1%) |
| 6:00 AM to 6:29 AM | 42 (13.9%) | 0 (0.0%) |
| 6:30 AM to 6:59 AM | 25 (8.3%) | 27 (8.9%) |
| 7:00 AM to 7:29 AM | 14 (4.6%) | 39 (12.8%) |
| 7:30 AM to 7:59 AM | 20 (6.6%) | 51 (16.8%) |
| 8:00 AM to 8:29 AM | 8 (2.6%) | 31 (10.2%) |
| 8:30 AM to 8:59 AM | 8 (2.6%) | 13 (4.3%) |
| 9:00 AM to 9:59 AM | 0 (0.0%) | 15 (4.9%) |
| 10:00 AM to 10:59 AM | 0 (0.0%) | 0 (0.0%) |
| 11:00 AM to 11:59 AM | 0 (0.0%) | 0 (0.0%) |
| 12:00 PM to 3:59 PM | 17 (5.6%) | 28 (9.2%) |
| 4:00 PM to 11:59 PM | 19 (6.3%) | 23 (7.6%) |
| Total | 303 (100.0%) | 304 (100.0%) |
Housing Occupancy in Troy borough
Occupancy by Ownership in Troy borough
Of the total 577 dwellings in Troy borough, owner-occupied units account for 353 (61.2%), while renter-occupied units make up 224 (38.8%).
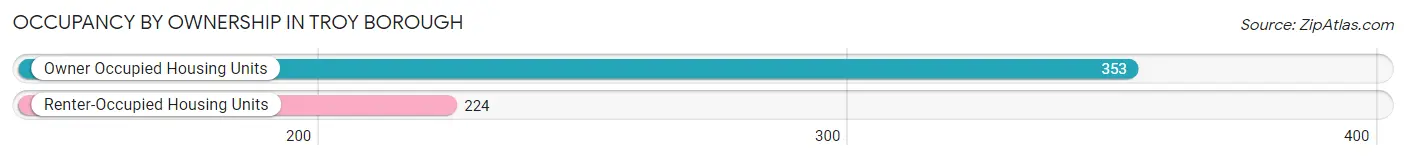
| Occupancy | # Housing Units | % Housing Units |
| Owner Occupied Housing Units | 353 | 61.2% |
| Renter-Occupied Housing Units | 224 | 38.8% |
| Total Occupied Housing Units | 577 | 100.0% |
Occupancy by Household Size in Troy borough
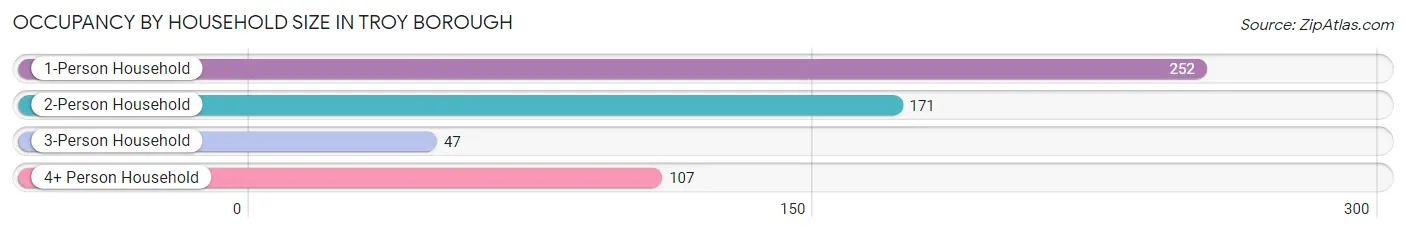
| Household Size | # Housing Units | % Housing Units |
| 1-Person Household | 252 | 43.7% |
| 2-Person Household | 171 | 29.6% |
| 3-Person Household | 47 | 8.2% |
| 4+ Person Household | 107 | 18.5% |
| Total Housing Units | 577 | 100.0% |
Occupancy by Ownership by Household Size in Troy borough
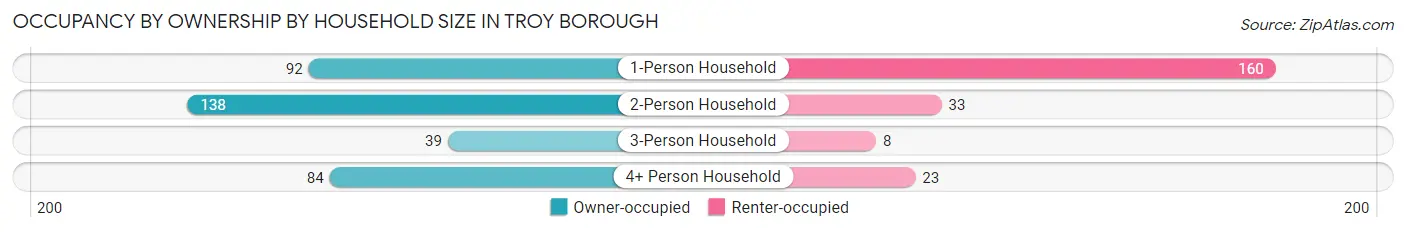
| Household Size | Owner-occupied | Renter-occupied |
| 1-Person Household | 92 (36.5%) | 160 (63.5%) |
| 2-Person Household | 138 (80.7%) | 33 (19.3%) |
| 3-Person Household | 39 (83.0%) | 8 (17.0%) |
| 4+ Person Household | 84 (78.5%) | 23 (21.5%) |
| Total Housing Units | 353 (61.2%) | 224 (38.8%) |
Occupancy by Educational Attainment in Troy borough
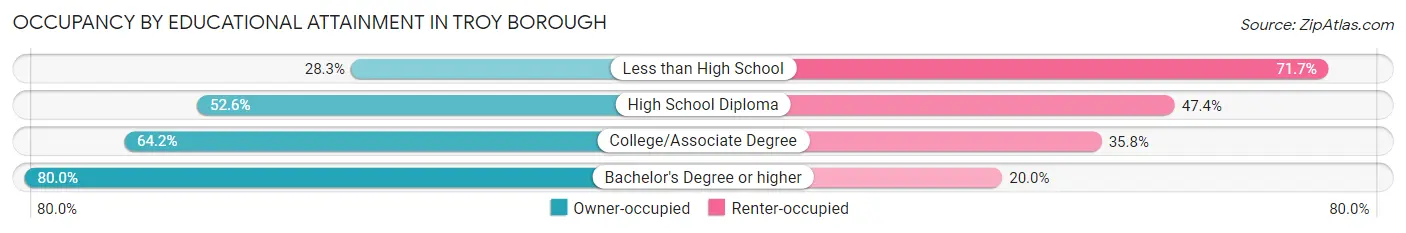
| Household Size | Owner-occupied | Renter-occupied |
| Less than High School | 13 (28.3%) | 33 (71.7%) |
| High School Diploma | 130 (52.6%) | 117 (47.4%) |
| College/Associate Degree | 70 (64.2%) | 39 (35.8%) |
| Bachelor's Degree or higher | 140 (80.0%) | 35 (20.0%) |
Occupancy by Age of Householder in Troy borough
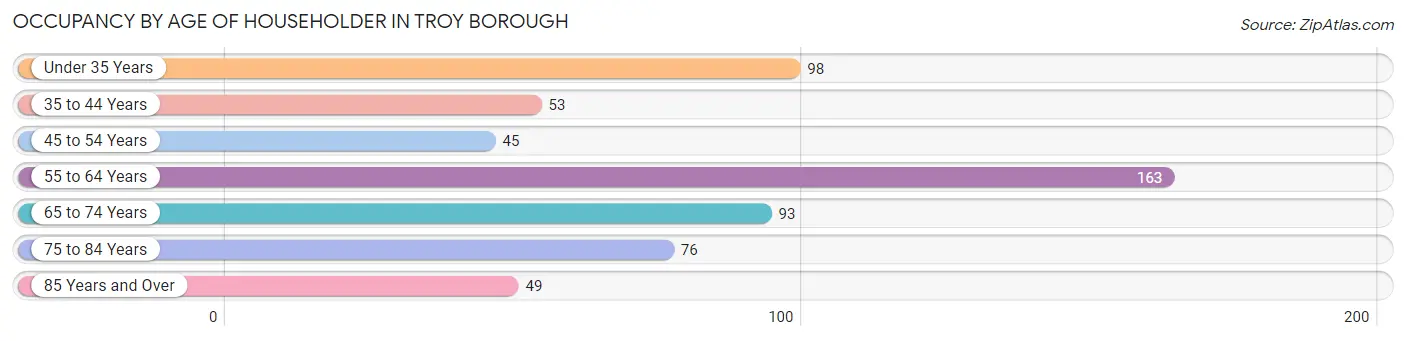
| Age Bracket | # Households | % Households |
| Under 35 Years | 98 | 17.0% |
| 35 to 44 Years | 53 | 9.2% |
| 45 to 54 Years | 45 | 7.8% |
| 55 to 64 Years | 163 | 28.2% |
| 65 to 74 Years | 93 | 16.1% |
| 75 to 84 Years | 76 | 13.2% |
| 85 Years and Over | 49 | 8.5% |
| Total | 577 | 100.0% |
Housing Finances in Troy borough
Median Income by Occupancy in Troy borough
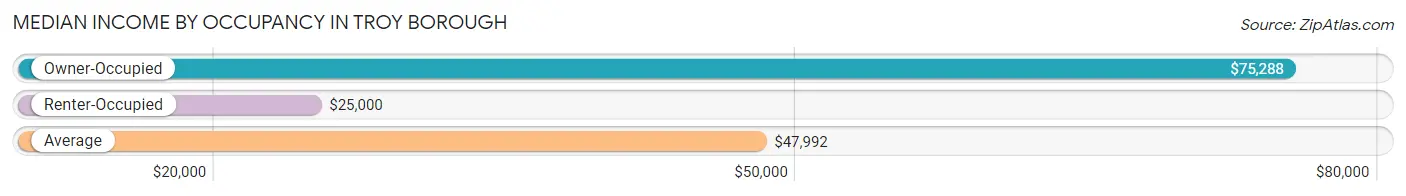
| Occupancy Type | # Households | Median Income |
| Owner-Occupied | 353 (61.2%) | $75,288 |
| Renter-Occupied | 224 (38.8%) | $25,000 |
| Average | 577 (100.0%) | $47,992 |
Occupancy by Householder Income Bracket in Troy borough
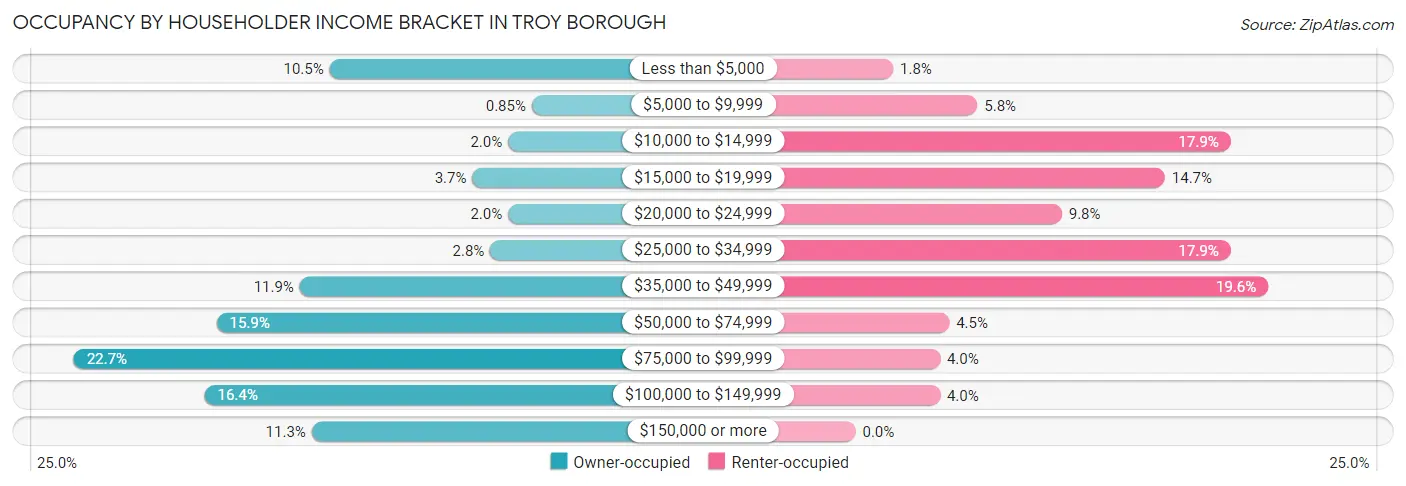
| Income Bracket | Owner-occupied | Renter-occupied |
| Less than $5,000 | 37 (10.5%) | 4 (1.8%) |
| $5,000 to $9,999 | 3 (0.9%) | 13 (5.8%) |
| $10,000 to $14,999 | 7 (2.0%) | 40 (17.9%) |
| $15,000 to $19,999 | 13 (3.7%) | 33 (14.7%) |
| $20,000 to $24,999 | 7 (2.0%) | 22 (9.8%) |
| $25,000 to $34,999 | 10 (2.8%) | 40 (17.9%) |
| $35,000 to $49,999 | 42 (11.9%) | 44 (19.6%) |
| $50,000 to $74,999 | 56 (15.9%) | 10 (4.5%) |
| $75,000 to $99,999 | 80 (22.7%) | 9 (4.0%) |
| $100,000 to $149,999 | 58 (16.4%) | 9 (4.0%) |
| $150,000 or more | 40 (11.3%) | 0 (0.0%) |
| Total | 353 (100.0%) | 224 (100.0%) |
Monthly Housing Cost Tiers in Troy borough
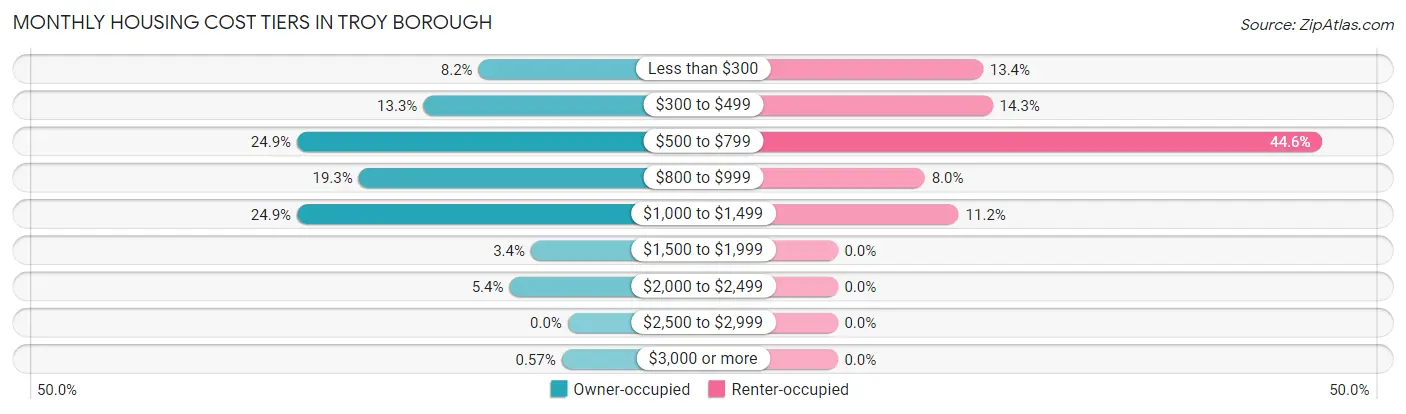
| Monthly Cost | Owner-occupied | Renter-occupied |
| Less than $300 | 29 (8.2%) | 30 (13.4%) |
| $300 to $499 | 47 (13.3%) | 32 (14.3%) |
| $500 to $799 | 88 (24.9%) | 100 (44.6%) |
| $800 to $999 | 68 (19.3%) | 18 (8.0%) |
| $1,000 to $1,499 | 88 (24.9%) | 25 (11.2%) |
| $1,500 to $1,999 | 12 (3.4%) | 0 (0.0%) |
| $2,000 to $2,499 | 19 (5.4%) | 0 (0.0%) |
| $2,500 to $2,999 | 0 (0.0%) | 0 (0.0%) |
| $3,000 or more | 2 (0.6%) | 0 (0.0%) |
| Total | 353 (100.0%) | 224 (100.0%) |
Physical Housing Characteristics in Troy borough
Housing Structures in Troy borough
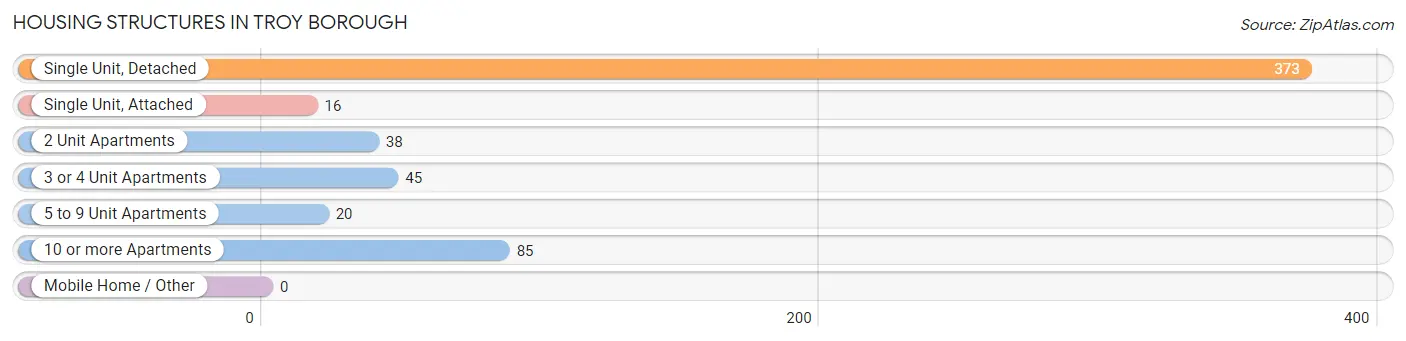
| Structure Type | # Housing Units | % Housing Units |
| Single Unit, Detached | 373 | 64.6% |
| Single Unit, Attached | 16 | 2.8% |
| 2 Unit Apartments | 38 | 6.6% |
| 3 or 4 Unit Apartments | 45 | 7.8% |
| 5 to 9 Unit Apartments | 20 | 3.5% |
| 10 or more Apartments | 85 | 14.7% |
| Mobile Home / Other | 0 | 0.0% |
| Total | 577 | 100.0% |
Housing Structures by Occupancy in Troy borough
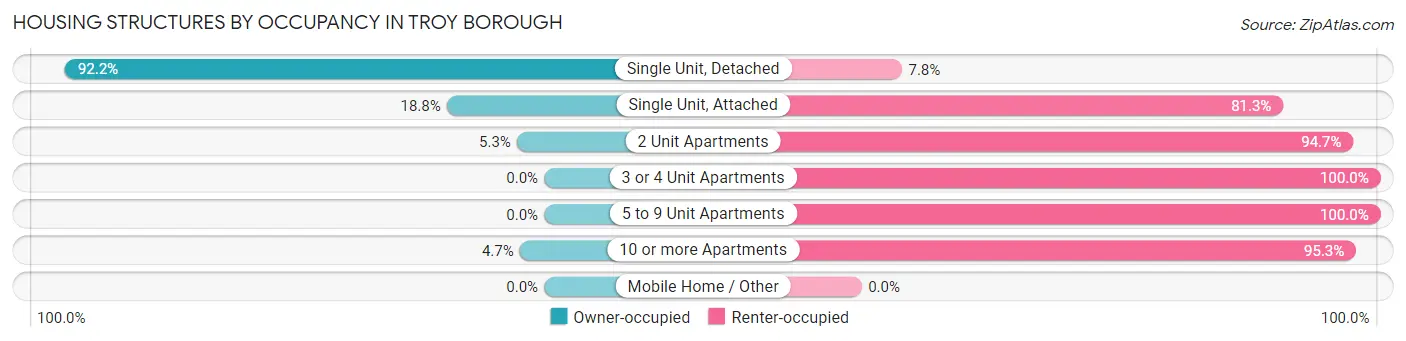
| Structure Type | Owner-occupied | Renter-occupied |
| Single Unit, Detached | 344 (92.2%) | 29 (7.8%) |
| Single Unit, Attached | 3 (18.8%) | 13 (81.2%) |
| 2 Unit Apartments | 2 (5.3%) | 36 (94.7%) |
| 3 or 4 Unit Apartments | 0 (0.0%) | 45 (100.0%) |
| 5 to 9 Unit Apartments | 0 (0.0%) | 20 (100.0%) |
| 10 or more Apartments | 4 (4.7%) | 81 (95.3%) |
| Mobile Home / Other | 0 (0.0%) | 0 (0.0%) |
| Total | 353 (61.2%) | 224 (38.8%) |
Housing Structures by Number of Rooms in Troy borough
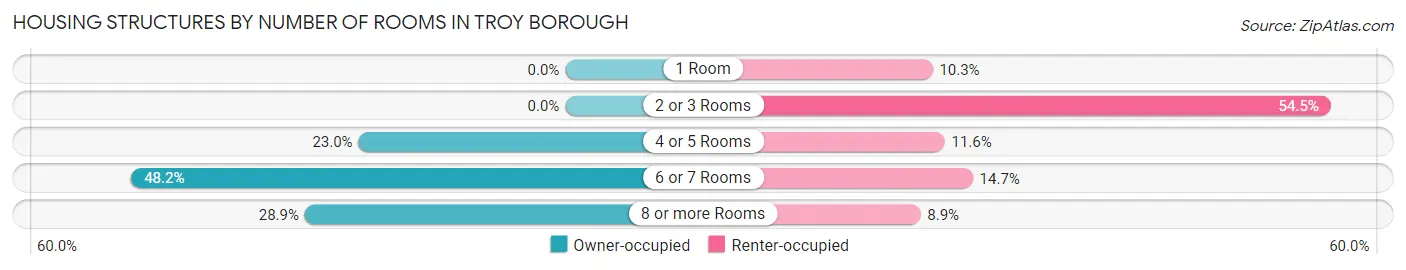
| Number of Rooms | Owner-occupied | Renter-occupied |
| 1 Room | 0 (0.0%) | 23 (10.3%) |
| 2 or 3 Rooms | 0 (0.0%) | 122 (54.5%) |
| 4 or 5 Rooms | 81 (23.0%) | 26 (11.6%) |
| 6 or 7 Rooms | 170 (48.2%) | 33 (14.7%) |
| 8 or more Rooms | 102 (28.9%) | 20 (8.9%) |
| Total | 353 (100.0%) | 224 (100.0%) |
Housing Structure by Heating Type in Troy borough
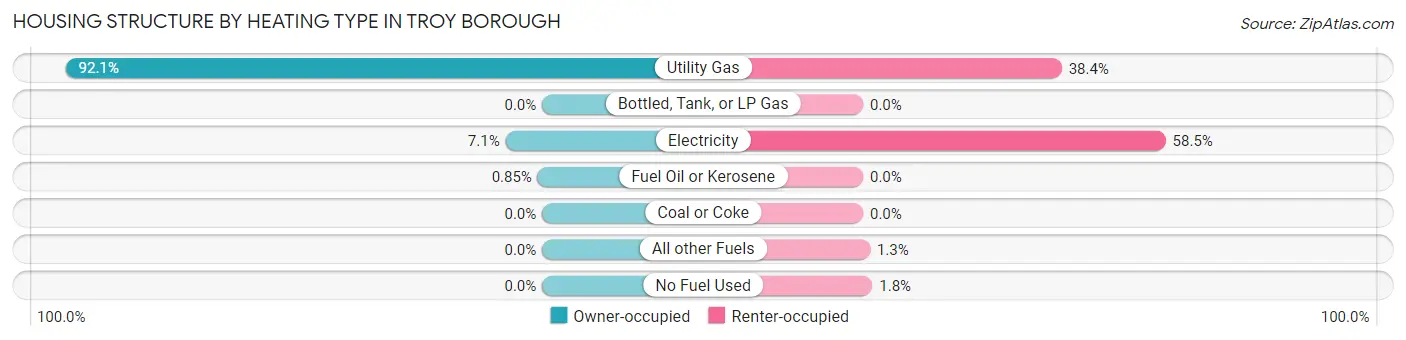
| Heating Type | Owner-occupied | Renter-occupied |
| Utility Gas | 325 (92.1%) | 86 (38.4%) |
| Bottled, Tank, or LP Gas | 0 (0.0%) | 0 (0.0%) |
| Electricity | 25 (7.1%) | 131 (58.5%) |
| Fuel Oil or Kerosene | 3 (0.9%) | 0 (0.0%) |
| Coal or Coke | 0 (0.0%) | 0 (0.0%) |
| All other Fuels | 0 (0.0%) | 3 (1.3%) |
| No Fuel Used | 0 (0.0%) | 4 (1.8%) |
| Total | 353 (100.0%) | 224 (100.0%) |
Household Vehicle Usage in Troy borough
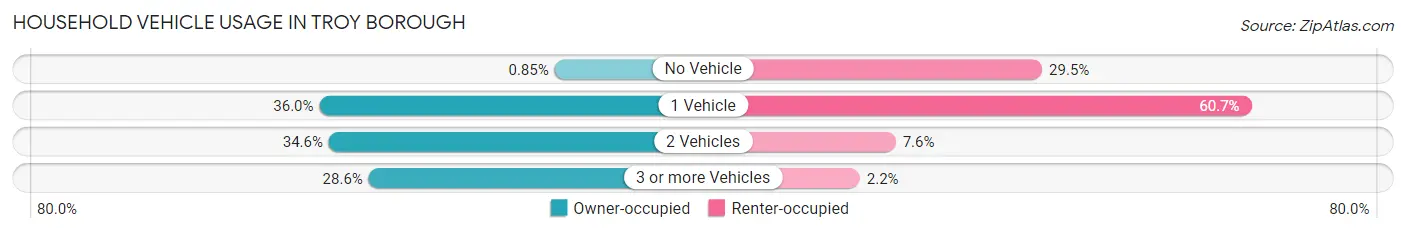
| Vehicles per Household | Owner-occupied | Renter-occupied |
| No Vehicle | 3 (0.9%) | 66 (29.5%) |
| 1 Vehicle | 127 (36.0%) | 136 (60.7%) |
| 2 Vehicles | 122 (34.6%) | 17 (7.6%) |
| 3 or more Vehicles | 101 (28.6%) | 5 (2.2%) |
| Total | 353 (100.0%) | 224 (100.0%) |
Real Estate & Mortgages in Troy borough
Real Estate and Mortgage Overview in Troy borough
| Characteristic | Without Mortgage | With Mortgage |
| Housing Units | 150 | 203 |
| Median Property Value | $152,200 | $135,400 |
| Median Household Income | $58,333 | $9 |
| Monthly Housing Costs | $518 | $2 |
| Real Estate Taxes | $1,759 | $1 |
Property Value by Mortgage Status in Troy borough
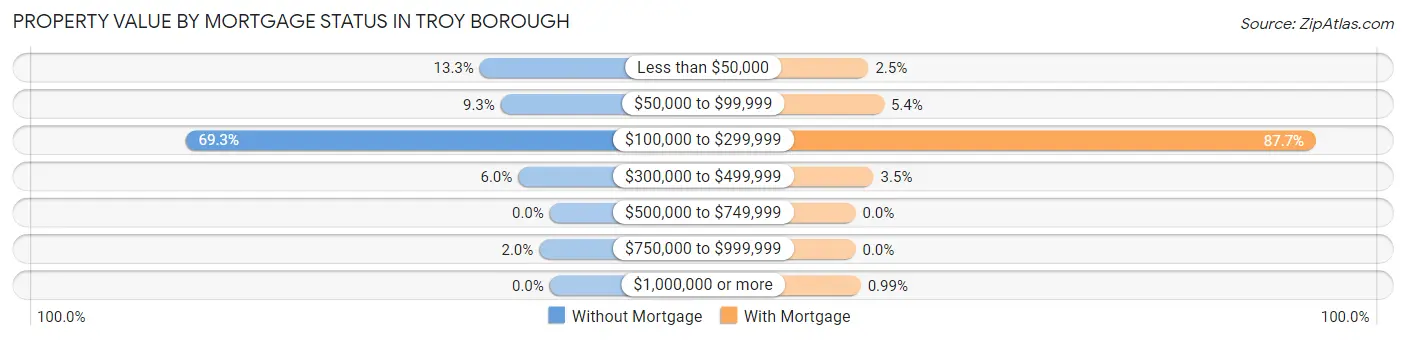
| Property Value | Without Mortgage | With Mortgage |
| Less than $50,000 | 20 (13.3%) | 5 (2.5%) |
| $50,000 to $99,999 | 14 (9.3%) | 11 (5.4%) |
| $100,000 to $299,999 | 104 (69.3%) | 178 (87.7%) |
| $300,000 to $499,999 | 9 (6.0%) | 7 (3.5%) |
| $500,000 to $749,999 | 0 (0.0%) | 0 (0.0%) |
| $750,000 to $999,999 | 3 (2.0%) | 0 (0.0%) |
| $1,000,000 or more | 0 (0.0%) | 2 (1.0%) |
| Total | 150 (100.0%) | 203 (100.0%) |
Household Income by Mortgage Status in Troy borough
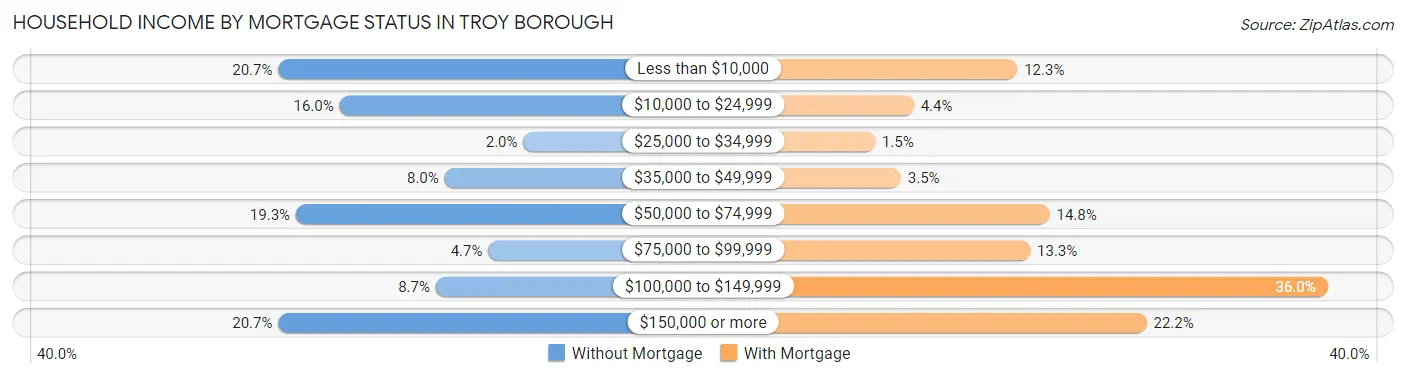
| Household Income | Without Mortgage | With Mortgage |
| Less than $10,000 | 31 (20.7%) | 25 (12.3%) |
| $10,000 to $24,999 | 24 (16.0%) | 9 (4.4%) |
| $25,000 to $34,999 | 3 (2.0%) | 3 (1.5%) |
| $35,000 to $49,999 | 12 (8.0%) | 7 (3.5%) |
| $50,000 to $74,999 | 29 (19.3%) | 30 (14.8%) |
| $75,000 to $99,999 | 7 (4.7%) | 27 (13.3%) |
| $100,000 to $149,999 | 13 (8.7%) | 73 (36.0%) |
| $150,000 or more | 31 (20.7%) | 45 (22.2%) |
| Total | 150 (100.0%) | 203 (100.0%) |
Property Value to Household Income Ratio in Troy borough
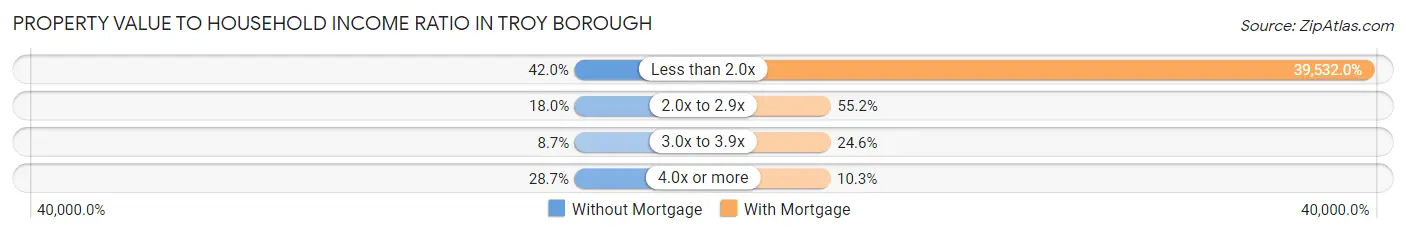
| Value-to-Income Ratio | Without Mortgage | With Mortgage |
| Less than 2.0x | 63 (42.0%) | 80,250 (39,532.0%) |
| 2.0x to 2.9x | 27 (18.0%) | 112 (55.2%) |
| 3.0x to 3.9x | 13 (8.7%) | 50 (24.6%) |
| 4.0x or more | 43 (28.7%) | 21 (10.3%) |
| Total | 150 (100.0%) | 203 (100.0%) |
Real Estate Taxes by Mortgage Status in Troy borough
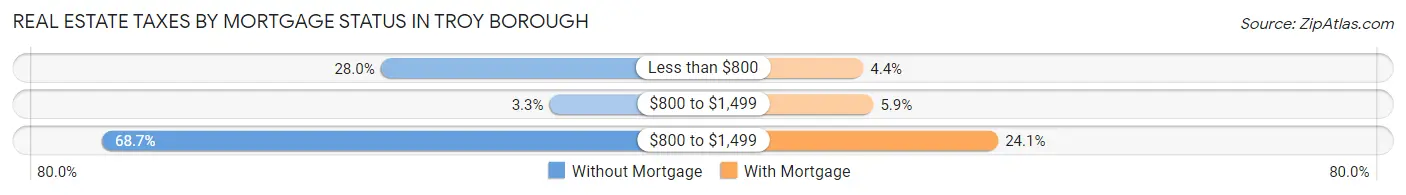
| Property Taxes | Without Mortgage | With Mortgage |
| Less than $800 | 42 (28.0%) | 9 (4.4%) |
| $800 to $1,499 | 5 (3.3%) | 12 (5.9%) |
| $800 to $1,499 | 103 (68.7%) | 49 (24.1%) |
| Total | 150 (100.0%) | 203 (100.0%) |
Health & Disability in Troy borough
Health Insurance Coverage by Age in Troy borough
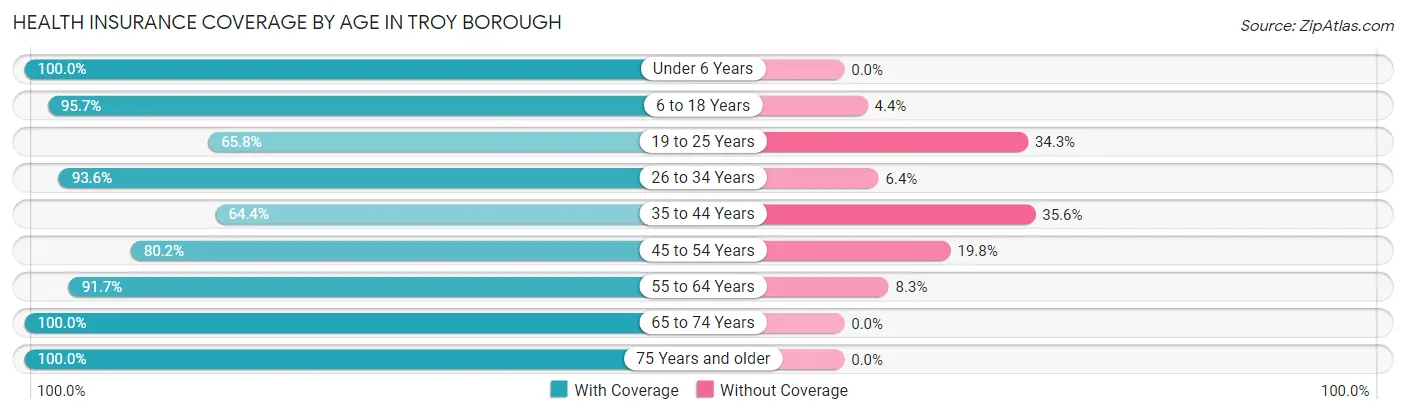
| Age Bracket | With Coverage | Without Coverage |
| Under 6 Years | 51 (100.0%) | 0 (0.0%) |
| 6 to 18 Years | 110 (95.7%) | 5 (4.3%) |
| 19 to 25 Years | 96 (65.7%) | 50 (34.3%) |
| 26 to 34 Years | 249 (93.6%) | 17 (6.4%) |
| 35 to 44 Years | 103 (64.4%) | 57 (35.6%) |
| 45 to 54 Years | 85 (80.2%) | 21 (19.8%) |
| 55 to 64 Years | 255 (91.7%) | 23 (8.3%) |
| 65 to 74 Years | 142 (100.0%) | 0 (0.0%) |
| 75 Years and older | 164 (100.0%) | 0 (0.0%) |
| Total | 1,255 (87.9%) | 173 (12.1%) |
Health Insurance Coverage by Citizenship Status in Troy borough
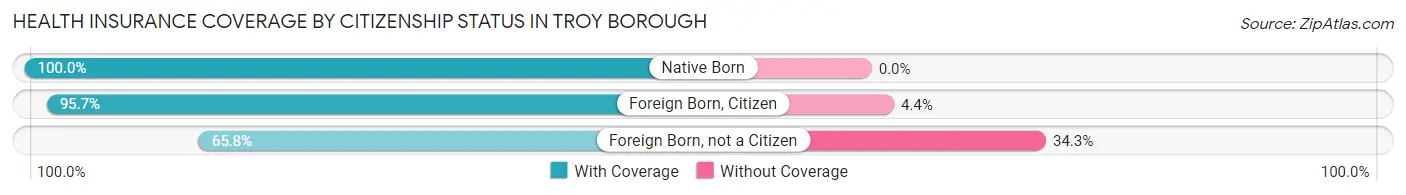
| Citizenship Status | With Coverage | Without Coverage |
| Native Born | 51 (100.0%) | 0 (0.0%) |
| Foreign Born, Citizen | 110 (95.7%) | 5 (4.3%) |
| Foreign Born, not a Citizen | 96 (65.7%) | 50 (34.3%) |
Health Insurance Coverage by Household Income in Troy borough
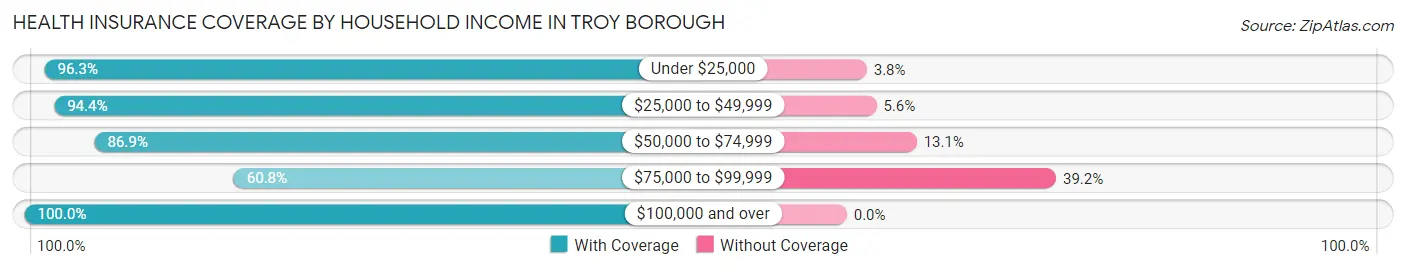
| Household Income | With Coverage | Without Coverage |
| Under $25,000 | 282 (96.3%) | 11 (3.7%) |
| $25,000 to $49,999 | 238 (94.4%) | 14 (5.6%) |
| $50,000 to $74,999 | 126 (86.9%) | 19 (13.1%) |
| $75,000 to $99,999 | 200 (60.8%) | 129 (39.2%) |
| $100,000 and over | 318 (100.0%) | 0 (0.0%) |
Public vs Private Health Insurance Coverage by Age in Troy borough
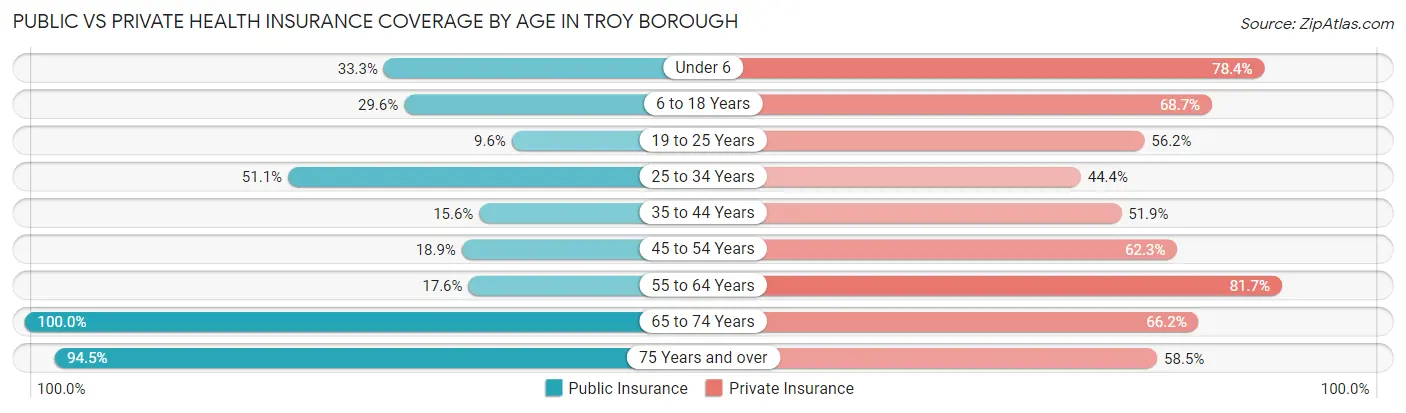
| Age Bracket | Public Insurance | Private Insurance |
| Under 6 | 17 (33.3%) | 40 (78.4%) |
| 6 to 18 Years | 34 (29.6%) | 79 (68.7%) |
| 19 to 25 Years | 14 (9.6%) | 82 (56.2%) |
| 25 to 34 Years | 136 (51.1%) | 118 (44.4%) |
| 35 to 44 Years | 25 (15.6%) | 83 (51.9%) |
| 45 to 54 Years | 20 (18.9%) | 66 (62.3%) |
| 55 to 64 Years | 49 (17.6%) | 227 (81.7%) |
| 65 to 74 Years | 142 (100.0%) | 94 (66.2%) |
| 75 Years and over | 155 (94.5%) | 96 (58.5%) |
| Total | 592 (41.5%) | 885 (62.0%) |
Disability Status by Sex by Age in Troy borough
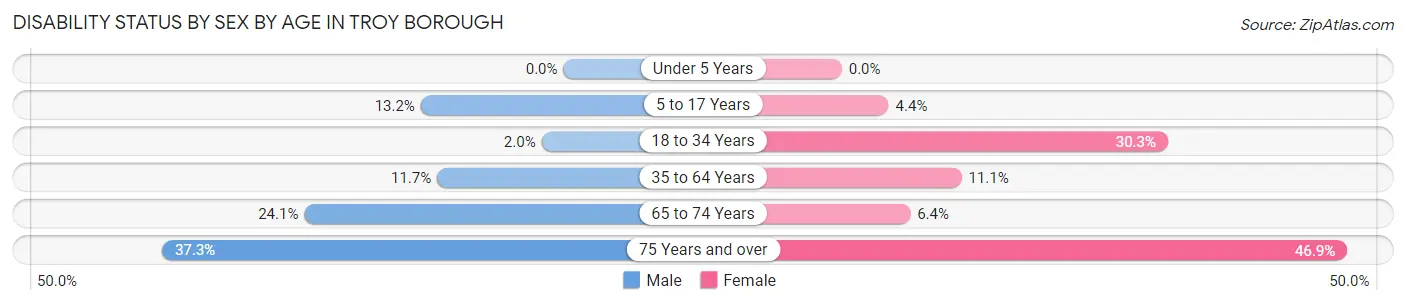
| Age Bracket | Male | Female |
| Under 5 Years | 0 (0.0%) | 0 (0.0%) |
| 5 to 17 Years | 9 (13.2%) | 2 (4.3%) |
| 18 to 34 Years | 3 (2.0%) | 85 (30.2%) |
| 35 to 64 Years | 30 (11.7%) | 32 (11.1%) |
| 65 to 74 Years | 19 (24.0%) | 4 (6.4%) |
| 75 Years and over | 19 (37.2%) | 53 (46.9%) |
Disability Class by Sex by Age in Troy borough
Disability Class: Hearing Difficulty
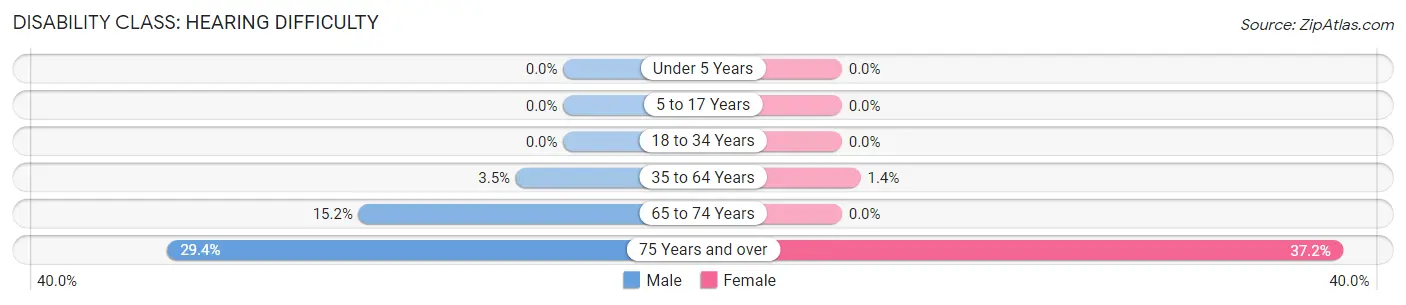
| Age Bracket | Male | Female |
| Under 5 Years | 0 (0.0%) | 0 (0.0%) |
| 5 to 17 Years | 0 (0.0%) | 0 (0.0%) |
| 18 to 34 Years | 0 (0.0%) | 0 (0.0%) |
| 35 to 64 Years | 9 (3.5%) | 4 (1.4%) |
| 65 to 74 Years | 12 (15.2%) | 0 (0.0%) |
| 75 Years and over | 15 (29.4%) | 42 (37.2%) |
Disability Class: Vision Difficulty
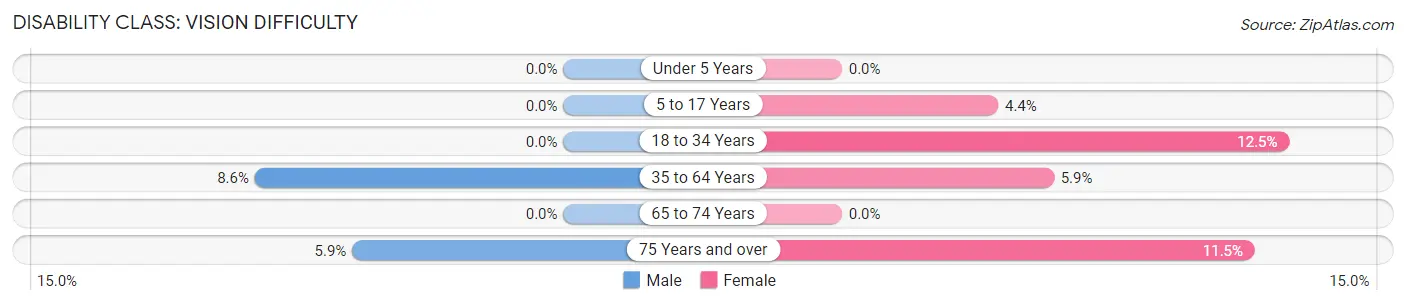
| Age Bracket | Male | Female |
| Under 5 Years | 0 (0.0%) | 0 (0.0%) |
| 5 to 17 Years | 0 (0.0%) | 2 (4.3%) |
| 18 to 34 Years | 0 (0.0%) | 35 (12.5%) |
| 35 to 64 Years | 22 (8.6%) | 17 (5.9%) |
| 65 to 74 Years | 0 (0.0%) | 0 (0.0%) |
| 75 Years and over | 3 (5.9%) | 13 (11.5%) |
Disability Class: Cognitive Difficulty
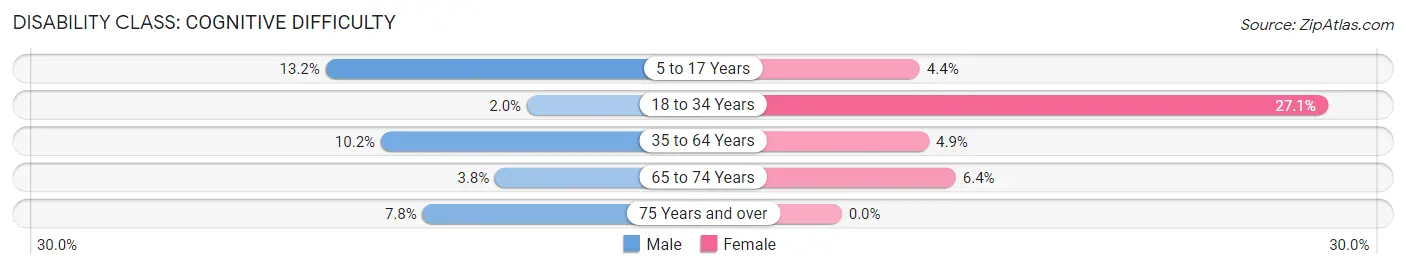
| Age Bracket | Male | Female |
| 5 to 17 Years | 9 (13.2%) | 2 (4.3%) |
| 18 to 34 Years | 3 (2.0%) | 76 (27.1%) |
| 35 to 64 Years | 26 (10.2%) | 14 (4.9%) |
| 65 to 74 Years | 3 (3.8%) | 4 (6.4%) |
| 75 Years and over | 4 (7.8%) | 0 (0.0%) |
Disability Class: Ambulatory Difficulty
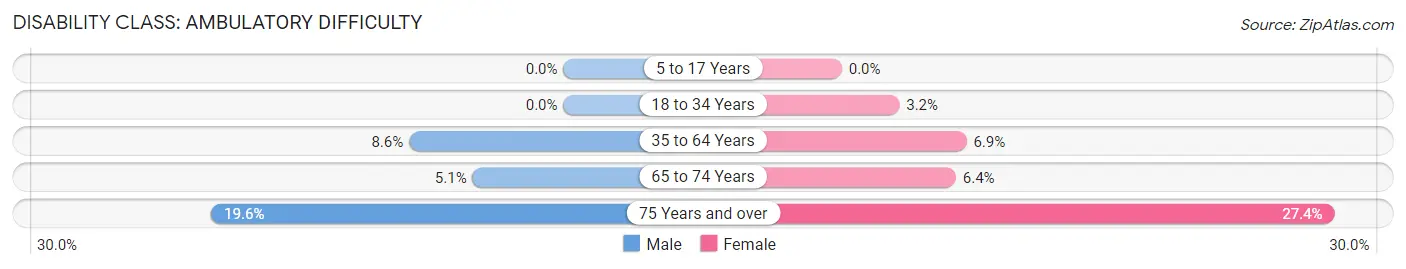
| Age Bracket | Male | Female |
| 5 to 17 Years | 0 (0.0%) | 0 (0.0%) |
| 18 to 34 Years | 0 (0.0%) | 9 (3.2%) |
| 35 to 64 Years | 22 (8.6%) | 20 (6.9%) |
| 65 to 74 Years | 4 (5.1%) | 4 (6.4%) |
| 75 Years and over | 10 (19.6%) | 31 (27.4%) |
Disability Class: Self-Care Difficulty
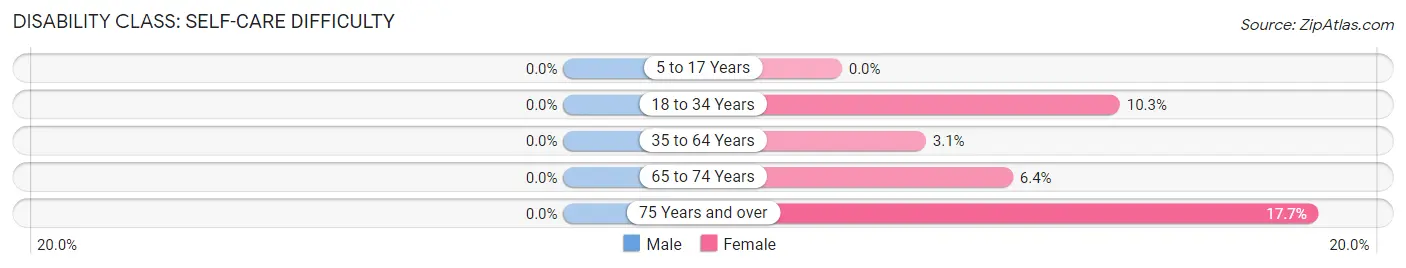
| Age Bracket | Male | Female |
| 5 to 17 Years | 0 (0.0%) | 0 (0.0%) |
| 18 to 34 Years | 0 (0.0%) | 29 (10.3%) |
| 35 to 64 Years | 0 (0.0%) | 9 (3.1%) |
| 65 to 74 Years | 0 (0.0%) | 4 (6.4%) |
| 75 Years and over | 0 (0.0%) | 20 (17.7%) |
Technology Access in Troy borough
Computing Device Access in Troy borough
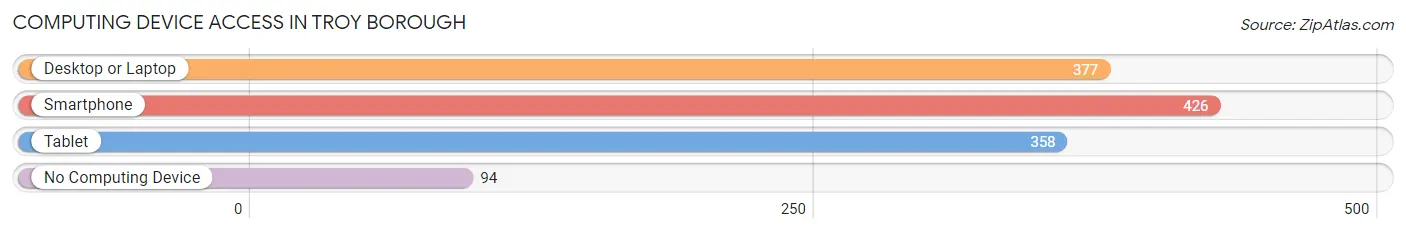
| Device Type | # Households | % Households |
| Desktop or Laptop | 377 | 65.3% |
| Smartphone | 426 | 73.8% |
| Tablet | 358 | 62.1% |
| No Computing Device | 94 | 16.3% |
| Total | 577 | 100.0% |
Internet Access in Troy borough
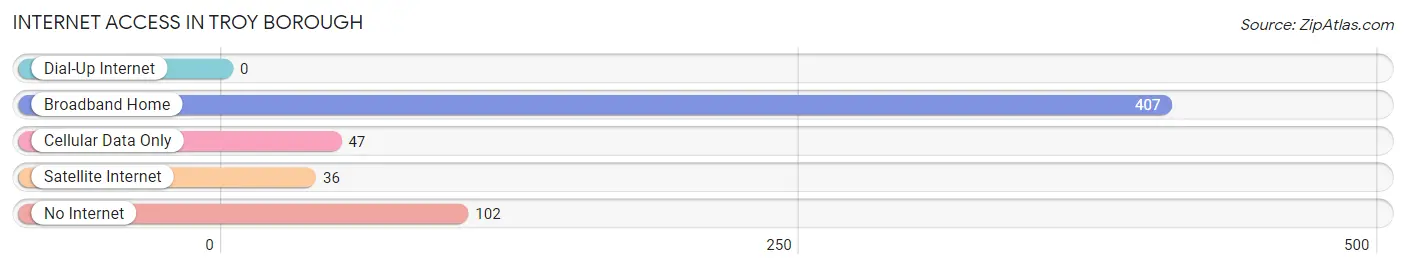
| Internet Type | # Households | % Households |
| Dial-Up Internet | 0 | 0.0% |
| Broadband Home | 407 | 70.5% |
| Cellular Data Only | 47 | 8.2% |
| Satellite Internet | 36 | 6.2% |
| No Internet | 102 | 17.7% |
| Total | 577 | 100.0% |
Troy borough Summary
Troy Borough is a small borough located in Bradford County, Pennsylvania. It is situated in the Endless Mountains region of the state, and is bordered by the Susquehanna River to the east. The population of Troy Borough was 1,845 at the 2010 census.
History
Troy Borough was founded in 1814 by a group of settlers from Connecticut. The town was named after the ancient city of Troy in Greece. The first settlers were mostly farmers, and the town quickly grew to become a center of commerce and industry. The first industry in Troy was a sawmill, which was built in 1817. This was followed by a gristmill, a tannery, and a woolen mill.
In 1825, the Troy and Towanda Railroad was built, connecting Troy to Towanda, Pennsylvania. This allowed for the transportation of goods and people, and helped to further develop the town.
In 1845, the Troy Academy was founded, and it quickly became a center of education in the area. The Troy Academy was the first school in the area to offer a high school education.
In 1871 the Troy Borough Council was formed and the town was officially incorporated
Geography
Troy Borough is located in Bradford County, Pennsylvania. It is situated in the Endless Mountains region of the state, and is bordered by the Susquehanna River to the east. The borough covers an area of 1.2 square miles, and has a population of 1,845 people, as of the 2010 census.
The terrain of Troy Borough is mostly flat, with some rolling hills. The borough is located in a valley, and is surrounded by mountains on all sides. The highest point in the borough is 1,400 feet above sea level.
Economy
The economy of Troy Borough is largely based on agriculture and tourism. The town is home to several farms, which produce a variety of crops, including corn, soybeans, and hay. The town is also home to several wineries, which produce a variety of wines.
Tourism is also an important part of the economy of Troy Borough. The town is home to several historic sites, including the Troy Academy, the Troy and Towanda Railroad, and the Troy Historical Society. The town also hosts several festivals and events throughout the year, including the Troy Fair, the Troy Music Festival, and the Troy Apple Festival.
Demographics
As of the 2010 census, the population of Troy Borough was 1,845 people. The racial makeup of the borough was 97.3% White, 0.7% African American, 0.2% Native American, 0.3% Asian, 0.2% from other races, and 1.3% from two or more races. Hispanic or Latino of any race were 1.2% of the population.
The median income for a household in Troy Borough was $41,250, and the median income for a family was $50,000. The per capita income for the borough was $20,845. About 11.2% of families and 14.2% of the population were below the poverty line, including 18.2% of those under age 18 and 8.3% of those age 65 or over.
Common Questions
What is Per Capita Income in Troy borough?
Per Capita income in Troy borough is $28,929.
What is the Median Family Income in Troy borough?
Median Family Income in Troy borough is $72,426.
What is the Median Household income in Troy borough?
Median Household Income in Troy borough is $47,992.
What is Income or Wage Gap in Troy borough?
Income or Wage Gap in Troy borough is 45.8%.
Women in Troy borough earn 54.2 cents for every dollar earned by a man.
What is Family Income Deficit in Troy borough?
Family Income Deficit in Troy borough is $15,511.
Families that are below poverty line in Troy borough earn $15,511 less on average than the poverty threshold level.
What is Inequality or Gini Index in Troy borough?
Inequality or Gini Index in Troy borough is 0.48.
What is the Total Population of Troy borough?
Total Population of Troy borough is 1,431.
What is the Total Male Population of Troy borough?
Total Male Population of Troy borough is 629.
What is the Total Female Population of Troy borough?
Total Female Population of Troy borough is 802.
What is the Ratio of Males per 100 Females in Troy borough?
There are 78.43 Males per 100 Females in Troy borough.
What is the Ratio of Females per 100 Males in Troy borough?
There are 127.50 Females per 100 Males in Troy borough.
What is the Median Population Age in Troy borough?
Median Population Age in Troy borough is 41.2 Years.
What is the Average Family Size in Troy borough
Average Family Size in Troy borough is 3.1 People.
What is the Average Household Size in Troy borough
Average Household Size in Troy borough is 2.3 People.
How Large is the Labor Force in Troy borough?
There are 647 People in the Labor Forcein in Troy borough.
What is the Percentage of People in the Labor Force in Troy borough?
49.7% of People are in the Labor Force in Troy borough.
What is the Unemployment Rate in Troy borough?
Unemployment Rate in Troy borough is 1.1%.