McEwensville borough, PA Map & Demographics
McEwensville borough Overview
$25,682
PER CAPITA INCOME
$71,786
AVG FAMILY INCOME
$66,875
AVG HOUSEHOLD INCOME
48.9%
WAGE / INCOME GAP [ % ]
51.1¢/ $1
WAGE / INCOME GAP [ $ ]
0.32
INEQUALITY / GINI INDEX
339
TOTAL POPULATION
165
MALE POPULATION
174
FEMALE POPULATION
94.83
MALES / 100 FEMALES
105.45
FEMALES / 100 MALES
40.1
MEDIAN AGE
3.0
AVG FAMILY SIZE
2.7
AVG HOUSEHOLD SIZE
164
LABOR FORCE [ PEOPLE ]
59.6%
PERCENT IN LABOR FORCE
5.5%
UNEMPLOYMENT RATE
Income in McEwensville borough
Income Overview in McEwensville borough
Per Capita Income in McEwensville borough is $25,682, while median incomes of families and households are $71,786 and $66,875 respectively.
| Characteristic | Number | Measure |
| Per Capita Income | 339 | $25,682 |
| Median Family Income | 94 | $71,786 |
| Mean Family Income | 94 | $74,822 |
| Median Household Income | 118 | $66,875 |
| Mean Household Income | 118 | $70,406 |
| Income Deficit | 94 | $0 |
| Wage / Income Gap (%) | 339 | 48.89% |
| Wage / Income Gap ($) | 339 | 51.11¢ per $1 |
| Gini / Inequality Index | 339 | 0.32 |
Earnings by Sex in McEwensville borough
Average Earnings in McEwensville borough are $40,795, $55,139 for men and $28,182 for women, a difference of 48.9%.
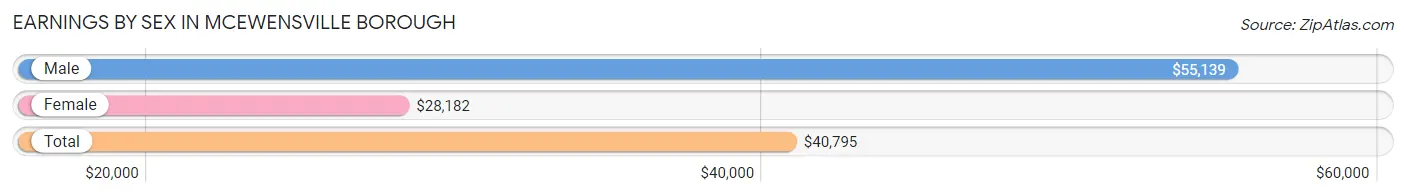
| Sex | Number | Average Earnings |
| Male | 63 (38.7%) | $55,139 |
| Female | 100 (61.4%) | $28,182 |
| Total | 163 (100.0%) | $40,795 |
Earnings by Sex by Income Bracket in McEwensville borough
The most common earnings brackets in McEwensville borough are $55,000 to $64,999 for men (19 | 30.2%) and $20,000 to $22,499 for women (15 | 15.0%).
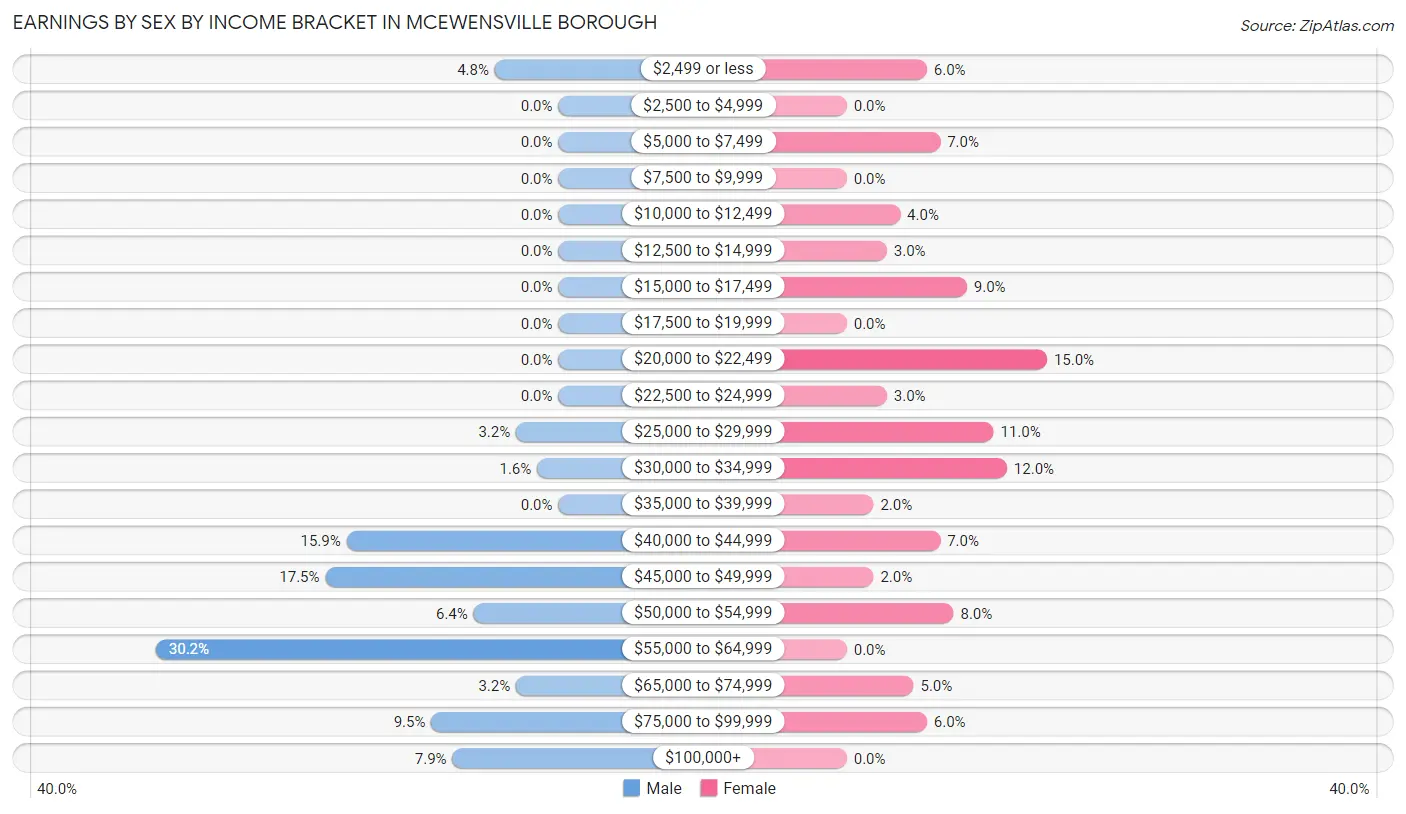
| Income | Male | Female |
| $2,499 or less | 3 (4.8%) | 6 (6.0%) |
| $2,500 to $4,999 | 0 (0.0%) | 0 (0.0%) |
| $5,000 to $7,499 | 0 (0.0%) | 7 (7.0%) |
| $7,500 to $9,999 | 0 (0.0%) | 0 (0.0%) |
| $10,000 to $12,499 | 0 (0.0%) | 4 (4.0%) |
| $12,500 to $14,999 | 0 (0.0%) | 3 (3.0%) |
| $15,000 to $17,499 | 0 (0.0%) | 9 (9.0%) |
| $17,500 to $19,999 | 0 (0.0%) | 0 (0.0%) |
| $20,000 to $22,499 | 0 (0.0%) | 15 (15.0%) |
| $22,500 to $24,999 | 0 (0.0%) | 3 (3.0%) |
| $25,000 to $29,999 | 2 (3.2%) | 11 (11.0%) |
| $30,000 to $34,999 | 1 (1.6%) | 12 (12.0%) |
| $35,000 to $39,999 | 0 (0.0%) | 2 (2.0%) |
| $40,000 to $44,999 | 10 (15.9%) | 7 (7.0%) |
| $45,000 to $49,999 | 11 (17.5%) | 2 (2.0%) |
| $50,000 to $54,999 | 4 (6.4%) | 8 (8.0%) |
| $55,000 to $64,999 | 19 (30.2%) | 0 (0.0%) |
| $65,000 to $74,999 | 2 (3.2%) | 5 (5.0%) |
| $75,000 to $99,999 | 6 (9.5%) | 6 (6.0%) |
| $100,000+ | 5 (7.9%) | 0 (0.0%) |
| Total | 63 (100.0%) | 100 (100.0%) |
Earnings by Sex by Educational Attainment in McEwensville borough
Average earnings in McEwensville borough are $55,139 for men and $28,977 for women, a difference of 47.4%. Men with an educational attainment of bachelor's degree enjoy the highest average annual earnings of $57,083, while those with college or associate's degree education earn the least with $41,875. Women with an educational attainment of college or associate's degree earn the most with the average annual earnings of $32,083, while those with high school diploma education have the smallest earnings of $29,750.
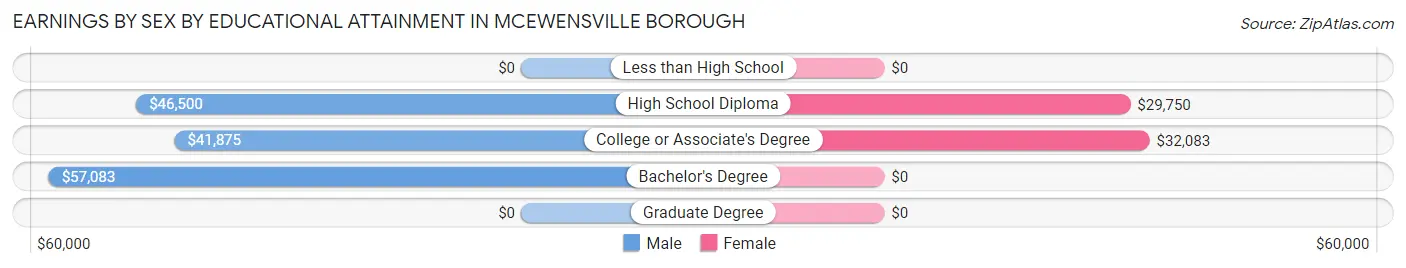
| Educational Attainment | Male Income | Female Income |
| Less than High School | - | - |
| High School Diploma | $46,500 | $29,750 |
| College or Associate's Degree | $41,875 | $32,083 |
| Bachelor's Degree | $57,083 | $0 |
| Graduate Degree | - | - |
| Total | $55,139 | $28,977 |
Family Income in McEwensville borough
Family Income Brackets in McEwensville borough
According to the McEwensville borough family income data, there are 28 families falling into the $50,000 to $74,999 income range, which is the most common income bracket and makes up 29.8% of all families.
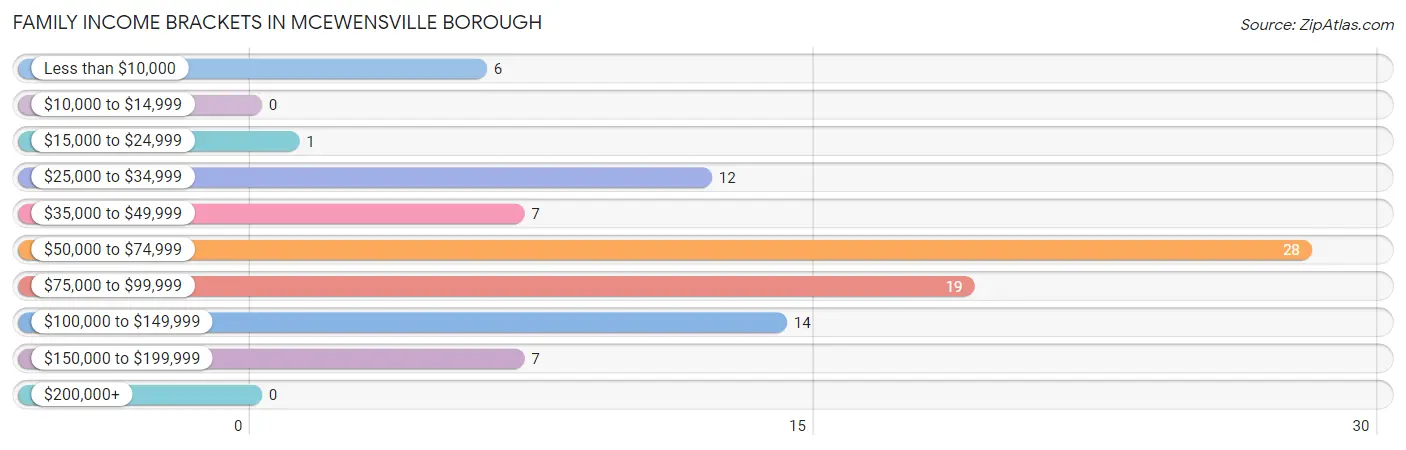
| Income Bracket | # Families | % Families |
| Less than $10,000 | 6 | 6.4% |
| $10,000 to $14,999 | 0 | 0.0% |
| $15,000 to $24,999 | 1 | 1.1% |
| $25,000 to $34,999 | 12 | 12.8% |
| $35,000 to $49,999 | 7 | 7.4% |
| $50,000 to $74,999 | 28 | 29.8% |
| $75,000 to $99,999 | 19 | 20.2% |
| $100,000 to $149,999 | 14 | 14.9% |
| $150,000 to $199,999 | 7 | 7.4% |
| $200,000+ | 0 | 0.0% |
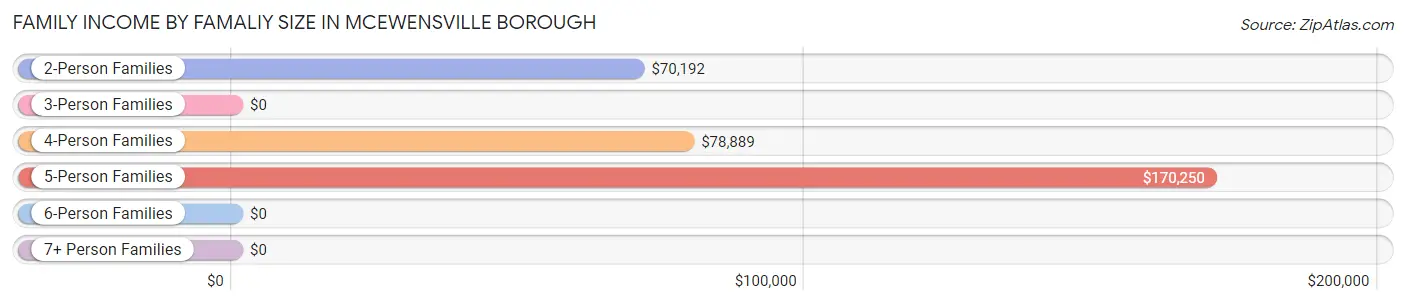
Family Income by Famaliy Size in McEwensville borough
5-person families (9 | 9.6%) account for the highest median family income in McEwensville borough with $170,250 per family, while 2-person families (50 | 53.2%) have the highest median income of $35,096 per family member.
| Income Bracket | # Families | Median Income |
| 2-Person Families | 50 (53.2%) | $70,192 |
| 3-Person Families | 17 (18.1%) | $0 |
| 4-Person Families | 18 (19.2%) | $78,889 |
| 5-Person Families | 9 (9.6%) | $170,250 |
| 6-Person Families | 0 (0.0%) | $0 |
| 7+ Person Families | 0 (0.0%) | $0 |
| Total | 94 (100.0%) | $71,786 |
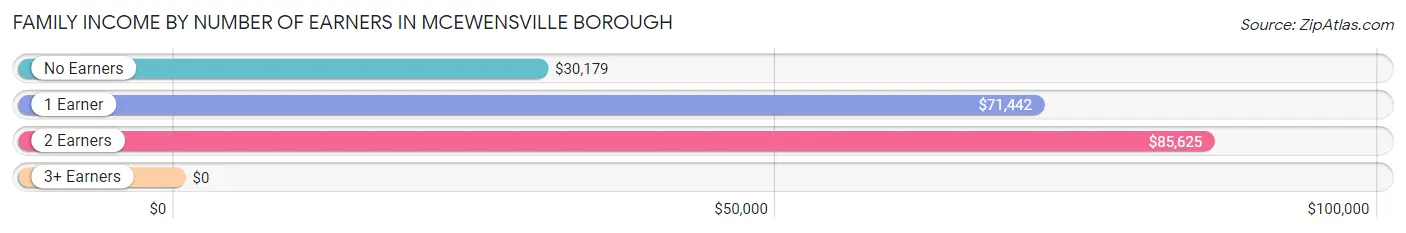
Family Income by Number of Earners in McEwensville borough
| Number of Earners | # Families | Median Income |
| No Earners | 19 (20.2%) | $30,179 |
| 1 Earner | 31 (33.0%) | $71,442 |
| 2 Earners | 37 (39.4%) | $85,625 |
| 3+ Earners | 7 (7.4%) | $0 |
| Total | 94 (100.0%) | $71,786 |
Household Income in McEwensville borough
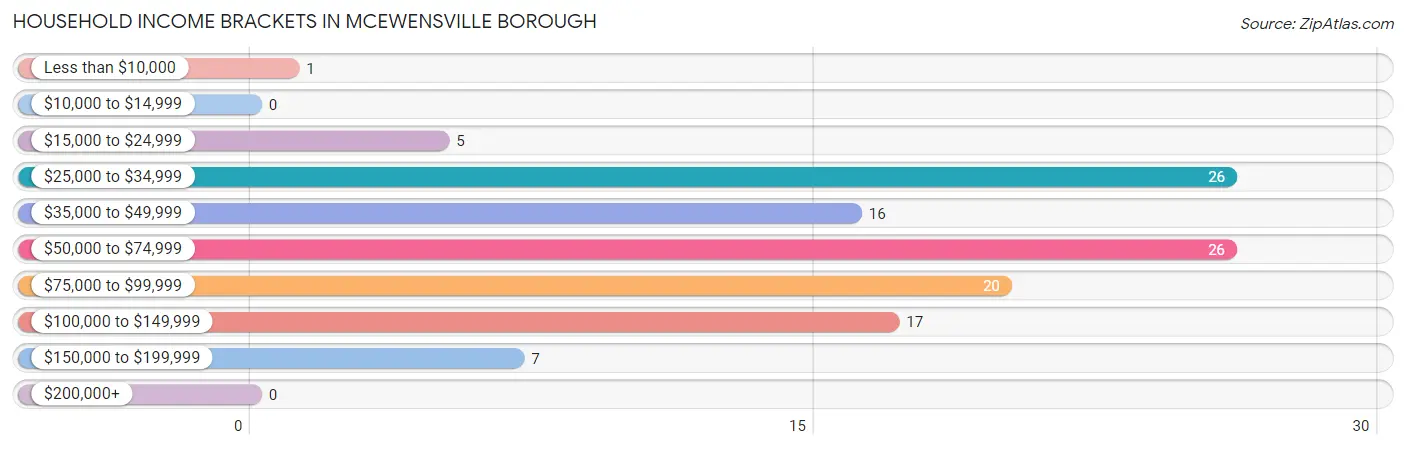
Household Income Brackets in McEwensville borough
With 26 households falling in the category, the $25,000 to $34,999 income range is the most frequent in McEwensville borough, accounting for 22.0% of all households.
| Income Bracket | # Households | % Households |
| Less than $10,000 | 1 | 0.8% |
| $10,000 to $14,999 | 0 | 0.0% |
| $15,000 to $24,999 | 5 | 4.2% |
| $25,000 to $34,999 | 26 | 22.0% |
| $35,000 to $49,999 | 16 | 13.6% |
| $50,000 to $74,999 | 26 | 22.0% |
| $75,000 to $99,999 | 20 | 16.9% |
| $100,000 to $149,999 | 17 | 14.4% |
| $150,000 to $199,999 | 7 | 5.9% |
| $200,000+ | 0 | 0.0% |
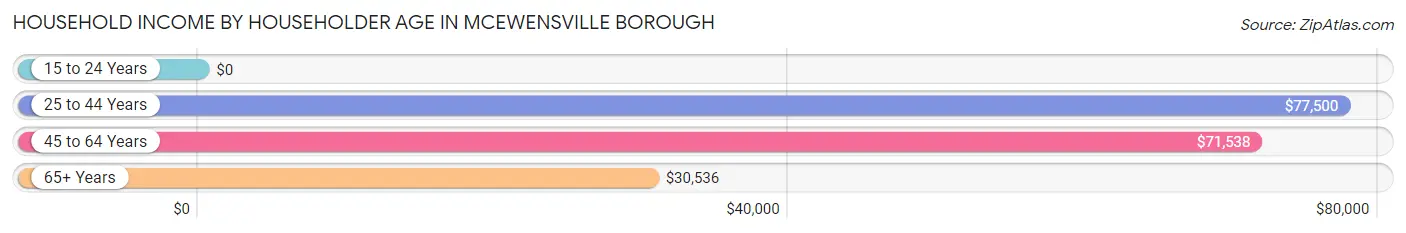
Household Income by Householder Age in McEwensville borough
The median household income in McEwensville borough is $66,875, with the highest median household income of $77,500 found in the 25 to 44 years age bracket for the primary householder. A total of 32 households (27.1%) fall into this category. Meanwhile, the 15 to 24 years age bracket for the primary householder has the lowest median household income of $0, with 5 households (4.2%) in this group.
| Income Bracket | # Households | Median Income |
| 15 to 24 Years | 5 (4.2%) | $0 |
| 25 to 44 Years | 32 (27.1%) | $77,500 |
| 45 to 64 Years | 56 (47.5%) | $71,538 |
| 65+ Years | 25 (21.2%) | $30,536 |
| Total | 118 (100.0%) | $66,875 |
Poverty in McEwensville borough
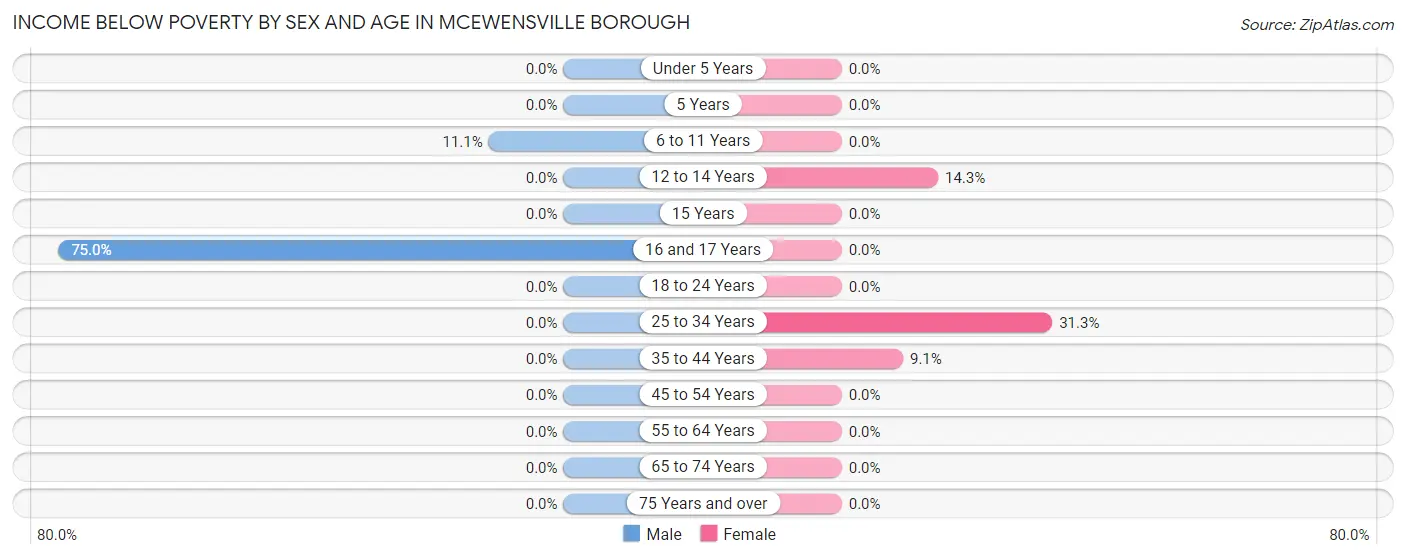
Income Below Poverty by Sex and Age in McEwensville borough
With 6.7% poverty level for males and 5.8% for females among the residents of McEwensville borough, 16 and 17 year old males and 25 to 34 year old females are the most vulnerable to poverty, with 6 males (75.0%) and 5 females (31.2%) in their respective age groups living below the poverty level.
| Age Bracket | Male | Female |
| Under 5 Years | 0 (0.0%) | 0 (0.0%) |
| 5 Years | 0 (0.0%) | 0 (0.0%) |
| 6 to 11 Years | 5 (11.1%) | 0 (0.0%) |
| 12 to 14 Years | 0 (0.0%) | 1 (14.3%) |
| 15 Years | 0 (0.0%) | 0 (0.0%) |
| 16 and 17 Years | 6 (75.0%) | 0 (0.0%) |
| 18 to 24 Years | 0 (0.0%) | 0 (0.0%) |
| 25 to 34 Years | 0 (0.0%) | 5 (31.2%) |
| 35 to 44 Years | 0 (0.0%) | 3 (9.1%) |
| 45 to 54 Years | 0 (0.0%) | 0 (0.0%) |
| 55 to 64 Years | 0 (0.0%) | 0 (0.0%) |
| 65 to 74 Years | 0 (0.0%) | 0 (0.0%) |
| 75 Years and over | 0 (0.0%) | 0 (0.0%) |
| Total | 11 (6.7%) | 9 (5.8%) |
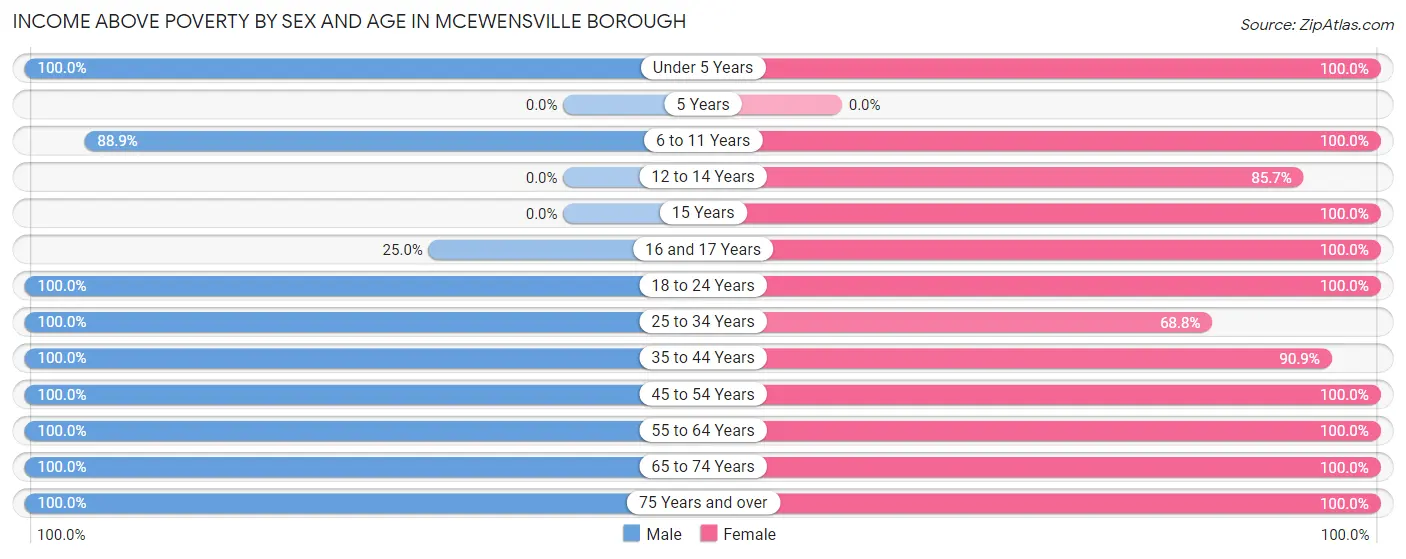
Income Above Poverty by Sex and Age in McEwensville borough
According to the poverty statistics in McEwensville borough, males aged under 5 years and females aged under 5 years are the age groups that are most secure financially, with 100.0% of males and 100.0% of females in these age groups living above the poverty line.
| Age Bracket | Male | Female |
| Under 5 Years | 2 (100.0%) | 4 (100.0%) |
| 5 Years | 0 (0.0%) | 0 (0.0%) |
| 6 to 11 Years | 40 (88.9%) | 2 (100.0%) |
| 12 to 14 Years | 0 (0.0%) | 6 (85.7%) |
| 15 Years | 0 (0.0%) | 4 (100.0%) |
| 16 and 17 Years | 2 (25.0%) | 3 (100.0%) |
| 18 to 24 Years | 12 (100.0%) | 8 (100.0%) |
| 25 to 34 Years | 12 (100.0%) | 11 (68.8%) |
| 35 to 44 Years | 26 (100.0%) | 30 (90.9%) |
| 45 to 54 Years | 15 (100.0%) | 38 (100.0%) |
| 55 to 64 Years | 21 (100.0%) | 17 (100.0%) |
| 65 to 74 Years | 10 (100.0%) | 12 (100.0%) |
| 75 Years and over | 14 (100.0%) | 10 (100.0%) |
| Total | 154 (93.3%) | 145 (94.2%) |
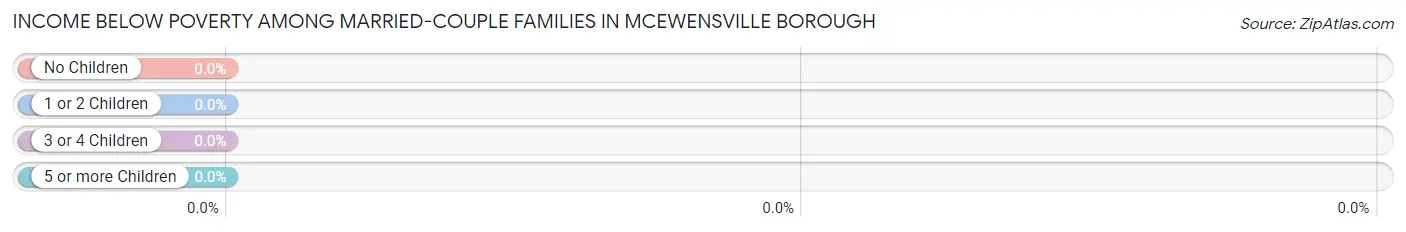
Income Below Poverty Among Married-Couple Families in McEwensville borough
| Children | Above Poverty | Below Poverty |
| No Children | 50 (100.0%) | 0 (0.0%) |
| 1 or 2 Children | 17 (100.0%) | 0 (0.0%) |
| 3 or 4 Children | 4 (100.0%) | 0 (0.0%) |
| 5 or more Children | 0 (0.0%) | 0 (0.0%) |
| Total | 71 (100.0%) | 0 (0.0%) |
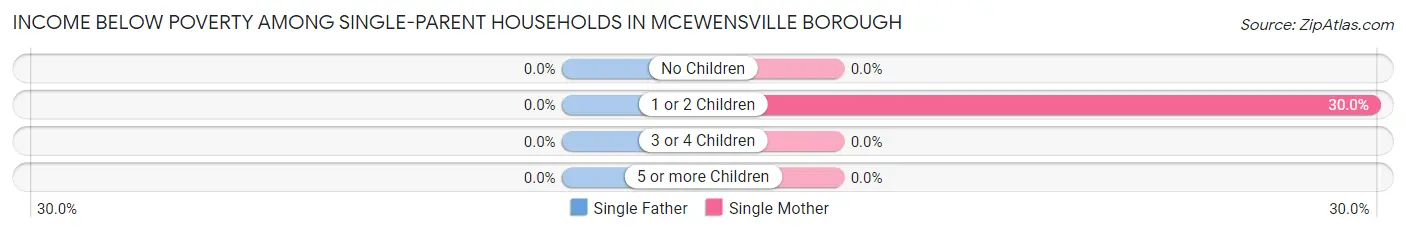
Income Below Poverty Among Single-Parent Households in McEwensville borough
| Children | Single Father | Single Mother |
| No Children | 0 (0.0%) | 0 (0.0%) |
| 1 or 2 Children | 0 (0.0%) | 6 (30.0%) |
| 3 or 4 Children | 0 (0.0%) | 0 (0.0%) |
| 5 or more Children | 0 (0.0%) | 0 (0.0%) |
| Total | 0 (0.0%) | 6 (28.6%) |
Income Below Poverty Among Married-Couple vs Single-Parent Households in McEwensville borough
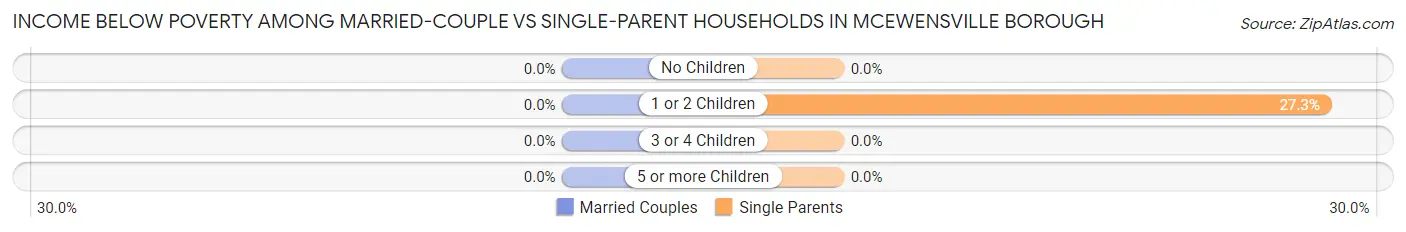
| Children | Married-Couple Families | Single-Parent Households |
| No Children | 0 (0.0%) | 0 (0.0%) |
| 1 or 2 Children | 0 (0.0%) | 6 (27.3%) |
| 3 or 4 Children | 0 (0.0%) | 0 (0.0%) |
| 5 or more Children | 0 (0.0%) | 0 (0.0%) |
| Total | 0 (0.0%) | 6 (26.1%) |
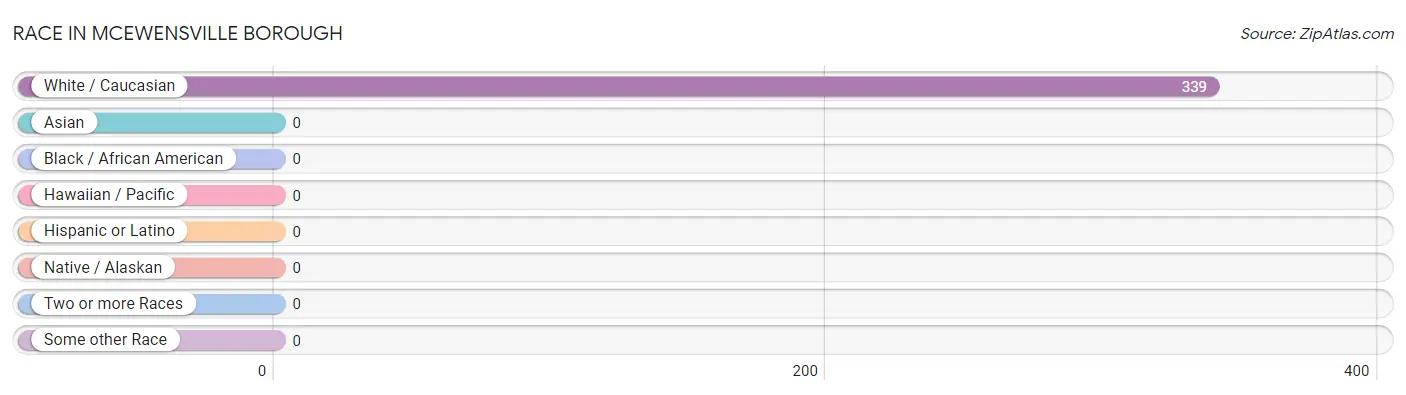
Race in McEwensville borough
The most populous races in McEwensville borough are , and White / Caucasian (339 | 100.0%).
| Race | # Population | % Population |
| Asian | 0 | 0.0% |
| Black / African American | 0 | 0.0% |
| Hawaiian / Pacific | 0 | 0.0% |
| Hispanic or Latino | 0 | 0.0% |
| Native / Alaskan | 0 | 0.0% |
| White / Caucasian | 339 | 100.0% |
| Two or more Races | 0 | 0.0% |
| Some other Race | 0 | 0.0% |
| Total | 339 | 100.0% |
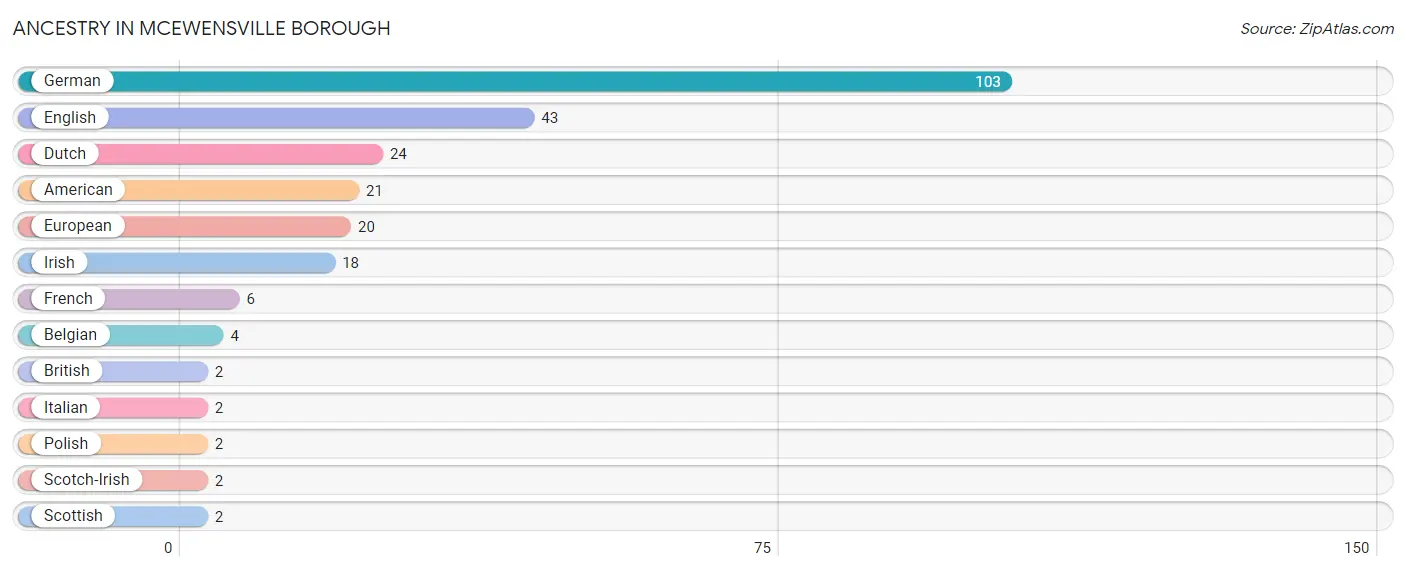
Ancestry in McEwensville borough
The most populous ancestries reported in McEwensville borough are German (103 | 30.4%), English (43 | 12.7%), Dutch (24 | 7.1%), American (21 | 6.2%), and European (20 | 5.9%), together accounting for 62.2% of all McEwensville borough residents.
| Ancestry | # Population | % Population |
| American | 21 | 6.2% |
| Belgian | 4 | 1.2% |
| British | 2 | 0.6% |
| Dutch | 24 | 7.1% |
| English | 43 | 12.7% |
| European | 20 | 5.9% |
| French | 6 | 1.8% |
| German | 103 | 30.4% |
| Irish | 18 | 5.3% |
| Italian | 2 | 0.6% |
| Polish | 2 | 0.6% |
| Scotch-Irish | 2 | 0.6% |
| Scottish | 2 | 0.6% | View All 13 Rows |
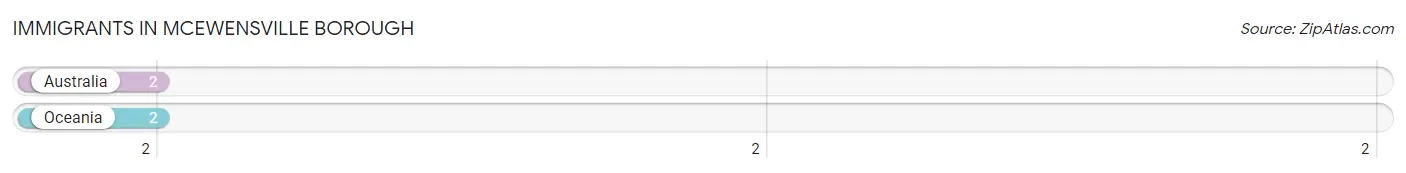
Immigrants in McEwensville borough
The most numerous immigrant groups reported in McEwensville borough came from Australia (2 | 0.6%), and Oceania (2 | 0.6%), together accounting for 1.2% of all McEwensville borough residents.
| Immigration Origin | # Population | % Population |
| Australia | 2 | 0.6% |
| Oceania | 2 | 0.6% | View All 2 Rows |
Sex and Age in McEwensville borough
Sex and Age in McEwensville borough
The most populous age groups in McEwensville borough are 5 to 9 Years (42 | 25.5%) for men and 50 to 54 Years (34 | 19.5%) for women.
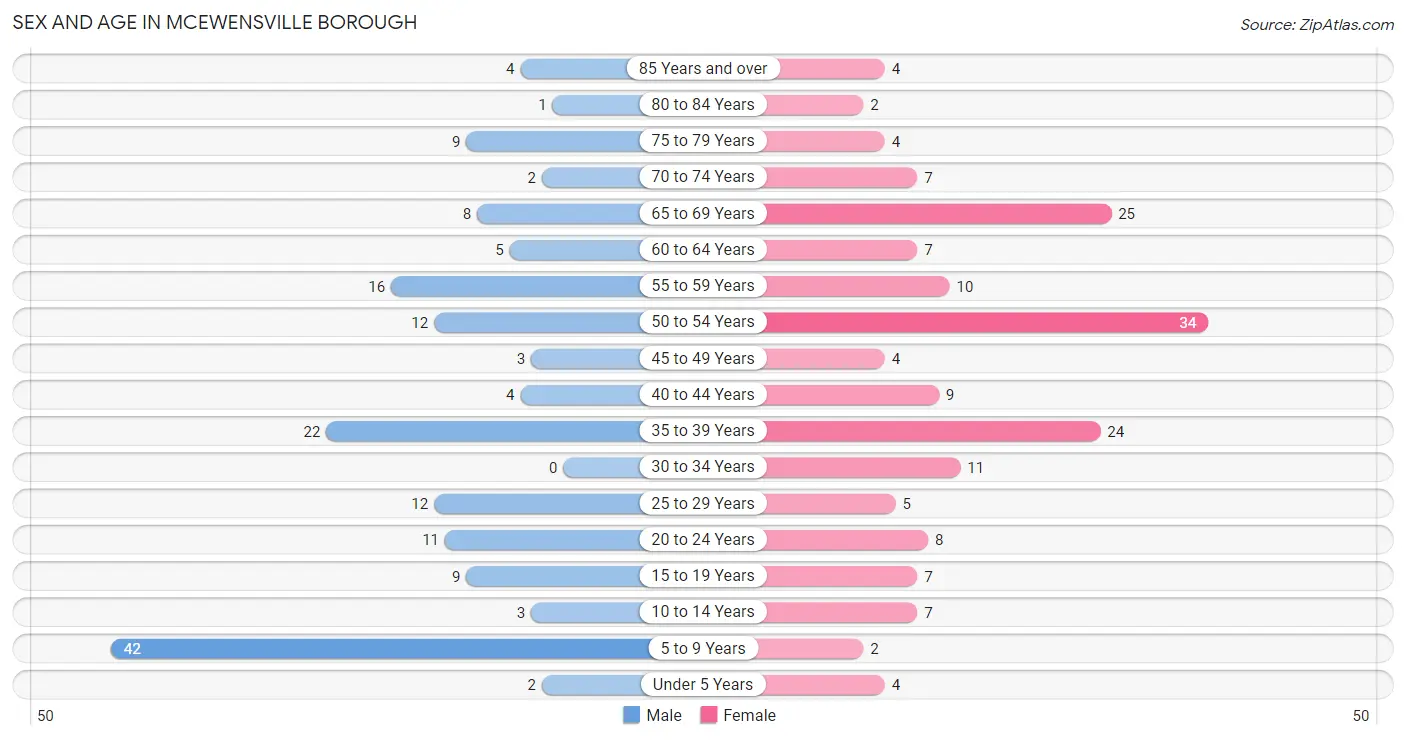
| Age Bracket | Male | Female |
| Under 5 Years | 2 (1.2%) | 4 (2.3%) |
| 5 to 9 Years | 42 (25.5%) | 2 (1.1%) |
| 10 to 14 Years | 3 (1.8%) | 7 (4.0%) |
| 15 to 19 Years | 9 (5.4%) | 7 (4.0%) |
| 20 to 24 Years | 11 (6.7%) | 8 (4.6%) |
| 25 to 29 Years | 12 (7.3%) | 5 (2.9%) |
| 30 to 34 Years | 0 (0.0%) | 11 (6.3%) |
| 35 to 39 Years | 22 (13.3%) | 24 (13.8%) |
| 40 to 44 Years | 4 (2.4%) | 9 (5.2%) |
| 45 to 49 Years | 3 (1.8%) | 4 (2.3%) |
| 50 to 54 Years | 12 (7.3%) | 34 (19.5%) |
| 55 to 59 Years | 16 (9.7%) | 10 (5.8%) |
| 60 to 64 Years | 5 (3.0%) | 7 (4.0%) |
| 65 to 69 Years | 8 (4.9%) | 25 (14.4%) |
| 70 to 74 Years | 2 (1.2%) | 7 (4.0%) |
| 75 to 79 Years | 9 (5.4%) | 4 (2.3%) |
| 80 to 84 Years | 1 (0.6%) | 2 (1.1%) |
| 85 Years and over | 4 (2.4%) | 4 (2.3%) |
| Total | 165 (100.0%) | 174 (100.0%) |
Families and Households in McEwensville borough
Median Family Size in McEwensville borough
The median family size in McEwensville borough is 3.01 persons per family, with single female/mother families (21 | 22.3%) accounting for the largest median family size of 3.1 persons per family. On the other hand, single male/father families (2 | 2.1%) represent the smallest median family size with 2.00 persons per family.
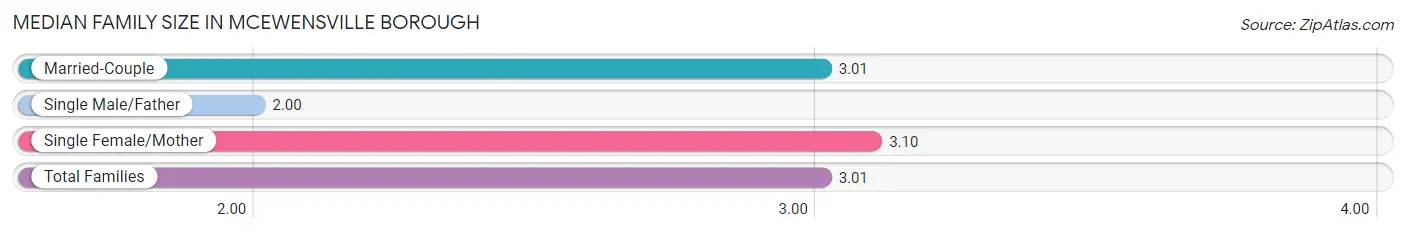
| Family Type | # Families | Family Size |
| Married-Couple | 71 (75.5%) | 3.01 |
| Single Male/Father | 2 (2.1%) | 2.00 |
| Single Female/Mother | 21 (22.3%) | 3.10 |
| Total Families | 94 (100.0%) | 3.01 |
Median Household Size in McEwensville borough
The median household size in McEwensville borough is 2.70 persons per household, with single female/mother households (21 | 17.8%) accounting for the largest median household size of 3.48 persons per household. non-family households (24 | 20.3%) represent the smallest median household size with 1.08 persons per household.
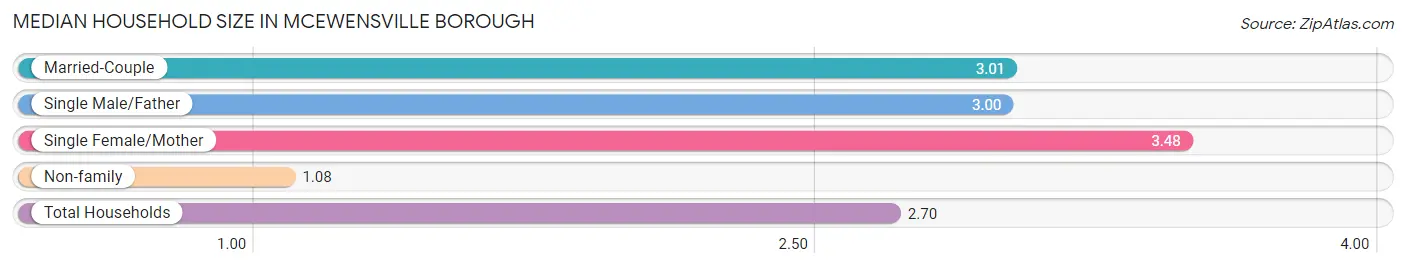
| Household Type | # Households | Household Size |
| Married-Couple | 71 (60.2%) | 3.01 |
| Single Male/Father | 2 (1.7%) | 3.00 |
| Single Female/Mother | 21 (17.8%) | 3.48 |
| Non-family | 24 (20.3%) | 1.08 |
| Total Households | 118 (100.0%) | 2.70 |
Household Size by Marriage Status in McEwensville borough
Out of a total of 118 households in McEwensville borough, 94 (79.7%) are family households, while 24 (20.3%) are nonfamily households. The most numerous type of family households are 2-person households, comprising 45, and the most common type of nonfamily households are 1-person households, comprising 23.
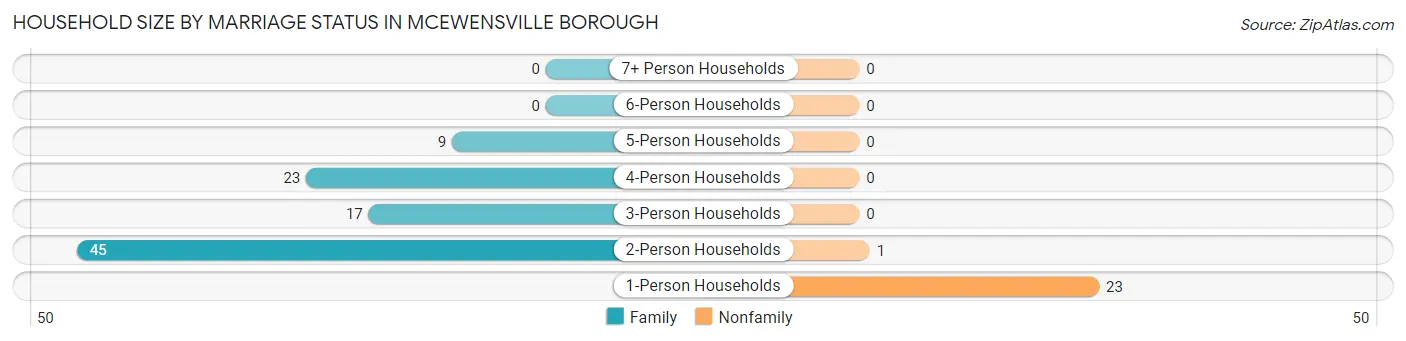
| Household Size | Family Households | Nonfamily Households |
| 1-Person Households | - | 23 (19.5%) |
| 2-Person Households | 45 (38.1%) | 1 (0.9%) |
| 3-Person Households | 17 (14.4%) | 0 (0.0%) |
| 4-Person Households | 23 (19.5%) | 0 (0.0%) |
| 5-Person Households | 9 (7.6%) | 0 (0.0%) |
| 6-Person Households | 0 (0.0%) | 0 (0.0%) |
| 7+ Person Households | 0 (0.0%) | 0 (0.0%) |
| Total | 94 (79.7%) | 24 (20.3%) |
Female Fertility in McEwensville borough
Fertility by Age in McEwensville borough
| Age Bracket | Women with Births | Births / 1,000 Women |
| 15 to 19 years | 0 (0.0%) | 0.0 |
| 20 to 34 years | 0 (0.0%) | 0.0 |
| 35 to 50 years | 0 (0.0%) | 0.0 |
| Total | 0 (0.0%) | 0.0 |
Fertility by Age by Marriage Status in McEwensville borough
| Age Bracket | Married | Unmarried |
| 15 to 19 years | 0 (0.0%) | 0 (0.0%) |
| 20 to 34 years | 0 (0.0%) | 0 (0.0%) |
| 35 to 50 years | 0 (0.0%) | 0 (0.0%) |
| Total | 0 (0.0%) | 0 (0.0%) |
Fertility by Education in McEwensville borough
| Educational Attainment | Women with Births | Births / 1,000 Women |
| Less than High School | 0 (0.0%) | 0.0 |
| High School Diploma | 0 (0.0%) | 0.0 |
| College or Associate's Degree | 0 (0.0%) | 0.0 |
| Bachelor's Degree | 0 (0.0%) | 0.0 |
| Graduate Degree | 0 (0.0%) | 0.0 |
| Total | 0 (0.0%) | 0.0 |
Fertility by Education by Marriage Status in McEwensville borough
| Educational Attainment | Married | Unmarried |
| Less than High School | 0 (0.0%) | 0 (0.0%) |
| High School Diploma | 0 (0.0%) | 0 (0.0%) |
| College or Associate's Degree | 0 (0.0%) | 0 (0.0%) |
| Bachelor's Degree | 0 (0.0%) | 0 (0.0%) |
| Graduate Degree | 0 (0.0%) | 0 (0.0%) |
| Total | 0 (0.0%) | 0 (0.0%) |
Employment Characteristics in McEwensville borough
Employment by Class of Employer in McEwensville borough
Among the 154 employed individuals in McEwensville borough, private company employees (92 | 59.7%), self-employed (not incorporated) (20 | 13.0%), and local government employees (16 | 10.4%) make up the most common classes of employment.
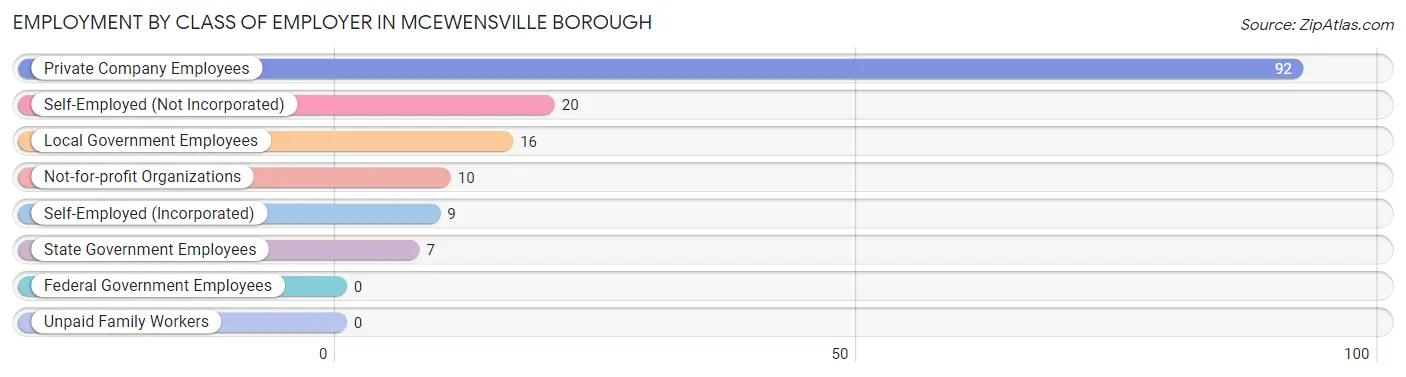
| Employer Class | # Employees | % Employees |
| Private Company Employees | 92 | 59.7% |
| Self-Employed (Incorporated) | 9 | 5.8% |
| Self-Employed (Not Incorporated) | 20 | 13.0% |
| Not-for-profit Organizations | 10 | 6.5% |
| Local Government Employees | 16 | 10.4% |
| State Government Employees | 7 | 4.5% |
| Federal Government Employees | 0 | 0.0% |
| Unpaid Family Workers | 0 | 0.0% |
| Total | 154 | 100.0% |
Employment Status by Age in McEwensville borough
According to the labor force statistics for McEwensville borough, out of the total population over 16 years of age (275), 59.6% or 164 individuals are in the labor force, with 5.5% or 9 of them unemployed. The age group with the highest labor force participation rate is 20 to 24 years, with 100.0% or 19 individuals in the labor force. Within the labor force, the 16 to 19 years age range has the highest percentage of unemployed individuals, with 75.0% or 3 of them being unemployed.
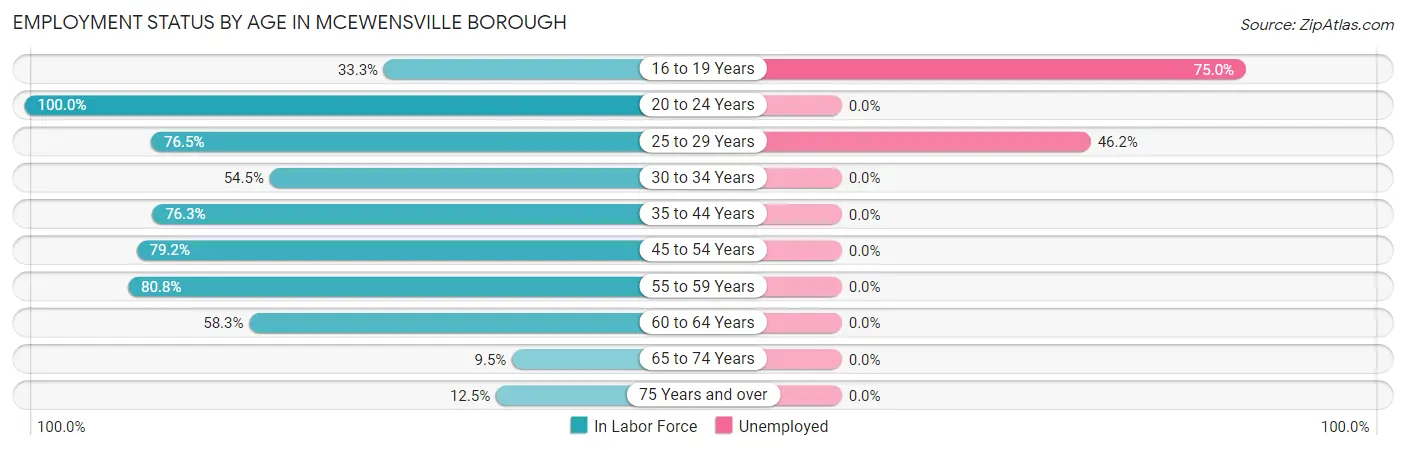
| Age Bracket | In Labor Force | Unemployed |
| 16 to 19 Years | 4 (33.3%) | 3 (75.0%) |
| 20 to 24 Years | 19 (100.0%) | 0 (0.0%) |
| 25 to 29 Years | 13 (76.5%) | 6 (46.2%) |
| 30 to 34 Years | 6 (54.5%) | 0 (0.0%) |
| 35 to 44 Years | 45 (76.3%) | 0 (0.0%) |
| 45 to 54 Years | 42 (79.2%) | 0 (0.0%) |
| 55 to 59 Years | 21 (80.8%) | 0 (0.0%) |
| 60 to 64 Years | 7 (58.3%) | 0 (0.0%) |
| 65 to 74 Years | 4 (9.5%) | 0 (0.0%) |
| 75 Years and over | 3 (12.5%) | 0 (0.0%) |
| Total | 164 (59.6%) | 9 (5.5%) |
Employment Status by Educational Attainment in McEwensville borough
According to labor force statistics for McEwensville borough, 75.3% of individuals (134) out of the total population between 25 and 64 years of age (178) are in the labor force, with 4.5% or 6 of them being unemployed. The group with the highest labor force participation rate are those with the educational attainment of bachelor's degree or higher, with 91.2% or 52 individuals in the labor force. Within the labor force, individuals with bachelor's degree or higher education have the highest percentage of unemployment, with 11.5% or 6 of them being unemployed.
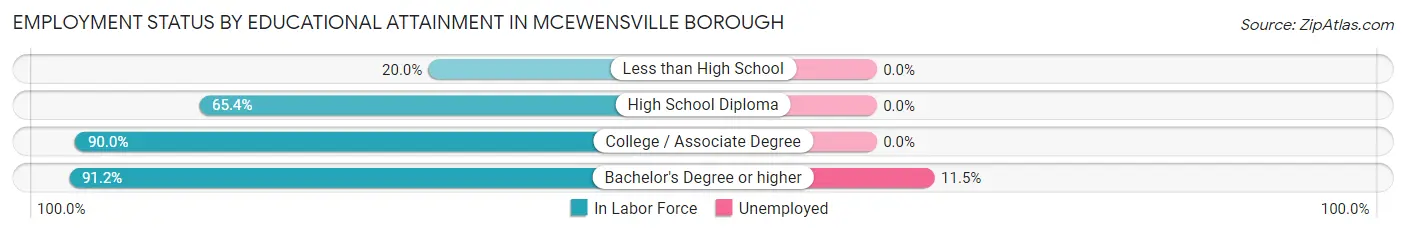
| Educational Attainment | In Labor Force | Unemployed |
| Less than High School | 2 (20.0%) | 0 (0.0%) |
| High School Diploma | 53 (65.4%) | 0 (0.0%) |
| College / Associate Degree | 27 (90.0%) | 0 (0.0%) |
| Bachelor's Degree or higher | 52 (91.2%) | 7 (11.5%) |
| Total | 134 (75.3%) | 8 (4.5%) |
Employment Occupations by Sex in McEwensville borough
Management, Business, Science and Arts Occupations
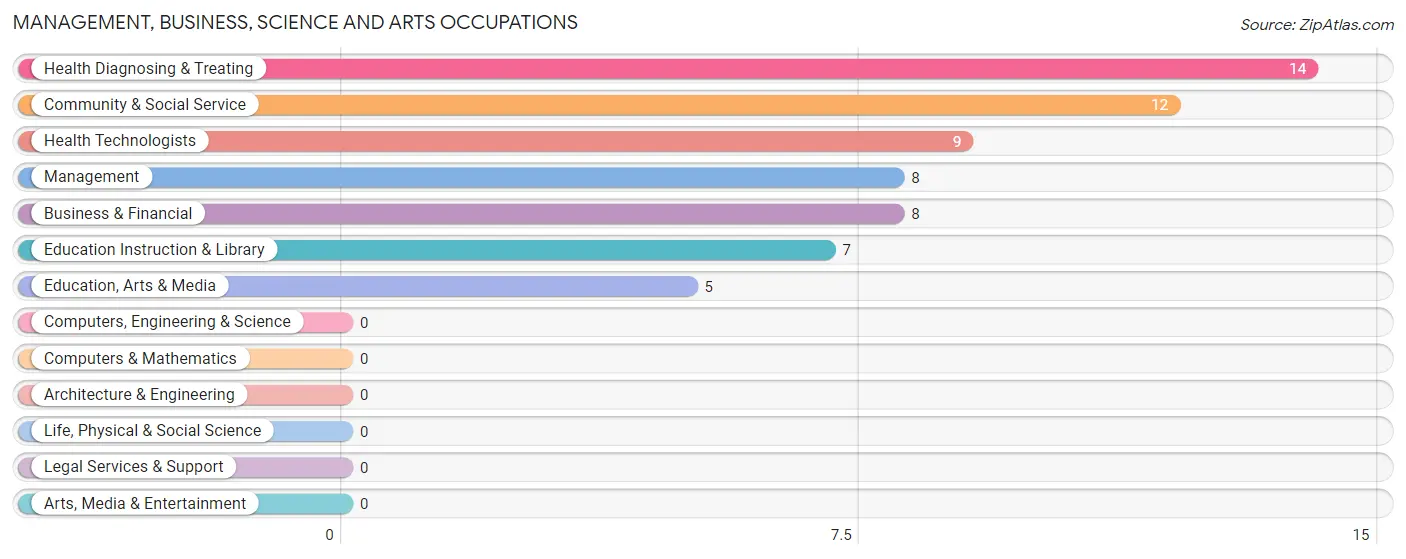
The most common Management, Business, Science and Arts occupations in McEwensville borough are Health Diagnosing & Treating (14 | 9.0%), Community & Social Service (12 | 7.7%), Health Technologists (9 | 5.8%), Management (8 | 5.2%), and Business & Financial (8 | 5.2%).
Management, Business, Science and Arts Occupations by Sex
Within the Management, Business, Science and Arts occupations in McEwensville borough, the most male-oriented occupations are Education, Arts & Media (60.0%), Business & Financial (25.0%), and Community & Social Service (25.0%), while the most female-oriented occupations are Management (100.0%), Education Instruction & Library (100.0%), and Health Diagnosing & Treating (100.0%).
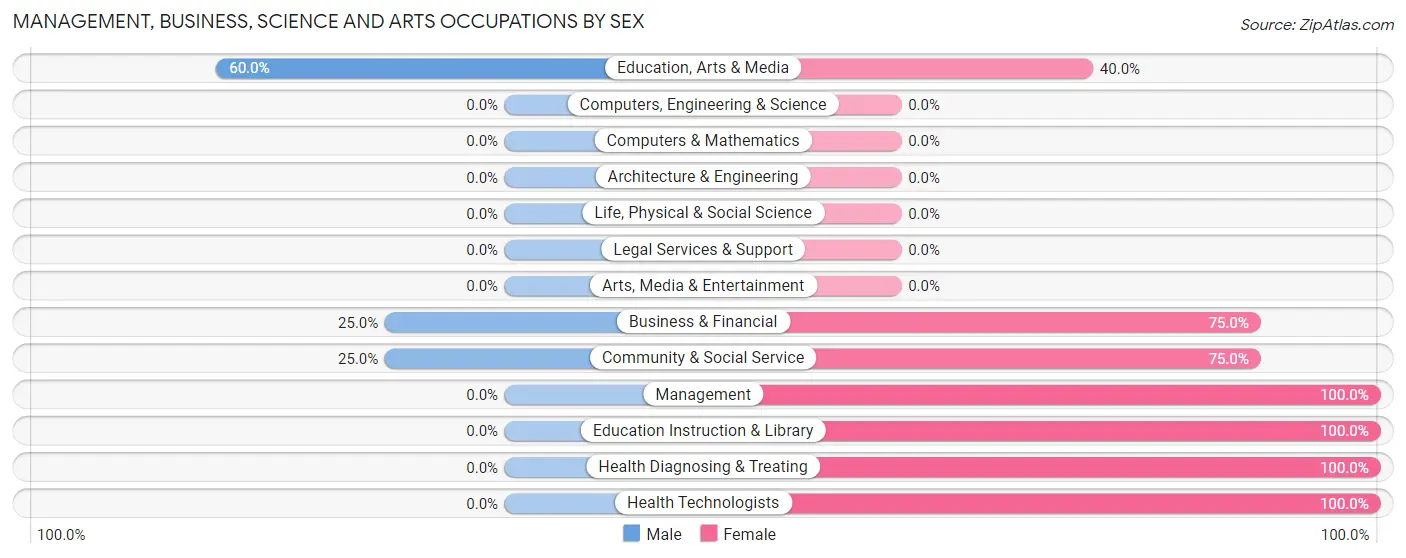
| Occupation | Male | Female |
| Management | 0 (0.0%) | 8 (100.0%) |
| Business & Financial | 2 (25.0%) | 6 (75.0%) |
| Computers, Engineering & Science | 0 (0.0%) | 0 (0.0%) |
| Computers & Mathematics | 0 (0.0%) | 0 (0.0%) |
| Architecture & Engineering | 0 (0.0%) | 0 (0.0%) |
| Life, Physical & Social Science | 0 (0.0%) | 0 (0.0%) |
| Community & Social Service | 3 (25.0%) | 9 (75.0%) |
| Education, Arts & Media | 3 (60.0%) | 2 (40.0%) |
| Legal Services & Support | 0 (0.0%) | 0 (0.0%) |
| Education Instruction & Library | 0 (0.0%) | 7 (100.0%) |
| Arts, Media & Entertainment | 0 (0.0%) | 0 (0.0%) |
| Health Diagnosing & Treating | 0 (0.0%) | 14 (100.0%) |
| Health Technologists | 0 (0.0%) | 9 (100.0%) |
| Total (Category) | 5 (11.9%) | 37 (88.1%) |
| Total (Overall) | 61 (39.4%) | 94 (60.7%) |
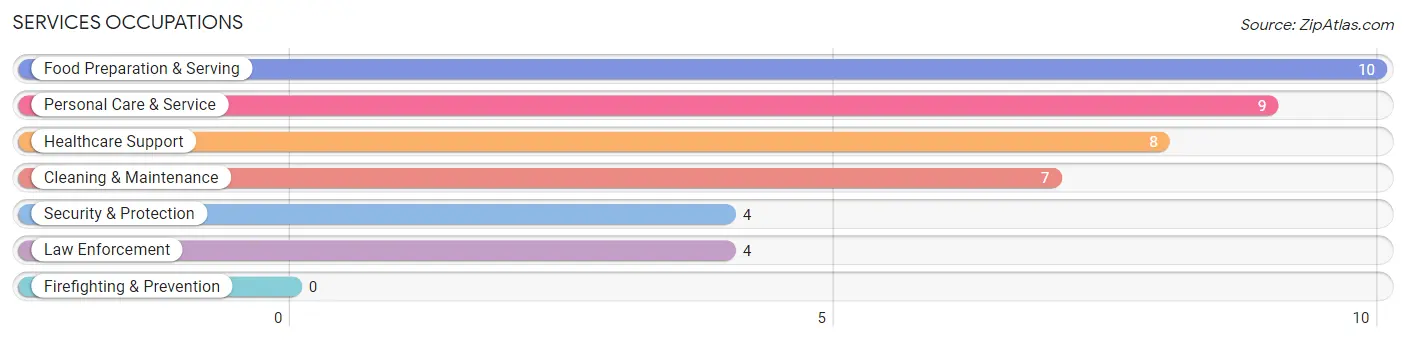
Services Occupations
The most common Services occupations in McEwensville borough are Food Preparation & Serving (10 | 6.5%), Personal Care & Service (9 | 5.8%), Healthcare Support (8 | 5.2%), Cleaning & Maintenance (7 | 4.5%), and Security & Protection (4 | 2.6%).
Services Occupations by Sex
Within the Services occupations in McEwensville borough, the most male-oriented occupations are Security & Protection (100.0%), Law Enforcement (100.0%), and Personal Care & Service (100.0%), while the most female-oriented occupations are Healthcare Support (100.0%), Cleaning & Maintenance (71.4%), and Food Preparation & Serving (50.0%).
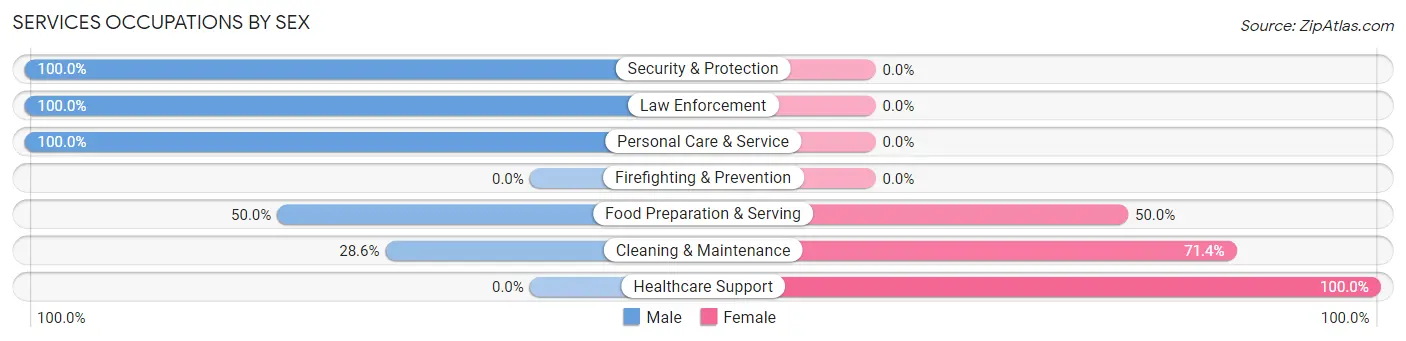
| Occupation | Male | Female |
| Healthcare Support | 0 (0.0%) | 8 (100.0%) |
| Security & Protection | 4 (100.0%) | 0 (0.0%) |
| Firefighting & Prevention | 0 (0.0%) | 0 (0.0%) |
| Law Enforcement | 4 (100.0%) | 0 (0.0%) |
| Food Preparation & Serving | 5 (50.0%) | 5 (50.0%) |
| Cleaning & Maintenance | 2 (28.6%) | 5 (71.4%) |
| Personal Care & Service | 9 (100.0%) | 0 (0.0%) |
| Total (Category) | 20 (52.6%) | 18 (47.4%) |
| Total (Overall) | 61 (39.4%) | 94 (60.7%) |
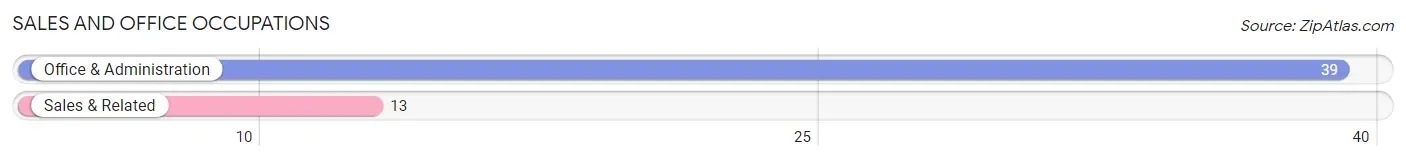
Sales and Office Occupations
The most common Sales and Office occupations in McEwensville borough are Office & Administration (39 | 25.2%), and Sales & Related (13 | 8.4%).
Sales and Office Occupations by Sex
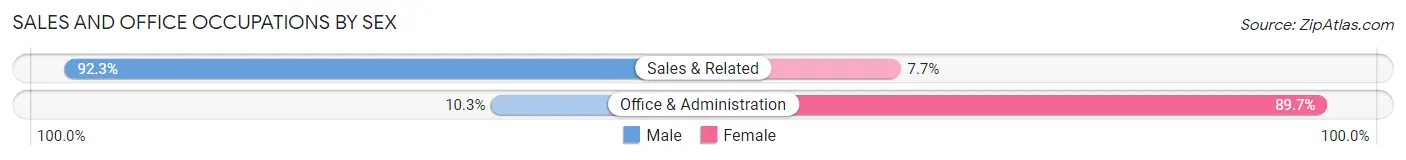
| Occupation | Male | Female |
| Sales & Related | 12 (92.3%) | 1 (7.7%) |
| Office & Administration | 4 (10.3%) | 35 (89.7%) |
| Total (Category) | 16 (30.8%) | 36 (69.2%) |
| Total (Overall) | 61 (39.4%) | 94 (60.7%) |
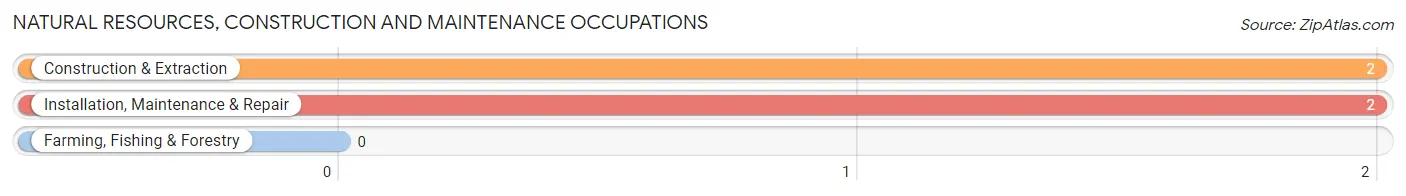
Natural Resources, Construction and Maintenance Occupations
The most common Natural Resources, Construction and Maintenance occupations in McEwensville borough are Construction & Extraction (2 | 1.3%), and Installation, Maintenance & Repair (2 | 1.3%).
Natural Resources, Construction and Maintenance Occupations by Sex
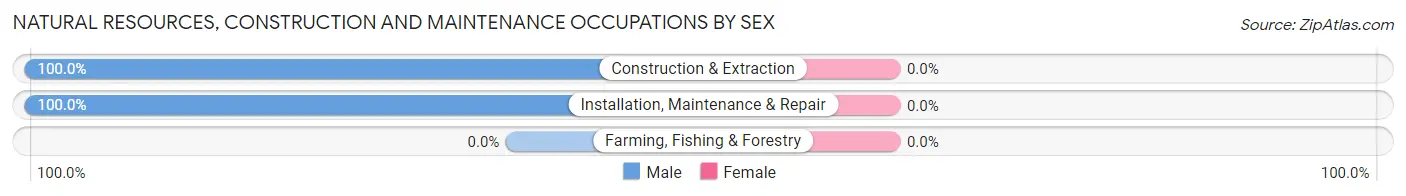
| Occupation | Male | Female |
| Farming, Fishing & Forestry | 0 (0.0%) | 0 (0.0%) |
| Construction & Extraction | 2 (100.0%) | 0 (0.0%) |
| Installation, Maintenance & Repair | 2 (100.0%) | 0 (0.0%) |
| Total (Category) | 4 (100.0%) | 0 (0.0%) |
| Total (Overall) | 61 (39.4%) | 94 (60.7%) |
Production, Transportation and Moving Occupations
The most common Production, Transportation and Moving occupations in McEwensville borough are Material Moving (10 | 6.5%), Transportation (7 | 4.5%), and Production (2 | 1.3%).
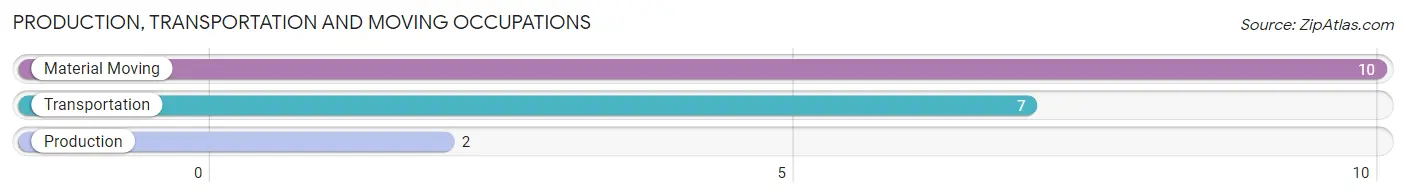
Production, Transportation and Moving Occupations by Sex
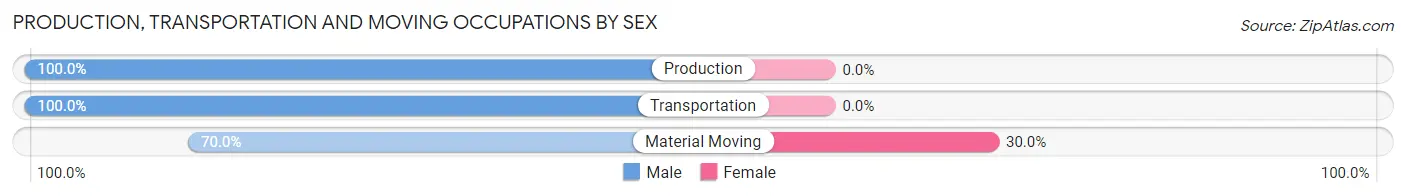
| Occupation | Male | Female |
| Production | 2 (100.0%) | 0 (0.0%) |
| Transportation | 7 (100.0%) | 0 (0.0%) |
| Material Moving | 7 (70.0%) | 3 (30.0%) |
| Total (Category) | 16 (84.2%) | 3 (15.8%) |
| Total (Overall) | 61 (39.4%) | 94 (60.7%) |
Employment Industries by Sex in McEwensville borough
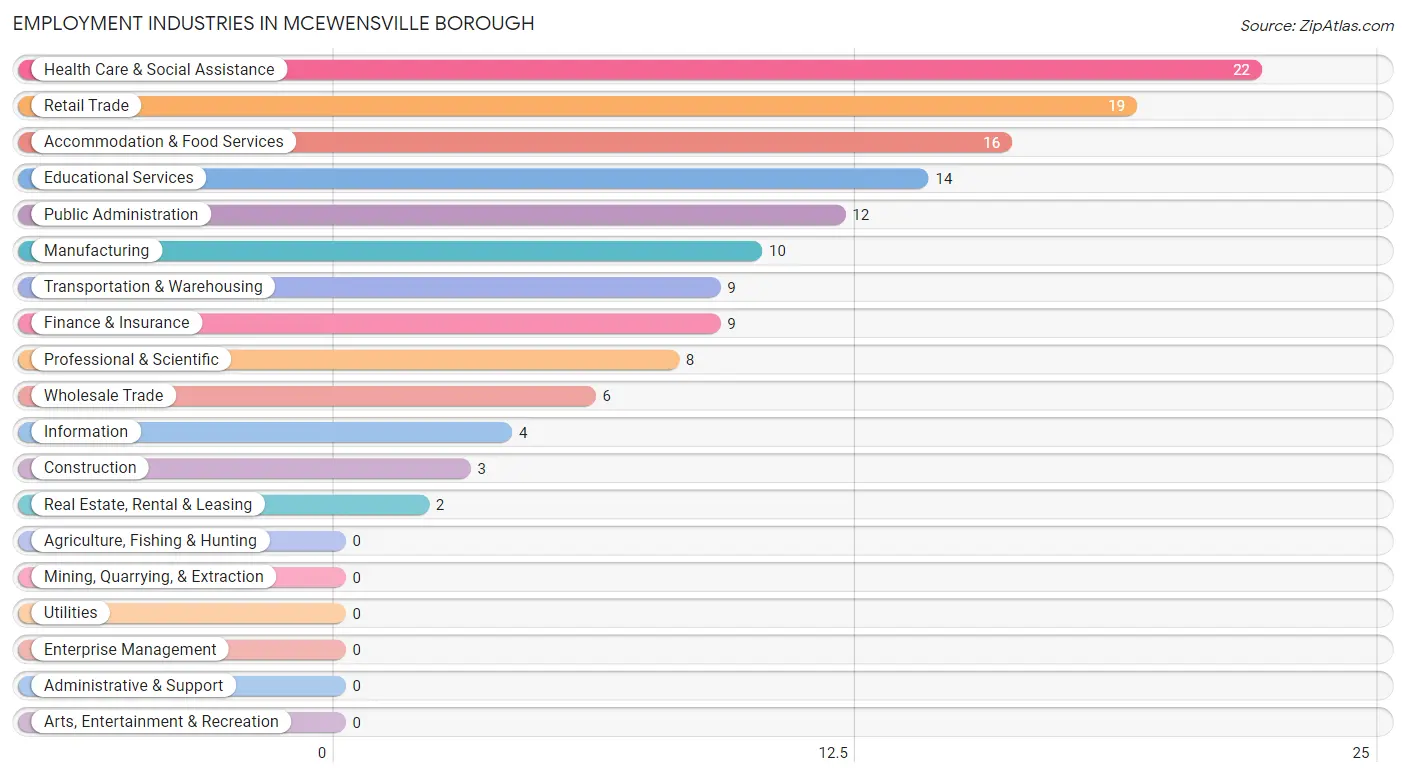
Employment Industries in McEwensville borough
The major employment industries in McEwensville borough include Health Care & Social Assistance (22 | 14.2%), Retail Trade (19 | 12.3%), Accommodation & Food Services (16 | 10.3%), Educational Services (14 | 9.0%), and Public Administration (12 | 7.7%).
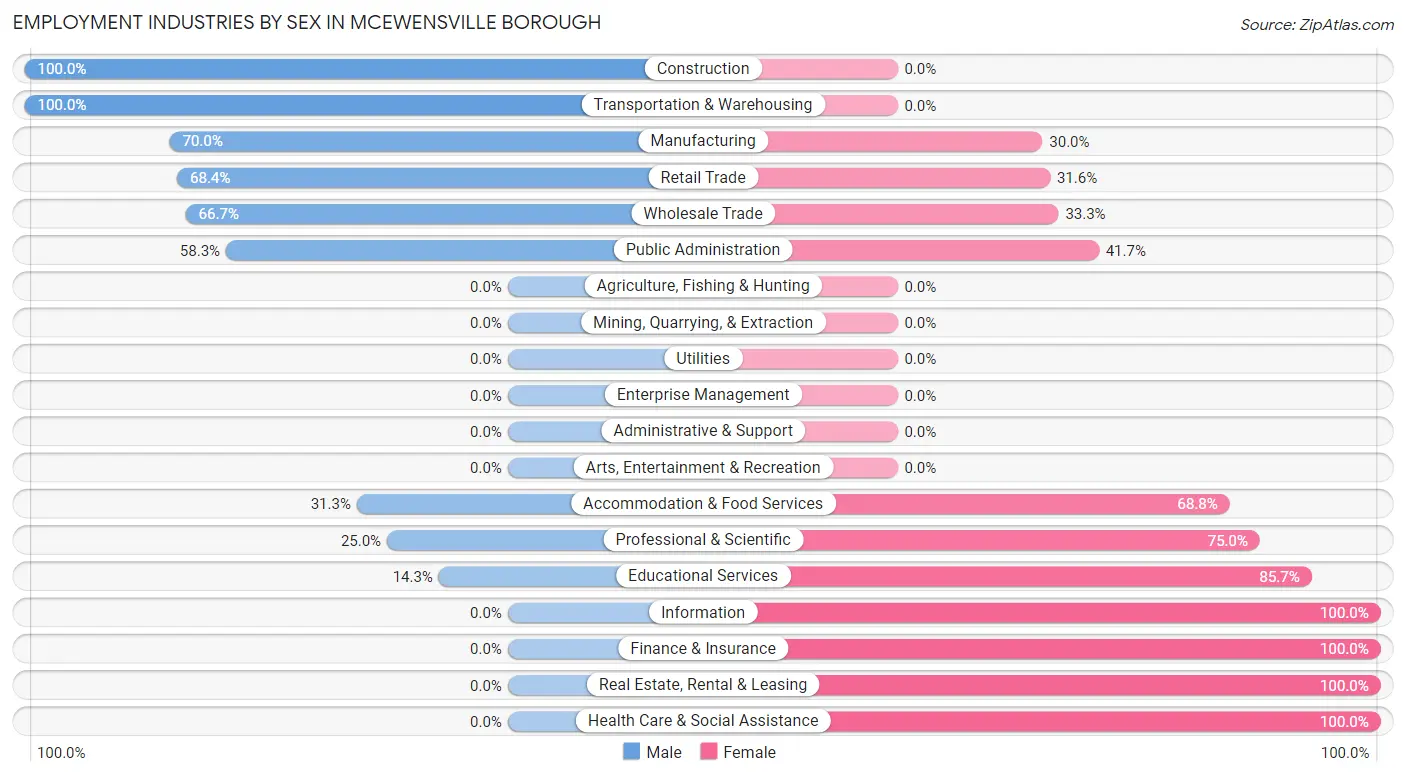
Employment Industries by Sex in McEwensville borough
The McEwensville borough industries that see more men than women are Construction (100.0%), Transportation & Warehousing (100.0%), and Manufacturing (70.0%), whereas the industries that tend to have a higher number of women are Information (100.0%), Finance & Insurance (100.0%), and Real Estate, Rental & Leasing (100.0%).
| Industry | Male | Female |
| Agriculture, Fishing & Hunting | 0 (0.0%) | 0 (0.0%) |
| Mining, Quarrying, & Extraction | 0 (0.0%) | 0 (0.0%) |
| Construction | 3 (100.0%) | 0 (0.0%) |
| Manufacturing | 7 (70.0%) | 3 (30.0%) |
| Wholesale Trade | 4 (66.7%) | 2 (33.3%) |
| Retail Trade | 13 (68.4%) | 6 (31.6%) |
| Transportation & Warehousing | 9 (100.0%) | 0 (0.0%) |
| Utilities | 0 (0.0%) | 0 (0.0%) |
| Information | 0 (0.0%) | 4 (100.0%) |
| Finance & Insurance | 0 (0.0%) | 9 (100.0%) |
| Real Estate, Rental & Leasing | 0 (0.0%) | 2 (100.0%) |
| Professional & Scientific | 2 (25.0%) | 6 (75.0%) |
| Enterprise Management | 0 (0.0%) | 0 (0.0%) |
| Administrative & Support | 0 (0.0%) | 0 (0.0%) |
| Educational Services | 2 (14.3%) | 12 (85.7%) |
| Health Care & Social Assistance | 0 (0.0%) | 22 (100.0%) |
| Arts, Entertainment & Recreation | 0 (0.0%) | 0 (0.0%) |
| Accommodation & Food Services | 5 (31.2%) | 11 (68.8%) |
| Public Administration | 7 (58.3%) | 5 (41.7%) |
| Total | 61 (39.4%) | 94 (60.7%) |
Education in McEwensville borough
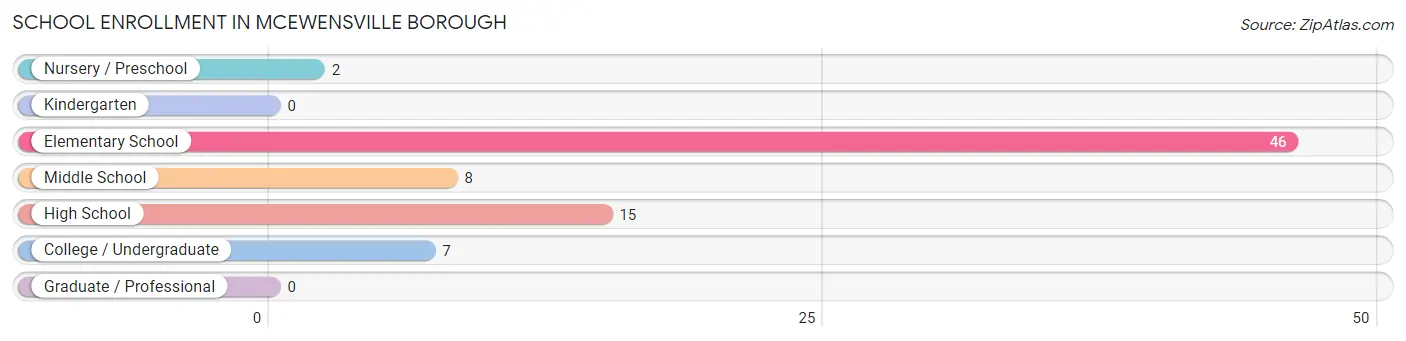
School Enrollment in McEwensville borough
The most common levels of schooling among the 78 students in McEwensville borough are elementary school (46 | 59.0%), high school (15 | 19.2%), and middle school (8 | 10.3%).
| School Level | # Students | % Students |
| Nursery / Preschool | 2 | 2.6% |
| Kindergarten | 0 | 0.0% |
| Elementary School | 46 | 59.0% |
| Middle School | 8 | 10.3% |
| High School | 15 | 19.2% |
| College / Undergraduate | 7 | 9.0% |
| Graduate / Professional | 0 | 0.0% |
| Total | 78 | 100.0% |
School Enrollment by Age by Funding Source in McEwensville borough
Out of a total of 78 students who are enrolled in schools in McEwensville borough, 7 (9.0%) attend a private institution, while the remaining 71 (91.0%) are enrolled in public schools. The age group of 35 years and over has the highest likelihood of being enrolled in private schools, with 4 (66.7% in the age bracket) enrolled. Conversely, the age group of 3 to 4 year olds has the lowest likelihood of being enrolled in a private school, with 2 (100.0% in the age bracket) attending a public institution.
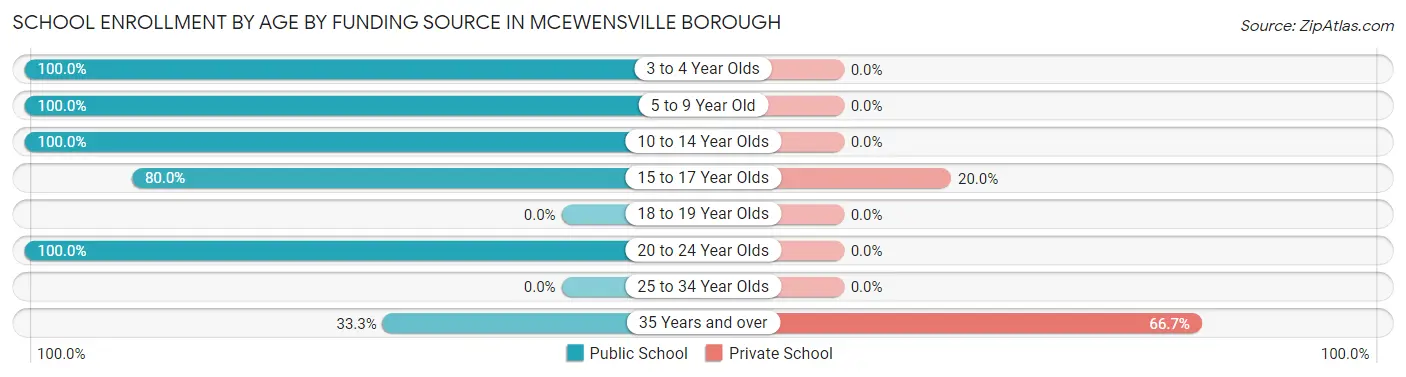
| Age Bracket | Public School | Private School |
| 3 to 4 Year Olds | 2 (100.0%) | 0 (0.0%) |
| 5 to 9 Year Old | 44 (100.0%) | 0 (0.0%) |
| 10 to 14 Year Olds | 10 (100.0%) | 0 (0.0%) |
| 15 to 17 Year Olds | 12 (80.0%) | 3 (20.0%) |
| 18 to 19 Year Olds | 0 (0.0%) | 0 (0.0%) |
| 20 to 24 Year Olds | 1 (100.0%) | 0 (0.0%) |
| 25 to 34 Year Olds | 0 (0.0%) | 0 (0.0%) |
| 35 Years and over | 2 (33.3%) | 4 (66.7%) |
| Total | 71 (91.0%) | 7 (9.0%) |
Educational Attainment by Field of Study in McEwensville borough
Business (16 | 23.5%), psychology (15 | 22.1%), computers & mathematics (9 | 13.2%), education (9 | 13.2%), and arts & humanities (9 | 13.2%) are the most common fields of study among 68 individuals in McEwensville borough who have obtained a bachelor's degree or higher.
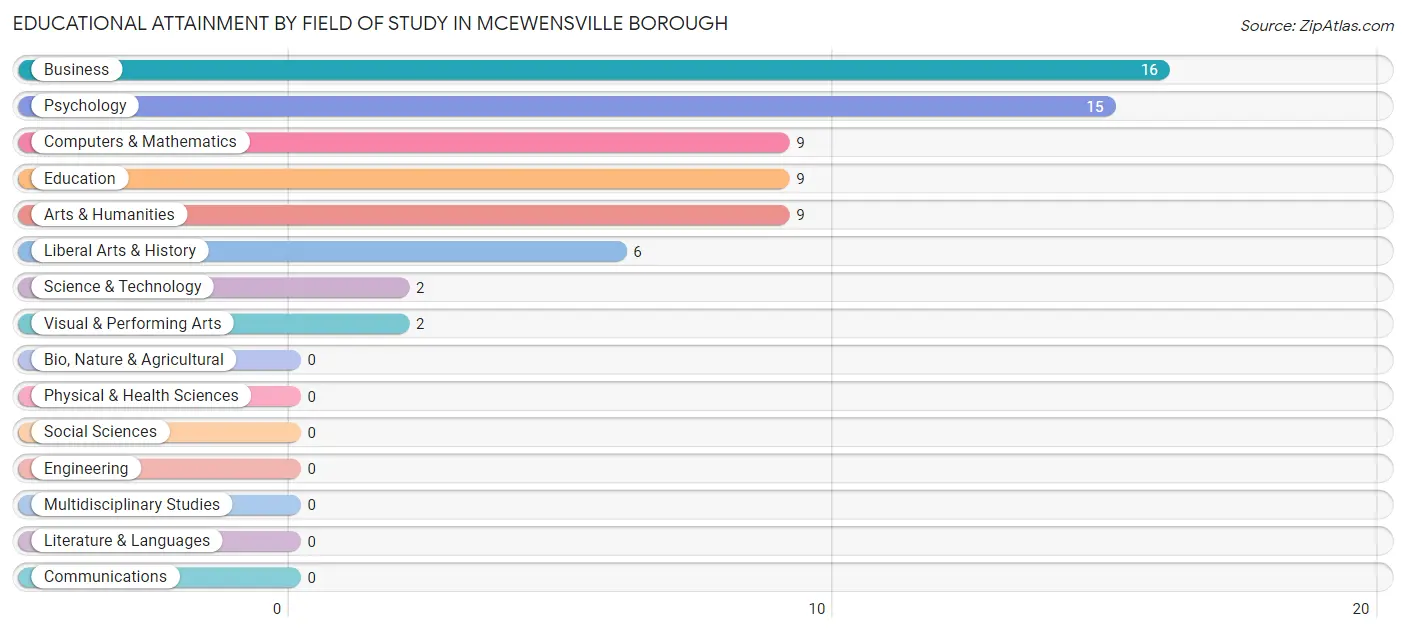
| Field of Study | # Graduates | % Graduates |
| Computers & Mathematics | 9 | 13.2% |
| Bio, Nature & Agricultural | 0 | 0.0% |
| Physical & Health Sciences | 0 | 0.0% |
| Psychology | 15 | 22.1% |
| Social Sciences | 0 | 0.0% |
| Engineering | 0 | 0.0% |
| Multidisciplinary Studies | 0 | 0.0% |
| Science & Technology | 2 | 2.9% |
| Business | 16 | 23.5% |
| Education | 9 | 13.2% |
| Literature & Languages | 0 | 0.0% |
| Liberal Arts & History | 6 | 8.8% |
| Visual & Performing Arts | 2 | 2.9% |
| Communications | 0 | 0.0% |
| Arts & Humanities | 9 | 13.2% |
| Total | 68 | 100.0% |
Transportation & Commute in McEwensville borough
Vehicle Availability by Sex in McEwensville borough
The most prevalent vehicle ownership categories in McEwensville borough are males with 1 vehicle (24, accounting for 40.0%) and females with 1 vehicle (31, making up 25.5%).
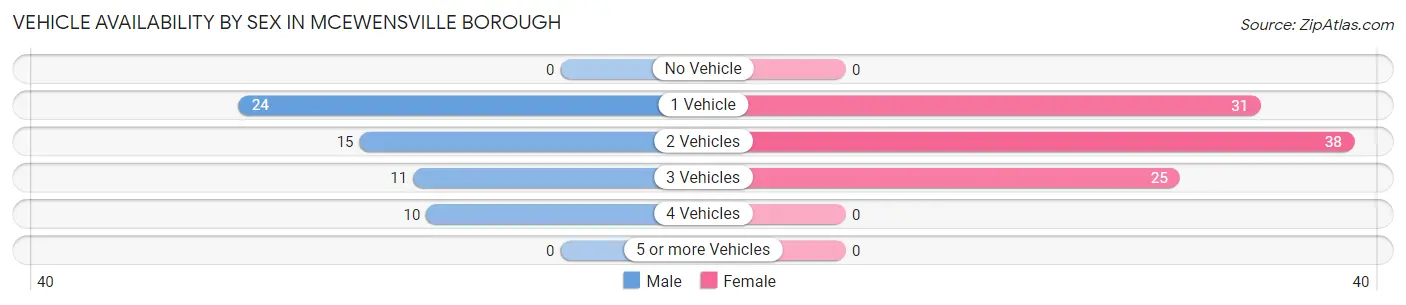
| Vehicles Available | Male | Female |
| No Vehicle | 0 (0.0%) | 0 (0.0%) |
| 1 Vehicle | 24 (40.0%) | 31 (33.0%) |
| 2 Vehicles | 15 (25.0%) | 38 (40.4%) |
| 3 Vehicles | 11 (18.3%) | 25 (26.6%) |
| 4 Vehicles | 10 (16.7%) | 0 (0.0%) |
| 5 or more Vehicles | 0 (0.0%) | 0 (0.0%) |
| Total | 60 (100.0%) | 94 (100.0%) |
Commute Time in McEwensville borough
The most frequently occuring commute durations in McEwensville borough are 20 to 24 minutes (46 commuters, 31.1%), 15 to 19 minutes (38 commuters, 25.7%), and 10 to 14 minutes (17 commuters, 11.5%).
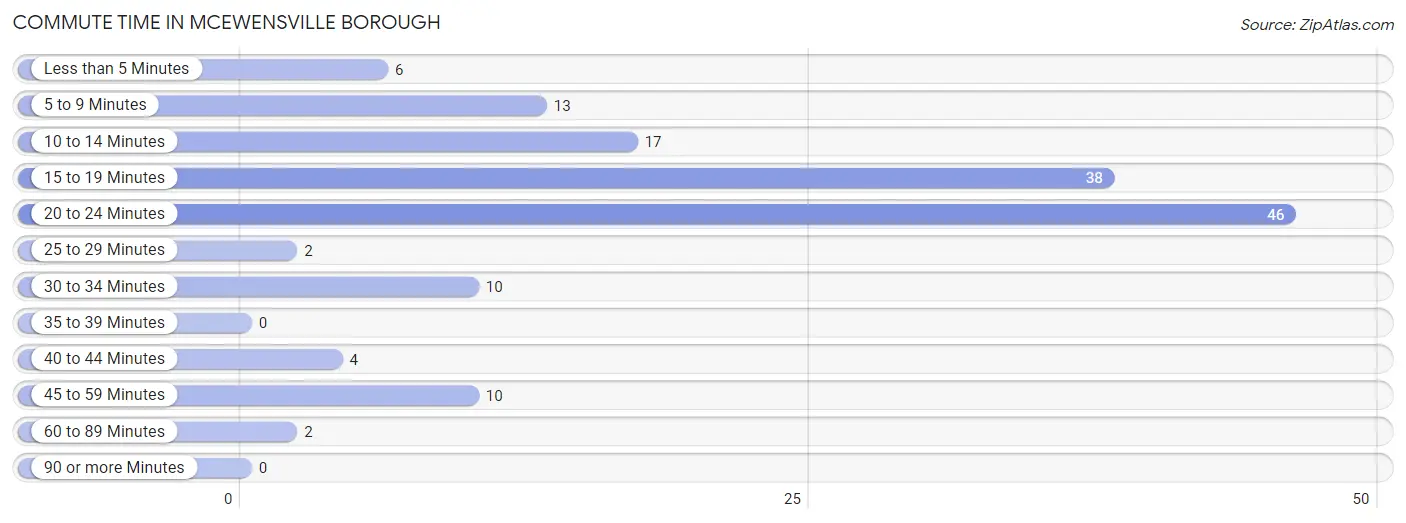
| Commute Time | # Commuters | % Commuters |
| Less than 5 Minutes | 6 | 4.1% |
| 5 to 9 Minutes | 13 | 8.8% |
| 10 to 14 Minutes | 17 | 11.5% |
| 15 to 19 Minutes | 38 | 25.7% |
| 20 to 24 Minutes | 46 | 31.1% |
| 25 to 29 Minutes | 2 | 1.3% |
| 30 to 34 Minutes | 10 | 6.8% |
| 35 to 39 Minutes | 0 | 0.0% |
| 40 to 44 Minutes | 4 | 2.7% |
| 45 to 59 Minutes | 10 | 6.8% |
| 60 to 89 Minutes | 2 | 1.3% |
| 90 or more Minutes | 0 | 0.0% |
Commute Time by Sex in McEwensville borough
The most common commute times in McEwensville borough are 15 to 19 minutes (20 commuters, 33.3%) for males and 20 to 24 minutes (34 commuters, 38.6%) for females.
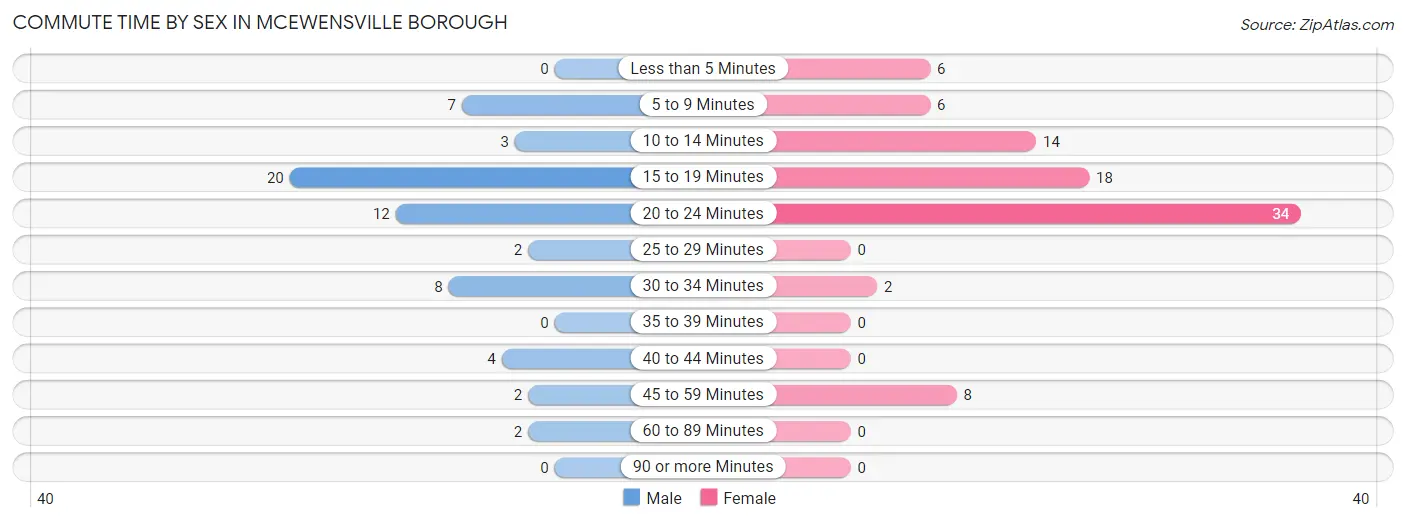
| Commute Time | Male | Female |
| Less than 5 Minutes | 0 (0.0%) | 6 (6.8%) |
| 5 to 9 Minutes | 7 (11.7%) | 6 (6.8%) |
| 10 to 14 Minutes | 3 (5.0%) | 14 (15.9%) |
| 15 to 19 Minutes | 20 (33.3%) | 18 (20.4%) |
| 20 to 24 Minutes | 12 (20.0%) | 34 (38.6%) |
| 25 to 29 Minutes | 2 (3.3%) | 0 (0.0%) |
| 30 to 34 Minutes | 8 (13.3%) | 2 (2.3%) |
| 35 to 39 Minutes | 0 (0.0%) | 0 (0.0%) |
| 40 to 44 Minutes | 4 (6.7%) | 0 (0.0%) |
| 45 to 59 Minutes | 2 (3.3%) | 8 (9.1%) |
| 60 to 89 Minutes | 2 (3.3%) | 0 (0.0%) |
| 90 or more Minutes | 0 (0.0%) | 0 (0.0%) |
Time of Departure to Work by Sex in McEwensville borough
The most frequent times of departure to work in McEwensville borough are 7:00 AM to 7:29 AM (24, 40.0%) for males and 7:00 AM to 7:29 AM (31, 35.2%) for females.
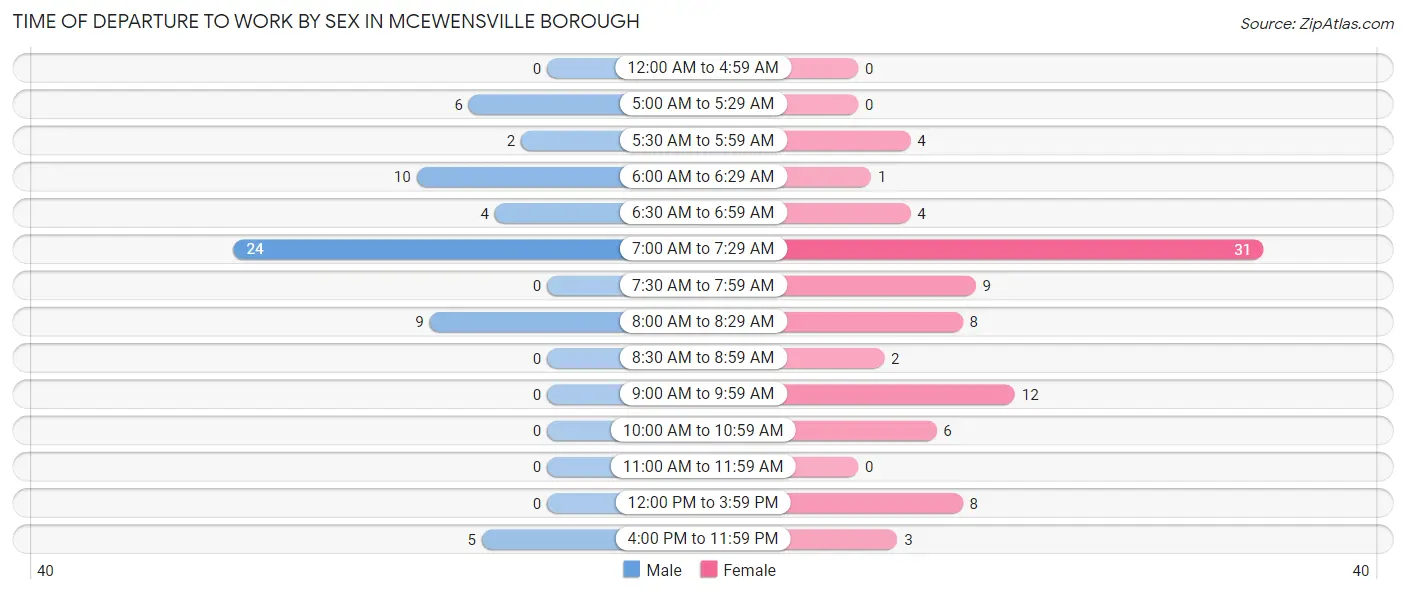
| Time of Departure | Male | Female |
| 12:00 AM to 4:59 AM | 0 (0.0%) | 0 (0.0%) |
| 5:00 AM to 5:29 AM | 6 (10.0%) | 0 (0.0%) |
| 5:30 AM to 5:59 AM | 2 (3.3%) | 4 (4.5%) |
| 6:00 AM to 6:29 AM | 10 (16.7%) | 1 (1.1%) |
| 6:30 AM to 6:59 AM | 4 (6.7%) | 4 (4.5%) |
| 7:00 AM to 7:29 AM | 24 (40.0%) | 31 (35.2%) |
| 7:30 AM to 7:59 AM | 0 (0.0%) | 9 (10.2%) |
| 8:00 AM to 8:29 AM | 9 (15.0%) | 8 (9.1%) |
| 8:30 AM to 8:59 AM | 0 (0.0%) | 2 (2.3%) |
| 9:00 AM to 9:59 AM | 0 (0.0%) | 12 (13.6%) |
| 10:00 AM to 10:59 AM | 0 (0.0%) | 6 (6.8%) |
| 11:00 AM to 11:59 AM | 0 (0.0%) | 0 (0.0%) |
| 12:00 PM to 3:59 PM | 0 (0.0%) | 8 (9.1%) |
| 4:00 PM to 11:59 PM | 5 (8.3%) | 3 (3.4%) |
| Total | 60 (100.0%) | 88 (100.0%) |
Housing Occupancy in McEwensville borough
Occupancy by Ownership in McEwensville borough
Of the total 118 dwellings in McEwensville borough, owner-occupied units account for 70 (59.3%), while renter-occupied units make up 48 (40.7%).
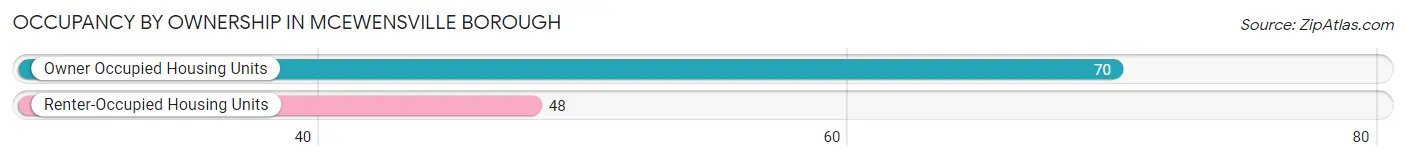
| Occupancy | # Housing Units | % Housing Units |
| Owner Occupied Housing Units | 70 | 59.3% |
| Renter-Occupied Housing Units | 48 | 40.7% |
| Total Occupied Housing Units | 118 | 100.0% |
Occupancy by Household Size in McEwensville borough
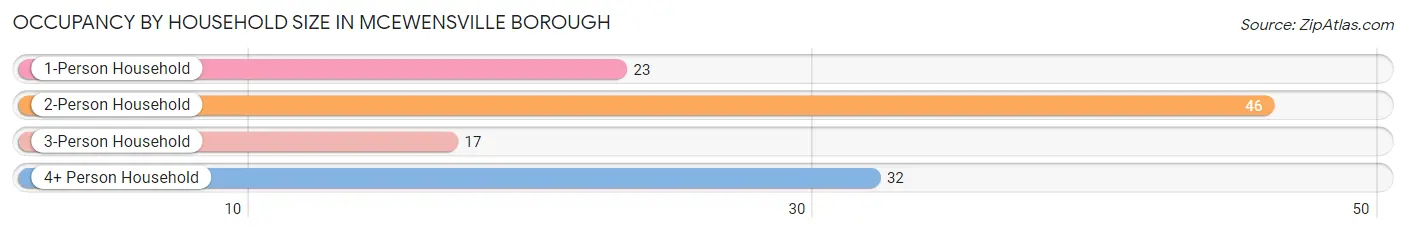
| Household Size | # Housing Units | % Housing Units |
| 1-Person Household | 23 | 19.5% |
| 2-Person Household | 46 | 39.0% |
| 3-Person Household | 17 | 14.4% |
| 4+ Person Household | 32 | 27.1% |
| Total Housing Units | 118 | 100.0% |
Occupancy by Ownership by Household Size in McEwensville borough
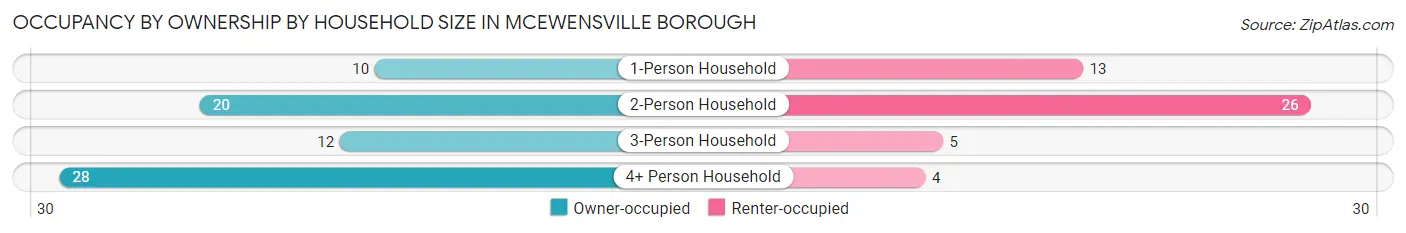
| Household Size | Owner-occupied | Renter-occupied |
| 1-Person Household | 10 (43.5%) | 13 (56.5%) |
| 2-Person Household | 20 (43.5%) | 26 (56.5%) |
| 3-Person Household | 12 (70.6%) | 5 (29.4%) |
| 4+ Person Household | 28 (87.5%) | 4 (12.5%) |
| Total Housing Units | 70 (59.3%) | 48 (40.7%) |
Occupancy by Educational Attainment in McEwensville borough
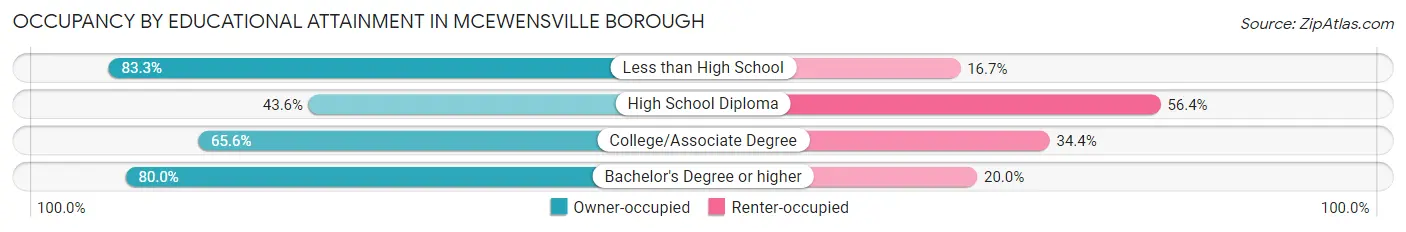
| Household Size | Owner-occupied | Renter-occupied |
| Less than High School | 5 (83.3%) | 1 (16.7%) |
| High School Diploma | 24 (43.6%) | 31 (56.4%) |
| College/Associate Degree | 21 (65.6%) | 11 (34.4%) |
| Bachelor's Degree or higher | 20 (80.0%) | 5 (20.0%) |
Occupancy by Age of Householder in McEwensville borough
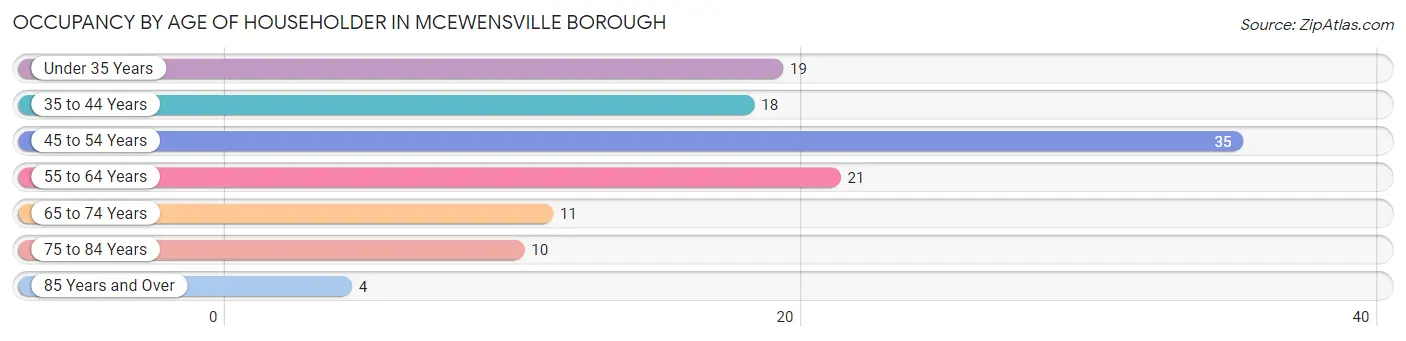
| Age Bracket | # Households | % Households |
| Under 35 Years | 19 | 16.1% |
| 35 to 44 Years | 18 | 15.2% |
| 45 to 54 Years | 35 | 29.7% |
| 55 to 64 Years | 21 | 17.8% |
| 65 to 74 Years | 11 | 9.3% |
| 75 to 84 Years | 10 | 8.5% |
| 85 Years and Over | 4 | 3.4% |
| Total | 118 | 100.0% |
Housing Finances in McEwensville borough
Median Income by Occupancy in McEwensville borough
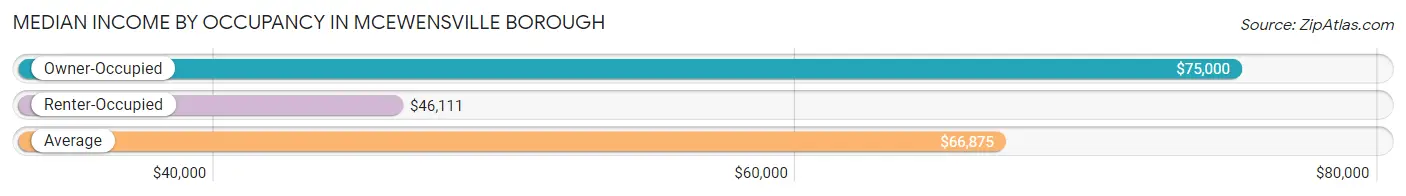
| Occupancy Type | # Households | Median Income |
| Owner-Occupied | 70 (59.3%) | $75,000 |
| Renter-Occupied | 48 (40.7%) | $46,111 |
| Average | 118 (100.0%) | $66,875 |
Occupancy by Householder Income Bracket in McEwensville borough
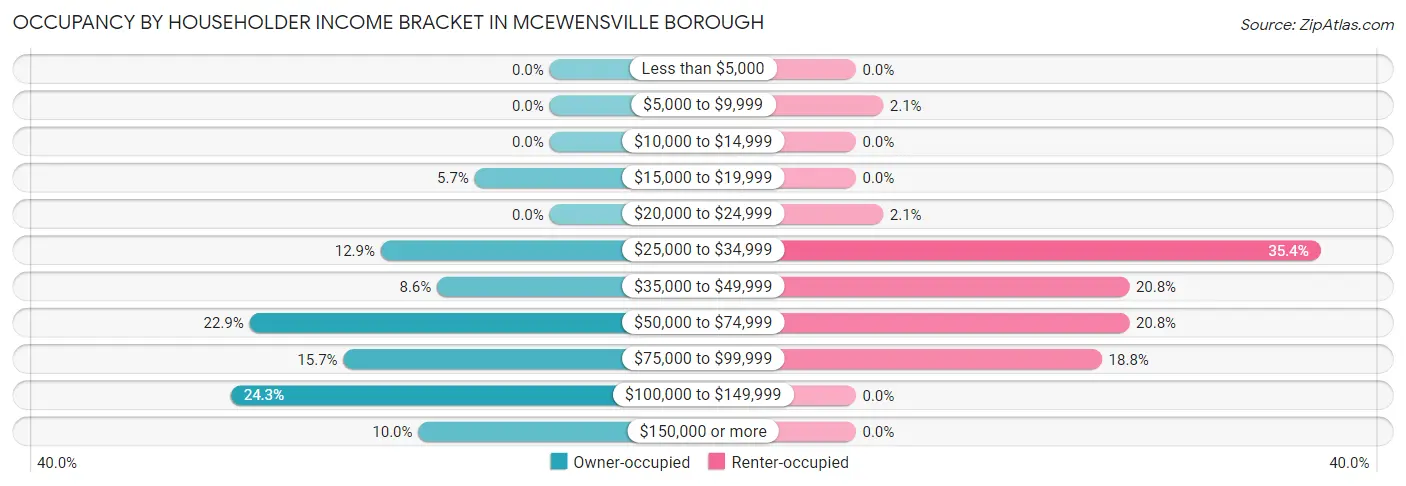
| Income Bracket | Owner-occupied | Renter-occupied |
| Less than $5,000 | 0 (0.0%) | 0 (0.0%) |
| $5,000 to $9,999 | 0 (0.0%) | 1 (2.1%) |
| $10,000 to $14,999 | 0 (0.0%) | 0 (0.0%) |
| $15,000 to $19,999 | 4 (5.7%) | 0 (0.0%) |
| $20,000 to $24,999 | 0 (0.0%) | 1 (2.1%) |
| $25,000 to $34,999 | 9 (12.9%) | 17 (35.4%) |
| $35,000 to $49,999 | 6 (8.6%) | 10 (20.8%) |
| $50,000 to $74,999 | 16 (22.9%) | 10 (20.8%) |
| $75,000 to $99,999 | 11 (15.7%) | 9 (18.8%) |
| $100,000 to $149,999 | 17 (24.3%) | 0 (0.0%) |
| $150,000 or more | 7 (10.0%) | 0 (0.0%) |
| Total | 70 (100.0%) | 48 (100.0%) |
Monthly Housing Cost Tiers in McEwensville borough
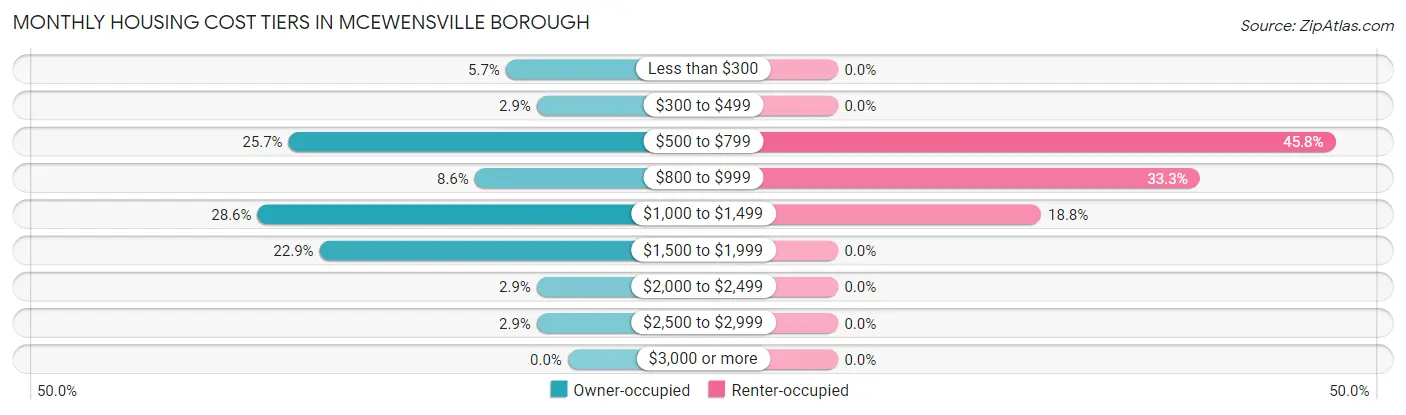
| Monthly Cost | Owner-occupied | Renter-occupied |
| Less than $300 | 4 (5.7%) | 0 (0.0%) |
| $300 to $499 | 2 (2.9%) | 0 (0.0%) |
| $500 to $799 | 18 (25.7%) | 22 (45.8%) |
| $800 to $999 | 6 (8.6%) | 16 (33.3%) |
| $1,000 to $1,499 | 20 (28.6%) | 9 (18.8%) |
| $1,500 to $1,999 | 16 (22.9%) | 0 (0.0%) |
| $2,000 to $2,499 | 2 (2.9%) | 0 (0.0%) |
| $2,500 to $2,999 | 2 (2.9%) | 0 (0.0%) |
| $3,000 or more | 0 (0.0%) | 0 (0.0%) |
| Total | 70 (100.0%) | 48 (100.0%) |
Physical Housing Characteristics in McEwensville borough
Housing Structures in McEwensville borough
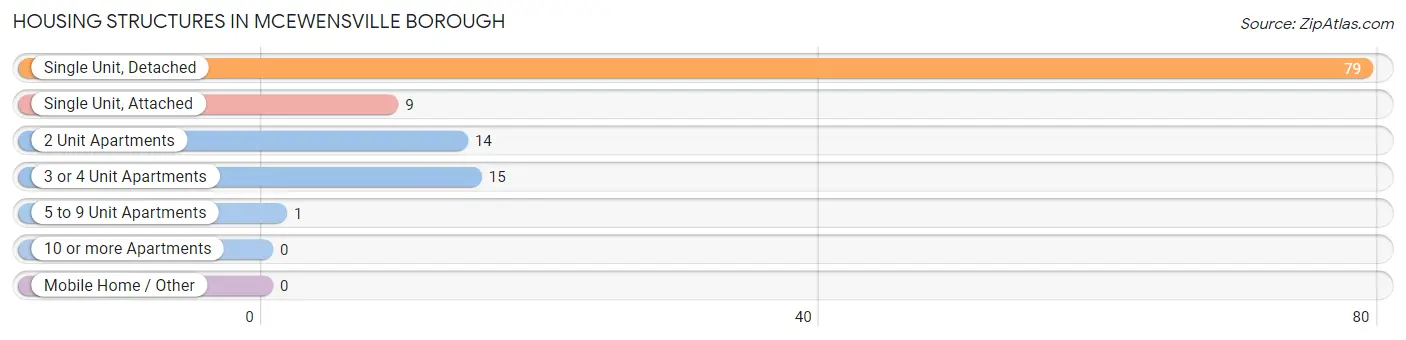
| Structure Type | # Housing Units | % Housing Units |
| Single Unit, Detached | 79 | 66.9% |
| Single Unit, Attached | 9 | 7.6% |
| 2 Unit Apartments | 14 | 11.9% |
| 3 or 4 Unit Apartments | 15 | 12.7% |
| 5 to 9 Unit Apartments | 1 | 0.9% |
| 10 or more Apartments | 0 | 0.0% |
| Mobile Home / Other | 0 | 0.0% |
| Total | 118 | 100.0% |
Housing Structures by Occupancy in McEwensville borough
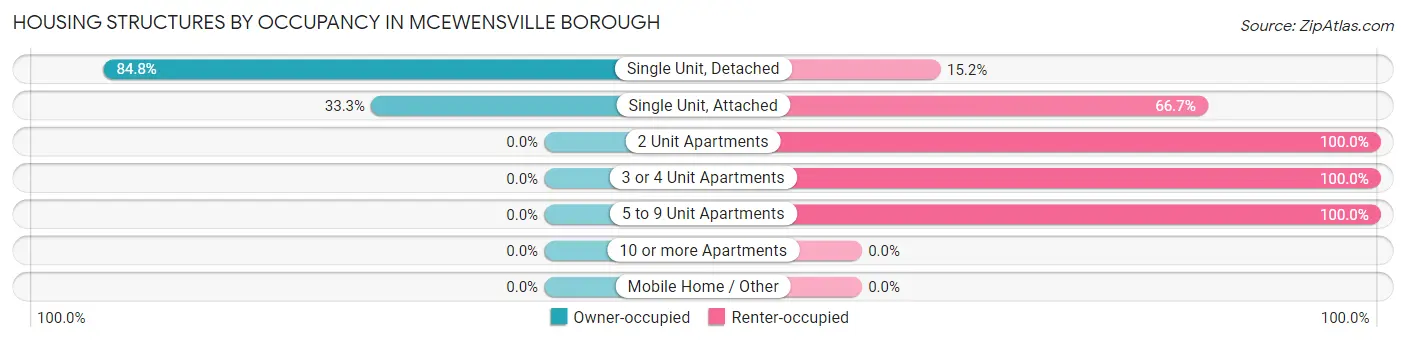
| Structure Type | Owner-occupied | Renter-occupied |
| Single Unit, Detached | 67 (84.8%) | 12 (15.2%) |
| Single Unit, Attached | 3 (33.3%) | 6 (66.7%) |
| 2 Unit Apartments | 0 (0.0%) | 14 (100.0%) |
| 3 or 4 Unit Apartments | 0 (0.0%) | 15 (100.0%) |
| 5 to 9 Unit Apartments | 0 (0.0%) | 1 (100.0%) |
| 10 or more Apartments | 0 (0.0%) | 0 (0.0%) |
| Mobile Home / Other | 0 (0.0%) | 0 (0.0%) |
| Total | 70 (59.3%) | 48 (40.7%) |
Housing Structures by Number of Rooms in McEwensville borough
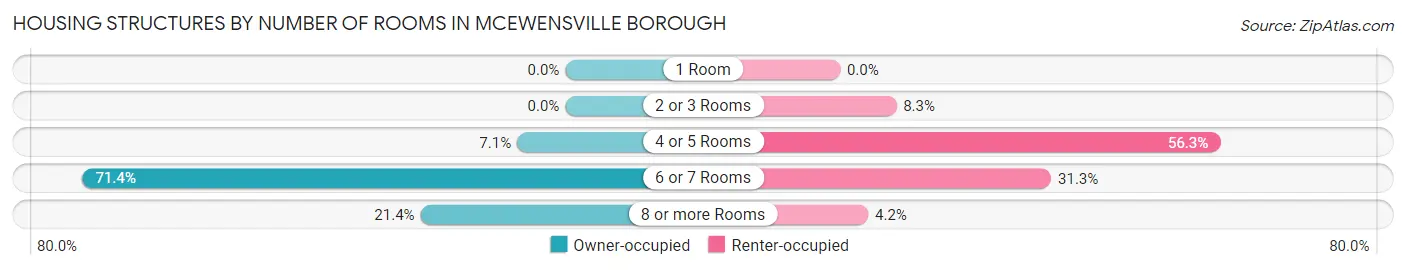
| Number of Rooms | Owner-occupied | Renter-occupied |
| 1 Room | 0 (0.0%) | 0 (0.0%) |
| 2 or 3 Rooms | 0 (0.0%) | 4 (8.3%) |
| 4 or 5 Rooms | 5 (7.1%) | 27 (56.2%) |
| 6 or 7 Rooms | 50 (71.4%) | 15 (31.2%) |
| 8 or more Rooms | 15 (21.4%) | 2 (4.2%) |
| Total | 70 (100.0%) | 48 (100.0%) |
Housing Structure by Heating Type in McEwensville borough
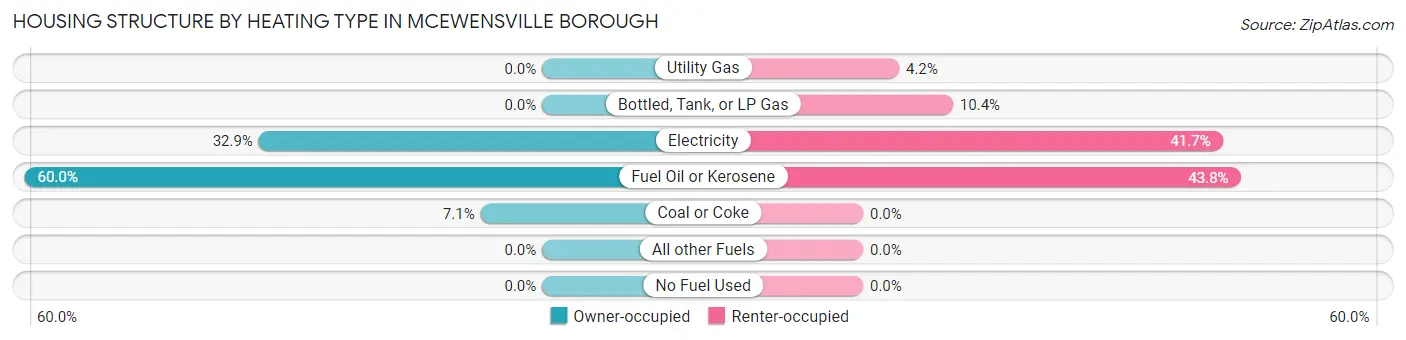
| Heating Type | Owner-occupied | Renter-occupied |
| Utility Gas | 0 (0.0%) | 2 (4.2%) |
| Bottled, Tank, or LP Gas | 0 (0.0%) | 5 (10.4%) |
| Electricity | 23 (32.9%) | 20 (41.7%) |
| Fuel Oil or Kerosene | 42 (60.0%) | 21 (43.8%) |
| Coal or Coke | 5 (7.1%) | 0 (0.0%) |
| All other Fuels | 0 (0.0%) | 0 (0.0%) |
| No Fuel Used | 0 (0.0%) | 0 (0.0%) |
| Total | 70 (100.0%) | 48 (100.0%) |
Household Vehicle Usage in McEwensville borough
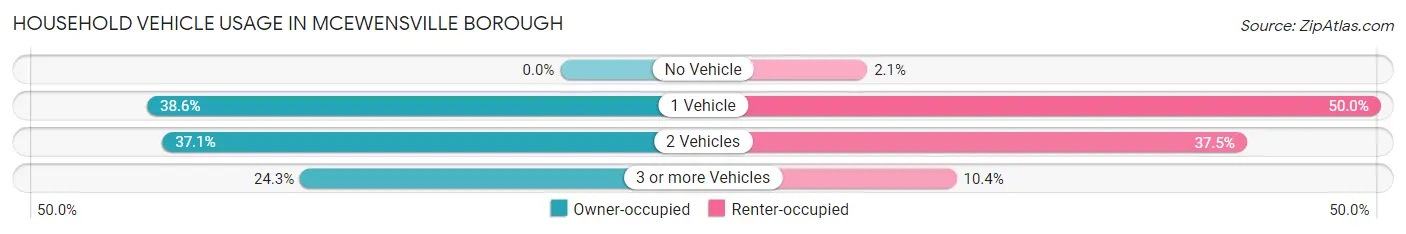
| Vehicles per Household | Owner-occupied | Renter-occupied |
| No Vehicle | 0 (0.0%) | 1 (2.1%) |
| 1 Vehicle | 27 (38.6%) | 24 (50.0%) |
| 2 Vehicles | 26 (37.1%) | 18 (37.5%) |
| 3 or more Vehicles | 17 (24.3%) | 5 (10.4%) |
| Total | 70 (100.0%) | 48 (100.0%) |
Real Estate & Mortgages in McEwensville borough
Real Estate and Mortgage Overview in McEwensville borough
| Characteristic | Without Mortgage | With Mortgage |
| Housing Units | 18 | 52 |
| Median Property Value | $145,000 | $193,800 |
| Median Household Income | - | - |
| Monthly Housing Costs | $547 | $0 |
| Real Estate Taxes | $2,000 | $0 |
Property Value by Mortgage Status in McEwensville borough
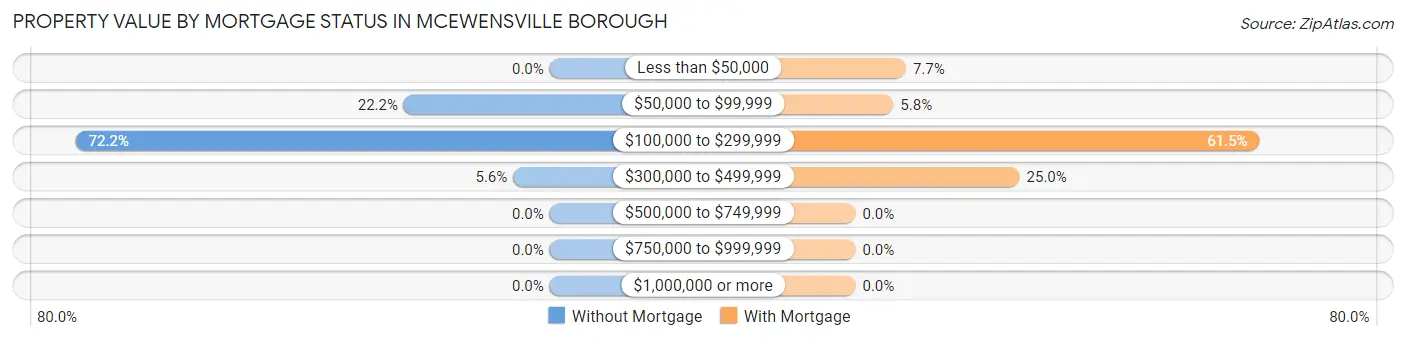
| Property Value | Without Mortgage | With Mortgage |
| Less than $50,000 | 0 (0.0%) | 4 (7.7%) |
| $50,000 to $99,999 | 4 (22.2%) | 3 (5.8%) |
| $100,000 to $299,999 | 13 (72.2%) | 32 (61.5%) |
| $300,000 to $499,999 | 1 (5.6%) | 13 (25.0%) |
| $500,000 to $749,999 | 0 (0.0%) | 0 (0.0%) |
| $750,000 to $999,999 | 0 (0.0%) | 0 (0.0%) |
| $1,000,000 or more | 0 (0.0%) | 0 (0.0%) |
| Total | 18 (100.0%) | 52 (100.0%) |
Household Income by Mortgage Status in McEwensville borough
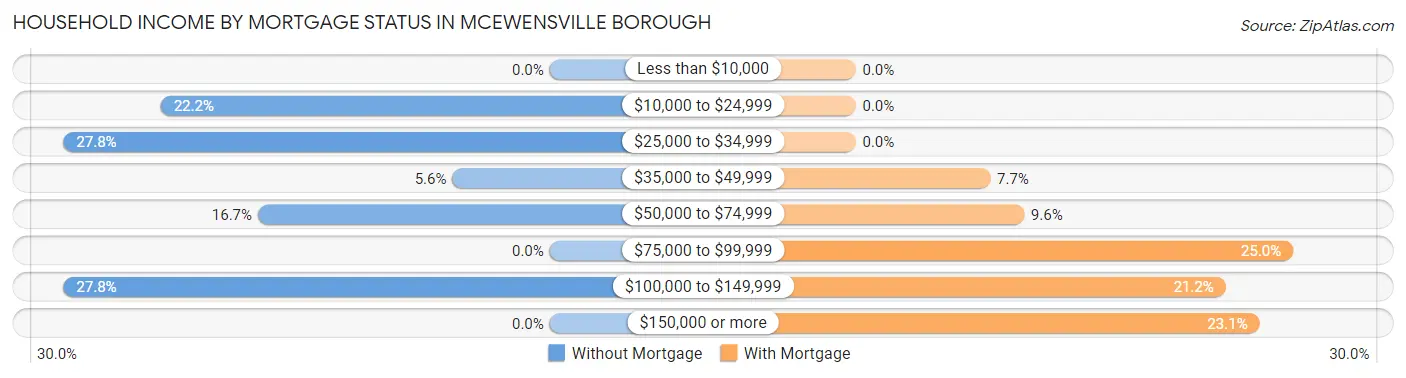
| Household Income | Without Mortgage | With Mortgage |
| Less than $10,000 | 0 (0.0%) | 0 (0.0%) |
| $10,000 to $24,999 | 4 (22.2%) | 0 (0.0%) |
| $25,000 to $34,999 | 5 (27.8%) | 0 (0.0%) |
| $35,000 to $49,999 | 1 (5.6%) | 4 (7.7%) |
| $50,000 to $74,999 | 3 (16.7%) | 5 (9.6%) |
| $75,000 to $99,999 | 0 (0.0%) | 13 (25.0%) |
| $100,000 to $149,999 | 5 (27.8%) | 11 (21.1%) |
| $150,000 or more | 0 (0.0%) | 12 (23.1%) |
| Total | 18 (100.0%) | 52 (100.0%) |
Property Value to Household Income Ratio in McEwensville borough
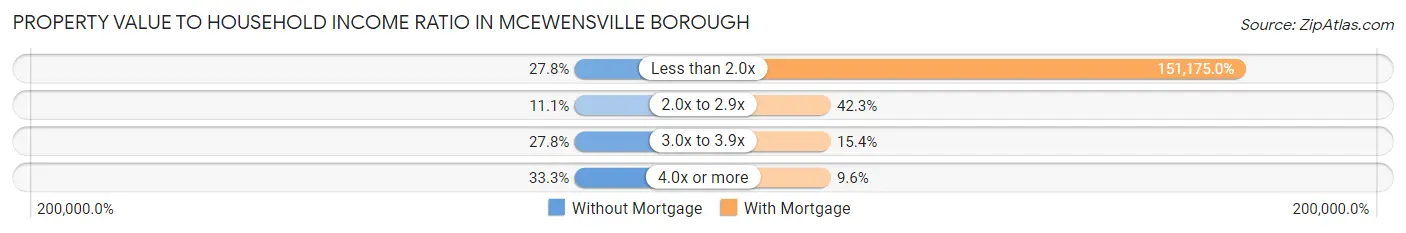
| Value-to-Income Ratio | Without Mortgage | With Mortgage |
| Less than 2.0x | 5 (27.8%) | 78,611 (151,175.0%) |
| 2.0x to 2.9x | 2 (11.1%) | 22 (42.3%) |
| 3.0x to 3.9x | 5 (27.8%) | 8 (15.4%) |
| 4.0x or more | 6 (33.3%) | 5 (9.6%) |
| Total | 18 (100.0%) | 52 (100.0%) |
Real Estate Taxes by Mortgage Status in McEwensville borough
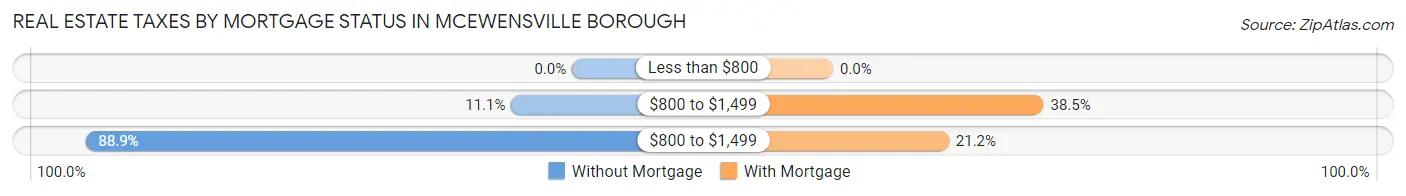
| Property Taxes | Without Mortgage | With Mortgage |
| Less than $800 | 0 (0.0%) | 0 (0.0%) |
| $800 to $1,499 | 2 (11.1%) | 20 (38.5%) |
| $800 to $1,499 | 16 (88.9%) | 11 (21.1%) |
| Total | 18 (100.0%) | 52 (100.0%) |
Health & Disability in McEwensville borough
Health Insurance Coverage by Age in McEwensville borough
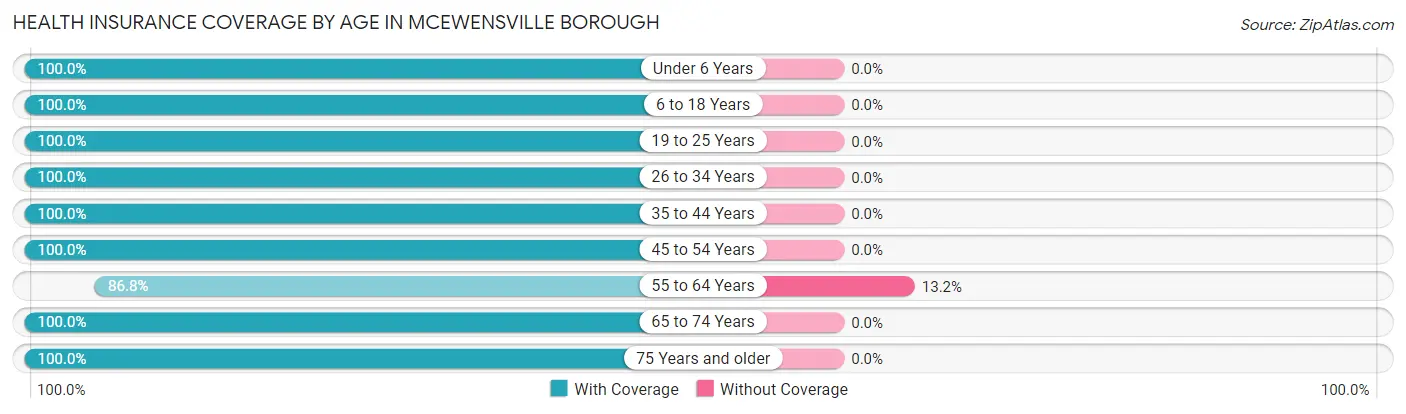
| Age Bracket | With Coverage | Without Coverage |
| Under 6 Years | 6 (100.0%) | 0 (0.0%) |
| 6 to 18 Years | 70 (100.0%) | 0 (0.0%) |
| 19 to 25 Years | 19 (100.0%) | 0 (0.0%) |
| 26 to 34 Years | 28 (100.0%) | 0 (0.0%) |
| 35 to 44 Years | 59 (100.0%) | 0 (0.0%) |
| 45 to 54 Years | 53 (100.0%) | 0 (0.0%) |
| 55 to 64 Years | 33 (86.8%) | 5 (13.2%) |
| 65 to 74 Years | 22 (100.0%) | 0 (0.0%) |
| 75 Years and older | 24 (100.0%) | 0 (0.0%) |
| Total | 314 (98.4%) | 5 (1.6%) |
Health Insurance Coverage by Citizenship Status in McEwensville borough
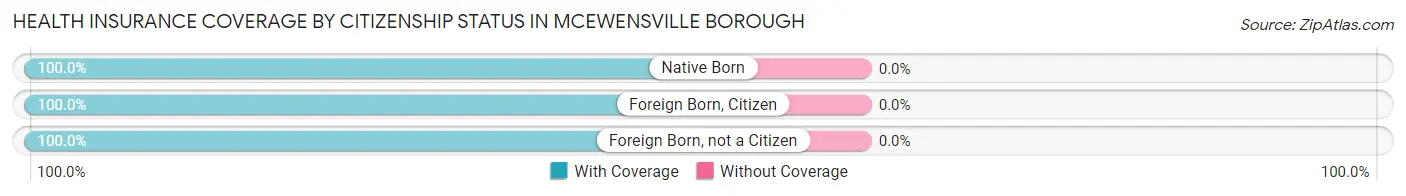
| Citizenship Status | With Coverage | Without Coverage |
| Native Born | 6 (100.0%) | 0 (0.0%) |
| Foreign Born, Citizen | 70 (100.0%) | 0 (0.0%) |
| Foreign Born, not a Citizen | 19 (100.0%) | 0 (0.0%) |
Health Insurance Coverage by Household Income in McEwensville borough
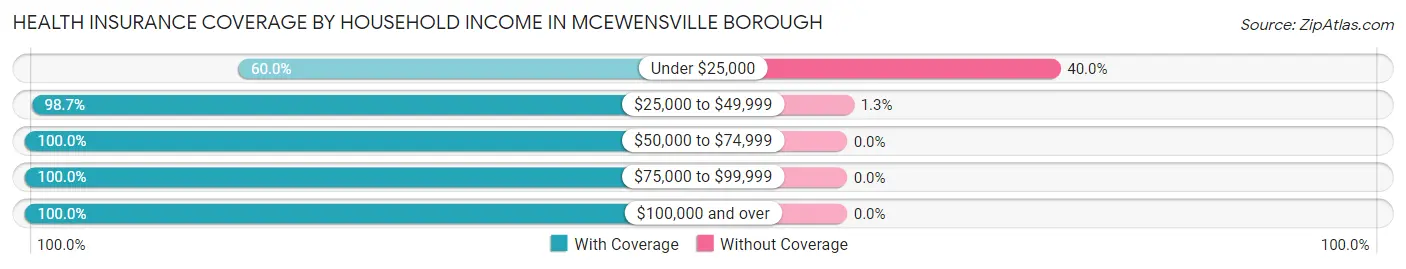
| Household Income | With Coverage | Without Coverage |
| Under $25,000 | 6 (60.0%) | 4 (40.0%) |
| $25,000 to $49,999 | 76 (98.7%) | 1 (1.3%) |
| $50,000 to $74,999 | 67 (100.0%) | 0 (0.0%) |
| $75,000 to $99,999 | 78 (100.0%) | 0 (0.0%) |
| $100,000 and over | 87 (100.0%) | 0 (0.0%) |
Public vs Private Health Insurance Coverage by Age in McEwensville borough
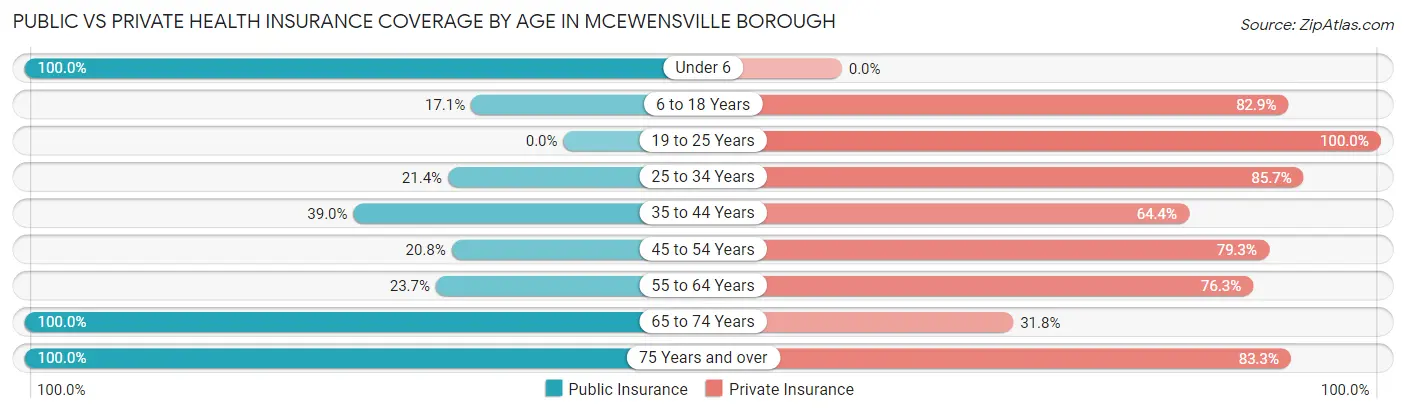
| Age Bracket | Public Insurance | Private Insurance |
| Under 6 | 6 (100.0%) | 0 (0.0%) |
| 6 to 18 Years | 12 (17.1%) | 58 (82.9%) |
| 19 to 25 Years | 0 (0.0%) | 19 (100.0%) |
| 25 to 34 Years | 6 (21.4%) | 24 (85.7%) |
| 35 to 44 Years | 23 (39.0%) | 38 (64.4%) |
| 45 to 54 Years | 11 (20.7%) | 42 (79.2%) |
| 55 to 64 Years | 9 (23.7%) | 29 (76.3%) |
| 65 to 74 Years | 22 (100.0%) | 7 (31.8%) |
| 75 Years and over | 24 (100.0%) | 20 (83.3%) |
| Total | 113 (35.4%) | 237 (74.3%) |
Disability Status by Sex by Age in McEwensville borough
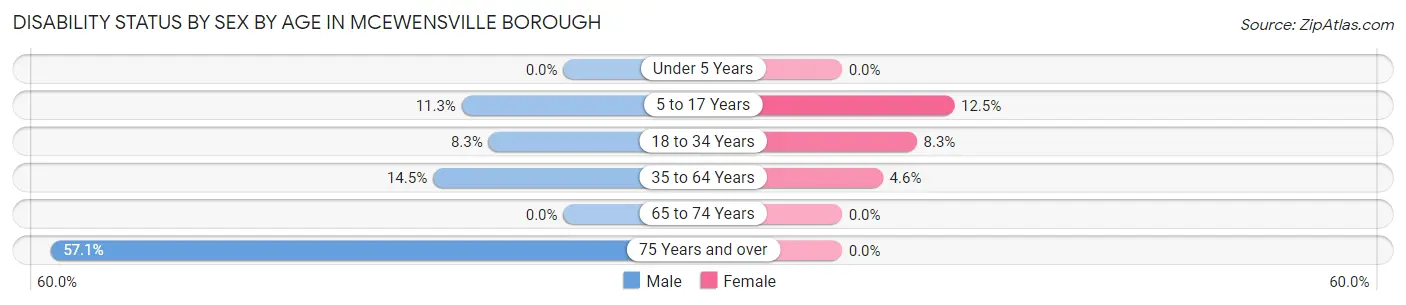
| Age Bracket | Male | Female |
| Under 5 Years | 0 (0.0%) | 0 (0.0%) |
| 5 to 17 Years | 6 (11.3%) | 2 (12.5%) |
| 18 to 34 Years | 2 (8.3%) | 2 (8.3%) |
| 35 to 64 Years | 9 (14.5%) | 4 (4.5%) |
| 65 to 74 Years | 0 (0.0%) | 0 (0.0%) |
| 75 Years and over | 8 (57.1%) | 0 (0.0%) |
Disability Class by Sex by Age in McEwensville borough
Disability Class: Hearing Difficulty
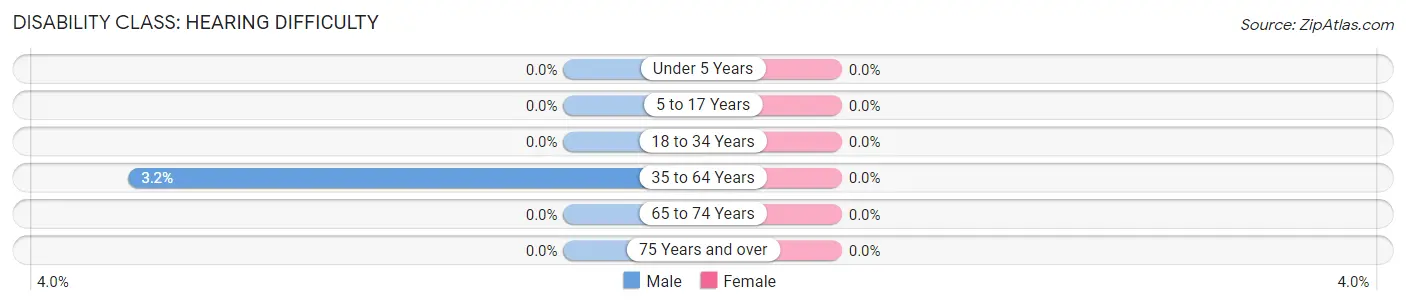
| Age Bracket | Male | Female |
| Under 5 Years | 0 (0.0%) | 0 (0.0%) |
| 5 to 17 Years | 0 (0.0%) | 0 (0.0%) |
| 18 to 34 Years | 0 (0.0%) | 0 (0.0%) |
| 35 to 64 Years | 2 (3.2%) | 0 (0.0%) |
| 65 to 74 Years | 0 (0.0%) | 0 (0.0%) |
| 75 Years and over | 0 (0.0%) | 0 (0.0%) |
Disability Class: Vision Difficulty
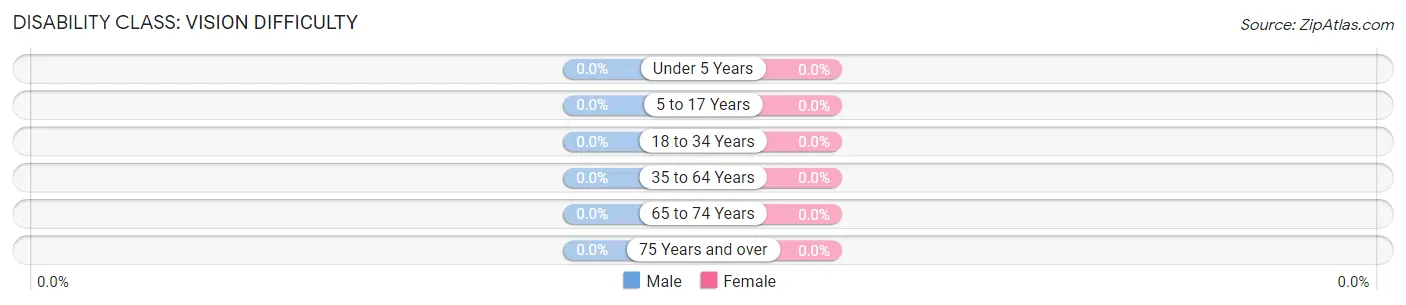
| Age Bracket | Male | Female |
| Under 5 Years | 0 (0.0%) | 0 (0.0%) |
| 5 to 17 Years | 0 (0.0%) | 0 (0.0%) |
| 18 to 34 Years | 0 (0.0%) | 0 (0.0%) |
| 35 to 64 Years | 0 (0.0%) | 0 (0.0%) |
| 65 to 74 Years | 0 (0.0%) | 0 (0.0%) |
| 75 Years and over | 0 (0.0%) | 0 (0.0%) |
Disability Class: Cognitive Difficulty
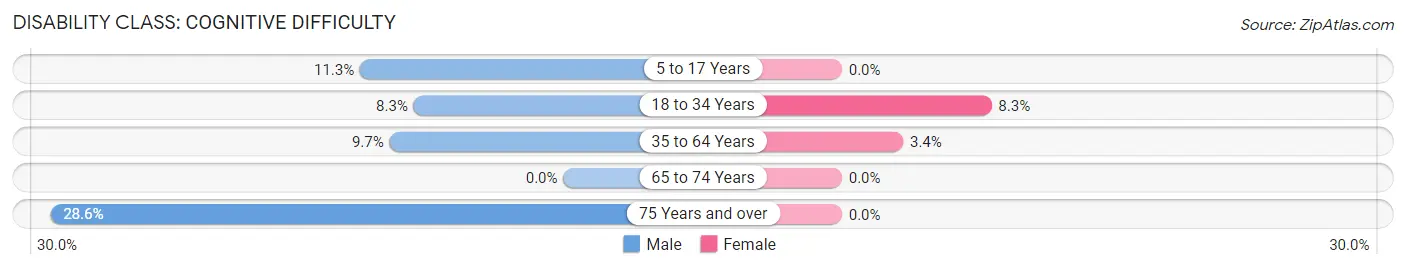
| Age Bracket | Male | Female |
| 5 to 17 Years | 6 (11.3%) | 0 (0.0%) |
| 18 to 34 Years | 2 (8.3%) | 2 (8.3%) |
| 35 to 64 Years | 6 (9.7%) | 3 (3.4%) |
| 65 to 74 Years | 0 (0.0%) | 0 (0.0%) |
| 75 Years and over | 4 (28.6%) | 0 (0.0%) |
Disability Class: Ambulatory Difficulty
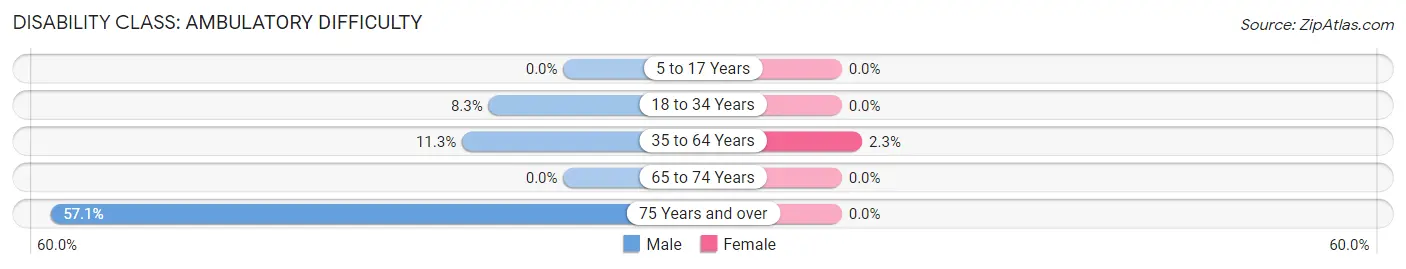
| Age Bracket | Male | Female |
| 5 to 17 Years | 0 (0.0%) | 0 (0.0%) |
| 18 to 34 Years | 2 (8.3%) | 0 (0.0%) |
| 35 to 64 Years | 7 (11.3%) | 2 (2.3%) |
| 65 to 74 Years | 0 (0.0%) | 0 (0.0%) |
| 75 Years and over | 8 (57.1%) | 0 (0.0%) |
Disability Class: Self-Care Difficulty
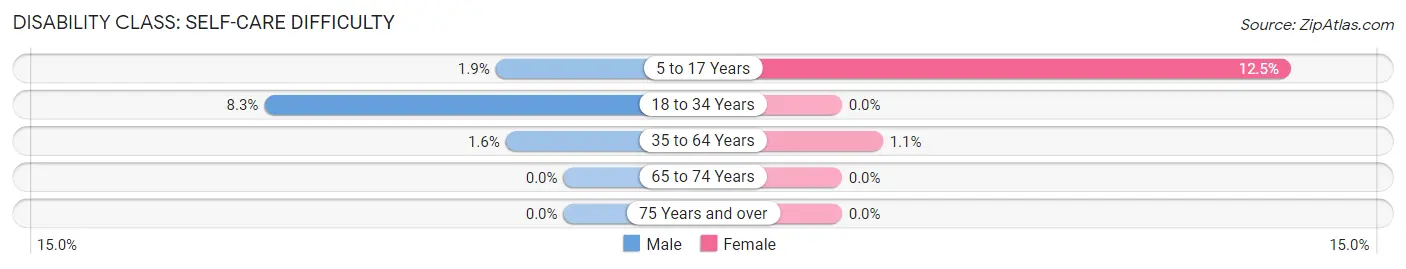
| Age Bracket | Male | Female |
| 5 to 17 Years | 1 (1.9%) | 2 (12.5%) |
| 18 to 34 Years | 2 (8.3%) | 0 (0.0%) |
| 35 to 64 Years | 1 (1.6%) | 1 (1.1%) |
| 65 to 74 Years | 0 (0.0%) | 0 (0.0%) |
| 75 Years and over | 0 (0.0%) | 0 (0.0%) |
Technology Access in McEwensville borough
Computing Device Access in McEwensville borough
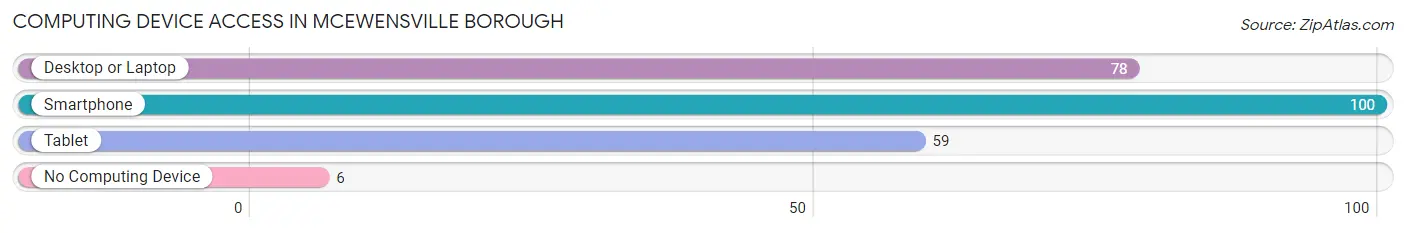
| Device Type | # Households | % Households |
| Desktop or Laptop | 78 | 66.1% |
| Smartphone | 100 | 84.8% |
| Tablet | 59 | 50.0% |
| No Computing Device | 6 | 5.1% |
| Total | 118 | 100.0% |
Internet Access in McEwensville borough
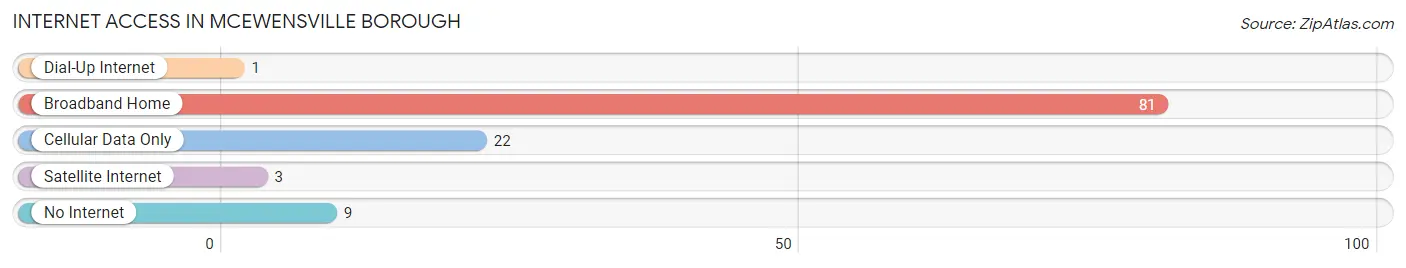
| Internet Type | # Households | % Households |
| Dial-Up Internet | 1 | 0.9% |
| Broadband Home | 81 | 68.6% |
| Cellular Data Only | 22 | 18.6% |
| Satellite Internet | 3 | 2.5% |
| No Internet | 9 | 7.6% |
| Total | 118 | 100.0% |
McEwensville borough Summary
Mcewensville Borough is a small borough located in Northumberland County, Pennsylvania. It is situated along the Susquehanna River, approximately 10 miles north of the city of Sunbury. The borough was incorporated in 1876 and has a population of approximately 500 people.
History
Mcewensville was originally known as “Mcewen’s Mill”, named after the first settler, John Mcewen, who arrived in the area in 1790. Mcewen built a grist mill on the banks of the Susquehanna River, which became the center of the community. The mill was a major source of employment for the area, and the town grew around it.
In 1876, the town was officially incorporated as Mcewensville Borough. The town was named after John Mcewen, and the name was changed to Mcewensville in 1883.
The town continued to grow and prosper throughout the 19th century. In 1891, the Mcewensville and Turbotville Railroad was built, connecting the town to the larger cities of Sunbury and Williamsport. This allowed for increased trade and commerce, and the town continued to grow.
In the early 20th century, the town experienced a period of decline. The railroad was abandoned in the 1920s, and the grist mill closed in the 1930s. The population of the town decreased, and the town fell into a period of stagnation.
In the late 20th century, the town experienced a resurgence. The grist mill was restored and reopened in the 1980s, and the town began to attract new businesses and residents. The population of the town has grown steadily since then, and the town is now a vibrant and thriving community.
Geography
Mcewensville is located in Northumberland County, Pennsylvania. It is situated along the Susquehanna River, approximately 10 miles north of the city of Sunbury. The borough covers an area of 0.6 square miles, and is bordered by Turbot Township to the north, East Chillisquaque Township to the east, and West Chillisquaque Township to the west.
The terrain of the borough is mostly flat, with some rolling hills. The Susquehanna River forms the western border of the borough, and the Mcewensville and Turbotville Railroad runs through the center of the town.
Economy
The economy of Mcewensville is largely based on agriculture and tourism. The town is home to several farms, which produce a variety of crops, including corn, soybeans, and hay. The town is also home to several small businesses, including a grocery store, a hardware store, and a restaurant.
The town is also a popular tourist destination. The restored grist mill is a popular attraction, and the town is home to several historic sites, including the Mcewensville and Turbotville Railroad Station and the Mcewensville Cemetery.
Demographics
As of the 2010 census, the population of Mcewensville was 498. The racial makeup of the town was 97.2% White, 0.6% African American, 0.2% Native American, 0.4% Asian, and 1.6% from other races. The median household income was $41,250, and the median family income was $50,000.
The town is served by the Mcewensville-Turbotville School District, which includes two elementary schools, a middle school, and a high school. The town is also home to several churches, including the Mcewensville United Methodist Church and the Mcewensville Presbyterian Church.
Common Questions
What is Per Capita Income in McEwensville borough?
Per Capita income in McEwensville borough is $25,682.
What is the Median Family Income in McEwensville borough?
Median Family Income in McEwensville borough is $71,786.
What is the Median Household income in McEwensville borough?
Median Household Income in McEwensville borough is $66,875.
What is Income or Wage Gap in McEwensville borough?
Income or Wage Gap in McEwensville borough is 48.9%.
Women in McEwensville borough earn 51.1 cents for every dollar earned by a man.
What is Inequality or Gini Index in McEwensville borough?
Inequality or Gini Index in McEwensville borough is 0.32.
What is the Total Population of McEwensville borough?
Total Population of McEwensville borough is 339.
What is the Total Male Population of McEwensville borough?
Total Male Population of McEwensville borough is 165.
What is the Total Female Population of McEwensville borough?
Total Female Population of McEwensville borough is 174.
What is the Ratio of Males per 100 Females in McEwensville borough?
There are 94.83 Males per 100 Females in McEwensville borough.
What is the Ratio of Females per 100 Males in McEwensville borough?
There are 105.45 Females per 100 Males in McEwensville borough.
What is the Median Population Age in McEwensville borough?
Median Population Age in McEwensville borough is 40.1 Years.
What is the Average Family Size in McEwensville borough
Average Family Size in McEwensville borough is 3.0 People.
What is the Average Household Size in McEwensville borough
Average Household Size in McEwensville borough is 2.7 People.
How Large is the Labor Force in McEwensville borough?
There are 164 People in the Labor Forcein in McEwensville borough.
What is the Percentage of People in the Labor Force in McEwensville borough?
59.6% of People are in the Labor Force in McEwensville borough.
What is the Unemployment Rate in McEwensville borough?
Unemployment Rate in McEwensville borough is 5.5%.