Wellersburg borough, PA Map & Demographics
Wellersburg borough Overview
$34,268
PER CAPITA INCOME
$53,750
AVG FAMILY INCOME
$51,250
AVG HOUSEHOLD INCOME
12.4%
WAGE / INCOME GAP [ % ]
87.6¢/ $1
WAGE / INCOME GAP [ $ ]
0.45
INEQUALITY / GINI INDEX
148
TOTAL POPULATION
71
MALE POPULATION
77
FEMALE POPULATION
92.21
MALES / 100 FEMALES
108.45
FEMALES / 100 MALES
50.0
MEDIAN AGE
2.7
AVG FAMILY SIZE
2.2
AVG HOUSEHOLD SIZE
70
LABOR FORCE [ PEOPLE ]
54.7%
PERCENT IN LABOR FORCE
1.4%
UNEMPLOYMENT RATE
Income in Wellersburg borough
Income Overview in Wellersburg borough
Per Capita Income in Wellersburg borough is $34,268, while median incomes of families and households are $53,750 and $51,250 respectively.
| Characteristic | Number | Measure |
| Per Capita Income | 148 | $34,268 |
| Median Family Income | 42 | $53,750 |
| Mean Family Income | 42 | $79,576 |
| Median Household Income | 67 | $51,250 |
| Mean Household Income | 67 | $71,172 |
| Income Deficit | 42 | $0 |
| Wage / Income Gap (%) | 148 | 12.38% |
| Wage / Income Gap ($) | 148 | 87.62¢ per $1 |
| Gini / Inequality Index | 148 | 0.45 |
Earnings by Sex in Wellersburg borough
Average Earnings in Wellersburg borough are $40,313, $43,750 for men and $38,333 for women, a difference of 12.4%.
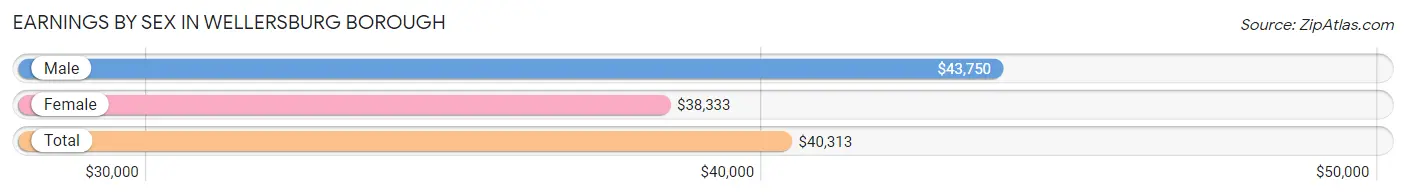
| Sex | Number | Average Earnings |
| Male | 31 (43.7%) | $43,750 |
| Female | 40 (56.3%) | $38,333 |
| Total | 71 (100.0%) | $40,313 |
Earnings by Sex by Income Bracket in Wellersburg borough
The most common earnings brackets in Wellersburg borough are $25,000 to $29,999 for men (6 | 19.4%) and $75,000 to $99,999 for women (8 | 20.0%).
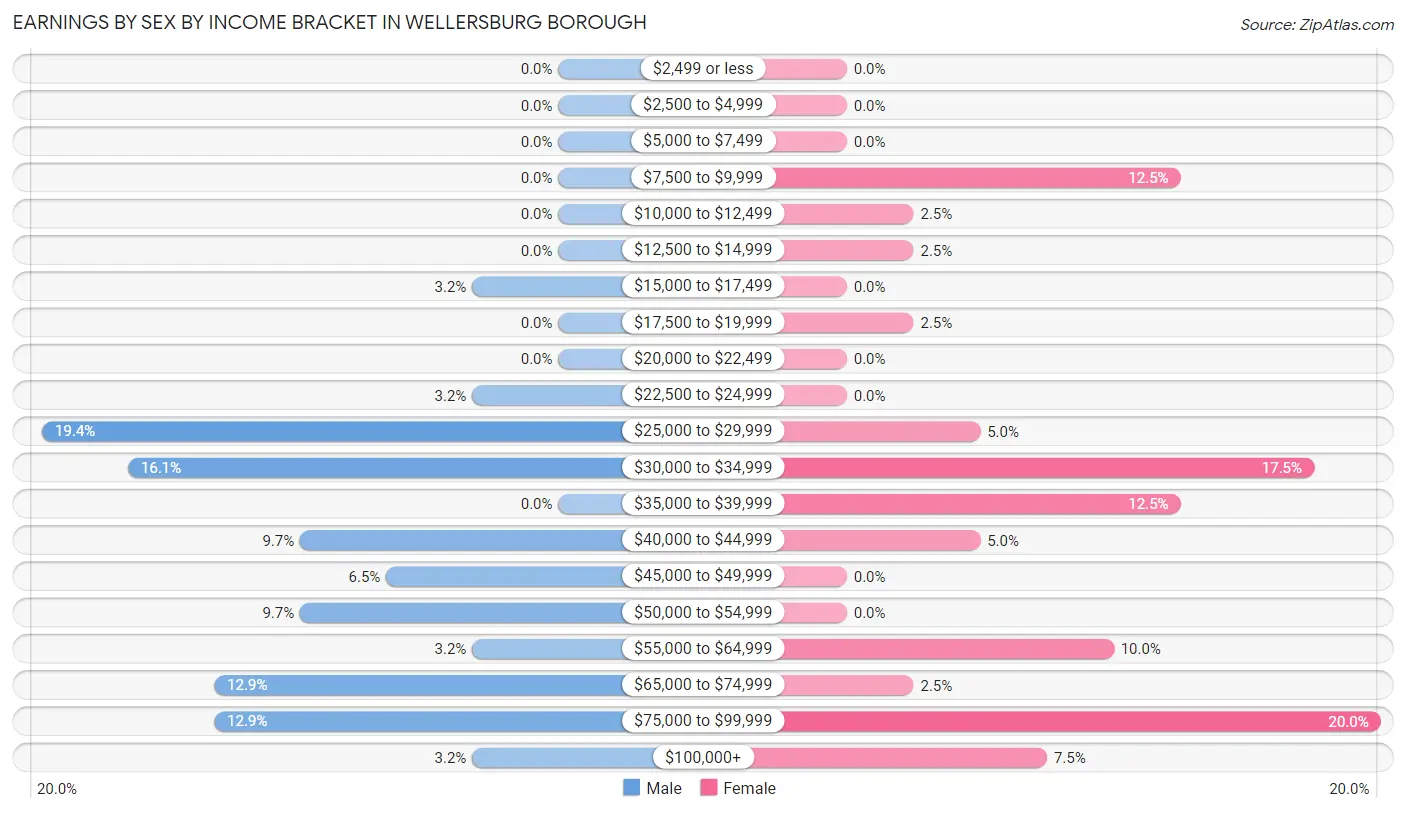
| Income | Male | Female |
| $2,499 or less | 0 (0.0%) | 0 (0.0%) |
| $2,500 to $4,999 | 0 (0.0%) | 0 (0.0%) |
| $5,000 to $7,499 | 0 (0.0%) | 0 (0.0%) |
| $7,500 to $9,999 | 0 (0.0%) | 5 (12.5%) |
| $10,000 to $12,499 | 0 (0.0%) | 1 (2.5%) |
| $12,500 to $14,999 | 0 (0.0%) | 1 (2.5%) |
| $15,000 to $17,499 | 1 (3.2%) | 0 (0.0%) |
| $17,500 to $19,999 | 0 (0.0%) | 1 (2.5%) |
| $20,000 to $22,499 | 0 (0.0%) | 0 (0.0%) |
| $22,500 to $24,999 | 1 (3.2%) | 0 (0.0%) |
| $25,000 to $29,999 | 6 (19.4%) | 2 (5.0%) |
| $30,000 to $34,999 | 5 (16.1%) | 7 (17.5%) |
| $35,000 to $39,999 | 0 (0.0%) | 5 (12.5%) |
| $40,000 to $44,999 | 3 (9.7%) | 2 (5.0%) |
| $45,000 to $49,999 | 2 (6.5%) | 0 (0.0%) |
| $50,000 to $54,999 | 3 (9.7%) | 0 (0.0%) |
| $55,000 to $64,999 | 1 (3.2%) | 4 (10.0%) |
| $65,000 to $74,999 | 4 (12.9%) | 1 (2.5%) |
| $75,000 to $99,999 | 4 (12.9%) | 8 (20.0%) |
| $100,000+ | 1 (3.2%) | 3 (7.5%) |
| Total | 31 (100.0%) | 40 (100.0%) |
Earnings by Sex by Educational Attainment in Wellersburg borough
Average earnings in Wellersburg borough are $45,000 for men and $40,000 for women, a difference of 11.1%. Men with an educational attainment of bachelor's degree enjoy the highest average annual earnings of $71,875, while those with high school diploma education earn the least with $41,250. Women with an educational attainment of graduate degree earn the most with the average annual earnings of $57,500, while those with graduate degree education have the smallest earnings of $57,500.
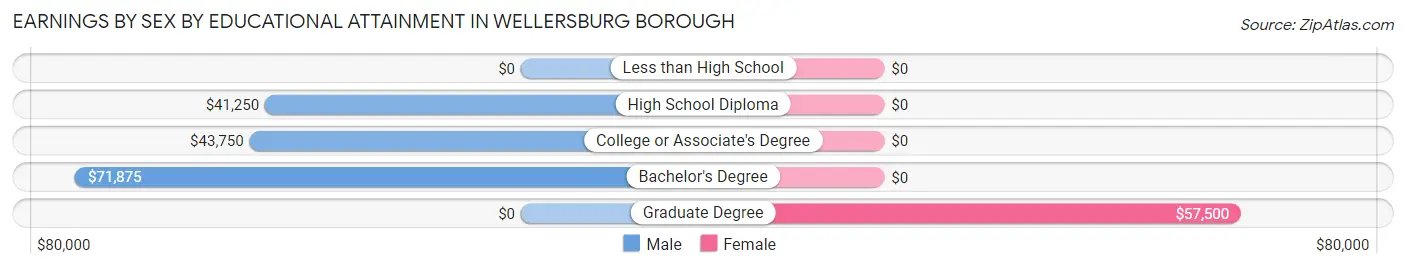
| Educational Attainment | Male Income | Female Income |
| Less than High School | - | - |
| High School Diploma | $41,250 | $0 |
| College or Associate's Degree | $43,750 | $0 |
| Bachelor's Degree | $71,875 | $0 |
| Graduate Degree | - | - |
| Total | $45,000 | $40,000 |
Family Income in Wellersburg borough
Family Income Brackets in Wellersburg borough
According to the Wellersburg borough family income data, there are 8 families falling into the $35,000 to $49,999 income range, which is the most common income bracket and makes up 19.1% of all families. Conversely, the less than $10,000 income bracket is the least frequent group with only 1 families (2.4%) belonging to this category.
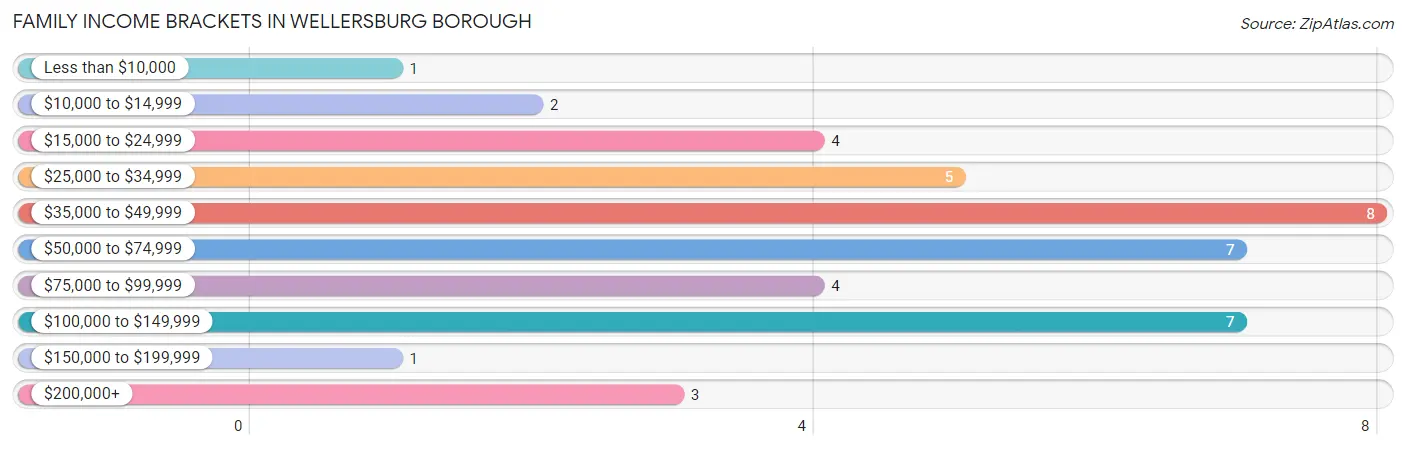
| Income Bracket | # Families | % Families |
| Less than $10,000 | 1 | 2.4% |
| $10,000 to $14,999 | 2 | 4.8% |
| $15,000 to $24,999 | 4 | 9.5% |
| $25,000 to $34,999 | 5 | 11.9% |
| $35,000 to $49,999 | 8 | 19.0% |
| $50,000 to $74,999 | 7 | 16.7% |
| $75,000 to $99,999 | 4 | 9.5% |
| $100,000 to $149,999 | 7 | 16.7% |
| $150,000 to $199,999 | 1 | 2.4% |
| $200,000+ | 3 | 7.1% |
Family Income by Famaliy Size in Wellersburg borough
2-person families (28 | 66.7%) account for the highest median family income in Wellersburg borough with $53,750 per family, while 2-person families (28 | 66.7%) have the highest median income of $26,875 per family member.
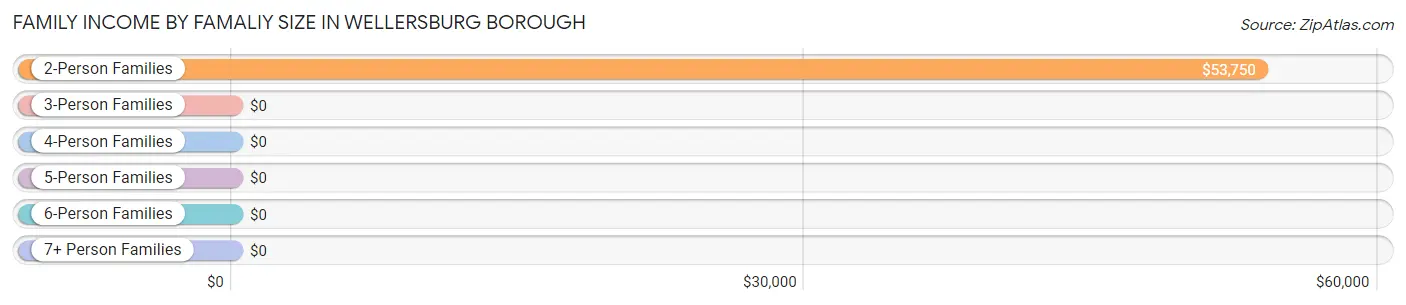
| Income Bracket | # Families | Median Income |
| 2-Person Families | 28 (66.7%) | $53,750 |
| 3-Person Families | 8 (19.1%) | $0 |
| 4-Person Families | 3 (7.1%) | $0 |
| 5-Person Families | 3 (7.1%) | $0 |
| 6-Person Families | 0 (0.0%) | $0 |
| 7+ Person Families | 0 (0.0%) | $0 |
| Total | 42 (100.0%) | $53,750 |
Family Income by Number of Earners in Wellersburg borough
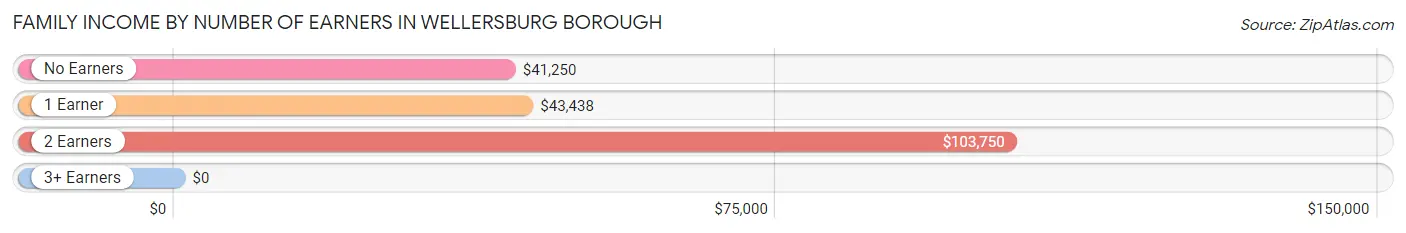
| Number of Earners | # Families | Median Income |
| No Earners | 11 (26.2%) | $41,250 |
| 1 Earner | 17 (40.5%) | $43,438 |
| 2 Earners | 13 (30.9%) | $103,750 |
| 3+ Earners | 1 (2.4%) | $0 |
| Total | 42 (100.0%) | $53,750 |
Household Income in Wellersburg borough
Household Income Brackets in Wellersburg borough
With 16 households falling in the category, the $15,000 to $24,999 income range is the most frequent in Wellersburg borough, accounting for 23.9% of all households.
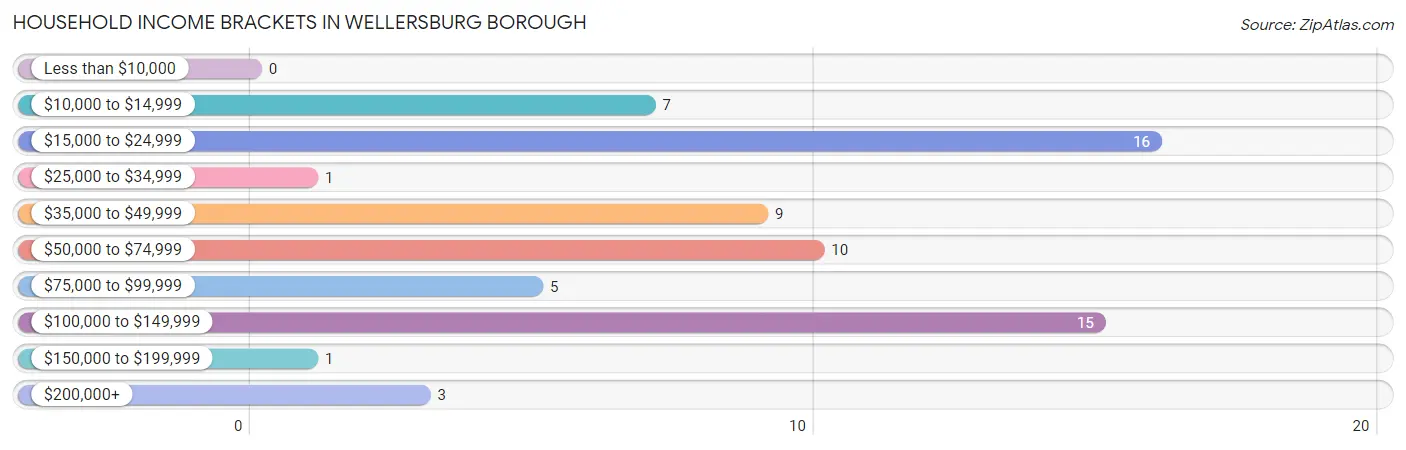
| Income Bracket | # Households | % Households |
| Less than $10,000 | 0 | 0.0% |
| $10,000 to $14,999 | 7 | 10.4% |
| $15,000 to $24,999 | 16 | 23.9% |
| $25,000 to $34,999 | 1 | 1.5% |
| $35,000 to $49,999 | 9 | 13.4% |
| $50,000 to $74,999 | 10 | 14.9% |
| $75,000 to $99,999 | 5 | 7.5% |
| $100,000 to $149,999 | 15 | 22.4% |
| $150,000 to $199,999 | 1 | 1.5% |
| $200,000+ | 3 | 4.5% |
Household Income by Householder Age in Wellersburg borough
The median household income in Wellersburg borough is $51,250, with the highest median household income of $115,313 found in the 25 to 44 years age bracket for the primary householder. A total of 15 households (22.4%) fall into this category.
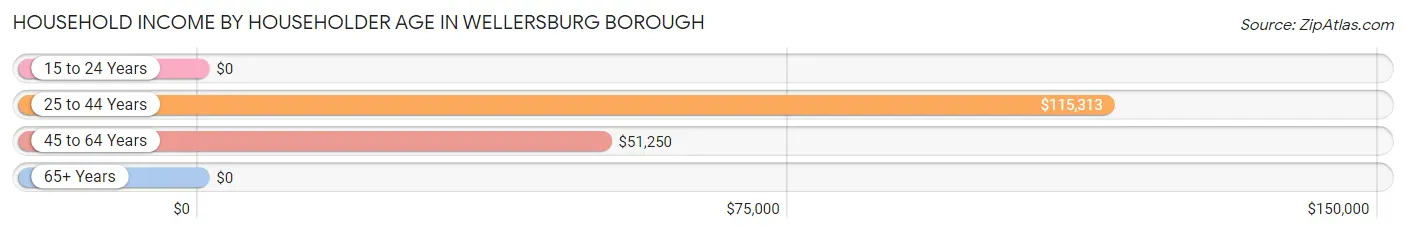
| Income Bracket | # Households | Median Income |
| 15 to 24 Years | 0 (0.0%) | $0 |
| 25 to 44 Years | 15 (22.4%) | $115,313 |
| 45 to 64 Years | 26 (38.8%) | $51,250 |
| 65+ Years | 26 (38.8%) | $0 |
| Total | 67 (100.0%) | $51,250 |
Poverty in Wellersburg borough
Income Below Poverty by Sex and Age in Wellersburg borough
With 11.3% poverty level for males and 7.8% for females among the residents of Wellersburg borough, 65 to 74 year old males and 12 to 14 year old females are the most vulnerable to poverty, with 7 males (43.8%) and 1 females (100.0%) in their respective age groups living below the poverty level.
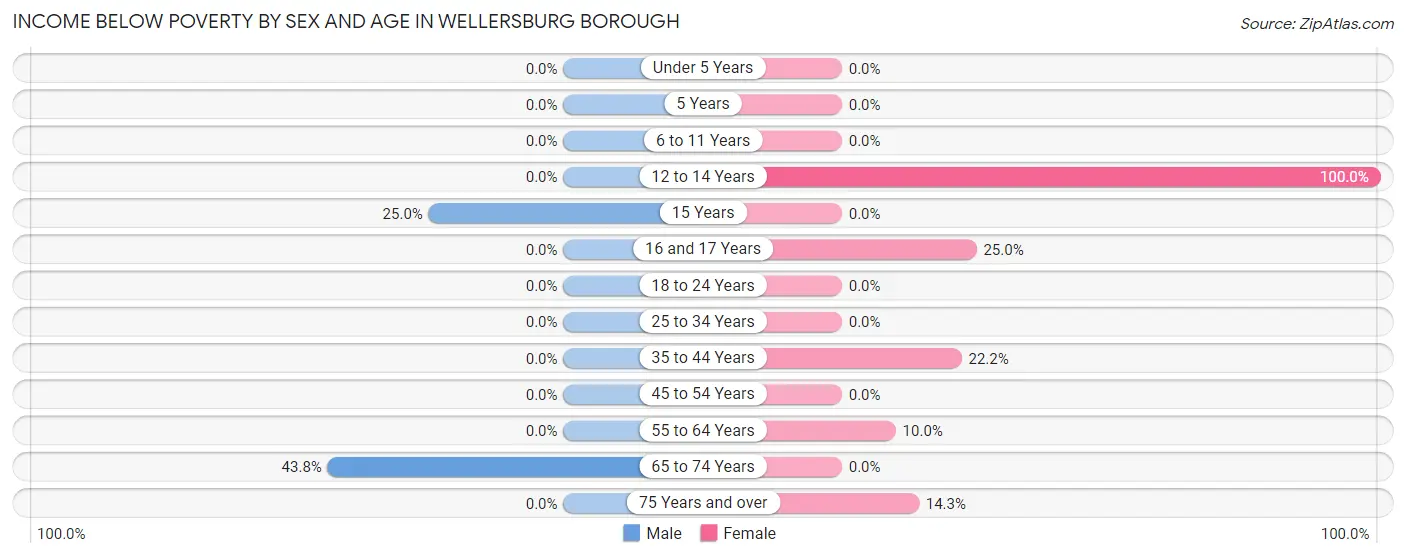
| Age Bracket | Male | Female |
| Under 5 Years | 0 (0.0%) | 0 (0.0%) |
| 5 Years | 0 (0.0%) | 0 (0.0%) |
| 6 to 11 Years | 0 (0.0%) | 0 (0.0%) |
| 12 to 14 Years | 0 (0.0%) | 1 (100.0%) |
| 15 Years | 1 (25.0%) | 0 (0.0%) |
| 16 and 17 Years | 0 (0.0%) | 1 (25.0%) |
| 18 to 24 Years | 0 (0.0%) | 0 (0.0%) |
| 25 to 34 Years | 0 (0.0%) | 0 (0.0%) |
| 35 to 44 Years | 0 (0.0%) | 2 (22.2%) |
| 45 to 54 Years | 0 (0.0%) | 0 (0.0%) |
| 55 to 64 Years | 0 (0.0%) | 1 (10.0%) |
| 65 to 74 Years | 7 (43.8%) | 0 (0.0%) |
| 75 Years and over | 0 (0.0%) | 1 (14.3%) |
| Total | 8 (11.3%) | 6 (7.8%) |
Income Above Poverty by Sex and Age in Wellersburg borough
According to the poverty statistics in Wellersburg borough, males aged under 5 years and females aged under 5 years are the age groups that are most secure financially, with 100.0% of males and 100.0% of females in these age groups living above the poverty line.
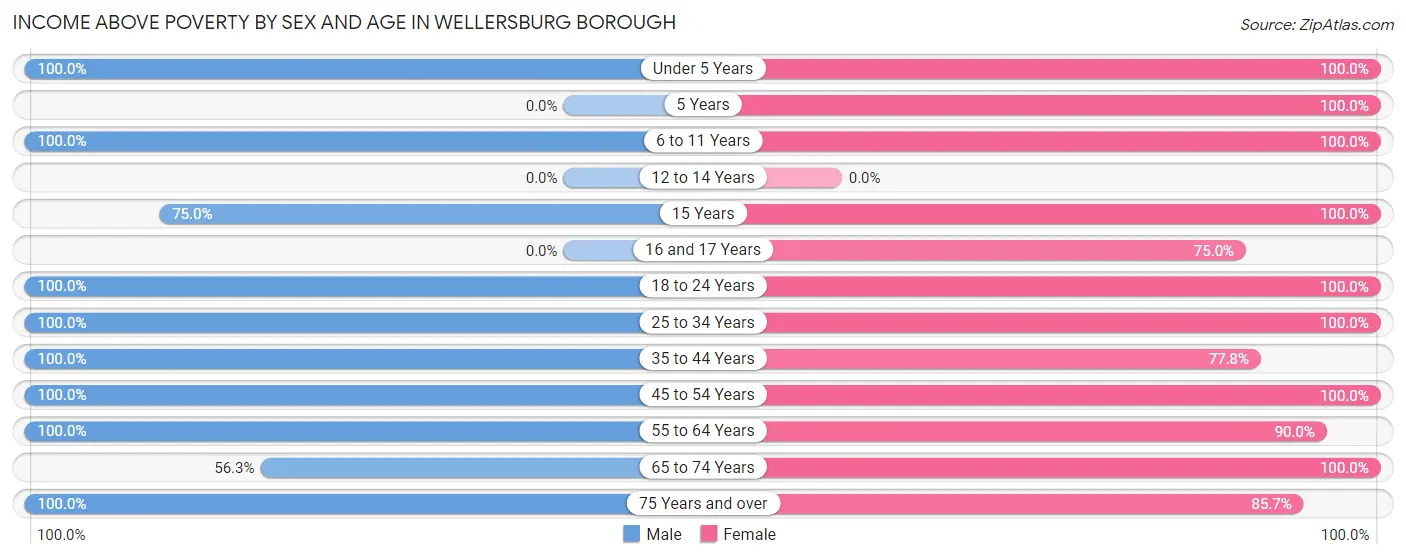
| Age Bracket | Male | Female |
| Under 5 Years | 1 (100.0%) | 4 (100.0%) |
| 5 Years | 0 (0.0%) | 2 (100.0%) |
| 6 to 11 Years | 2 (100.0%) | 5 (100.0%) |
| 12 to 14 Years | 0 (0.0%) | 0 (0.0%) |
| 15 Years | 3 (75.0%) | 1 (100.0%) |
| 16 and 17 Years | 0 (0.0%) | 3 (75.0%) |
| 18 to 24 Years | 1 (100.0%) | 3 (100.0%) |
| 25 to 34 Years | 8 (100.0%) | 7 (100.0%) |
| 35 to 44 Years | 5 (100.0%) | 7 (77.8%) |
| 45 to 54 Years | 21 (100.0%) | 11 (100.0%) |
| 55 to 64 Years | 8 (100.0%) | 9 (90.0%) |
| 65 to 74 Years | 9 (56.2%) | 13 (100.0%) |
| 75 Years and over | 5 (100.0%) | 6 (85.7%) |
| Total | 63 (88.7%) | 71 (92.2%) |
Income Below Poverty Among Married-Couple Families in Wellersburg borough
The poverty statistics for married-couple families in Wellersburg borough show that 2.9% or 1 of the total 35 families live below the poverty line. Families with no children have the highest poverty rate of 3.7%, comprising of 1 families. On the other hand, families with 1 or 2 children have the lowest poverty rate of 0.0%, which includes 0 families.
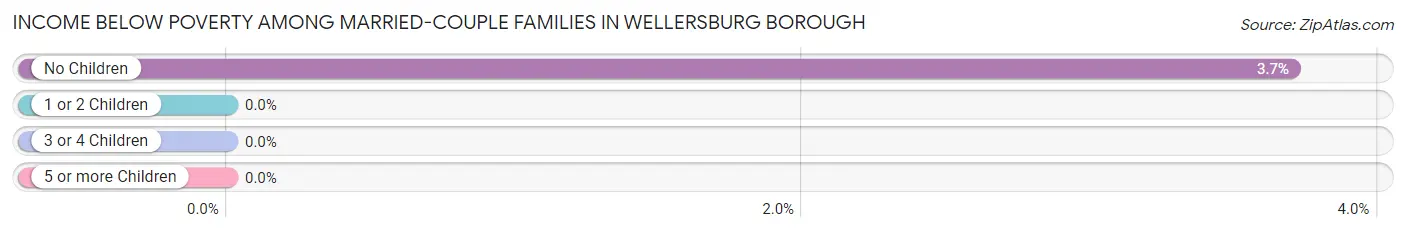
| Children | Above Poverty | Below Poverty |
| No Children | 26 (96.3%) | 1 (3.7%) |
| 1 or 2 Children | 6 (100.0%) | 0 (0.0%) |
| 3 or 4 Children | 2 (100.0%) | 0 (0.0%) |
| 5 or more Children | 0 (0.0%) | 0 (0.0%) |
| Total | 34 (97.1%) | 1 (2.9%) |
Income Below Poverty Among Single-Parent Households in Wellersburg borough
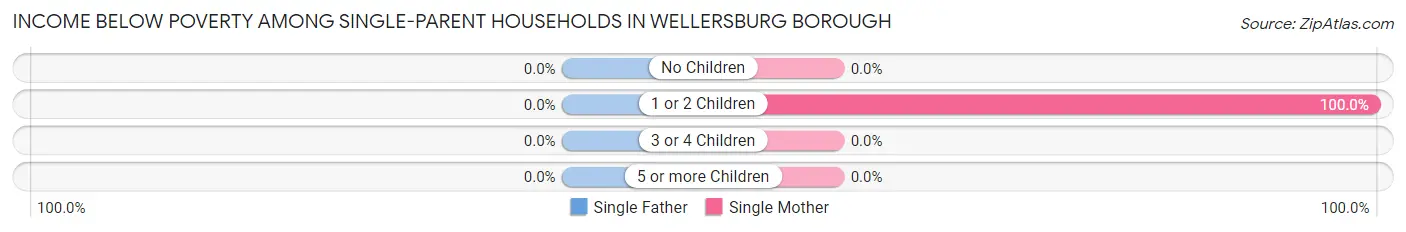
| Children | Single Father | Single Mother |
| No Children | 0 (0.0%) | 0 (0.0%) |
| 1 or 2 Children | 0 (0.0%) | 2 (100.0%) |
| 3 or 4 Children | 0 (0.0%) | 0 (0.0%) |
| 5 or more Children | 0 (0.0%) | 0 (0.0%) |
| Total | 0 (0.0%) | 2 (100.0%) |
Income Below Poverty Among Married-Couple vs Single-Parent Households in Wellersburg borough
The poverty data for Wellersburg borough shows that 1 of the married-couple family households (2.9%) and 2 of the single-parent households (28.6%) are living below the poverty level. Within the married-couple family households, those with no children have the highest poverty rate, with 1 households (3.7%) falling below the poverty line. Among the single-parent households, those with 1 or 2 children have the highest poverty rate, with 2 household (28.6%) living below poverty.
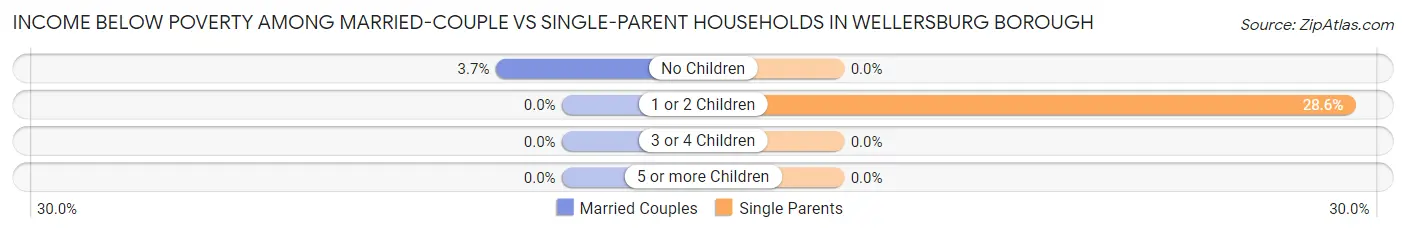
| Children | Married-Couple Families | Single-Parent Households |
| No Children | 1 (3.7%) | 0 (0.0%) |
| 1 or 2 Children | 0 (0.0%) | 2 (28.6%) |
| 3 or 4 Children | 0 (0.0%) | 0 (0.0%) |
| 5 or more Children | 0 (0.0%) | 0 (0.0%) |
| Total | 1 (2.9%) | 2 (28.6%) |
Race in Wellersburg borough
The most populous races in Wellersburg borough are White / Caucasian (146 | 98.7%), and Two or more Races (2 | 1.3%).
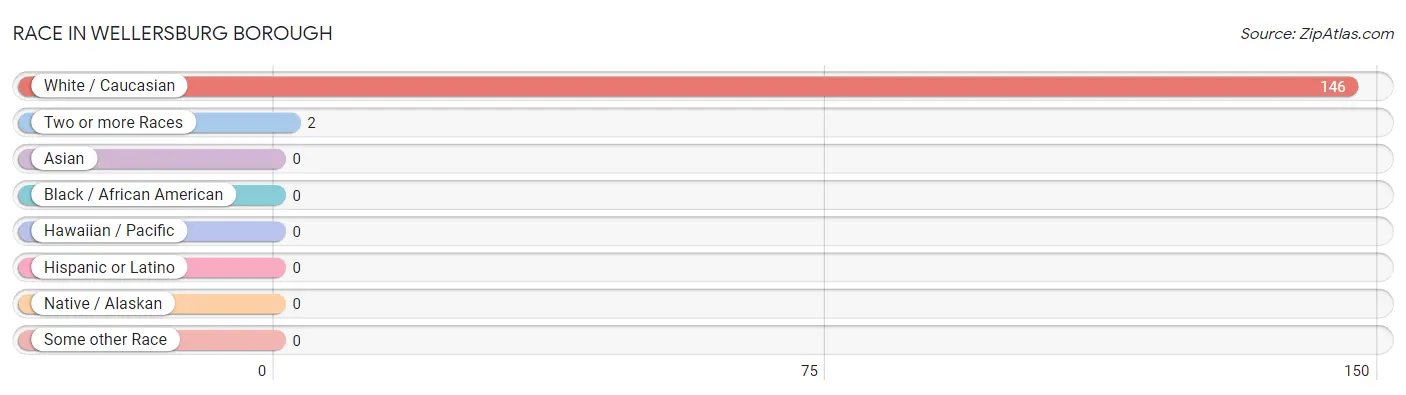
| Race | # Population | % Population |
| Asian | 0 | 0.0% |
| Black / African American | 0 | 0.0% |
| Hawaiian / Pacific | 0 | 0.0% |
| Hispanic or Latino | 0 | 0.0% |
| Native / Alaskan | 0 | 0.0% |
| White / Caucasian | 146 | 98.7% |
| Two or more Races | 2 | 1.3% |
| Some other Race | 0 | 0.0% |
| Total | 148 | 100.0% |
Ancestry in Wellersburg borough
The most populous ancestries reported in Wellersburg borough are German (58 | 39.2%), English (20 | 13.5%), Irish (14 | 9.5%), Italian (11 | 7.4%), and French (10 | 6.8%), together accounting for 76.4% of all Wellersburg borough residents.
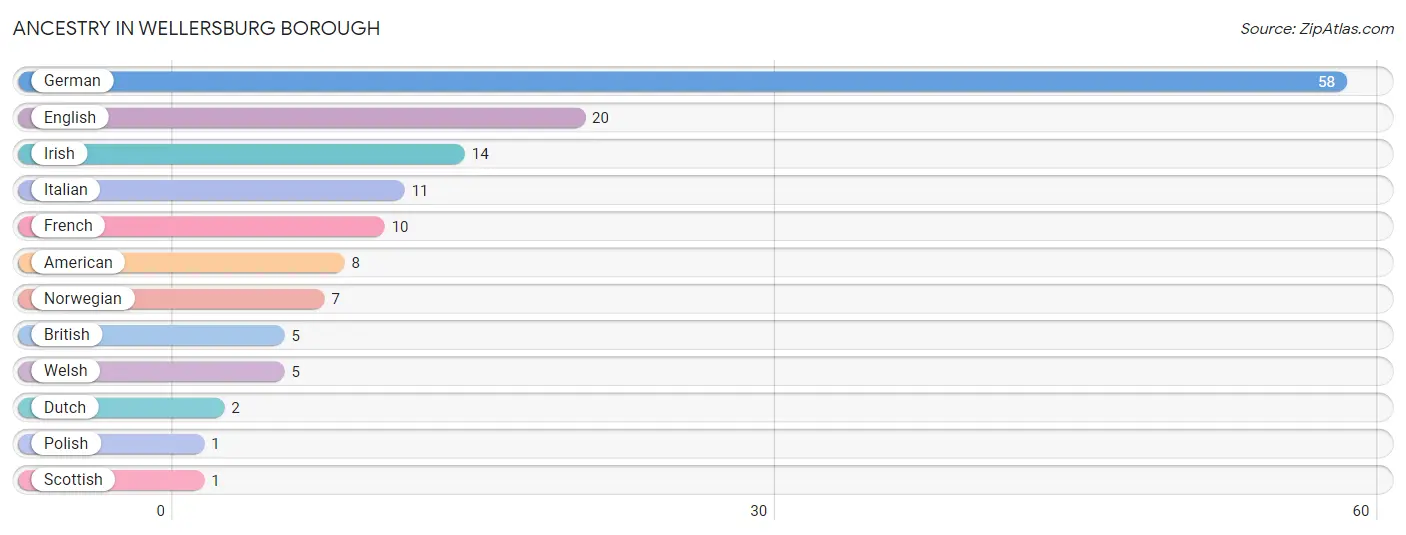
| Ancestry | # Population | % Population |
| American | 8 | 5.4% |
| British | 5 | 3.4% |
| Dutch | 2 | 1.3% |
| English | 20 | 13.5% |
| French | 10 | 6.8% |
| German | 58 | 39.2% |
| Irish | 14 | 9.5% |
| Italian | 11 | 7.4% |
| Norwegian | 7 | 4.7% |
| Polish | 1 | 0.7% |
| Scottish | 1 | 0.7% |
| Welsh | 5 | 3.4% | View All 12 Rows |
Immigrants in Wellersburg borough

| Immigration Origin | # Population | % Population | View All 0 Rows |
Sex and Age in Wellersburg borough
Sex and Age in Wellersburg borough
The most populous age groups in Wellersburg borough are 45 to 49 Years (11 | 15.5%) for men and 65 to 69 Years (8 | 10.4%) for women.
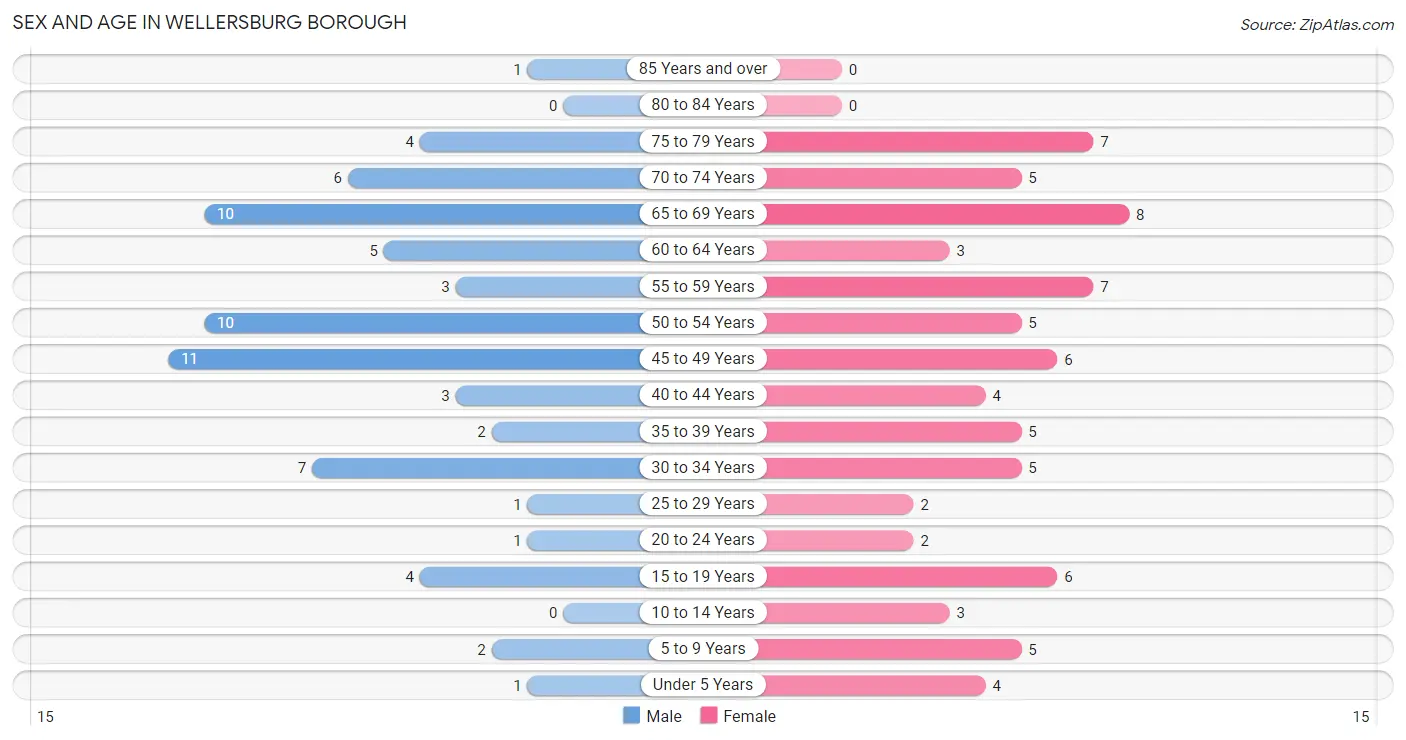
| Age Bracket | Male | Female |
| Under 5 Years | 1 (1.4%) | 4 (5.2%) |
| 5 to 9 Years | 2 (2.8%) | 5 (6.5%) |
| 10 to 14 Years | 0 (0.0%) | 3 (3.9%) |
| 15 to 19 Years | 4 (5.6%) | 6 (7.8%) |
| 20 to 24 Years | 1 (1.4%) | 2 (2.6%) |
| 25 to 29 Years | 1 (1.4%) | 2 (2.6%) |
| 30 to 34 Years | 7 (9.9%) | 5 (6.5%) |
| 35 to 39 Years | 2 (2.8%) | 5 (6.5%) |
| 40 to 44 Years | 3 (4.2%) | 4 (5.2%) |
| 45 to 49 Years | 11 (15.5%) | 6 (7.8%) |
| 50 to 54 Years | 10 (14.1%) | 5 (6.5%) |
| 55 to 59 Years | 3 (4.2%) | 7 (9.1%) |
| 60 to 64 Years | 5 (7.0%) | 3 (3.9%) |
| 65 to 69 Years | 10 (14.1%) | 8 (10.4%) |
| 70 to 74 Years | 6 (8.5%) | 5 (6.5%) |
| 75 to 79 Years | 4 (5.6%) | 7 (9.1%) |
| 80 to 84 Years | 0 (0.0%) | 0 (0.0%) |
| 85 Years and over | 1 (1.4%) | 0 (0.0%) |
| Total | 71 (100.0%) | 77 (100.0%) |
Families and Households in Wellersburg borough
Median Family Size in Wellersburg borough
The median family size in Wellersburg borough is 2.69 persons per family, with married-couple families (35 | 83.3%) accounting for the largest median family size of 2.71 persons per family. On the other hand, single female/mother families (2 | 4.8%) represent the smallest median family size with 2.50 persons per family.
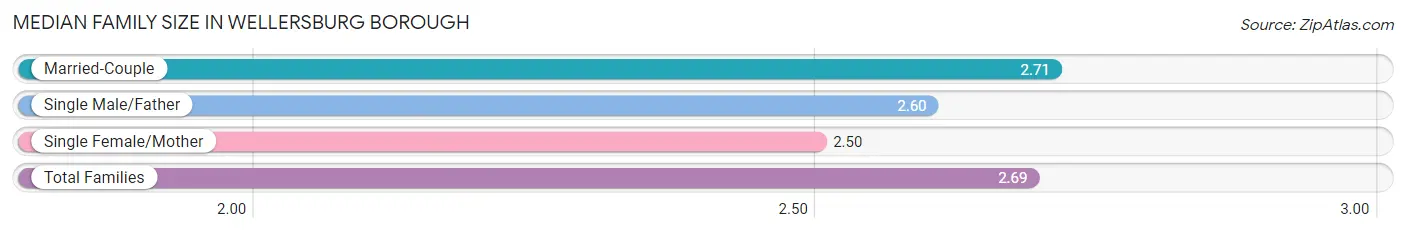
| Family Type | # Families | Family Size |
| Married-Couple | 35 (83.3%) | 2.71 |
| Single Male/Father | 5 (11.9%) | 2.60 |
| Single Female/Mother | 2 (4.8%) | 2.50 |
| Total Families | 42 (100.0%) | 2.69 |
Median Household Size in Wellersburg borough
The median household size in Wellersburg borough is 2.21 persons per household, with single male/father households (5 | 7.5%) accounting for the largest median household size of 3.6 persons per household. non-family households (25 | 37.3%) represent the smallest median household size with 1.16 persons per household.
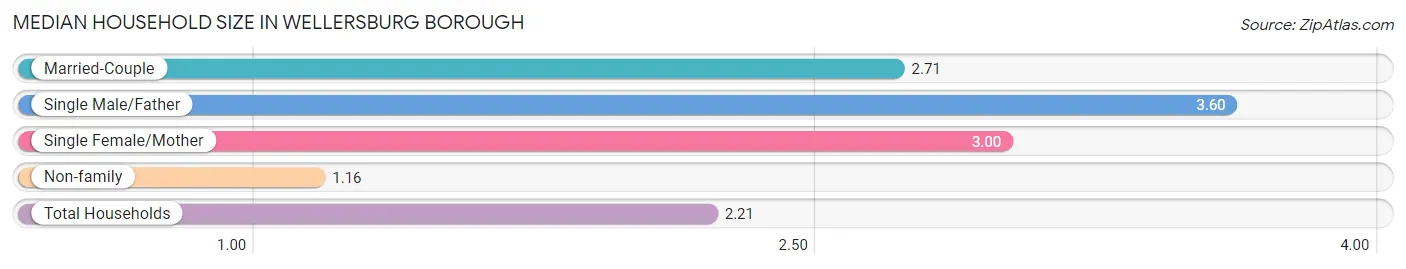
| Household Type | # Households | Household Size |
| Married-Couple | 35 (52.2%) | 2.71 |
| Single Male/Father | 5 (7.5%) | 3.60 |
| Single Female/Mother | 2 (3.0%) | 3.00 |
| Non-family | 25 (37.3%) | 1.16 |
| Total Households | 67 (100.0%) | 2.21 |
Household Size by Marriage Status in Wellersburg borough
Out of a total of 67 households in Wellersburg borough, 42 (62.7%) are family households, while 25 (37.3%) are nonfamily households. The most numerous type of family households are 2-person households, comprising 26, and the most common type of nonfamily households are 1-person households, comprising 19.
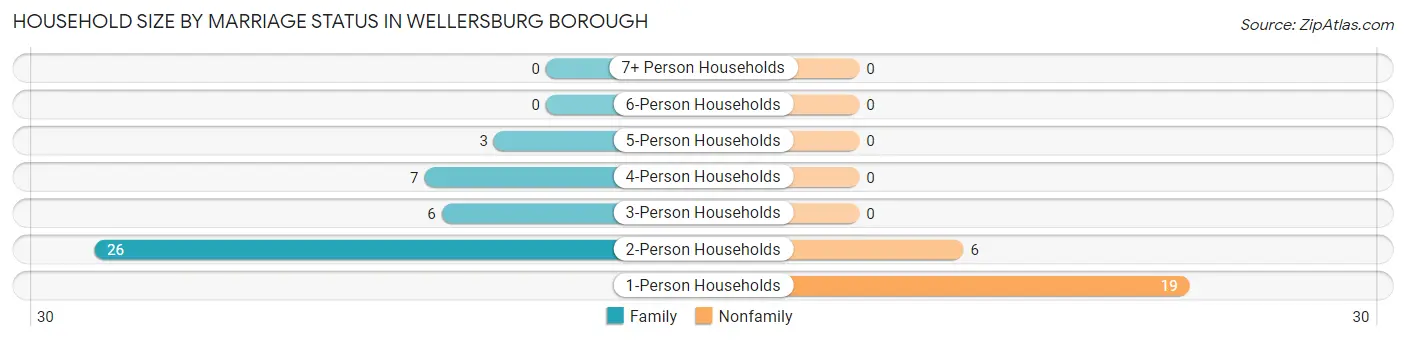
| Household Size | Family Households | Nonfamily Households |
| 1-Person Households | - | 19 (28.4%) |
| 2-Person Households | 26 (38.8%) | 6 (9.0%) |
| 3-Person Households | 6 (9.0%) | 0 (0.0%) |
| 4-Person Households | 7 (10.4%) | 0 (0.0%) |
| 5-Person Households | 3 (4.5%) | 0 (0.0%) |
| 6-Person Households | 0 (0.0%) | 0 (0.0%) |
| 7+ Person Households | 0 (0.0%) | 0 (0.0%) |
| Total | 42 (62.7%) | 25 (37.3%) |
Female Fertility in Wellersburg borough
Fertility by Age in Wellersburg borough
| Age Bracket | Women with Births | Births / 1,000 Women |
| 15 to 19 years | 0 (0.0%) | 0.0 |
| 20 to 34 years | 0 (0.0%) | 0.0 |
| 35 to 50 years | 0 (0.0%) | 0.0 |
| Total | 0 (0.0%) | 0.0 |
Fertility by Age by Marriage Status in Wellersburg borough
| Age Bracket | Married | Unmarried |
| 15 to 19 years | 0 (0.0%) | 0 (0.0%) |
| 20 to 34 years | 0 (0.0%) | 0 (0.0%) |
| 35 to 50 years | 0 (0.0%) | 0 (0.0%) |
| Total | 0 (0.0%) | 0 (0.0%) |
Fertility by Education in Wellersburg borough
| Educational Attainment | Women with Births | Births / 1,000 Women |
| Less than High School | 0 (0.0%) | 0.0 |
| High School Diploma | 0 (0.0%) | 0.0 |
| College or Associate's Degree | 0 (0.0%) | 0.0 |
| Bachelor's Degree | 0 (0.0%) | 0.0 |
| Graduate Degree | 0 (0.0%) | 0.0 |
| Total | 0 (0.0%) | 0.0 |
Fertility by Education by Marriage Status in Wellersburg borough
| Educational Attainment | Married | Unmarried |
| Less than High School | 0 (0.0%) | 0 (0.0%) |
| High School Diploma | 0 (0.0%) | 0 (0.0%) |
| College or Associate's Degree | 0 (0.0%) | 0 (0.0%) |
| Bachelor's Degree | 0 (0.0%) | 0 (0.0%) |
| Graduate Degree | 0 (0.0%) | 0 (0.0%) |
| Total | 0 (0.0%) | 0 (0.0%) |
Employment Characteristics in Wellersburg borough
Employment by Class of Employer in Wellersburg borough
Among the 65 employed individuals in Wellersburg borough, private company employees (36 | 55.4%), not-for-profit organizations (17 | 26.2%), and state government employees (5 | 7.7%) make up the most common classes of employment.
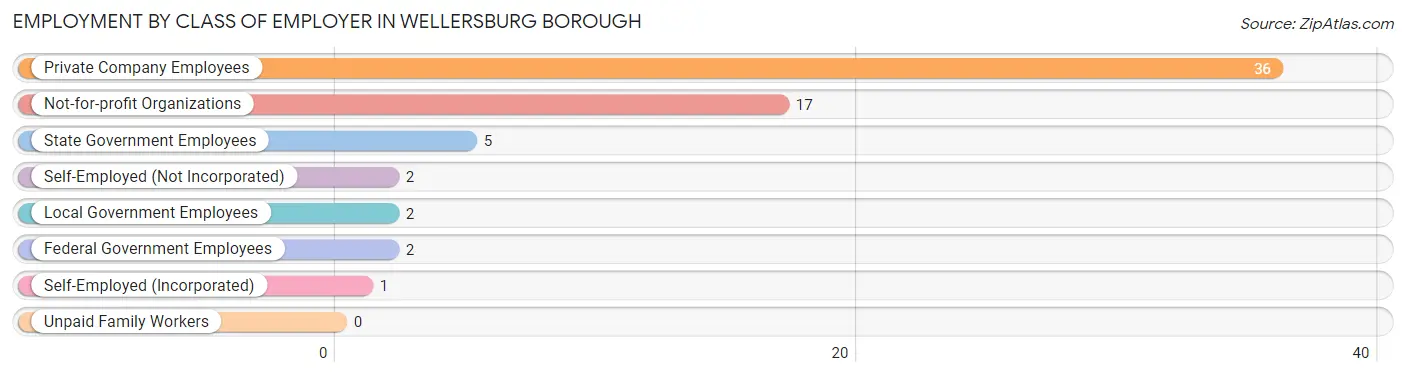
| Employer Class | # Employees | % Employees |
| Private Company Employees | 36 | 55.4% |
| Self-Employed (Incorporated) | 1 | 1.5% |
| Self-Employed (Not Incorporated) | 2 | 3.1% |
| Not-for-profit Organizations | 17 | 26.2% |
| Local Government Employees | 2 | 3.1% |
| State Government Employees | 5 | 7.7% |
| Federal Government Employees | 2 | 3.1% |
| Unpaid Family Workers | 0 | 0.0% |
| Total | 65 | 100.0% |
Employment Status by Age in Wellersburg borough
According to the labor force statistics for Wellersburg borough, out of the total population over 16 years of age (128), 54.7% or 70 individuals are in the labor force, with 1.4% or 1 of them unemployed. The age group with the highest labor force participation rate is 20 to 24 years, with 100.0% or 3 individuals in the labor force. Within the labor force, the 35 to 44 years age range has the highest percentage of unemployed individuals, with 7.1% or 1 of them being unemployed.
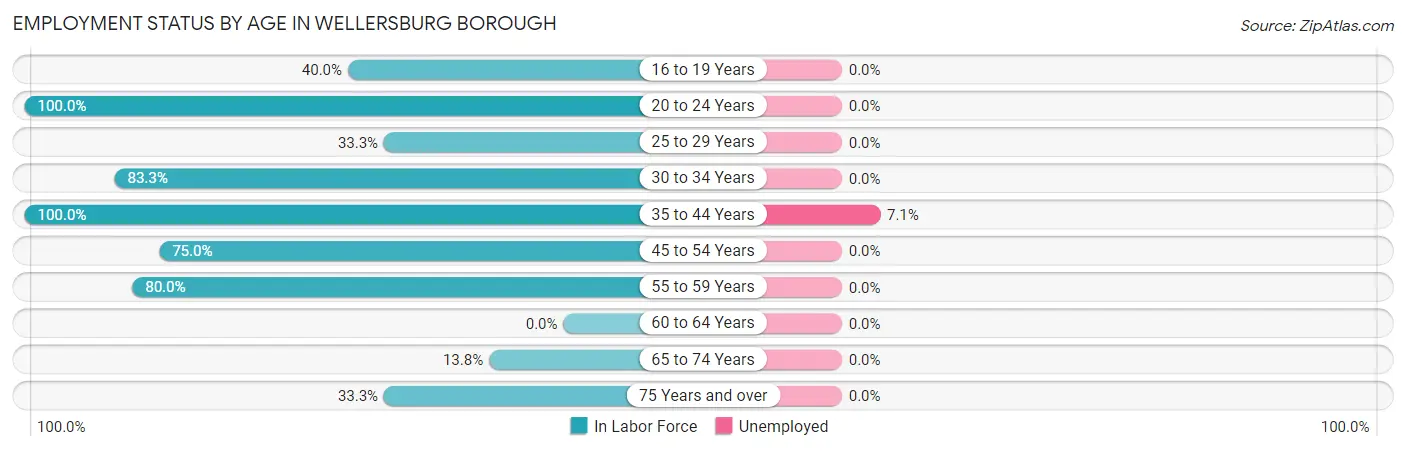
| Age Bracket | In Labor Force | Unemployed |
| 16 to 19 Years | 2 (40.0%) | 0 (0.0%) |
| 20 to 24 Years | 3 (100.0%) | 0 (0.0%) |
| 25 to 29 Years | 1 (33.3%) | 0 (0.0%) |
| 30 to 34 Years | 10 (83.3%) | 0 (0.0%) |
| 35 to 44 Years | 14 (100.0%) | 1 (7.1%) |
| 45 to 54 Years | 24 (75.0%) | 0 (0.0%) |
| 55 to 59 Years | 8 (80.0%) | 0 (0.0%) |
| 60 to 64 Years | 0 (0.0%) | 0 (0.0%) |
| 65 to 74 Years | 4 (13.8%) | 0 (0.0%) |
| 75 Years and over | 4 (33.3%) | 0 (0.0%) |
| Total | 70 (54.7%) | 1 (1.4%) |
Employment Status by Educational Attainment in Wellersburg borough
According to labor force statistics for Wellersburg borough, 72.2% of individuals (57) out of the total population between 25 and 64 years of age (79) are in the labor force, with 1.8% or 1 of them being unemployed. The group with the highest labor force participation rate are those with the educational attainment of bachelor's degree or higher, with 81.3% or 13 individuals in the labor force. Within the labor force, individuals with high school diploma education have the highest percentage of unemployment, with 4.0% or 1 of them being unemployed.
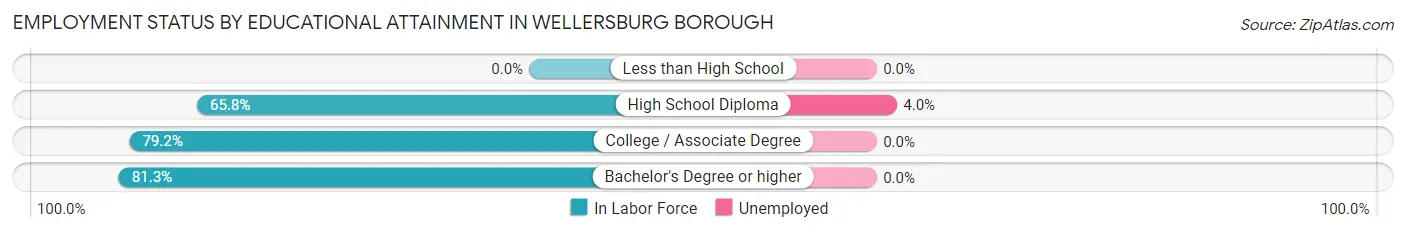
| Educational Attainment | In Labor Force | Unemployed |
| Less than High School | 0 (0.0%) | 0 (0.0%) |
| High School Diploma | 25 (65.8%) | 2 (4.0%) |
| College / Associate Degree | 19 (79.2%) | 0 (0.0%) |
| Bachelor's Degree or higher | 13 (81.3%) | 0 (0.0%) |
| Total | 57 (72.2%) | 1 (1.8%) |
Employment Occupations by Sex in Wellersburg borough
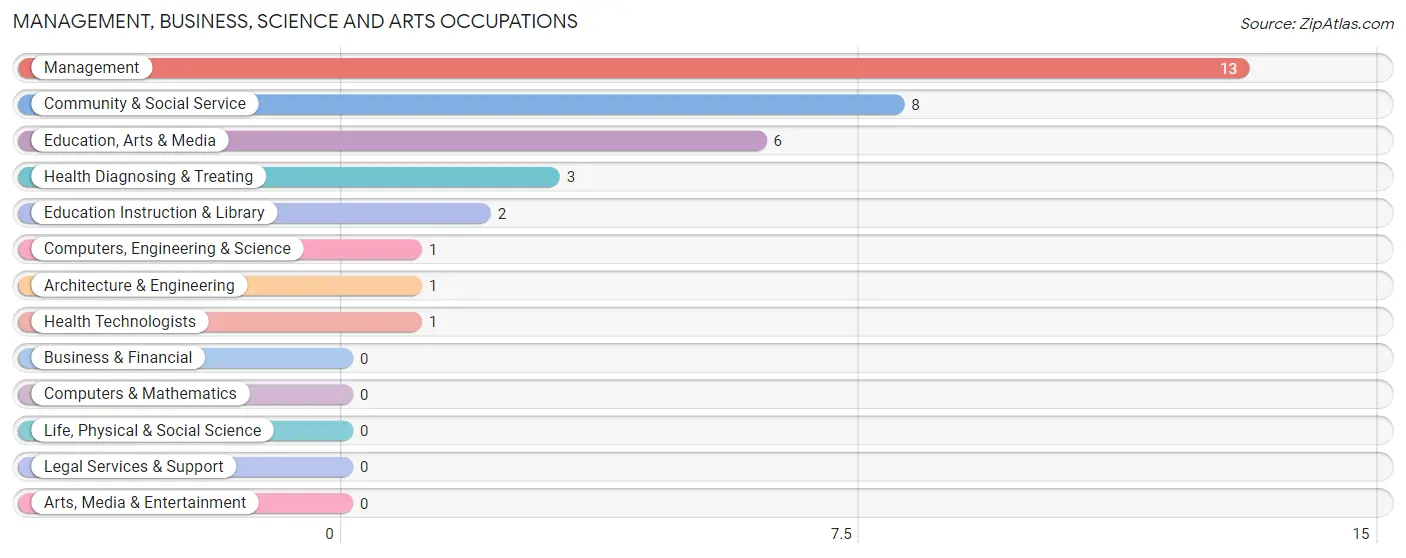
Management, Business, Science and Arts Occupations
The most common Management, Business, Science and Arts occupations in Wellersburg borough are Management (13 | 18.8%), Community & Social Service (8 | 11.6%), Education, Arts & Media (6 | 8.7%), Health Diagnosing & Treating (3 | 4.3%), and Education Instruction & Library (2 | 2.9%).
Management, Business, Science and Arts Occupations by Sex
Within the Management, Business, Science and Arts occupations in Wellersburg borough, the most male-oriented occupations are Computers, Engineering & Science (100.0%), Architecture & Engineering (100.0%), and Management (30.8%), while the most female-oriented occupations are Community & Social Service (100.0%), Education, Arts & Media (100.0%), and Education Instruction & Library (100.0%).
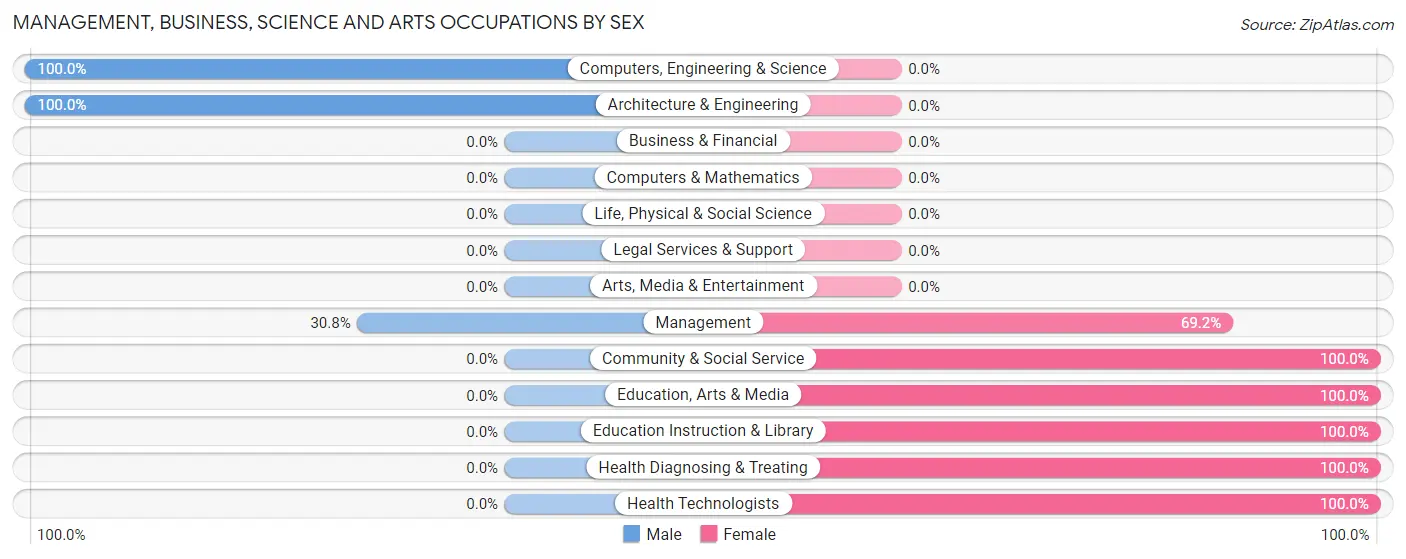
| Occupation | Male | Female |
| Management | 4 (30.8%) | 9 (69.2%) |
| Business & Financial | 0 (0.0%) | 0 (0.0%) |
| Computers, Engineering & Science | 1 (100.0%) | 0 (0.0%) |
| Computers & Mathematics | 0 (0.0%) | 0 (0.0%) |
| Architecture & Engineering | 1 (100.0%) | 0 (0.0%) |
| Life, Physical & Social Science | 0 (0.0%) | 0 (0.0%) |
| Community & Social Service | 0 (0.0%) | 8 (100.0%) |
| Education, Arts & Media | 0 (0.0%) | 6 (100.0%) |
| Legal Services & Support | 0 (0.0%) | 0 (0.0%) |
| Education Instruction & Library | 0 (0.0%) | 2 (100.0%) |
| Arts, Media & Entertainment | 0 (0.0%) | 0 (0.0%) |
| Health Diagnosing & Treating | 0 (0.0%) | 3 (100.0%) |
| Health Technologists | 0 (0.0%) | 1 (100.0%) |
| Total (Category) | 5 (20.0%) | 20 (80.0%) |
| Total (Overall) | 29 (42.0%) | 40 (58.0%) |
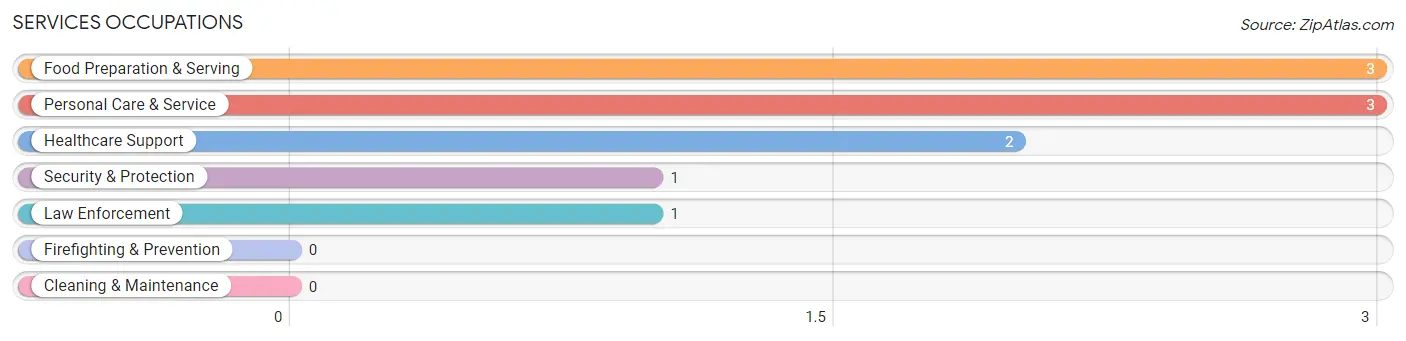
Services Occupations
The most common Services occupations in Wellersburg borough are Food Preparation & Serving (3 | 4.3%), Personal Care & Service (3 | 4.3%), Healthcare Support (2 | 2.9%), Security & Protection (1 | 1.5%), and Law Enforcement (1 | 1.5%).
Services Occupations by Sex
Within the Services occupations in Wellersburg borough, the most male-oriented occupations are Security & Protection (100.0%), Law Enforcement (100.0%), and Food Preparation & Serving (66.7%), while the most female-oriented occupations are Healthcare Support (100.0%), Personal Care & Service (100.0%), and Food Preparation & Serving (33.3%).
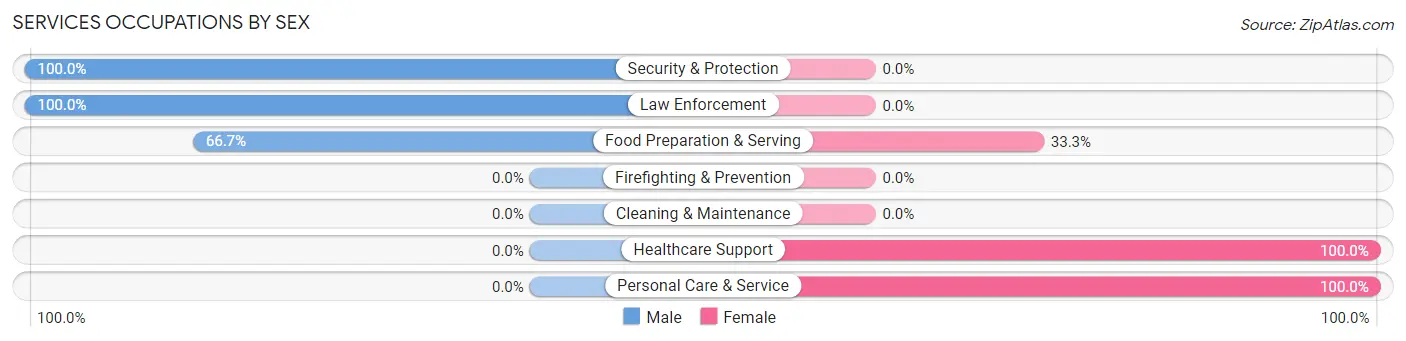
| Occupation | Male | Female |
| Healthcare Support | 0 (0.0%) | 2 (100.0%) |
| Security & Protection | 1 (100.0%) | 0 (0.0%) |
| Firefighting & Prevention | 0 (0.0%) | 0 (0.0%) |
| Law Enforcement | 1 (100.0%) | 0 (0.0%) |
| Food Preparation & Serving | 2 (66.7%) | 1 (33.3%) |
| Cleaning & Maintenance | 0 (0.0%) | 0 (0.0%) |
| Personal Care & Service | 0 (0.0%) | 3 (100.0%) |
| Total (Category) | 3 (33.3%) | 6 (66.7%) |
| Total (Overall) | 29 (42.0%) | 40 (58.0%) |
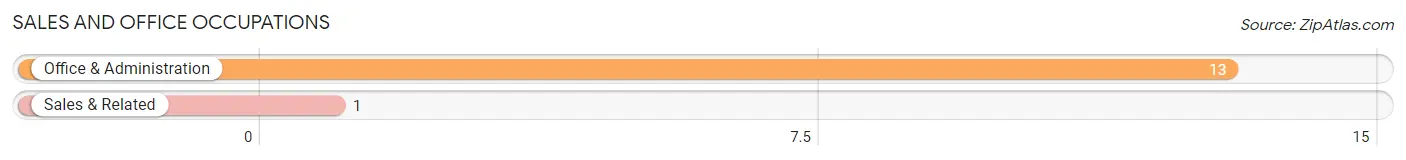
Sales and Office Occupations
The most common Sales and Office occupations in Wellersburg borough are Office & Administration (13 | 18.8%), and Sales & Related (1 | 1.5%).
Sales and Office Occupations by Sex

| Occupation | Male | Female |
| Sales & Related | 1 (100.0%) | 0 (0.0%) |
| Office & Administration | 0 (0.0%) | 13 (100.0%) |
| Total (Category) | 1 (7.1%) | 13 (92.9%) |
| Total (Overall) | 29 (42.0%) | 40 (58.0%) |
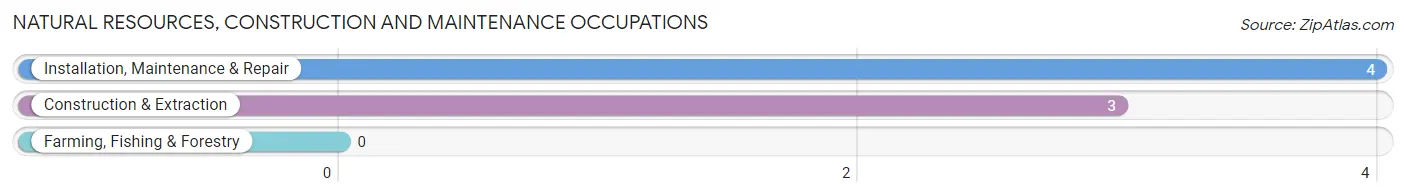
Natural Resources, Construction and Maintenance Occupations
The most common Natural Resources, Construction and Maintenance occupations in Wellersburg borough are Installation, Maintenance & Repair (4 | 5.8%), and Construction & Extraction (3 | 4.3%).
Natural Resources, Construction and Maintenance Occupations by Sex
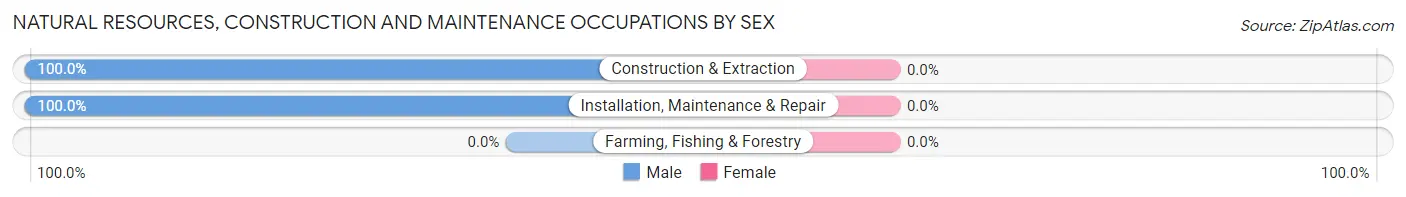
| Occupation | Male | Female |
| Farming, Fishing & Forestry | 0 (0.0%) | 0 (0.0%) |
| Construction & Extraction | 3 (100.0%) | 0 (0.0%) |
| Installation, Maintenance & Repair | 4 (100.0%) | 0 (0.0%) |
| Total (Category) | 7 (100.0%) | 0 (0.0%) |
| Total (Overall) | 29 (42.0%) | 40 (58.0%) |
Production, Transportation and Moving Occupations
The most common Production, Transportation and Moving occupations in Wellersburg borough are Production (7 | 10.1%), Transportation (5 | 7.2%), and Material Moving (2 | 2.9%).
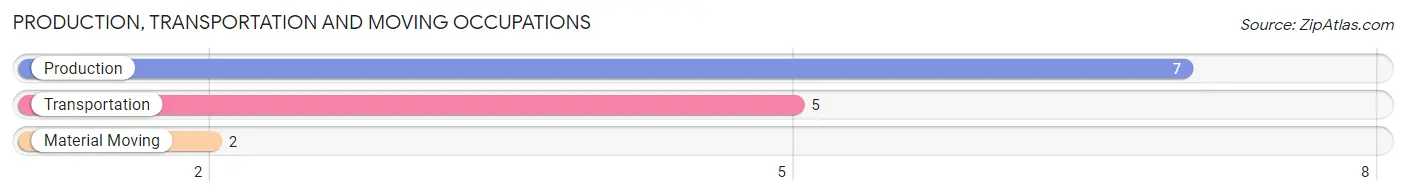
Production, Transportation and Moving Occupations by Sex
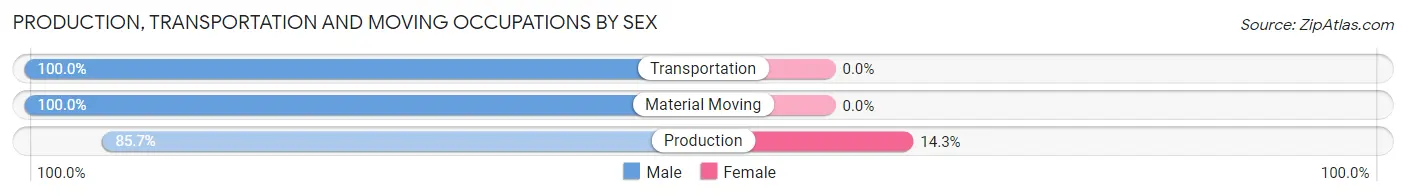
| Occupation | Male | Female |
| Production | 6 (85.7%) | 1 (14.3%) |
| Transportation | 5 (100.0%) | 0 (0.0%) |
| Material Moving | 2 (100.0%) | 0 (0.0%) |
| Total (Category) | 13 (92.9%) | 1 (7.1%) |
| Total (Overall) | 29 (42.0%) | 40 (58.0%) |
Employment Industries by Sex in Wellersburg borough
Employment Industries in Wellersburg borough
The major employment industries in Wellersburg borough include Health Care & Social Assistance (17 | 24.6%), Manufacturing (8 | 11.6%), Transportation & Warehousing (8 | 11.6%), Accommodation & Food Services (8 | 11.6%), and Construction (6 | 8.7%).
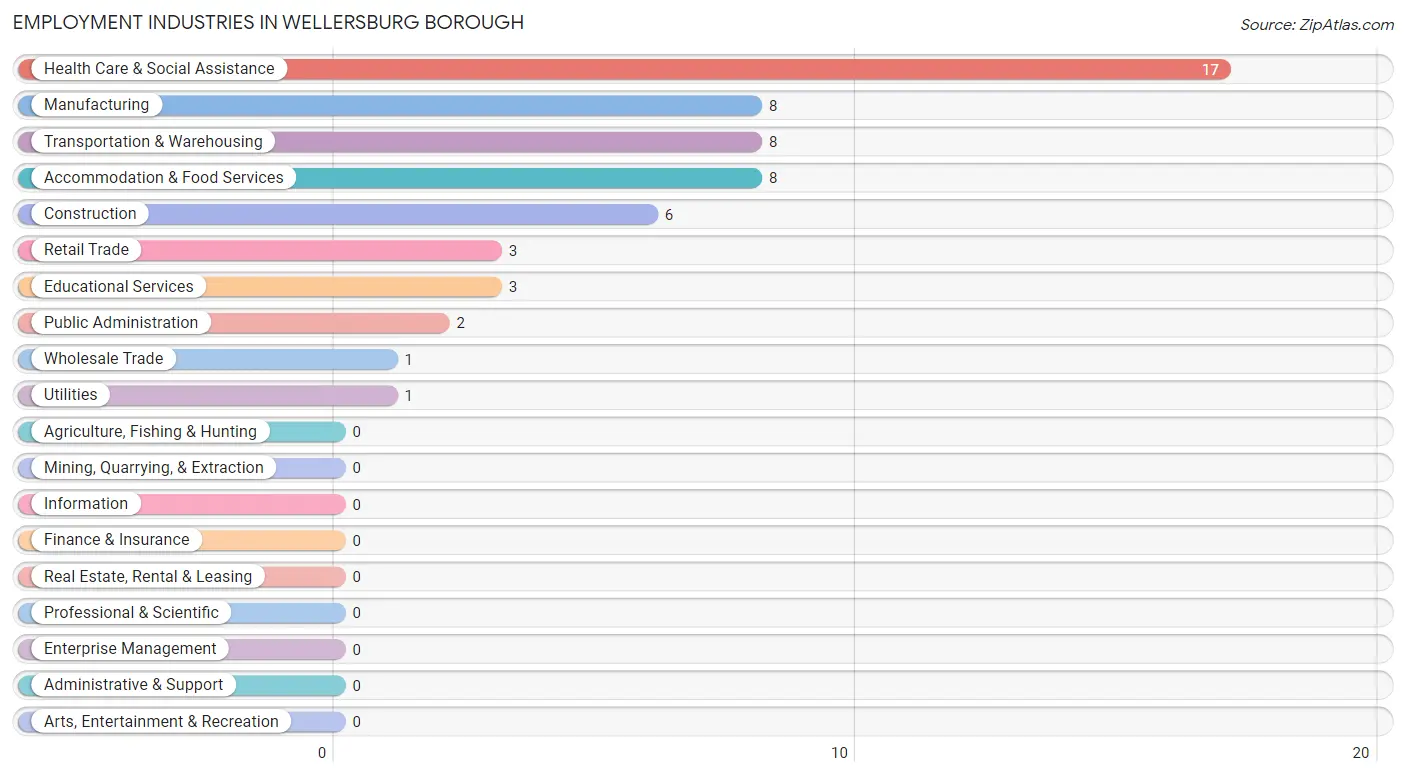
Employment Industries by Sex in Wellersburg borough
The Wellersburg borough industries that see more men than women are Wholesale Trade (100.0%), Transportation & Warehousing (100.0%), and Utilities (100.0%), whereas the industries that tend to have a higher number of women are Educational Services (100.0%), Health Care & Social Assistance (100.0%), and Accommodation & Food Services (75.0%).
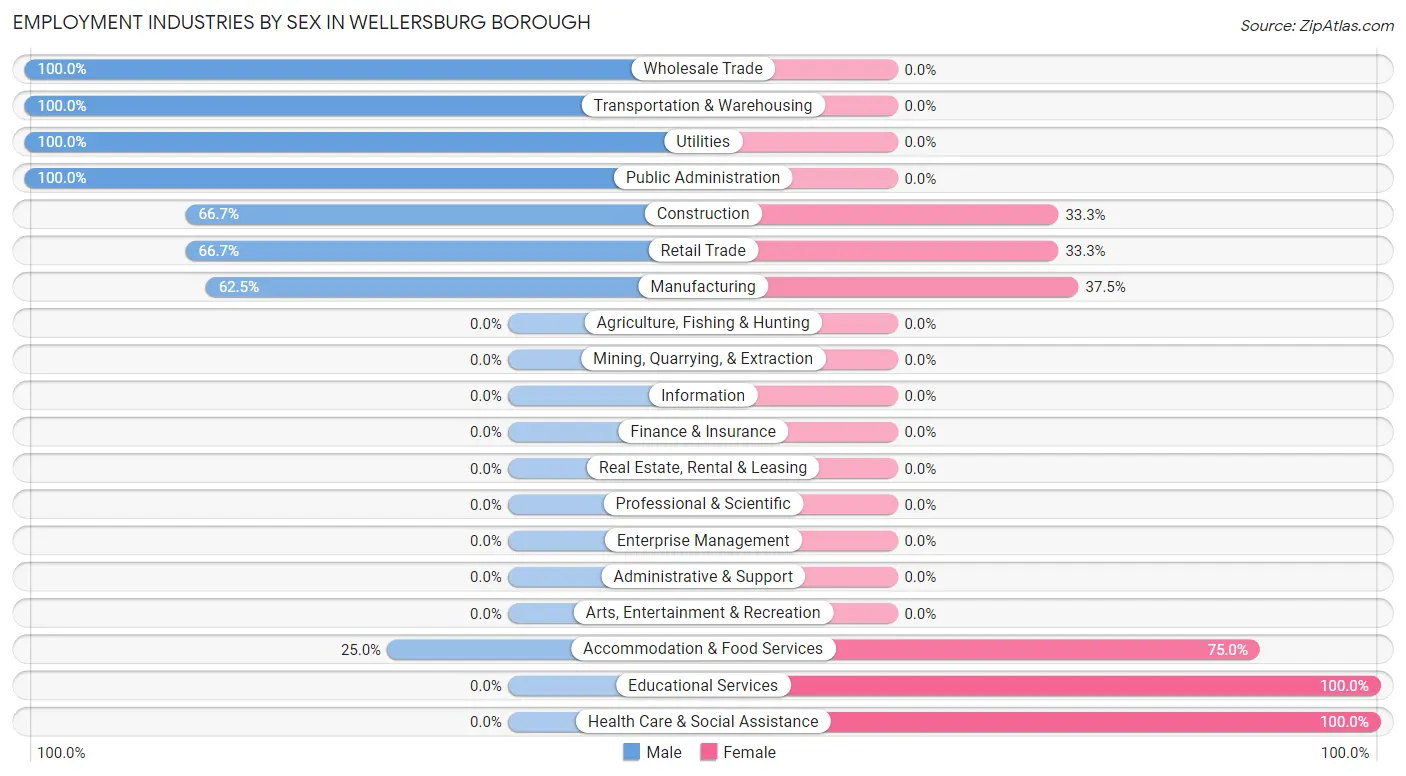
| Industry | Male | Female |
| Agriculture, Fishing & Hunting | 0 (0.0%) | 0 (0.0%) |
| Mining, Quarrying, & Extraction | 0 (0.0%) | 0 (0.0%) |
| Construction | 4 (66.7%) | 2 (33.3%) |
| Manufacturing | 5 (62.5%) | 3 (37.5%) |
| Wholesale Trade | 1 (100.0%) | 0 (0.0%) |
| Retail Trade | 2 (66.7%) | 1 (33.3%) |
| Transportation & Warehousing | 8 (100.0%) | 0 (0.0%) |
| Utilities | 1 (100.0%) | 0 (0.0%) |
| Information | 0 (0.0%) | 0 (0.0%) |
| Finance & Insurance | 0 (0.0%) | 0 (0.0%) |
| Real Estate, Rental & Leasing | 0 (0.0%) | 0 (0.0%) |
| Professional & Scientific | 0 (0.0%) | 0 (0.0%) |
| Enterprise Management | 0 (0.0%) | 0 (0.0%) |
| Administrative & Support | 0 (0.0%) | 0 (0.0%) |
| Educational Services | 0 (0.0%) | 3 (100.0%) |
| Health Care & Social Assistance | 0 (0.0%) | 17 (100.0%) |
| Arts, Entertainment & Recreation | 0 (0.0%) | 0 (0.0%) |
| Accommodation & Food Services | 2 (25.0%) | 6 (75.0%) |
| Public Administration | 2 (100.0%) | 0 (0.0%) |
| Total | 29 (42.0%) | 40 (58.0%) |
Education in Wellersburg borough
School Enrollment in Wellersburg borough
The most common levels of schooling among the 23 students in Wellersburg borough are high school (9 | 39.1%), elementary school (5 | 21.7%), and college / undergraduate (4 | 17.4%).
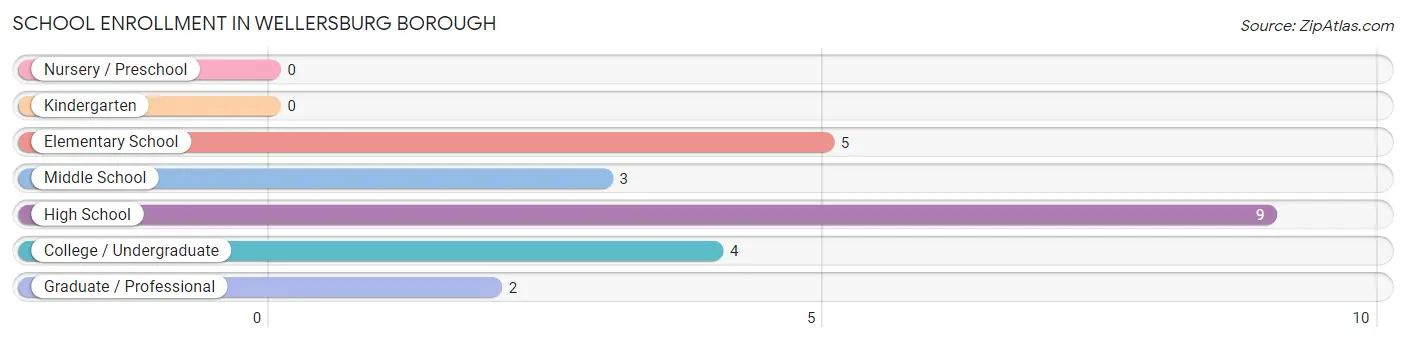
| School Level | # Students | % Students |
| Nursery / Preschool | 0 | 0.0% |
| Kindergarten | 0 | 0.0% |
| Elementary School | 5 | 21.7% |
| Middle School | 3 | 13.0% |
| High School | 9 | 39.1% |
| College / Undergraduate | 4 | 17.4% |
| Graduate / Professional | 2 | 8.7% |
| Total | 23 | 100.0% |
School Enrollment by Age by Funding Source in Wellersburg borough
Out of a total of 23 students who are enrolled in schools in Wellersburg borough, 9 (39.1%) attend a private institution, while the remaining 14 (60.9%) are enrolled in public schools. The age group of 35 years and over has the highest likelihood of being enrolled in private schools, with 3 (60.0% in the age bracket) enrolled. Conversely, the age group of 18 to 19 year olds has the lowest likelihood of being enrolled in a private school, with 1 (100.0% in the age bracket) attending a public institution.
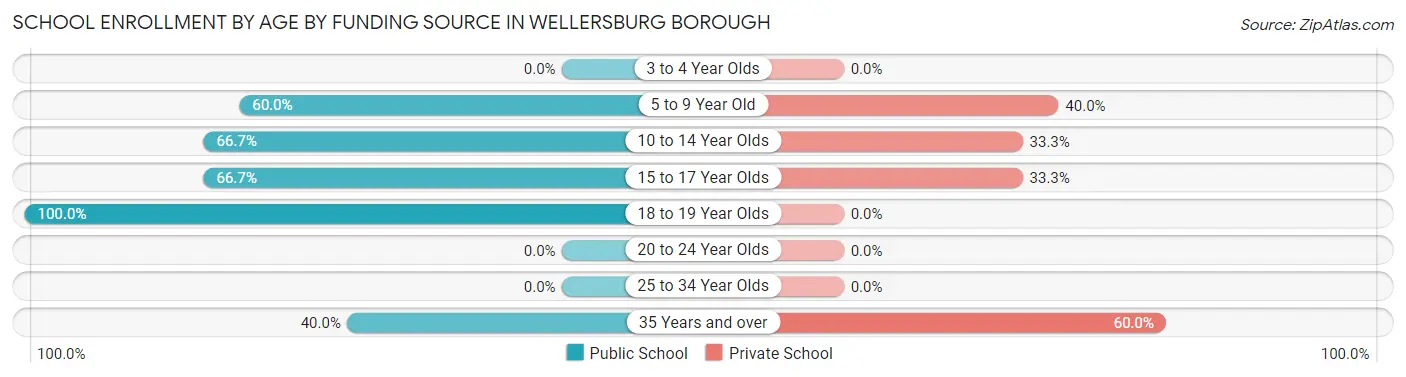
| Age Bracket | Public School | Private School |
| 3 to 4 Year Olds | 0 (0.0%) | 0 (0.0%) |
| 5 to 9 Year Old | 3 (60.0%) | 2 (40.0%) |
| 10 to 14 Year Olds | 2 (66.7%) | 1 (33.3%) |
| 15 to 17 Year Olds | 6 (66.7%) | 3 (33.3%) |
| 18 to 19 Year Olds | 1 (100.0%) | 0 (0.0%) |
| 20 to 24 Year Olds | 0 (0.0%) | 0 (0.0%) |
| 25 to 34 Year Olds | 0 (0.0%) | 0 (0.0%) |
| 35 Years and over | 2 (40.0%) | 3 (60.0%) |
| Total | 14 (60.9%) | 9 (39.1%) |
Educational Attainment by Field of Study in Wellersburg borough
Science & technology (4 | 18.2%), liberal arts & history (4 | 18.2%), computers & mathematics (3 | 13.6%), psychology (2 | 9.1%), and social sciences (2 | 9.1%) are the most common fields of study among 22 individuals in Wellersburg borough who have obtained a bachelor's degree or higher.
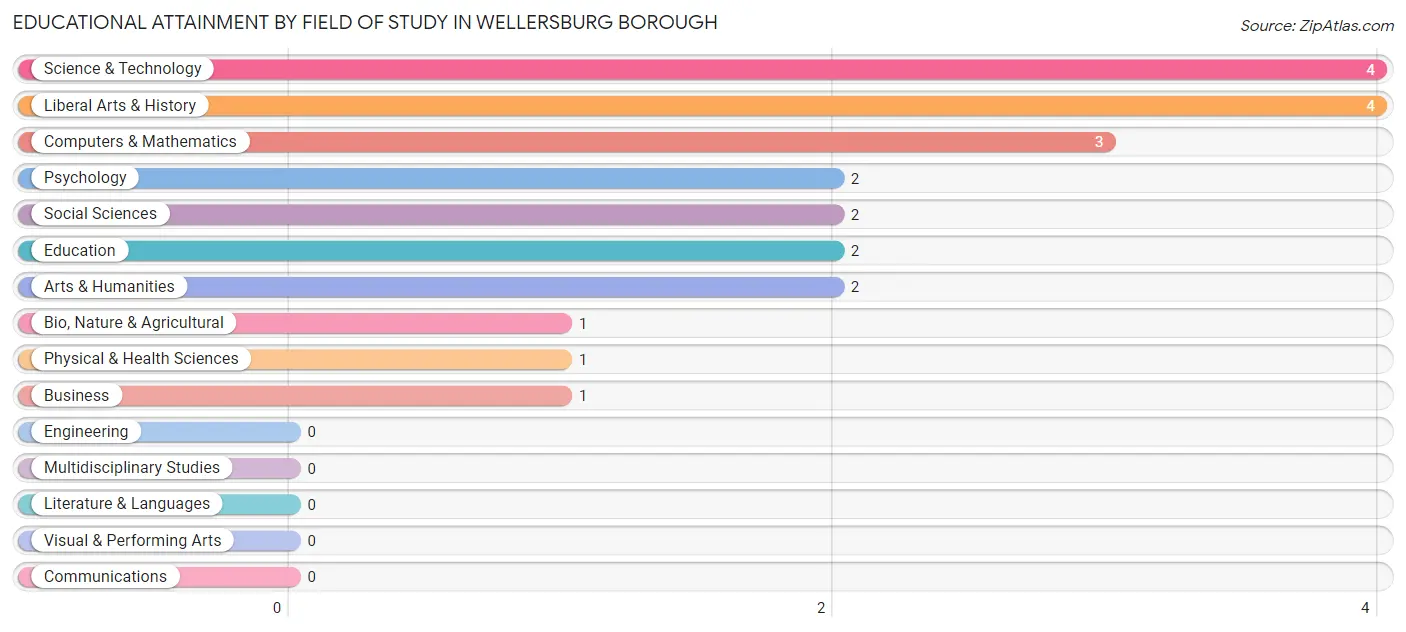
| Field of Study | # Graduates | % Graduates |
| Computers & Mathematics | 3 | 13.6% |
| Bio, Nature & Agricultural | 1 | 4.5% |
| Physical & Health Sciences | 1 | 4.5% |
| Psychology | 2 | 9.1% |
| Social Sciences | 2 | 9.1% |
| Engineering | 0 | 0.0% |
| Multidisciplinary Studies | 0 | 0.0% |
| Science & Technology | 4 | 18.2% |
| Business | 1 | 4.5% |
| Education | 2 | 9.1% |
| Literature & Languages | 0 | 0.0% |
| Liberal Arts & History | 4 | 18.2% |
| Visual & Performing Arts | 0 | 0.0% |
| Communications | 0 | 0.0% |
| Arts & Humanities | 2 | 9.1% |
| Total | 22 | 100.0% |
Transportation & Commute in Wellersburg borough
Vehicle Availability by Sex in Wellersburg borough
The most prevalent vehicle ownership categories in Wellersburg borough are males with 2 vehicles (16, accounting for 64.0%) and females with 2 vehicles (19, making up 40.0%).
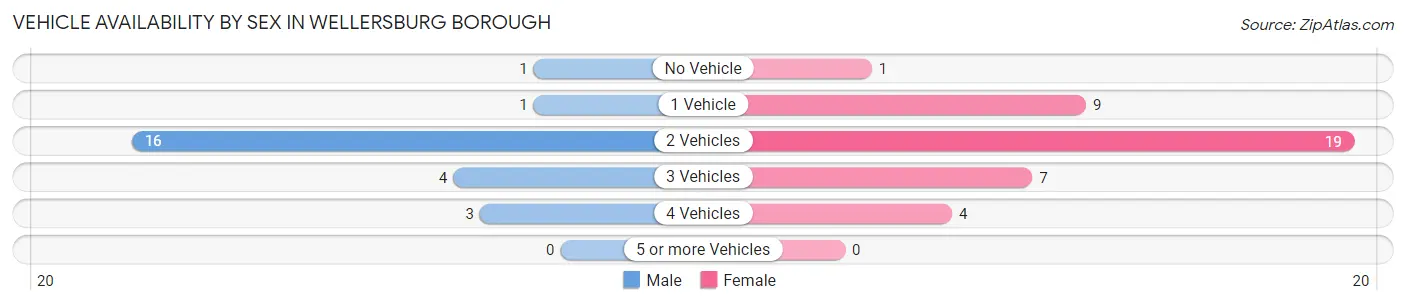
| Vehicles Available | Male | Female |
| No Vehicle | 1 (4.0%) | 1 (2.5%) |
| 1 Vehicle | 1 (4.0%) | 9 (22.5%) |
| 2 Vehicles | 16 (64.0%) | 19 (47.5%) |
| 3 Vehicles | 4 (16.0%) | 7 (17.5%) |
| 4 Vehicles | 3 (12.0%) | 4 (10.0%) |
| 5 or more Vehicles | 0 (0.0%) | 0 (0.0%) |
| Total | 25 (100.0%) | 40 (100.0%) |
Commute Time in Wellersburg borough
The most frequently occuring commute durations in Wellersburg borough are 20 to 24 minutes (19 commuters, 29.2%), 25 to 29 minutes (10 commuters, 15.4%), and 30 to 34 minutes (10 commuters, 15.4%).
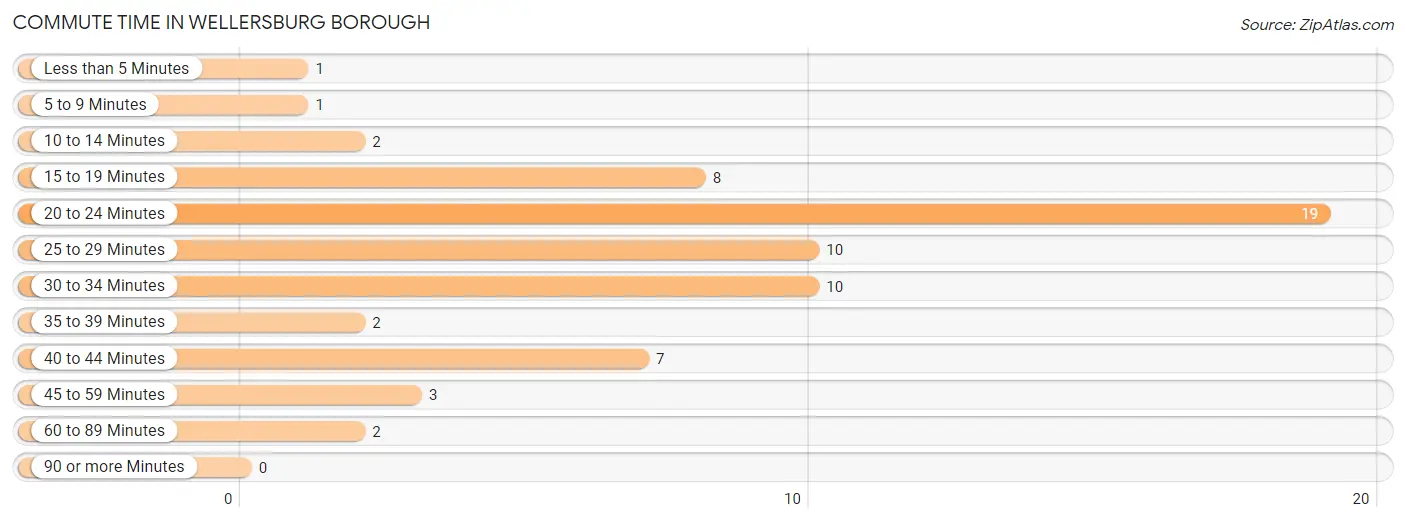
| Commute Time | # Commuters | % Commuters |
| Less than 5 Minutes | 1 | 1.5% |
| 5 to 9 Minutes | 1 | 1.5% |
| 10 to 14 Minutes | 2 | 3.1% |
| 15 to 19 Minutes | 8 | 12.3% |
| 20 to 24 Minutes | 19 | 29.2% |
| 25 to 29 Minutes | 10 | 15.4% |
| 30 to 34 Minutes | 10 | 15.4% |
| 35 to 39 Minutes | 2 | 3.1% |
| 40 to 44 Minutes | 7 | 10.8% |
| 45 to 59 Minutes | 3 | 4.6% |
| 60 to 89 Minutes | 2 | 3.1% |
| 90 or more Minutes | 0 | 0.0% |
Commute Time by Sex in Wellersburg borough
The most common commute times in Wellersburg borough are 20 to 24 minutes (6 commuters, 24.0%) for males and 20 to 24 minutes (13 commuters, 32.5%) for females.
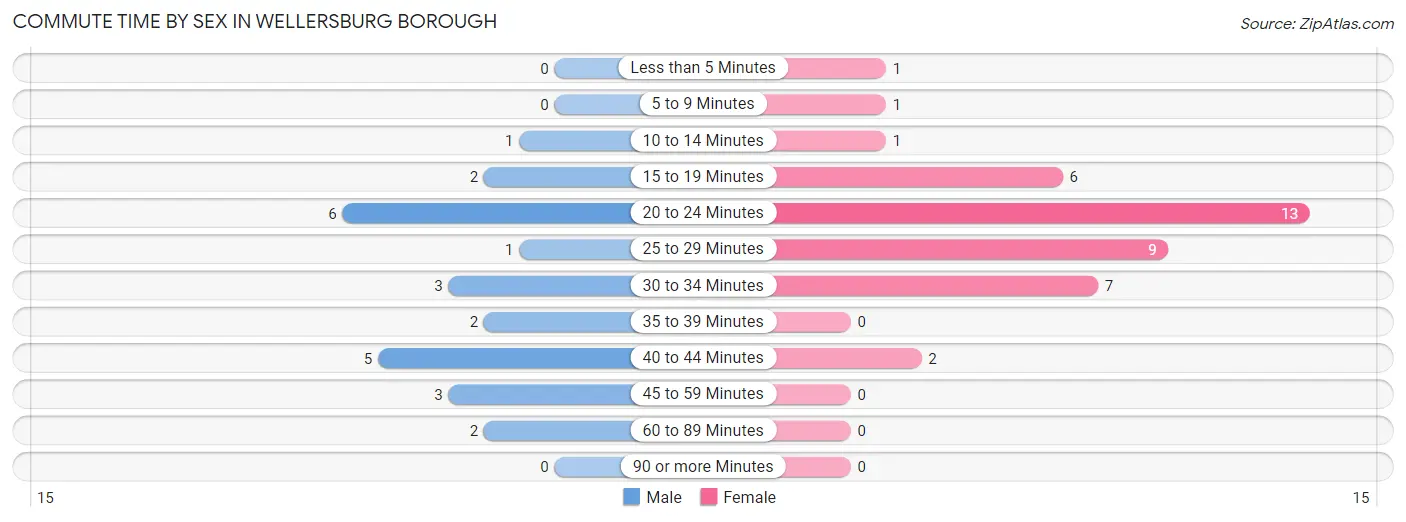
| Commute Time | Male | Female |
| Less than 5 Minutes | 0 (0.0%) | 1 (2.5%) |
| 5 to 9 Minutes | 0 (0.0%) | 1 (2.5%) |
| 10 to 14 Minutes | 1 (4.0%) | 1 (2.5%) |
| 15 to 19 Minutes | 2 (8.0%) | 6 (15.0%) |
| 20 to 24 Minutes | 6 (24.0%) | 13 (32.5%) |
| 25 to 29 Minutes | 1 (4.0%) | 9 (22.5%) |
| 30 to 34 Minutes | 3 (12.0%) | 7 (17.5%) |
| 35 to 39 Minutes | 2 (8.0%) | 0 (0.0%) |
| 40 to 44 Minutes | 5 (20.0%) | 2 (5.0%) |
| 45 to 59 Minutes | 3 (12.0%) | 0 (0.0%) |
| 60 to 89 Minutes | 2 (8.0%) | 0 (0.0%) |
| 90 or more Minutes | 0 (0.0%) | 0 (0.0%) |
Time of Departure to Work by Sex in Wellersburg borough
The most frequent times of departure to work in Wellersburg borough are 12:00 AM to 4:59 AM (7, 28.0%) for males and 7:00 AM to 7:29 AM (14, 35.0%) for females.
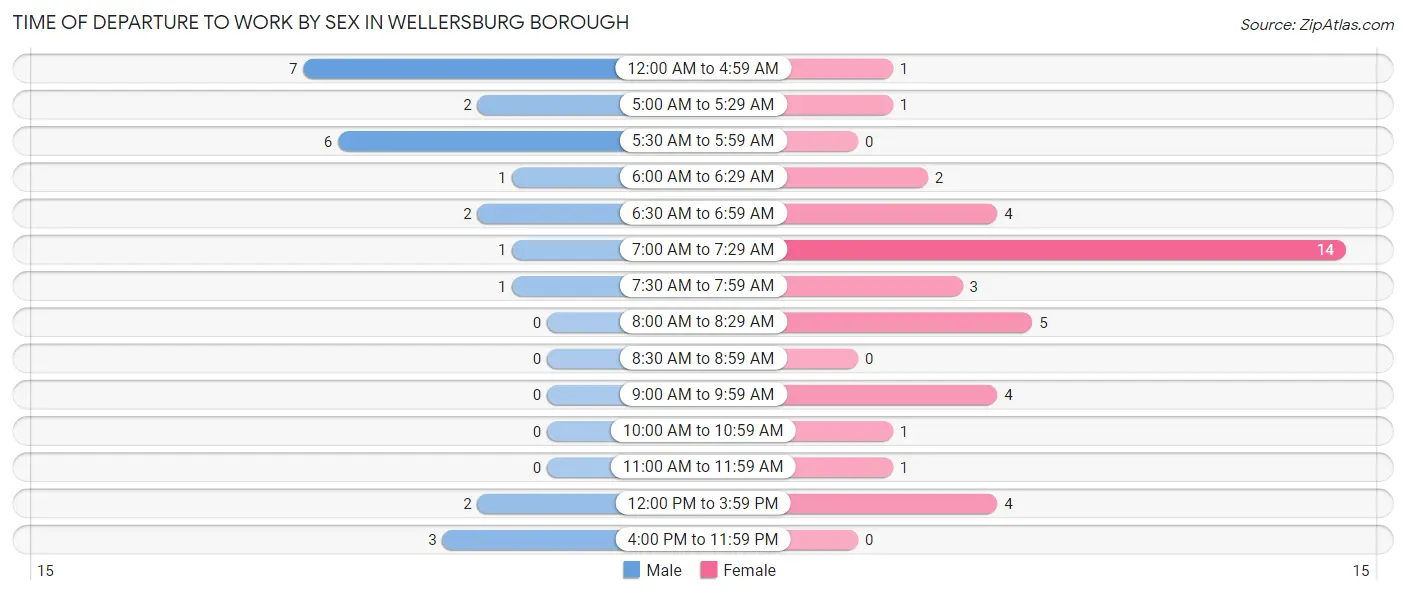
| Time of Departure | Male | Female |
| 12:00 AM to 4:59 AM | 7 (28.0%) | 1 (2.5%) |
| 5:00 AM to 5:29 AM | 2 (8.0%) | 1 (2.5%) |
| 5:30 AM to 5:59 AM | 6 (24.0%) | 0 (0.0%) |
| 6:00 AM to 6:29 AM | 1 (4.0%) | 2 (5.0%) |
| 6:30 AM to 6:59 AM | 2 (8.0%) | 4 (10.0%) |
| 7:00 AM to 7:29 AM | 1 (4.0%) | 14 (35.0%) |
| 7:30 AM to 7:59 AM | 1 (4.0%) | 3 (7.5%) |
| 8:00 AM to 8:29 AM | 0 (0.0%) | 5 (12.5%) |
| 8:30 AM to 8:59 AM | 0 (0.0%) | 0 (0.0%) |
| 9:00 AM to 9:59 AM | 0 (0.0%) | 4 (10.0%) |
| 10:00 AM to 10:59 AM | 0 (0.0%) | 1 (2.5%) |
| 11:00 AM to 11:59 AM | 0 (0.0%) | 1 (2.5%) |
| 12:00 PM to 3:59 PM | 2 (8.0%) | 4 (10.0%) |
| 4:00 PM to 11:59 PM | 3 (12.0%) | 0 (0.0%) |
| Total | 25 (100.0%) | 40 (100.0%) |
Housing Occupancy in Wellersburg borough
Occupancy by Ownership in Wellersburg borough
Of the total 67 dwellings in Wellersburg borough, owner-occupied units account for 46 (68.7%), while renter-occupied units make up 21 (31.3%).
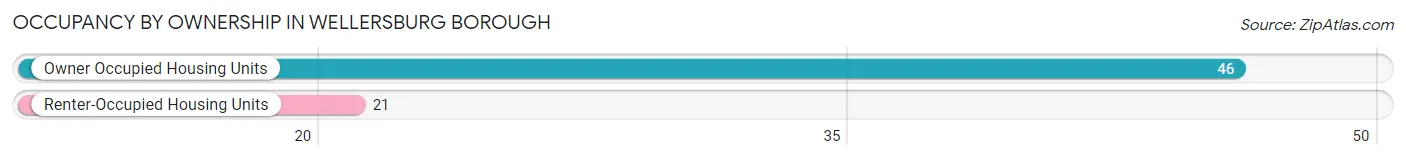
| Occupancy | # Housing Units | % Housing Units |
| Owner Occupied Housing Units | 46 | 68.7% |
| Renter-Occupied Housing Units | 21 | 31.3% |
| Total Occupied Housing Units | 67 | 100.0% |
Occupancy by Household Size in Wellersburg borough
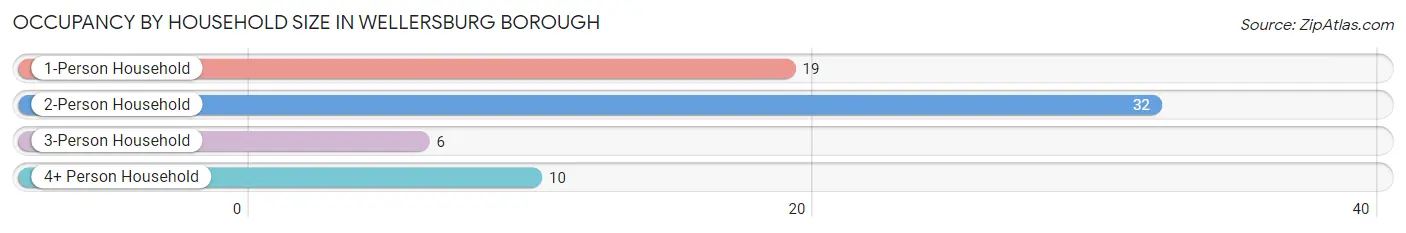
| Household Size | # Housing Units | % Housing Units |
| 1-Person Household | 19 | 28.4% |
| 2-Person Household | 32 | 47.8% |
| 3-Person Household | 6 | 9.0% |
| 4+ Person Household | 10 | 14.9% |
| Total Housing Units | 67 | 100.0% |
Occupancy by Ownership by Household Size in Wellersburg borough
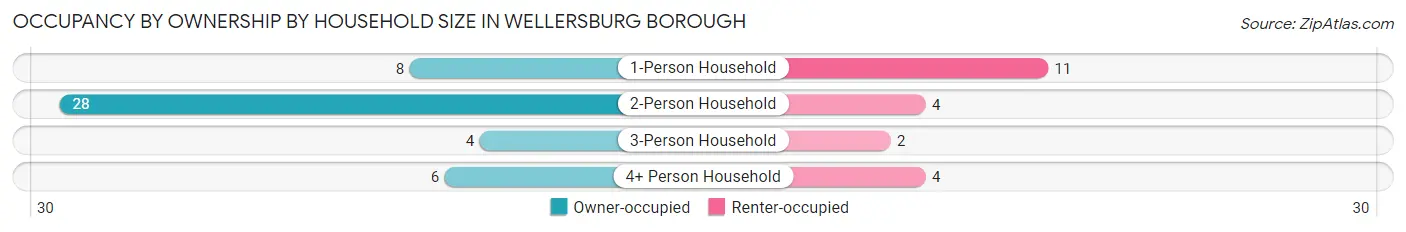
| Household Size | Owner-occupied | Renter-occupied |
| 1-Person Household | 8 (42.1%) | 11 (57.9%) |
| 2-Person Household | 28 (87.5%) | 4 (12.5%) |
| 3-Person Household | 4 (66.7%) | 2 (33.3%) |
| 4+ Person Household | 6 (60.0%) | 4 (40.0%) |
| Total Housing Units | 46 (68.7%) | 21 (31.3%) |
Occupancy by Educational Attainment in Wellersburg borough
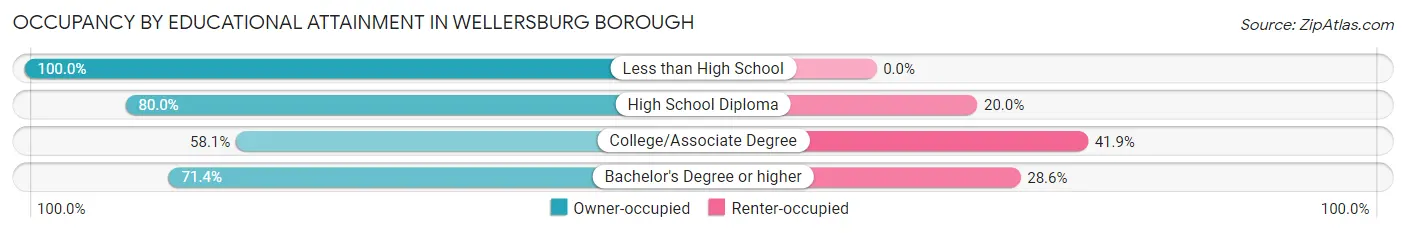
| Household Size | Owner-occupied | Renter-occupied |
| Less than High School | 2 (100.0%) | 0 (0.0%) |
| High School Diploma | 16 (80.0%) | 4 (20.0%) |
| College/Associate Degree | 18 (58.1%) | 13 (41.9%) |
| Bachelor's Degree or higher | 10 (71.4%) | 4 (28.6%) |
Occupancy by Age of Householder in Wellersburg borough
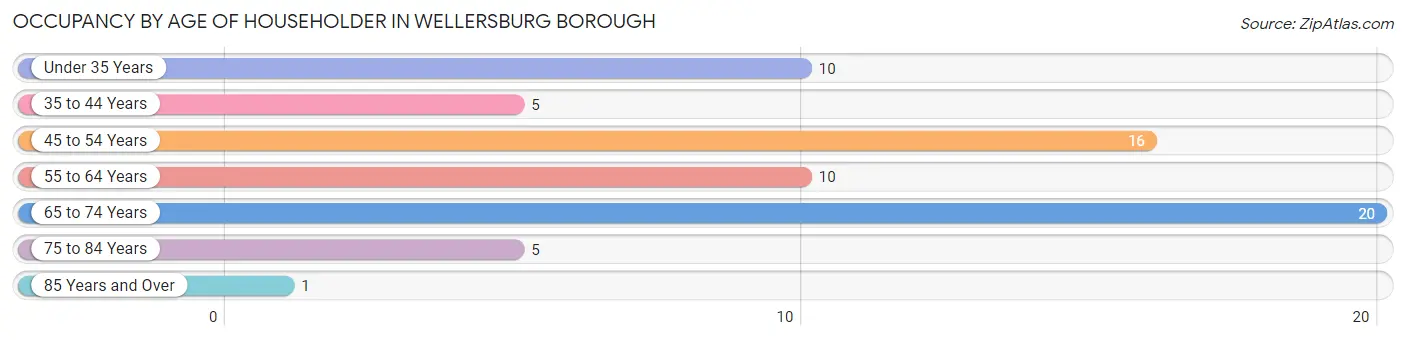
| Age Bracket | # Households | % Households |
| Under 35 Years | 10 | 14.9% |
| 35 to 44 Years | 5 | 7.5% |
| 45 to 54 Years | 16 | 23.9% |
| 55 to 64 Years | 10 | 14.9% |
| 65 to 74 Years | 20 | 29.8% |
| 75 to 84 Years | 5 | 7.5% |
| 85 Years and Over | 1 | 1.5% |
| Total | 67 | 100.0% |
Housing Finances in Wellersburg borough
Median Income by Occupancy in Wellersburg borough
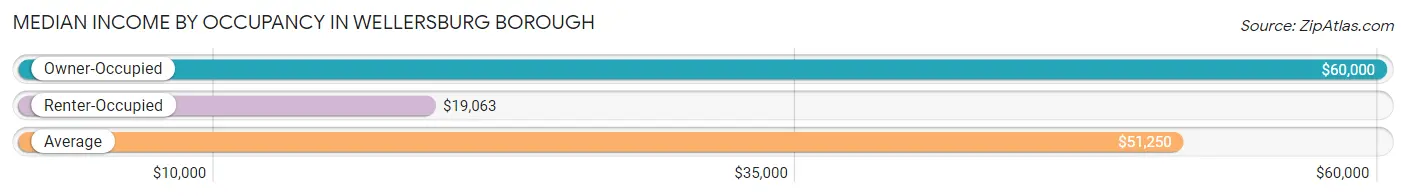
| Occupancy Type | # Households | Median Income |
| Owner-Occupied | 46 (68.7%) | $60,000 |
| Renter-Occupied | 21 (31.3%) | $19,063 |
| Average | 67 (100.0%) | $51,250 |
Occupancy by Householder Income Bracket in Wellersburg borough
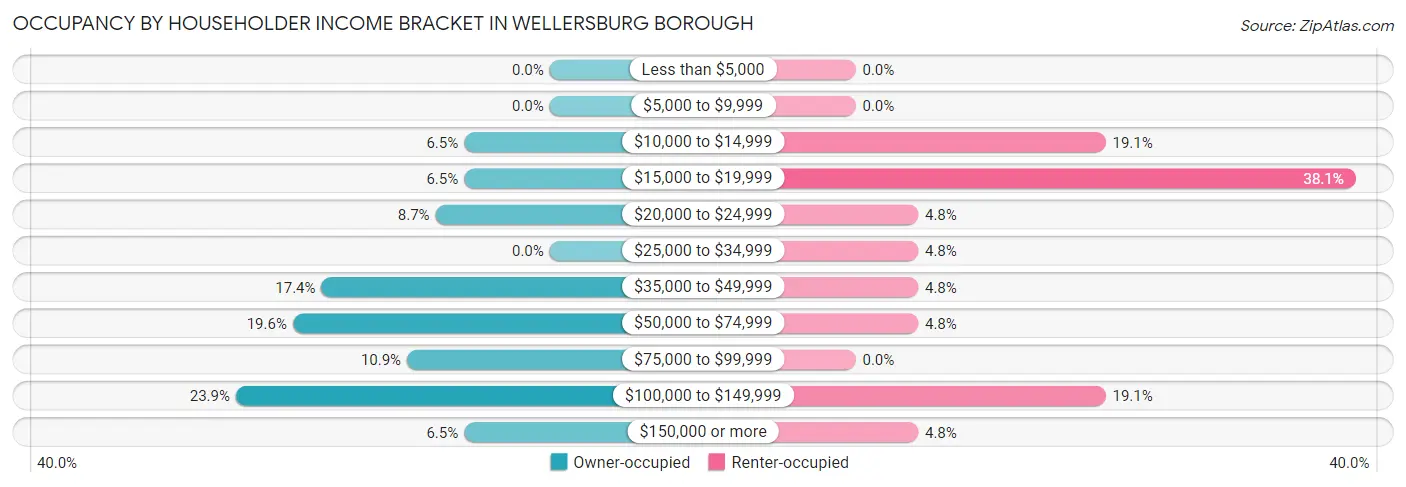
| Income Bracket | Owner-occupied | Renter-occupied |
| Less than $5,000 | 0 (0.0%) | 0 (0.0%) |
| $5,000 to $9,999 | 0 (0.0%) | 0 (0.0%) |
| $10,000 to $14,999 | 3 (6.5%) | 4 (19.1%) |
| $15,000 to $19,999 | 3 (6.5%) | 8 (38.1%) |
| $20,000 to $24,999 | 4 (8.7%) | 1 (4.8%) |
| $25,000 to $34,999 | 0 (0.0%) | 1 (4.8%) |
| $35,000 to $49,999 | 8 (17.4%) | 1 (4.8%) |
| $50,000 to $74,999 | 9 (19.6%) | 1 (4.8%) |
| $75,000 to $99,999 | 5 (10.9%) | 0 (0.0%) |
| $100,000 to $149,999 | 11 (23.9%) | 4 (19.1%) |
| $150,000 or more | 3 (6.5%) | 1 (4.8%) |
| Total | 46 (100.0%) | 21 (100.0%) |
Monthly Housing Cost Tiers in Wellersburg borough
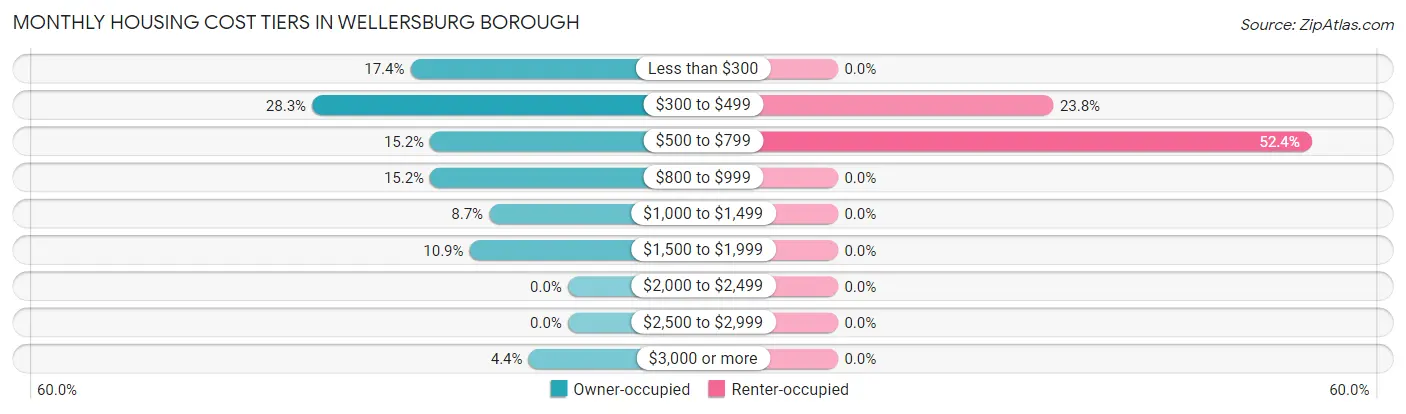
| Monthly Cost | Owner-occupied | Renter-occupied |
| Less than $300 | 8 (17.4%) | 0 (0.0%) |
| $300 to $499 | 13 (28.3%) | 5 (23.8%) |
| $500 to $799 | 7 (15.2%) | 11 (52.4%) |
| $800 to $999 | 7 (15.2%) | 0 (0.0%) |
| $1,000 to $1,499 | 4 (8.7%) | 0 (0.0%) |
| $1,500 to $1,999 | 5 (10.9%) | 0 (0.0%) |
| $2,000 to $2,499 | 0 (0.0%) | 0 (0.0%) |
| $2,500 to $2,999 | 0 (0.0%) | 0 (0.0%) |
| $3,000 or more | 2 (4.3%) | 0 (0.0%) |
| Total | 46 (100.0%) | 21 (100.0%) |
Physical Housing Characteristics in Wellersburg borough
Housing Structures in Wellersburg borough
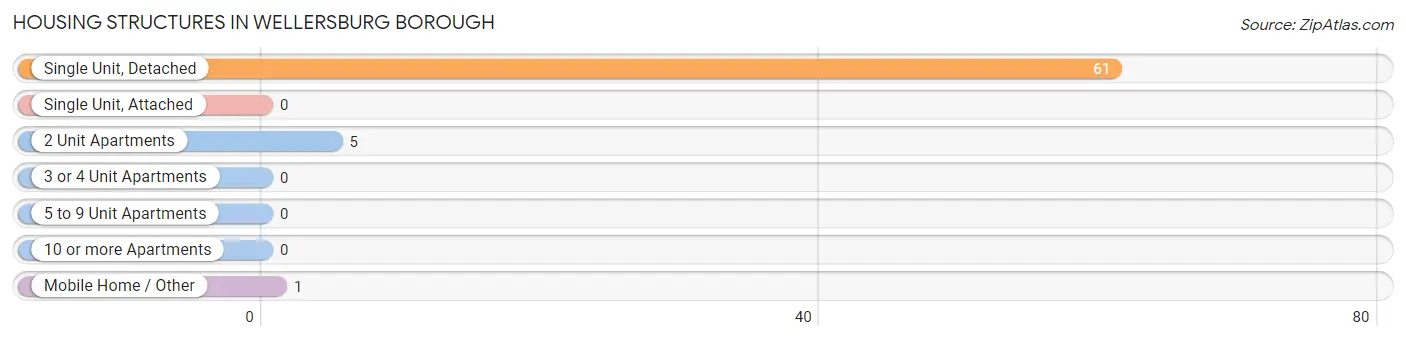
| Structure Type | # Housing Units | % Housing Units |
| Single Unit, Detached | 61 | 91.0% |
| Single Unit, Attached | 0 | 0.0% |
| 2 Unit Apartments | 5 | 7.5% |
| 3 or 4 Unit Apartments | 0 | 0.0% |
| 5 to 9 Unit Apartments | 0 | 0.0% |
| 10 or more Apartments | 0 | 0.0% |
| Mobile Home / Other | 1 | 1.5% |
| Total | 67 | 100.0% |
Housing Structures by Occupancy in Wellersburg borough
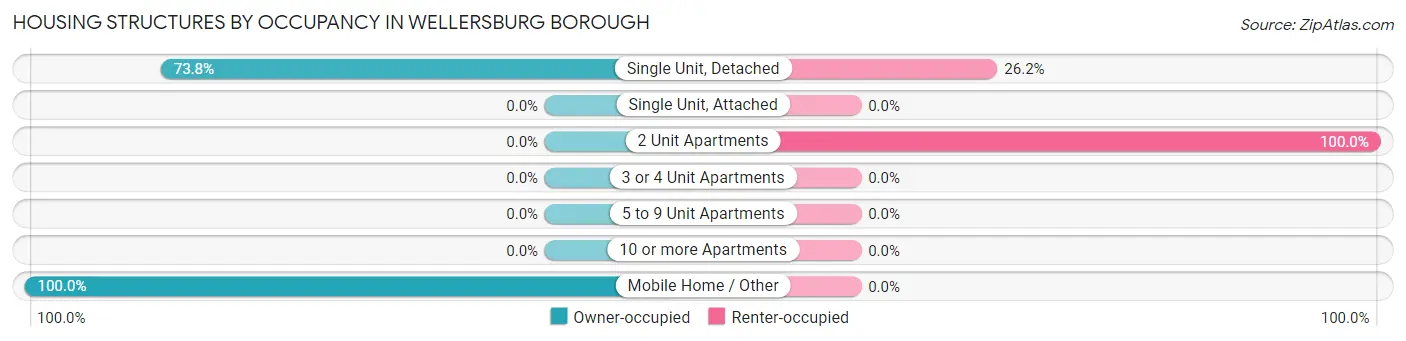
| Structure Type | Owner-occupied | Renter-occupied |
| Single Unit, Detached | 45 (73.8%) | 16 (26.2%) |
| Single Unit, Attached | 0 (0.0%) | 0 (0.0%) |
| 2 Unit Apartments | 0 (0.0%) | 5 (100.0%) |
| 3 or 4 Unit Apartments | 0 (0.0%) | 0 (0.0%) |
| 5 to 9 Unit Apartments | 0 (0.0%) | 0 (0.0%) |
| 10 or more Apartments | 0 (0.0%) | 0 (0.0%) |
| Mobile Home / Other | 1 (100.0%) | 0 (0.0%) |
| Total | 46 (68.7%) | 21 (31.3%) |
Housing Structures by Number of Rooms in Wellersburg borough
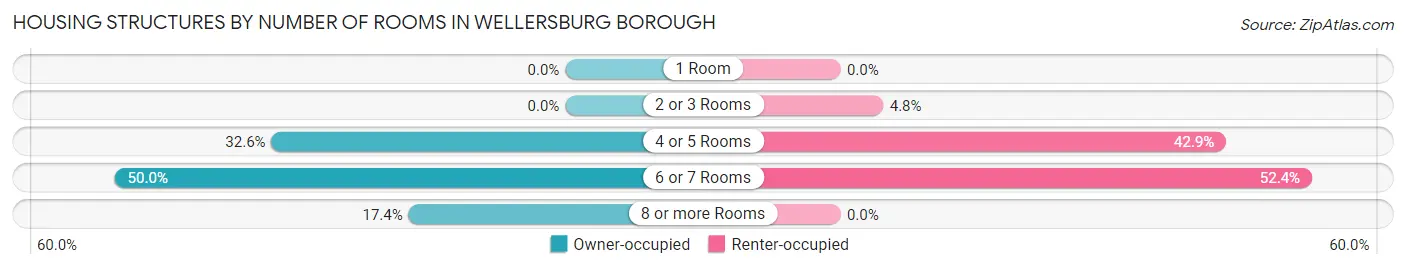
| Number of Rooms | Owner-occupied | Renter-occupied |
| 1 Room | 0 (0.0%) | 0 (0.0%) |
| 2 or 3 Rooms | 0 (0.0%) | 1 (4.8%) |
| 4 or 5 Rooms | 15 (32.6%) | 9 (42.9%) |
| 6 or 7 Rooms | 23 (50.0%) | 11 (52.4%) |
| 8 or more Rooms | 8 (17.4%) | 0 (0.0%) |
| Total | 46 (100.0%) | 21 (100.0%) |
Housing Structure by Heating Type in Wellersburg borough
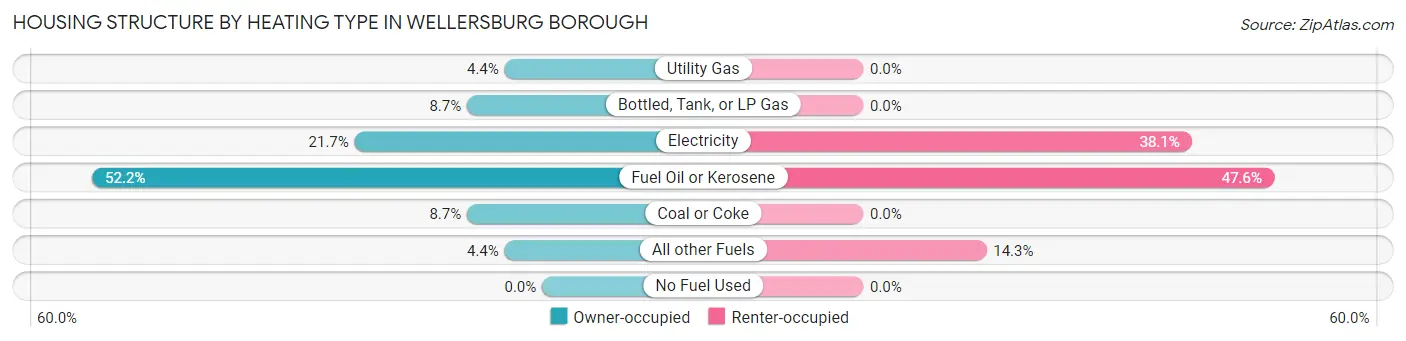
| Heating Type | Owner-occupied | Renter-occupied |
| Utility Gas | 2 (4.3%) | 0 (0.0%) |
| Bottled, Tank, or LP Gas | 4 (8.7%) | 0 (0.0%) |
| Electricity | 10 (21.7%) | 8 (38.1%) |
| Fuel Oil or Kerosene | 24 (52.2%) | 10 (47.6%) |
| Coal or Coke | 4 (8.7%) | 0 (0.0%) |
| All other Fuels | 2 (4.3%) | 3 (14.3%) |
| No Fuel Used | 0 (0.0%) | 0 (0.0%) |
| Total | 46 (100.0%) | 21 (100.0%) |
Household Vehicle Usage in Wellersburg borough
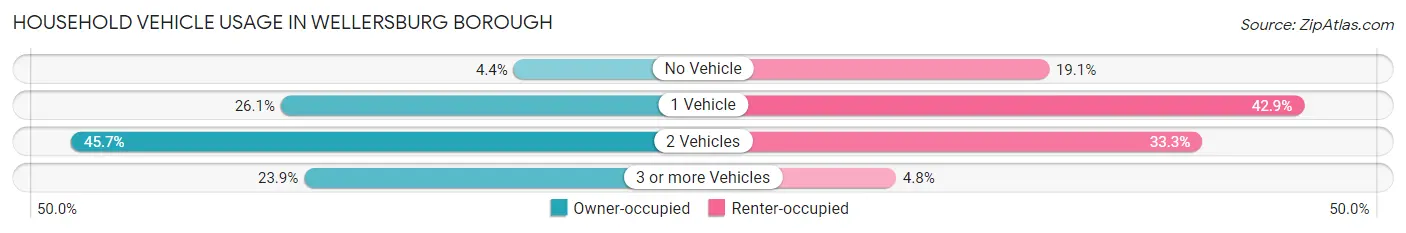
| Vehicles per Household | Owner-occupied | Renter-occupied |
| No Vehicle | 2 (4.3%) | 4 (19.1%) |
| 1 Vehicle | 12 (26.1%) | 9 (42.9%) |
| 2 Vehicles | 21 (45.7%) | 7 (33.3%) |
| 3 or more Vehicles | 11 (23.9%) | 1 (4.8%) |
| Total | 46 (100.0%) | 21 (100.0%) |
Real Estate & Mortgages in Wellersburg borough
Real Estate and Mortgage Overview in Wellersburg borough
| Characteristic | Without Mortgage | With Mortgage |
| Housing Units | 26 | 20 |
| Median Property Value | $95,000 | $165,000 |
| Median Household Income | $50,000 | $0 |
| Monthly Housing Costs | $400 | $2 |
| Real Estate Taxes | $750 | $0 |
Property Value by Mortgage Status in Wellersburg borough
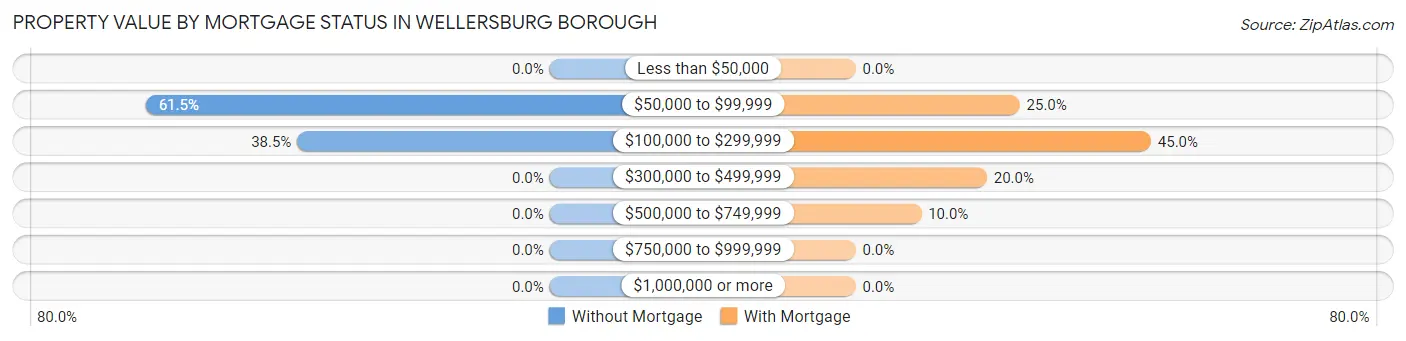
| Property Value | Without Mortgage | With Mortgage |
| Less than $50,000 | 0 (0.0%) | 0 (0.0%) |
| $50,000 to $99,999 | 16 (61.5%) | 5 (25.0%) |
| $100,000 to $299,999 | 10 (38.5%) | 9 (45.0%) |
| $300,000 to $499,999 | 0 (0.0%) | 4 (20.0%) |
| $500,000 to $749,999 | 0 (0.0%) | 2 (10.0%) |
| $750,000 to $999,999 | 0 (0.0%) | 0 (0.0%) |
| $1,000,000 or more | 0 (0.0%) | 0 (0.0%) |
| Total | 26 (100.0%) | 20 (100.0%) |
Household Income by Mortgage Status in Wellersburg borough
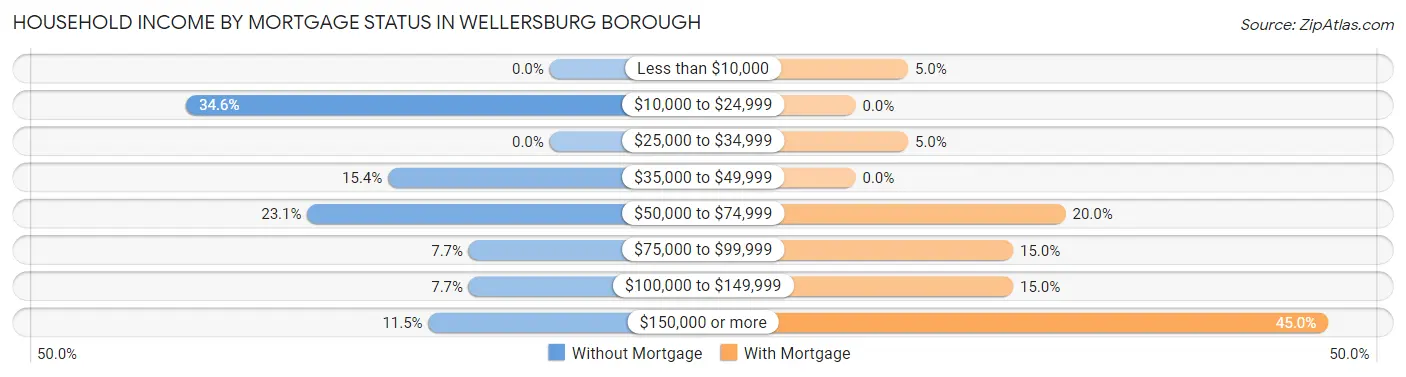
| Household Income | Without Mortgage | With Mortgage |
| Less than $10,000 | 0 (0.0%) | 1 (5.0%) |
| $10,000 to $24,999 | 9 (34.6%) | 0 (0.0%) |
| $25,000 to $34,999 | 0 (0.0%) | 1 (5.0%) |
| $35,000 to $49,999 | 4 (15.4%) | 0 (0.0%) |
| $50,000 to $74,999 | 6 (23.1%) | 4 (20.0%) |
| $75,000 to $99,999 | 2 (7.7%) | 3 (15.0%) |
| $100,000 to $149,999 | 2 (7.7%) | 3 (15.0%) |
| $150,000 or more | 3 (11.5%) | 9 (45.0%) |
| Total | 26 (100.0%) | 20 (100.0%) |
Property Value to Household Income Ratio in Wellersburg borough
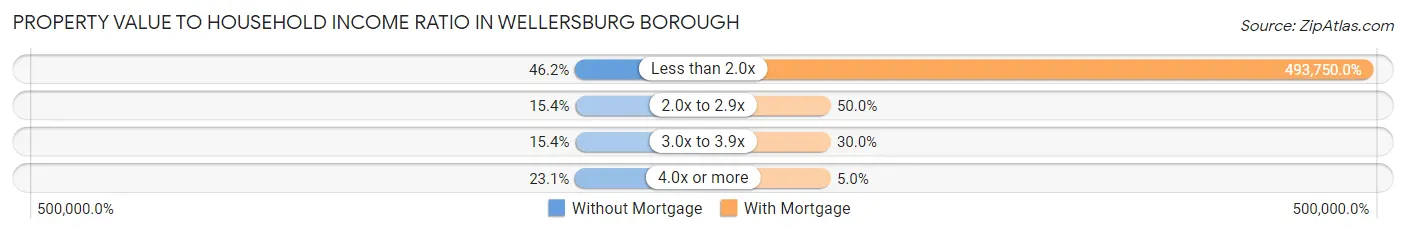
| Value-to-Income Ratio | Without Mortgage | With Mortgage |
| Less than 2.0x | 12 (46.2%) | 98,750 (493,750.0%) |
| 2.0x to 2.9x | 4 (15.4%) | 10 (50.0%) |
| 3.0x to 3.9x | 4 (15.4%) | 6 (30.0%) |
| 4.0x or more | 6 (23.1%) | 1 (5.0%) |
| Total | 26 (100.0%) | 20 (100.0%) |
Real Estate Taxes by Mortgage Status in Wellersburg borough
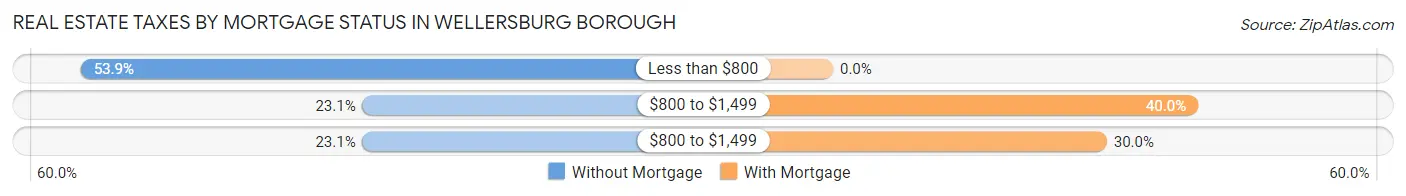
| Property Taxes | Without Mortgage | With Mortgage |
| Less than $800 | 14 (53.8%) | 0 (0.0%) |
| $800 to $1,499 | 6 (23.1%) | 8 (40.0%) |
| $800 to $1,499 | 6 (23.1%) | 6 (30.0%) |
| Total | 26 (100.0%) | 20 (100.0%) |
Health & Disability in Wellersburg borough
Health Insurance Coverage by Age in Wellersburg borough
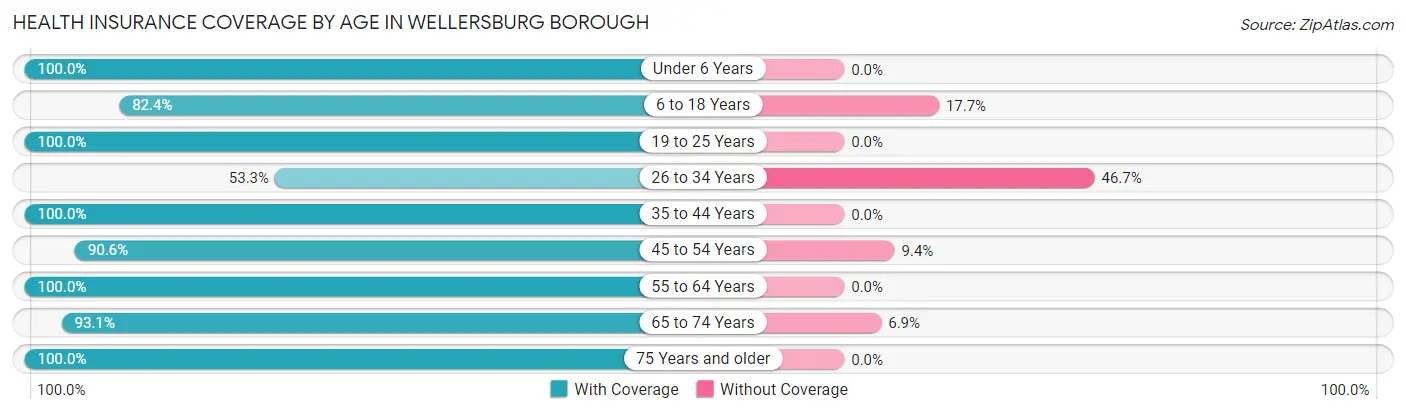
| Age Bracket | With Coverage | Without Coverage |
| Under 6 Years | 7 (100.0%) | 0 (0.0%) |
| 6 to 18 Years | 14 (82.4%) | 3 (17.6%) |
| 19 to 25 Years | 4 (100.0%) | 0 (0.0%) |
| 26 to 34 Years | 8 (53.3%) | 7 (46.7%) |
| 35 to 44 Years | 14 (100.0%) | 0 (0.0%) |
| 45 to 54 Years | 29 (90.6%) | 3 (9.4%) |
| 55 to 64 Years | 18 (100.0%) | 0 (0.0%) |
| 65 to 74 Years | 27 (93.1%) | 2 (6.9%) |
| 75 Years and older | 12 (100.0%) | 0 (0.0%) |
| Total | 133 (89.9%) | 15 (10.1%) |
Health Insurance Coverage by Citizenship Status in Wellersburg borough
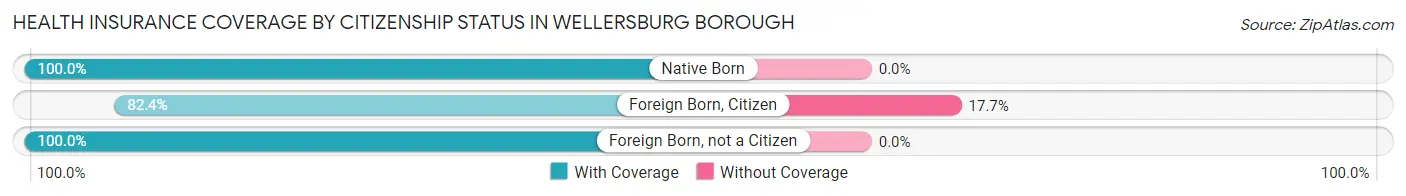
| Citizenship Status | With Coverage | Without Coverage |
| Native Born | 7 (100.0%) | 0 (0.0%) |
| Foreign Born, Citizen | 14 (82.4%) | 3 (17.6%) |
| Foreign Born, not a Citizen | 4 (100.0%) | 0 (0.0%) |
Health Insurance Coverage by Household Income in Wellersburg borough
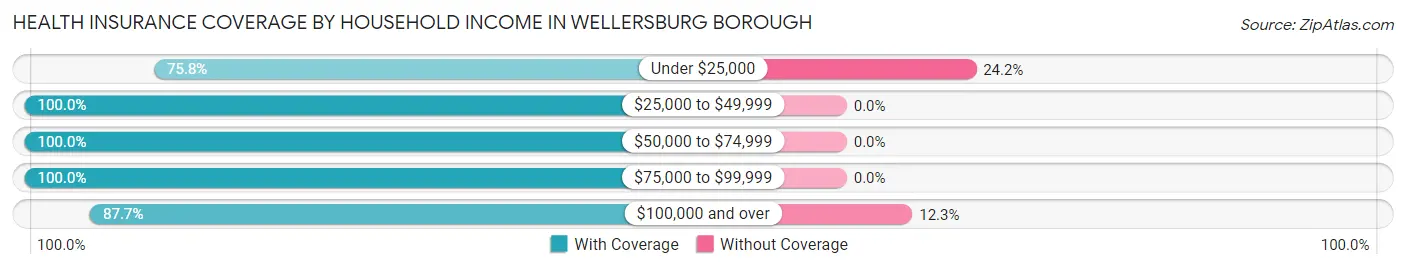
| Household Income | With Coverage | Without Coverage |
| Under $25,000 | 25 (75.8%) | 8 (24.2%) |
| $25,000 to $49,999 | 25 (100.0%) | 0 (0.0%) |
| $50,000 to $74,999 | 21 (100.0%) | 0 (0.0%) |
| $75,000 to $99,999 | 12 (100.0%) | 0 (0.0%) |
| $100,000 and over | 50 (87.7%) | 7 (12.3%) |
Public vs Private Health Insurance Coverage by Age in Wellersburg borough
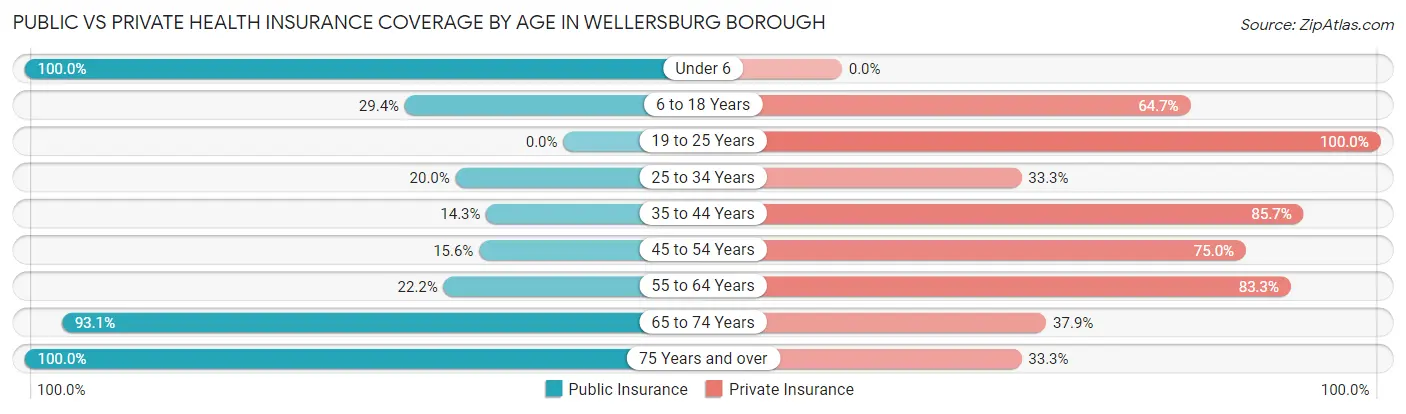
| Age Bracket | Public Insurance | Private Insurance |
| Under 6 | 7 (100.0%) | 0 (0.0%) |
| 6 to 18 Years | 5 (29.4%) | 11 (64.7%) |
| 19 to 25 Years | 0 (0.0%) | 4 (100.0%) |
| 25 to 34 Years | 3 (20.0%) | 5 (33.3%) |
| 35 to 44 Years | 2 (14.3%) | 12 (85.7%) |
| 45 to 54 Years | 5 (15.6%) | 24 (75.0%) |
| 55 to 64 Years | 4 (22.2%) | 15 (83.3%) |
| 65 to 74 Years | 27 (93.1%) | 11 (37.9%) |
| 75 Years and over | 12 (100.0%) | 4 (33.3%) |
| Total | 65 (43.9%) | 86 (58.1%) |
Disability Status by Sex by Age in Wellersburg borough
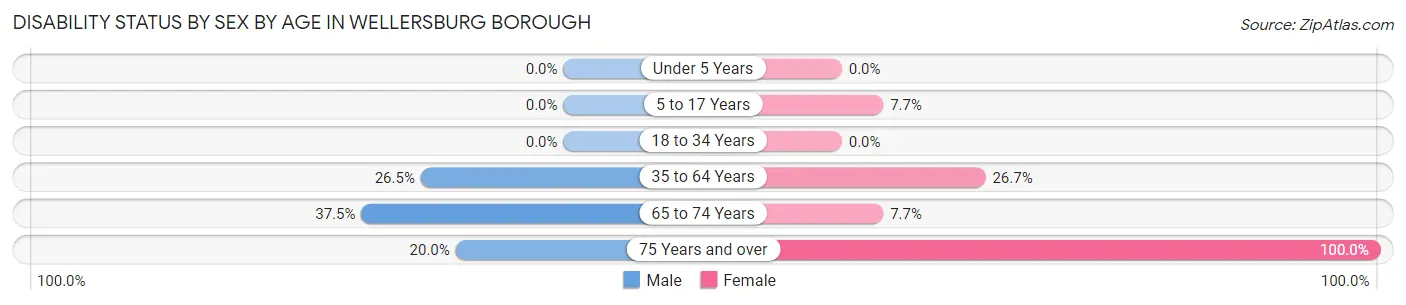
| Age Bracket | Male | Female |
| Under 5 Years | 0 (0.0%) | 0 (0.0%) |
| 5 to 17 Years | 0 (0.0%) | 1 (7.7%) |
| 18 to 34 Years | 0 (0.0%) | 0 (0.0%) |
| 35 to 64 Years | 9 (26.5%) | 8 (26.7%) |
| 65 to 74 Years | 6 (37.5%) | 1 (7.7%) |
| 75 Years and over | 1 (20.0%) | 7 (100.0%) |
Disability Class by Sex by Age in Wellersburg borough
Disability Class: Hearing Difficulty
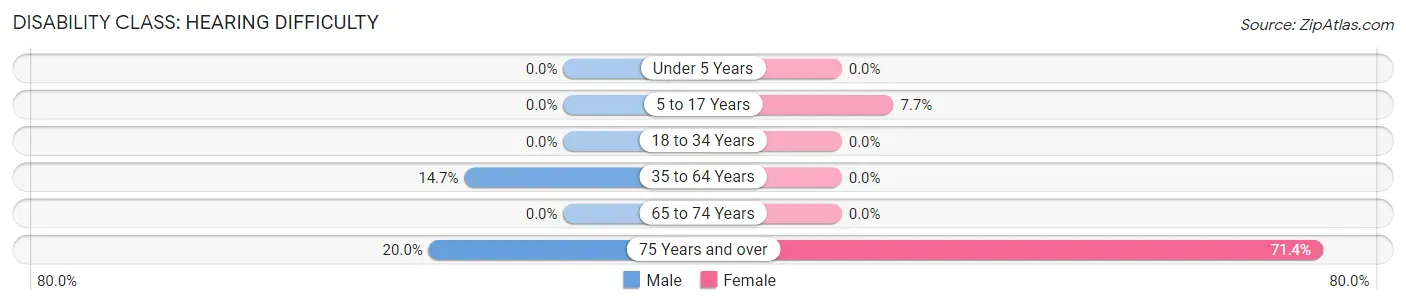
| Age Bracket | Male | Female |
| Under 5 Years | 0 (0.0%) | 0 (0.0%) |
| 5 to 17 Years | 0 (0.0%) | 1 (7.7%) |
| 18 to 34 Years | 0 (0.0%) | 0 (0.0%) |
| 35 to 64 Years | 5 (14.7%) | 0 (0.0%) |
| 65 to 74 Years | 0 (0.0%) | 0 (0.0%) |
| 75 Years and over | 1 (20.0%) | 5 (71.4%) |
Disability Class: Vision Difficulty
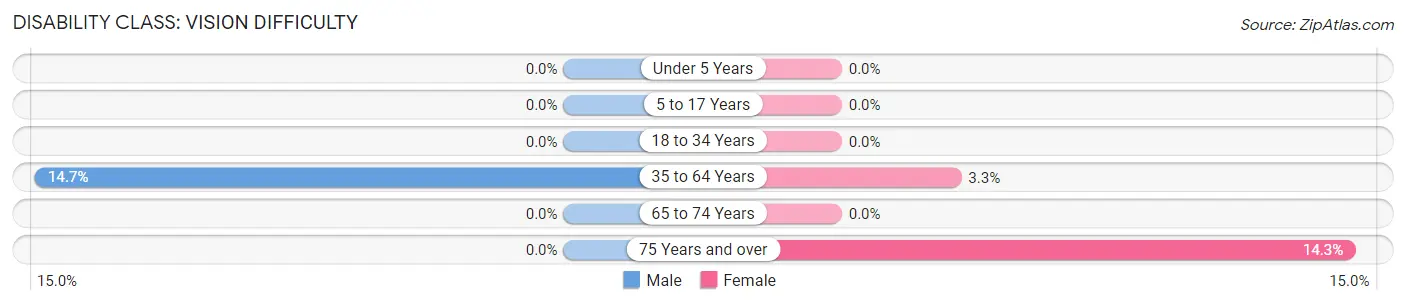
| Age Bracket | Male | Female |
| Under 5 Years | 0 (0.0%) | 0 (0.0%) |
| 5 to 17 Years | 0 (0.0%) | 0 (0.0%) |
| 18 to 34 Years | 0 (0.0%) | 0 (0.0%) |
| 35 to 64 Years | 5 (14.7%) | 1 (3.3%) |
| 65 to 74 Years | 0 (0.0%) | 0 (0.0%) |
| 75 Years and over | 0 (0.0%) | 1 (14.3%) |
Disability Class: Cognitive Difficulty
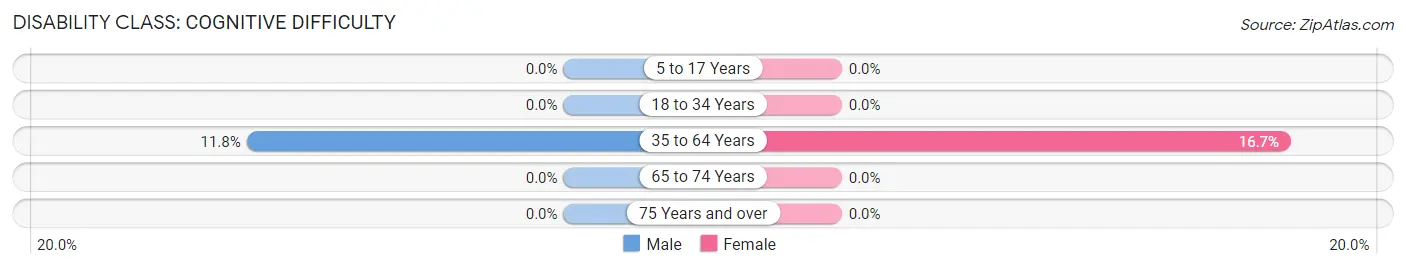
| Age Bracket | Male | Female |
| 5 to 17 Years | 0 (0.0%) | 0 (0.0%) |
| 18 to 34 Years | 0 (0.0%) | 0 (0.0%) |
| 35 to 64 Years | 4 (11.8%) | 5 (16.7%) |
| 65 to 74 Years | 0 (0.0%) | 0 (0.0%) |
| 75 Years and over | 0 (0.0%) | 0 (0.0%) |
Disability Class: Ambulatory Difficulty
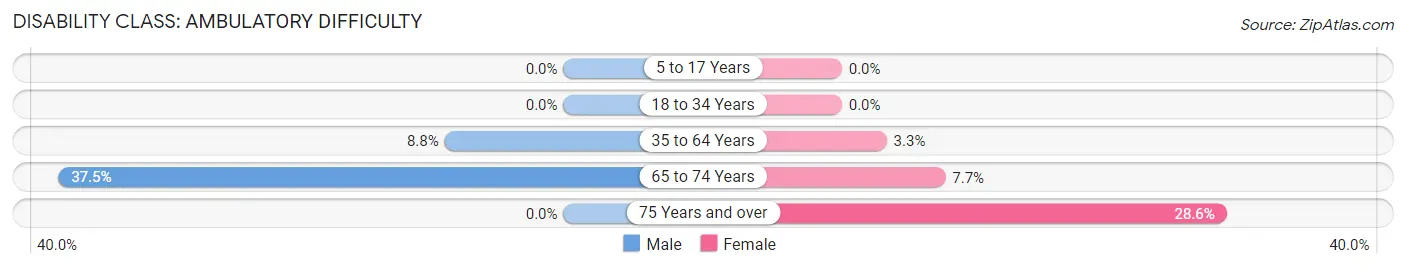
| Age Bracket | Male | Female |
| 5 to 17 Years | 0 (0.0%) | 0 (0.0%) |
| 18 to 34 Years | 0 (0.0%) | 0 (0.0%) |
| 35 to 64 Years | 3 (8.8%) | 1 (3.3%) |
| 65 to 74 Years | 6 (37.5%) | 1 (7.7%) |
| 75 Years and over | 0 (0.0%) | 2 (28.6%) |
Disability Class: Self-Care Difficulty
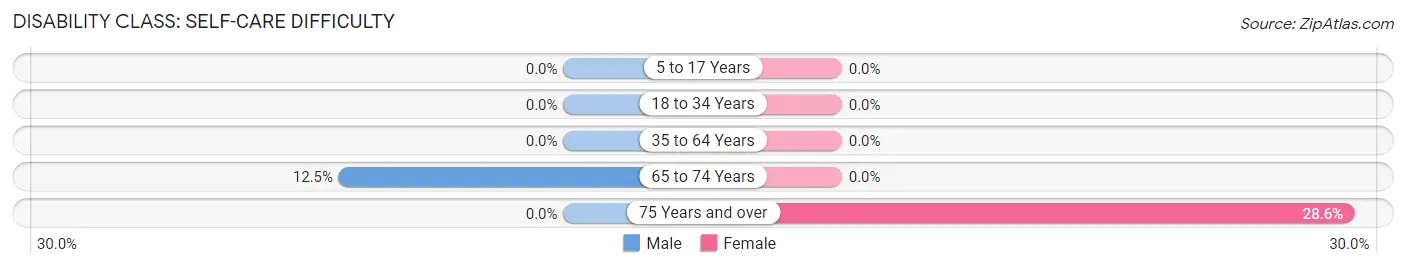
| Age Bracket | Male | Female |
| 5 to 17 Years | 0 (0.0%) | 0 (0.0%) |
| 18 to 34 Years | 0 (0.0%) | 0 (0.0%) |
| 35 to 64 Years | 0 (0.0%) | 0 (0.0%) |
| 65 to 74 Years | 2 (12.5%) | 0 (0.0%) |
| 75 Years and over | 0 (0.0%) | 2 (28.6%) |
Technology Access in Wellersburg borough
Computing Device Access in Wellersburg borough
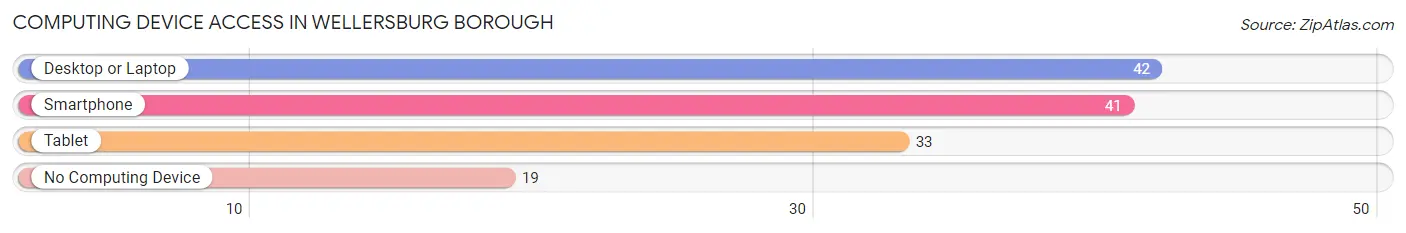
| Device Type | # Households | % Households |
| Desktop or Laptop | 42 | 62.7% |
| Smartphone | 41 | 61.2% |
| Tablet | 33 | 49.2% |
| No Computing Device | 19 | 28.4% |
| Total | 67 | 100.0% |
Internet Access in Wellersburg borough
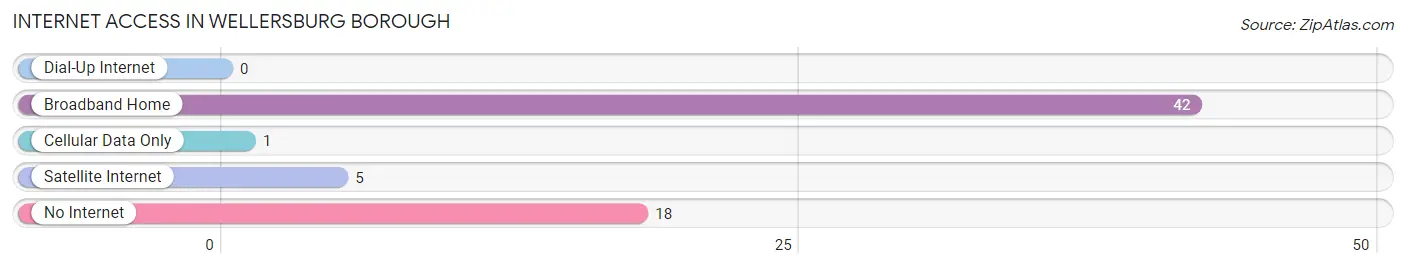
| Internet Type | # Households | % Households |
| Dial-Up Internet | 0 | 0.0% |
| Broadband Home | 42 | 62.7% |
| Cellular Data Only | 1 | 1.5% |
| Satellite Internet | 5 | 7.5% |
| No Internet | 18 | 26.9% |
| Total | 67 | 100.0% |
Wellersburg borough Summary
Wellersburg Borough is a small borough located in Somerset County, Pennsylvania. It is situated in the Appalachian Mountains, and is part of the Cumberland Valley region. The borough has a population of approximately 300 people, and is located about 25 miles south of Johnstown.
History
Wellersburg Borough was founded in 1845 by John Weller, a German immigrant. He purchased the land from the local Native American tribes and established a small settlement. The settlement grew quickly, and by the late 1800s, it had become a thriving community. The town was incorporated in 1891, and the first mayor was elected in 1892.
The town was originally a farming community, but in the early 1900s, the coal industry began to take off in the area. This led to an influx of immigrants from Eastern Europe, who came to work in the mines. The town also became a popular destination for tourists, as it was located near the Allegheny Mountains.
Geography
Wellersburg Borough is located in the Appalachian Mountains, and is part of the Cumberland Valley region. The borough is situated in a valley, and is surrounded by hills and mountains. The town is located about 25 miles south of Johnstown, and is about an hour and a half drive from Pittsburgh.
The borough is located in a humid continental climate zone, and experiences hot summers and cold winters. The average temperature in the summer is around 75 degrees Fahrenheit, and the average temperature in the winter is around 25 degrees Fahrenheit.
Economy
The economy of Wellersburg Borough is largely based on agriculture and tourism. The town is home to several farms, and the surrounding area is known for its production of apples, peaches, and other fruits and vegetables. The town is also a popular destination for tourists, as it is located near the Allegheny Mountains.
The town also has a few small businesses, including a grocery store, a hardware store, and a few restaurants. The town also has a post office, a bank, and a few other services.
Demographics
As of the 2010 census, the population of Wellersburg Borough was approximately 300 people. The racial makeup of the borough was 97.3% White, 0.7% African American, 0.3% Native American, 0.3% Asian, and 1.3% from other races. The median household income was $37,500, and the median family income was $41,250.
The town is home to a variety of religious denominations, including Catholic, Lutheran, Methodist, and Presbyterian. The town also has a few churches, including the Wellersburg United Methodist Church, the Wellersburg Presbyterian Church, and the Wellersburg Lutheran Church.
Conclusion
Wellersburg Borough is a small borough located in Somerset County, Pennsylvania. It is situated in the Appalachian Mountains, and is part of the Cumberland Valley region. The borough has a population of approximately 300 people, and is located about 25 miles south of Johnstown. The economy of Wellersburg Borough is largely based on agriculture and tourism, and the town is home to a variety of religious denominations. The town is also a popular destination for tourists, as it is located near the Allegheny Mountains.
Common Questions
What is Per Capita Income in Wellersburg borough?
Per Capita income in Wellersburg borough is $34,268.
What is the Median Family Income in Wellersburg borough?
Median Family Income in Wellersburg borough is $53,750.
What is the Median Household income in Wellersburg borough?
Median Household Income in Wellersburg borough is $51,250.
What is Income or Wage Gap in Wellersburg borough?
Income or Wage Gap in Wellersburg borough is 12.4%.
Women in Wellersburg borough earn 87.6 cents for every dollar earned by a man.
What is Inequality or Gini Index in Wellersburg borough?
Inequality or Gini Index in Wellersburg borough is 0.45.
What is the Total Population of Wellersburg borough?
Total Population of Wellersburg borough is 148.
What is the Total Male Population of Wellersburg borough?
Total Male Population of Wellersburg borough is 71.
What is the Total Female Population of Wellersburg borough?
Total Female Population of Wellersburg borough is 77.
What is the Ratio of Males per 100 Females in Wellersburg borough?
There are 92.21 Males per 100 Females in Wellersburg borough.
What is the Ratio of Females per 100 Males in Wellersburg borough?
There are 108.45 Females per 100 Males in Wellersburg borough.
What is the Median Population Age in Wellersburg borough?
Median Population Age in Wellersburg borough is 50.0 Years.
What is the Average Family Size in Wellersburg borough
Average Family Size in Wellersburg borough is 2.7 People.
What is the Average Household Size in Wellersburg borough
Average Household Size in Wellersburg borough is 2.2 People.
How Large is the Labor Force in Wellersburg borough?
There are 70 People in the Labor Forcein in Wellersburg borough.
What is the Percentage of People in the Labor Force in Wellersburg borough?
54.7% of People are in the Labor Force in Wellersburg borough.
What is the Unemployment Rate in Wellersburg borough?
Unemployment Rate in Wellersburg borough is 1.4%.