Mayfield borough, PA Map & Demographics
Mayfield borough Overview
$39,109
PER CAPITA INCOME
$97,885
AVG FAMILY INCOME
$84,545
AVG HOUSEHOLD INCOME
37.3%
WAGE / INCOME GAP [ % ]
62.7¢/ $1
WAGE / INCOME GAP [ $ ]
0.37
INEQUALITY / GINI INDEX
1,835
TOTAL POPULATION
829
MALE POPULATION
1,006
FEMALE POPULATION
82.41
MALES / 100 FEMALES
121.35
FEMALES / 100 MALES
41.7
MEDIAN AGE
2.8
AVG FAMILY SIZE
2.2
AVG HOUSEHOLD SIZE
1,098
LABOR FORCE [ PEOPLE ]
70.4%
PERCENT IN LABOR FORCE
4.2%
UNEMPLOYMENT RATE
Income in Mayfield borough
Income Overview in Mayfield borough
Per Capita Income in Mayfield borough is $39,109, while median incomes of families and households are $97,885 and $84,545 respectively.
| Characteristic | Number | Measure |
| Per Capita Income | 1,835 | $39,109 |
| Median Family Income | 456 | $97,885 |
| Mean Family Income | 456 | $98,591 |
| Median Household Income | 826 | $84,545 |
| Mean Household Income | 826 | $87,162 |
| Income Deficit | 456 | $0 |
| Wage / Income Gap (%) | 1,835 | 37.31% |
| Wage / Income Gap ($) | 1,835 | 62.69¢ per $1 |
| Gini / Inequality Index | 1,835 | 0.37 |
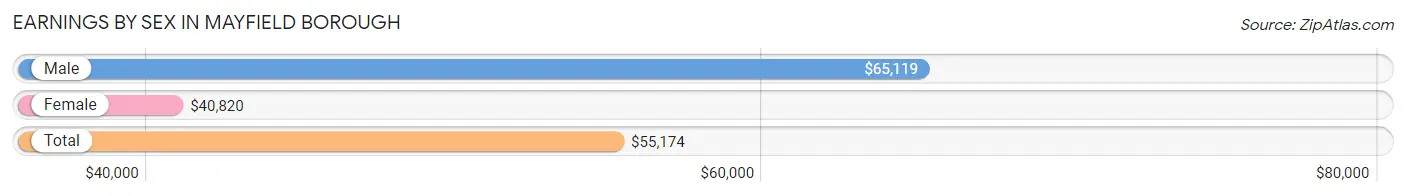
Earnings by Sex in Mayfield borough
Average Earnings in Mayfield borough are $55,174, $65,119 for men and $40,820 for women, a difference of 37.3%.
| Sex | Number | Average Earnings |
| Male | 552 (50.8%) | $65,119 |
| Female | 535 (49.2%) | $40,820 |
| Total | 1,087 (100.0%) | $55,174 |
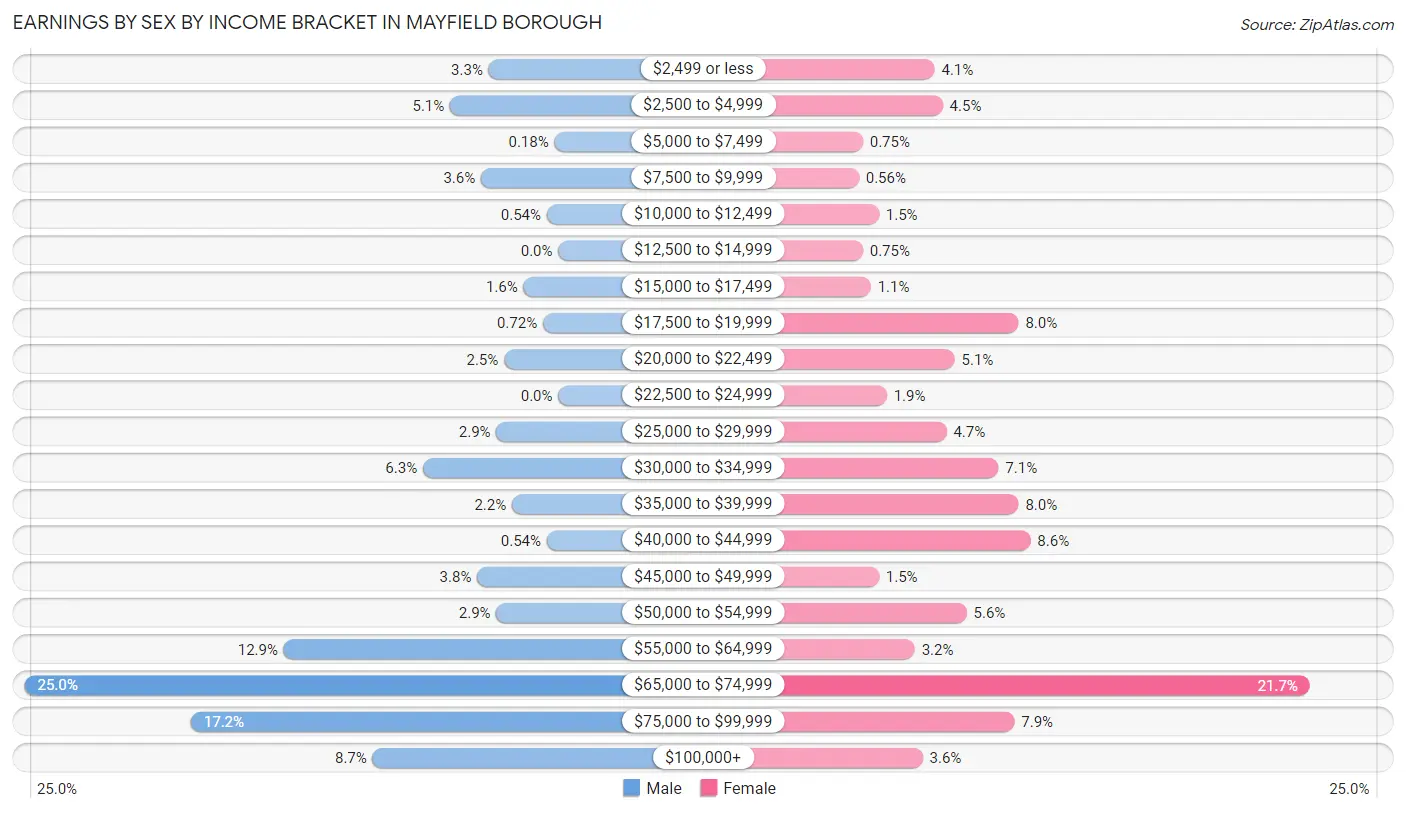
Earnings by Sex by Income Bracket in Mayfield borough
The most common earnings brackets in Mayfield borough are $65,000 to $74,999 for men (138 | 25.0%) and $65,000 to $74,999 for women (116 | 21.7%).
| Income | Male | Female |
| $2,499 or less | 18 (3.3%) | 22 (4.1%) |
| $2,500 to $4,999 | 28 (5.1%) | 24 (4.5%) |
| $5,000 to $7,499 | 1 (0.2%) | 4 (0.7%) |
| $7,500 to $9,999 | 20 (3.6%) | 3 (0.6%) |
| $10,000 to $12,499 | 3 (0.5%) | 8 (1.5%) |
| $12,500 to $14,999 | 0 (0.0%) | 4 (0.7%) |
| $15,000 to $17,499 | 9 (1.6%) | 6 (1.1%) |
| $17,500 to $19,999 | 4 (0.7%) | 43 (8.0%) |
| $20,000 to $22,499 | 14 (2.5%) | 27 (5.1%) |
| $22,500 to $24,999 | 0 (0.0%) | 10 (1.9%) |
| $25,000 to $29,999 | 16 (2.9%) | 25 (4.7%) |
| $30,000 to $34,999 | 35 (6.3%) | 38 (7.1%) |
| $35,000 to $39,999 | 12 (2.2%) | 43 (8.0%) |
| $40,000 to $44,999 | 3 (0.5%) | 46 (8.6%) |
| $45,000 to $49,999 | 21 (3.8%) | 8 (1.5%) |
| $50,000 to $54,999 | 16 (2.9%) | 30 (5.6%) |
| $55,000 to $64,999 | 71 (12.9%) | 17 (3.2%) |
| $65,000 to $74,999 | 138 (25.0%) | 116 (21.7%) |
| $75,000 to $99,999 | 95 (17.2%) | 42 (7.9%) |
| $100,000+ | 48 (8.7%) | 19 (3.5%) |
| Total | 552 (100.0%) | 535 (100.0%) |
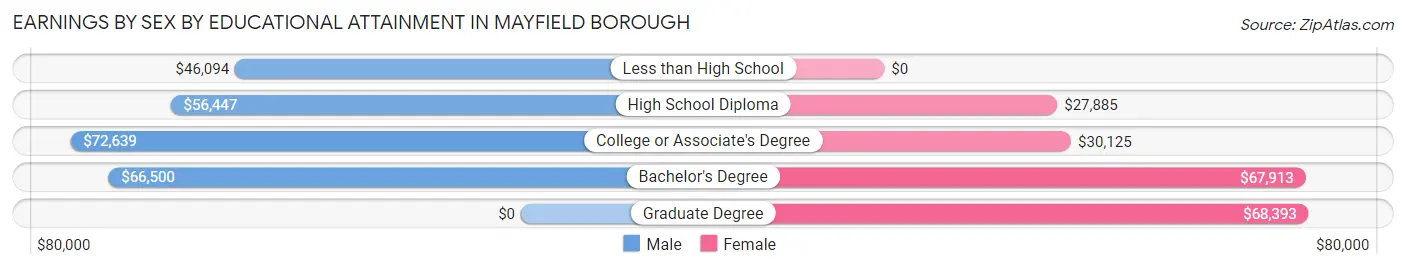
Earnings by Sex by Educational Attainment in Mayfield borough
Average earnings in Mayfield borough are $65,762 for men and $43,036 for women, a difference of 34.6%. Men with an educational attainment of college or associate's degree enjoy the highest average annual earnings of $72,639, while those with less than high school education earn the least with $46,094. Women with an educational attainment of graduate degree earn the most with the average annual earnings of $68,393, while those with high school diploma education have the smallest earnings of $27,885.
| Educational Attainment | Male Income | Female Income |
| Less than High School | $46,094 | $0 |
| High School Diploma | $56,447 | $27,885 |
| College or Associate's Degree | $72,639 | $30,125 |
| Bachelor's Degree | $66,500 | $67,913 |
| Graduate Degree | - | - |
| Total | $65,762 | $43,036 |
Family Income in Mayfield borough
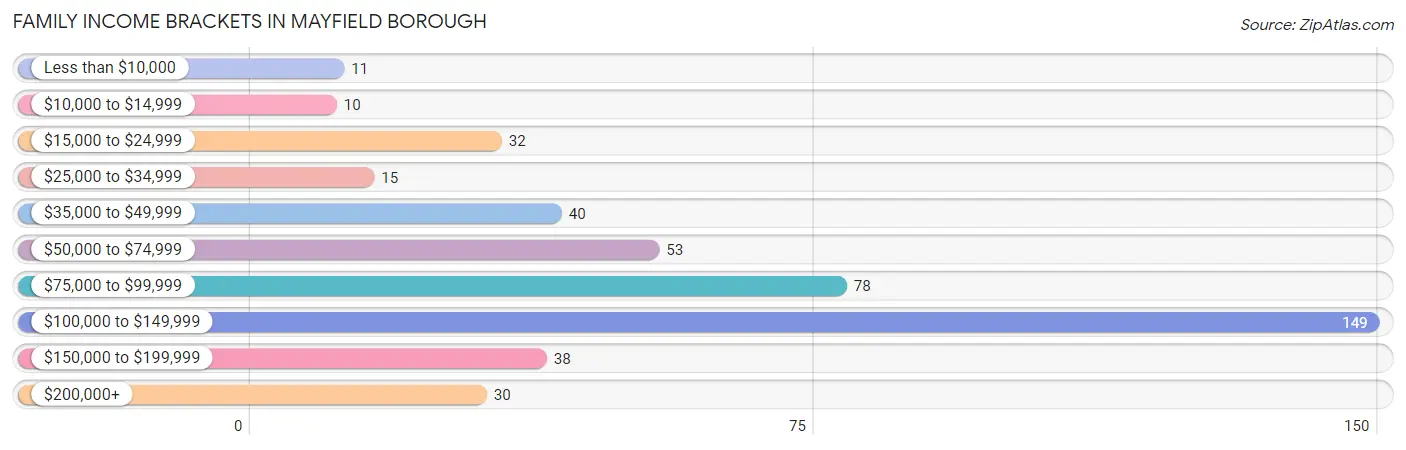
Family Income Brackets in Mayfield borough
According to the Mayfield borough family income data, there are 149 families falling into the $100,000 to $149,999 income range, which is the most common income bracket and makes up 32.7% of all families. Conversely, the $10,000 to $14,999 income bracket is the least frequent group with only 10 families (2.2%) belonging to this category.
| Income Bracket | # Families | % Families |
| Less than $10,000 | 11 | 2.4% |
| $10,000 to $14,999 | 10 | 2.2% |
| $15,000 to $24,999 | 32 | 7.0% |
| $25,000 to $34,999 | 15 | 3.3% |
| $35,000 to $49,999 | 40 | 8.8% |
| $50,000 to $74,999 | 53 | 11.6% |
| $75,000 to $99,999 | 78 | 17.1% |
| $100,000 to $149,999 | 149 | 32.7% |
| $150,000 to $199,999 | 38 | 8.3% |
| $200,000+ | 30 | 6.6% |
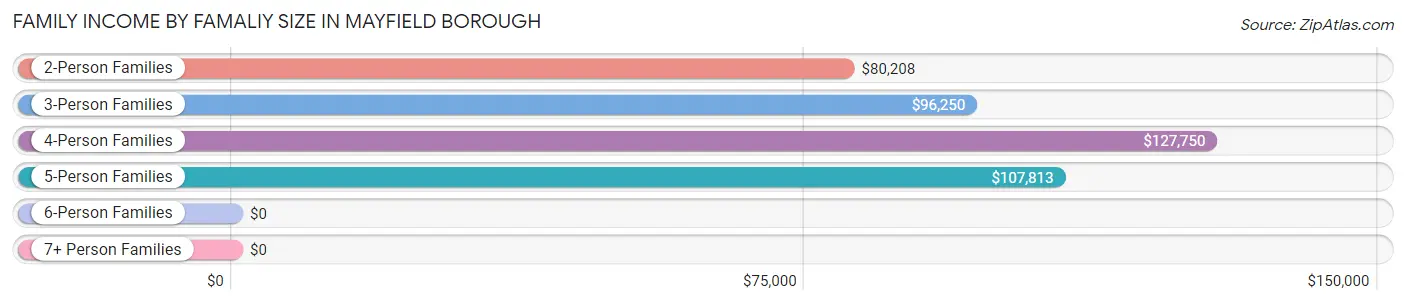
Family Income by Famaliy Size in Mayfield borough
4-person families (65 | 14.2%) account for the highest median family income in Mayfield borough with $127,750 per family, while 2-person families (217 | 47.6%) have the highest median income of $40,104 per family member.
| Income Bracket | # Families | Median Income |
| 2-Person Families | 217 (47.6%) | $80,208 |
| 3-Person Families | 147 (32.2%) | $96,250 |
| 4-Person Families | 65 (14.2%) | $127,750 |
| 5-Person Families | 15 (3.3%) | $107,813 |
| 6-Person Families | 10 (2.2%) | $0 |
| 7+ Person Families | 2 (0.4%) | $0 |
| Total | 456 (100.0%) | $97,885 |
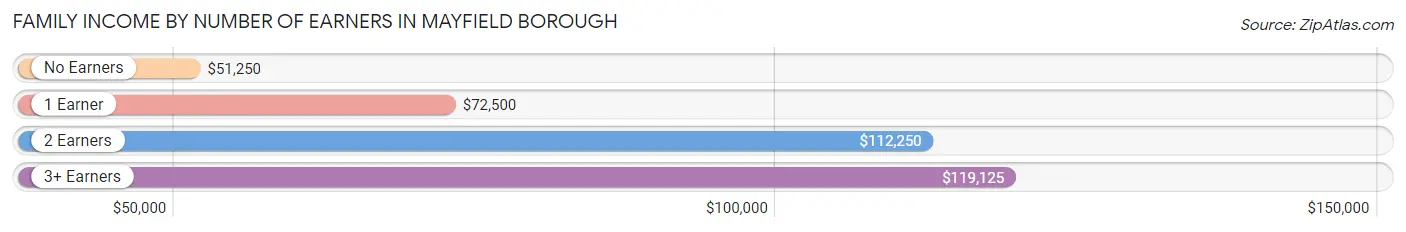
Family Income by Number of Earners in Mayfield borough
The median family income in Mayfield borough is $97,885, with families comprising 3+ earners (47) having the highest median family income of $119,125, while families with no earners (56) have the lowest median family income of $51,250, accounting for 10.3% and 12.3% of families, respectively.
| Number of Earners | # Families | Median Income |
| No Earners | 56 (12.3%) | $51,250 |
| 1 Earner | 164 (36.0%) | $72,500 |
| 2 Earners | 189 (41.4%) | $112,250 |
| 3+ Earners | 47 (10.3%) | $119,125 |
| Total | 456 (100.0%) | $97,885 |
Household Income in Mayfield borough
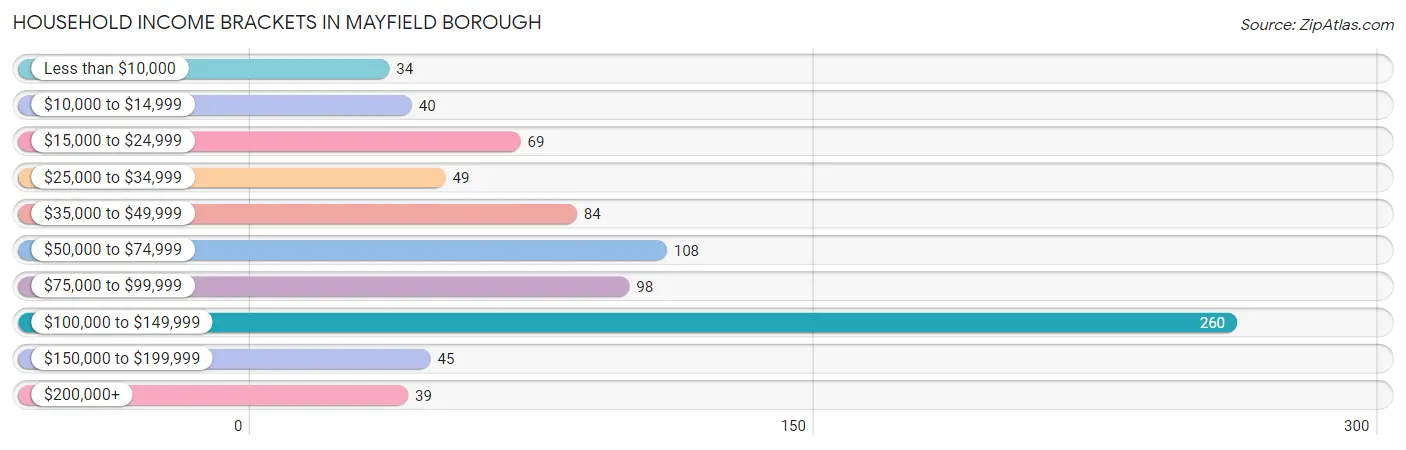
Household Income Brackets in Mayfield borough
With 260 households falling in the category, the $100,000 to $149,999 income range is the most frequent in Mayfield borough, accounting for 31.5% of all households. In contrast, only 34 households (4.1%) fall into the less than $10,000 income bracket, making it the least populous group.
| Income Bracket | # Households | % Households |
| Less than $10,000 | 34 | 4.1% |
| $10,000 to $14,999 | 40 | 4.8% |
| $15,000 to $24,999 | 69 | 8.4% |
| $25,000 to $34,999 | 49 | 5.9% |
| $35,000 to $49,999 | 84 | 10.2% |
| $50,000 to $74,999 | 108 | 13.1% |
| $75,000 to $99,999 | 98 | 11.9% |
| $100,000 to $149,999 | 260 | 31.5% |
| $150,000 to $199,999 | 45 | 5.4% |
| $200,000+ | 39 | 4.7% |
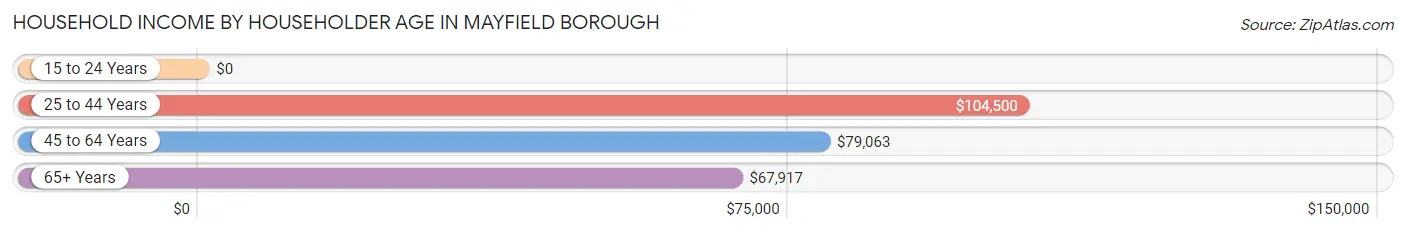
Household Income by Householder Age in Mayfield borough
The median household income in Mayfield borough is $84,545, with the highest median household income of $104,500 found in the 25 to 44 years age bracket for the primary householder. A total of 262 households (31.7%) fall into this category. Meanwhile, the 15 to 24 years age bracket for the primary householder has the lowest median household income of $0, with 9 households (1.1%) in this group.
| Income Bracket | # Households | Median Income |
| 15 to 24 Years | 9 (1.1%) | $0 |
| 25 to 44 Years | 262 (31.7%) | $104,500 |
| 45 to 64 Years | 362 (43.8%) | $79,063 |
| 65+ Years | 193 (23.4%) | $67,917 |
| Total | 826 (100.0%) | $84,545 |
Poverty in Mayfield borough
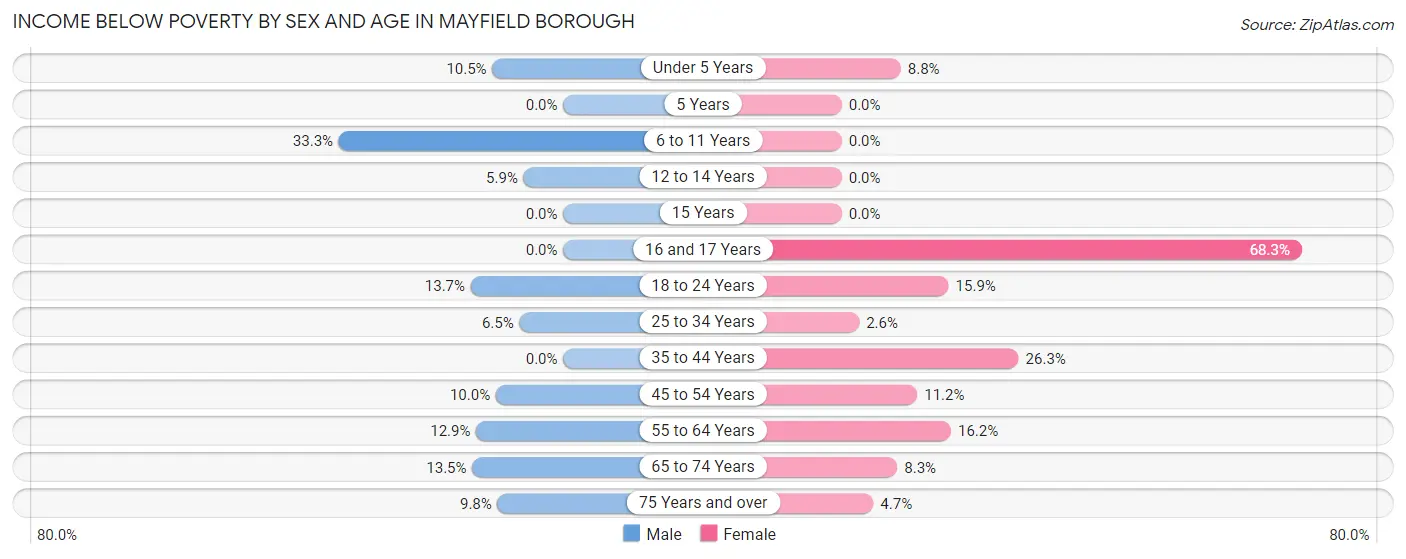
Income Below Poverty by Sex and Age in Mayfield borough
With 10.4% poverty level for males and 12.7% for females among the residents of Mayfield borough, 6 to 11 year old males and 16 and 17 year old females are the most vulnerable to poverty, with 17 males (33.3%) and 28 females (68.3%) in their respective age groups living below the poverty level.
| Age Bracket | Male | Female |
| Under 5 Years | 2 (10.5%) | 5 (8.8%) |
| 5 Years | 0 (0.0%) | 0 (0.0%) |
| 6 to 11 Years | 17 (33.3%) | 0 (0.0%) |
| 12 to 14 Years | 2 (5.9%) | 0 (0.0%) |
| 15 Years | 0 (0.0%) | 0 (0.0%) |
| 16 and 17 Years | 0 (0.0%) | 28 (68.3%) |
| 18 to 24 Years | 7 (13.7%) | 10 (15.9%) |
| 25 to 34 Years | 11 (6.5%) | 5 (2.6%) |
| 35 to 44 Years | 0 (0.0%) | 26 (26.3%) |
| 45 to 54 Years | 14 (10.0%) | 13 (11.2%) |
| 55 to 64 Years | 19 (12.9%) | 30 (16.2%) |
| 65 to 74 Years | 10 (13.5%) | 8 (8.3%) |
| 75 Years and over | 4 (9.8%) | 3 (4.7%) |
| Total | 86 (10.4%) | 128 (12.7%) |
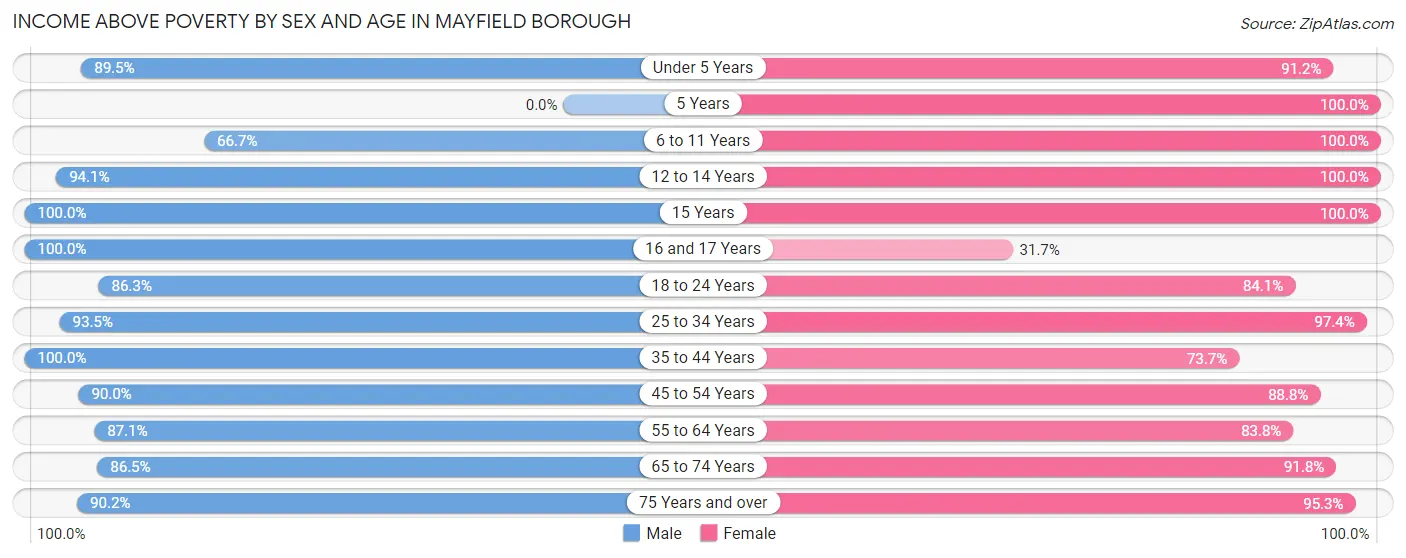
Income Above Poverty by Sex and Age in Mayfield borough
According to the poverty statistics in Mayfield borough, males aged 15 years and females aged 5 years are the age groups that are most secure financially, with 100.0% of males and 100.0% of females in these age groups living above the poverty line.
| Age Bracket | Male | Female |
| Under 5 Years | 17 (89.5%) | 52 (91.2%) |
| 5 Years | 0 (0.0%) | 11 (100.0%) |
| 6 to 11 Years | 34 (66.7%) | 20 (100.0%) |
| 12 to 14 Years | 32 (94.1%) | 50 (100.0%) |
| 15 Years | 17 (100.0%) | 10 (100.0%) |
| 16 and 17 Years | 29 (100.0%) | 13 (31.7%) |
| 18 to 24 Years | 44 (86.3%) | 53 (84.1%) |
| 25 to 34 Years | 158 (93.5%) | 188 (97.4%) |
| 35 to 44 Years | 51 (100.0%) | 73 (73.7%) |
| 45 to 54 Years | 126 (90.0%) | 103 (88.8%) |
| 55 to 64 Years | 128 (87.1%) | 155 (83.8%) |
| 65 to 74 Years | 64 (86.5%) | 89 (91.7%) |
| 75 Years and over | 37 (90.2%) | 61 (95.3%) |
| Total | 737 (89.5%) | 878 (87.3%) |
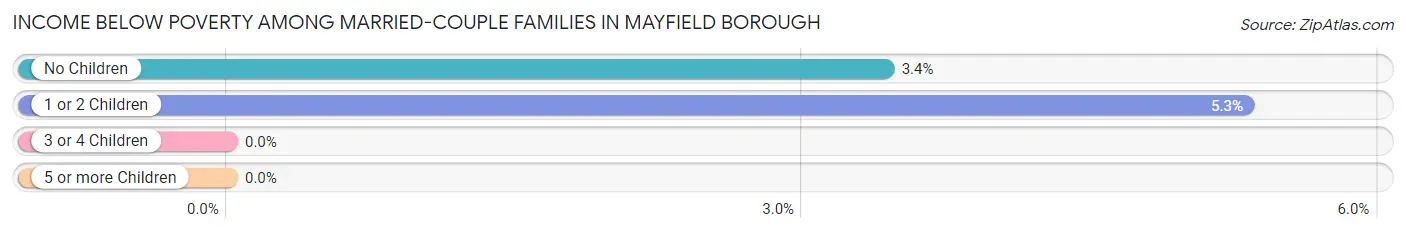
Income Below Poverty Among Married-Couple Families in Mayfield borough
The poverty statistics for married-couple families in Mayfield borough show that 3.9% or 13 of the total 333 families live below the poverty line. Families with 1 or 2 children have the highest poverty rate of 5.3%, comprising of 6 families. On the other hand, families with 3 or 4 children have the lowest poverty rate of 0.0%, which includes 0 families.
| Children | Above Poverty | Below Poverty |
| No Children | 197 (96.6%) | 7 (3.4%) |
| 1 or 2 Children | 107 (94.7%) | 6 (5.3%) |
| 3 or 4 Children | 16 (100.0%) | 0 (0.0%) |
| 5 or more Children | 0 (0.0%) | 0 (0.0%) |
| Total | 320 (96.1%) | 13 (3.9%) |
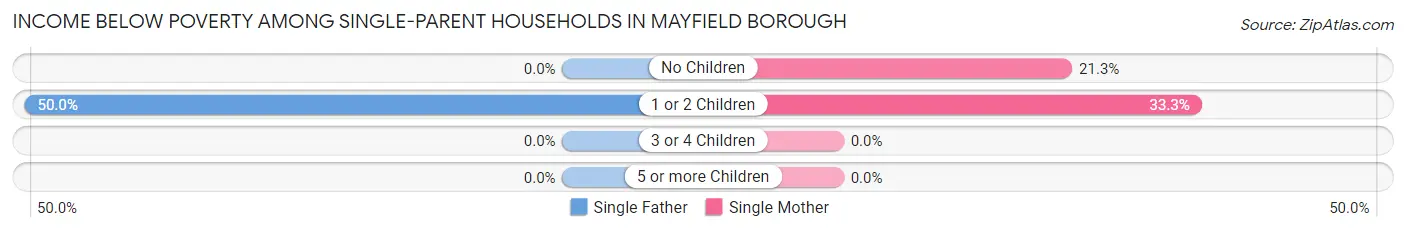
Income Below Poverty Among Single-Parent Households in Mayfield borough
According to the poverty data in Mayfield borough, 25.0% or 4 single-father households and 28.0% or 30 single-mother households are living below the poverty line. Among single-father households, those with 1 or 2 children have the highest poverty rate, with 4 households (50.0%) experiencing poverty. Likewise, among single-mother households, those with 1 or 2 children have the highest poverty rate, with 20 households (33.3%) falling below the poverty line.
| Children | Single Father | Single Mother |
| No Children | 0 (0.0%) | 10 (21.3%) |
| 1 or 2 Children | 4 (50.0%) | 20 (33.3%) |
| 3 or 4 Children | 0 (0.0%) | 0 (0.0%) |
| 5 or more Children | 0 (0.0%) | 0 (0.0%) |
| Total | 4 (25.0%) | 30 (28.0%) |
Income Below Poverty Among Married-Couple vs Single-Parent Households in Mayfield borough
The poverty data for Mayfield borough shows that 13 of the married-couple family households (3.9%) and 34 of the single-parent households (27.6%) are living below the poverty level. Within the married-couple family households, those with 1 or 2 children have the highest poverty rate, with 6 households (5.3%) falling below the poverty line. Among the single-parent households, those with 1 or 2 children have the highest poverty rate, with 24 household (35.3%) living below poverty.
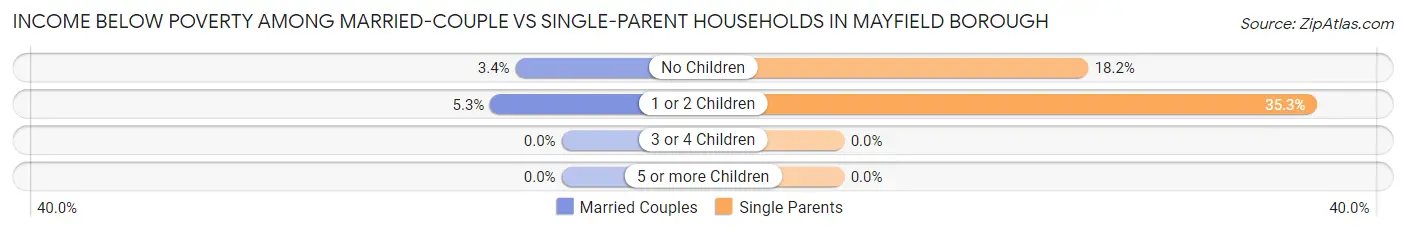
| Children | Married-Couple Families | Single-Parent Households |
| No Children | 7 (3.4%) | 10 (18.2%) |
| 1 or 2 Children | 6 (5.3%) | 24 (35.3%) |
| 3 or 4 Children | 0 (0.0%) | 0 (0.0%) |
| 5 or more Children | 0 (0.0%) | 0 (0.0%) |
| Total | 13 (3.9%) | 34 (27.6%) |
Race in Mayfield borough
The most populous races in Mayfield borough are White / Caucasian (1,624 | 88.5%), Two or more Races (196 | 10.7%), and Asian (14 | 0.8%).
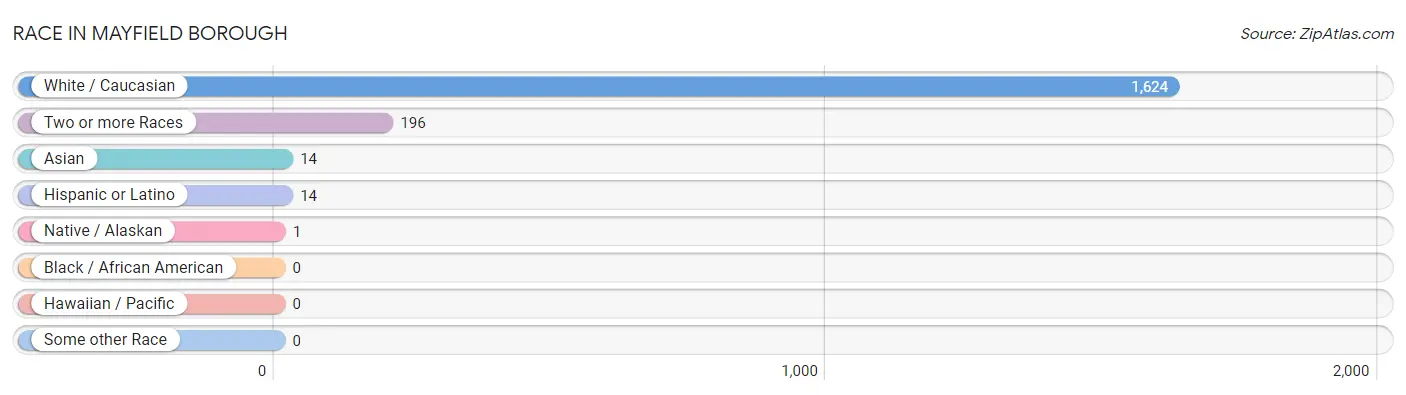
| Race | # Population | % Population |
| Asian | 14 | 0.8% |
| Black / African American | 0 | 0.0% |
| Hawaiian / Pacific | 0 | 0.0% |
| Hispanic or Latino | 14 | 0.8% |
| Native / Alaskan | 1 | 0.1% |
| White / Caucasian | 1,624 | 88.5% |
| Two or more Races | 196 | 10.7% |
| Some other Race | 0 | 0.0% |
| Total | 1,835 | 100.0% |
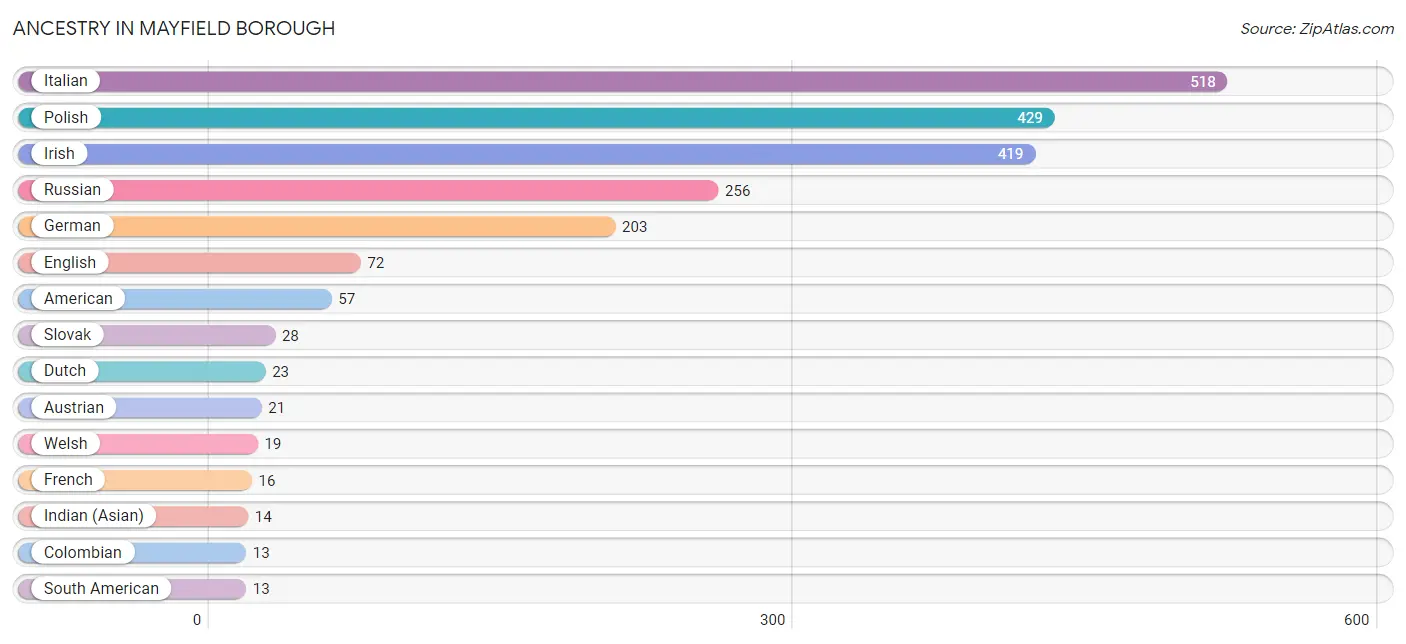
Ancestry in Mayfield borough
The most populous ancestries reported in Mayfield borough are Italian (518 | 28.2%), Polish (429 | 23.4%), Irish (419 | 22.8%), Russian (256 | 14.0%), and German (203 | 11.1%), together accounting for 99.4% of all Mayfield borough residents.
| Ancestry | # Population | % Population |
| American | 57 | 3.1% |
| Apache | 1 | 0.1% |
| Armenian | 4 | 0.2% |
| Austrian | 21 | 1.1% |
| Burmese | 3 | 0.2% |
| Colombian | 13 | 0.7% |
| Czechoslovakian | 7 | 0.4% |
| Dutch | 23 | 1.3% |
| Eastern European | 4 | 0.2% |
| English | 72 | 3.9% |
| European | 8 | 0.4% |
| French | 16 | 0.9% |
| French Canadian | 10 | 0.5% |
| German | 203 | 11.1% |
| Greek | 5 | 0.3% |
| Hungarian | 7 | 0.4% |
| Indian (Asian) | 14 | 0.8% |
| Irish | 419 | 22.8% |
| Italian | 518 | 28.2% |
| Lithuanian | 12 | 0.6% |
| Mexican | 1 | 0.1% |
| Norwegian | 2 | 0.1% |
| Polish | 429 | 23.4% |
| Portuguese | 4 | 0.2% |
| Russian | 256 | 14.0% |
| Scotch-Irish | 11 | 0.6% |
| Slovak | 28 | 1.5% |
| Slovene | 2 | 0.1% |
| South American | 13 | 0.7% |
| Swedish | 6 | 0.3% |
| Ukrainian | 10 | 0.5% |
| Welsh | 19 | 1.0% | View All 32 Rows |
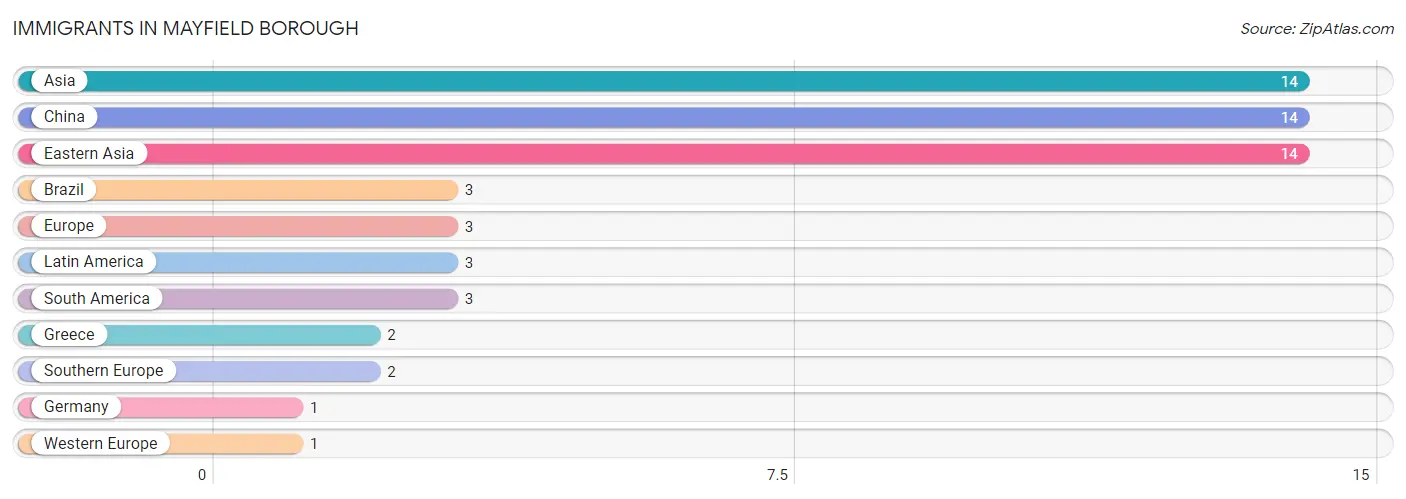
Immigrants in Mayfield borough
The most numerous immigrant groups reported in Mayfield borough came from Asia (14 | 0.8%), China (14 | 0.8%), Eastern Asia (14 | 0.8%), Brazil (3 | 0.2%), and Europe (3 | 0.2%), together accounting for 2.6% of all Mayfield borough residents.
| Immigration Origin | # Population | % Population |
| Asia | 14 | 0.8% |
| Brazil | 3 | 0.2% |
| China | 14 | 0.8% |
| Eastern Asia | 14 | 0.8% |
| Europe | 3 | 0.2% |
| Germany | 1 | 0.1% |
| Greece | 2 | 0.1% |
| Latin America | 3 | 0.2% |
| South America | 3 | 0.2% |
| Southern Europe | 2 | 0.1% |
| Western Europe | 1 | 0.1% | View All 11 Rows |
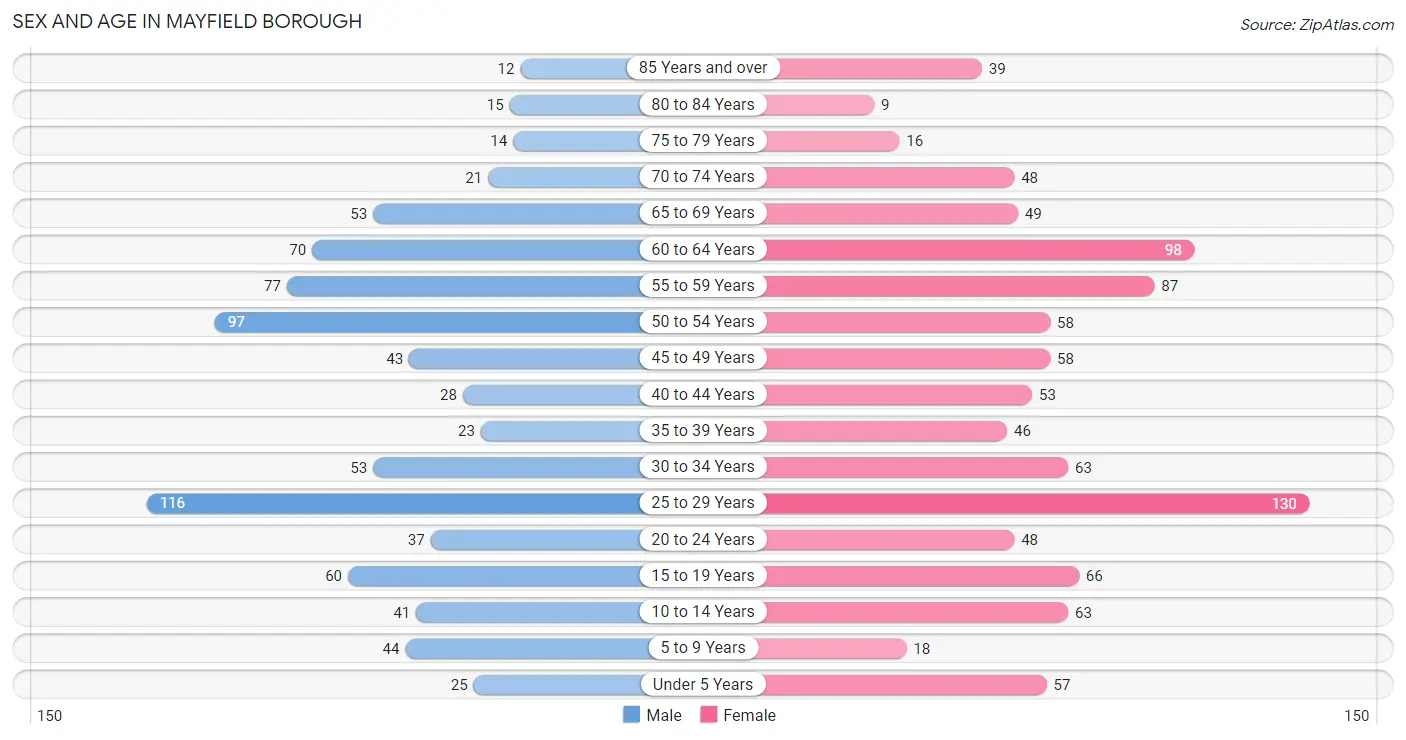
Sex and Age in Mayfield borough
Sex and Age in Mayfield borough
The most populous age groups in Mayfield borough are 25 to 29 Years (116 | 14.0%) for men and 25 to 29 Years (130 | 12.9%) for women.
| Age Bracket | Male | Female |
| Under 5 Years | 25 (3.0%) | 57 (5.7%) |
| 5 to 9 Years | 44 (5.3%) | 18 (1.8%) |
| 10 to 14 Years | 41 (5.0%) | 63 (6.3%) |
| 15 to 19 Years | 60 (7.2%) | 66 (6.6%) |
| 20 to 24 Years | 37 (4.5%) | 48 (4.8%) |
| 25 to 29 Years | 116 (14.0%) | 130 (12.9%) |
| 30 to 34 Years | 53 (6.4%) | 63 (6.3%) |
| 35 to 39 Years | 23 (2.8%) | 46 (4.6%) |
| 40 to 44 Years | 28 (3.4%) | 53 (5.3%) |
| 45 to 49 Years | 43 (5.2%) | 58 (5.8%) |
| 50 to 54 Years | 97 (11.7%) | 58 (5.8%) |
| 55 to 59 Years | 77 (9.3%) | 87 (8.6%) |
| 60 to 64 Years | 70 (8.4%) | 98 (9.7%) |
| 65 to 69 Years | 53 (6.4%) | 49 (4.9%) |
| 70 to 74 Years | 21 (2.5%) | 48 (4.8%) |
| 75 to 79 Years | 14 (1.7%) | 16 (1.6%) |
| 80 to 84 Years | 15 (1.8%) | 9 (0.9%) |
| 85 Years and over | 12 (1.5%) | 39 (3.9%) |
| Total | 829 (100.0%) | 1,006 (100.0%) |
Families and Households in Mayfield borough
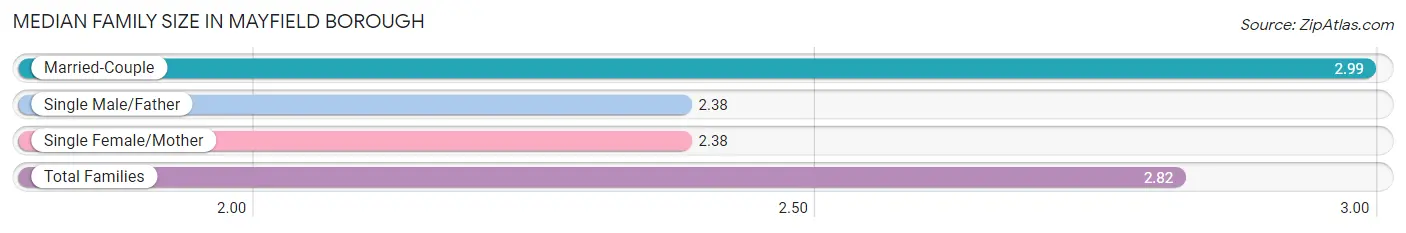
Median Family Size in Mayfield borough
The median family size in Mayfield borough is 2.82 persons per family, with married-couple families (333 | 73.0%) accounting for the largest median family size of 2.99 persons per family. On the other hand, single male/father families (16 | 3.5%) represent the smallest median family size with 2.38 persons per family.
| Family Type | # Families | Family Size |
| Married-Couple | 333 (73.0%) | 2.99 |
| Single Male/Father | 16 (3.5%) | 2.38 |
| Single Female/Mother | 107 (23.5%) | 2.38 |
| Total Families | 456 (100.0%) | 2.82 |
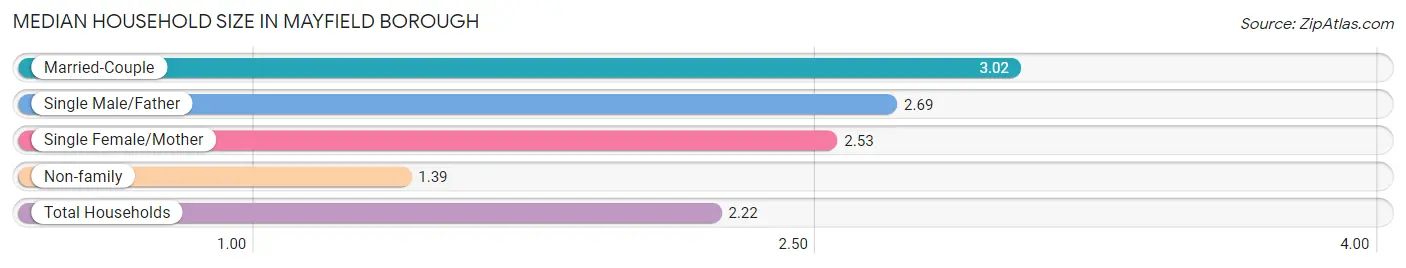
Median Household Size in Mayfield borough
The median household size in Mayfield borough is 2.22 persons per household, with married-couple households (333 | 40.3%) accounting for the largest median household size of 3.02 persons per household. non-family households (370 | 44.8%) represent the smallest median household size with 1.39 persons per household.
| Household Type | # Households | Household Size |
| Married-Couple | 333 (40.3%) | 3.02 |
| Single Male/Father | 16 (1.9%) | 2.69 |
| Single Female/Mother | 107 (13.0%) | 2.53 |
| Non-family | 370 (44.8%) | 1.39 |
| Total Households | 826 (100.0%) | 2.22 |
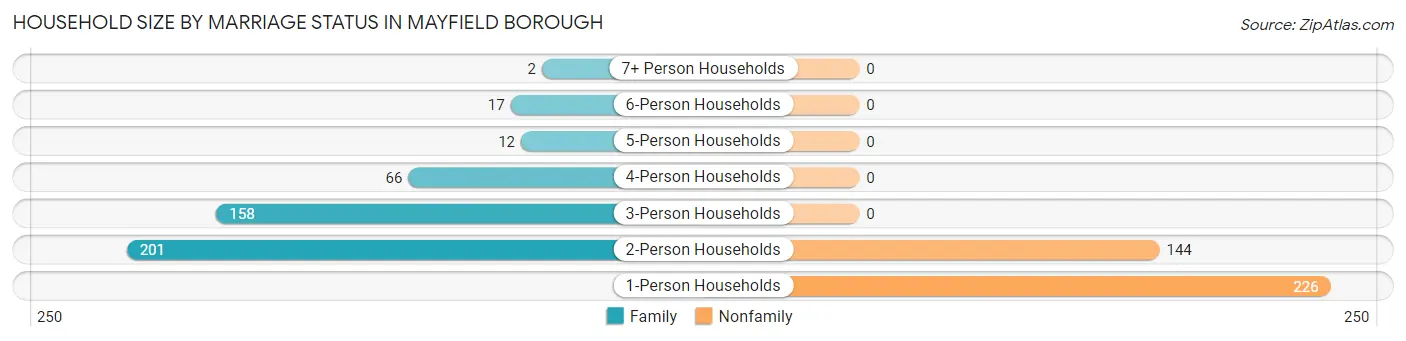
Household Size by Marriage Status in Mayfield borough
Out of a total of 826 households in Mayfield borough, 456 (55.2%) are family households, while 370 (44.8%) are nonfamily households. The most numerous type of family households are 2-person households, comprising 201, and the most common type of nonfamily households are 1-person households, comprising 226.
| Household Size | Family Households | Nonfamily Households |
| 1-Person Households | - | 226 (27.4%) |
| 2-Person Households | 201 (24.3%) | 144 (17.4%) |
| 3-Person Households | 158 (19.1%) | 0 (0.0%) |
| 4-Person Households | 66 (8.0%) | 0 (0.0%) |
| 5-Person Households | 12 (1.5%) | 0 (0.0%) |
| 6-Person Households | 17 (2.1%) | 0 (0.0%) |
| 7+ Person Households | 2 (0.2%) | 0 (0.0%) |
| Total | 456 (55.2%) | 370 (44.8%) |
Female Fertility in Mayfield borough
Fertility by Age in Mayfield borough
Average fertility rate in Mayfield borough is 51.0 births per 1,000 women. Women in the age bracket of 20 to 34 years have the highest fertility rate with 100.0 births per 1,000 women. Women in the age bracket of 20 to 34 years acount for 100.0% of all women with births.
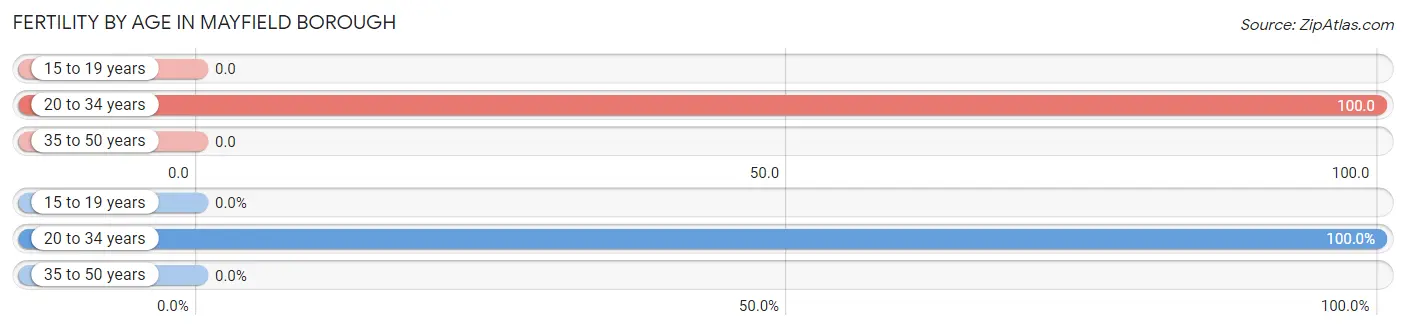
| Age Bracket | Women with Births | Births / 1,000 Women |
| 15 to 19 years | 0 (0.0%) | 0.0 |
| 20 to 34 years | 24 (100.0%) | 100.0 |
| 35 to 50 years | 0 (0.0%) | 0.0 |
| Total | 24 (100.0%) | 51.0 |
Fertility by Age by Marriage Status in Mayfield borough
45.8% of women with births (24) in Mayfield borough are married. The highest percentage of unmarried women with births falls into 20 to 34 years age bracket with 54.2% of them unmarried at the time of birth, while the lowest percentage of unmarried women with births belong to 20 to 34 years age bracket with 54.2% of them unmarried.
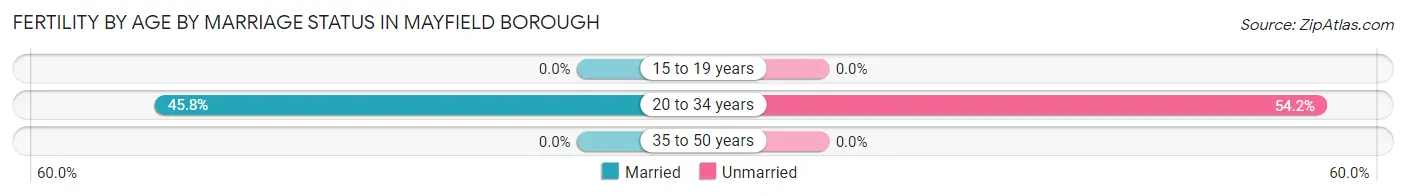
| Age Bracket | Married | Unmarried |
| 15 to 19 years | 0 (0.0%) | 0 (0.0%) |
| 20 to 34 years | 11 (45.8%) | 13 (54.2%) |
| 35 to 50 years | 0 (0.0%) | 0 (0.0%) |
| Total | 11 (45.8%) | 13 (54.2%) |
Fertility by Education in Mayfield borough
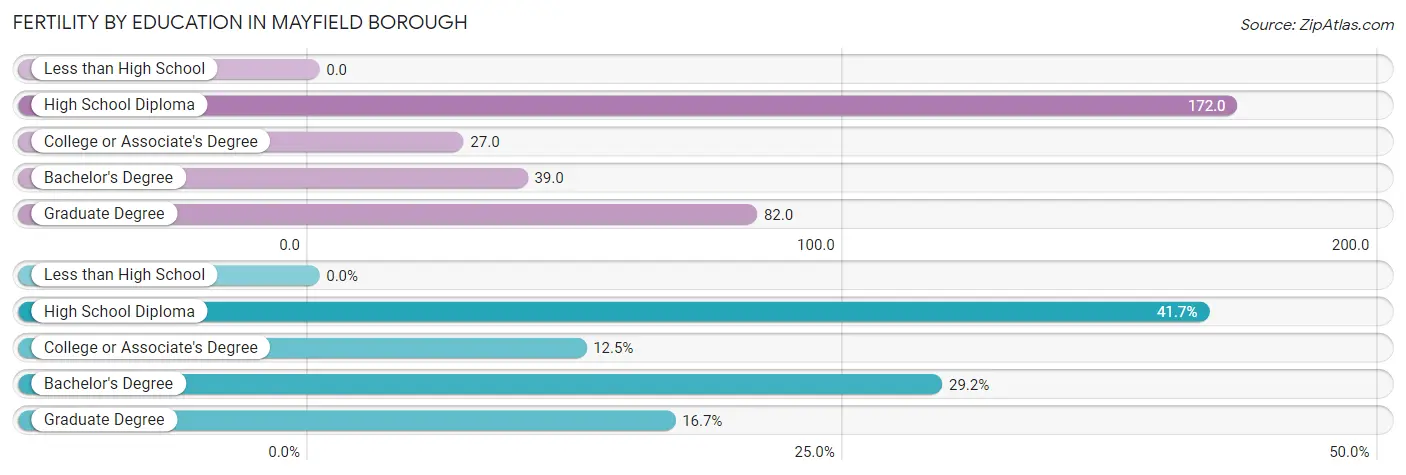
| Educational Attainment | Women with Births | Births / 1,000 Women |
| Less than High School | 0 (0.0%) | 0.0 |
| High School Diploma | 10 (41.7%) | 172.0 |
| College or Associate's Degree | 3 (12.5%) | 27.0 |
| Bachelor's Degree | 7 (29.2%) | 39.0 |
| Graduate Degree | 4 (16.7%) | 82.0 |
| Total | 24 (100.0%) | 51.0 |
Fertility by Education by Marriage Status in Mayfield borough
54.2% of women with births in Mayfield borough are unmarried. Women with the educational attainment of bachelor's degree are most likely to be married with 100.0% of them married at childbirth, while women with the educational attainment of high school diploma are least likely to be married with 100.0% of them unmarried at childbirth.
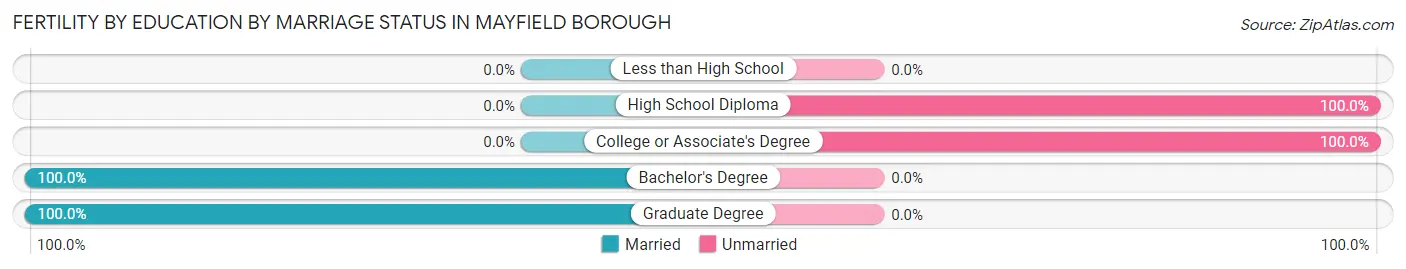
| Educational Attainment | Married | Unmarried |
| Less than High School | 0 (0.0%) | 0 (0.0%) |
| High School Diploma | 0 (0.0%) | 10 (100.0%) |
| College or Associate's Degree | 0 (0.0%) | 3 (100.0%) |
| Bachelor's Degree | 7 (100.0%) | 0 (0.0%) |
| Graduate Degree | 4 (100.0%) | 0 (0.0%) |
| Total | 11 (45.8%) | 13 (54.2%) |
Employment Characteristics in Mayfield borough
Employment by Class of Employer in Mayfield borough
Among the 1,037 employed individuals in Mayfield borough, private company employees (731 | 70.5%), not-for-profit organizations (86 | 8.3%), and local government employees (67 | 6.5%) make up the most common classes of employment.
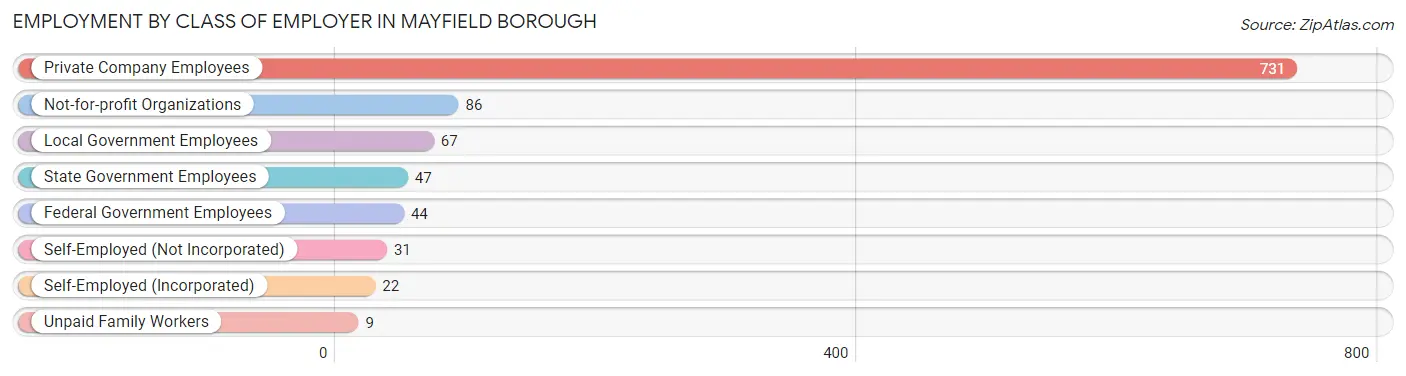
| Employer Class | # Employees | % Employees |
| Private Company Employees | 731 | 70.5% |
| Self-Employed (Incorporated) | 22 | 2.1% |
| Self-Employed (Not Incorporated) | 31 | 3.0% |
| Not-for-profit Organizations | 86 | 8.3% |
| Local Government Employees | 67 | 6.5% |
| State Government Employees | 47 | 4.5% |
| Federal Government Employees | 44 | 4.2% |
| Unpaid Family Workers | 9 | 0.9% |
| Total | 1,037 | 100.0% |
Employment Status by Age in Mayfield borough
According to the labor force statistics for Mayfield borough, out of the total population over 16 years of age (1,560), 70.4% or 1,098 individuals are in the labor force, with 4.2% or 46 of them unemployed. The age group with the highest labor force participation rate is 20 to 24 years, with 100.0% or 85 individuals in the labor force. Within the labor force, the 20 to 24 years age range has the highest percentage of unemployed individuals, with 31.8% or 27 of them being unemployed.
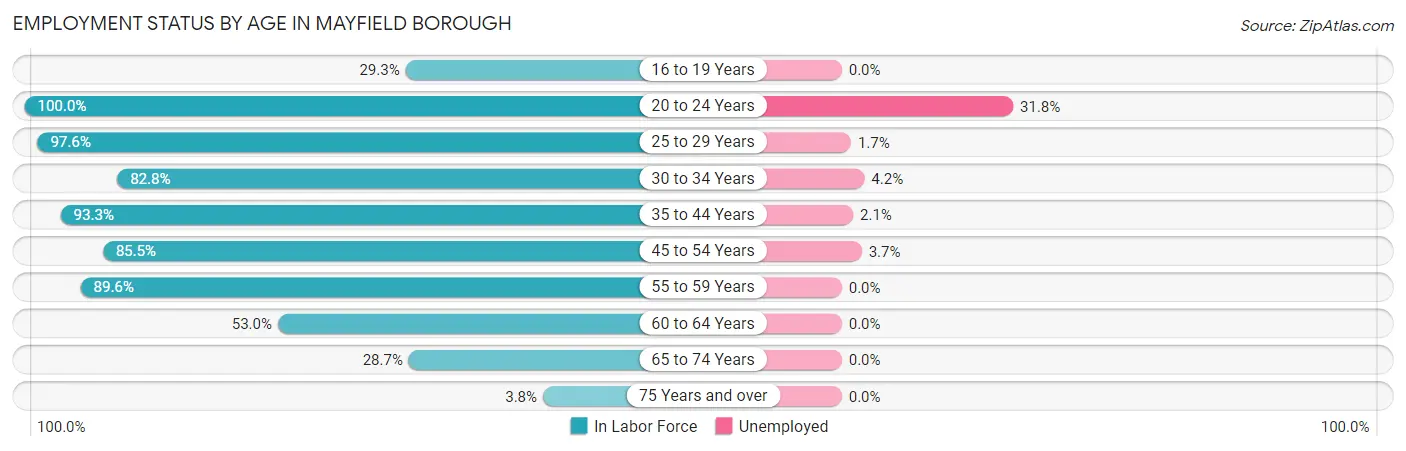
| Age Bracket | In Labor Force | Unemployed |
| 16 to 19 Years | 29 (29.3%) | 0 (0.0%) |
| 20 to 24 Years | 85 (100.0%) | 27 (31.8%) |
| 25 to 29 Years | 240 (97.6%) | 4 (1.7%) |
| 30 to 34 Years | 96 (82.8%) | 4 (4.2%) |
| 35 to 44 Years | 140 (93.3%) | 3 (2.1%) |
| 45 to 54 Years | 219 (85.5%) | 8 (3.7%) |
| 55 to 59 Years | 147 (89.6%) | 0 (0.0%) |
| 60 to 64 Years | 89 (53.0%) | 0 (0.0%) |
| 65 to 74 Years | 49 (28.7%) | 0 (0.0%) |
| 75 Years and over | 4 (3.8%) | 0 (0.0%) |
| Total | 1,098 (70.4%) | 46 (4.2%) |
Employment Status by Educational Attainment in Mayfield borough
According to labor force statistics for Mayfield borough, 84.6% of individuals (931) out of the total population between 25 and 64 years of age (1,100) are in the labor force, with 2.0% or 19 of them being unemployed. The group with the highest labor force participation rate are those with the educational attainment of bachelor's degree or higher, with 97.3% or 463 individuals in the labor force. Within the labor force, individuals with less than high school education have the highest percentage of unemployment, with 16.7% or 2 of them being unemployed.
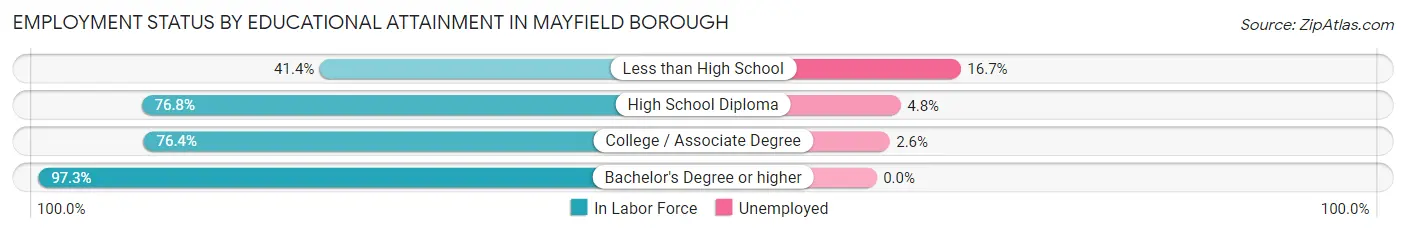
| Educational Attainment | In Labor Force | Unemployed |
| Less than High School | 12 (41.4%) | 5 (16.7%) |
| High School Diploma | 229 (76.8%) | 14 (4.8%) |
| College / Associate Degree | 227 (76.4%) | 8 (2.6%) |
| Bachelor's Degree or higher | 463 (97.3%) | 0 (0.0%) |
| Total | 931 (84.6%) | 22 (2.0%) |
Employment Occupations by Sex in Mayfield borough
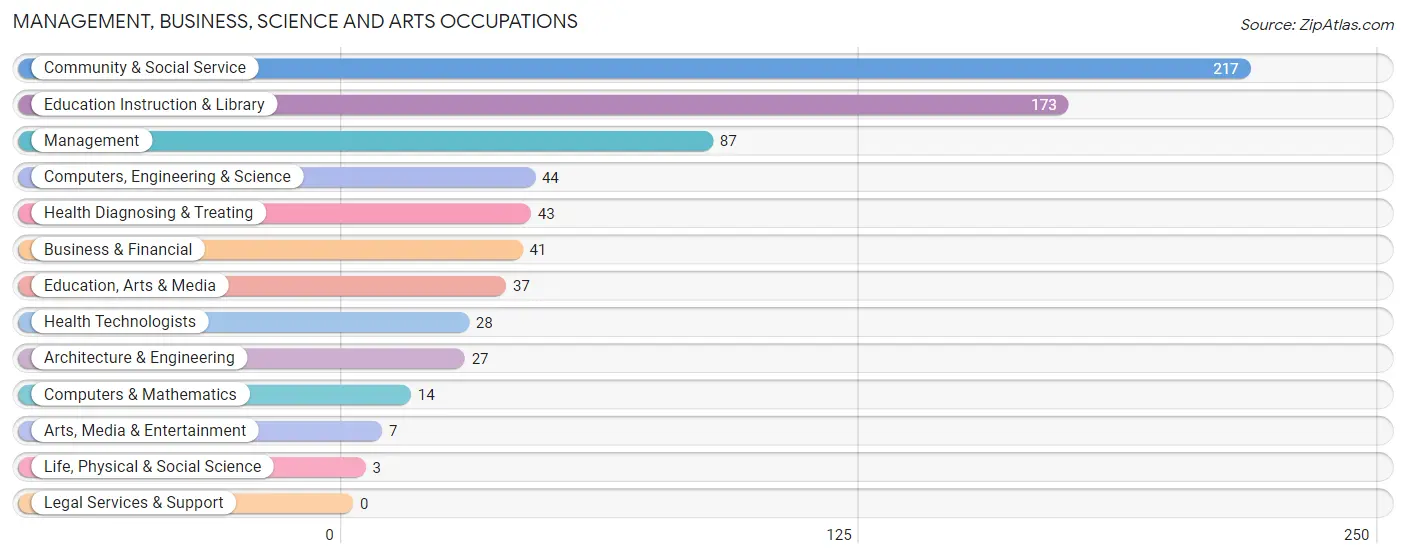
Management, Business, Science and Arts Occupations
The most common Management, Business, Science and Arts occupations in Mayfield borough are Community & Social Service (217 | 20.6%), Education Instruction & Library (173 | 16.5%), Management (87 | 8.3%), Computers, Engineering & Science (44 | 4.2%), and Health Diagnosing & Treating (43 | 4.1%).
Management, Business, Science and Arts Occupations by Sex
Within the Management, Business, Science and Arts occupations in Mayfield borough, the most male-oriented occupations are Arts, Media & Entertainment (100.0%), Architecture & Engineering (70.4%), and Management (62.1%), while the most female-oriented occupations are Life, Physical & Social Science (100.0%), Health Technologists (85.7%), and Education Instruction & Library (85.6%).
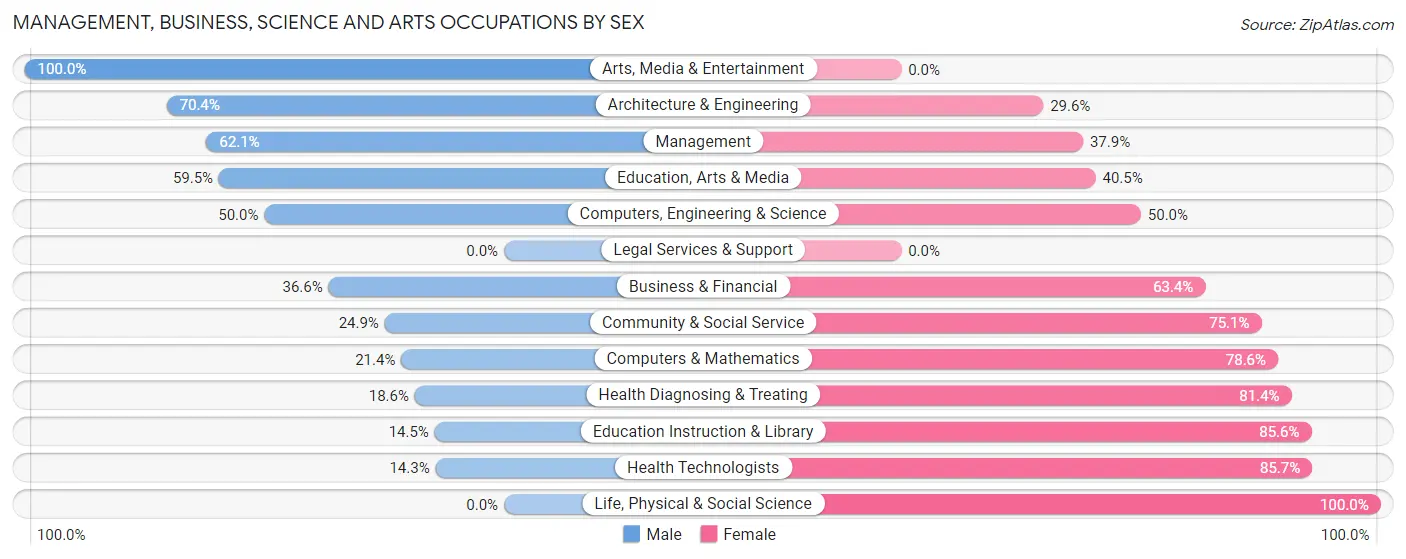
| Occupation | Male | Female |
| Management | 54 (62.1%) | 33 (37.9%) |
| Business & Financial | 15 (36.6%) | 26 (63.4%) |
| Computers, Engineering & Science | 22 (50.0%) | 22 (50.0%) |
| Computers & Mathematics | 3 (21.4%) | 11 (78.6%) |
| Architecture & Engineering | 19 (70.4%) | 8 (29.6%) |
| Life, Physical & Social Science | 0 (0.0%) | 3 (100.0%) |
| Community & Social Service | 54 (24.9%) | 163 (75.1%) |
| Education, Arts & Media | 22 (59.5%) | 15 (40.5%) |
| Legal Services & Support | 0 (0.0%) | 0 (0.0%) |
| Education Instruction & Library | 25 (14.4%) | 148 (85.6%) |
| Arts, Media & Entertainment | 7 (100.0%) | 0 (0.0%) |
| Health Diagnosing & Treating | 8 (18.6%) | 35 (81.4%) |
| Health Technologists | 4 (14.3%) | 24 (85.7%) |
| Total (Category) | 153 (35.4%) | 279 (64.6%) |
| Total (Overall) | 530 (50.4%) | 521 (49.6%) |
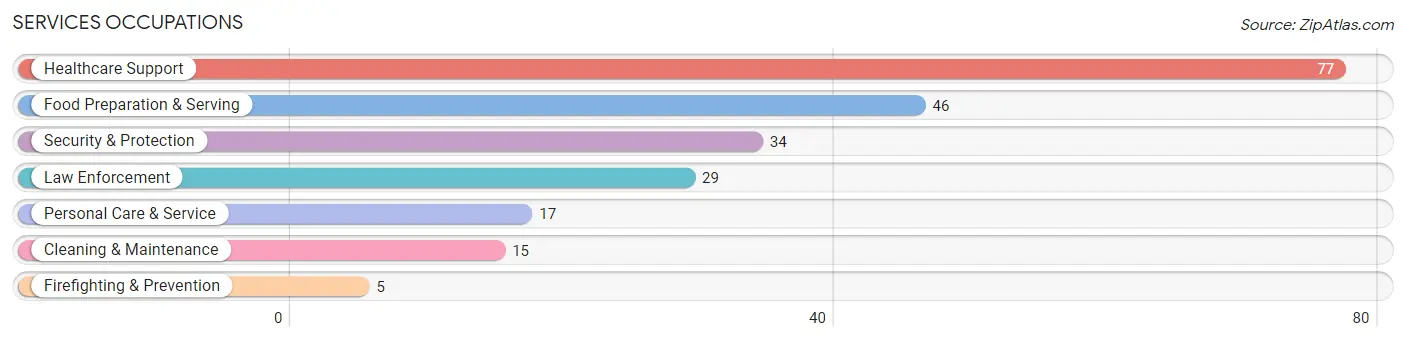
Services Occupations
The most common Services occupations in Mayfield borough are Healthcare Support (77 | 7.3%), Food Preparation & Serving (46 | 4.4%), Security & Protection (34 | 3.2%), Law Enforcement (29 | 2.8%), and Personal Care & Service (17 | 1.6%).
Services Occupations by Sex
Within the Services occupations in Mayfield borough, the most male-oriented occupations are Security & Protection (100.0%), Firefighting & Prevention (100.0%), and Law Enforcement (100.0%), while the most female-oriented occupations are Healthcare Support (89.6%), Personal Care & Service (70.6%), and Food Preparation & Serving (50.0%).
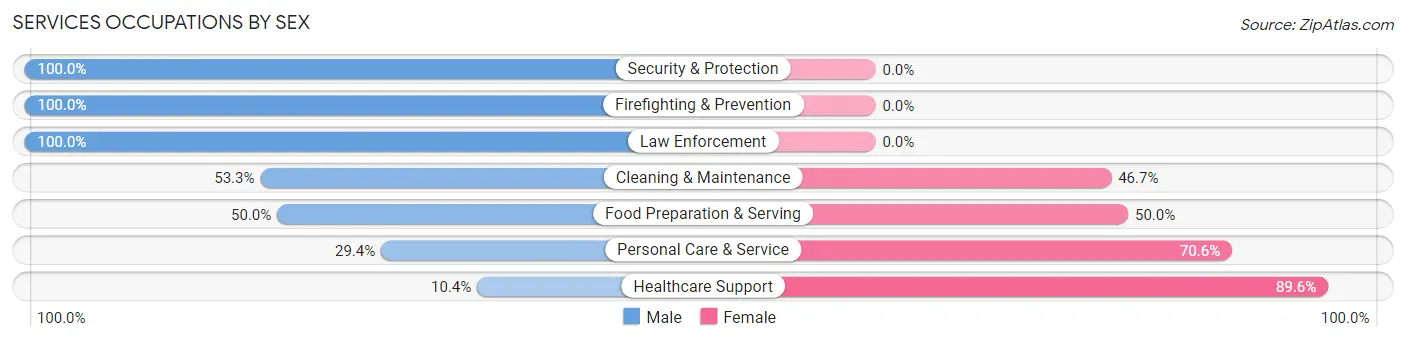
| Occupation | Male | Female |
| Healthcare Support | 8 (10.4%) | 69 (89.6%) |
| Security & Protection | 34 (100.0%) | 0 (0.0%) |
| Firefighting & Prevention | 5 (100.0%) | 0 (0.0%) |
| Law Enforcement | 29 (100.0%) | 0 (0.0%) |
| Food Preparation & Serving | 23 (50.0%) | 23 (50.0%) |
| Cleaning & Maintenance | 8 (53.3%) | 7 (46.7%) |
| Personal Care & Service | 5 (29.4%) | 12 (70.6%) |
| Total (Category) | 78 (41.3%) | 111 (58.7%) |
| Total (Overall) | 530 (50.4%) | 521 (49.6%) |
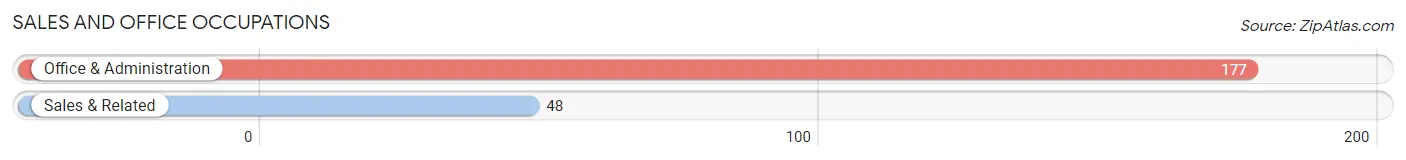
Sales and Office Occupations
The most common Sales and Office occupations in Mayfield borough are Office & Administration (177 | 16.8%), and Sales & Related (48 | 4.6%).
Sales and Office Occupations by Sex
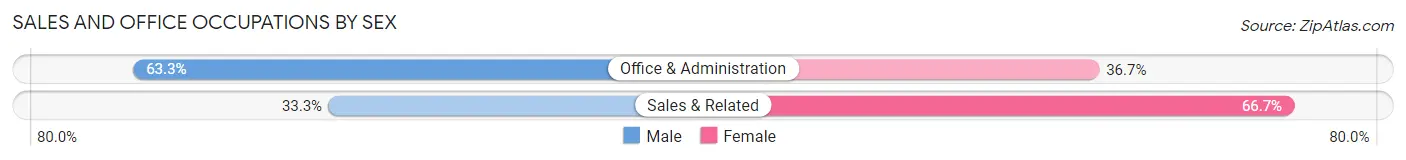
| Occupation | Male | Female |
| Sales & Related | 16 (33.3%) | 32 (66.7%) |
| Office & Administration | 112 (63.3%) | 65 (36.7%) |
| Total (Category) | 128 (56.9%) | 97 (43.1%) |
| Total (Overall) | 530 (50.4%) | 521 (49.6%) |
Natural Resources, Construction and Maintenance Occupations
The most common Natural Resources, Construction and Maintenance occupations in Mayfield borough are Construction & Extraction (54 | 5.1%), and Installation, Maintenance & Repair (21 | 2.0%).
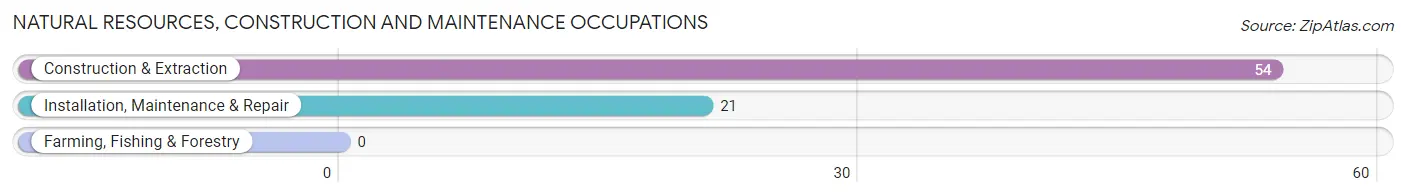
Natural Resources, Construction and Maintenance Occupations by Sex

| Occupation | Male | Female |
| Farming, Fishing & Forestry | 0 (0.0%) | 0 (0.0%) |
| Construction & Extraction | 54 (100.0%) | 0 (0.0%) |
| Installation, Maintenance & Repair | 21 (100.0%) | 0 (0.0%) |
| Total (Category) | 75 (100.0%) | 0 (0.0%) |
| Total (Overall) | 530 (50.4%) | 521 (49.6%) |
Production, Transportation and Moving Occupations
The most common Production, Transportation and Moving occupations in Mayfield borough are Transportation (47 | 4.5%), Production (45 | 4.3%), and Material Moving (38 | 3.6%).
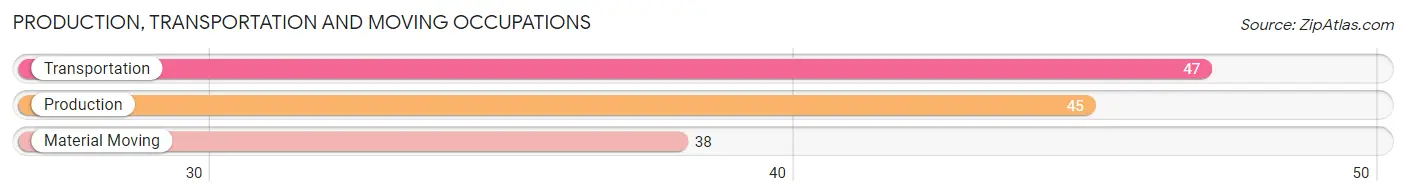
Production, Transportation and Moving Occupations by Sex
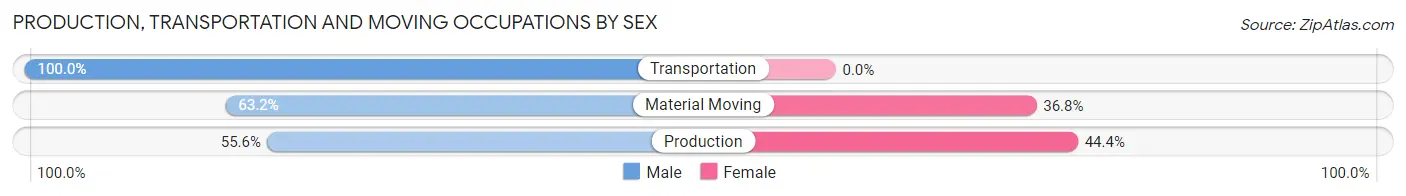
| Occupation | Male | Female |
| Production | 25 (55.6%) | 20 (44.4%) |
| Transportation | 47 (100.0%) | 0 (0.0%) |
| Material Moving | 24 (63.2%) | 14 (36.8%) |
| Total (Category) | 96 (73.9%) | 34 (26.2%) |
| Total (Overall) | 530 (50.4%) | 521 (49.6%) |
Employment Industries by Sex in Mayfield borough
Employment Industries in Mayfield borough
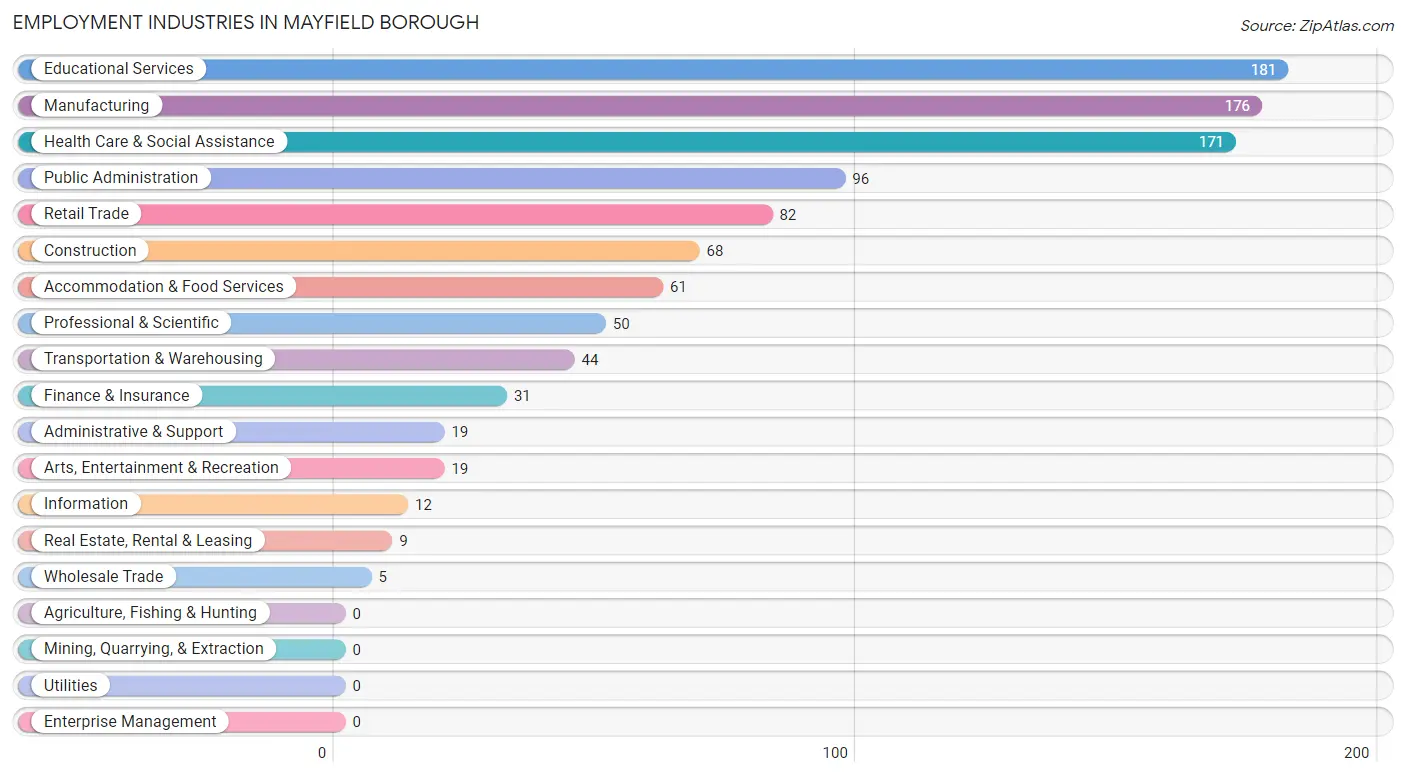
The major employment industries in Mayfield borough include Educational Services (181 | 17.2%), Manufacturing (176 | 16.8%), Health Care & Social Assistance (171 | 16.3%), Public Administration (96 | 9.1%), and Retail Trade (82 | 7.8%).
Employment Industries by Sex in Mayfield borough
The Mayfield borough industries that see more men than women are Construction (100.0%), Wholesale Trade (100.0%), and Real Estate, Rental & Leasing (100.0%), whereas the industries that tend to have a higher number of women are Educational Services (82.9%), Health Care & Social Assistance (75.4%), and Information (75.0%).
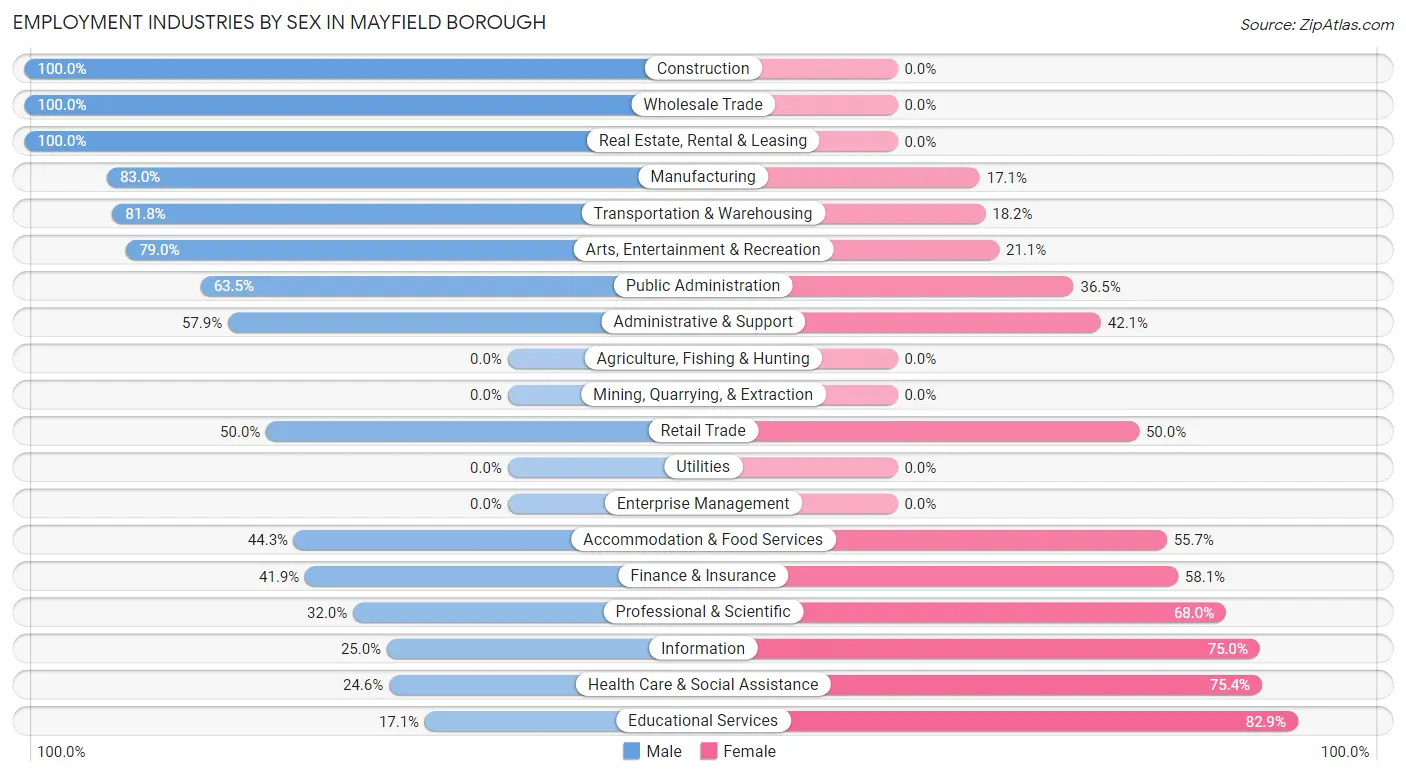
| Industry | Male | Female |
| Agriculture, Fishing & Hunting | 0 (0.0%) | 0 (0.0%) |
| Mining, Quarrying, & Extraction | 0 (0.0%) | 0 (0.0%) |
| Construction | 68 (100.0%) | 0 (0.0%) |
| Manufacturing | 146 (83.0%) | 30 (17.1%) |
| Wholesale Trade | 5 (100.0%) | 0 (0.0%) |
| Retail Trade | 41 (50.0%) | 41 (50.0%) |
| Transportation & Warehousing | 36 (81.8%) | 8 (18.2%) |
| Utilities | 0 (0.0%) | 0 (0.0%) |
| Information | 3 (25.0%) | 9 (75.0%) |
| Finance & Insurance | 13 (41.9%) | 18 (58.1%) |
| Real Estate, Rental & Leasing | 9 (100.0%) | 0 (0.0%) |
| Professional & Scientific | 16 (32.0%) | 34 (68.0%) |
| Enterprise Management | 0 (0.0%) | 0 (0.0%) |
| Administrative & Support | 11 (57.9%) | 8 (42.1%) |
| Educational Services | 31 (17.1%) | 150 (82.9%) |
| Health Care & Social Assistance | 42 (24.6%) | 129 (75.4%) |
| Arts, Entertainment & Recreation | 15 (78.9%) | 4 (21.0%) |
| Accommodation & Food Services | 27 (44.3%) | 34 (55.7%) |
| Public Administration | 61 (63.5%) | 35 (36.5%) |
| Total | 530 (50.4%) | 521 (49.6%) |
Education in Mayfield borough
School Enrollment in Mayfield borough
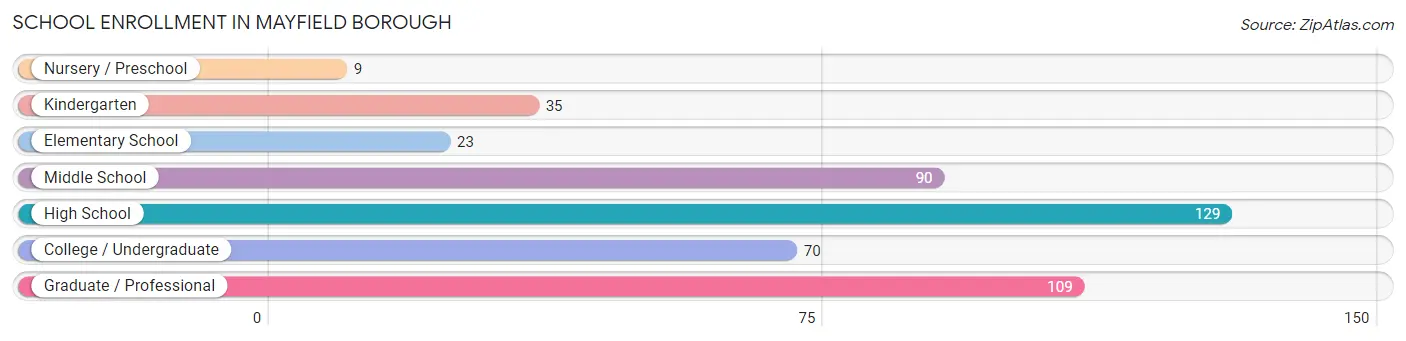
The most common levels of schooling among the 465 students in Mayfield borough are high school (129 | 27.7%), graduate / professional (109 | 23.4%), and middle school (90 | 19.4%).
| School Level | # Students | % Students |
| Nursery / Preschool | 9 | 1.9% |
| Kindergarten | 35 | 7.5% |
| Elementary School | 23 | 5.0% |
| Middle School | 90 | 19.4% |
| High School | 129 | 27.7% |
| College / Undergraduate | 70 | 15.0% |
| Graduate / Professional | 109 | 23.4% |
| Total | 465 | 100.0% |
School Enrollment by Age by Funding Source in Mayfield borough
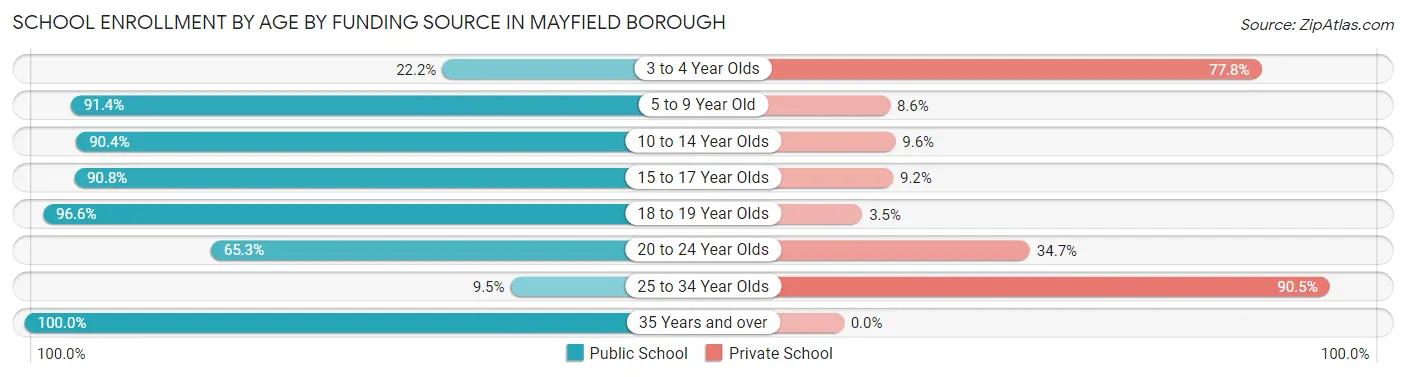
Out of a total of 465 students who are enrolled in schools in Mayfield borough, 143 (30.8%) attend a private institution, while the remaining 322 (69.2%) are enrolled in public schools. The age group of 25 to 34 year olds has the highest likelihood of being enrolled in private schools, with 95 (90.5% in the age bracket) enrolled. Conversely, the age group of 35 years and over has the lowest likelihood of being enrolled in a private school, with 24 (100.0% in the age bracket) attending a public institution.
| Age Bracket | Public School | Private School |
| 3 to 4 Year Olds | 2 (22.2%) | 7 (77.8%) |
| 5 to 9 Year Old | 53 (91.4%) | 5 (8.6%) |
| 10 to 14 Year Olds | 94 (90.4%) | 10 (9.6%) |
| 15 to 17 Year Olds | 79 (90.8%) | 8 (9.2%) |
| 18 to 19 Year Olds | 28 (96.6%) | 1 (3.5%) |
| 20 to 24 Year Olds | 32 (65.3%) | 17 (34.7%) |
| 25 to 34 Year Olds | 10 (9.5%) | 95 (90.5%) |
| 35 Years and over | 24 (100.0%) | 0 (0.0%) |
| Total | 322 (69.2%) | 143 (30.8%) |
Educational Attainment by Field of Study in Mayfield borough
Science & technology (165 | 29.7%), computers & mathematics (91 | 16.4%), business (78 | 14.1%), education (71 | 12.8%), and psychology (40 | 7.2%) are the most common fields of study among 555 individuals in Mayfield borough who have obtained a bachelor's degree or higher.
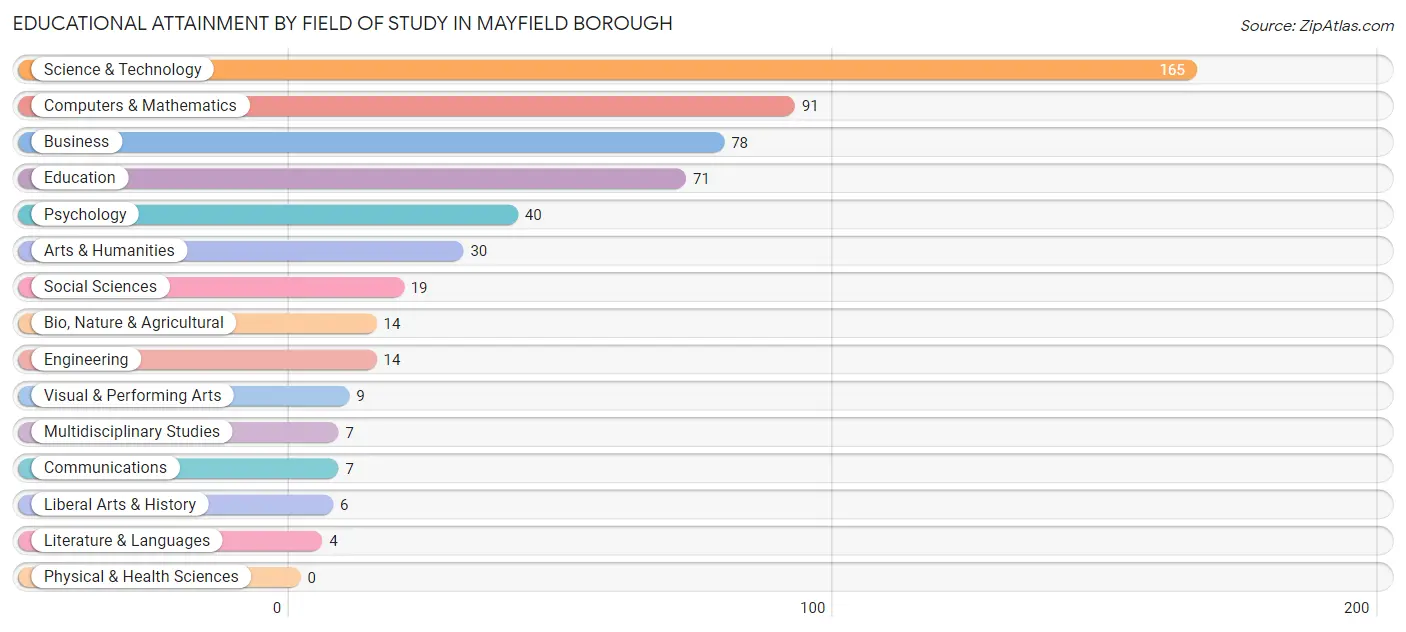
| Field of Study | # Graduates | % Graduates |
| Computers & Mathematics | 91 | 16.4% |
| Bio, Nature & Agricultural | 14 | 2.5% |
| Physical & Health Sciences | 0 | 0.0% |
| Psychology | 40 | 7.2% |
| Social Sciences | 19 | 3.4% |
| Engineering | 14 | 2.5% |
| Multidisciplinary Studies | 7 | 1.3% |
| Science & Technology | 165 | 29.7% |
| Business | 78 | 14.1% |
| Education | 71 | 12.8% |
| Literature & Languages | 4 | 0.7% |
| Liberal Arts & History | 6 | 1.1% |
| Visual & Performing Arts | 9 | 1.6% |
| Communications | 7 | 1.3% |
| Arts & Humanities | 30 | 5.4% |
| Total | 555 | 100.0% |
Transportation & Commute in Mayfield borough
Vehicle Availability by Sex in Mayfield borough
The most prevalent vehicle ownership categories in Mayfield borough are males with 2 vehicles (348, accounting for 66.8%) and females with 2 vehicles (250, making up 67.4%).
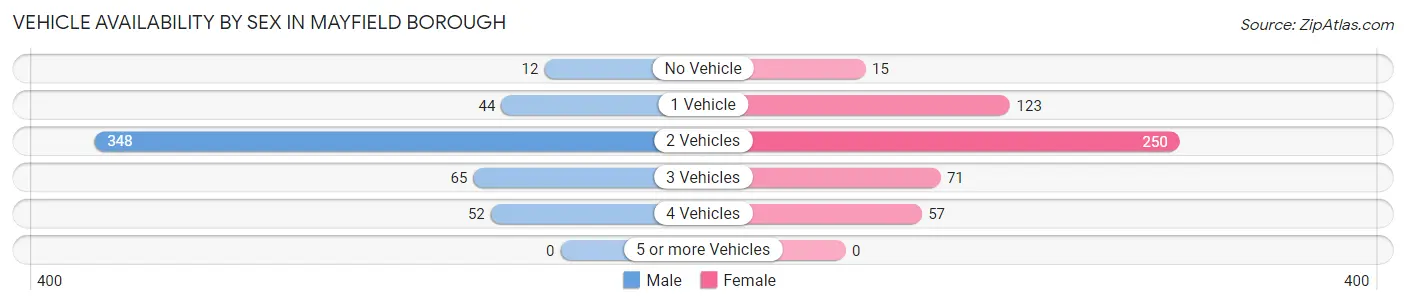
| Vehicles Available | Male | Female |
| No Vehicle | 12 (2.3%) | 15 (2.9%) |
| 1 Vehicle | 44 (8.5%) | 123 (23.8%) |
| 2 Vehicles | 348 (66.8%) | 250 (48.4%) |
| 3 Vehicles | 65 (12.5%) | 71 (13.8%) |
| 4 Vehicles | 52 (10.0%) | 57 (11.1%) |
| 5 or more Vehicles | 0 (0.0%) | 0 (0.0%) |
| Total | 521 (100.0%) | 516 (100.0%) |
Commute Time in Mayfield borough
The most frequently occuring commute durations in Mayfield borough are 15 to 19 minutes (187 commuters, 21.4%), 45 to 59 minutes (134 commuters, 15.3%), and 20 to 24 minutes (127 commuters, 14.5%).
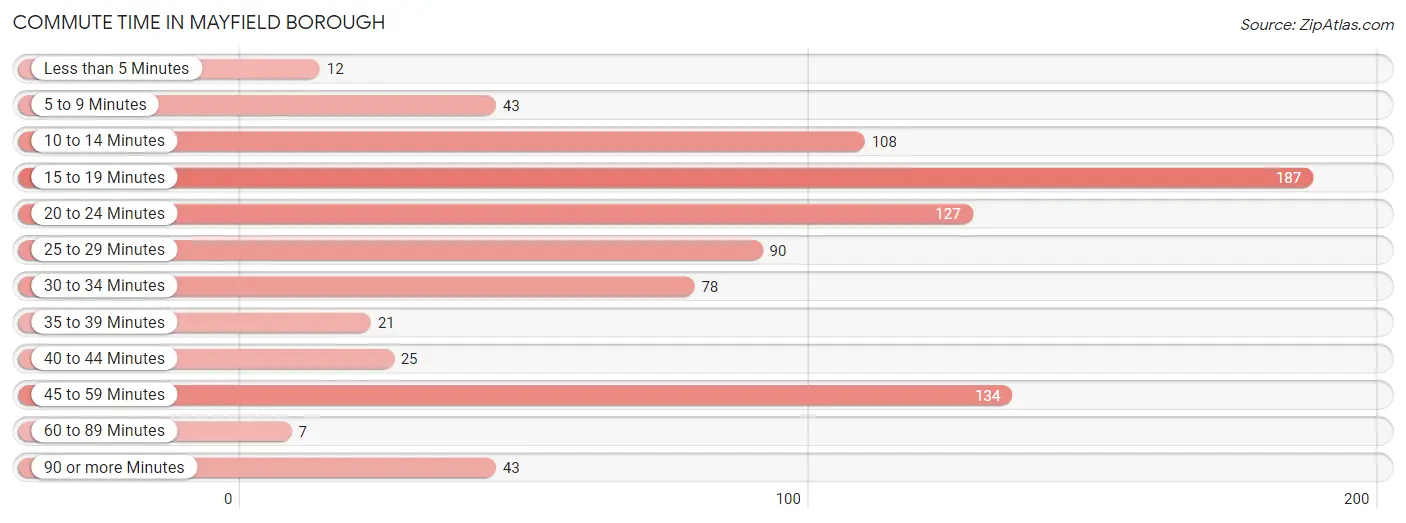
| Commute Time | # Commuters | % Commuters |
| Less than 5 Minutes | 12 | 1.4% |
| 5 to 9 Minutes | 43 | 4.9% |
| 10 to 14 Minutes | 108 | 12.3% |
| 15 to 19 Minutes | 187 | 21.4% |
| 20 to 24 Minutes | 127 | 14.5% |
| 25 to 29 Minutes | 90 | 10.3% |
| 30 to 34 Minutes | 78 | 8.9% |
| 35 to 39 Minutes | 21 | 2.4% |
| 40 to 44 Minutes | 25 | 2.9% |
| 45 to 59 Minutes | 134 | 15.3% |
| 60 to 89 Minutes | 7 | 0.8% |
| 90 or more Minutes | 43 | 4.9% |
Commute Time by Sex in Mayfield borough
The most common commute times in Mayfield borough are 45 to 59 minutes (115 commuters, 23.9%) for males and 15 to 19 minutes (104 commuters, 26.4%) for females.
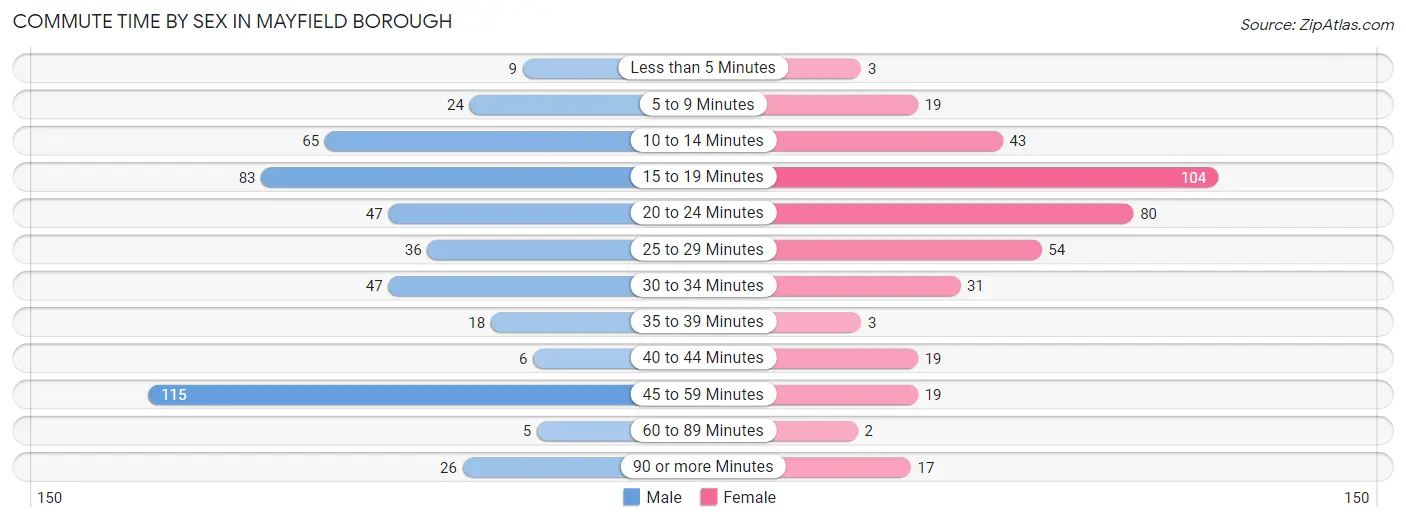
| Commute Time | Male | Female |
| Less than 5 Minutes | 9 (1.9%) | 3 (0.8%) |
| 5 to 9 Minutes | 24 (5.0%) | 19 (4.8%) |
| 10 to 14 Minutes | 65 (13.5%) | 43 (10.9%) |
| 15 to 19 Minutes | 83 (17.3%) | 104 (26.4%) |
| 20 to 24 Minutes | 47 (9.8%) | 80 (20.3%) |
| 25 to 29 Minutes | 36 (7.5%) | 54 (13.7%) |
| 30 to 34 Minutes | 47 (9.8%) | 31 (7.9%) |
| 35 to 39 Minutes | 18 (3.7%) | 3 (0.8%) |
| 40 to 44 Minutes | 6 (1.3%) | 19 (4.8%) |
| 45 to 59 Minutes | 115 (23.9%) | 19 (4.8%) |
| 60 to 89 Minutes | 5 (1.0%) | 2 (0.5%) |
| 90 or more Minutes | 26 (5.4%) | 17 (4.3%) |
Time of Departure to Work by Sex in Mayfield borough
The most frequent times of departure to work in Mayfield borough are 5:00 AM to 5:29 AM (133, 27.7%) for males and 7:30 AM to 7:59 AM (101, 25.6%) for females.
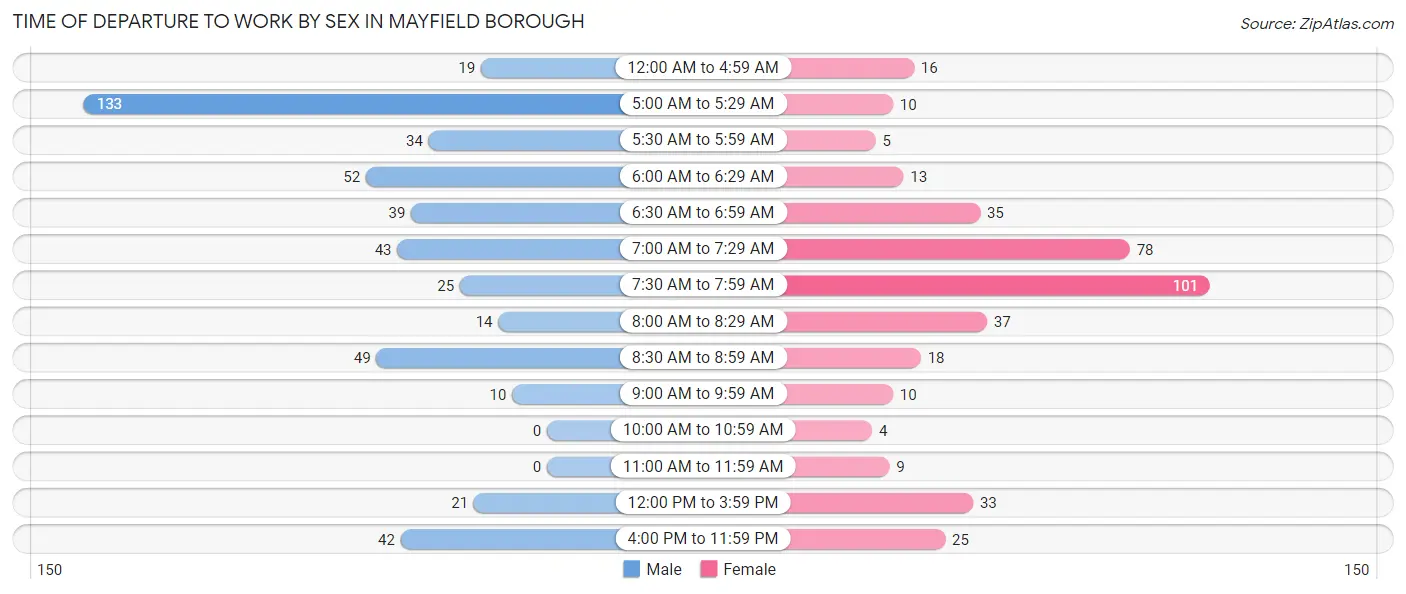
| Time of Departure | Male | Female |
| 12:00 AM to 4:59 AM | 19 (4.0%) | 16 (4.1%) |
| 5:00 AM to 5:29 AM | 133 (27.7%) | 10 (2.5%) |
| 5:30 AM to 5:59 AM | 34 (7.1%) | 5 (1.3%) |
| 6:00 AM to 6:29 AM | 52 (10.8%) | 13 (3.3%) |
| 6:30 AM to 6:59 AM | 39 (8.1%) | 35 (8.9%) |
| 7:00 AM to 7:29 AM | 43 (8.9%) | 78 (19.8%) |
| 7:30 AM to 7:59 AM | 25 (5.2%) | 101 (25.6%) |
| 8:00 AM to 8:29 AM | 14 (2.9%) | 37 (9.4%) |
| 8:30 AM to 8:59 AM | 49 (10.2%) | 18 (4.6%) |
| 9:00 AM to 9:59 AM | 10 (2.1%) | 10 (2.5%) |
| 10:00 AM to 10:59 AM | 0 (0.0%) | 4 (1.0%) |
| 11:00 AM to 11:59 AM | 0 (0.0%) | 9 (2.3%) |
| 12:00 PM to 3:59 PM | 21 (4.4%) | 33 (8.4%) |
| 4:00 PM to 11:59 PM | 42 (8.7%) | 25 (6.4%) |
| Total | 481 (100.0%) | 394 (100.0%) |
Housing Occupancy in Mayfield borough
Occupancy by Ownership in Mayfield borough
Of the total 826 dwellings in Mayfield borough, owner-occupied units account for 691 (83.7%), while renter-occupied units make up 135 (16.3%).
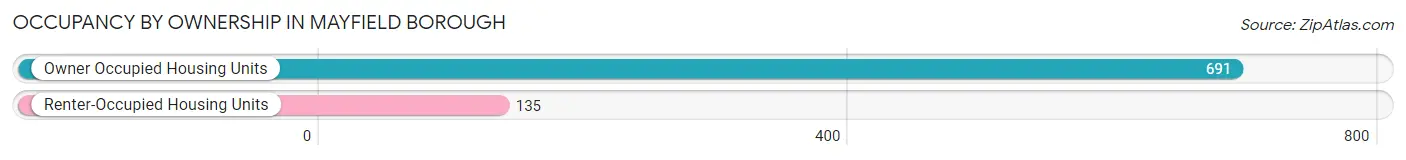
| Occupancy | # Housing Units | % Housing Units |
| Owner Occupied Housing Units | 691 | 83.7% |
| Renter-Occupied Housing Units | 135 | 16.3% |
| Total Occupied Housing Units | 826 | 100.0% |
Occupancy by Household Size in Mayfield borough
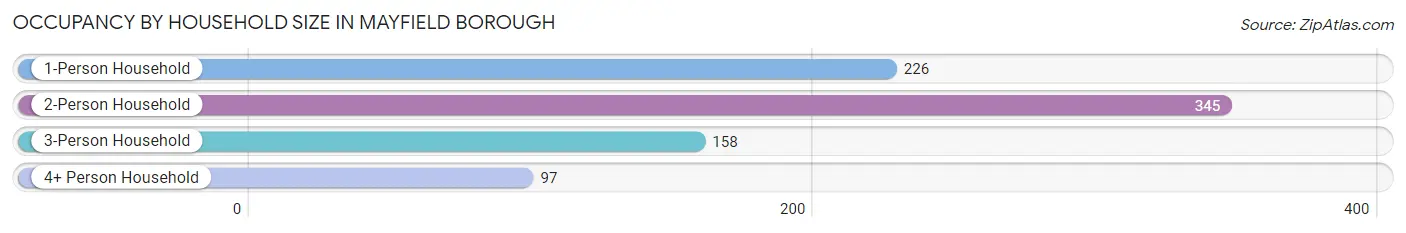
| Household Size | # Housing Units | % Housing Units |
| 1-Person Household | 226 | 27.4% |
| 2-Person Household | 345 | 41.8% |
| 3-Person Household | 158 | 19.1% |
| 4+ Person Household | 97 | 11.7% |
| Total Housing Units | 826 | 100.0% |
Occupancy by Ownership by Household Size in Mayfield borough
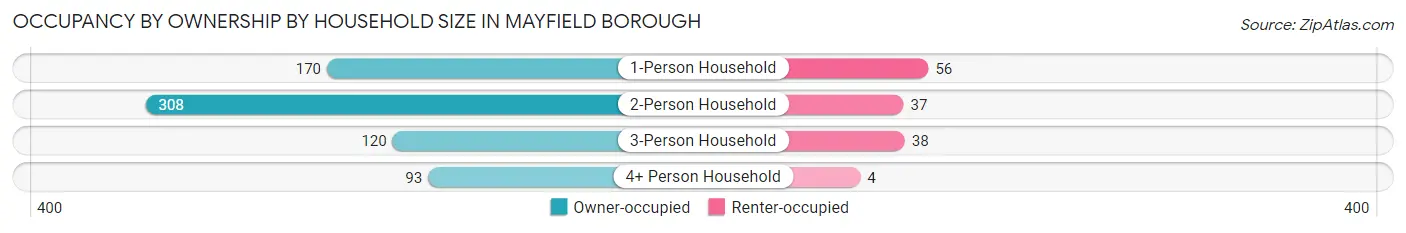
| Household Size | Owner-occupied | Renter-occupied |
| 1-Person Household | 170 (75.2%) | 56 (24.8%) |
| 2-Person Household | 308 (89.3%) | 37 (10.7%) |
| 3-Person Household | 120 (75.9%) | 38 (24.0%) |
| 4+ Person Household | 93 (95.9%) | 4 (4.1%) |
| Total Housing Units | 691 (83.7%) | 135 (16.3%) |
Occupancy by Educational Attainment in Mayfield borough
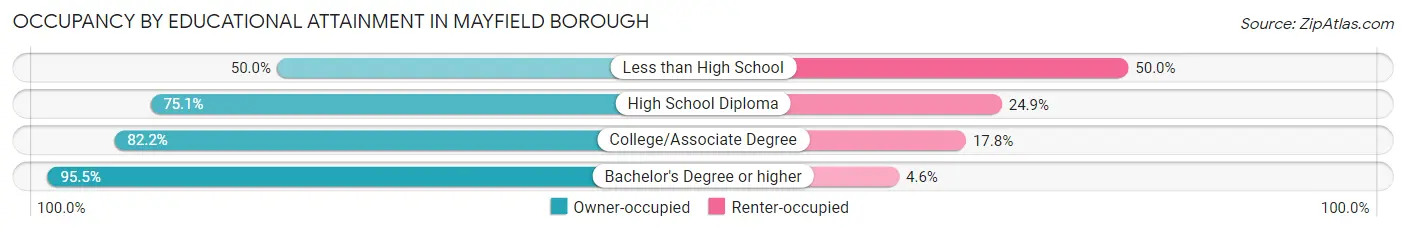
| Household Size | Owner-occupied | Renter-occupied |
| Less than High School | 10 (50.0%) | 10 (50.0%) |
| High School Diploma | 205 (75.1%) | 68 (24.9%) |
| College/Associate Degree | 203 (82.2%) | 44 (17.8%) |
| Bachelor's Degree or higher | 273 (95.5%) | 13 (4.5%) |
Occupancy by Age of Householder in Mayfield borough
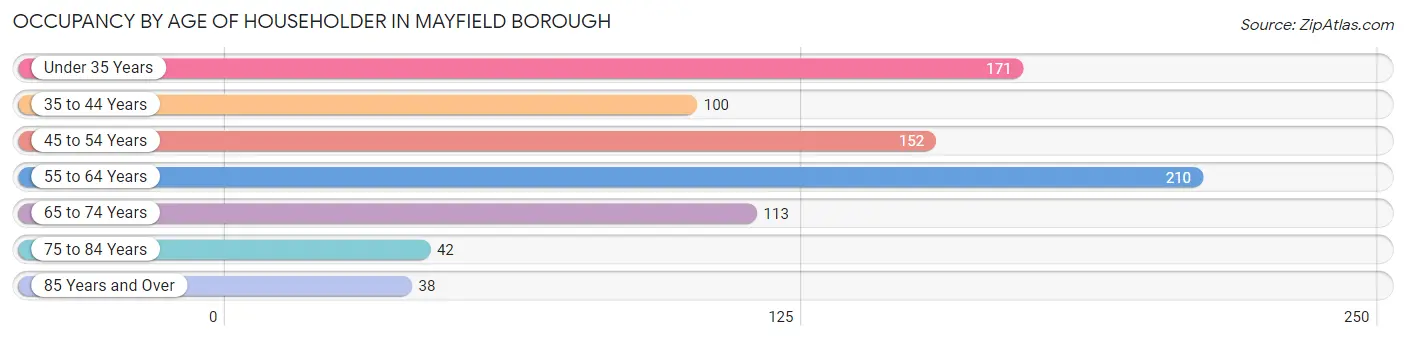
| Age Bracket | # Households | % Households |
| Under 35 Years | 171 | 20.7% |
| 35 to 44 Years | 100 | 12.1% |
| 45 to 54 Years | 152 | 18.4% |
| 55 to 64 Years | 210 | 25.4% |
| 65 to 74 Years | 113 | 13.7% |
| 75 to 84 Years | 42 | 5.1% |
| 85 Years and Over | 38 | 4.6% |
| Total | 826 | 100.0% |
Housing Finances in Mayfield borough
Median Income by Occupancy in Mayfield borough
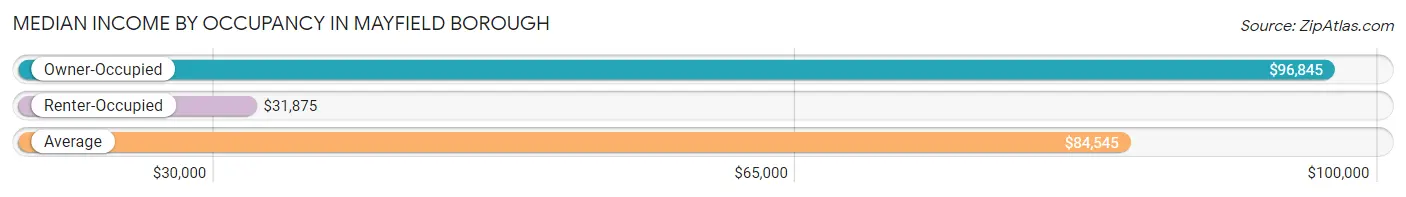
| Occupancy Type | # Households | Median Income |
| Owner-Occupied | 691 (83.7%) | $96,845 |
| Renter-Occupied | 135 (16.3%) | $31,875 |
| Average | 826 (100.0%) | $84,545 |
Occupancy by Householder Income Bracket in Mayfield borough
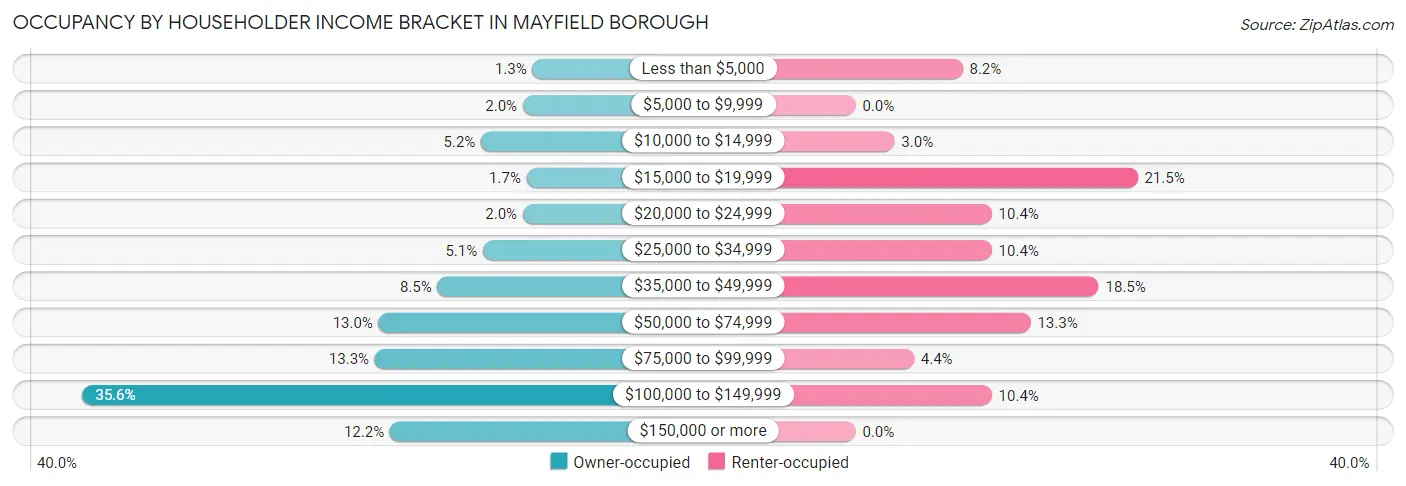
| Income Bracket | Owner-occupied | Renter-occupied |
| Less than $5,000 | 9 (1.3%) | 11 (8.2%) |
| $5,000 to $9,999 | 14 (2.0%) | 0 (0.0%) |
| $10,000 to $14,999 | 36 (5.2%) | 4 (3.0%) |
| $15,000 to $19,999 | 12 (1.7%) | 29 (21.5%) |
| $20,000 to $24,999 | 14 (2.0%) | 14 (10.4%) |
| $25,000 to $34,999 | 35 (5.1%) | 14 (10.4%) |
| $35,000 to $49,999 | 59 (8.5%) | 25 (18.5%) |
| $50,000 to $74,999 | 90 (13.0%) | 18 (13.3%) |
| $75,000 to $99,999 | 92 (13.3%) | 6 (4.4%) |
| $100,000 to $149,999 | 246 (35.6%) | 14 (10.4%) |
| $150,000 or more | 84 (12.2%) | 0 (0.0%) |
| Total | 691 (100.0%) | 135 (100.0%) |
Monthly Housing Cost Tiers in Mayfield borough
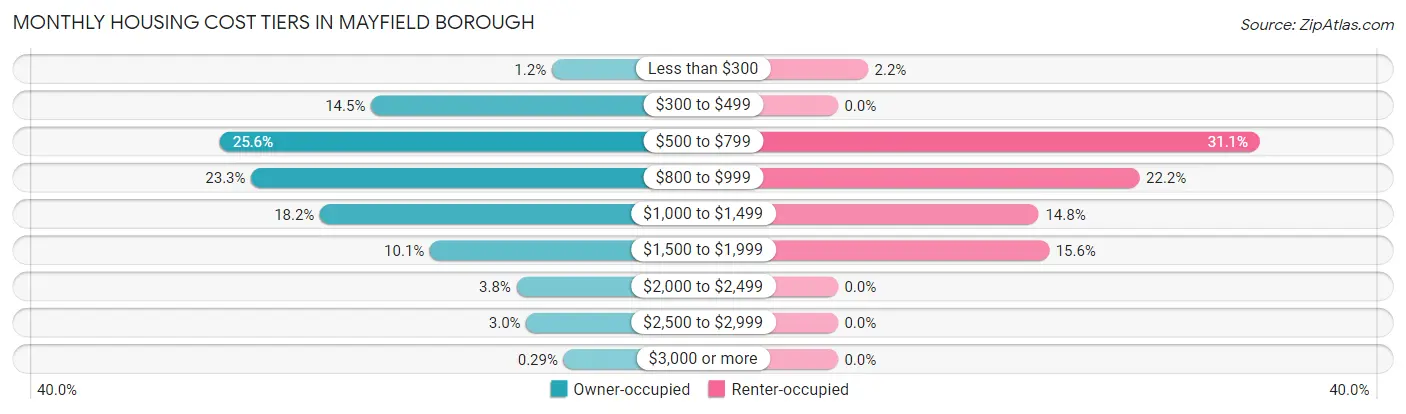
| Monthly Cost | Owner-occupied | Renter-occupied |
| Less than $300 | 8 (1.2%) | 3 (2.2%) |
| $300 to $499 | 100 (14.5%) | 0 (0.0%) |
| $500 to $799 | 177 (25.6%) | 42 (31.1%) |
| $800 to $999 | 161 (23.3%) | 30 (22.2%) |
| $1,000 to $1,499 | 126 (18.2%) | 20 (14.8%) |
| $1,500 to $1,999 | 70 (10.1%) | 21 (15.6%) |
| $2,000 to $2,499 | 26 (3.8%) | 0 (0.0%) |
| $2,500 to $2,999 | 21 (3.0%) | 0 (0.0%) |
| $3,000 or more | 2 (0.3%) | 0 (0.0%) |
| Total | 691 (100.0%) | 135 (100.0%) |
Physical Housing Characteristics in Mayfield borough
Housing Structures in Mayfield borough
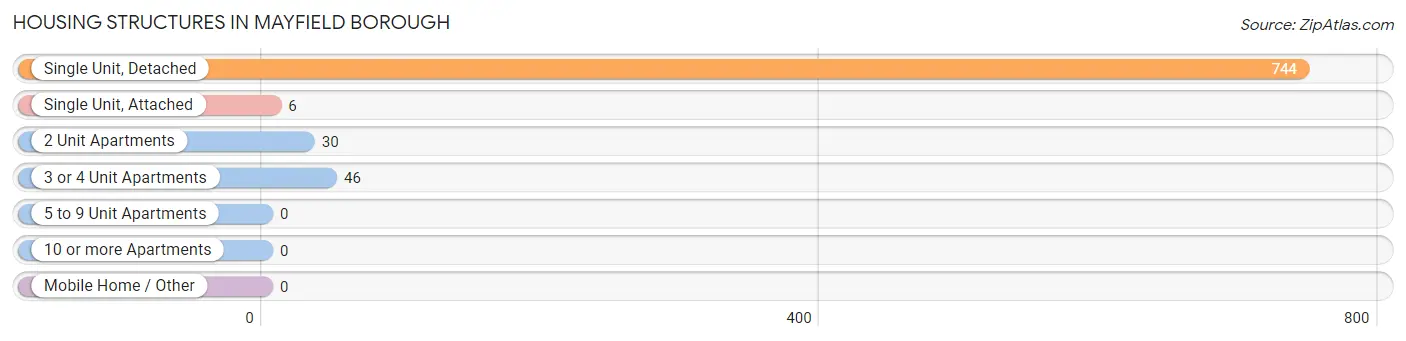
| Structure Type | # Housing Units | % Housing Units |
| Single Unit, Detached | 744 | 90.1% |
| Single Unit, Attached | 6 | 0.7% |
| 2 Unit Apartments | 30 | 3.6% |
| 3 or 4 Unit Apartments | 46 | 5.6% |
| 5 to 9 Unit Apartments | 0 | 0.0% |
| 10 or more Apartments | 0 | 0.0% |
| Mobile Home / Other | 0 | 0.0% |
| Total | 826 | 100.0% |
Housing Structures by Occupancy in Mayfield borough
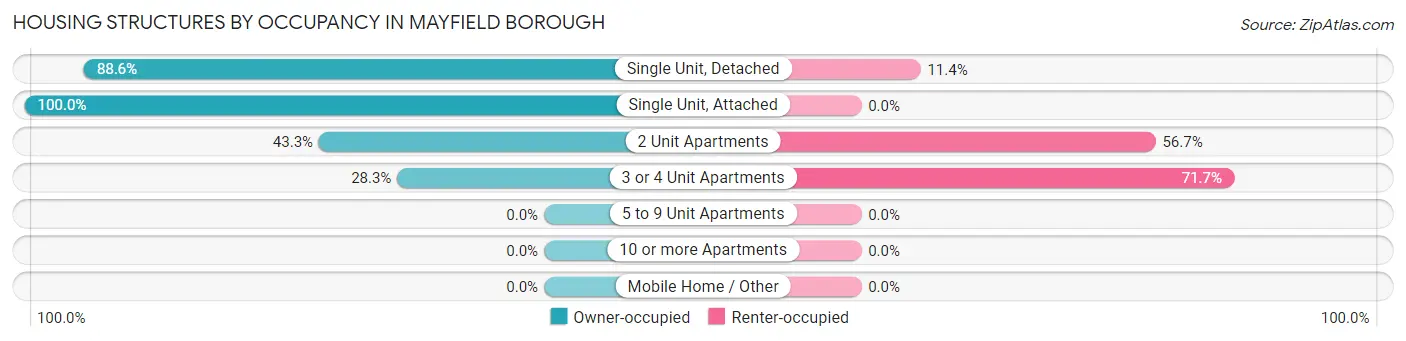
| Structure Type | Owner-occupied | Renter-occupied |
| Single Unit, Detached | 659 (88.6%) | 85 (11.4%) |
| Single Unit, Attached | 6 (100.0%) | 0 (0.0%) |
| 2 Unit Apartments | 13 (43.3%) | 17 (56.7%) |
| 3 or 4 Unit Apartments | 13 (28.3%) | 33 (71.7%) |
| 5 to 9 Unit Apartments | 0 (0.0%) | 0 (0.0%) |
| 10 or more Apartments | 0 (0.0%) | 0 (0.0%) |
| Mobile Home / Other | 0 (0.0%) | 0 (0.0%) |
| Total | 691 (83.7%) | 135 (16.3%) |
Housing Structures by Number of Rooms in Mayfield borough
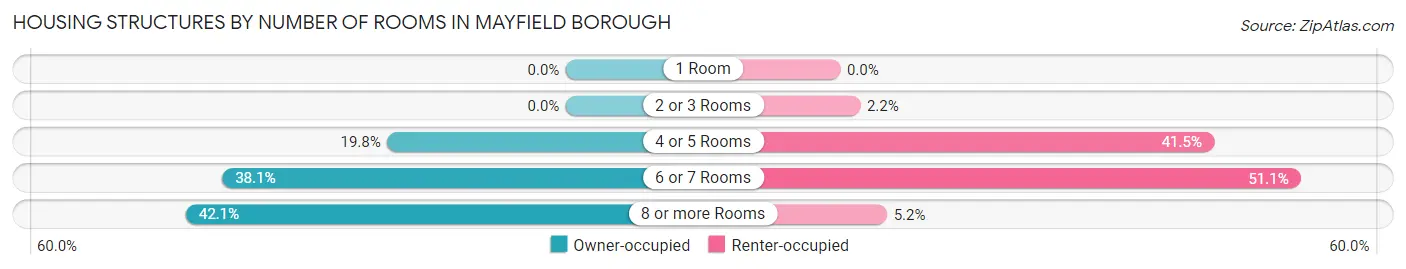
| Number of Rooms | Owner-occupied | Renter-occupied |
| 1 Room | 0 (0.0%) | 0 (0.0%) |
| 2 or 3 Rooms | 0 (0.0%) | 3 (2.2%) |
| 4 or 5 Rooms | 137 (19.8%) | 56 (41.5%) |
| 6 or 7 Rooms | 263 (38.1%) | 69 (51.1%) |
| 8 or more Rooms | 291 (42.1%) | 7 (5.2%) |
| Total | 691 (100.0%) | 135 (100.0%) |
Housing Structure by Heating Type in Mayfield borough
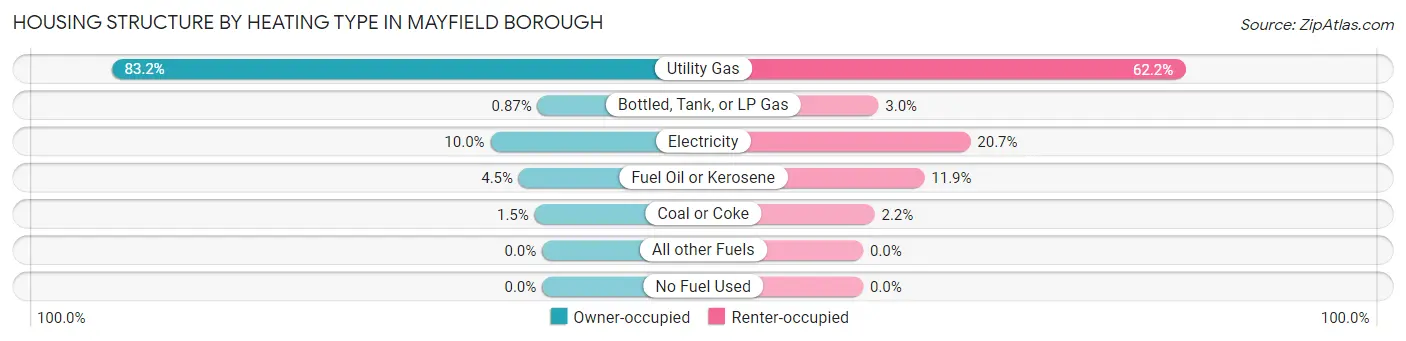
| Heating Type | Owner-occupied | Renter-occupied |
| Utility Gas | 575 (83.2%) | 84 (62.2%) |
| Bottled, Tank, or LP Gas | 6 (0.9%) | 4 (3.0%) |
| Electricity | 69 (10.0%) | 28 (20.7%) |
| Fuel Oil or Kerosene | 31 (4.5%) | 16 (11.8%) |
| Coal or Coke | 10 (1.5%) | 3 (2.2%) |
| All other Fuels | 0 (0.0%) | 0 (0.0%) |
| No Fuel Used | 0 (0.0%) | 0 (0.0%) |
| Total | 691 (100.0%) | 135 (100.0%) |
Household Vehicle Usage in Mayfield borough
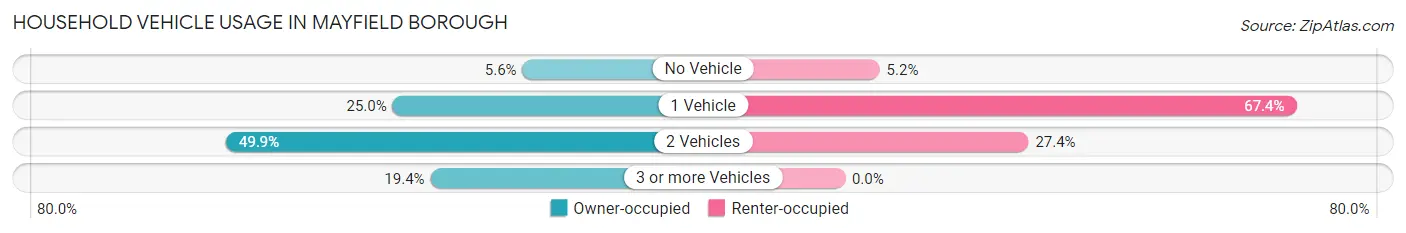
| Vehicles per Household | Owner-occupied | Renter-occupied |
| No Vehicle | 39 (5.6%) | 7 (5.2%) |
| 1 Vehicle | 173 (25.0%) | 91 (67.4%) |
| 2 Vehicles | 345 (49.9%) | 37 (27.4%) |
| 3 or more Vehicles | 134 (19.4%) | 0 (0.0%) |
| Total | 691 (100.0%) | 135 (100.0%) |
Real Estate & Mortgages in Mayfield borough
Real Estate and Mortgage Overview in Mayfield borough
| Characteristic | Without Mortgage | With Mortgage |
| Housing Units | 273 | 418 |
| Median Property Value | $164,500 | $119,900 |
| Median Household Income | $66,417 | $68 |
| Monthly Housing Costs | $541 | $2 |
| Real Estate Taxes | $1,913 | $0 |
Property Value by Mortgage Status in Mayfield borough
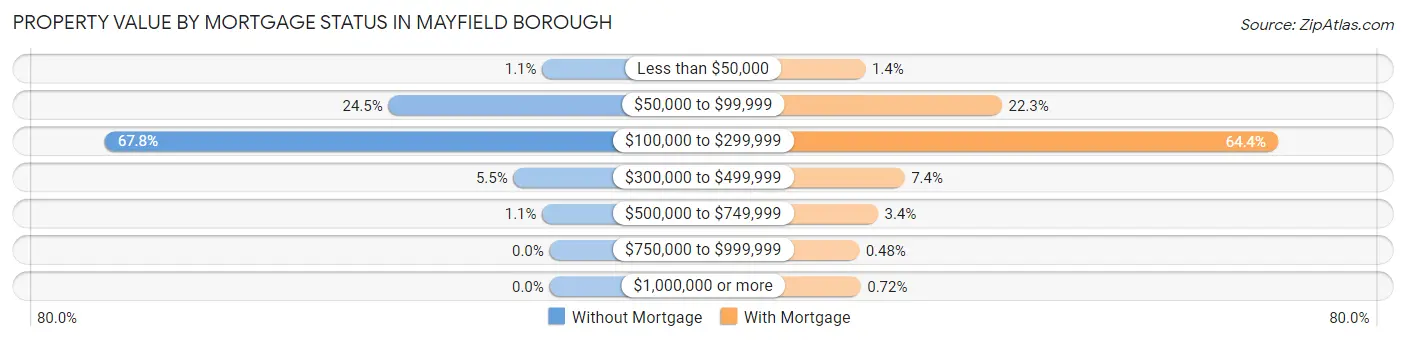
| Property Value | Without Mortgage | With Mortgage |
| Less than $50,000 | 3 (1.1%) | 6 (1.4%) |
| $50,000 to $99,999 | 67 (24.5%) | 93 (22.3%) |
| $100,000 to $299,999 | 185 (67.8%) | 269 (64.3%) |
| $300,000 to $499,999 | 15 (5.5%) | 31 (7.4%) |
| $500,000 to $749,999 | 3 (1.1%) | 14 (3.4%) |
| $750,000 to $999,999 | 0 (0.0%) | 2 (0.5%) |
| $1,000,000 or more | 0 (0.0%) | 3 (0.7%) |
| Total | 273 (100.0%) | 418 (100.0%) |
Household Income by Mortgage Status in Mayfield borough
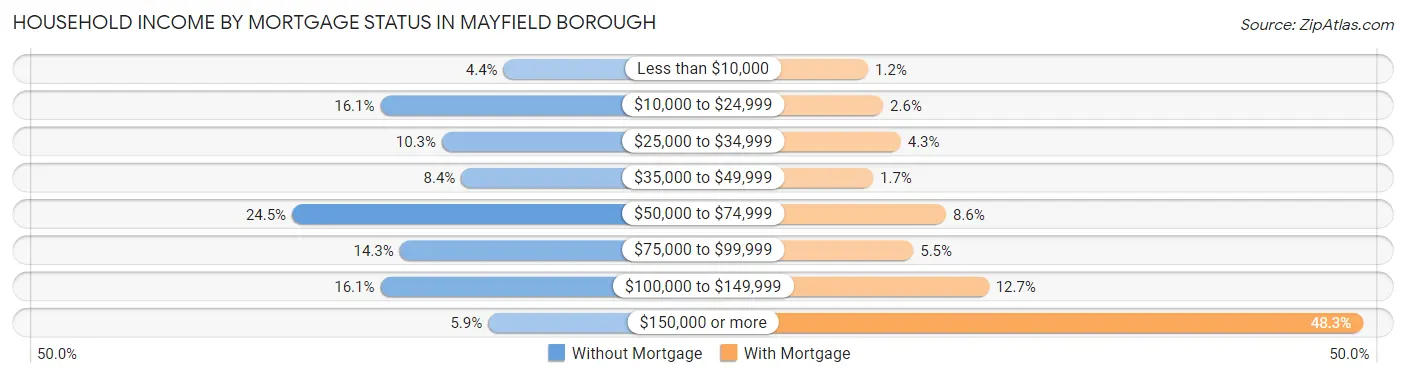
| Household Income | Without Mortgage | With Mortgage |
| Less than $10,000 | 12 (4.4%) | 5 (1.2%) |
| $10,000 to $24,999 | 44 (16.1%) | 11 (2.6%) |
| $25,000 to $34,999 | 28 (10.3%) | 18 (4.3%) |
| $35,000 to $49,999 | 23 (8.4%) | 7 (1.7%) |
| $50,000 to $74,999 | 67 (24.5%) | 36 (8.6%) |
| $75,000 to $99,999 | 39 (14.3%) | 23 (5.5%) |
| $100,000 to $149,999 | 44 (16.1%) | 53 (12.7%) |
| $150,000 or more | 16 (5.9%) | 202 (48.3%) |
| Total | 273 (100.0%) | 418 (100.0%) |
Property Value to Household Income Ratio in Mayfield borough
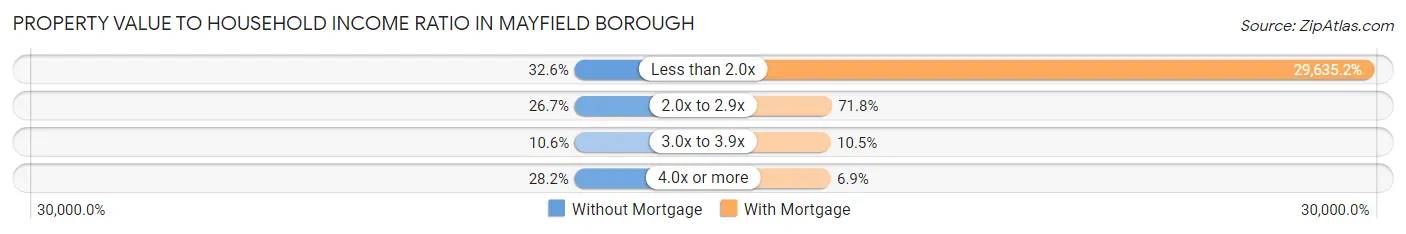
| Value-to-Income Ratio | Without Mortgage | With Mortgage |
| Less than 2.0x | 89 (32.6%) | 123,875 (29,635.2%) |
| 2.0x to 2.9x | 73 (26.7%) | 300 (71.8%) |
| 3.0x to 3.9x | 29 (10.6%) | 44 (10.5%) |
| 4.0x or more | 77 (28.2%) | 29 (6.9%) |
| Total | 273 (100.0%) | 418 (100.0%) |
Real Estate Taxes by Mortgage Status in Mayfield borough
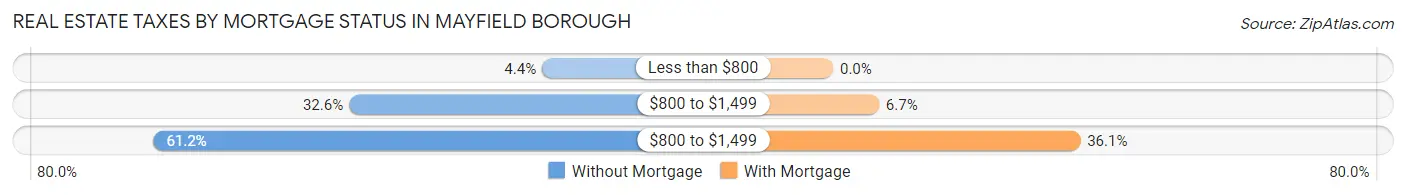
| Property Taxes | Without Mortgage | With Mortgage |
| Less than $800 | 12 (4.4%) | 0 (0.0%) |
| $800 to $1,499 | 89 (32.6%) | 28 (6.7%) |
| $800 to $1,499 | 167 (61.2%) | 151 (36.1%) |
| Total | 273 (100.0%) | 418 (100.0%) |
Health & Disability in Mayfield borough
Health Insurance Coverage by Age in Mayfield borough
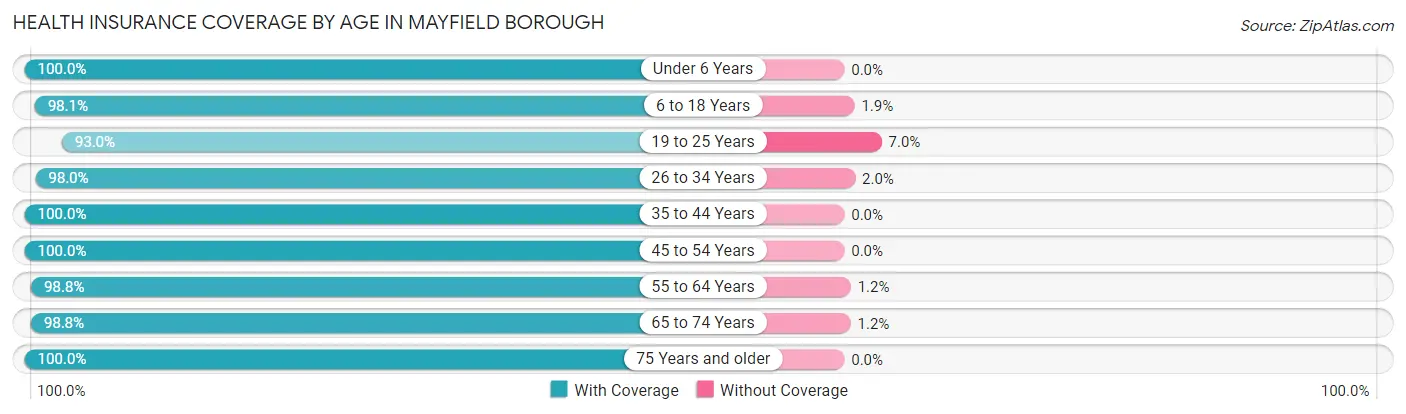
| Age Bracket | With Coverage | Without Coverage |
| Under 6 Years | 93 (100.0%) | 0 (0.0%) |
| 6 to 18 Years | 258 (98.1%) | 5 (1.9%) |
| 19 to 25 Years | 107 (93.0%) | 8 (7.0%) |
| 26 to 34 Years | 342 (98.0%) | 7 (2.0%) |
| 35 to 44 Years | 150 (100.0%) | 0 (0.0%) |
| 45 to 54 Years | 256 (100.0%) | 0 (0.0%) |
| 55 to 64 Years | 328 (98.8%) | 4 (1.2%) |
| 65 to 74 Years | 169 (98.8%) | 2 (1.2%) |
| 75 Years and older | 105 (100.0%) | 0 (0.0%) |
| Total | 1,808 (98.6%) | 26 (1.4%) |
Health Insurance Coverage by Citizenship Status in Mayfield borough
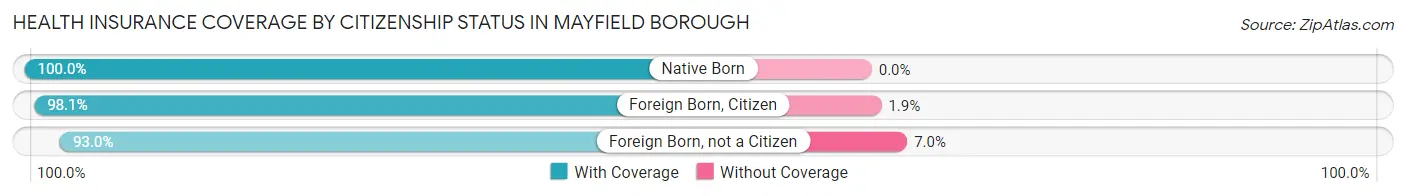
| Citizenship Status | With Coverage | Without Coverage |
| Native Born | 93 (100.0%) | 0 (0.0%) |
| Foreign Born, Citizen | 258 (98.1%) | 5 (1.9%) |
| Foreign Born, not a Citizen | 107 (93.0%) | 8 (7.0%) |
Health Insurance Coverage by Household Income in Mayfield borough
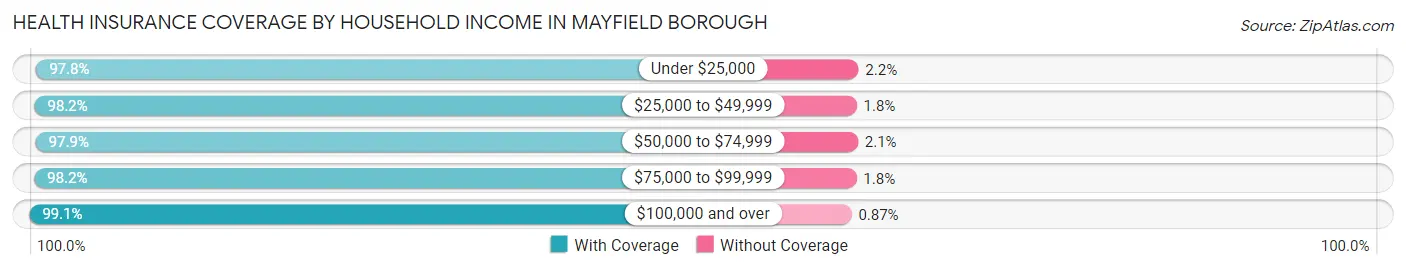
| Household Income | With Coverage | Without Coverage |
| Under $25,000 | 224 (97.8%) | 5 (2.2%) |
| $25,000 to $49,999 | 215 (98.2%) | 4 (1.8%) |
| $50,000 to $74,999 | 189 (97.9%) | 4 (2.1%) |
| $75,000 to $99,999 | 273 (98.2%) | 5 (1.8%) |
| $100,000 and over | 907 (99.1%) | 8 (0.9%) |
Public vs Private Health Insurance Coverage by Age in Mayfield borough
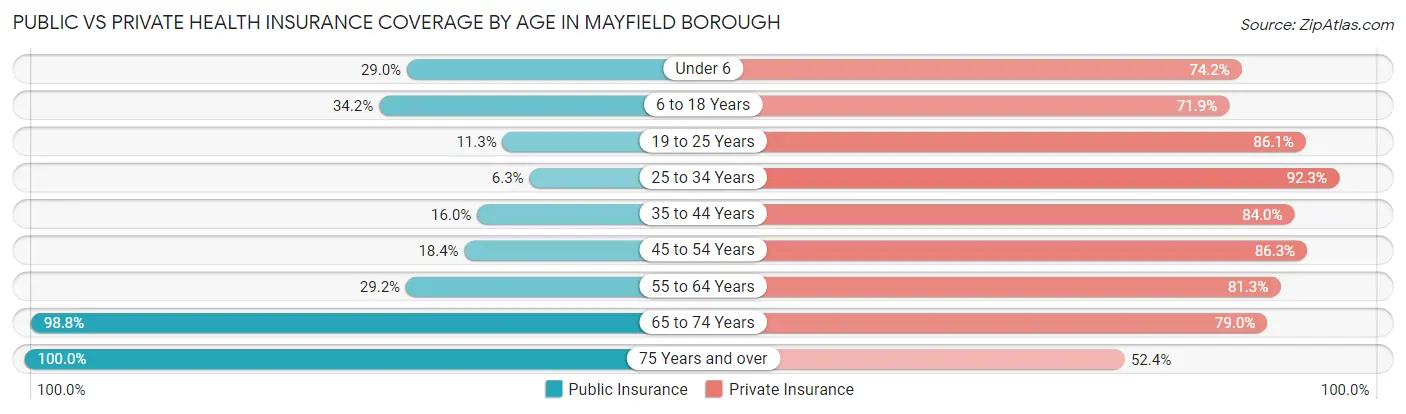
| Age Bracket | Public Insurance | Private Insurance |
| Under 6 | 27 (29.0%) | 69 (74.2%) |
| 6 to 18 Years | 90 (34.2%) | 189 (71.9%) |
| 19 to 25 Years | 13 (11.3%) | 99 (86.1%) |
| 25 to 34 Years | 22 (6.3%) | 322 (92.3%) |
| 35 to 44 Years | 24 (16.0%) | 126 (84.0%) |
| 45 to 54 Years | 47 (18.4%) | 221 (86.3%) |
| 55 to 64 Years | 97 (29.2%) | 270 (81.3%) |
| 65 to 74 Years | 169 (98.8%) | 135 (78.9%) |
| 75 Years and over | 105 (100.0%) | 55 (52.4%) |
| Total | 594 (32.4%) | 1,486 (81.0%) |
Disability Status by Sex by Age in Mayfield borough
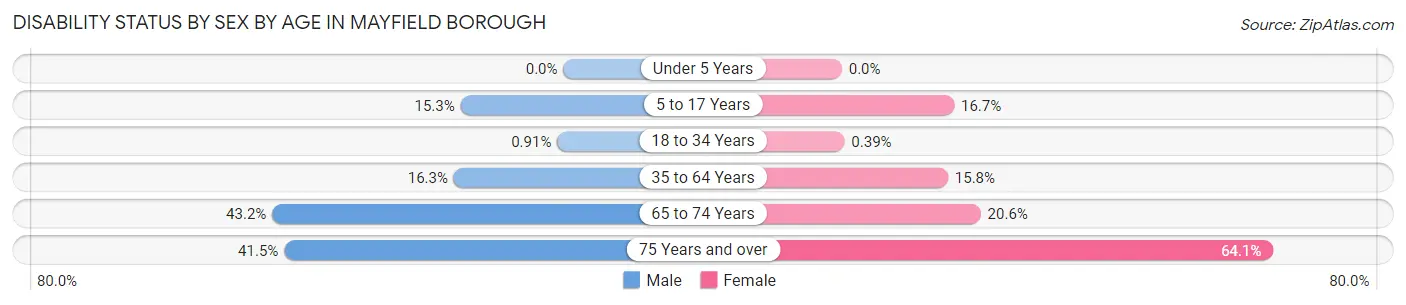
| Age Bracket | Male | Female |
| Under 5 Years | 0 (0.0%) | 0 (0.0%) |
| 5 to 17 Years | 20 (15.3%) | 22 (16.7%) |
| 18 to 34 Years | 2 (0.9%) | 1 (0.4%) |
| 35 to 64 Years | 55 (16.3%) | 63 (15.8%) |
| 65 to 74 Years | 32 (43.2%) | 20 (20.6%) |
| 75 Years and over | 17 (41.5%) | 41 (64.1%) |
Disability Class by Sex by Age in Mayfield borough
Disability Class: Hearing Difficulty
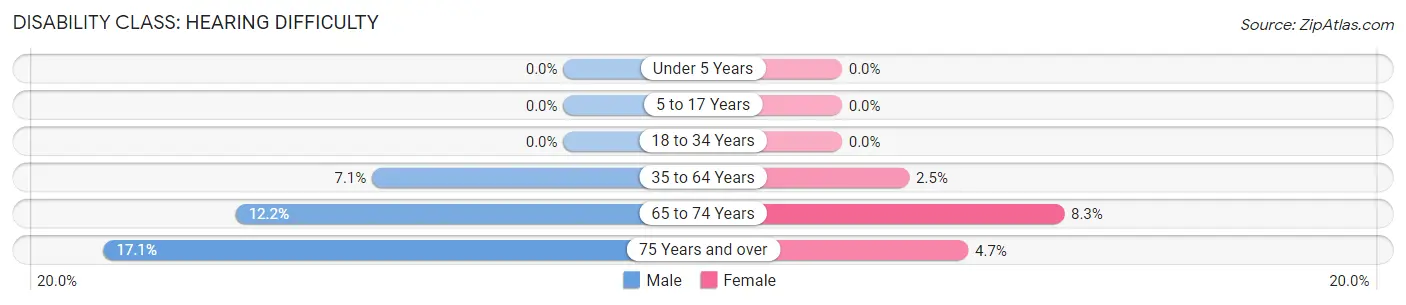
| Age Bracket | Male | Female |
| Under 5 Years | 0 (0.0%) | 0 (0.0%) |
| 5 to 17 Years | 0 (0.0%) | 0 (0.0%) |
| 18 to 34 Years | 0 (0.0%) | 0 (0.0%) |
| 35 to 64 Years | 24 (7.1%) | 10 (2.5%) |
| 65 to 74 Years | 9 (12.2%) | 8 (8.3%) |
| 75 Years and over | 7 (17.1%) | 3 (4.7%) |
Disability Class: Vision Difficulty
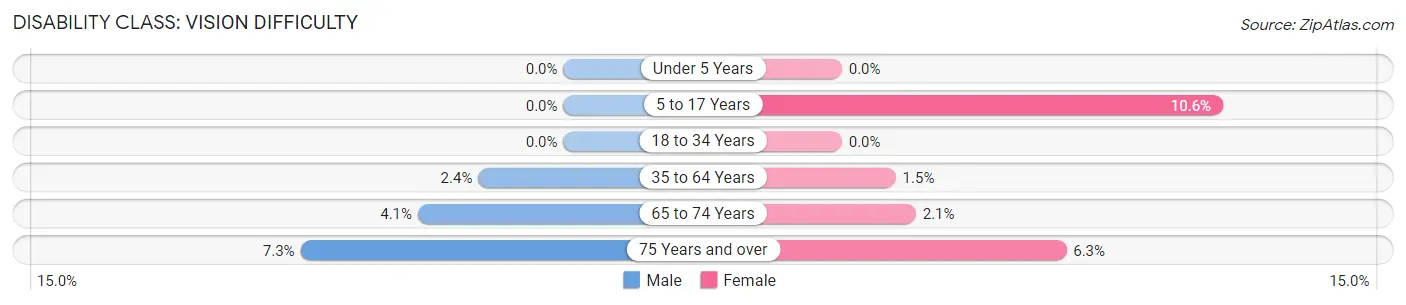
| Age Bracket | Male | Female |
| Under 5 Years | 0 (0.0%) | 0 (0.0%) |
| 5 to 17 Years | 0 (0.0%) | 14 (10.6%) |
| 18 to 34 Years | 0 (0.0%) | 0 (0.0%) |
| 35 to 64 Years | 8 (2.4%) | 6 (1.5%) |
| 65 to 74 Years | 3 (4.1%) | 2 (2.1%) |
| 75 Years and over | 3 (7.3%) | 4 (6.2%) |
Disability Class: Cognitive Difficulty
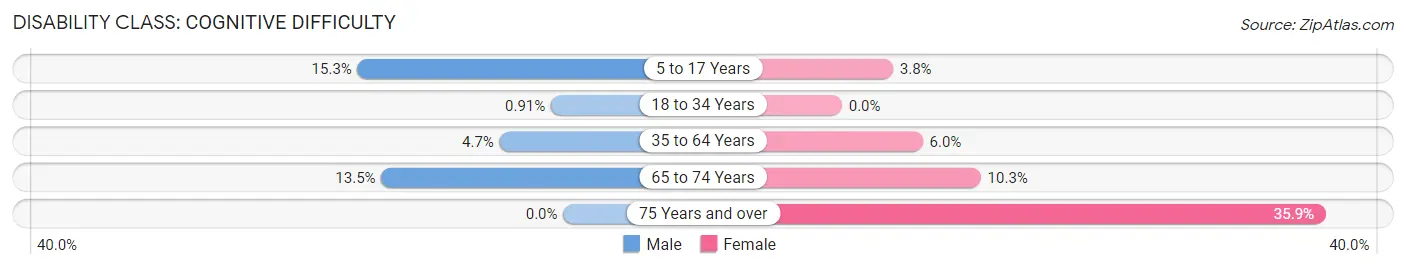
| Age Bracket | Male | Female |
| 5 to 17 Years | 20 (15.3%) | 5 (3.8%) |
| 18 to 34 Years | 2 (0.9%) | 0 (0.0%) |
| 35 to 64 Years | 16 (4.7%) | 24 (6.0%) |
| 65 to 74 Years | 10 (13.5%) | 10 (10.3%) |
| 75 Years and over | 0 (0.0%) | 23 (35.9%) |
Disability Class: Ambulatory Difficulty
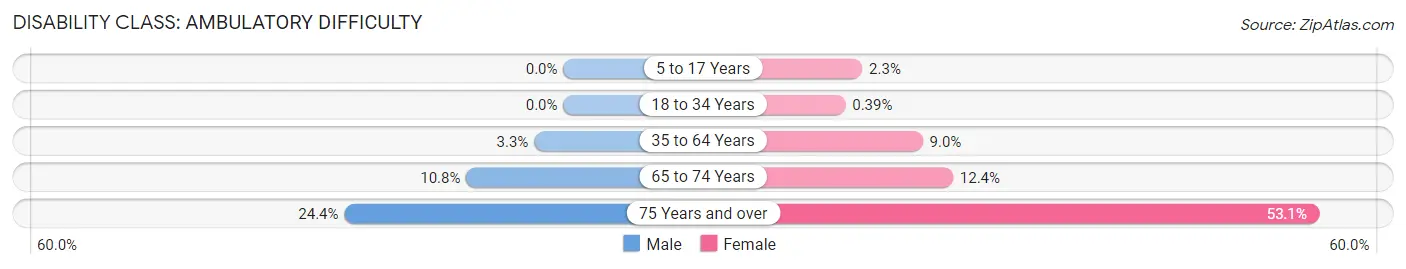
| Age Bracket | Male | Female |
| 5 to 17 Years | 0 (0.0%) | 3 (2.3%) |
| 18 to 34 Years | 0 (0.0%) | 1 (0.4%) |
| 35 to 64 Years | 11 (3.3%) | 36 (9.0%) |
| 65 to 74 Years | 8 (10.8%) | 12 (12.4%) |
| 75 Years and over | 10 (24.4%) | 34 (53.1%) |
Disability Class: Self-Care Difficulty
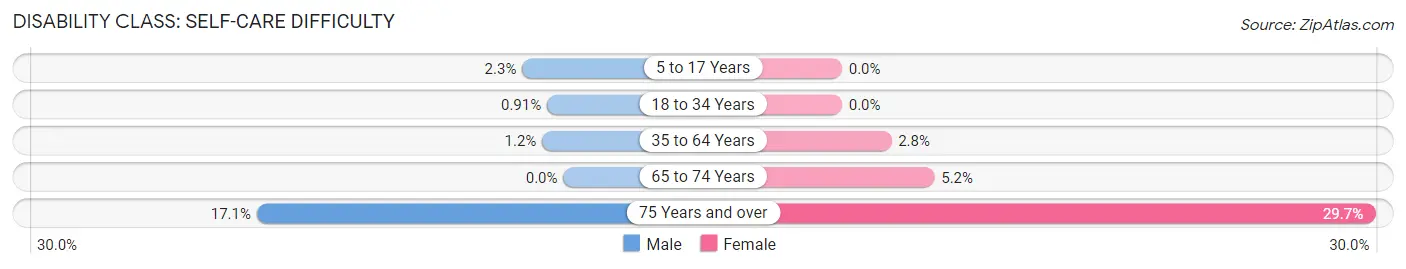
| Age Bracket | Male | Female |
| 5 to 17 Years | 3 (2.3%) | 0 (0.0%) |
| 18 to 34 Years | 2 (0.9%) | 0 (0.0%) |
| 35 to 64 Years | 4 (1.2%) | 11 (2.8%) |
| 65 to 74 Years | 0 (0.0%) | 5 (5.1%) |
| 75 Years and over | 7 (17.1%) | 19 (29.7%) |
Technology Access in Mayfield borough
Computing Device Access in Mayfield borough
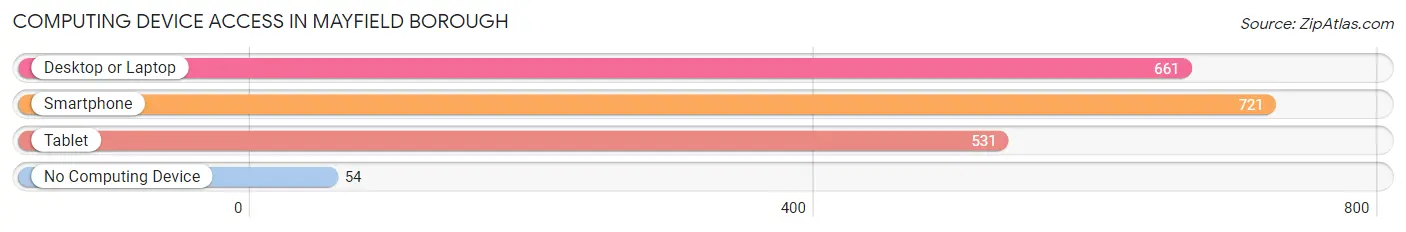
| Device Type | # Households | % Households |
| Desktop or Laptop | 661 | 80.0% |
| Smartphone | 721 | 87.3% |
| Tablet | 531 | 64.3% |
| No Computing Device | 54 | 6.5% |
| Total | 826 | 100.0% |
Internet Access in Mayfield borough
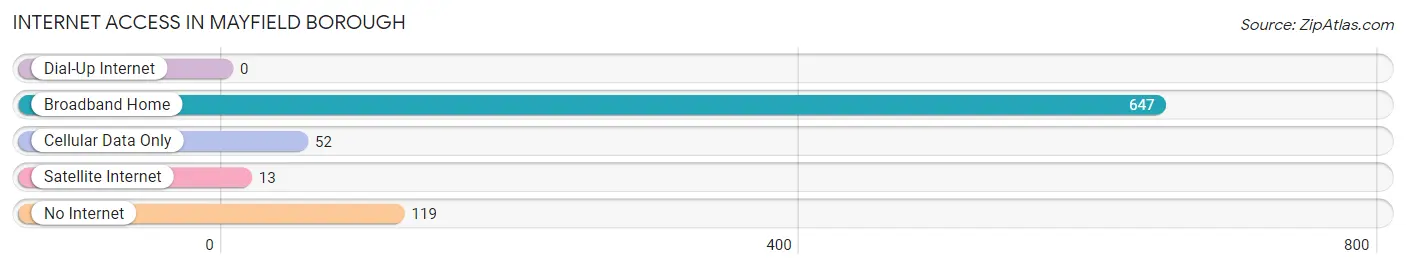
| Internet Type | # Households | % Households |
| Dial-Up Internet | 0 | 0.0% |
| Broadband Home | 647 | 78.3% |
| Cellular Data Only | 52 | 6.3% |
| Satellite Internet | 13 | 1.6% |
| No Internet | 119 | 14.4% |
| Total | 826 | 100.0% |
Mayfield borough Summary
Mayfield Borough is a small borough located in Lackawanna County, Pennsylvania. It is situated in the foothills of the Pocono Mountains and is part of the Scranton–Wilkes-Barre–Hazleton Metropolitan Statistical Area. The borough has a population of approximately 1,800 people and covers an area of 0.7 square miles.
History
Mayfield Borough was founded in 1845 by a group of settlers from Connecticut. The settlers named the borough after Mayfield, Connecticut, the town they had left behind. The borough was incorporated in 1866 and has remained relatively unchanged since then.
The borough was originally a farming community, but in the late 19th century, the coal industry began to take hold in the area. The coal industry brought a large influx of immigrants to the area, many of whom were of Polish and Italian descent. This influx of immigrants helped to shape the culture of the borough and many of the traditions and customs of the area are still practiced today.
Geography
Mayfield Borough is located in the foothills of the Pocono Mountains in northeastern Pennsylvania. The borough is situated in the Lackawanna Valley, which is part of the Appalachian Mountains. The borough is bordered by the townships of Carbondale, Fell, and Jessup.
The borough is located in a hilly area and is surrounded by forests and streams. The Lackawanna River runs through the borough and is a popular spot for fishing and other recreational activities.
Economy
The economy of Mayfield Borough is largely based on the coal industry. The borough is home to several coal mines, which provide employment for many of the residents. In addition to the coal industry, the borough also has a number of small businesses, including restaurants, shops, and other services.
The borough also has a number of tourist attractions, including the Lackawanna Coal Mine Tour, which offers visitors a chance to explore the history of the coal industry in the area. The borough also has a number of parks and recreational areas, including the Lackawanna State Park, which offers camping, hiking, and other outdoor activities.
Demographics
As of the 2010 census, the population of Mayfield Borough was 1,811. The racial makeup of the borough was 97.3% White, 0.7% African American, 0.2% Native American, 0.3% Asian, and 1.5% from two or more races. Hispanic or Latino of any race were 1.2% of the population.
The median household income in Mayfield Borough was $41,250, and the median family income was $50,000. The per capita income was $20,945. About 11.2% of families and 14.2% of the population were below the poverty line, including 18.2% of those under age 18 and 8.3% of those age 65 or over.
Mayfield Borough is a small borough with a rich history and culture. The borough is home to a diverse population and has a strong economy based on the coal industry. The borough also has a number of tourist attractions and recreational areas, making it a great place to visit or live.
Common Questions
What is Per Capita Income in Mayfield borough?
Per Capita income in Mayfield borough is $39,109.
What is the Median Family Income in Mayfield borough?
Median Family Income in Mayfield borough is $97,885.
What is the Median Household income in Mayfield borough?
Median Household Income in Mayfield borough is $84,545.
What is Income or Wage Gap in Mayfield borough?
Income or Wage Gap in Mayfield borough is 37.3%.
Women in Mayfield borough earn 62.7 cents for every dollar earned by a man.
What is Inequality or Gini Index in Mayfield borough?
Inequality or Gini Index in Mayfield borough is 0.37.
What is the Total Population of Mayfield borough?
Total Population of Mayfield borough is 1,835.
What is the Total Male Population of Mayfield borough?
Total Male Population of Mayfield borough is 829.
What is the Total Female Population of Mayfield borough?
Total Female Population of Mayfield borough is 1,006.
What is the Ratio of Males per 100 Females in Mayfield borough?
There are 82.41 Males per 100 Females in Mayfield borough.
What is the Ratio of Females per 100 Males in Mayfield borough?
There are 121.35 Females per 100 Males in Mayfield borough.
What is the Median Population Age in Mayfield borough?
Median Population Age in Mayfield borough is 41.7 Years.
What is the Average Family Size in Mayfield borough
Average Family Size in Mayfield borough is 2.8 People.
What is the Average Household Size in Mayfield borough
Average Household Size in Mayfield borough is 2.2 People.
How Large is the Labor Force in Mayfield borough?
There are 1,098 People in the Labor Forcein in Mayfield borough.
What is the Percentage of People in the Labor Force in Mayfield borough?
70.4% of People are in the Labor Force in Mayfield borough.
What is the Unemployment Rate in Mayfield borough?
Unemployment Rate in Mayfield borough is 4.2%.