Valley Green, PA Map & Demographics
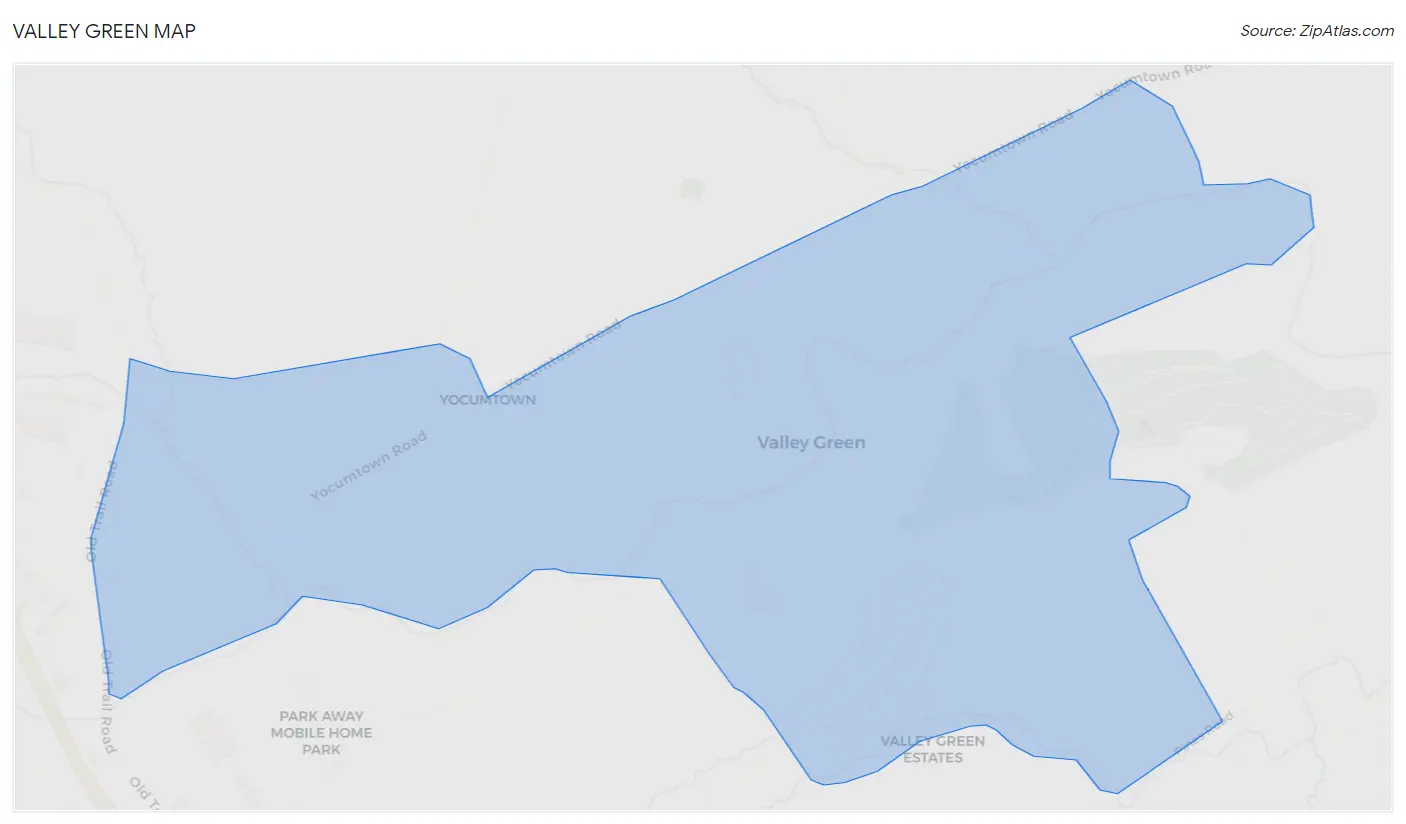
Valley Green Map
Valley Green Overview
$42,860
PER CAPITA INCOME
$100,000
AVG FAMILY INCOME
$96,368
AVG HOUSEHOLD INCOME
20.4%
WAGE / INCOME GAP [ % ]
79.6¢/ $1
WAGE / INCOME GAP [ $ ]
0.31
INEQUALITY / GINI INDEX
2,867
TOTAL POPULATION
1,480
MALE POPULATION
1,387
FEMALE POPULATION
106.71
MALES / 100 FEMALES
93.72
FEMALES / 100 MALES
37.3
MEDIAN AGE
2.9
AVG FAMILY SIZE
2.5
AVG HOUSEHOLD SIZE
1,720
LABOR FORCE [ PEOPLE ]
74.6%
PERCENT IN LABOR FORCE
2.0%
UNEMPLOYMENT RATE
Income in Valley Green
Income Overview in Valley Green
Per Capita Income in Valley Green is $42,860, while median incomes of families and households are $100,000 and $96,368 respectively.
| Characteristic | Number | Measure |
| Per Capita Income | 2,867 | $42,860 |
| Median Family Income | 812 | $100,000 |
| Mean Family Income | 812 | $111,430 |
| Median Household Income | 1,172 | $96,368 |
| Mean Household Income | 1,172 | $102,259 |
| Income Deficit | 812 | $0 |
| Wage / Income Gap (%) | 2,867 | 20.39% |
| Wage / Income Gap ($) | 2,867 | 79.61¢ per $1 |
| Gini / Inequality Index | 2,867 | 0.31 |
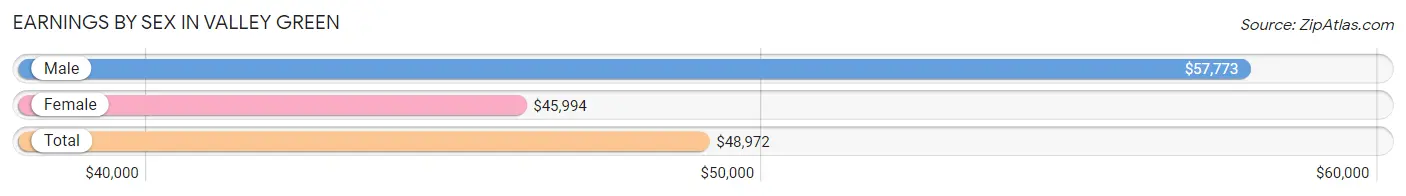
Earnings by Sex in Valley Green
Average Earnings in Valley Green are $48,972, $57,773 for men and $45,994 for women, a difference of 20.4%.
| Sex | Number | Average Earnings |
| Male | 995 (56.5%) | $57,773 |
| Female | 765 (43.5%) | $45,994 |
| Total | 1,760 (100.0%) | $48,972 |
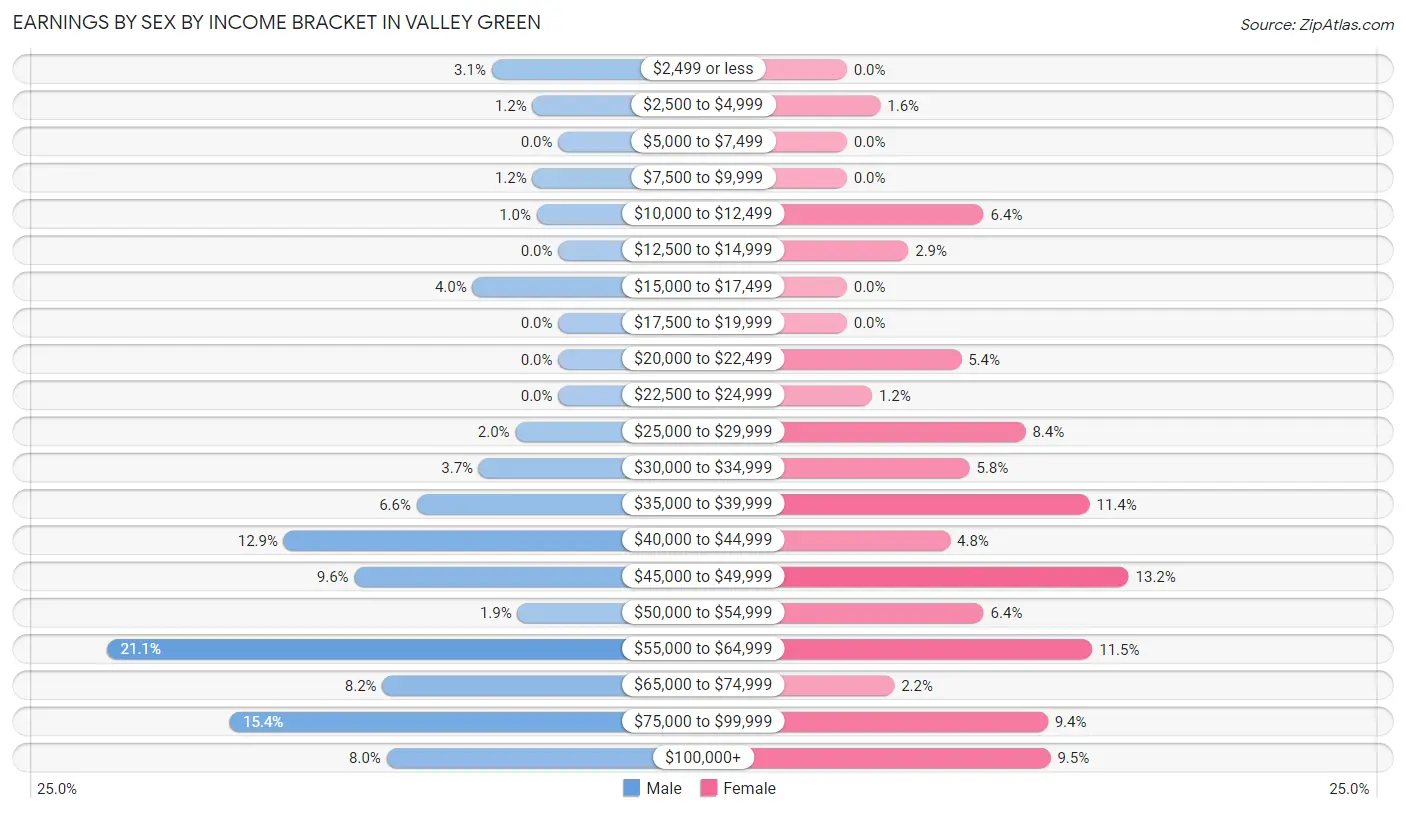
Earnings by Sex by Income Bracket in Valley Green
The most common earnings brackets in Valley Green are $55,000 to $64,999 for men (210 | 21.1%) and $45,000 to $49,999 for women (101 | 13.2%).
| Income | Male | Female |
| $2,499 or less | 31 (3.1%) | 0 (0.0%) |
| $2,500 to $4,999 | 12 (1.2%) | 12 (1.6%) |
| $5,000 to $7,499 | 0 (0.0%) | 0 (0.0%) |
| $7,500 to $9,999 | 12 (1.2%) | 0 (0.0%) |
| $10,000 to $12,499 | 10 (1.0%) | 49 (6.4%) |
| $12,500 to $14,999 | 0 (0.0%) | 22 (2.9%) |
| $15,000 to $17,499 | 40 (4.0%) | 0 (0.0%) |
| $17,500 to $19,999 | 0 (0.0%) | 0 (0.0%) |
| $20,000 to $22,499 | 0 (0.0%) | 41 (5.4%) |
| $22,500 to $24,999 | 0 (0.0%) | 9 (1.2%) |
| $25,000 to $29,999 | 20 (2.0%) | 64 (8.4%) |
| $30,000 to $34,999 | 37 (3.7%) | 44 (5.8%) |
| $35,000 to $39,999 | 66 (6.6%) | 87 (11.4%) |
| $40,000 to $44,999 | 128 (12.9%) | 37 (4.8%) |
| $45,000 to $49,999 | 95 (9.6%) | 101 (13.2%) |
| $50,000 to $54,999 | 19 (1.9%) | 49 (6.4%) |
| $55,000 to $64,999 | 210 (21.1%) | 88 (11.5%) |
| $65,000 to $74,999 | 82 (8.2%) | 17 (2.2%) |
| $75,000 to $99,999 | 153 (15.4%) | 72 (9.4%) |
| $100,000+ | 80 (8.0%) | 73 (9.5%) |
| Total | 995 (100.0%) | 765 (100.0%) |
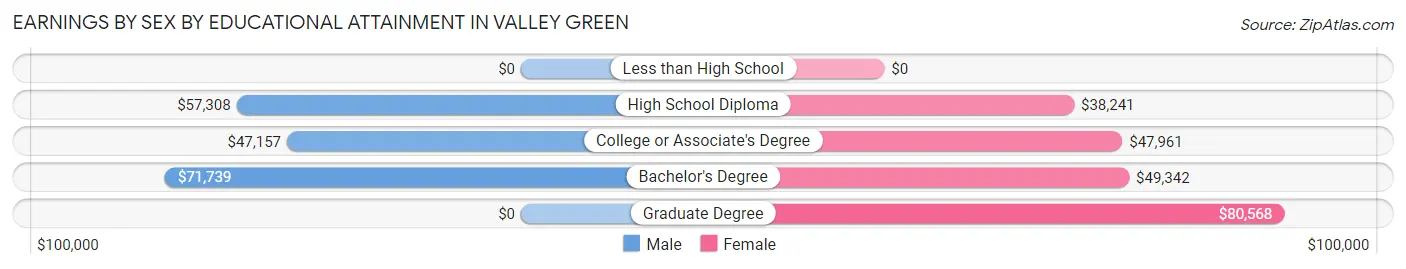
Earnings by Sex by Educational Attainment in Valley Green
Average earnings in Valley Green are $58,666 for men and $47,917 for women, a difference of 18.3%. Men with an educational attainment of bachelor's degree enjoy the highest average annual earnings of $71,739, while those with college or associate's degree education earn the least with $47,157. Women with an educational attainment of graduate degree earn the most with the average annual earnings of $80,568, while those with high school diploma education have the smallest earnings of $38,241.
| Educational Attainment | Male Income | Female Income |
| Less than High School | - | - |
| High School Diploma | $57,308 | $38,241 |
| College or Associate's Degree | $47,157 | $47,961 |
| Bachelor's Degree | $71,739 | $49,342 |
| Graduate Degree | - | - |
| Total | $58,666 | $47,917 |
Family Income in Valley Green
Family Income Brackets in Valley Green
According to the Valley Green family income data, there are 278 families falling into the $100,000 to $149,999 income range, which is the most common income bracket and makes up 34.2% of all families.
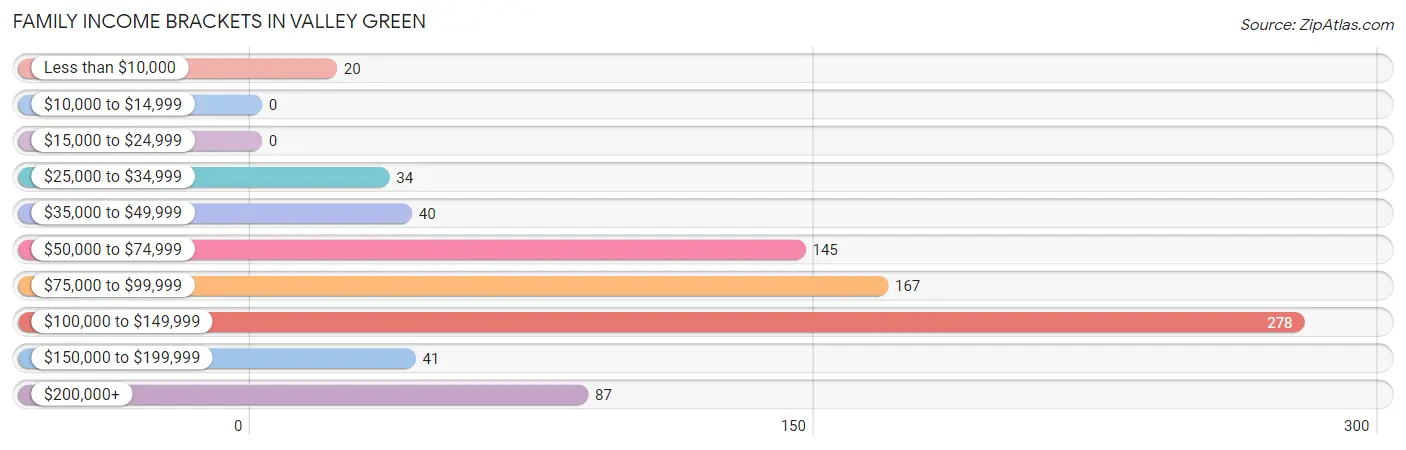
| Income Bracket | # Families | % Families |
| Less than $10,000 | 20 | 2.5% |
| $10,000 to $14,999 | 0 | 0.0% |
| $15,000 to $24,999 | 0 | 0.0% |
| $25,000 to $34,999 | 34 | 4.2% |
| $35,000 to $49,999 | 40 | 4.9% |
| $50,000 to $74,999 | 145 | 17.9% |
| $75,000 to $99,999 | 167 | 20.6% |
| $100,000 to $149,999 | 278 | 34.2% |
| $150,000 to $199,999 | 41 | 5.0% |
| $200,000+ | 87 | 10.7% |
Family Income by Famaliy Size in Valley Green
3-person families (176 | 21.7%) account for the highest median family income in Valley Green with $103,068 per family, while 2-person families (409 | 50.4%) have the highest median income of $49,760 per family member.
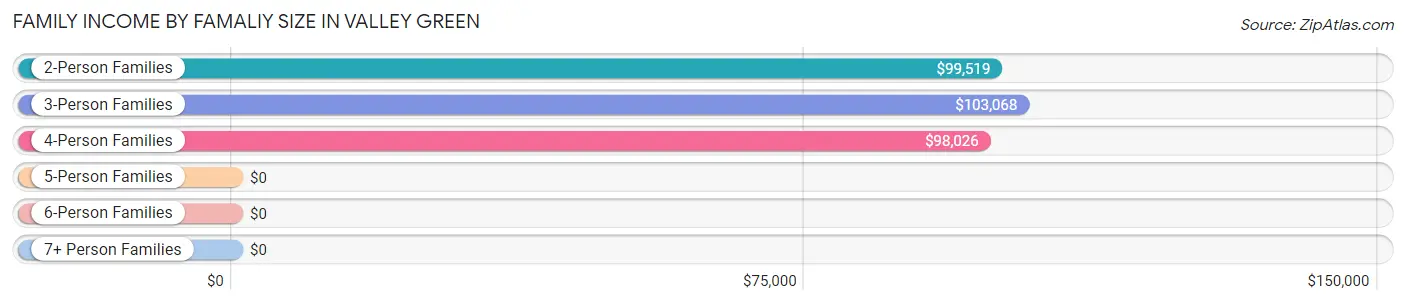
| Income Bracket | # Families | Median Income |
| 2-Person Families | 409 (50.4%) | $99,519 |
| 3-Person Families | 176 (21.7%) | $103,068 |
| 4-Person Families | 202 (24.9%) | $98,026 |
| 5-Person Families | 14 (1.7%) | $0 |
| 6-Person Families | 11 (1.3%) | $0 |
| 7+ Person Families | 0 (0.0%) | $0 |
| Total | 812 (100.0%) | $100,000 |
Family Income by Number of Earners in Valley Green
The median family income in Valley Green is $100,000, with families comprising 3+ earners (56) having the highest median family income of $124,853, while families with no earners (117) have the lowest median family income of $68,661, accounting for 6.9% and 14.4% of families, respectively.
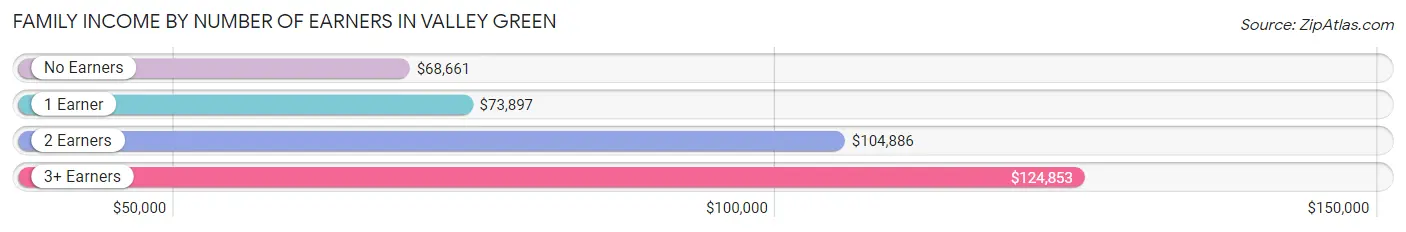
| Number of Earners | # Families | Median Income |
| No Earners | 117 (14.4%) | $68,661 |
| 1 Earner | 227 (28.0%) | $73,897 |
| 2 Earners | 412 (50.7%) | $104,886 |
| 3+ Earners | 56 (6.9%) | $124,853 |
| Total | 812 (100.0%) | $100,000 |
Household Income in Valley Green
Household Income Brackets in Valley Green
With 380 households falling in the category, the $100,000 to $149,999 income range is the most frequent in Valley Green, accounting for 32.4% of all households.
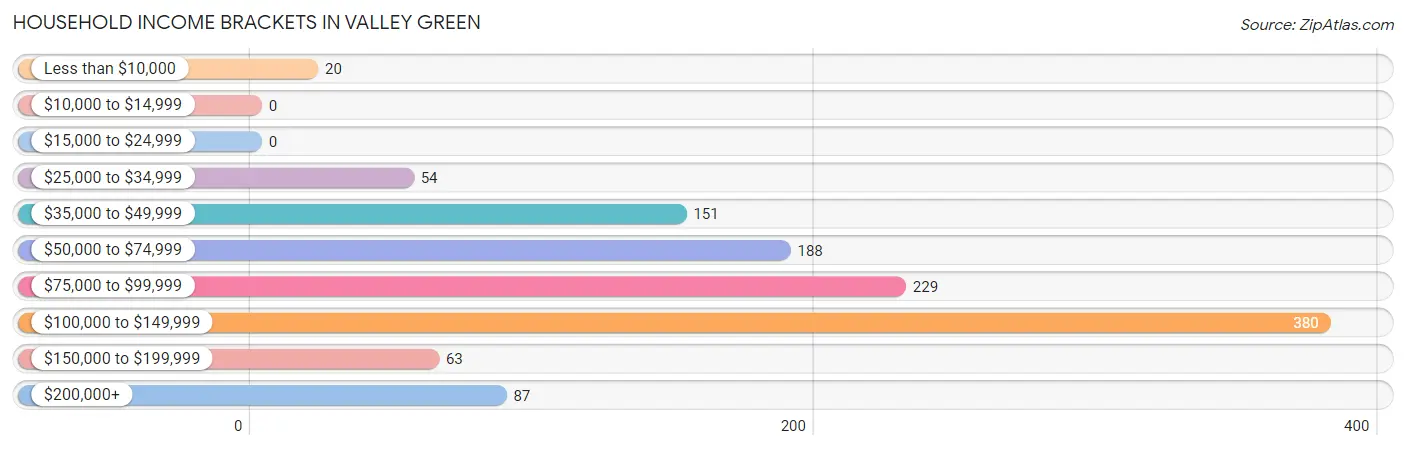
| Income Bracket | # Households | % Households |
| Less than $10,000 | 20 | 1.7% |
| $10,000 to $14,999 | 0 | 0.0% |
| $15,000 to $24,999 | 0 | 0.0% |
| $25,000 to $34,999 | 54 | 4.6% |
| $35,000 to $49,999 | 151 | 12.9% |
| $50,000 to $74,999 | 188 | 16.0% |
| $75,000 to $99,999 | 229 | 19.5% |
| $100,000 to $149,999 | 380 | 32.4% |
| $150,000 to $199,999 | 63 | 5.4% |
| $200,000+ | 87 | 7.4% |
Household Income by Householder Age in Valley Green
The median household income in Valley Green is $96,368, with the highest median household income of $105,025 found in the 25 to 44 years age bracket for the primary householder. A total of 479 households (40.9%) fall into this category. Meanwhile, the 15 to 24 years age bracket for the primary householder has the lowest median household income of $0, with 108 households (9.2%) in this group.
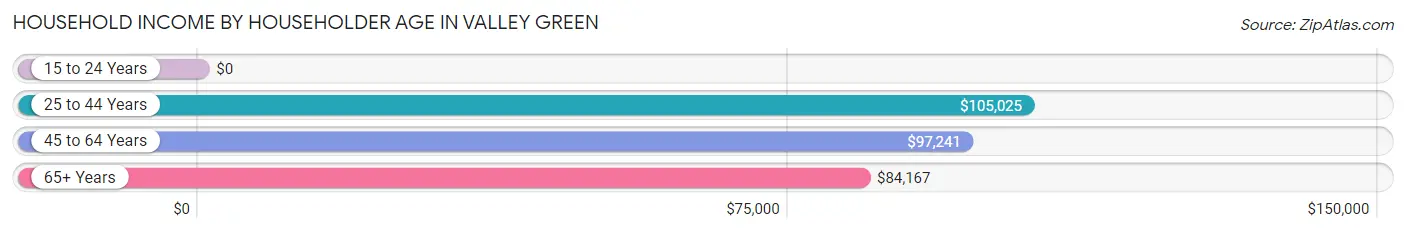
| Income Bracket | # Households | Median Income |
| 15 to 24 Years | 108 (9.2%) | $0 |
| 25 to 44 Years | 479 (40.9%) | $105,025 |
| 45 to 64 Years | 395 (33.7%) | $97,241 |
| 65+ Years | 190 (16.2%) | $84,167 |
| Total | 1,172 (100.0%) | $96,368 |
Poverty in Valley Green
Income Below Poverty by Sex and Age in Valley Green
With 1.4% poverty level for males and 1.5% for females among the residents of Valley Green, 75 year old and over males and 75 year old and over females are the most vulnerable to poverty, with 20 males (30.3%) and 21 females (23.1%) in their respective age groups living below the poverty level.
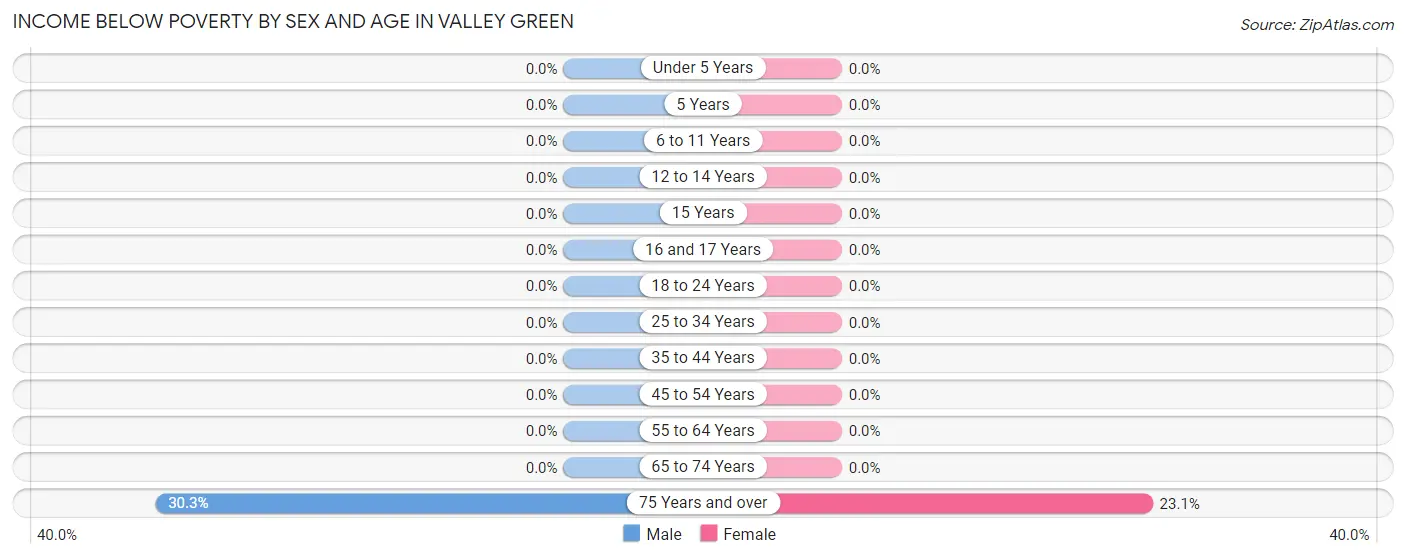
| Age Bracket | Male | Female |
| Under 5 Years | 0 (0.0%) | 0 (0.0%) |
| 5 Years | 0 (0.0%) | 0 (0.0%) |
| 6 to 11 Years | 0 (0.0%) | 0 (0.0%) |
| 12 to 14 Years | 0 (0.0%) | 0 (0.0%) |
| 15 Years | 0 (0.0%) | 0 (0.0%) |
| 16 and 17 Years | 0 (0.0%) | 0 (0.0%) |
| 18 to 24 Years | 0 (0.0%) | 0 (0.0%) |
| 25 to 34 Years | 0 (0.0%) | 0 (0.0%) |
| 35 to 44 Years | 0 (0.0%) | 0 (0.0%) |
| 45 to 54 Years | 0 (0.0%) | 0 (0.0%) |
| 55 to 64 Years | 0 (0.0%) | 0 (0.0%) |
| 65 to 74 Years | 0 (0.0%) | 0 (0.0%) |
| 75 Years and over | 20 (30.3%) | 21 (23.1%) |
| Total | 20 (1.4%) | 21 (1.5%) |
Income Above Poverty by Sex and Age in Valley Green
According to the poverty statistics in Valley Green, males aged under 5 years and females aged under 5 years are the age groups that are most secure financially, with 100.0% of males and 100.0% of females in these age groups living above the poverty line.
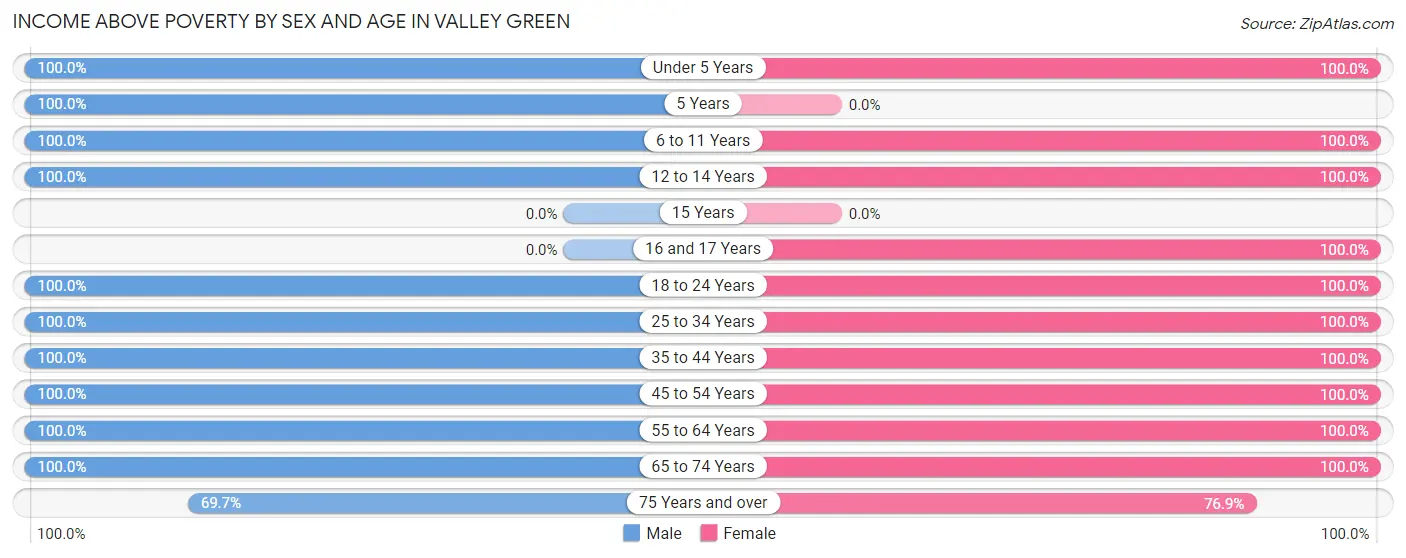
| Age Bracket | Male | Female |
| Under 5 Years | 59 (100.0%) | 193 (100.0%) |
| 5 Years | 14 (100.0%) | 0 (0.0%) |
| 6 to 11 Years | 158 (100.0%) | 13 (100.0%) |
| 12 to 14 Years | 54 (100.0%) | 51 (100.0%) |
| 15 Years | 0 (0.0%) | 0 (0.0%) |
| 16 and 17 Years | 0 (0.0%) | 24 (100.0%) |
| 18 to 24 Years | 142 (100.0%) | 70 (100.0%) |
| 25 to 34 Years | 227 (100.0%) | 283 (100.0%) |
| 35 to 44 Years | 277 (100.0%) | 175 (100.0%) |
| 45 to 54 Years | 187 (100.0%) | 200 (100.0%) |
| 55 to 64 Years | 187 (100.0%) | 173 (100.0%) |
| 65 to 74 Years | 90 (100.0%) | 114 (100.0%) |
| 75 Years and over | 46 (69.7%) | 70 (76.9%) |
| Total | 1,441 (98.6%) | 1,366 (98.5%) |
Income Below Poverty Among Married-Couple Families in Valley Green
The poverty statistics for married-couple families in Valley Green show that 3.3% or 20 of the total 611 families live below the poverty line. Families with no children have the highest poverty rate of 5.8%, comprising of 20 families. On the other hand, families with 1 or 2 children have the lowest poverty rate of 0.0%, which includes 0 families.
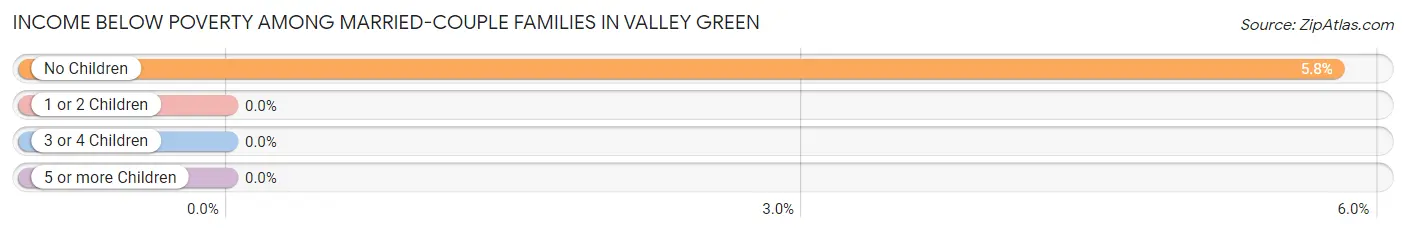
| Children | Above Poverty | Below Poverty |
| No Children | 326 (94.2%) | 20 (5.8%) |
| 1 or 2 Children | 240 (100.0%) | 0 (0.0%) |
| 3 or 4 Children | 25 (100.0%) | 0 (0.0%) |
| 5 or more Children | 0 (0.0%) | 0 (0.0%) |
| Total | 591 (96.7%) | 20 (3.3%) |
Income Below Poverty Among Single-Parent Households in Valley Green
| Children | Single Father | Single Mother |
| No Children | 0 (0.0%) | 0 (0.0%) |
| 1 or 2 Children | 0 (0.0%) | 0 (0.0%) |
| 3 or 4 Children | 0 (0.0%) | 0 (0.0%) |
| 5 or more Children | 0 (0.0%) | 0 (0.0%) |
| Total | 0 (0.0%) | 0 (0.0%) |
Income Below Poverty Among Married-Couple vs Single-Parent Households in Valley Green
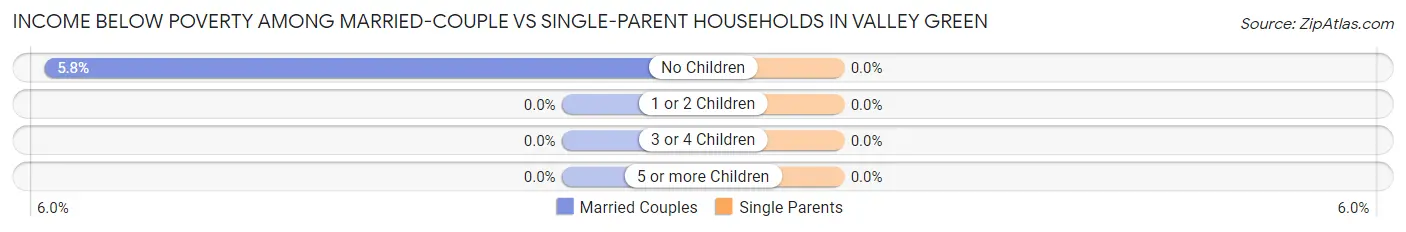
| Children | Married-Couple Families | Single-Parent Households |
| No Children | 20 (5.8%) | 0 (0.0%) |
| 1 or 2 Children | 0 (0.0%) | 0 (0.0%) |
| 3 or 4 Children | 0 (0.0%) | 0 (0.0%) |
| 5 or more Children | 0 (0.0%) | 0 (0.0%) |
| Total | 20 (3.3%) | 0 (0.0%) |
Race in Valley Green
The most populous races in Valley Green are White / Caucasian (2,811 | 98.1%), Hispanic or Latino (108 | 3.8%), and Some other Race (36 | 1.3%).
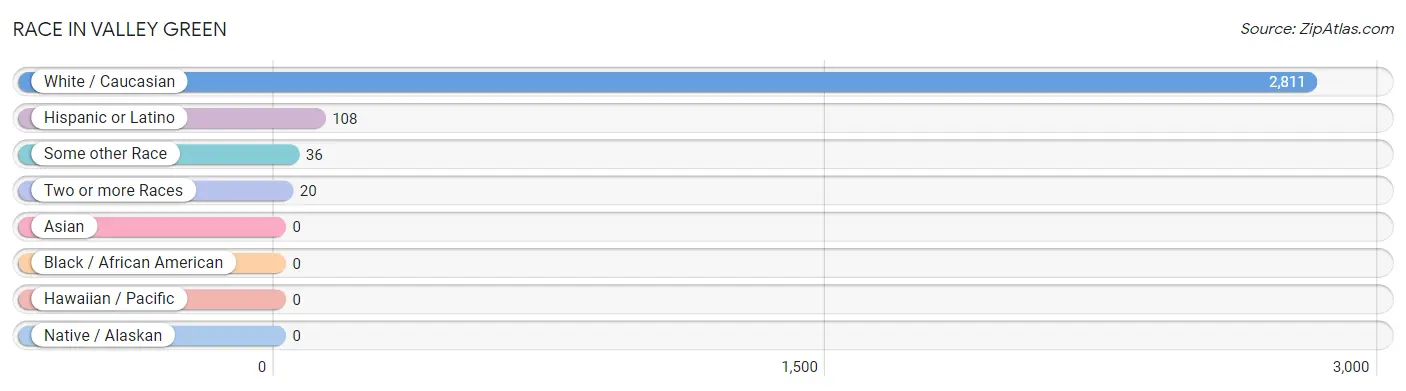
| Race | # Population | % Population |
| Asian | 0 | 0.0% |
| Black / African American | 0 | 0.0% |
| Hawaiian / Pacific | 0 | 0.0% |
| Hispanic or Latino | 108 | 3.8% |
| Native / Alaskan | 0 | 0.0% |
| White / Caucasian | 2,811 | 98.1% |
| Two or more Races | 20 | 0.7% |
| Some other Race | 36 | 1.3% |
| Total | 2,867 | 100.0% |
Ancestry in Valley Green
The most populous ancestries reported in Valley Green are German (918 | 32.0%), Irish (501 | 17.5%), English (498 | 17.4%), Italian (259 | 9.0%), and American (155 | 5.4%), together accounting for 81.3% of all Valley Green residents.
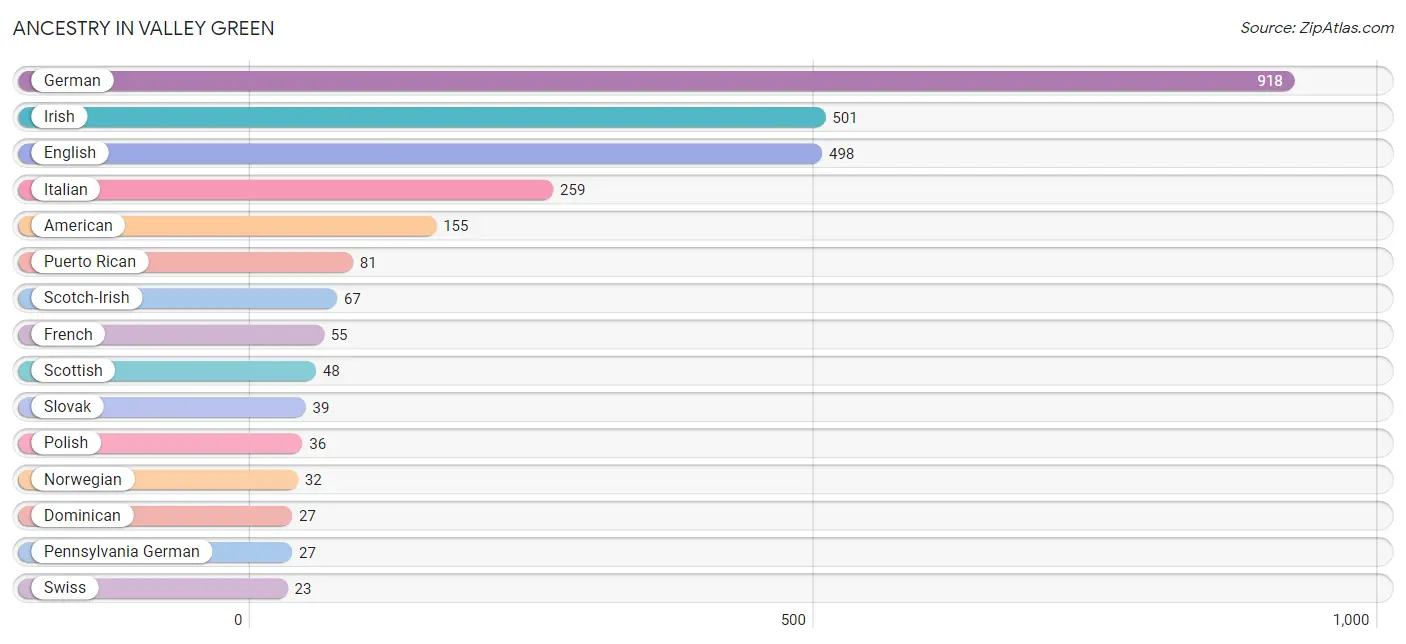
| Ancestry | # Population | % Population |
| American | 155 | 5.4% |
| Belgian | 14 | 0.5% |
| Danish | 19 | 0.7% |
| Dominican | 27 | 0.9% |
| Dutch | 20 | 0.7% |
| English | 498 | 17.4% |
| European | 19 | 0.7% |
| French | 55 | 1.9% |
| German | 918 | 32.0% |
| Irish | 501 | 17.5% |
| Italian | 259 | 9.0% |
| Lithuanian | 11 | 0.4% |
| Norwegian | 32 | 1.1% |
| Pennsylvania German | 27 | 0.9% |
| Polish | 36 | 1.3% |
| Puerto Rican | 81 | 2.8% |
| Scotch-Irish | 67 | 2.3% |
| Scottish | 48 | 1.7% |
| Slovak | 39 | 1.4% |
| Swiss | 23 | 0.8% |
| Welsh | 12 | 0.4% | View All 21 Rows |
Immigrants in Valley Green

| Immigration Origin | # Population | % Population | View All 0 Rows |
Sex and Age in Valley Green
Sex and Age in Valley Green
The most populous age groups in Valley Green are 35 to 39 Years (184 | 12.4%) for men and Under 5 Years (193 | 13.9%) for women.
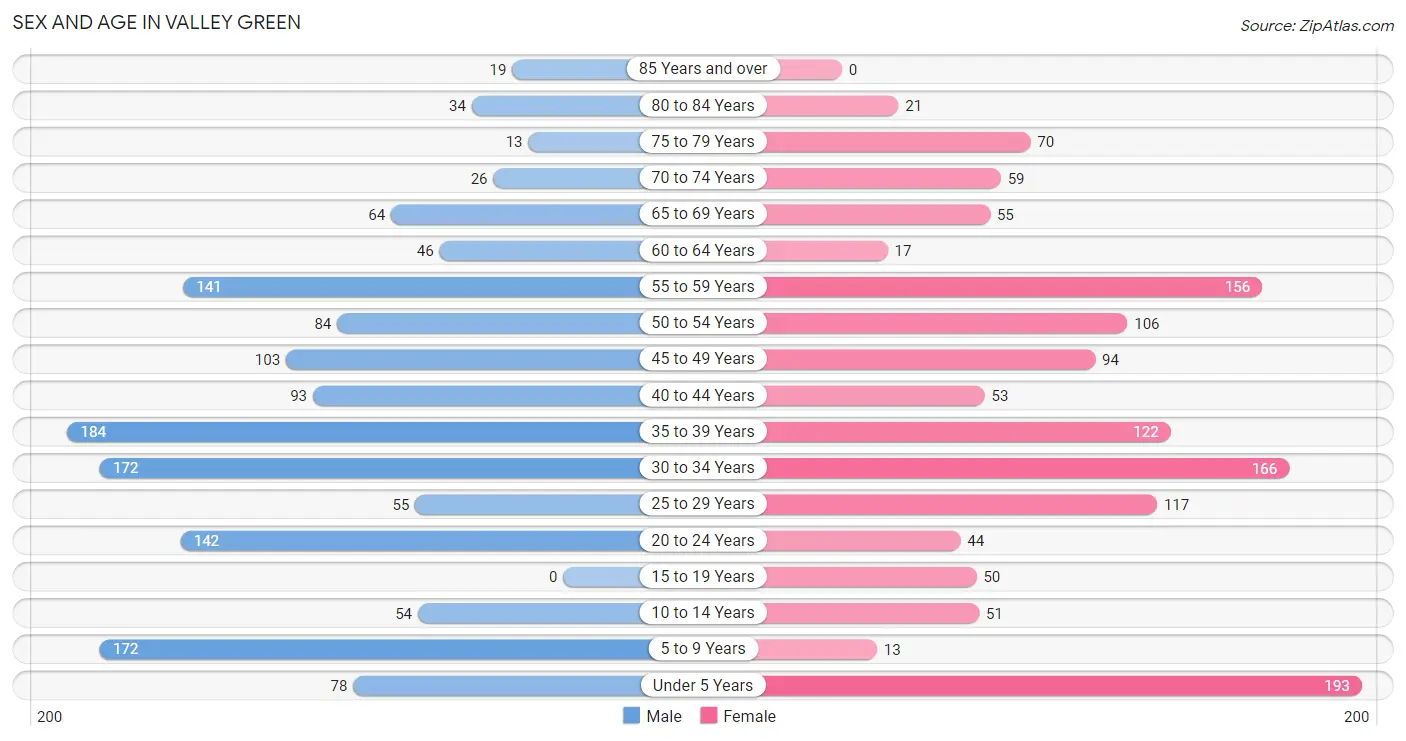
| Age Bracket | Male | Female |
| Under 5 Years | 78 (5.3%) | 193 (13.9%) |
| 5 to 9 Years | 172 (11.6%) | 13 (0.9%) |
| 10 to 14 Years | 54 (3.6%) | 51 (3.7%) |
| 15 to 19 Years | 0 (0.0%) | 50 (3.6%) |
| 20 to 24 Years | 142 (9.6%) | 44 (3.2%) |
| 25 to 29 Years | 55 (3.7%) | 117 (8.4%) |
| 30 to 34 Years | 172 (11.6%) | 166 (12.0%) |
| 35 to 39 Years | 184 (12.4%) | 122 (8.8%) |
| 40 to 44 Years | 93 (6.3%) | 53 (3.8%) |
| 45 to 49 Years | 103 (7.0%) | 94 (6.8%) |
| 50 to 54 Years | 84 (5.7%) | 106 (7.6%) |
| 55 to 59 Years | 141 (9.5%) | 156 (11.3%) |
| 60 to 64 Years | 46 (3.1%) | 17 (1.2%) |
| 65 to 69 Years | 64 (4.3%) | 55 (4.0%) |
| 70 to 74 Years | 26 (1.8%) | 59 (4.3%) |
| 75 to 79 Years | 13 (0.9%) | 70 (5.1%) |
| 80 to 84 Years | 34 (2.3%) | 21 (1.5%) |
| 85 Years and over | 19 (1.3%) | 0 (0.0%) |
| Total | 1,480 (100.0%) | 1,387 (100.0%) |
Families and Households in Valley Green
Median Family Size in Valley Green
The median family size in Valley Green is 2.86 persons per family, with single male/father families (87 | 10.7%) accounting for the largest median family size of 2.97 persons per family. On the other hand, single female/mother families (114 | 14.0%) represent the smallest median family size with 2.53 persons per family.
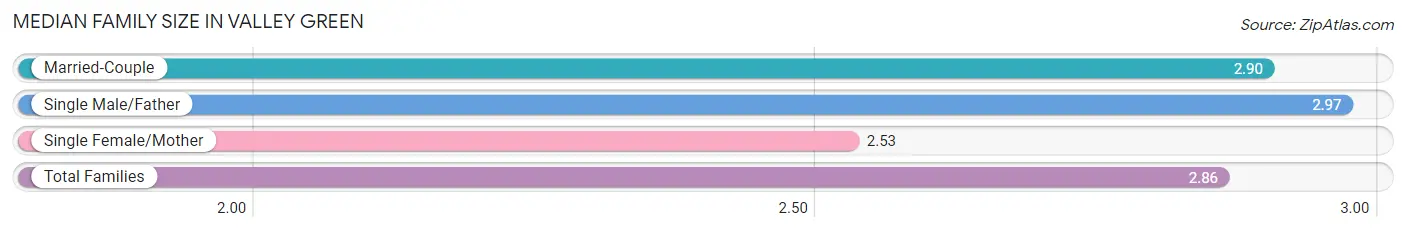
| Family Type | # Families | Family Size |
| Married-Couple | 611 (75.2%) | 2.90 |
| Single Male/Father | 87 (10.7%) | 2.97 |
| Single Female/Mother | 114 (14.0%) | 2.53 |
| Total Families | 812 (100.0%) | 2.86 |
Median Household Size in Valley Green
The median household size in Valley Green is 2.45 persons per household, with single male/father households (87 | 7.4%) accounting for the largest median household size of 3.22 persons per household. non-family households (360 | 30.7%) represent the smallest median household size with 1.40 persons per household.
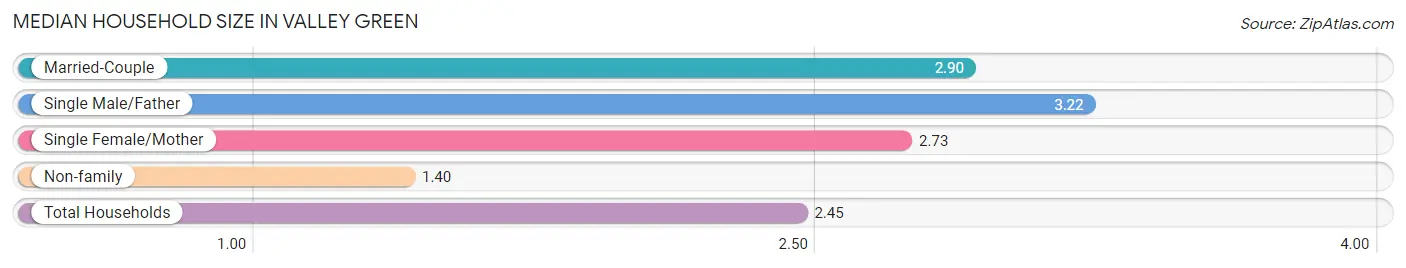
| Household Type | # Households | Household Size |
| Married-Couple | 611 (52.1%) | 2.90 |
| Single Male/Father | 87 (7.4%) | 3.22 |
| Single Female/Mother | 114 (9.7%) | 2.73 |
| Non-family | 360 (30.7%) | 1.40 |
| Total Households | 1,172 (100.0%) | 2.45 |
Household Size by Marriage Status in Valley Green
Out of a total of 1,172 households in Valley Green, 812 (69.3%) are family households, while 360 (30.7%) are nonfamily households. The most numerous type of family households are 2-person households, comprising 409, and the most common type of nonfamily households are 1-person households, comprising 209.
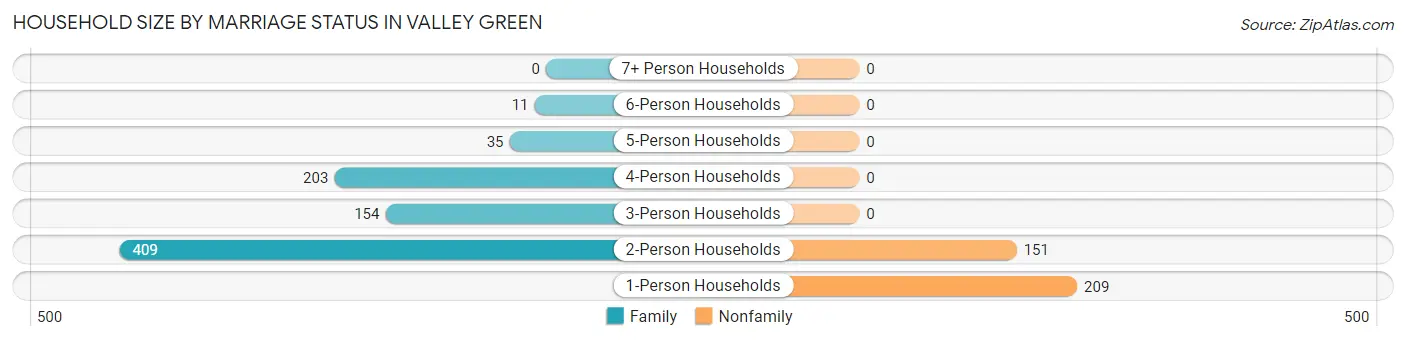
| Household Size | Family Households | Nonfamily Households |
| 1-Person Households | - | 209 (17.8%) |
| 2-Person Households | 409 (34.9%) | 151 (12.9%) |
| 3-Person Households | 154 (13.1%) | 0 (0.0%) |
| 4-Person Households | 203 (17.3%) | 0 (0.0%) |
| 5-Person Households | 35 (3.0%) | 0 (0.0%) |
| 6-Person Households | 11 (0.9%) | 0 (0.0%) |
| 7+ Person Households | 0 (0.0%) | 0 (0.0%) |
| Total | 812 (69.3%) | 360 (30.7%) |
Female Fertility in Valley Green
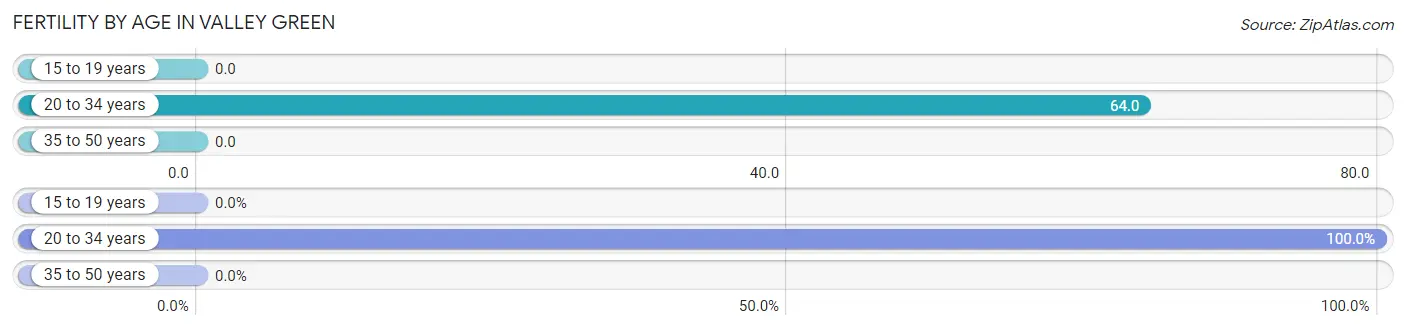
Fertility by Age in Valley Green
Average fertility rate in Valley Green is 31.0 births per 1,000 women. Women in the age bracket of 20 to 34 years have the highest fertility rate with 64.0 births per 1,000 women. Women in the age bracket of 20 to 34 years acount for 100.0% of all women with births.
| Age Bracket | Women with Births | Births / 1,000 Women |
| 15 to 19 years | 0 (0.0%) | 0.0 |
| 20 to 34 years | 21 (100.0%) | 64.0 |
| 35 to 50 years | 0 (0.0%) | 0.0 |
| Total | 21 (100.0%) | 31.0 |
Fertility by Age by Marriage Status in Valley Green
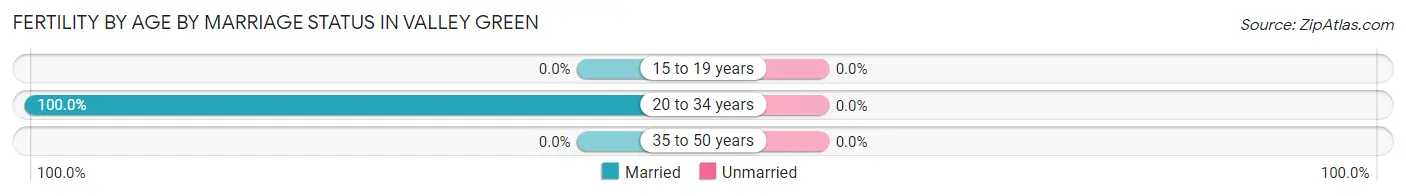
| Age Bracket | Married | Unmarried |
| 15 to 19 years | 0 (0.0%) | 0 (0.0%) |
| 20 to 34 years | 21 (100.0%) | 0 (0.0%) |
| 35 to 50 years | 0 (0.0%) | 0 (0.0%) |
| Total | 21 (100.0%) | 0 (0.0%) |
Fertility by Education in Valley Green
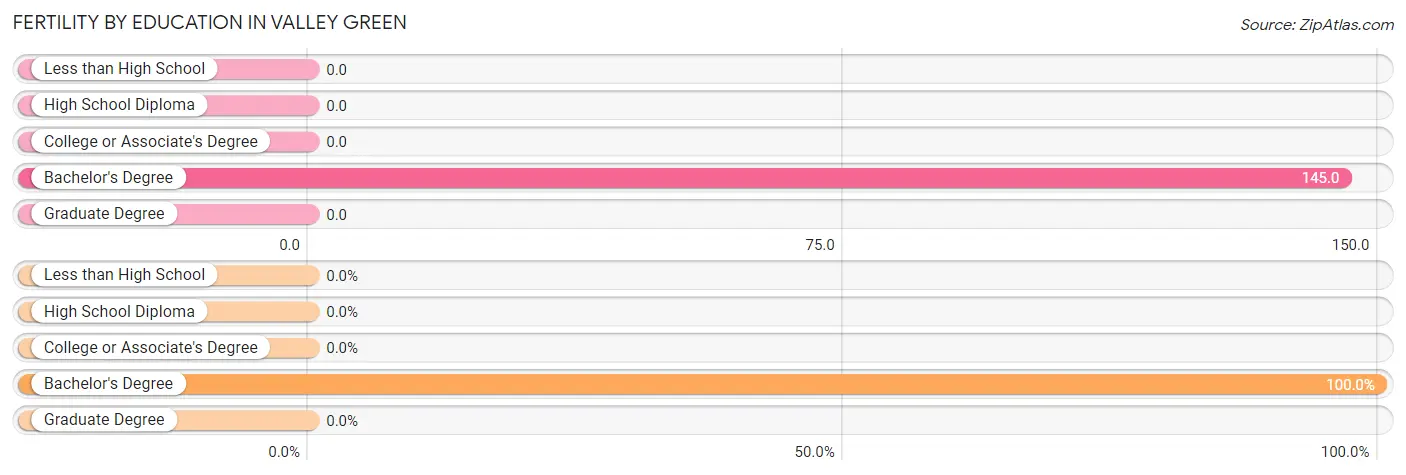
| Educational Attainment | Women with Births | Births / 1,000 Women |
| Less than High School | 0 (0.0%) | 0.0 |
| High School Diploma | 0 (0.0%) | 0.0 |
| College or Associate's Degree | 0 (0.0%) | 0.0 |
| Bachelor's Degree | 21 (100.0%) | 145.0 |
| Graduate Degree | 0 (0.0%) | 0.0 |
| Total | 21 (100.0%) | 31.0 |
Fertility by Education by Marriage Status in Valley Green
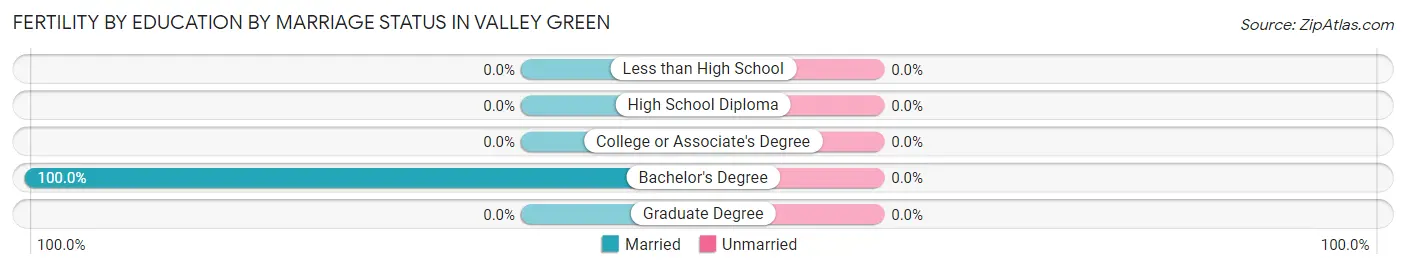
| Educational Attainment | Married | Unmarried |
| Less than High School | 0 (0.0%) | 0 (0.0%) |
| High School Diploma | 0 (0.0%) | 0 (0.0%) |
| College or Associate's Degree | 0 (0.0%) | 0 (0.0%) |
| Bachelor's Degree | 21 (100.0%) | 0 (0.0%) |
| Graduate Degree | 0 (0.0%) | 0 (0.0%) |
| Total | 21 (100.0%) | 0 (0.0%) |
Employment Characteristics in Valley Green
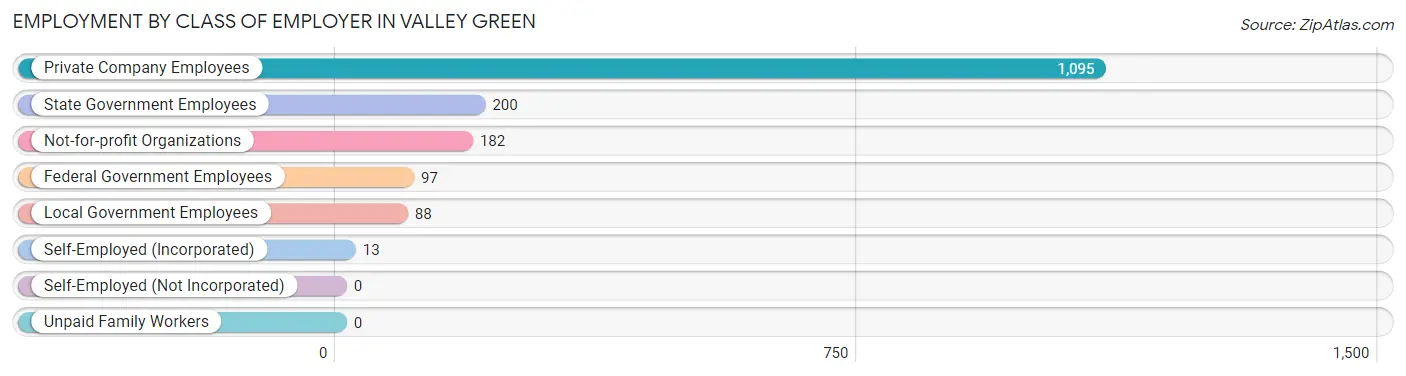
Employment by Class of Employer in Valley Green
Among the 1,675 employed individuals in Valley Green, private company employees (1,095 | 65.4%), state government employees (200 | 11.9%), and not-for-profit organizations (182 | 10.9%) make up the most common classes of employment.
| Employer Class | # Employees | % Employees |
| Private Company Employees | 1,095 | 65.4% |
| Self-Employed (Incorporated) | 13 | 0.8% |
| Self-Employed (Not Incorporated) | 0 | 0.0% |
| Not-for-profit Organizations | 182 | 10.9% |
| Local Government Employees | 88 | 5.2% |
| State Government Employees | 200 | 11.9% |
| Federal Government Employees | 97 | 5.8% |
| Unpaid Family Workers | 0 | 0.0% |
| Total | 1,675 | 100.0% |
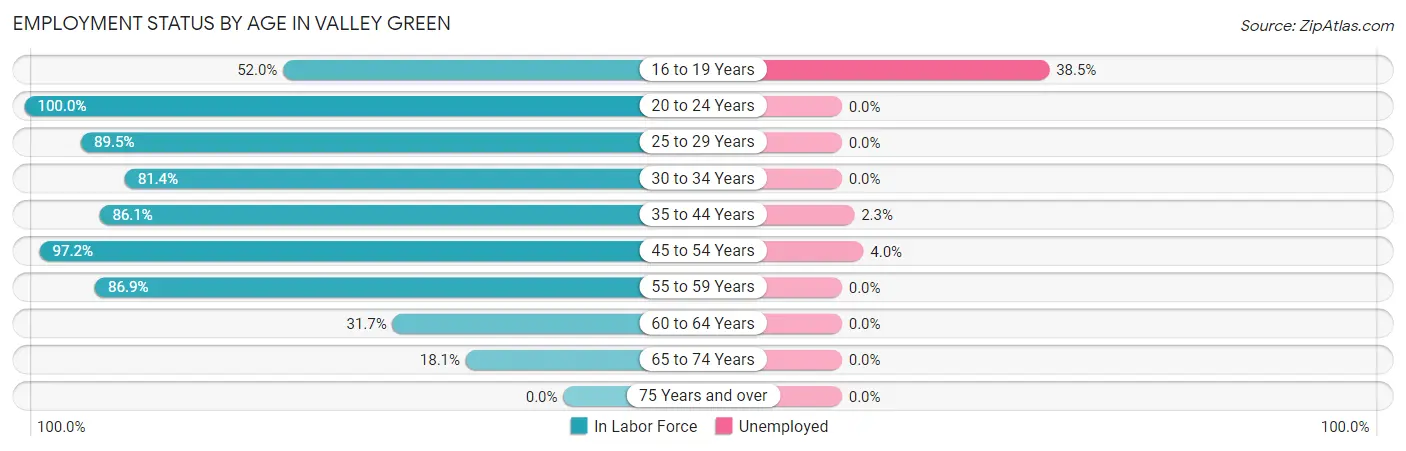
Employment Status by Age in Valley Green
According to the labor force statistics for Valley Green, out of the total population over 16 years of age (2,306), 74.6% or 1,720 individuals are in the labor force, with 2.0% or 34 of them unemployed. The age group with the highest labor force participation rate is 20 to 24 years, with 100.0% or 186 individuals in the labor force. Within the labor force, the 16 to 19 years age range has the highest percentage of unemployed individuals, with 38.5% or 10 of them being unemployed.
| Age Bracket | In Labor Force | Unemployed |
| 16 to 19 Years | 26 (52.0%) | 10 (38.5%) |
| 20 to 24 Years | 186 (100.0%) | 0 (0.0%) |
| 25 to 29 Years | 154 (89.5%) | 0 (0.0%) |
| 30 to 34 Years | 275 (81.4%) | 0 (0.0%) |
| 35 to 44 Years | 389 (86.1%) | 9 (2.3%) |
| 45 to 54 Years | 376 (97.2%) | 15 (4.0%) |
| 55 to 59 Years | 258 (86.9%) | 0 (0.0%) |
| 60 to 64 Years | 20 (31.7%) | 0 (0.0%) |
| 65 to 74 Years | 37 (18.1%) | 0 (0.0%) |
| 75 Years and over | 0 (0.0%) | 0 (0.0%) |
| Total | 1,720 (74.6%) | 34 (2.0%) |
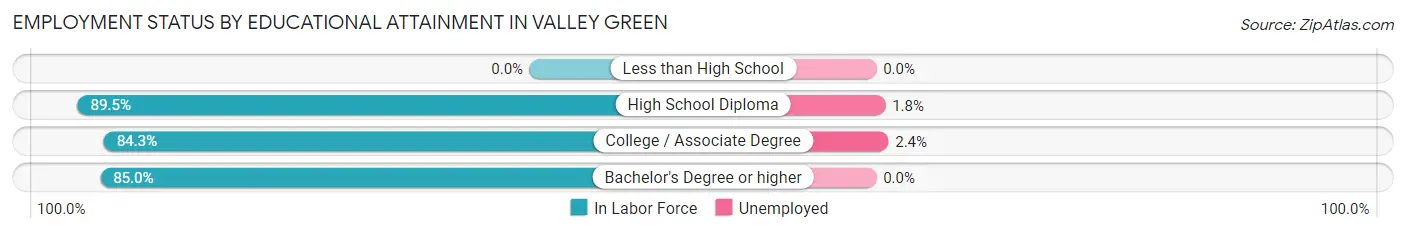
Employment Status by Educational Attainment in Valley Green
According to labor force statistics for Valley Green, 86.1% of individuals (1,471) out of the total population between 25 and 64 years of age (1,709) are in the labor force, with 1.6% or 24 of them being unemployed. The group with the highest labor force participation rate are those with the educational attainment of high school diploma, with 89.5% or 487 individuals in the labor force. Within the labor force, individuals with college / associate degree education have the highest percentage of unemployment, with 2.4% or 15 of them being unemployed.
| Educational Attainment | In Labor Force | Unemployed |
| Less than High School | 0 (0.0%) | 0 (0.0%) |
| High School Diploma | 487 (89.5%) | 10 (1.8%) |
| College / Associate Degree | 618 (84.3%) | 18 (2.4%) |
| Bachelor's Degree or higher | 367 (85.0%) | 0 (0.0%) |
| Total | 1,471 (86.1%) | 27 (1.6%) |
Employment Occupations by Sex in Valley Green
Management, Business, Science and Arts Occupations
The most common Management, Business, Science and Arts occupations in Valley Green are Community & Social Service (210 | 12.4%), Business & Financial (140 | 8.3%), Health Diagnosing & Treating (120 | 7.1%), Computers, Engineering & Science (116 | 6.9%), and Education Instruction & Library (99 | 5.9%).
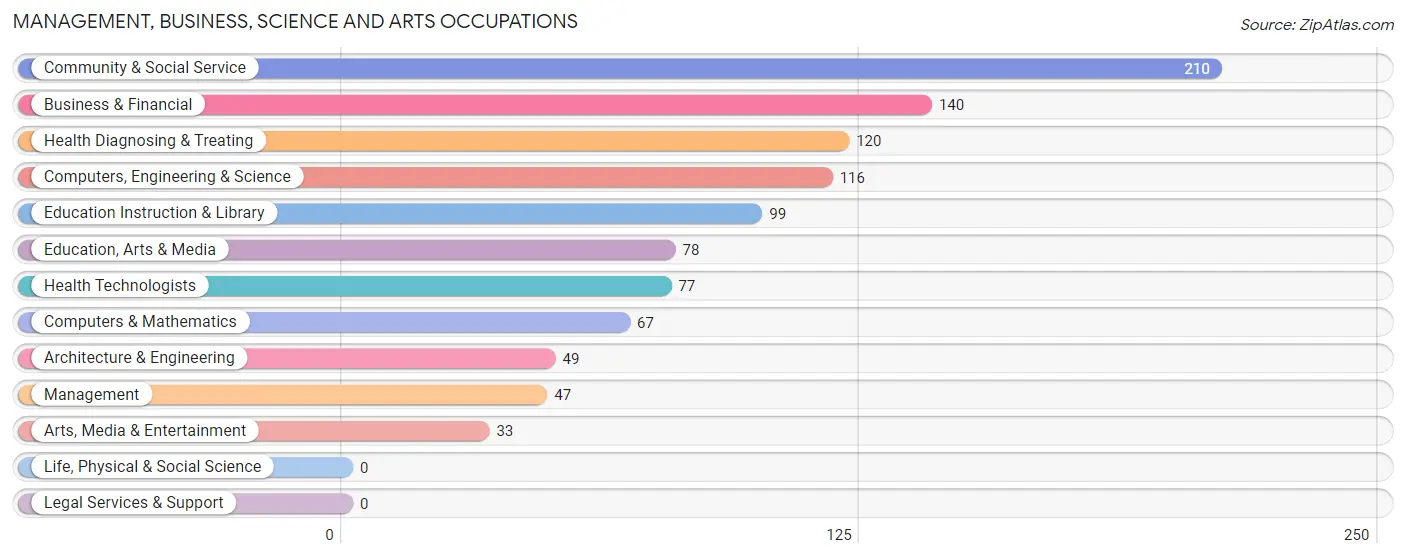
Management, Business, Science and Arts Occupations by Sex
Within the Management, Business, Science and Arts occupations in Valley Green, the most male-oriented occupations are Architecture & Engineering (100.0%), Computers, Engineering & Science (75.9%), and Computers & Mathematics (58.2%), while the most female-oriented occupations are Health Diagnosing & Treating (100.0%), Health Technologists (100.0%), and Education Instruction & Library (87.9%).
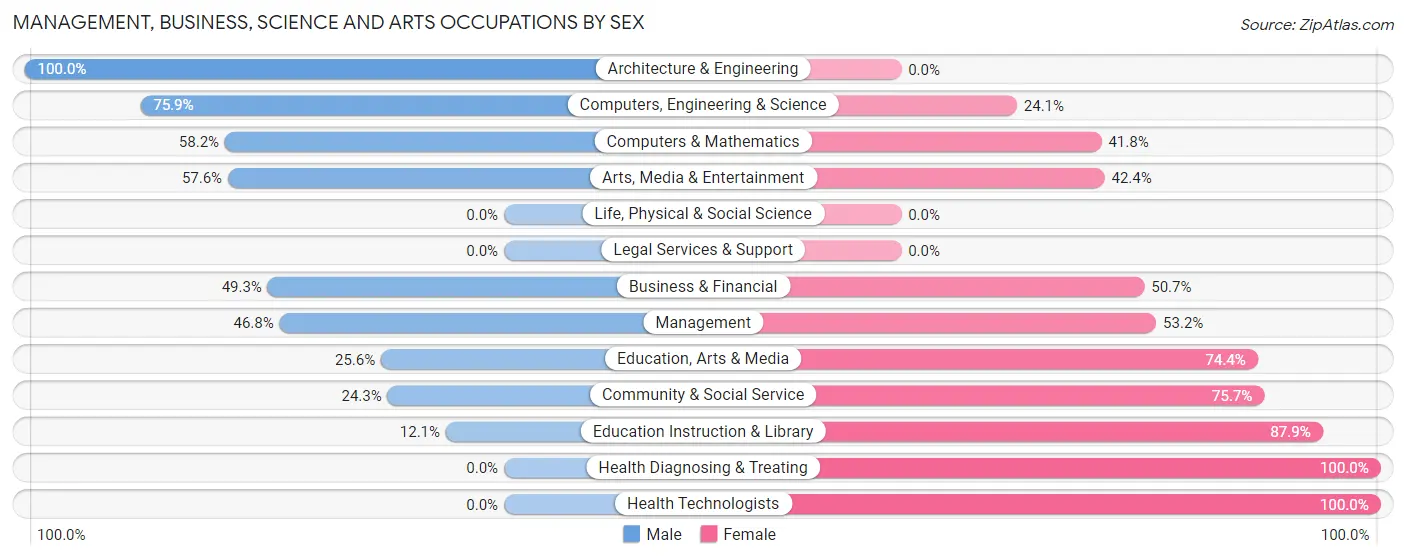
| Occupation | Male | Female |
| Management | 22 (46.8%) | 25 (53.2%) |
| Business & Financial | 69 (49.3%) | 71 (50.7%) |
| Computers, Engineering & Science | 88 (75.9%) | 28 (24.1%) |
| Computers & Mathematics | 39 (58.2%) | 28 (41.8%) |
| Architecture & Engineering | 49 (100.0%) | 0 (0.0%) |
| Life, Physical & Social Science | 0 (0.0%) | 0 (0.0%) |
| Community & Social Service | 51 (24.3%) | 159 (75.7%) |
| Education, Arts & Media | 20 (25.6%) | 58 (74.4%) |
| Legal Services & Support | 0 (0.0%) | 0 (0.0%) |
| Education Instruction & Library | 12 (12.1%) | 87 (87.9%) |
| Arts, Media & Entertainment | 19 (57.6%) | 14 (42.4%) |
| Health Diagnosing & Treating | 0 (0.0%) | 120 (100.0%) |
| Health Technologists | 0 (0.0%) | 77 (100.0%) |
| Total (Category) | 230 (36.3%) | 403 (63.7%) |
| Total (Overall) | 943 (55.9%) | 744 (44.1%) |
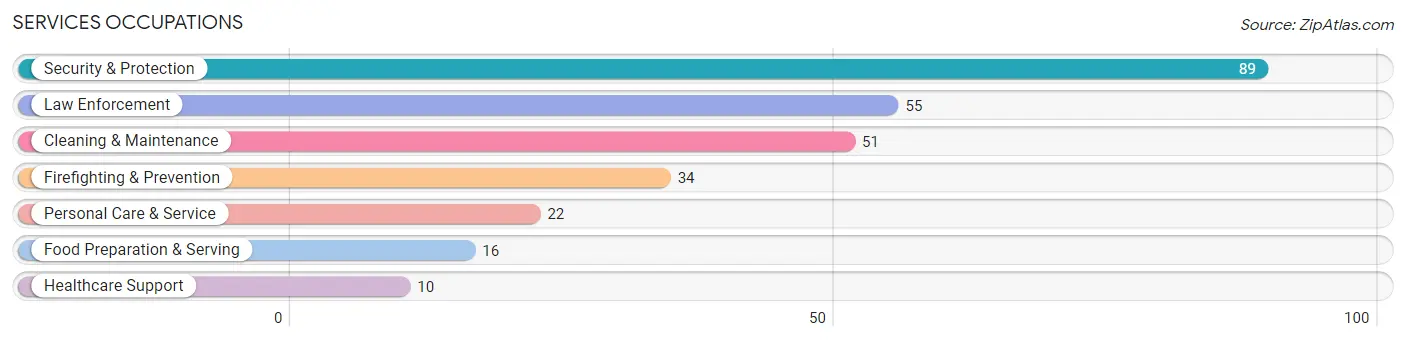
Services Occupations
The most common Services occupations in Valley Green are Security & Protection (89 | 5.3%), Law Enforcement (55 | 3.3%), Cleaning & Maintenance (51 | 3.0%), Firefighting & Prevention (34 | 2.0%), and Personal Care & Service (22 | 1.3%).
Services Occupations by Sex
Within the Services occupations in Valley Green, the most male-oriented occupations are Security & Protection (100.0%), Firefighting & Prevention (100.0%), and Law Enforcement (100.0%), while the most female-oriented occupations are Healthcare Support (100.0%), Food Preparation & Serving (100.0%), and Personal Care & Service (100.0%).
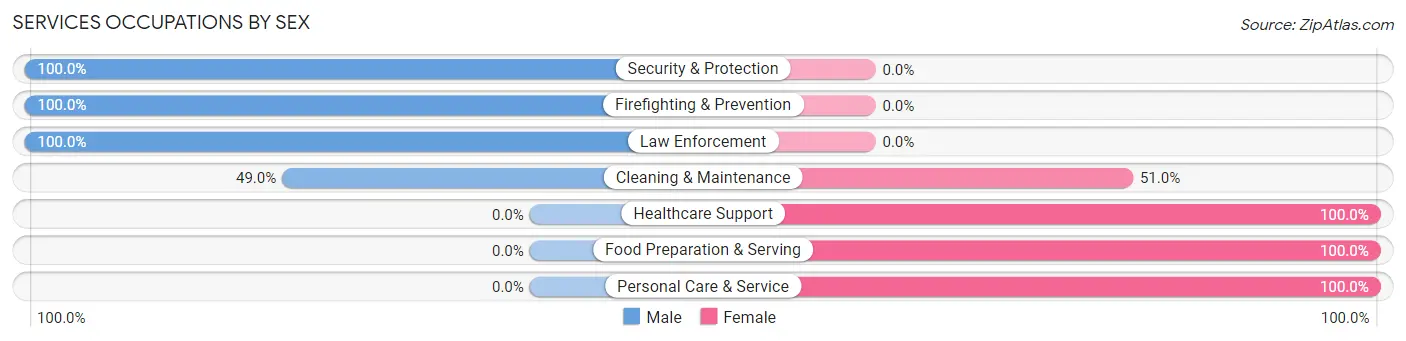
| Occupation | Male | Female |
| Healthcare Support | 0 (0.0%) | 10 (100.0%) |
| Security & Protection | 89 (100.0%) | 0 (0.0%) |
| Firefighting & Prevention | 34 (100.0%) | 0 (0.0%) |
| Law Enforcement | 55 (100.0%) | 0 (0.0%) |
| Food Preparation & Serving | 0 (0.0%) | 16 (100.0%) |
| Cleaning & Maintenance | 25 (49.0%) | 26 (51.0%) |
| Personal Care & Service | 0 (0.0%) | 22 (100.0%) |
| Total (Category) | 114 (60.6%) | 74 (39.4%) |
| Total (Overall) | 943 (55.9%) | 744 (44.1%) |
Sales and Office Occupations
The most common Sales and Office occupations in Valley Green are Office & Administration (261 | 15.5%), and Sales & Related (165 | 9.8%).

Sales and Office Occupations by Sex
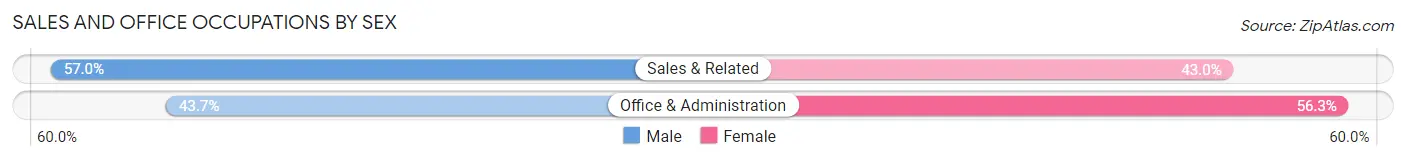
| Occupation | Male | Female |
| Sales & Related | 94 (57.0%) | 71 (43.0%) |
| Office & Administration | 114 (43.7%) | 147 (56.3%) |
| Total (Category) | 208 (48.8%) | 218 (51.2%) |
| Total (Overall) | 943 (55.9%) | 744 (44.1%) |
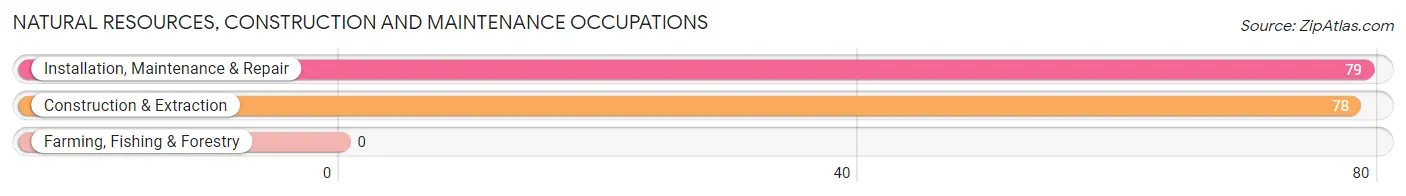
Natural Resources, Construction and Maintenance Occupations
The most common Natural Resources, Construction and Maintenance occupations in Valley Green are Installation, Maintenance & Repair (79 | 4.7%), and Construction & Extraction (78 | 4.6%).
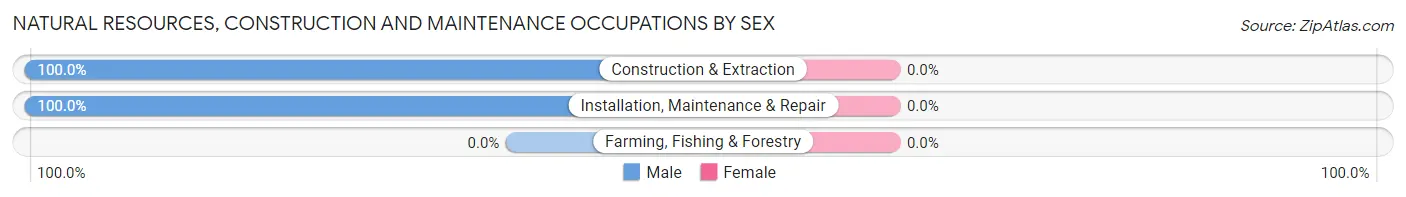
Natural Resources, Construction and Maintenance Occupations by Sex
| Occupation | Male | Female |
| Farming, Fishing & Forestry | 0 (0.0%) | 0 (0.0%) |
| Construction & Extraction | 78 (100.0%) | 0 (0.0%) |
| Installation, Maintenance & Repair | 79 (100.0%) | 0 (0.0%) |
| Total (Category) | 157 (100.0%) | 0 (0.0%) |
| Total (Overall) | 943 (55.9%) | 744 (44.1%) |
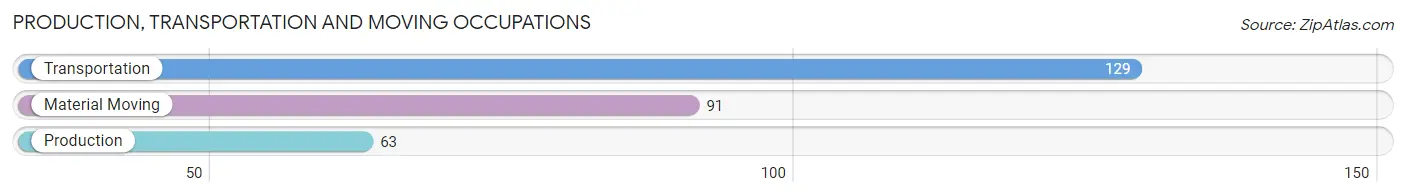
Production, Transportation and Moving Occupations
The most common Production, Transportation and Moving occupations in Valley Green are Transportation (129 | 7.6%), Material Moving (91 | 5.4%), and Production (63 | 3.7%).
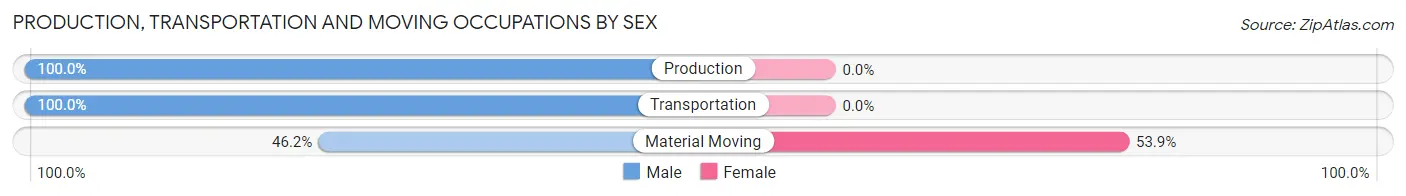
Production, Transportation and Moving Occupations by Sex
| Occupation | Male | Female |
| Production | 63 (100.0%) | 0 (0.0%) |
| Transportation | 129 (100.0%) | 0 (0.0%) |
| Material Moving | 42 (46.2%) | 49 (53.8%) |
| Total (Category) | 234 (82.7%) | 49 (17.3%) |
| Total (Overall) | 943 (55.9%) | 744 (44.1%) |
Employment Industries by Sex in Valley Green
Employment Industries in Valley Green
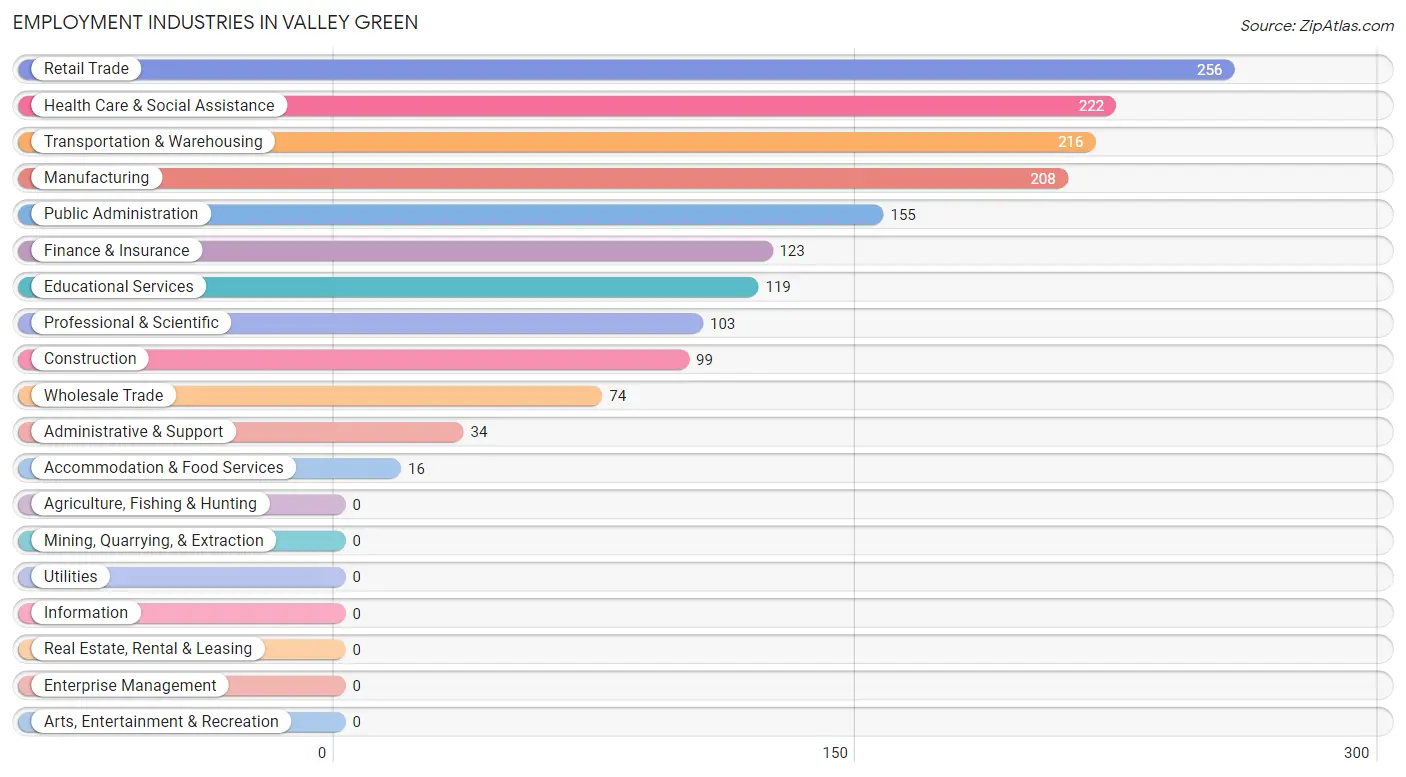
The major employment industries in Valley Green include Retail Trade (256 | 15.2%), Health Care & Social Assistance (222 | 13.2%), Transportation & Warehousing (216 | 12.8%), Manufacturing (208 | 12.3%), and Public Administration (155 | 9.2%).
Employment Industries by Sex in Valley Green
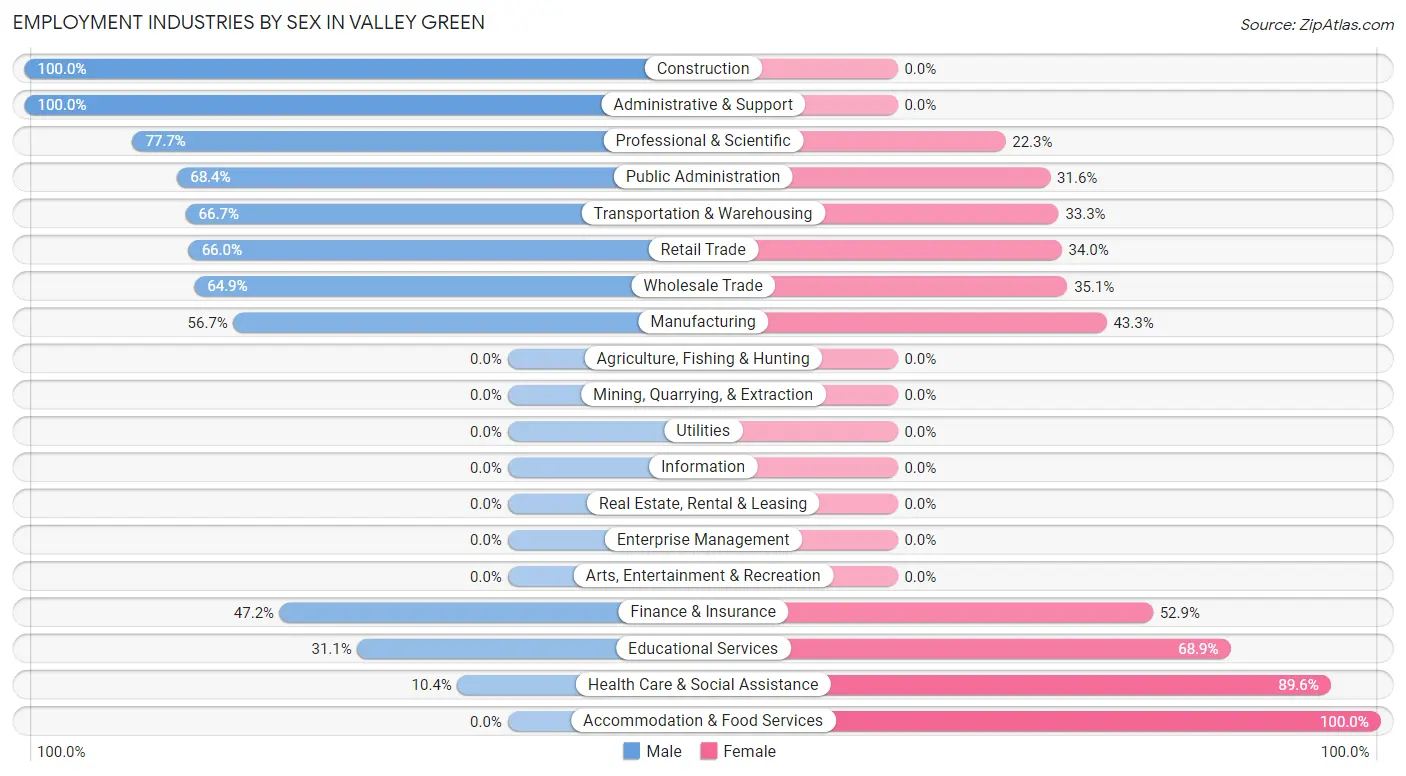
The Valley Green industries that see more men than women are Construction (100.0%), Administrative & Support (100.0%), and Professional & Scientific (77.7%), whereas the industries that tend to have a higher number of women are Accommodation & Food Services (100.0%), Health Care & Social Assistance (89.6%), and Educational Services (68.9%).
| Industry | Male | Female |
| Agriculture, Fishing & Hunting | 0 (0.0%) | 0 (0.0%) |
| Mining, Quarrying, & Extraction | 0 (0.0%) | 0 (0.0%) |
| Construction | 99 (100.0%) | 0 (0.0%) |
| Manufacturing | 118 (56.7%) | 90 (43.3%) |
| Wholesale Trade | 48 (64.9%) | 26 (35.1%) |
| Retail Trade | 169 (66.0%) | 87 (34.0%) |
| Transportation & Warehousing | 144 (66.7%) | 72 (33.3%) |
| Utilities | 0 (0.0%) | 0 (0.0%) |
| Information | 0 (0.0%) | 0 (0.0%) |
| Finance & Insurance | 58 (47.1%) | 65 (52.8%) |
| Real Estate, Rental & Leasing | 0 (0.0%) | 0 (0.0%) |
| Professional & Scientific | 80 (77.7%) | 23 (22.3%) |
| Enterprise Management | 0 (0.0%) | 0 (0.0%) |
| Administrative & Support | 34 (100.0%) | 0 (0.0%) |
| Educational Services | 37 (31.1%) | 82 (68.9%) |
| Health Care & Social Assistance | 23 (10.4%) | 199 (89.6%) |
| Arts, Entertainment & Recreation | 0 (0.0%) | 0 (0.0%) |
| Accommodation & Food Services | 0 (0.0%) | 16 (100.0%) |
| Public Administration | 106 (68.4%) | 49 (31.6%) |
| Total | 943 (55.9%) | 744 (44.1%) |
Education in Valley Green
School Enrollment in Valley Green
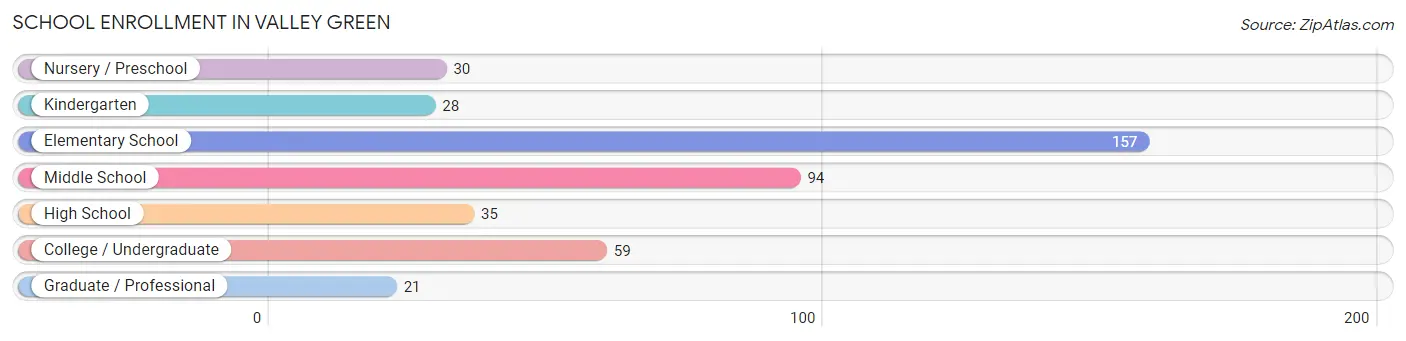
The most common levels of schooling among the 424 students in Valley Green are elementary school (157 | 37.0%), middle school (94 | 22.2%), and college / undergraduate (59 | 13.9%).
| School Level | # Students | % Students |
| Nursery / Preschool | 30 | 7.1% |
| Kindergarten | 28 | 6.6% |
| Elementary School | 157 | 37.0% |
| Middle School | 94 | 22.2% |
| High School | 35 | 8.3% |
| College / Undergraduate | 59 | 13.9% |
| Graduate / Professional | 21 | 5.0% |
| Total | 424 | 100.0% |
School Enrollment by Age by Funding Source in Valley Green
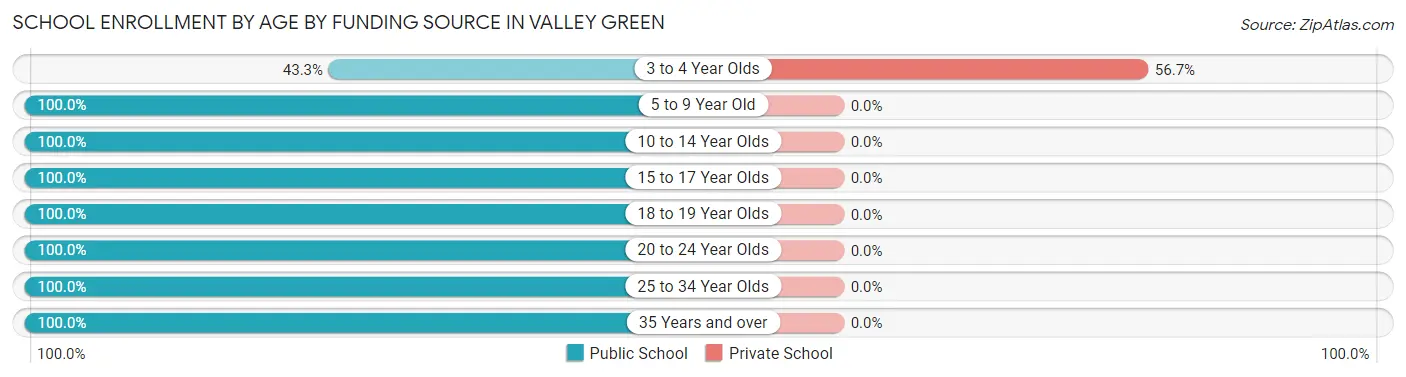
Out of a total of 424 students who are enrolled in schools in Valley Green, 17 (4.0%) attend a private institution, while the remaining 407 (96.0%) are enrolled in public schools. The age group of 3 to 4 year olds has the highest likelihood of being enrolled in private schools, with 17 (56.7% in the age bracket) enrolled. Conversely, the age group of 5 to 9 year old has the lowest likelihood of being enrolled in a private school, with 185 (100.0% in the age bracket) attending a public institution.
| Age Bracket | Public School | Private School |
| 3 to 4 Year Olds | 13 (43.3%) | 17 (56.7%) |
| 5 to 9 Year Old | 185 (100.0%) | 0 (0.0%) |
| 10 to 14 Year Olds | 105 (100.0%) | 0 (0.0%) |
| 15 to 17 Year Olds | 24 (100.0%) | 0 (0.0%) |
| 18 to 19 Year Olds | 16 (100.0%) | 0 (0.0%) |
| 20 to 24 Year Olds | 21 (100.0%) | 0 (0.0%) |
| 25 to 34 Year Olds | 21 (100.0%) | 0 (0.0%) |
| 35 Years and over | 22 (100.0%) | 0 (0.0%) |
| Total | 407 (96.0%) | 17 (4.0%) |
Educational Attainment by Field of Study in Valley Green
Business (129 | 23.2%), computers & mathematics (92 | 16.6%), arts & humanities (77 | 13.9%), liberal arts & history (59 | 10.6%), and education (50 | 9.0%) are the most common fields of study among 556 individuals in Valley Green who have obtained a bachelor's degree or higher.
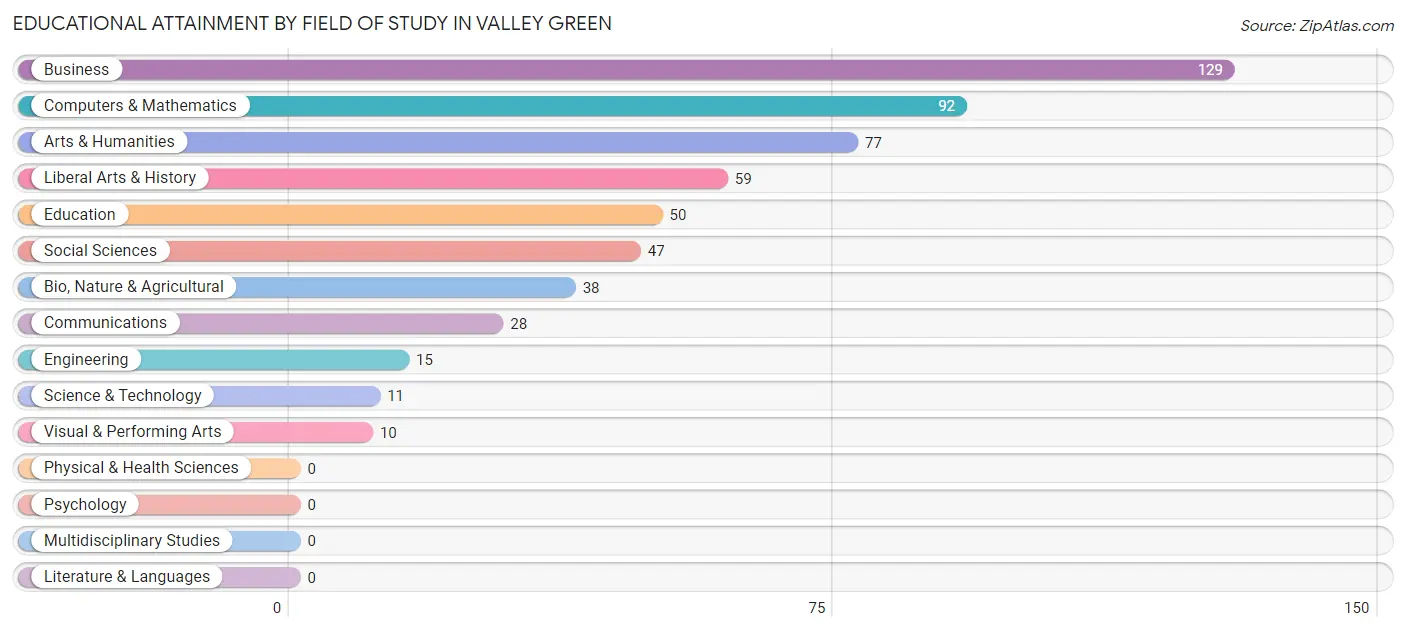
| Field of Study | # Graduates | % Graduates |
| Computers & Mathematics | 92 | 16.6% |
| Bio, Nature & Agricultural | 38 | 6.8% |
| Physical & Health Sciences | 0 | 0.0% |
| Psychology | 0 | 0.0% |
| Social Sciences | 47 | 8.5% |
| Engineering | 15 | 2.7% |
| Multidisciplinary Studies | 0 | 0.0% |
| Science & Technology | 11 | 2.0% |
| Business | 129 | 23.2% |
| Education | 50 | 9.0% |
| Literature & Languages | 0 | 0.0% |
| Liberal Arts & History | 59 | 10.6% |
| Visual & Performing Arts | 10 | 1.8% |
| Communications | 28 | 5.0% |
| Arts & Humanities | 77 | 13.9% |
| Total | 556 | 100.0% |
Transportation & Commute in Valley Green
Vehicle Availability by Sex in Valley Green
The most prevalent vehicle ownership categories in Valley Green are males with 2 vehicles (574, accounting for 61.7%) and females with 2 vehicles (478, making up 77.1%).
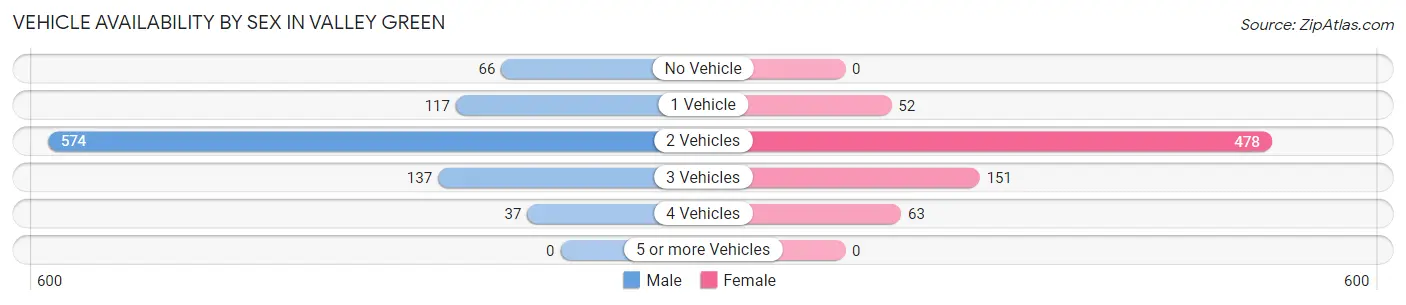
| Vehicles Available | Male | Female |
| No Vehicle | 66 (7.1%) | 0 (0.0%) |
| 1 Vehicle | 117 (12.6%) | 52 (7.0%) |
| 2 Vehicles | 574 (61.7%) | 478 (64.2%) |
| 3 Vehicles | 137 (14.7%) | 151 (20.3%) |
| 4 Vehicles | 37 (4.0%) | 63 (8.5%) |
| 5 or more Vehicles | 0 (0.0%) | 0 (0.0%) |
| Total | 931 (100.0%) | 744 (100.0%) |
Commute Time in Valley Green
The most frequently occuring commute durations in Valley Green are 20 to 24 minutes (322 commuters, 20.2%), 25 to 29 minutes (308 commuters, 19.4%), and 30 to 34 minutes (304 commuters, 19.1%).
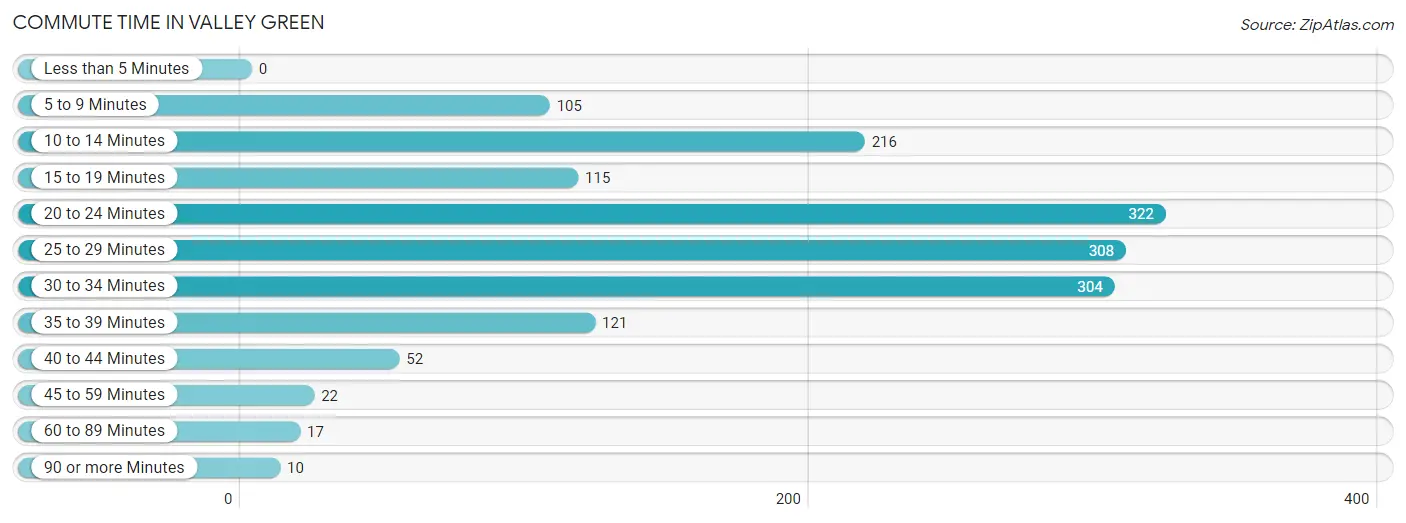
| Commute Time | # Commuters | % Commuters |
| Less than 5 Minutes | 0 | 0.0% |
| 5 to 9 Minutes | 105 | 6.6% |
| 10 to 14 Minutes | 216 | 13.6% |
| 15 to 19 Minutes | 115 | 7.2% |
| 20 to 24 Minutes | 322 | 20.2% |
| 25 to 29 Minutes | 308 | 19.4% |
| 30 to 34 Minutes | 304 | 19.1% |
| 35 to 39 Minutes | 121 | 7.6% |
| 40 to 44 Minutes | 52 | 3.3% |
| 45 to 59 Minutes | 22 | 1.4% |
| 60 to 89 Minutes | 17 | 1.1% |
| 90 or more Minutes | 10 | 0.6% |
Commute Time by Sex in Valley Green
The most common commute times in Valley Green are 25 to 29 minutes (215 commuters, 24.3%) for males and 30 to 34 minutes (194 commuters, 27.5%) for females.
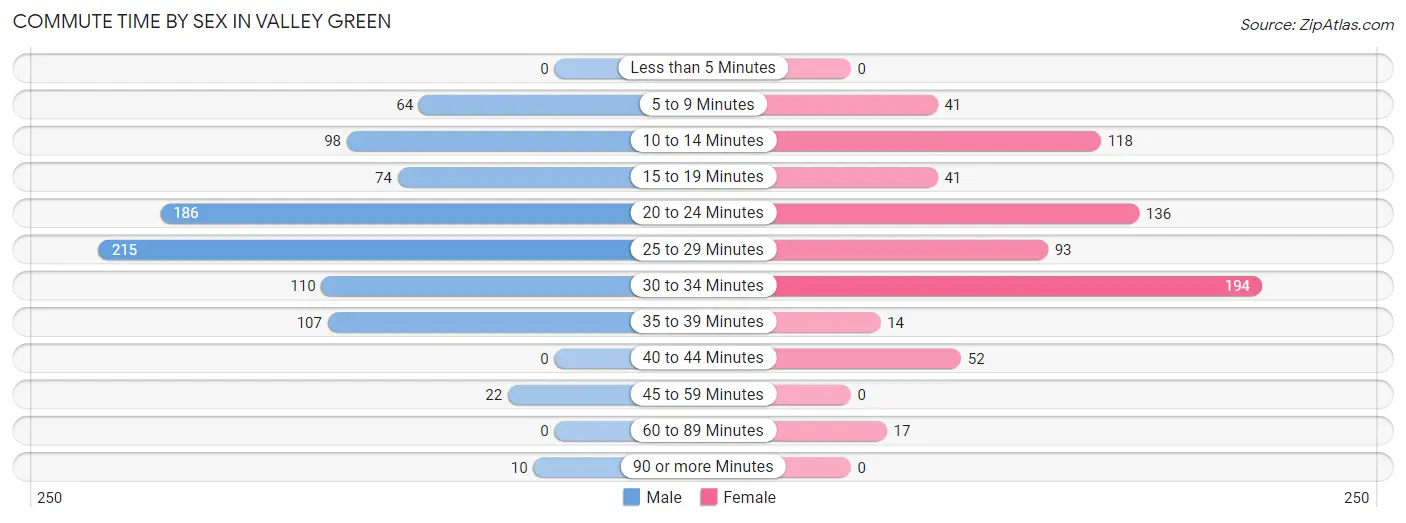
| Commute Time | Male | Female |
| Less than 5 Minutes | 0 (0.0%) | 0 (0.0%) |
| 5 to 9 Minutes | 64 (7.2%) | 41 (5.8%) |
| 10 to 14 Minutes | 98 (11.1%) | 118 (16.7%) |
| 15 to 19 Minutes | 74 (8.4%) | 41 (5.8%) |
| 20 to 24 Minutes | 186 (21.0%) | 136 (19.3%) |
| 25 to 29 Minutes | 215 (24.3%) | 93 (13.2%) |
| 30 to 34 Minutes | 110 (12.4%) | 194 (27.5%) |
| 35 to 39 Minutes | 107 (12.1%) | 14 (2.0%) |
| 40 to 44 Minutes | 0 (0.0%) | 52 (7.4%) |
| 45 to 59 Minutes | 22 (2.5%) | 0 (0.0%) |
| 60 to 89 Minutes | 0 (0.0%) | 17 (2.4%) |
| 90 or more Minutes | 10 (1.1%) | 0 (0.0%) |
Time of Departure to Work by Sex in Valley Green
The most frequent times of departure to work in Valley Green are 7:00 AM to 7:29 AM (232, 26.2%) for males and 8:00 AM to 8:29 AM (230, 32.6%) for females.
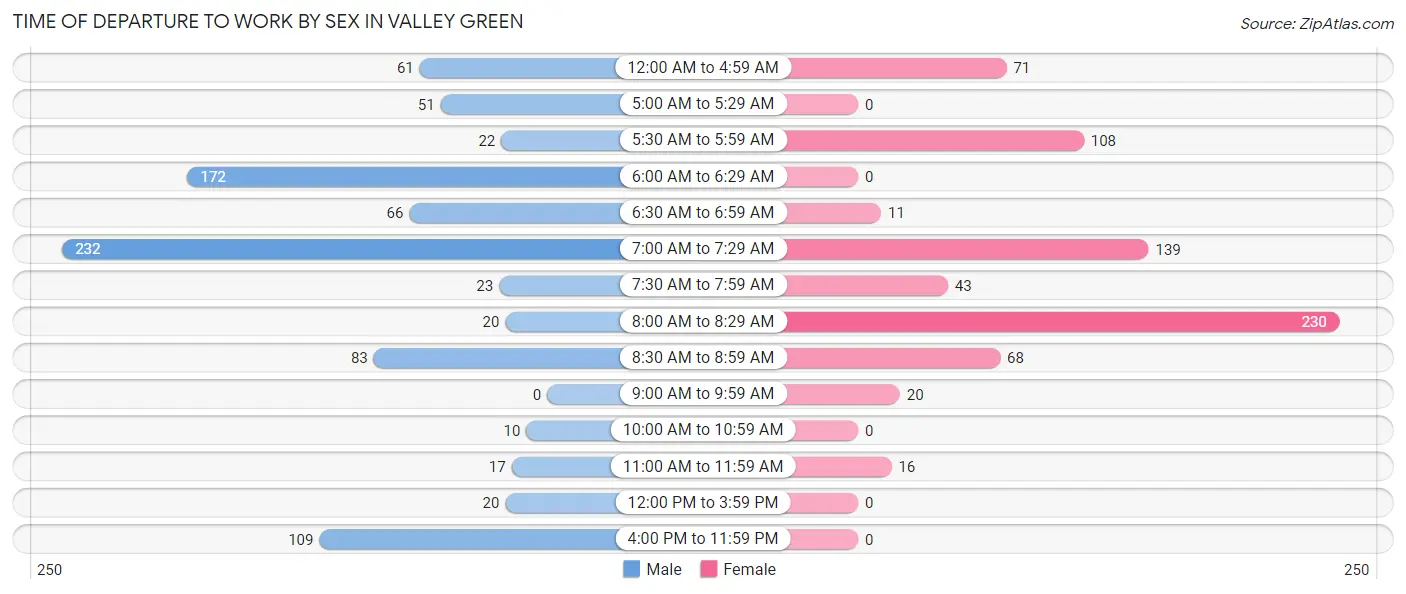
| Time of Departure | Male | Female |
| 12:00 AM to 4:59 AM | 61 (6.9%) | 71 (10.1%) |
| 5:00 AM to 5:29 AM | 51 (5.8%) | 0 (0.0%) |
| 5:30 AM to 5:59 AM | 22 (2.5%) | 108 (15.3%) |
| 6:00 AM to 6:29 AM | 172 (19.4%) | 0 (0.0%) |
| 6:30 AM to 6:59 AM | 66 (7.4%) | 11 (1.6%) |
| 7:00 AM to 7:29 AM | 232 (26.2%) | 139 (19.7%) |
| 7:30 AM to 7:59 AM | 23 (2.6%) | 43 (6.1%) |
| 8:00 AM to 8:29 AM | 20 (2.3%) | 230 (32.6%) |
| 8:30 AM to 8:59 AM | 83 (9.4%) | 68 (9.6%) |
| 9:00 AM to 9:59 AM | 0 (0.0%) | 20 (2.8%) |
| 10:00 AM to 10:59 AM | 10 (1.1%) | 0 (0.0%) |
| 11:00 AM to 11:59 AM | 17 (1.9%) | 16 (2.3%) |
| 12:00 PM to 3:59 PM | 20 (2.3%) | 0 (0.0%) |
| 4:00 PM to 11:59 PM | 109 (12.3%) | 0 (0.0%) |
| Total | 886 (100.0%) | 706 (100.0%) |
Housing Occupancy in Valley Green
Occupancy by Ownership in Valley Green
Of the total 1,172 dwellings in Valley Green, owner-occupied units account for 1,134 (96.8%), while renter-occupied units make up 38 (3.2%).
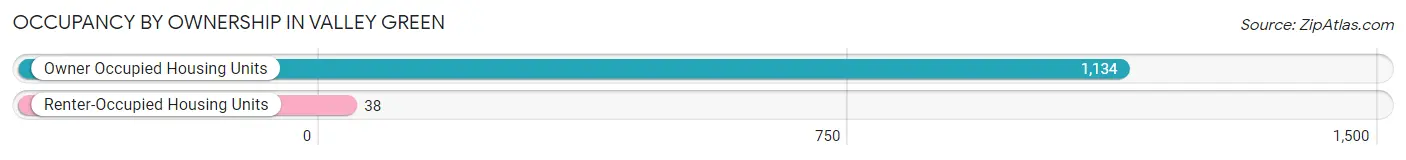
| Occupancy | # Housing Units | % Housing Units |
| Owner Occupied Housing Units | 1,134 | 96.8% |
| Renter-Occupied Housing Units | 38 | 3.2% |
| Total Occupied Housing Units | 1,172 | 100.0% |
Occupancy by Household Size in Valley Green
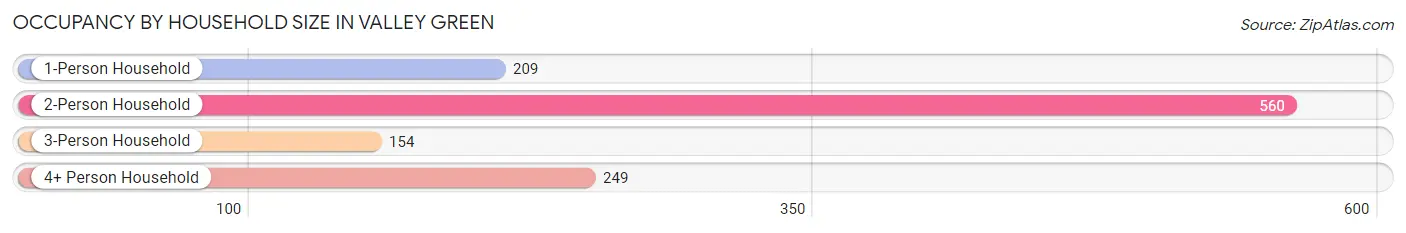
| Household Size | # Housing Units | % Housing Units |
| 1-Person Household | 209 | 17.8% |
| 2-Person Household | 560 | 47.8% |
| 3-Person Household | 154 | 13.1% |
| 4+ Person Household | 249 | 21.2% |
| Total Housing Units | 1,172 | 100.0% |
Occupancy by Ownership by Household Size in Valley Green
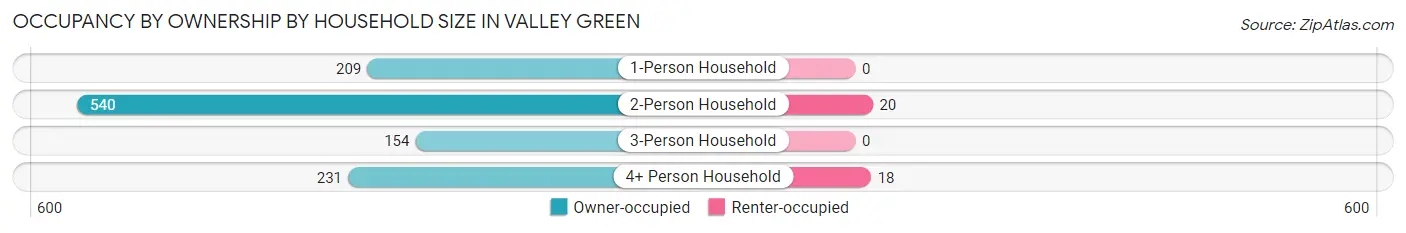
| Household Size | Owner-occupied | Renter-occupied |
| 1-Person Household | 209 (100.0%) | 0 (0.0%) |
| 2-Person Household | 540 (96.4%) | 20 (3.6%) |
| 3-Person Household | 154 (100.0%) | 0 (0.0%) |
| 4+ Person Household | 231 (92.8%) | 18 (7.2%) |
| Total Housing Units | 1,134 (96.8%) | 38 (3.2%) |
Occupancy by Educational Attainment in Valley Green
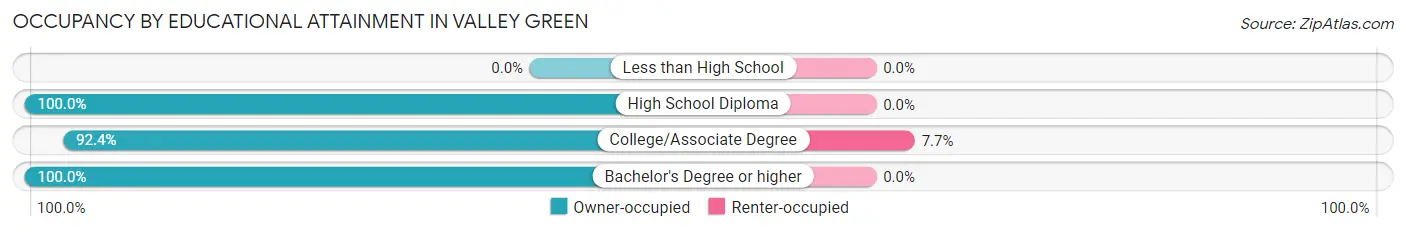
| Household Size | Owner-occupied | Renter-occupied |
| Less than High School | 0 (0.0%) | 0 (0.0%) |
| High School Diploma | 301 (100.0%) | 0 (0.0%) |
| College/Associate Degree | 459 (92.3%) | 38 (7.6%) |
| Bachelor's Degree or higher | 374 (100.0%) | 0 (0.0%) |
Occupancy by Age of Householder in Valley Green
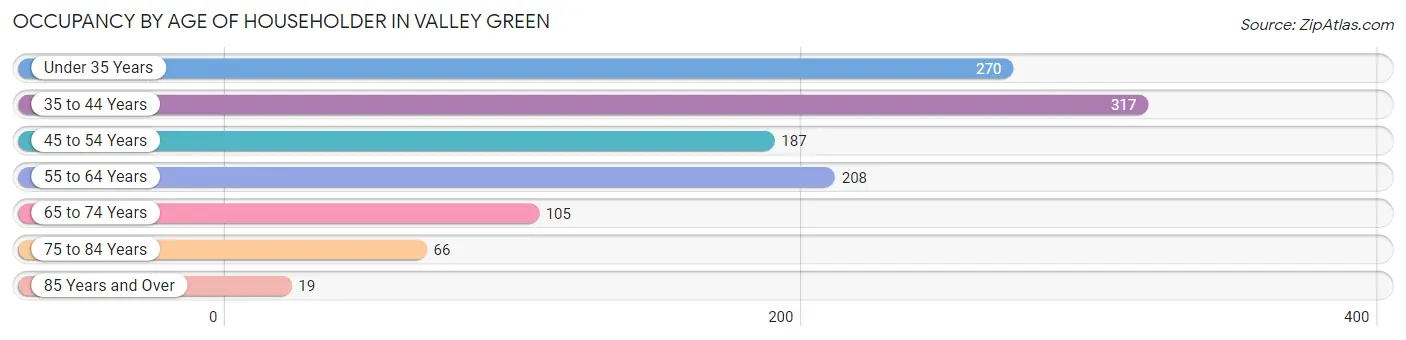
| Age Bracket | # Households | % Households |
| Under 35 Years | 270 | 23.0% |
| 35 to 44 Years | 317 | 27.1% |
| 45 to 54 Years | 187 | 16.0% |
| 55 to 64 Years | 208 | 17.7% |
| 65 to 74 Years | 105 | 9.0% |
| 75 to 84 Years | 66 | 5.6% |
| 85 Years and Over | 19 | 1.6% |
| Total | 1,172 | 100.0% |
Housing Finances in Valley Green
Median Income by Occupancy in Valley Green
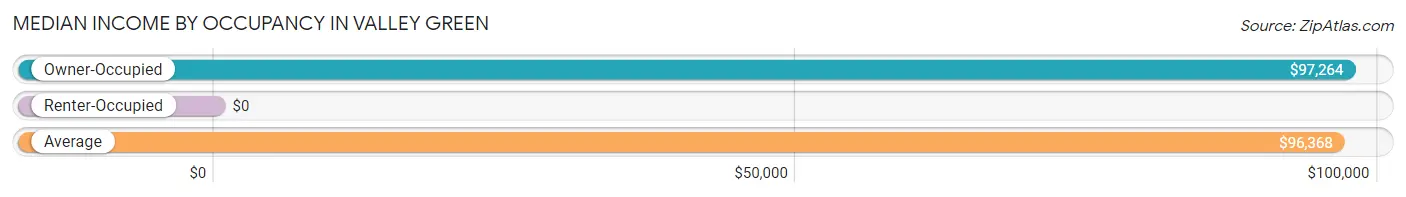
| Occupancy Type | # Households | Median Income |
| Owner-Occupied | 1,134 (96.8%) | $97,264 |
| Renter-Occupied | 38 (3.2%) | $0 |
| Average | 1,172 (100.0%) | $96,368 |
Occupancy by Householder Income Bracket in Valley Green
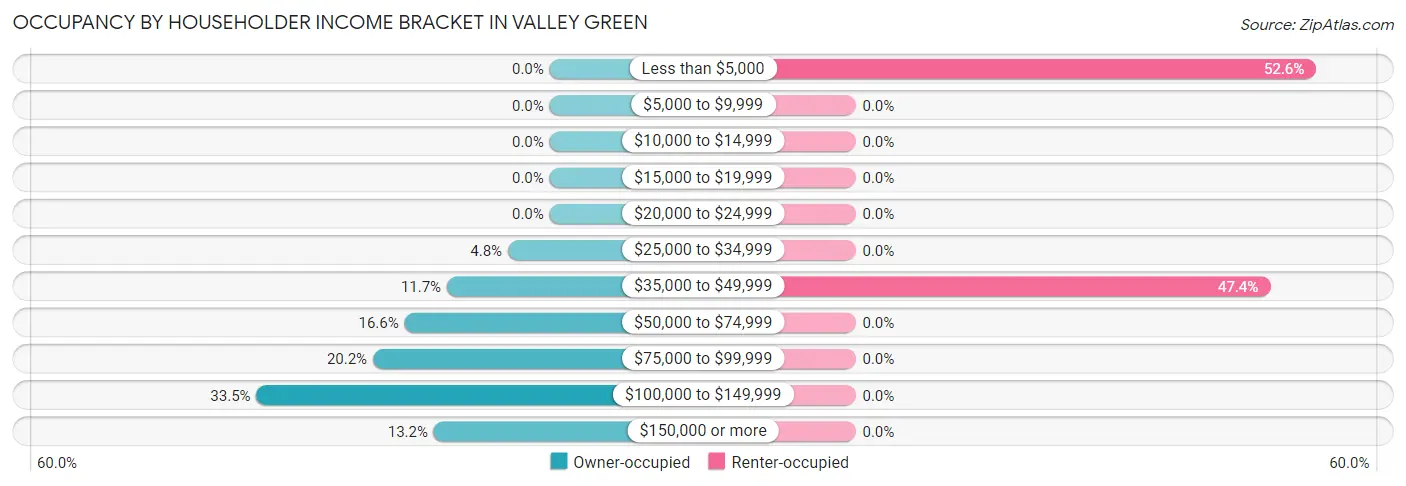
| Income Bracket | Owner-occupied | Renter-occupied |
| Less than $5,000 | 0 (0.0%) | 20 (52.6%) |
| $5,000 to $9,999 | 0 (0.0%) | 0 (0.0%) |
| $10,000 to $14,999 | 0 (0.0%) | 0 (0.0%) |
| $15,000 to $19,999 | 0 (0.0%) | 0 (0.0%) |
| $20,000 to $24,999 | 0 (0.0%) | 0 (0.0%) |
| $25,000 to $34,999 | 54 (4.8%) | 0 (0.0%) |
| $35,000 to $49,999 | 133 (11.7%) | 18 (47.4%) |
| $50,000 to $74,999 | 188 (16.6%) | 0 (0.0%) |
| $75,000 to $99,999 | 229 (20.2%) | 0 (0.0%) |
| $100,000 to $149,999 | 380 (33.5%) | 0 (0.0%) |
| $150,000 or more | 150 (13.2%) | 0 (0.0%) |
| Total | 1,134 (100.0%) | 38 (100.0%) |
Monthly Housing Cost Tiers in Valley Green
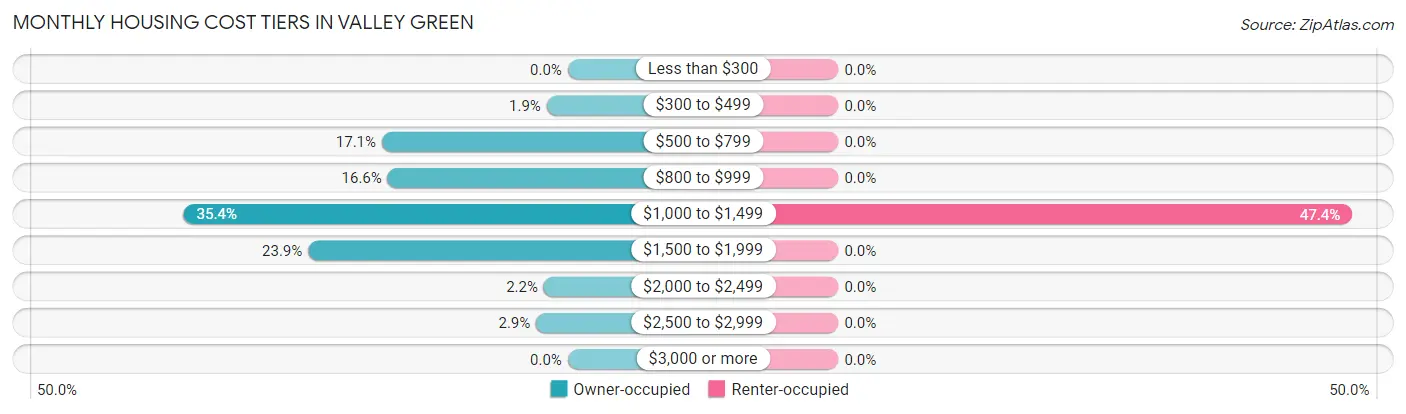
| Monthly Cost | Owner-occupied | Renter-occupied |
| Less than $300 | 0 (0.0%) | 0 (0.0%) |
| $300 to $499 | 22 (1.9%) | 0 (0.0%) |
| $500 to $799 | 194 (17.1%) | 0 (0.0%) |
| $800 to $999 | 188 (16.6%) | 0 (0.0%) |
| $1,000 to $1,499 | 401 (35.4%) | 18 (47.4%) |
| $1,500 to $1,999 | 271 (23.9%) | 0 (0.0%) |
| $2,000 to $2,499 | 25 (2.2%) | 0 (0.0%) |
| $2,500 to $2,999 | 33 (2.9%) | 0 (0.0%) |
| $3,000 or more | 0 (0.0%) | 0 (0.0%) |
| Total | 1,134 (100.0%) | 38 (100.0%) |
Physical Housing Characteristics in Valley Green
Housing Structures in Valley Green
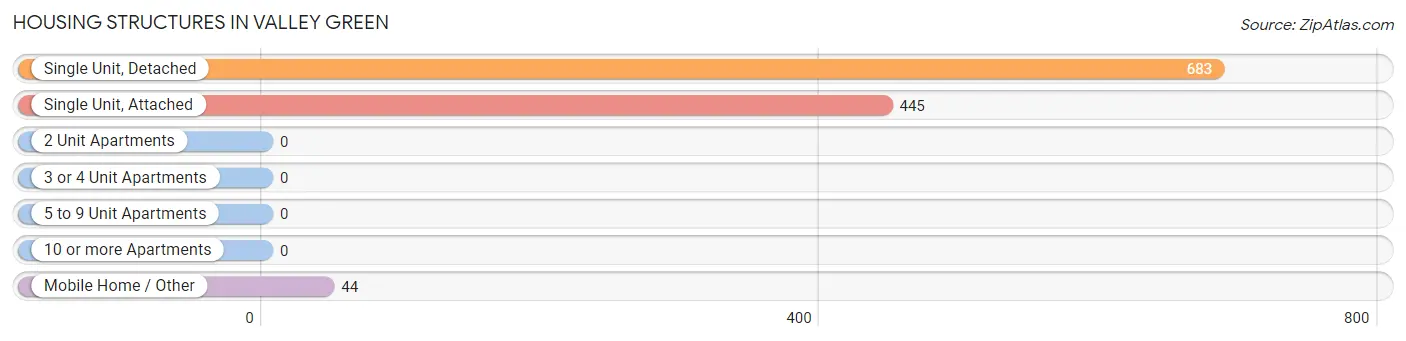
| Structure Type | # Housing Units | % Housing Units |
| Single Unit, Detached | 683 | 58.3% |
| Single Unit, Attached | 445 | 38.0% |
| 2 Unit Apartments | 0 | 0.0% |
| 3 or 4 Unit Apartments | 0 | 0.0% |
| 5 to 9 Unit Apartments | 0 | 0.0% |
| 10 or more Apartments | 0 | 0.0% |
| Mobile Home / Other | 44 | 3.7% |
| Total | 1,172 | 100.0% |
Housing Structures by Occupancy in Valley Green
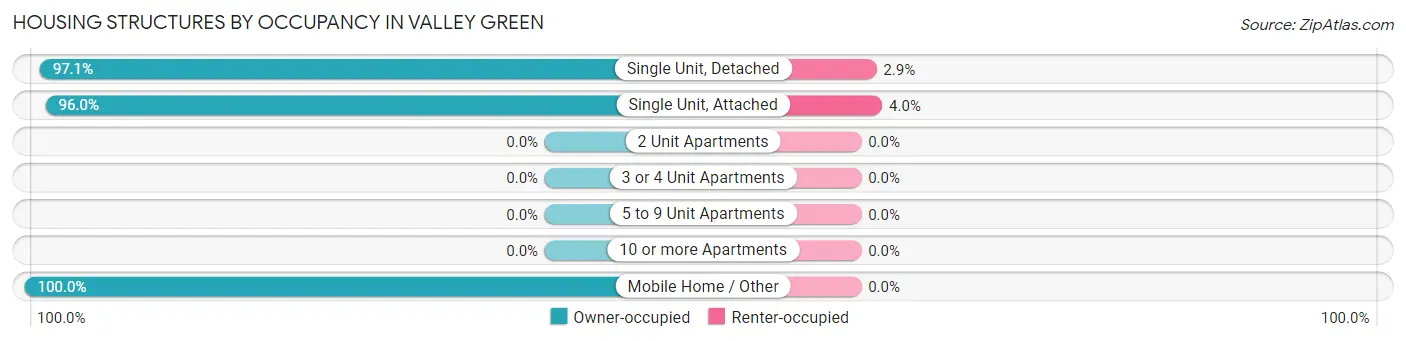
| Structure Type | Owner-occupied | Renter-occupied |
| Single Unit, Detached | 663 (97.1%) | 20 (2.9%) |
| Single Unit, Attached | 427 (96.0%) | 18 (4.0%) |
| 2 Unit Apartments | 0 (0.0%) | 0 (0.0%) |
| 3 or 4 Unit Apartments | 0 (0.0%) | 0 (0.0%) |
| 5 to 9 Unit Apartments | 0 (0.0%) | 0 (0.0%) |
| 10 or more Apartments | 0 (0.0%) | 0 (0.0%) |
| Mobile Home / Other | 44 (100.0%) | 0 (0.0%) |
| Total | 1,134 (96.8%) | 38 (3.2%) |
Housing Structures by Number of Rooms in Valley Green
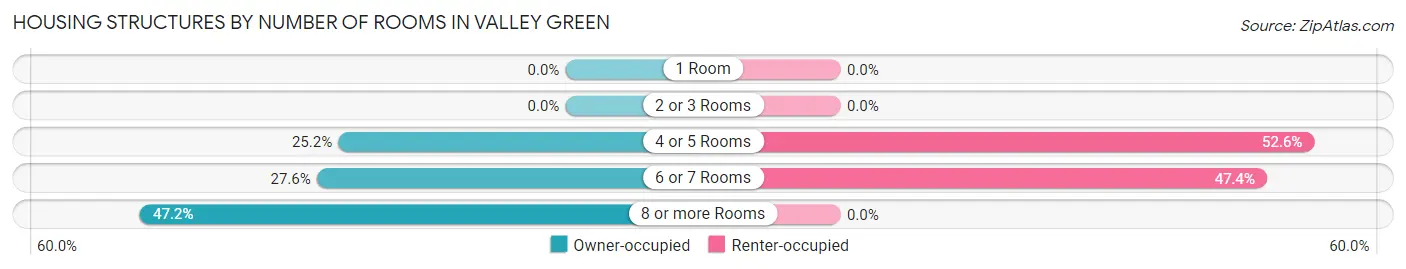
| Number of Rooms | Owner-occupied | Renter-occupied |
| 1 Room | 0 (0.0%) | 0 (0.0%) |
| 2 or 3 Rooms | 0 (0.0%) | 0 (0.0%) |
| 4 or 5 Rooms | 286 (25.2%) | 20 (52.6%) |
| 6 or 7 Rooms | 313 (27.6%) | 18 (47.4%) |
| 8 or more Rooms | 535 (47.2%) | 0 (0.0%) |
| Total | 1,134 (100.0%) | 38 (100.0%) |
Housing Structure by Heating Type in Valley Green
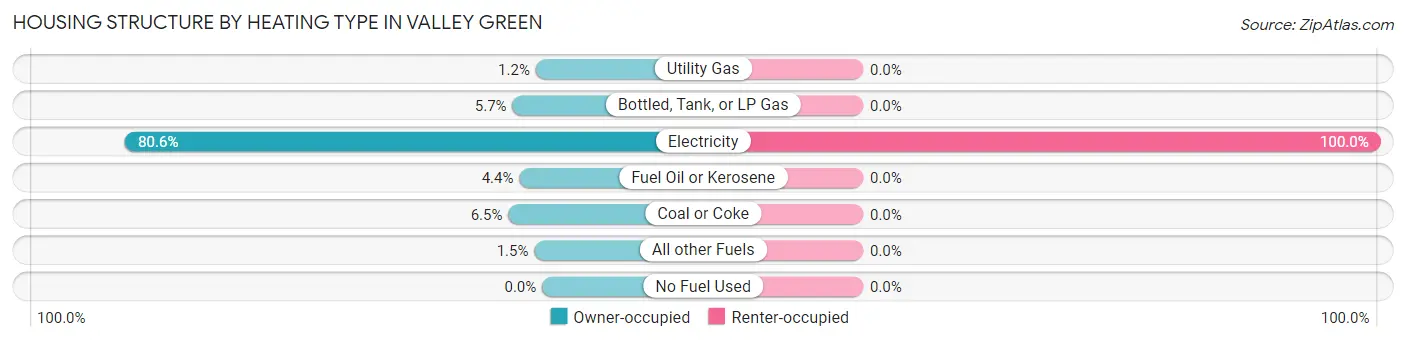
| Heating Type | Owner-occupied | Renter-occupied |
| Utility Gas | 14 (1.2%) | 0 (0.0%) |
| Bottled, Tank, or LP Gas | 65 (5.7%) | 0 (0.0%) |
| Electricity | 914 (80.6%) | 38 (100.0%) |
| Fuel Oil or Kerosene | 50 (4.4%) | 0 (0.0%) |
| Coal or Coke | 74 (6.5%) | 0 (0.0%) |
| All other Fuels | 17 (1.5%) | 0 (0.0%) |
| No Fuel Used | 0 (0.0%) | 0 (0.0%) |
| Total | 1,134 (100.0%) | 38 (100.0%) |
Household Vehicle Usage in Valley Green
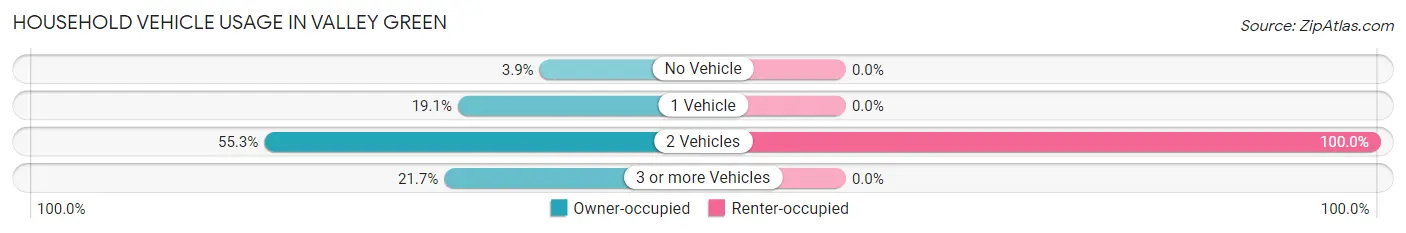
| Vehicles per Household | Owner-occupied | Renter-occupied |
| No Vehicle | 44 (3.9%) | 0 (0.0%) |
| 1 Vehicle | 217 (19.1%) | 0 (0.0%) |
| 2 Vehicles | 627 (55.3%) | 38 (100.0%) |
| 3 or more Vehicles | 246 (21.7%) | 0 (0.0%) |
| Total | 1,134 (100.0%) | 38 (100.0%) |
Real Estate & Mortgages in Valley Green
Real Estate and Mortgage Overview in Valley Green
| Characteristic | Without Mortgage | With Mortgage |
| Housing Units | 228 | 906 |
| Median Property Value | $219,400 | $168,700 |
| Median Household Income | - | - |
| Monthly Housing Costs | $619 | $0 |
| Real Estate Taxes | $2,630 | $19 |
Property Value by Mortgage Status in Valley Green
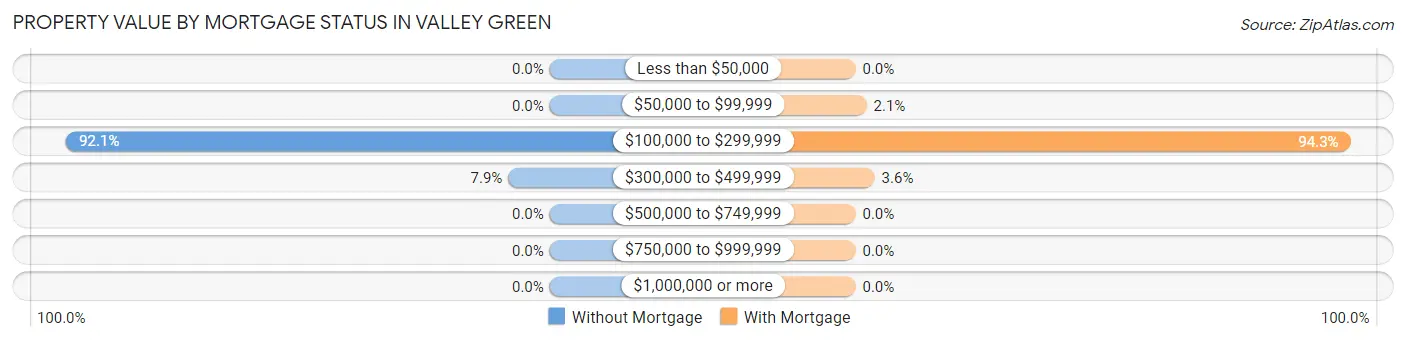
| Property Value | Without Mortgage | With Mortgage |
| Less than $50,000 | 0 (0.0%) | 0 (0.0%) |
| $50,000 to $99,999 | 0 (0.0%) | 19 (2.1%) |
| $100,000 to $299,999 | 210 (92.1%) | 854 (94.3%) |
| $300,000 to $499,999 | 18 (7.9%) | 33 (3.6%) |
| $500,000 to $749,999 | 0 (0.0%) | 0 (0.0%) |
| $750,000 to $999,999 | 0 (0.0%) | 0 (0.0%) |
| $1,000,000 or more | 0 (0.0%) | 0 (0.0%) |
| Total | 228 (100.0%) | 906 (100.0%) |
Household Income by Mortgage Status in Valley Green
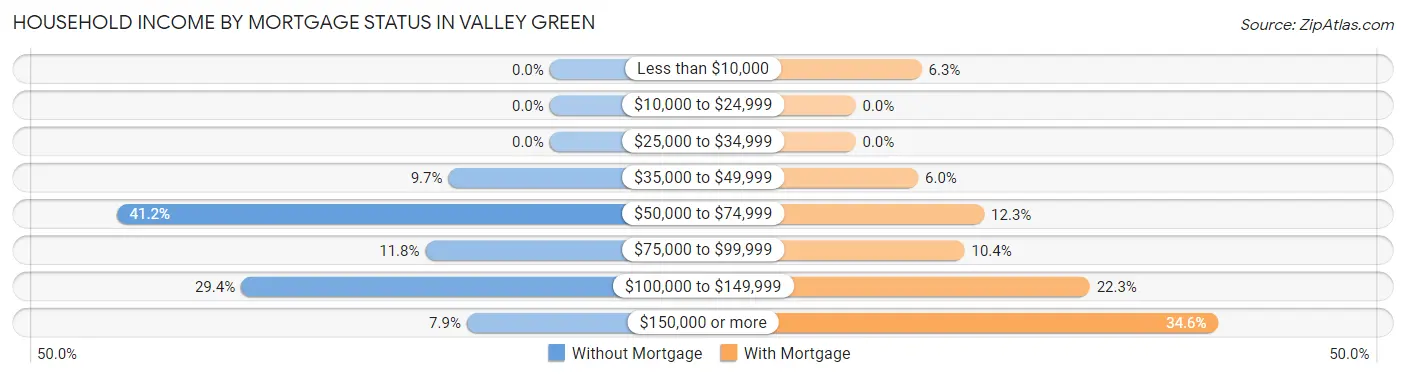
| Household Income | Without Mortgage | With Mortgage |
| Less than $10,000 | 0 (0.0%) | 57 (6.3%) |
| $10,000 to $24,999 | 0 (0.0%) | 0 (0.0%) |
| $25,000 to $34,999 | 0 (0.0%) | 0 (0.0%) |
| $35,000 to $49,999 | 22 (9.7%) | 54 (6.0%) |
| $50,000 to $74,999 | 94 (41.2%) | 111 (12.2%) |
| $75,000 to $99,999 | 27 (11.8%) | 94 (10.4%) |
| $100,000 to $149,999 | 67 (29.4%) | 202 (22.3%) |
| $150,000 or more | 18 (7.9%) | 313 (34.5%) |
| Total | 228 (100.0%) | 906 (100.0%) |
Property Value to Household Income Ratio in Valley Green
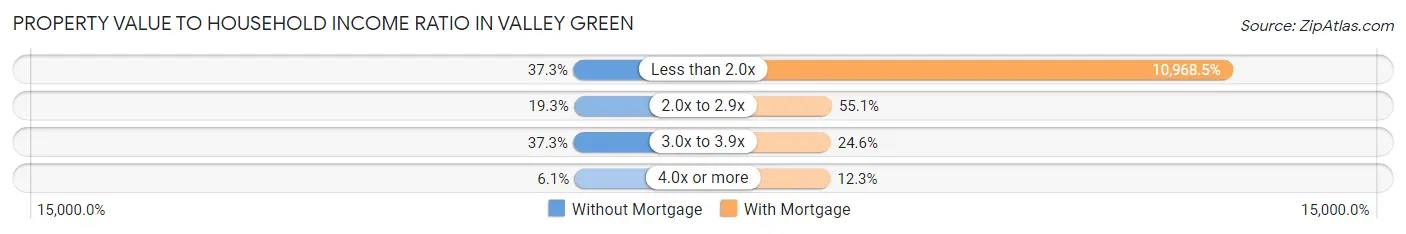
| Value-to-Income Ratio | Without Mortgage | With Mortgage |
| Less than 2.0x | 85 (37.3%) | 99,375 (10,968.5%) |
| 2.0x to 2.9x | 44 (19.3%) | 499 (55.1%) |
| 3.0x to 3.9x | 85 (37.3%) | 223 (24.6%) |
| 4.0x or more | 14 (6.1%) | 111 (12.2%) |
| Total | 228 (100.0%) | 906 (100.0%) |
Real Estate Taxes by Mortgage Status in Valley Green
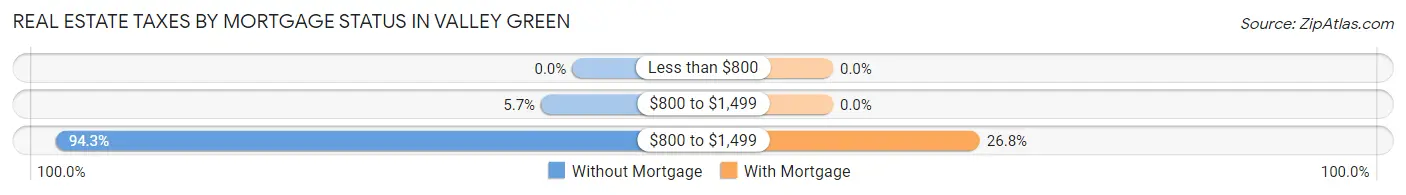
| Property Taxes | Without Mortgage | With Mortgage |
| Less than $800 | 0 (0.0%) | 0 (0.0%) |
| $800 to $1,499 | 13 (5.7%) | 0 (0.0%) |
| $800 to $1,499 | 215 (94.3%) | 243 (26.8%) |
| Total | 228 (100.0%) | 906 (100.0%) |
Health & Disability in Valley Green
Health Insurance Coverage by Age in Valley Green
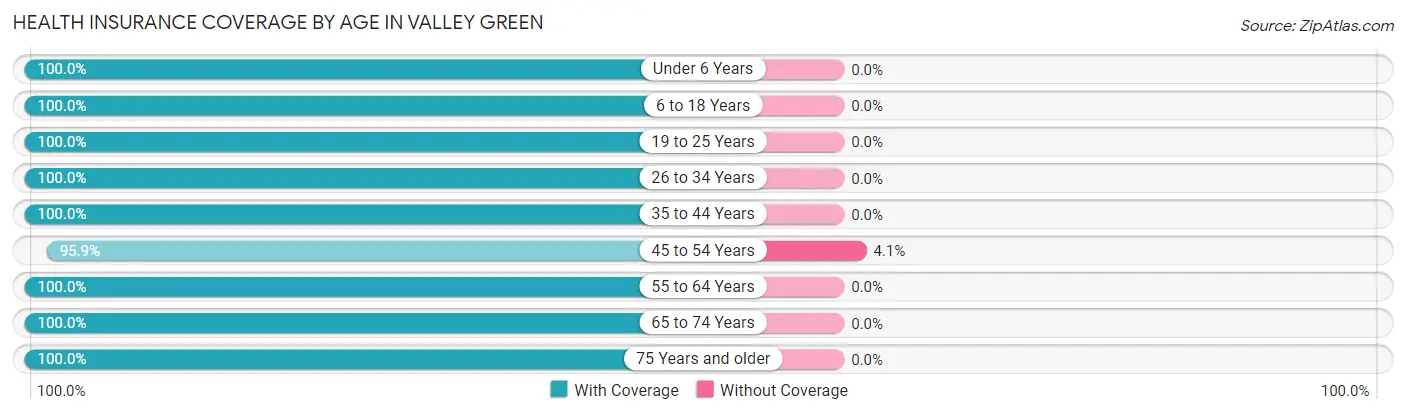
| Age Bracket | With Coverage | Without Coverage |
| Under 6 Years | 285 (100.0%) | 0 (0.0%) |
| 6 to 18 Years | 326 (100.0%) | 0 (0.0%) |
| 19 to 25 Years | 227 (100.0%) | 0 (0.0%) |
| 26 to 34 Years | 469 (100.0%) | 0 (0.0%) |
| 35 to 44 Years | 452 (100.0%) | 0 (0.0%) |
| 45 to 54 Years | 371 (95.9%) | 16 (4.1%) |
| 55 to 64 Years | 360 (100.0%) | 0 (0.0%) |
| 65 to 74 Years | 204 (100.0%) | 0 (0.0%) |
| 75 Years and older | 157 (100.0%) | 0 (0.0%) |
| Total | 2,851 (99.4%) | 16 (0.6%) |
Health Insurance Coverage by Citizenship Status in Valley Green
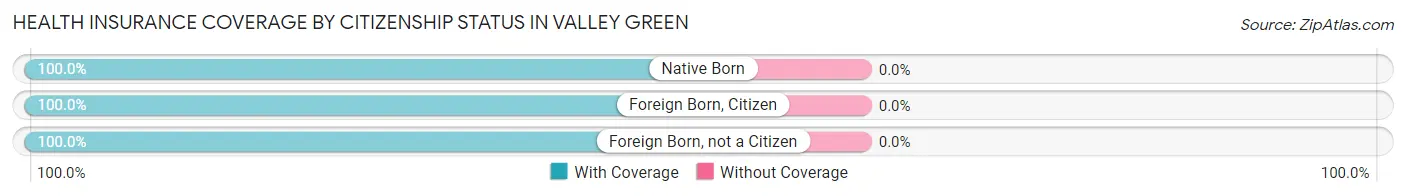
| Citizenship Status | With Coverage | Without Coverage |
| Native Born | 285 (100.0%) | 0 (0.0%) |
| Foreign Born, Citizen | 326 (100.0%) | 0 (0.0%) |
| Foreign Born, not a Citizen | 227 (100.0%) | 0 (0.0%) |
Health Insurance Coverage by Household Income in Valley Green
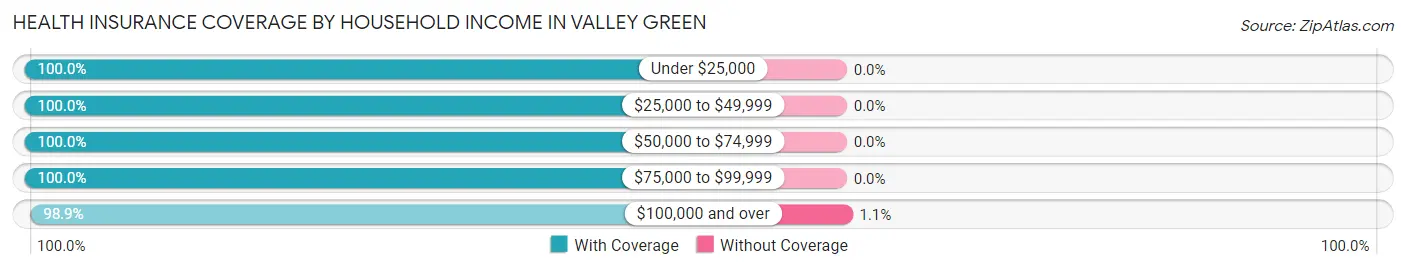
| Household Income | With Coverage | Without Coverage |
| Under $25,000 | 41 (100.0%) | 0 (0.0%) |
| $25,000 to $49,999 | 353 (100.0%) | 0 (0.0%) |
| $50,000 to $74,999 | 395 (100.0%) | 0 (0.0%) |
| $75,000 to $99,999 | 580 (100.0%) | 0 (0.0%) |
| $100,000 and over | 1,482 (98.9%) | 16 (1.1%) |
Public vs Private Health Insurance Coverage by Age in Valley Green
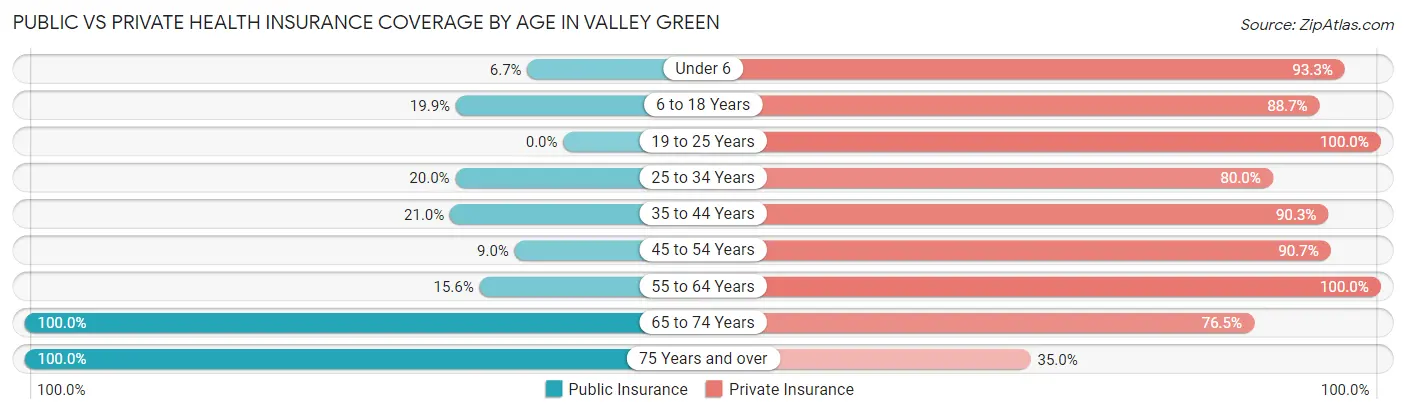
| Age Bracket | Public Insurance | Private Insurance |
| Under 6 | 19 (6.7%) | 266 (93.3%) |
| 6 to 18 Years | 65 (19.9%) | 289 (88.6%) |
| 19 to 25 Years | 0 (0.0%) | 227 (100.0%) |
| 25 to 34 Years | 94 (20.0%) | 375 (80.0%) |
| 35 to 44 Years | 95 (21.0%) | 408 (90.3%) |
| 45 to 54 Years | 35 (9.0%) | 351 (90.7%) |
| 55 to 64 Years | 56 (15.6%) | 360 (100.0%) |
| 65 to 74 Years | 204 (100.0%) | 156 (76.5%) |
| 75 Years and over | 157 (100.0%) | 55 (35.0%) |
| Total | 725 (25.3%) | 2,487 (86.8%) |
Disability Status by Sex by Age in Valley Green
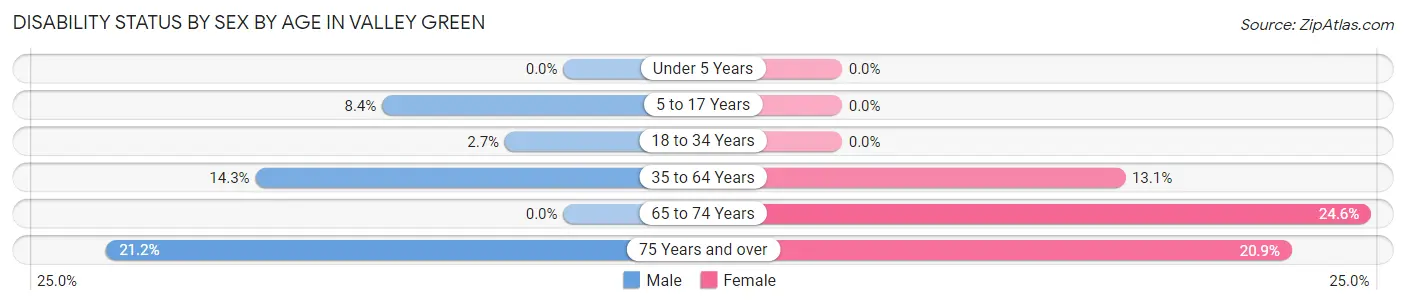
| Age Bracket | Male | Female |
| Under 5 Years | 0 (0.0%) | 0 (0.0%) |
| 5 to 17 Years | 19 (8.4%) | 0 (0.0%) |
| 18 to 34 Years | 10 (2.7%) | 0 (0.0%) |
| 35 to 64 Years | 93 (14.3%) | 72 (13.1%) |
| 65 to 74 Years | 0 (0.0%) | 28 (24.6%) |
| 75 Years and over | 14 (21.2%) | 19 (20.9%) |
Disability Class by Sex by Age in Valley Green
Disability Class: Hearing Difficulty
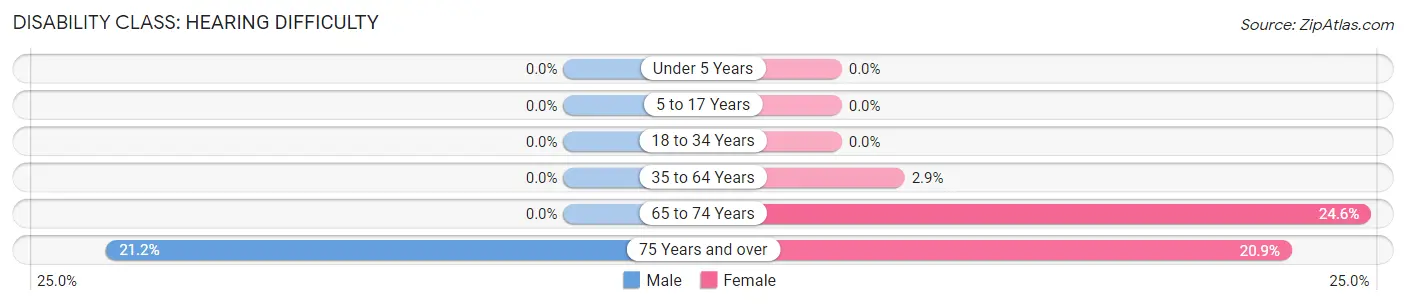
| Age Bracket | Male | Female |
| Under 5 Years | 0 (0.0%) | 0 (0.0%) |
| 5 to 17 Years | 0 (0.0%) | 0 (0.0%) |
| 18 to 34 Years | 0 (0.0%) | 0 (0.0%) |
| 35 to 64 Years | 0 (0.0%) | 16 (2.9%) |
| 65 to 74 Years | 0 (0.0%) | 28 (24.6%) |
| 75 Years and over | 14 (21.2%) | 19 (20.9%) |
Disability Class: Vision Difficulty
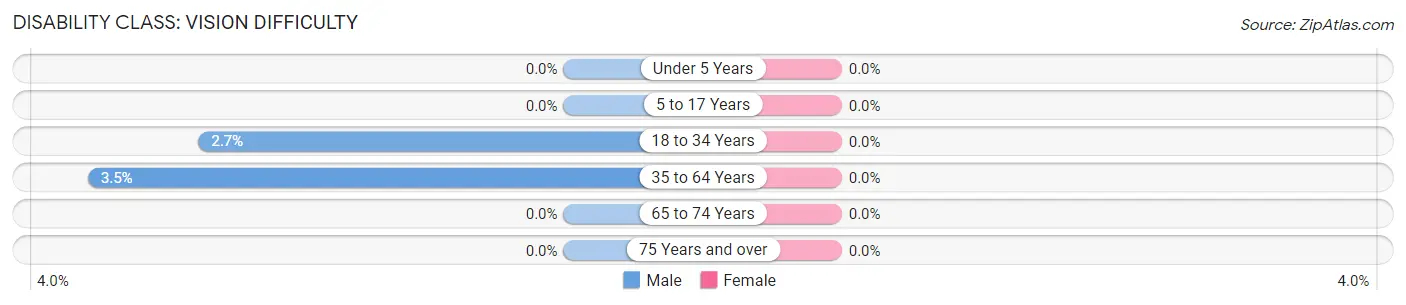
| Age Bracket | Male | Female |
| Under 5 Years | 0 (0.0%) | 0 (0.0%) |
| 5 to 17 Years | 0 (0.0%) | 0 (0.0%) |
| 18 to 34 Years | 10 (2.7%) | 0 (0.0%) |
| 35 to 64 Years | 23 (3.5%) | 0 (0.0%) |
| 65 to 74 Years | 0 (0.0%) | 0 (0.0%) |
| 75 Years and over | 0 (0.0%) | 0 (0.0%) |
Disability Class: Cognitive Difficulty
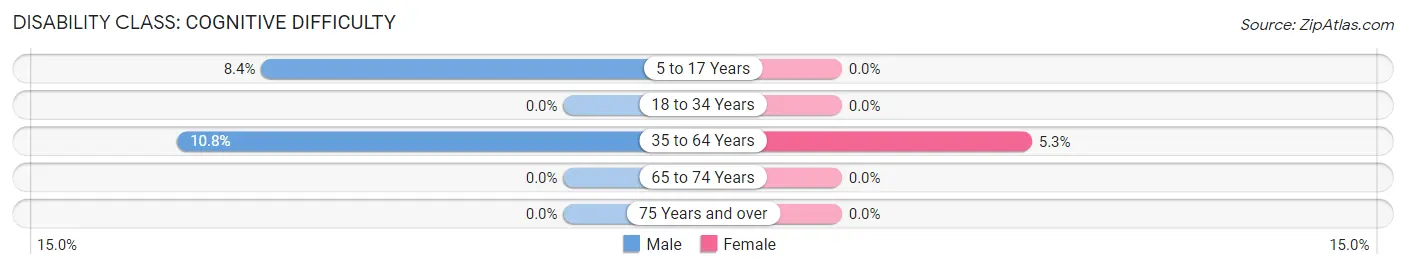
| Age Bracket | Male | Female |
| 5 to 17 Years | 19 (8.4%) | 0 (0.0%) |
| 18 to 34 Years | 0 (0.0%) | 0 (0.0%) |
| 35 to 64 Years | 70 (10.7%) | 29 (5.3%) |
| 65 to 74 Years | 0 (0.0%) | 0 (0.0%) |
| 75 Years and over | 0 (0.0%) | 0 (0.0%) |
Disability Class: Ambulatory Difficulty
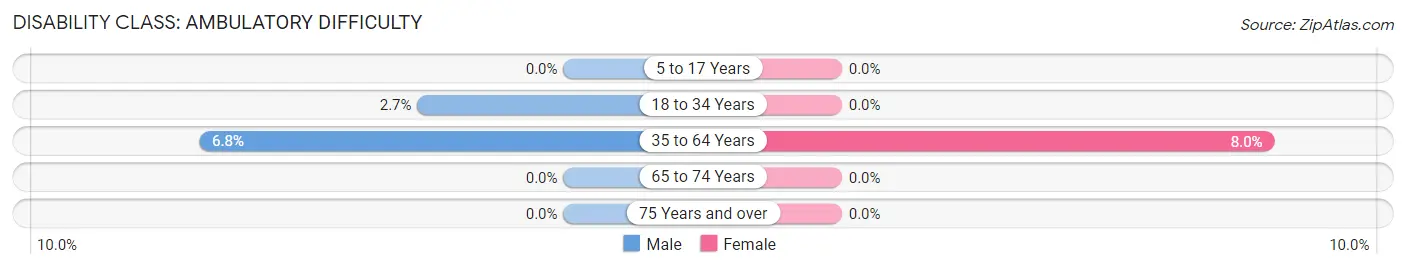
| Age Bracket | Male | Female |
| 5 to 17 Years | 0 (0.0%) | 0 (0.0%) |
| 18 to 34 Years | 10 (2.7%) | 0 (0.0%) |
| 35 to 64 Years | 44 (6.8%) | 44 (8.0%) |
| 65 to 74 Years | 0 (0.0%) | 0 (0.0%) |
| 75 Years and over | 0 (0.0%) | 0 (0.0%) |
Disability Class: Self-Care Difficulty
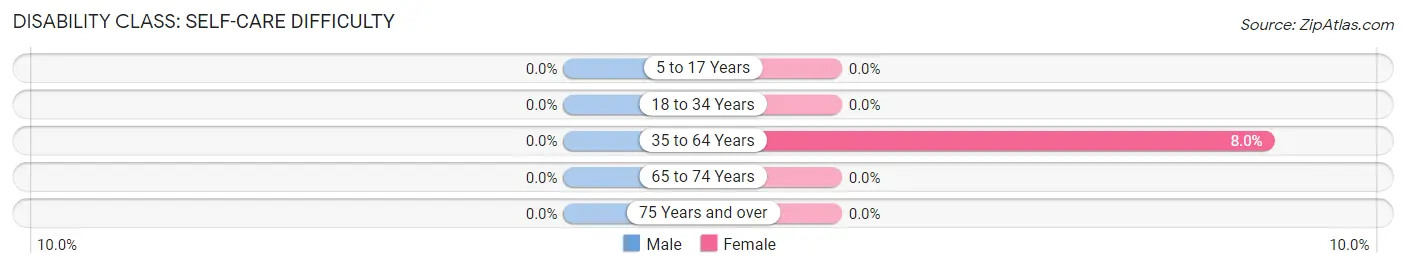
| Age Bracket | Male | Female |
| 5 to 17 Years | 0 (0.0%) | 0 (0.0%) |
| 18 to 34 Years | 0 (0.0%) | 0 (0.0%) |
| 35 to 64 Years | 0 (0.0%) | 44 (8.0%) |
| 65 to 74 Years | 0 (0.0%) | 0 (0.0%) |
| 75 Years and over | 0 (0.0%) | 0 (0.0%) |
Technology Access in Valley Green
Computing Device Access in Valley Green
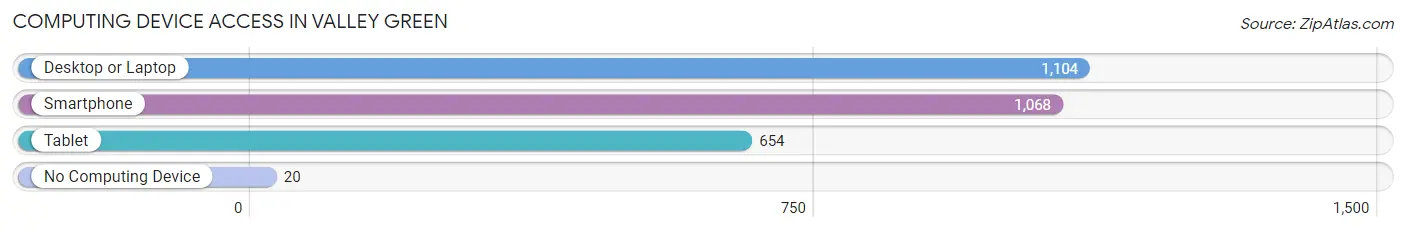
| Device Type | # Households | % Households |
| Desktop or Laptop | 1,104 | 94.2% |
| Smartphone | 1,068 | 91.1% |
| Tablet | 654 | 55.8% |
| No Computing Device | 20 | 1.7% |
| Total | 1,172 | 100.0% |
Internet Access in Valley Green
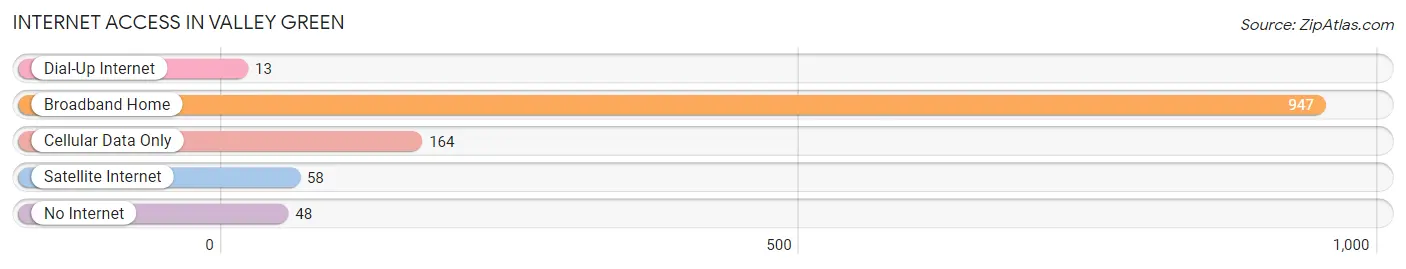
| Internet Type | # Households | % Households |
| Dial-Up Internet | 13 | 1.1% |
| Broadband Home | 947 | 80.8% |
| Cellular Data Only | 164 | 14.0% |
| Satellite Internet | 58 | 5.0% |
| No Internet | 48 | 4.1% |
| Total | 1,172 | 100.0% |
Valley Green Summary
Valley Green is a small unincorporated community located in Bucks County, Pennsylvania. It is situated in the Delaware Valley region of the state, approximately 25 miles north of Philadelphia. The community is bordered by the Neshaminy Creek to the east and the Tohickon Creek to the west.
History
Valley Green was first settled in the late 1700s by a group of German immigrants. The area was originally known as “Germantown” and was part of the larger Germantown Township. In 1854, the area was renamed Valley Green after the nearby Valley Green Inn. The inn was a popular destination for travelers and was known for its excellent food and hospitality.
In the late 1800s, Valley Green began to grow as a summer resort destination. The area was known for its natural beauty and was a popular spot for fishing, hunting, and other outdoor activities. The Valley Green Inn was a popular destination for visitors and hosted many events, including dances and concerts.
In the early 1900s, Valley Green began to transition from a summer resort to a residential community. The area was home to a number of small farms and businesses, including a sawmill, a gristmill, and a blacksmith shop. The community also had a post office, a general store, and a school.
Geography
Valley Green is located in Bucks County, Pennsylvania. It is situated in the Delaware Valley region of the state, approximately 25 miles north of Philadelphia. The community is bordered by the Neshaminy Creek to the east and the Tohickon Creek to the west.
The area is mostly rural, with rolling hills and wooded areas. The terrain is mostly flat, with some areas of higher elevation. The climate is temperate, with hot summers and cold winters.
Economy
Valley Green is a small, rural community with a limited economy. The area is home to a number of small businesses, including a sawmill, a gristmill, and a blacksmith shop. The community also has a post office, a general store, and a school.
The area is also home to a number of farms, which produce a variety of crops, including corn, soybeans, and hay. The area is also known for its dairy farms, which produce milk, cheese, and other dairy products.
Demographics
As of the 2010 census, the population of Valley Green was 1,845. The population is mostly white (94.3%), with a small percentage of African Americans (2.2%) and Hispanics (2.2%). The median household income is $60,000, and the median home value is $250,000.
Valley Green is a small, rural community with a limited economy. The area is home to a number of small businesses, farms, and other amenities. The population is mostly white, with a small percentage of African Americans and Hispanics. The median household income is $60,000, and the median home value is $250,000.
Common Questions
What is Per Capita Income in Valley Green?
Per Capita income in Valley Green is $42,860.
What is the Median Family Income in Valley Green?
Median Family Income in Valley Green is $100,000.
What is the Median Household income in Valley Green?
Median Household Income in Valley Green is $96,368.
What is Income or Wage Gap in Valley Green?
Income or Wage Gap in Valley Green is 20.4%.
Women in Valley Green earn 79.6 cents for every dollar earned by a man.
What is Inequality or Gini Index in Valley Green?
Inequality or Gini Index in Valley Green is 0.31.
What is the Total Population of Valley Green?
Total Population of Valley Green is 2,867.
What is the Total Male Population of Valley Green?
Total Male Population of Valley Green is 1,480.
What is the Total Female Population of Valley Green?
Total Female Population of Valley Green is 1,387.
What is the Ratio of Males per 100 Females in Valley Green?
There are 106.71 Males per 100 Females in Valley Green.
What is the Ratio of Females per 100 Males in Valley Green?
There are 93.72 Females per 100 Males in Valley Green.
What is the Median Population Age in Valley Green?
Median Population Age in Valley Green is 37.3 Years.
What is the Average Family Size in Valley Green
Average Family Size in Valley Green is 2.9 People.
What is the Average Household Size in Valley Green
Average Household Size in Valley Green is 2.5 People.
How Large is the Labor Force in Valley Green?
There are 1,720 People in the Labor Forcein in Valley Green.
What is the Percentage of People in the Labor Force in Valley Green?
74.6% of People are in the Labor Force in Valley Green.
What is the Unemployment Rate in Valley Green?
Unemployment Rate in Valley Green is 2.0%.