Bear Lake borough, PA Map & Demographics
Bear Lake borough Overview
$21,095
PER CAPITA INCOME
$43,750
AVG FAMILY INCOME
$67,824
AVG HOUSEHOLD INCOME
57.1%
WAGE / INCOME GAP [ % ]
42.9¢/ $1
WAGE / INCOME GAP [ $ ]
0.32
INEQUALITY / GINI INDEX
194
TOTAL POPULATION
117
MALE POPULATION
77
FEMALE POPULATION
151.95
MALES / 100 FEMALES
65.81
FEMALES / 100 MALES
44.9
MEDIAN AGE
3.4
AVG FAMILY SIZE
2.7
AVG HOUSEHOLD SIZE
107
LABOR FORCE [ PEOPLE ]
56.0%
PERCENT IN LABOR FORCE
14.0%
UNEMPLOYMENT RATE
Income in Bear Lake borough
Income Overview in Bear Lake borough
Per Capita Income in Bear Lake borough is $21,095, while median incomes of families and households are $43,750 and $67,824 respectively.
| Characteristic | Number | Measure |
| Per Capita Income | 194 | $21,095 |
| Median Family Income | 26 | $43,750 |
| Mean Family Income | 26 | $61,131 |
| Median Household Income | 71 | $67,824 |
| Mean Household Income | 71 | $54,775 |
| Income Deficit | 26 | $0 |
| Wage / Income Gap (%) | 194 | 57.11% |
| Wage / Income Gap ($) | 194 | 42.89¢ per $1 |
| Gini / Inequality Index | 194 | 0.32 |
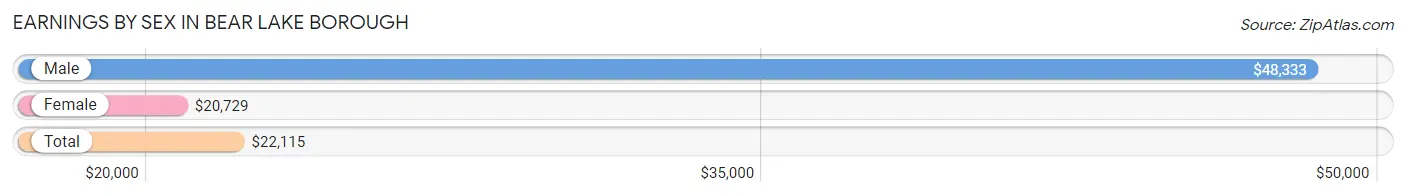
Earnings by Sex in Bear Lake borough
Average Earnings in Bear Lake borough are $22,115, $48,333 for men and $20,729 for women, a difference of 57.1%.
| Sex | Number | Average Earnings |
| Male | 58 (54.7%) | $48,333 |
| Female | 48 (45.3%) | $20,729 |
| Total | 106 (100.0%) | $22,115 |
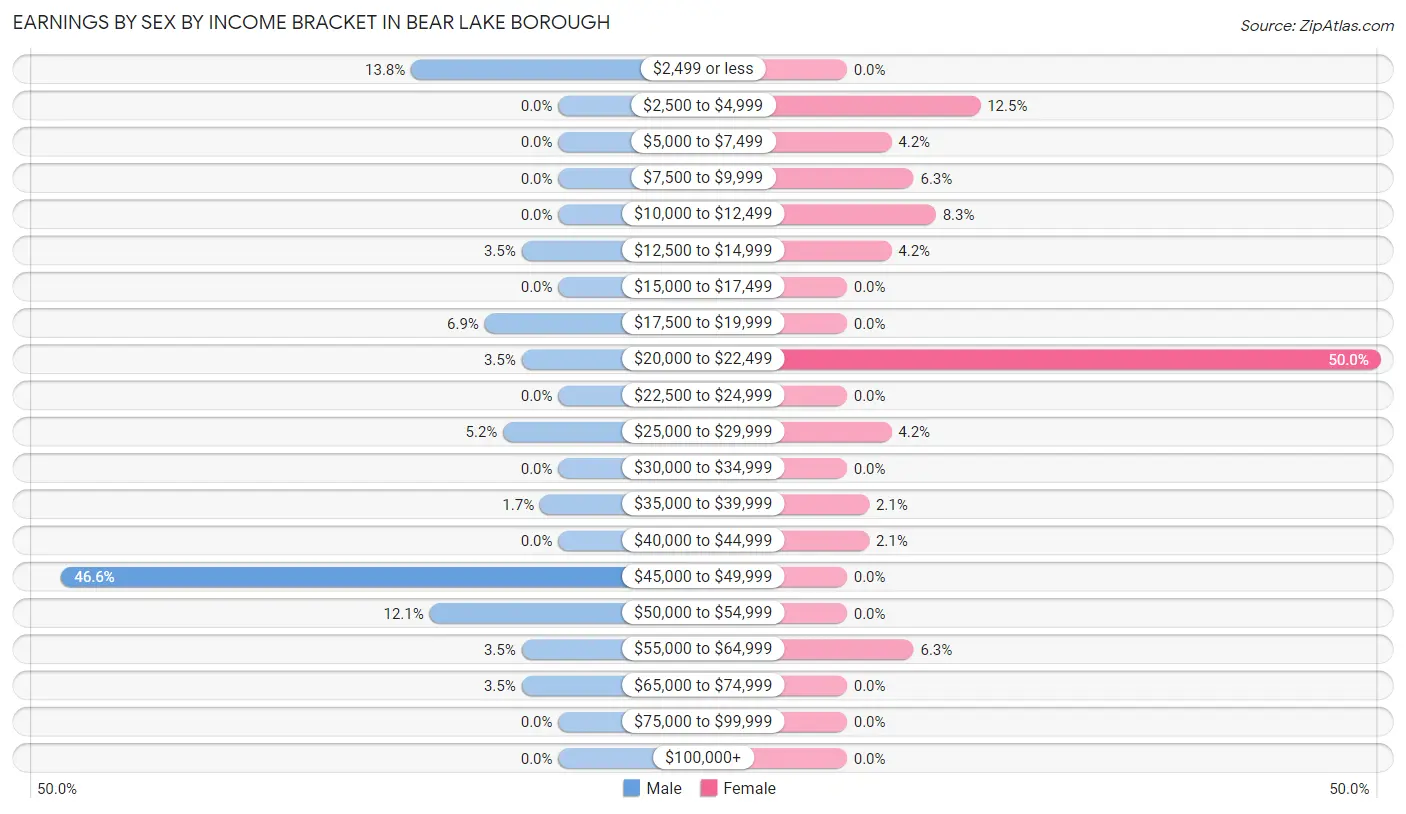
Earnings by Sex by Income Bracket in Bear Lake borough
The most common earnings brackets in Bear Lake borough are $45,000 to $49,999 for men (27 | 46.6%) and $20,000 to $22,499 for women (24 | 50.0%).
| Income | Male | Female |
| $2,499 or less | 8 (13.8%) | 0 (0.0%) |
| $2,500 to $4,999 | 0 (0.0%) | 6 (12.5%) |
| $5,000 to $7,499 | 0 (0.0%) | 2 (4.2%) |
| $7,500 to $9,999 | 0 (0.0%) | 3 (6.2%) |
| $10,000 to $12,499 | 0 (0.0%) | 4 (8.3%) |
| $12,500 to $14,999 | 2 (3.5%) | 2 (4.2%) |
| $15,000 to $17,499 | 0 (0.0%) | 0 (0.0%) |
| $17,500 to $19,999 | 4 (6.9%) | 0 (0.0%) |
| $20,000 to $22,499 | 2 (3.5%) | 24 (50.0%) |
| $22,500 to $24,999 | 0 (0.0%) | 0 (0.0%) |
| $25,000 to $29,999 | 3 (5.2%) | 2 (4.2%) |
| $30,000 to $34,999 | 0 (0.0%) | 0 (0.0%) |
| $35,000 to $39,999 | 1 (1.7%) | 1 (2.1%) |
| $40,000 to $44,999 | 0 (0.0%) | 1 (2.1%) |
| $45,000 to $49,999 | 27 (46.6%) | 0 (0.0%) |
| $50,000 to $54,999 | 7 (12.1%) | 0 (0.0%) |
| $55,000 to $64,999 | 2 (3.5%) | 3 (6.2%) |
| $65,000 to $74,999 | 2 (3.5%) | 0 (0.0%) |
| $75,000 to $99,999 | 0 (0.0%) | 0 (0.0%) |
| $100,000+ | 0 (0.0%) | 0 (0.0%) |
| Total | 58 (100.0%) | 48 (100.0%) |
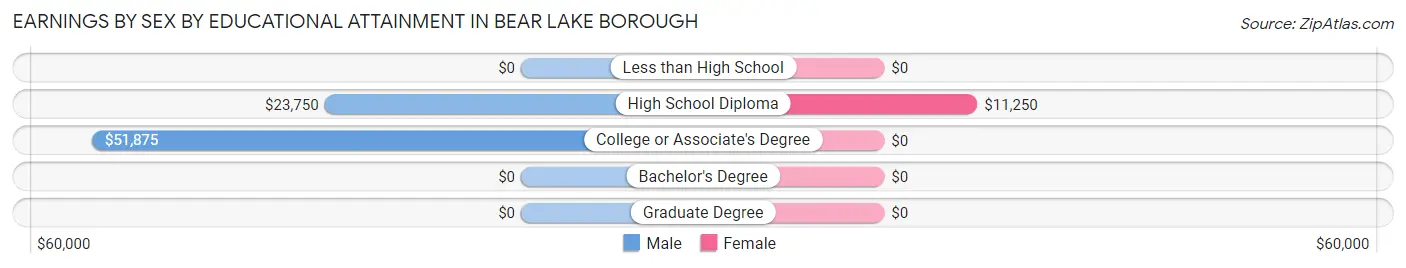
Earnings by Sex by Educational Attainment in Bear Lake borough
Average earnings in Bear Lake borough are $48,472 for men and $21,042 for women, a difference of 56.6%. Men with an educational attainment of college or associate's degree enjoy the highest average annual earnings of $51,875, while those with high school diploma education earn the least with $23,750. Women with an educational attainment of high school diploma earn the most with the average annual earnings of $11,250, while those with high school diploma education have the smallest earnings of $11,250.
| Educational Attainment | Male Income | Female Income |
| Less than High School | - | - |
| High School Diploma | $23,750 | $11,250 |
| College or Associate's Degree | $51,875 | $0 |
| Bachelor's Degree | - | - |
| Graduate Degree | - | - |
| Total | $48,472 | $21,042 |
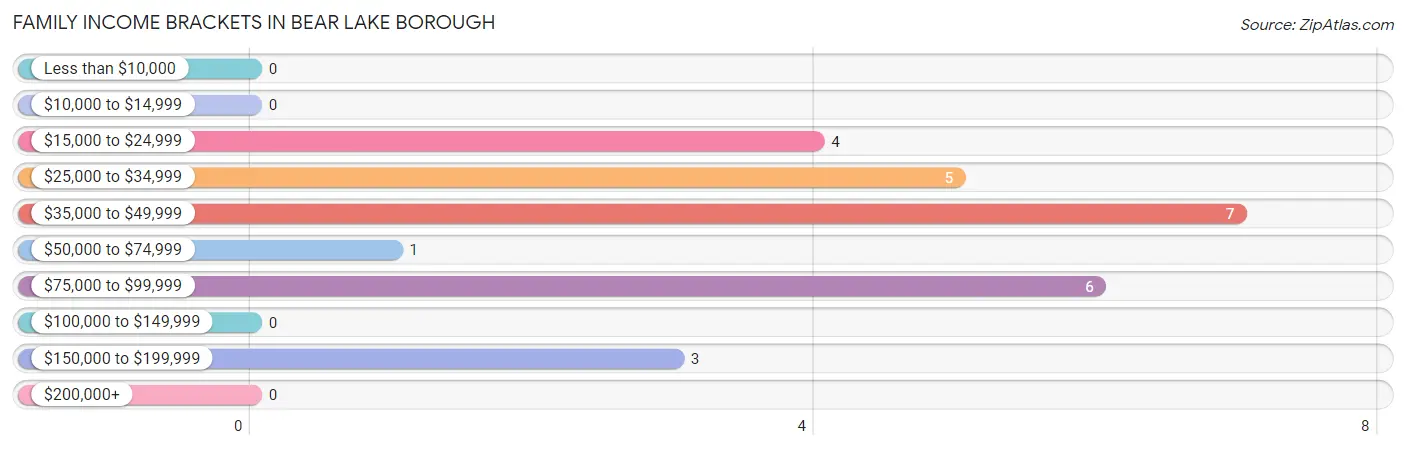
Family Income in Bear Lake borough
Family Income Brackets in Bear Lake borough
According to the Bear Lake borough family income data, there are 7 families falling into the $35,000 to $49,999 income range, which is the most common income bracket and makes up 26.9% of all families.
| Income Bracket | # Families | % Families |
| Less than $10,000 | 0 | 0.0% |
| $10,000 to $14,999 | 0 | 0.0% |
| $15,000 to $24,999 | 4 | 15.4% |
| $25,000 to $34,999 | 5 | 19.2% |
| $35,000 to $49,999 | 7 | 26.9% |
| $50,000 to $74,999 | 1 | 3.8% |
| $75,000 to $99,999 | 6 | 23.1% |
| $100,000 to $149,999 | 0 | 0.0% |
| $150,000 to $199,999 | 3 | 11.5% |
| $200,000+ | 0 | 0.0% |
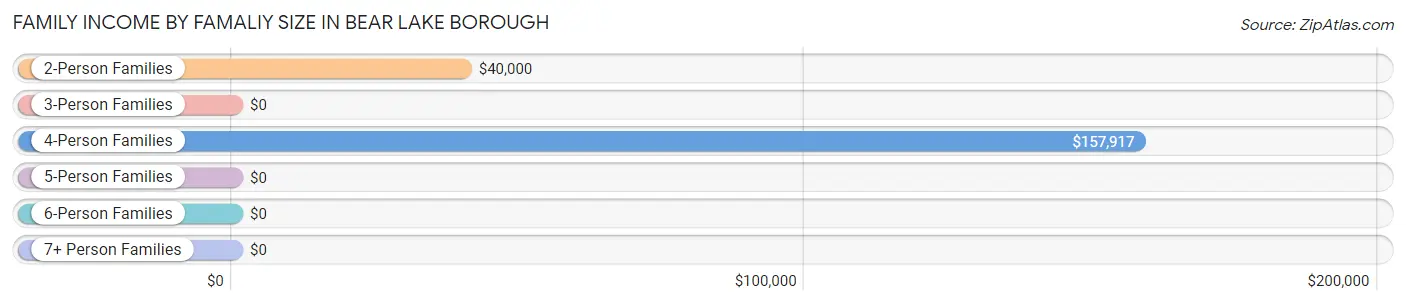
Family Income by Famaliy Size in Bear Lake borough
4-person families (5 | 19.2%) account for the highest median family income in Bear Lake borough with $157,917 per family, while 4-person families (5 | 19.2%) have the highest median income of $39,479 per family member.
| Income Bracket | # Families | Median Income |
| 2-Person Families | 12 (46.2%) | $40,000 |
| 3-Person Families | 8 (30.8%) | $0 |
| 4-Person Families | 5 (19.2%) | $157,917 |
| 5-Person Families | 1 (3.8%) | $0 |
| 6-Person Families | 0 (0.0%) | $0 |
| 7+ Person Families | 0 (0.0%) | $0 |
| Total | 26 (100.0%) | $43,750 |
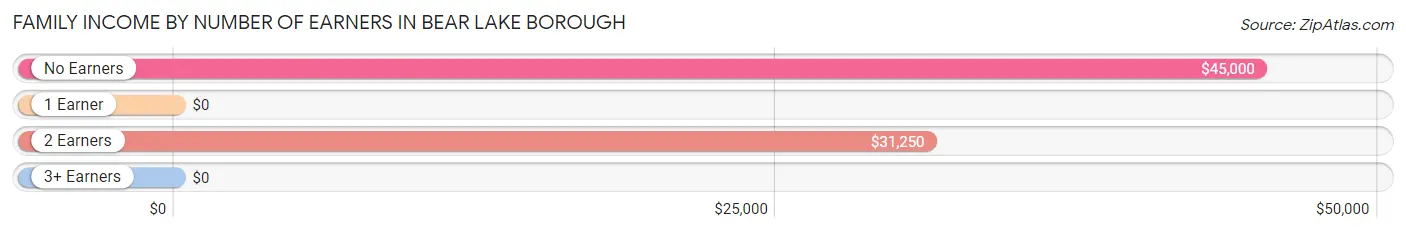
Family Income by Number of Earners in Bear Lake borough
| Number of Earners | # Families | Median Income |
| No Earners | 8 (30.8%) | $45,000 |
| 1 Earner | 3 (11.5%) | $0 |
| 2 Earners | 10 (38.5%) | $31,250 |
| 3+ Earners | 5 (19.2%) | $0 |
| Total | 26 (100.0%) | $43,750 |
Household Income in Bear Lake borough
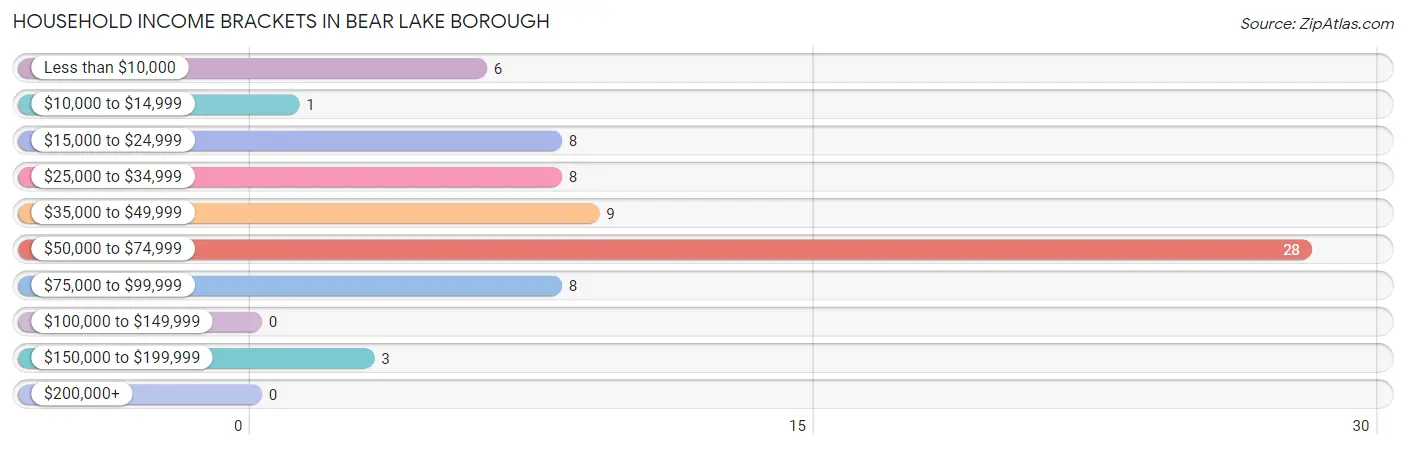
Household Income Brackets in Bear Lake borough
With 28 households falling in the category, the $50,000 to $74,999 income range is the most frequent in Bear Lake borough, accounting for 39.4% of all households.
| Income Bracket | # Households | % Households |
| Less than $10,000 | 6 | 8.5% |
| $10,000 to $14,999 | 1 | 1.4% |
| $15,000 to $24,999 | 8 | 11.3% |
| $25,000 to $34,999 | 8 | 11.3% |
| $35,000 to $49,999 | 9 | 12.7% |
| $50,000 to $74,999 | 28 | 39.4% |
| $75,000 to $99,999 | 8 | 11.3% |
| $100,000 to $149,999 | 0 | 0.0% |
| $150,000 to $199,999 | 3 | 4.2% |
| $200,000+ | 0 | 0.0% |
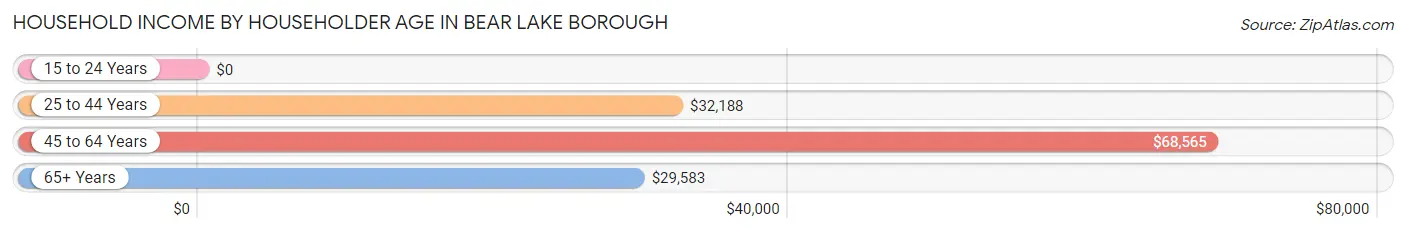
Household Income by Householder Age in Bear Lake borough
The median household income in Bear Lake borough is $67,824, with the highest median household income of $68,565 found in the 45 to 64 years age bracket for the primary householder. A total of 49 households (69.0%) fall into this category.
| Income Bracket | # Households | Median Income |
| 15 to 24 Years | 0 (0.0%) | $0 |
| 25 to 44 Years | 7 (9.9%) | $32,188 |
| 45 to 64 Years | 49 (69.0%) | $68,565 |
| 65+ Years | 15 (21.1%) | $29,583 |
| Total | 71 (100.0%) | $67,824 |
Poverty in Bear Lake borough
Income Below Poverty by Sex and Age in Bear Lake borough
With 34.2% poverty level for males and 19.5% for females among the residents of Bear Lake borough, 16 and 17 year old males and 25 to 34 year old females are the most vulnerable to poverty, with 40 males (100.0%) and 5 females (100.0%) in their respective age groups living below the poverty level.
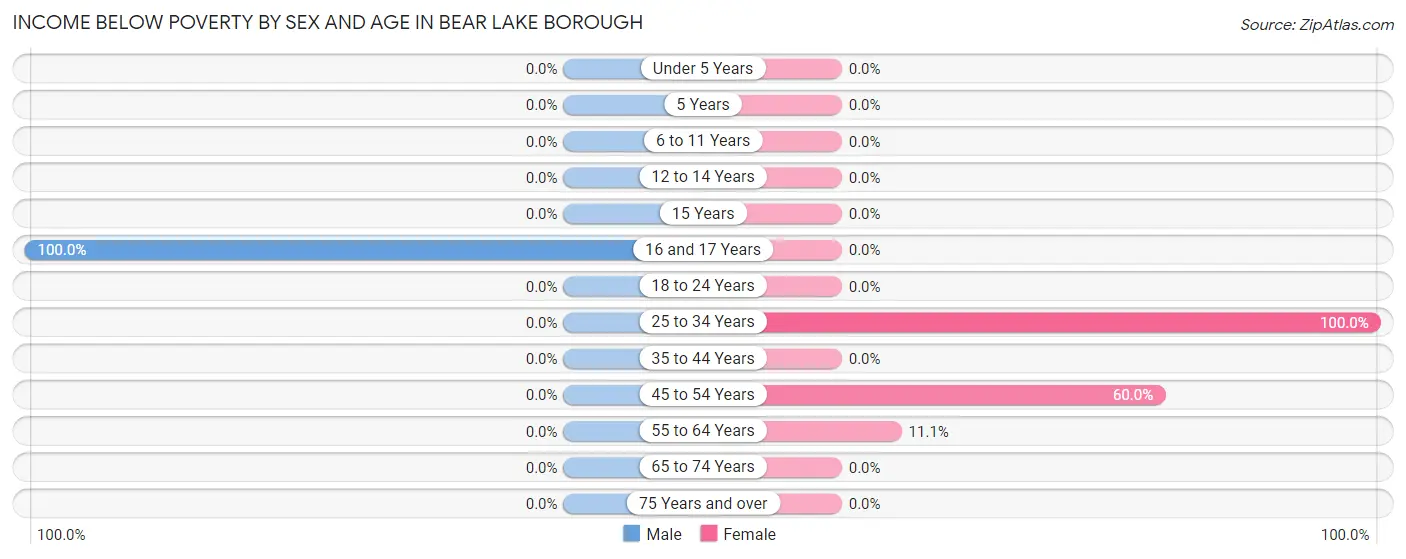
| Age Bracket | Male | Female |
| Under 5 Years | 0 (0.0%) | 0 (0.0%) |
| 5 Years | 0 (0.0%) | 0 (0.0%) |
| 6 to 11 Years | 0 (0.0%) | 0 (0.0%) |
| 12 to 14 Years | 0 (0.0%) | 0 (0.0%) |
| 15 Years | 0 (0.0%) | 0 (0.0%) |
| 16 and 17 Years | 40 (100.0%) | 0 (0.0%) |
| 18 to 24 Years | 0 (0.0%) | 0 (0.0%) |
| 25 to 34 Years | 0 (0.0%) | 5 (100.0%) |
| 35 to 44 Years | 0 (0.0%) | 0 (0.0%) |
| 45 to 54 Years | 0 (0.0%) | 9 (60.0%) |
| 55 to 64 Years | 0 (0.0%) | 1 (11.1%) |
| 65 to 74 Years | 0 (0.0%) | 0 (0.0%) |
| 75 Years and over | 0 (0.0%) | 0 (0.0%) |
| Total | 40 (34.2%) | 15 (19.5%) |
Income Above Poverty by Sex and Age in Bear Lake borough
According to the poverty statistics in Bear Lake borough, males aged 15 years and females aged 15 years are the age groups that are most secure financially, with 100.0% of males and 100.0% of females in these age groups living above the poverty line.
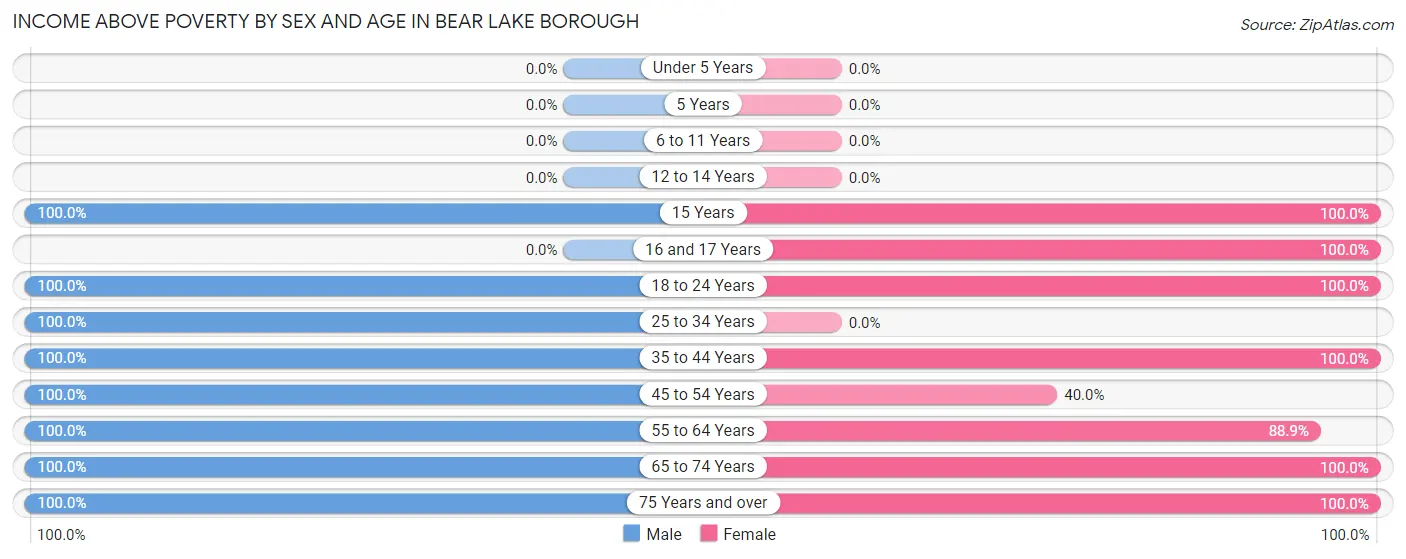
| Age Bracket | Male | Female |
| Under 5 Years | 0 (0.0%) | 0 (0.0%) |
| 5 Years | 0 (0.0%) | 0 (0.0%) |
| 6 to 11 Years | 0 (0.0%) | 0 (0.0%) |
| 12 to 14 Years | 0 (0.0%) | 0 (0.0%) |
| 15 Years | 2 (100.0%) | 1 (100.0%) |
| 16 and 17 Years | 0 (0.0%) | 1 (100.0%) |
| 18 to 24 Years | 11 (100.0%) | 6 (100.0%) |
| 25 to 34 Years | 2 (100.0%) | 0 (0.0%) |
| 35 to 44 Years | 7 (100.0%) | 26 (100.0%) |
| 45 to 54 Years | 33 (100.0%) | 6 (40.0%) |
| 55 to 64 Years | 9 (100.0%) | 8 (88.9%) |
| 65 to 74 Years | 8 (100.0%) | 10 (100.0%) |
| 75 Years and over | 5 (100.0%) | 4 (100.0%) |
| Total | 77 (65.8%) | 62 (80.5%) |
Income Below Poverty Among Married-Couple Families in Bear Lake borough
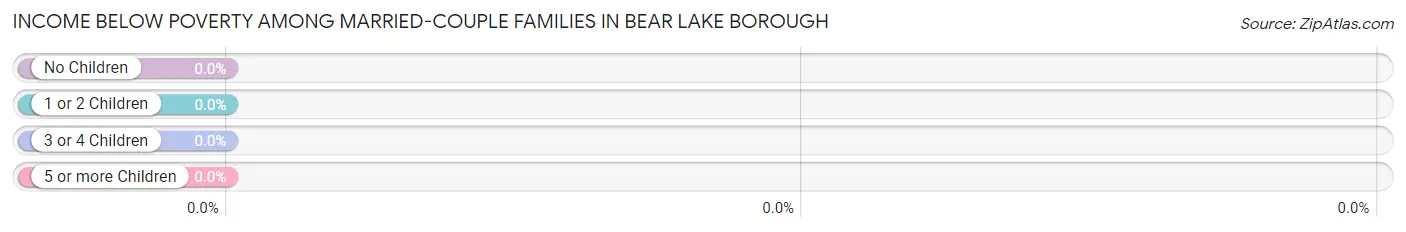
| Children | Above Poverty | Below Poverty |
| No Children | 19 (100.0%) | 0 (0.0%) |
| 1 or 2 Children | 2 (100.0%) | 0 (0.0%) |
| 3 or 4 Children | 0 (0.0%) | 0 (0.0%) |
| 5 or more Children | 0 (0.0%) | 0 (0.0%) |
| Total | 21 (100.0%) | 0 (0.0%) |
Income Below Poverty Among Single-Parent Households in Bear Lake borough
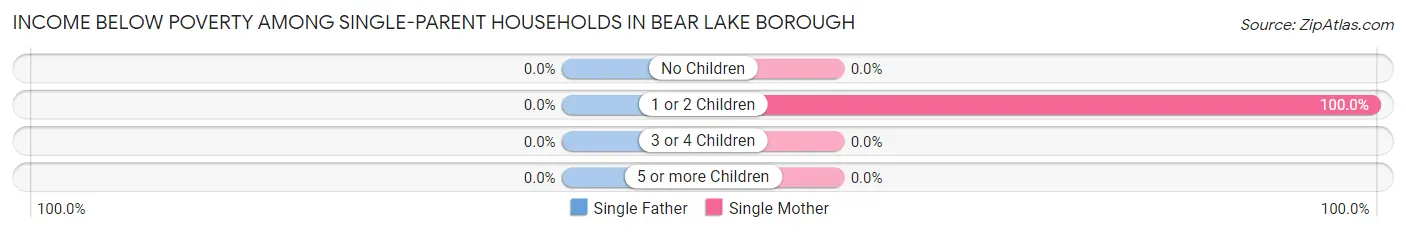
| Children | Single Father | Single Mother |
| No Children | 0 (0.0%) | 0 (0.0%) |
| 1 or 2 Children | 0 (0.0%) | 3 (100.0%) |
| 3 or 4 Children | 0 (0.0%) | 0 (0.0%) |
| 5 or more Children | 0 (0.0%) | 0 (0.0%) |
| Total | 0 (0.0%) | 3 (100.0%) |
Income Below Poverty Among Married-Couple vs Single-Parent Households in Bear Lake borough
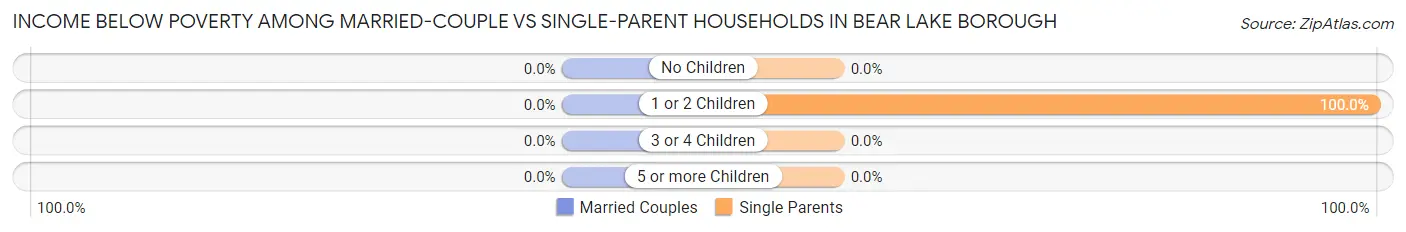
| Children | Married-Couple Families | Single-Parent Households |
| No Children | 0 (0.0%) | 0 (0.0%) |
| 1 or 2 Children | 0 (0.0%) | 3 (100.0%) |
| 3 or 4 Children | 0 (0.0%) | 0 (0.0%) |
| 5 or more Children | 0 (0.0%) | 0 (0.0%) |
| Total | 0 (0.0%) | 3 (60.0%) |
Race in Bear Lake borough
The most populous races in Bear Lake borough are White / Caucasian (189 | 97.4%), and Two or more Races (5 | 2.6%).
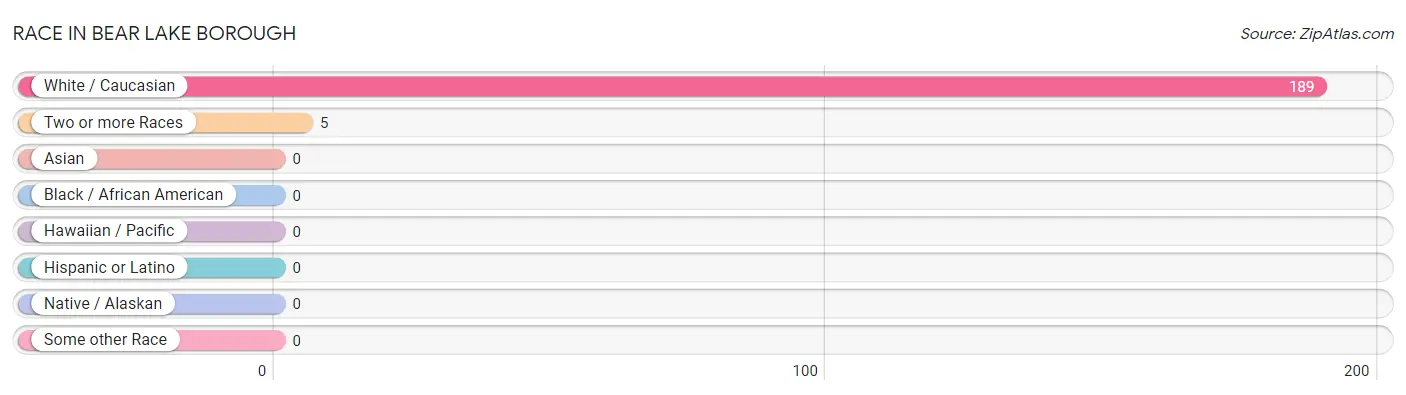
| Race | # Population | % Population |
| Asian | 0 | 0.0% |
| Black / African American | 0 | 0.0% |
| Hawaiian / Pacific | 0 | 0.0% |
| Hispanic or Latino | 0 | 0.0% |
| Native / Alaskan | 0 | 0.0% |
| White / Caucasian | 189 | 97.4% |
| Two or more Races | 5 | 2.6% |
| Some other Race | 0 | 0.0% |
| Total | 194 | 100.0% |
Ancestry in Bear Lake borough
The most populous ancestries reported in Bear Lake borough are English (55 | 28.3%), German (26 | 13.4%), Dutch (15 | 7.7%), Polish (9 | 4.6%), and American (7 | 3.6%), together accounting for 57.7% of all Bear Lake borough residents.
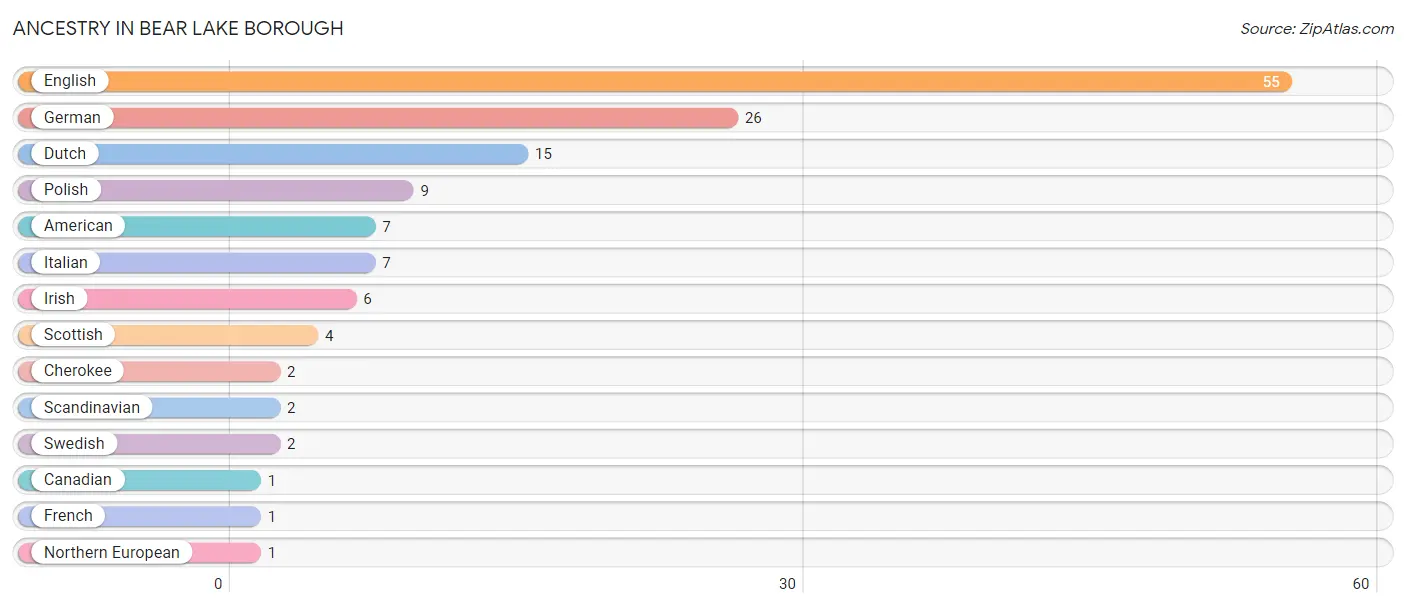
| Ancestry | # Population | % Population |
| American | 7 | 3.6% |
| Canadian | 1 | 0.5% |
| Cherokee | 2 | 1.0% |
| Dutch | 15 | 7.7% |
| English | 55 | 28.3% |
| French | 1 | 0.5% |
| German | 26 | 13.4% |
| Irish | 6 | 3.1% |
| Italian | 7 | 3.6% |
| Northern European | 1 | 0.5% |
| Polish | 9 | 4.6% |
| Scandinavian | 2 | 1.0% |
| Scottish | 4 | 2.1% |
| Swedish | 2 | 1.0% | View All 14 Rows |
Immigrants in Bear Lake borough

| Immigration Origin | # Population | % Population | View All 0 Rows |
Sex and Age in Bear Lake borough
Sex and Age in Bear Lake borough
The most populous age groups in Bear Lake borough are 15 to 19 Years (46 | 39.3%) for men and 40 to 44 Years (25 | 32.5%) for women.
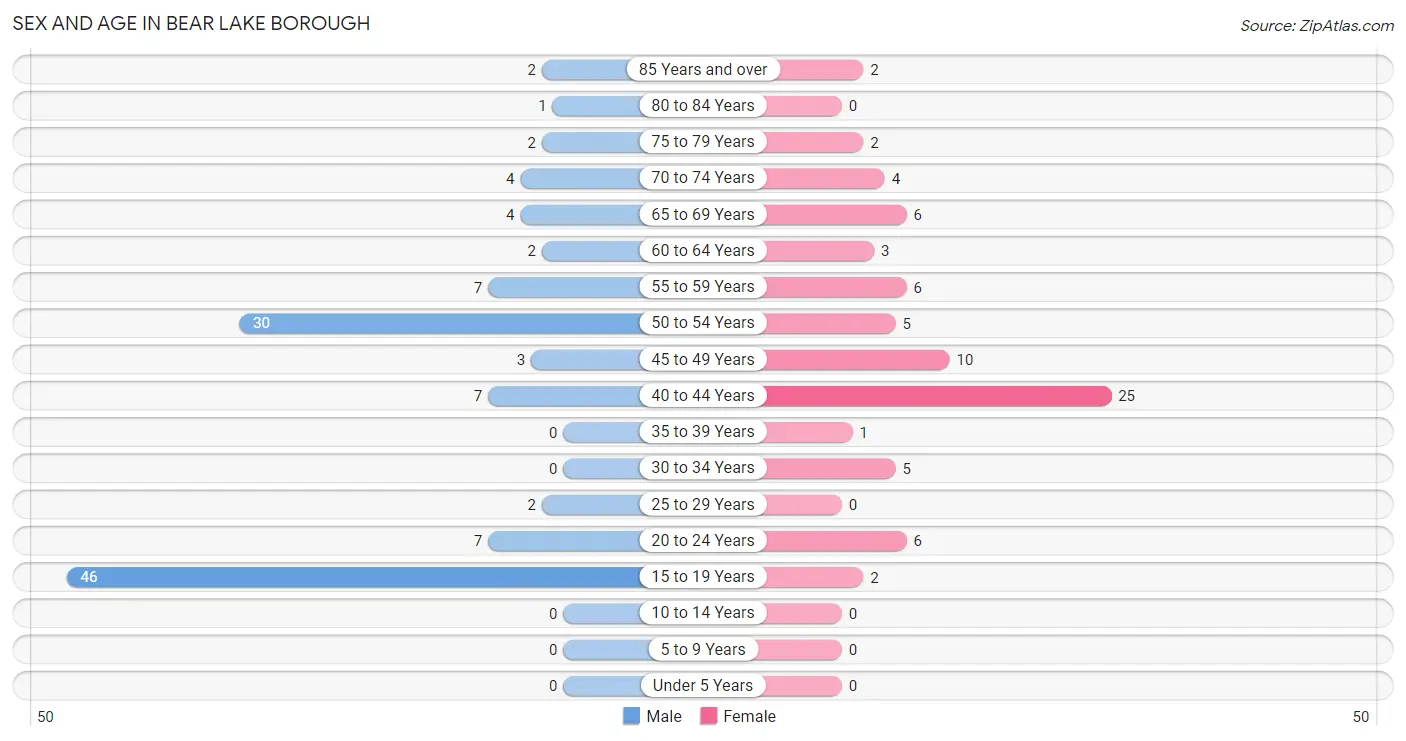
| Age Bracket | Male | Female |
| Under 5 Years | 0 (0.0%) | 0 (0.0%) |
| 5 to 9 Years | 0 (0.0%) | 0 (0.0%) |
| 10 to 14 Years | 0 (0.0%) | 0 (0.0%) |
| 15 to 19 Years | 46 (39.3%) | 2 (2.6%) |
| 20 to 24 Years | 7 (6.0%) | 6 (7.8%) |
| 25 to 29 Years | 2 (1.7%) | 0 (0.0%) |
| 30 to 34 Years | 0 (0.0%) | 5 (6.5%) |
| 35 to 39 Years | 0 (0.0%) | 1 (1.3%) |
| 40 to 44 Years | 7 (6.0%) | 25 (32.5%) |
| 45 to 49 Years | 3 (2.6%) | 10 (13.0%) |
| 50 to 54 Years | 30 (25.6%) | 5 (6.5%) |
| 55 to 59 Years | 7 (6.0%) | 6 (7.8%) |
| 60 to 64 Years | 2 (1.7%) | 3 (3.9%) |
| 65 to 69 Years | 4 (3.4%) | 6 (7.8%) |
| 70 to 74 Years | 4 (3.4%) | 4 (5.2%) |
| 75 to 79 Years | 2 (1.7%) | 2 (2.6%) |
| 80 to 84 Years | 1 (0.9%) | 0 (0.0%) |
| 85 Years and over | 2 (1.7%) | 2 (2.6%) |
| Total | 117 (100.0%) | 77 (100.0%) |
Families and Households in Bear Lake borough
Median Family Size in Bear Lake borough
The median family size in Bear Lake borough is 3.35 persons per family, with married-couple families (21 | 80.8%) accounting for the largest median family size of 3.38 persons per family. On the other hand, single male/father families (2 | 7.7%) represent the smallest median family size with 3.00 persons per family.
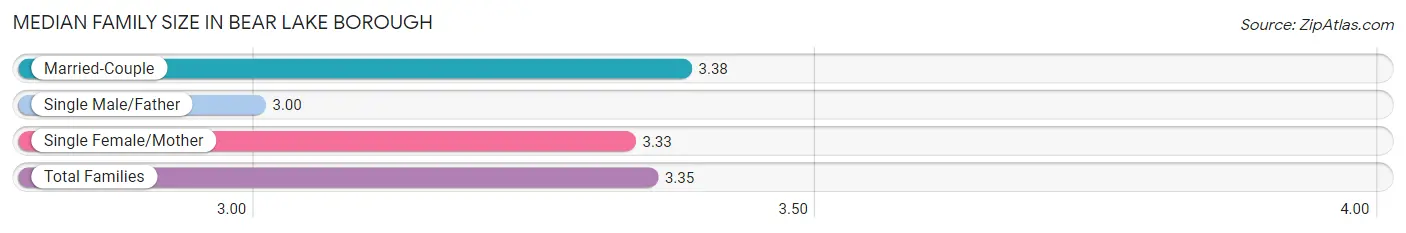
| Family Type | # Families | Family Size |
| Married-Couple | 21 (80.8%) | 3.38 |
| Single Male/Father | 2 (7.7%) | 3.00 |
| Single Female/Mother | 3 (11.5%) | 3.33 |
| Total Families | 26 (100.0%) | 3.35 |
Median Household Size in Bear Lake borough
The median household size in Bear Lake borough is 2.73 persons per household, with married-couple households (21 | 29.6%) accounting for the largest median household size of 3.62 persons per household. non-family households (45 | 63.4%) represent the smallest median household size with 2.27 persons per household.
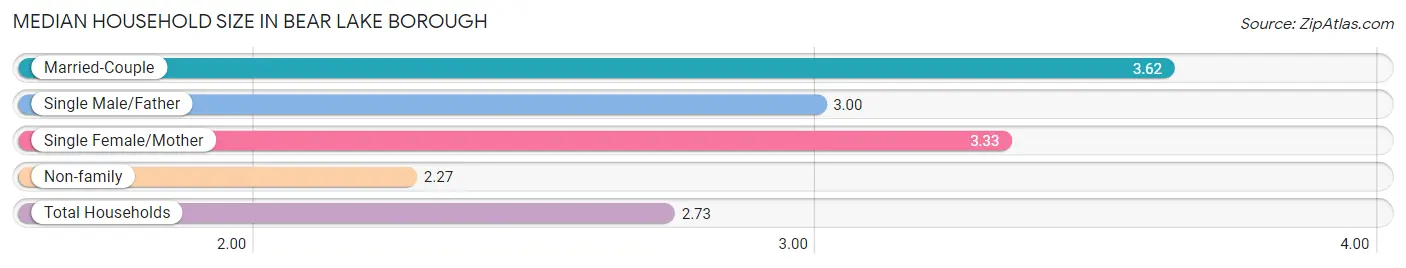
| Household Type | # Households | Household Size |
| Married-Couple | 21 (29.6%) | 3.62 |
| Single Male/Father | 2 (2.8%) | 3.00 |
| Single Female/Mother | 3 (4.2%) | 3.33 |
| Non-family | 45 (63.4%) | 2.27 |
| Total Households | 71 (100.0%) | 2.73 |
Household Size by Marriage Status in Bear Lake borough
Out of a total of 71 households in Bear Lake borough, 26 (36.6%) are family households, while 45 (63.4%) are nonfamily households. The most numerous type of family households are 2-person households, comprising 12, and the most common type of nonfamily households are 3-person households, comprising 27.
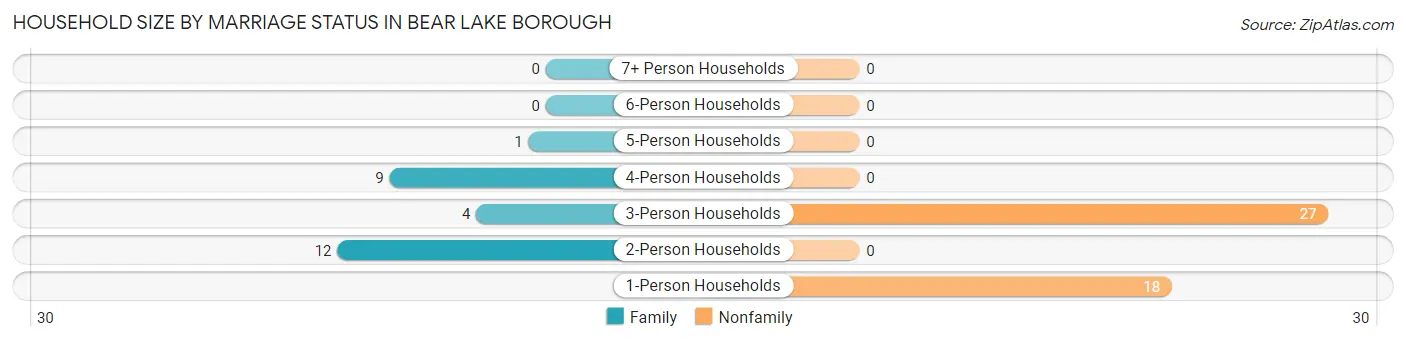
| Household Size | Family Households | Nonfamily Households |
| 1-Person Households | - | 18 (25.4%) |
| 2-Person Households | 12 (16.9%) | 0 (0.0%) |
| 3-Person Households | 4 (5.6%) | 27 (38.0%) |
| 4-Person Households | 9 (12.7%) | 0 (0.0%) |
| 5-Person Households | 1 (1.4%) | 0 (0.0%) |
| 6-Person Households | 0 (0.0%) | 0 (0.0%) |
| 7+ Person Households | 0 (0.0%) | 0 (0.0%) |
| Total | 26 (36.6%) | 45 (63.4%) |
Female Fertility in Bear Lake borough
Fertility by Age in Bear Lake borough
| Age Bracket | Women with Births | Births / 1,000 Women |
| 15 to 19 years | 0 (0.0%) | 0.0 |
| 20 to 34 years | 0 (0.0%) | 0.0 |
| 35 to 50 years | 0 (0.0%) | 0.0 |
| Total | 0 (0.0%) | 0.0 |
Fertility by Age by Marriage Status in Bear Lake borough
| Age Bracket | Married | Unmarried |
| 15 to 19 years | 0 (0.0%) | 0 (0.0%) |
| 20 to 34 years | 0 (0.0%) | 0 (0.0%) |
| 35 to 50 years | 0 (0.0%) | 0 (0.0%) |
| Total | 0 (0.0%) | 0 (0.0%) |
Fertility by Education in Bear Lake borough
| Educational Attainment | Women with Births | Births / 1,000 Women |
| Less than High School | 0 (0.0%) | 0.0 |
| High School Diploma | 0 (0.0%) | 0.0 |
| College or Associate's Degree | 0 (0.0%) | 0.0 |
| Bachelor's Degree | 0 (0.0%) | 0.0 |
| Graduate Degree | 0 (0.0%) | 0.0 |
| Total | 0 (0.0%) | 0.0 |
Fertility by Education by Marriage Status in Bear Lake borough
| Educational Attainment | Married | Unmarried |
| Less than High School | 0 (0.0%) | 0 (0.0%) |
| High School Diploma | 0 (0.0%) | 0 (0.0%) |
| College or Associate's Degree | 0 (0.0%) | 0 (0.0%) |
| Bachelor's Degree | 0 (0.0%) | 0 (0.0%) |
| Graduate Degree | 0 (0.0%) | 0 (0.0%) |
| Total | 0 (0.0%) | 0 (0.0%) |
Employment Characteristics in Bear Lake borough
Employment by Class of Employer in Bear Lake borough
Among the 92 employed individuals in Bear Lake borough, private company employees (55 | 59.8%), self-employed (not incorporated) (31 | 33.7%), and self-employed (incorporated) (5 | 5.4%) make up the most common classes of employment.
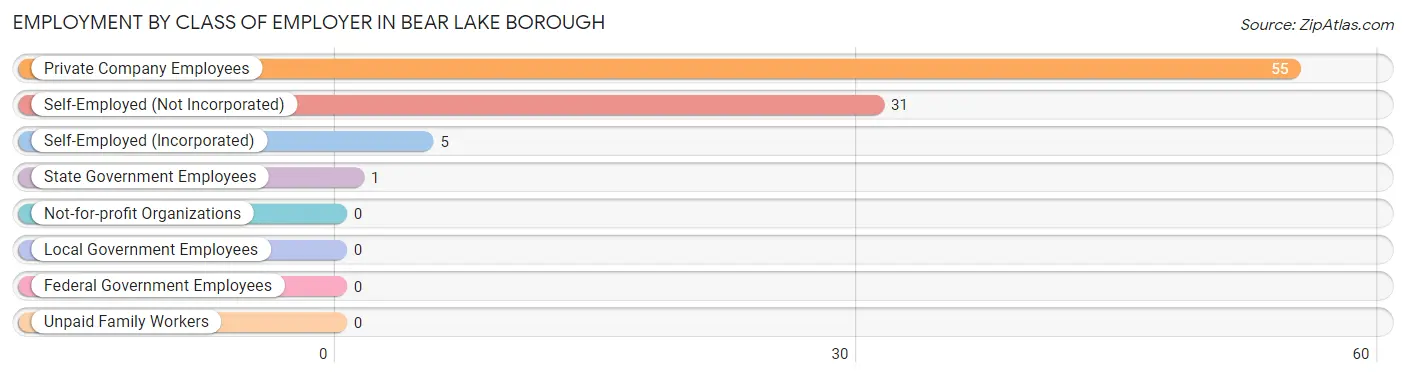
| Employer Class | # Employees | % Employees |
| Private Company Employees | 55 | 59.8% |
| Self-Employed (Incorporated) | 5 | 5.4% |
| Self-Employed (Not Incorporated) | 31 | 33.7% |
| Not-for-profit Organizations | 0 | 0.0% |
| Local Government Employees | 0 | 0.0% |
| State Government Employees | 1 | 1.1% |
| Federal Government Employees | 0 | 0.0% |
| Unpaid Family Workers | 0 | 0.0% |
| Total | 92 | 100.0% |
Employment Status by Age in Bear Lake borough
According to the labor force statistics for Bear Lake borough, out of the total population over 16 years of age (191), 56.0% or 107 individuals are in the labor force, with 14.0% or 15 of them unemployed. The age group with the highest labor force participation rate is 25 to 29 years, with 100.0% or 2 individuals in the labor force. Within the labor force, the 16 to 19 years age range has the highest percentage of unemployed individuals, with 100.0% or 8 of them being unemployed.
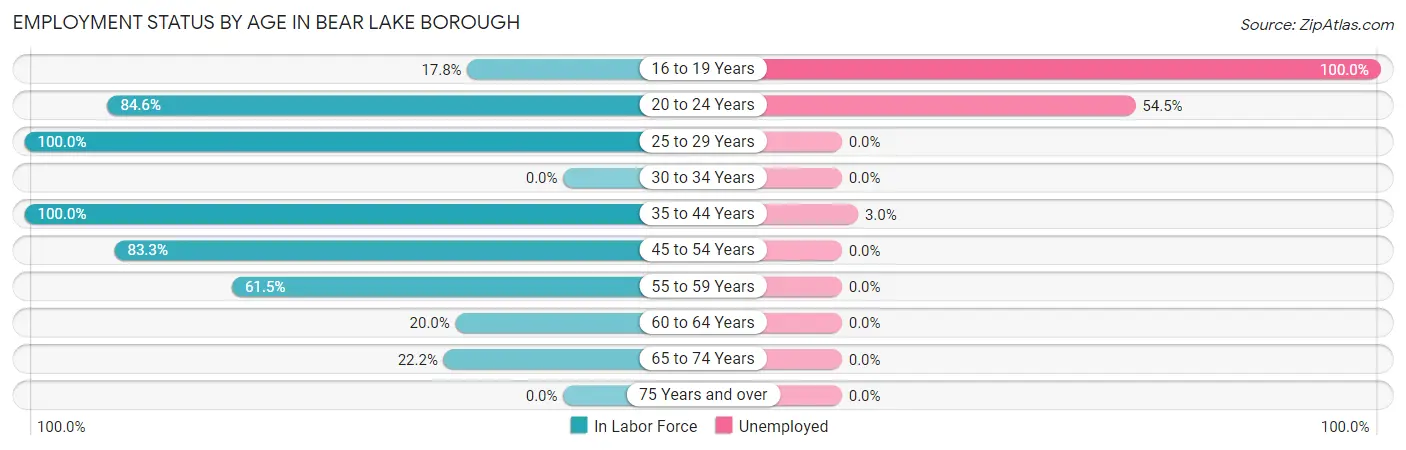
| Age Bracket | In Labor Force | Unemployed |
| 16 to 19 Years | 8 (17.8%) | 8 (100.0%) |
| 20 to 24 Years | 11 (84.6%) | 6 (54.5%) |
| 25 to 29 Years | 2 (100.0%) | 0 (0.0%) |
| 30 to 34 Years | 0 (0.0%) | 0 (0.0%) |
| 35 to 44 Years | 33 (100.0%) | 1 (3.0%) |
| 45 to 54 Years | 40 (83.3%) | 0 (0.0%) |
| 55 to 59 Years | 8 (61.5%) | 0 (0.0%) |
| 60 to 64 Years | 1 (20.0%) | 0 (0.0%) |
| 65 to 74 Years | 4 (22.2%) | 0 (0.0%) |
| 75 Years and over | 0 (0.0%) | 0 (0.0%) |
| Total | 107 (56.0%) | 15 (14.0%) |
Employment Status by Educational Attainment in Bear Lake borough
According to labor force statistics for Bear Lake borough, 79.2% of individuals (84) out of the total population between 25 and 64 years of age (106) are in the labor force, with 1.2% or 1 of them being unemployed. The group with the highest labor force participation rate are those with the educational attainment of college / associate degree, with 93.8% or 30 individuals in the labor force. Within the labor force, individuals with high school diploma education have the highest percentage of unemployment, with 5.3% or 1 of them being unemployed.
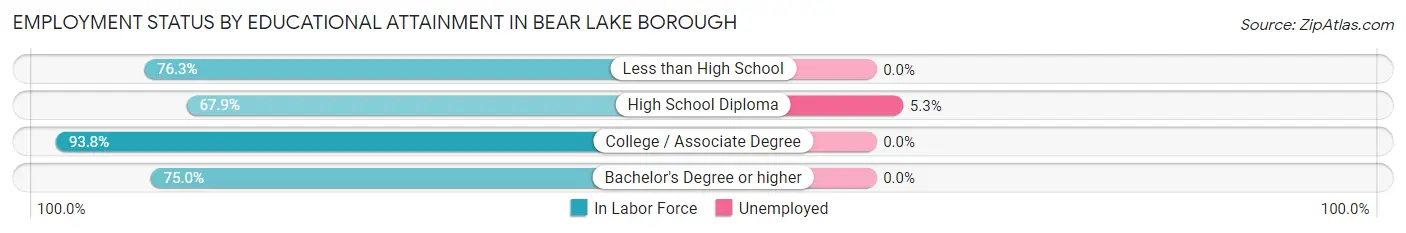
| Educational Attainment | In Labor Force | Unemployed |
| Less than High School | 29 (76.3%) | 0 (0.0%) |
| High School Diploma | 19 (67.9%) | 1 (5.3%) |
| College / Associate Degree | 30 (93.8%) | 0 (0.0%) |
| Bachelor's Degree or higher | 6 (75.0%) | 0 (0.0%) |
| Total | 84 (79.2%) | 1 (1.2%) |
Employment Occupations by Sex in Bear Lake borough
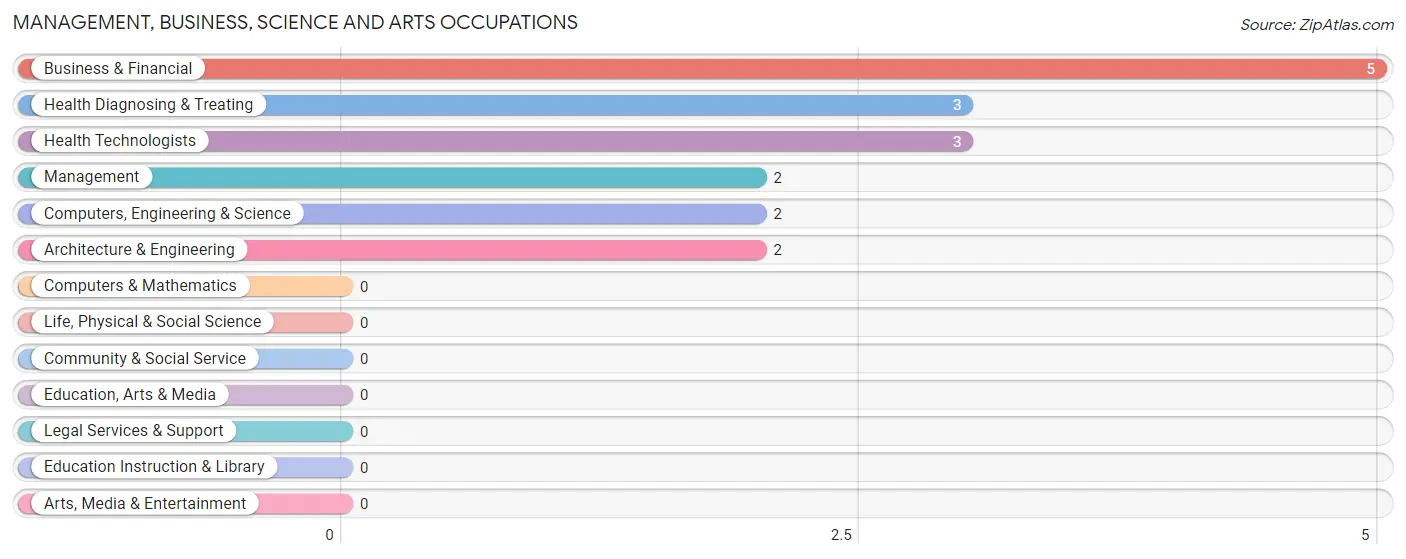
Management, Business, Science and Arts Occupations
The most common Management, Business, Science and Arts occupations in Bear Lake borough are Business & Financial (5 | 5.4%), Health Diagnosing & Treating (3 | 3.3%), Health Technologists (3 | 3.3%), Management (2 | 2.2%), and Computers, Engineering & Science (2 | 2.2%).
Management, Business, Science and Arts Occupations by Sex
Within the Management, Business, Science and Arts occupations in Bear Lake borough, the most male-oriented occupations are Management (100.0%), Business & Financial (100.0%), and Computers, Engineering & Science (100.0%), while the most female-oriented occupations are Health Diagnosing & Treating (100.0%), and Health Technologists (100.0%).
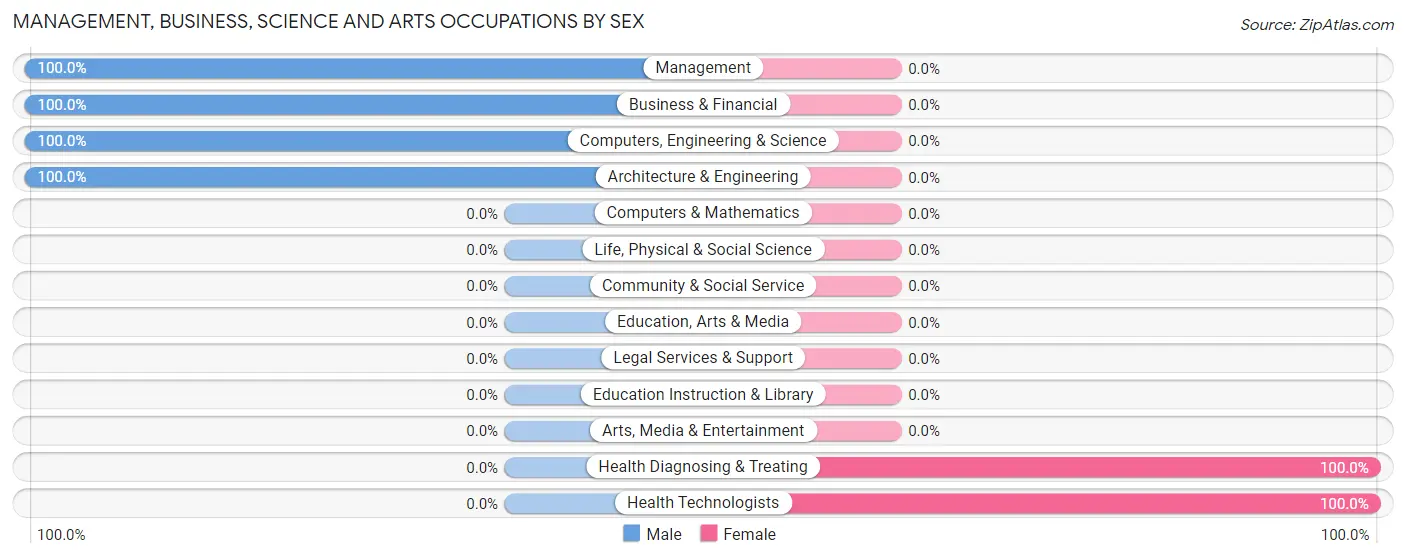
| Occupation | Male | Female |
| Management | 2 (100.0%) | 0 (0.0%) |
| Business & Financial | 5 (100.0%) | 0 (0.0%) |
| Computers, Engineering & Science | 2 (100.0%) | 0 (0.0%) |
| Computers & Mathematics | 0 (0.0%) | 0 (0.0%) |
| Architecture & Engineering | 2 (100.0%) | 0 (0.0%) |
| Life, Physical & Social Science | 0 (0.0%) | 0 (0.0%) |
| Community & Social Service | 0 (0.0%) | 0 (0.0%) |
| Education, Arts & Media | 0 (0.0%) | 0 (0.0%) |
| Legal Services & Support | 0 (0.0%) | 0 (0.0%) |
| Education Instruction & Library | 0 (0.0%) | 0 (0.0%) |
| Arts, Media & Entertainment | 0 (0.0%) | 0 (0.0%) |
| Health Diagnosing & Treating | 0 (0.0%) | 3 (100.0%) |
| Health Technologists | 0 (0.0%) | 3 (100.0%) |
| Total (Category) | 9 (75.0%) | 3 (25.0%) |
| Total (Overall) | 50 (54.3%) | 42 (45.7%) |
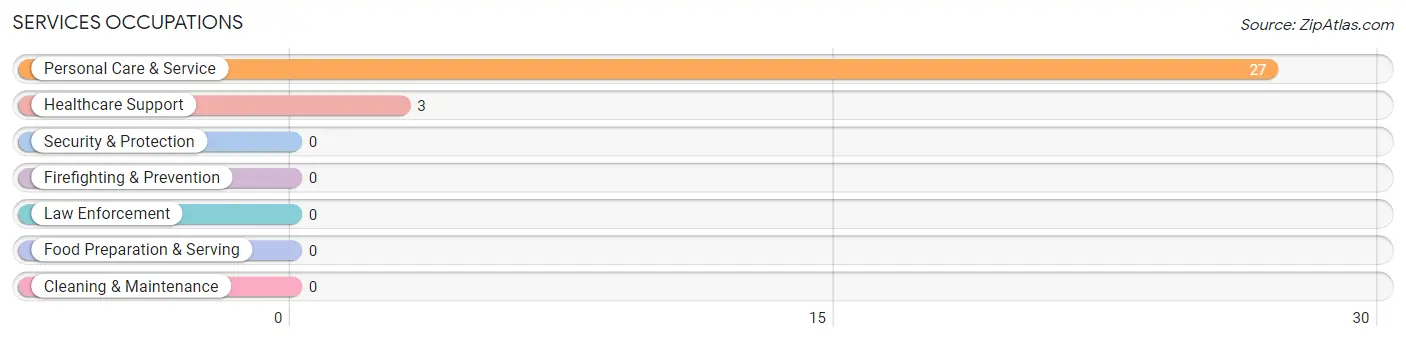
Services Occupations
The most common Services occupations in Bear Lake borough are Personal Care & Service (27 | 29.3%), and Healthcare Support (3 | 3.3%).
Services Occupations by Sex
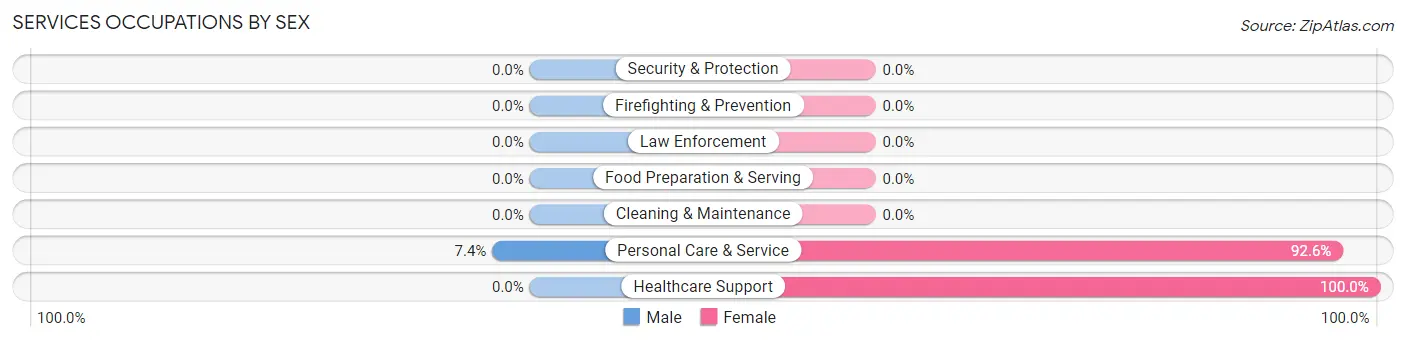
| Occupation | Male | Female |
| Healthcare Support | 0 (0.0%) | 3 (100.0%) |
| Security & Protection | 0 (0.0%) | 0 (0.0%) |
| Firefighting & Prevention | 0 (0.0%) | 0 (0.0%) |
| Law Enforcement | 0 (0.0%) | 0 (0.0%) |
| Food Preparation & Serving | 0 (0.0%) | 0 (0.0%) |
| Cleaning & Maintenance | 0 (0.0%) | 0 (0.0%) |
| Personal Care & Service | 2 (7.4%) | 25 (92.6%) |
| Total (Category) | 2 (6.7%) | 28 (93.3%) |
| Total (Overall) | 50 (54.3%) | 42 (45.7%) |
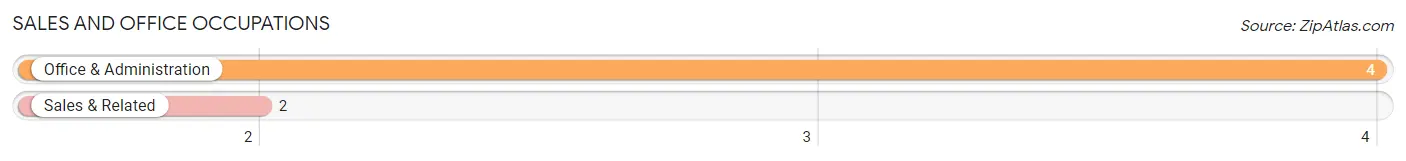
Sales and Office Occupations
The most common Sales and Office occupations in Bear Lake borough are Office & Administration (4 | 4.3%), and Sales & Related (2 | 2.2%).
Sales and Office Occupations by Sex
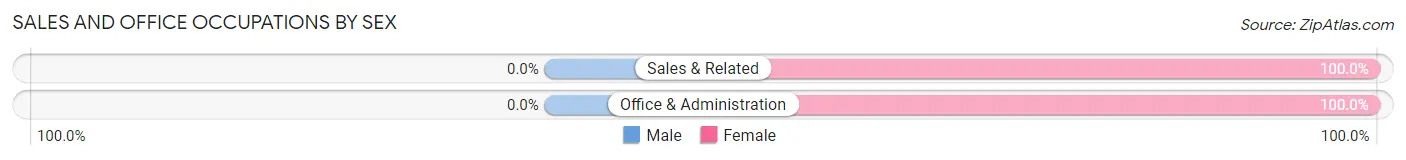
| Occupation | Male | Female |
| Sales & Related | 0 (0.0%) | 2 (100.0%) |
| Office & Administration | 0 (0.0%) | 4 (100.0%) |
| Total (Category) | 0 (0.0%) | 6 (100.0%) |
| Total (Overall) | 50 (54.3%) | 42 (45.7%) |
Natural Resources, Construction and Maintenance Occupations
The most common Natural Resources, Construction and Maintenance occupations in Bear Lake borough are Construction & Extraction (28 | 30.4%), and Installation, Maintenance & Repair (5 | 5.4%).
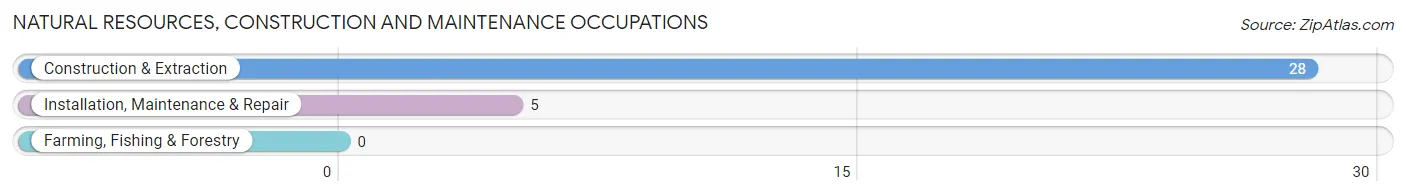
Natural Resources, Construction and Maintenance Occupations by Sex
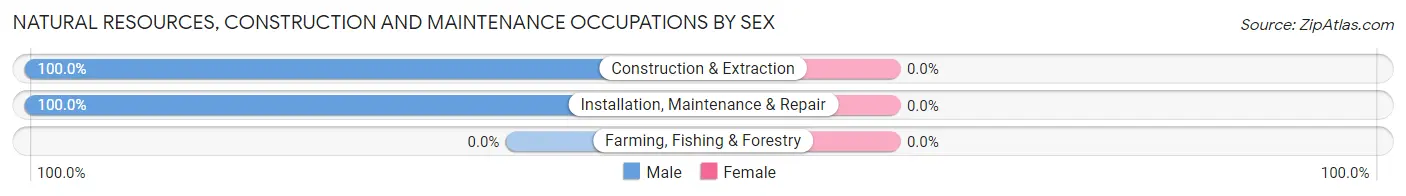
| Occupation | Male | Female |
| Farming, Fishing & Forestry | 0 (0.0%) | 0 (0.0%) |
| Construction & Extraction | 28 (100.0%) | 0 (0.0%) |
| Installation, Maintenance & Repair | 5 (100.0%) | 0 (0.0%) |
| Total (Category) | 33 (100.0%) | 0 (0.0%) |
| Total (Overall) | 50 (54.3%) | 42 (45.7%) |
Production, Transportation and Moving Occupations
The most common Production, Transportation and Moving occupations in Bear Lake borough are Transportation (7 | 7.6%), Production (2 | 2.2%), and Material Moving (2 | 2.2%).
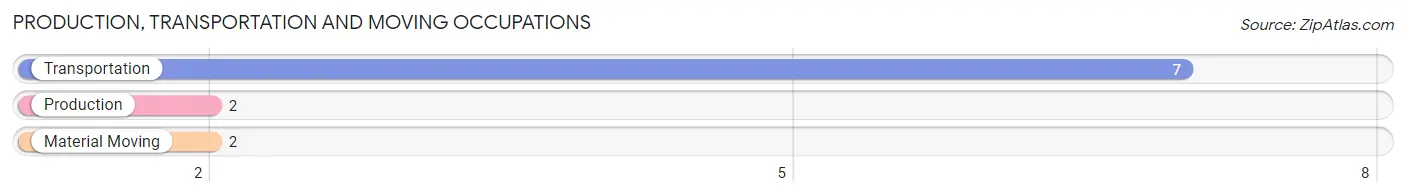
Production, Transportation and Moving Occupations by Sex
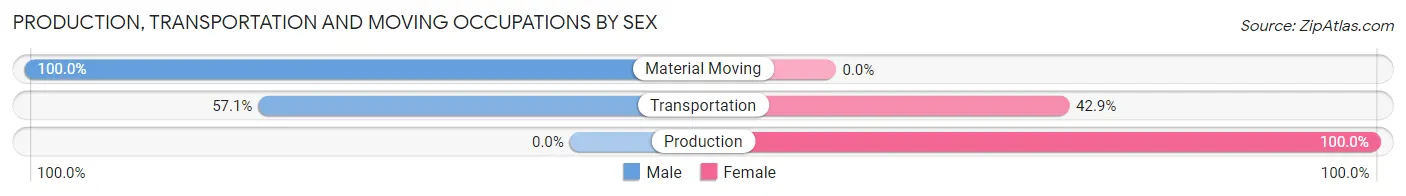
| Occupation | Male | Female |
| Production | 0 (0.0%) | 2 (100.0%) |
| Transportation | 4 (57.1%) | 3 (42.9%) |
| Material Moving | 2 (100.0%) | 0 (0.0%) |
| Total (Category) | 6 (54.5%) | 5 (45.5%) |
| Total (Overall) | 50 (54.3%) | 42 (45.7%) |
Employment Industries by Sex in Bear Lake borough
Employment Industries in Bear Lake borough
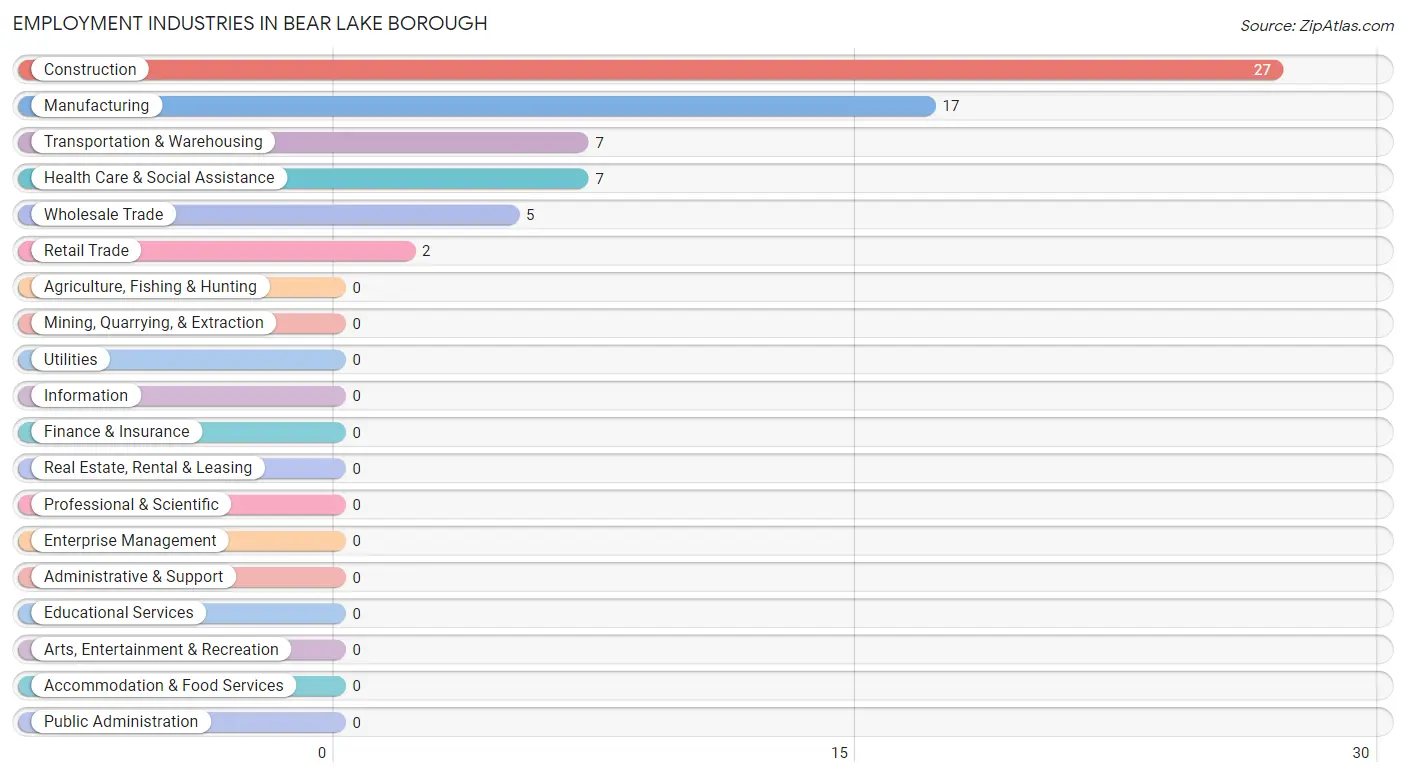
The major employment industries in Bear Lake borough include Construction (27 | 29.3%), Manufacturing (17 | 18.5%), Transportation & Warehousing (7 | 7.6%), Health Care & Social Assistance (7 | 7.6%), and Wholesale Trade (5 | 5.4%).
Employment Industries by Sex in Bear Lake borough
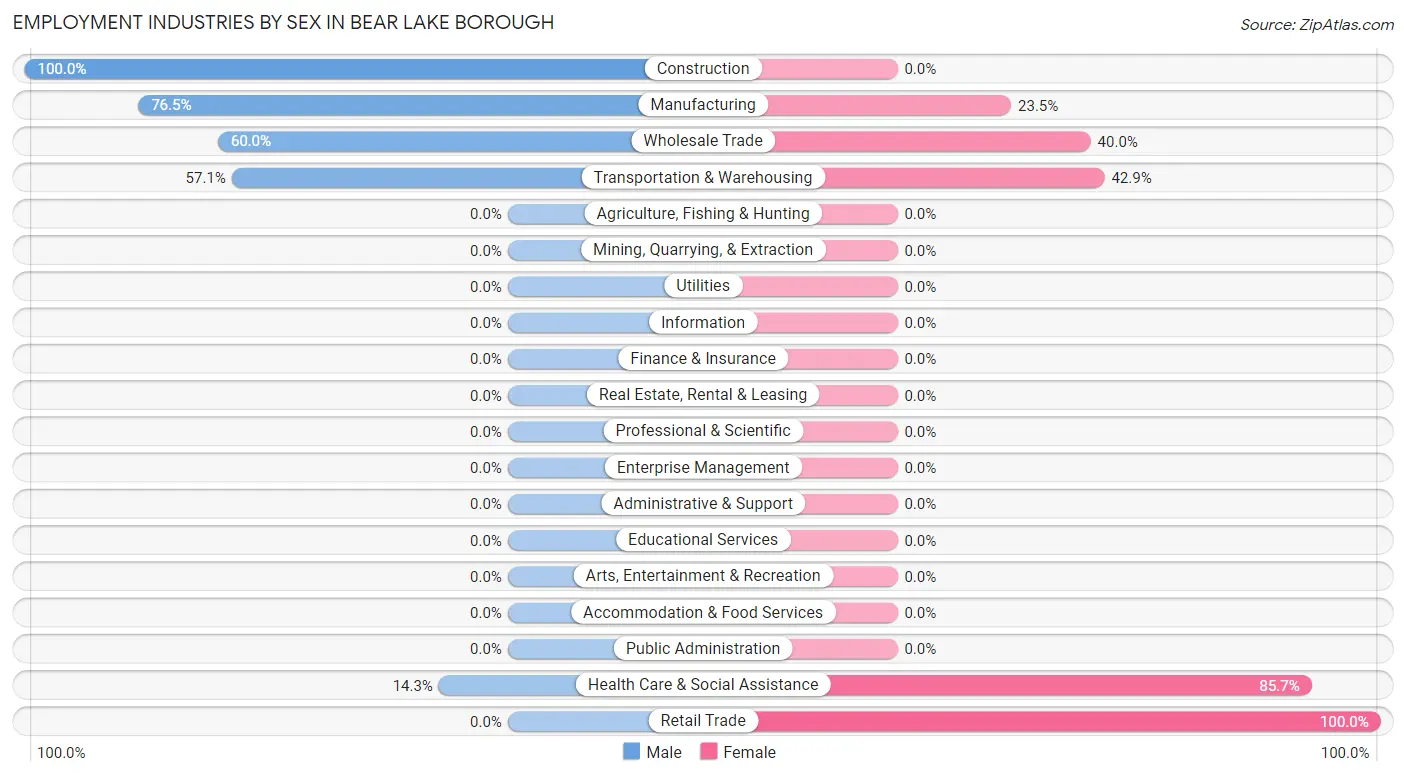
The Bear Lake borough industries that see more men than women are Construction (100.0%), Manufacturing (76.5%), and Wholesale Trade (60.0%), whereas the industries that tend to have a higher number of women are Retail Trade (100.0%), Health Care & Social Assistance (85.7%), and Transportation & Warehousing (42.9%).
| Industry | Male | Female |
| Agriculture, Fishing & Hunting | 0 (0.0%) | 0 (0.0%) |
| Mining, Quarrying, & Extraction | 0 (0.0%) | 0 (0.0%) |
| Construction | 27 (100.0%) | 0 (0.0%) |
| Manufacturing | 13 (76.5%) | 4 (23.5%) |
| Wholesale Trade | 3 (60.0%) | 2 (40.0%) |
| Retail Trade | 0 (0.0%) | 2 (100.0%) |
| Transportation & Warehousing | 4 (57.1%) | 3 (42.9%) |
| Utilities | 0 (0.0%) | 0 (0.0%) |
| Information | 0 (0.0%) | 0 (0.0%) |
| Finance & Insurance | 0 (0.0%) | 0 (0.0%) |
| Real Estate, Rental & Leasing | 0 (0.0%) | 0 (0.0%) |
| Professional & Scientific | 0 (0.0%) | 0 (0.0%) |
| Enterprise Management | 0 (0.0%) | 0 (0.0%) |
| Administrative & Support | 0 (0.0%) | 0 (0.0%) |
| Educational Services | 0 (0.0%) | 0 (0.0%) |
| Health Care & Social Assistance | 1 (14.3%) | 6 (85.7%) |
| Arts, Entertainment & Recreation | 0 (0.0%) | 0 (0.0%) |
| Accommodation & Food Services | 0 (0.0%) | 0 (0.0%) |
| Public Administration | 0 (0.0%) | 0 (0.0%) |
| Total | 50 (54.3%) | 42 (45.7%) |
Education in Bear Lake borough
School Enrollment in Bear Lake borough
| School Level | # Students | % Students |
| Nursery / Preschool | 0 | 0.0% |
| Kindergarten | 0 | 0.0% |
| Elementary School | 0 | 0.0% |
| Middle School | 0 | 0.0% |
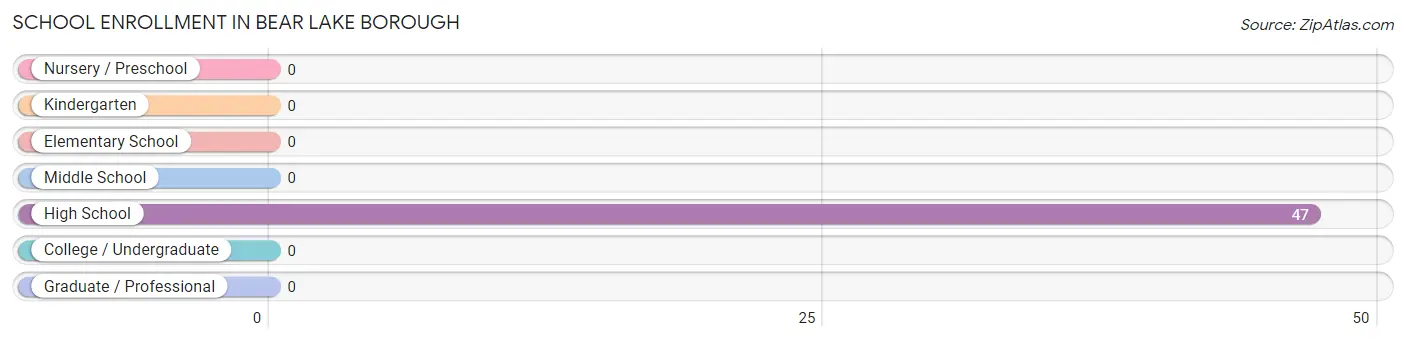
| High School | 47 | 100.0% |
| College / Undergraduate | 0 | 0.0% |
| Graduate / Professional | 0 | 0.0% |
| Total | 47 | 100.0% |
School Enrollment by Age by Funding Source in Bear Lake borough
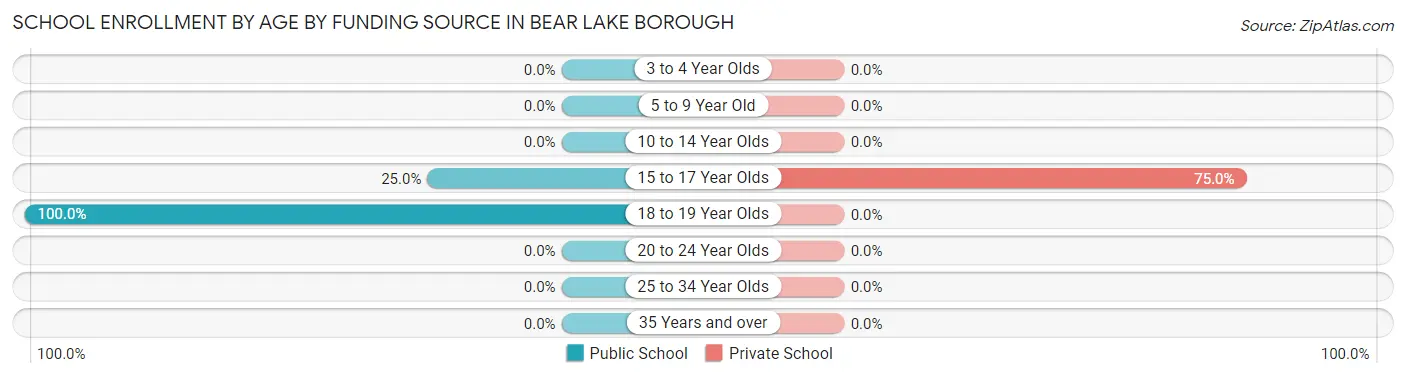
Out of a total of 47 students who are enrolled in schools in Bear Lake borough, 33 (70.2%) attend a private institution, while the remaining 14 (29.8%) are enrolled in public schools. The age group of 15 to 17 year olds has the highest likelihood of being enrolled in private schools, with 33 (75.0% in the age bracket) enrolled. Conversely, the age group of 18 to 19 year olds has the lowest likelihood of being enrolled in a private school, with 3 (100.0% in the age bracket) attending a public institution.
| Age Bracket | Public School | Private School |
| 3 to 4 Year Olds | 0 (0.0%) | 0 (0.0%) |
| 5 to 9 Year Old | 0 (0.0%) | 0 (0.0%) |
| 10 to 14 Year Olds | 0 (0.0%) | 0 (0.0%) |
| 15 to 17 Year Olds | 11 (25.0%) | 33 (75.0%) |
| 18 to 19 Year Olds | 3 (100.0%) | 0 (0.0%) |
| 20 to 24 Year Olds | 0 (0.0%) | 0 (0.0%) |
| 25 to 34 Year Olds | 0 (0.0%) | 0 (0.0%) |
| 35 Years and over | 0 (0.0%) | 0 (0.0%) |
| Total | 14 (29.8%) | 33 (70.2%) |
Educational Attainment by Field of Study in Bear Lake borough
Multidisciplinary studies (3 | 37.5%), computers & mathematics (2 | 25.0%), business (2 | 25.0%), and engineering (1 | 12.5%) are the most common fields of study among 8 individuals in Bear Lake borough who have obtained a bachelor's degree or higher.
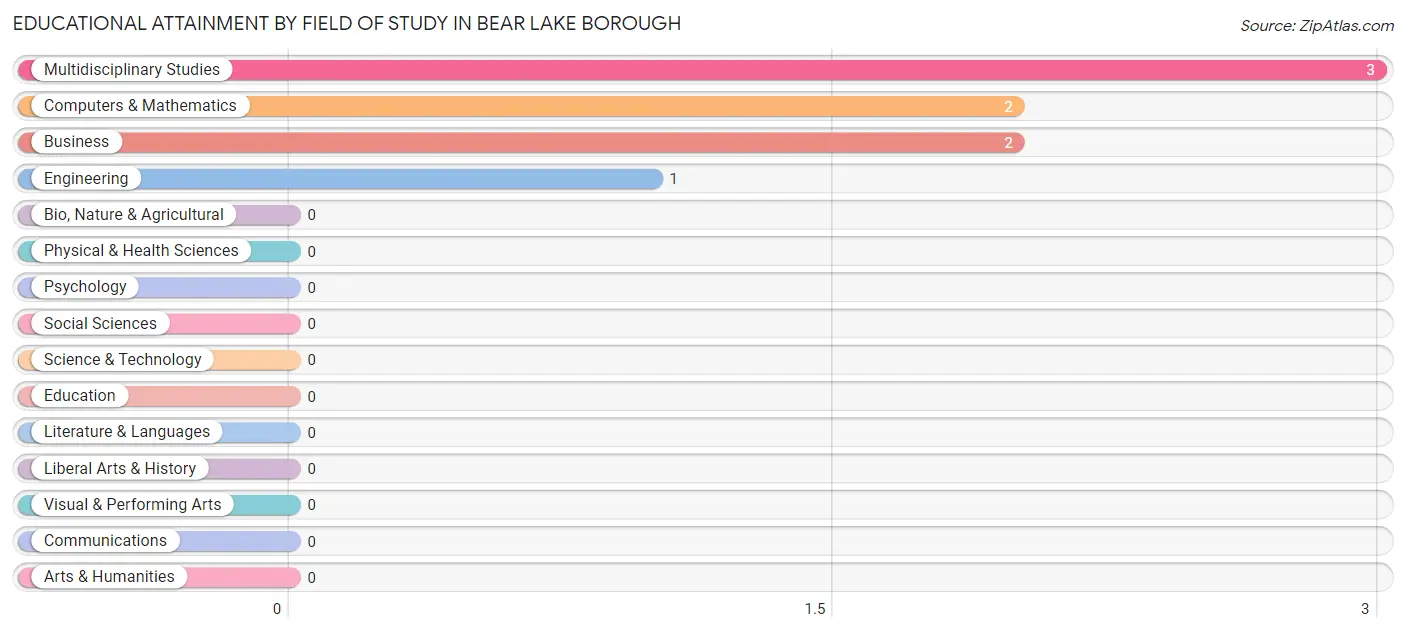
| Field of Study | # Graduates | % Graduates |
| Computers & Mathematics | 2 | 25.0% |
| Bio, Nature & Agricultural | 0 | 0.0% |
| Physical & Health Sciences | 0 | 0.0% |
| Psychology | 0 | 0.0% |
| Social Sciences | 0 | 0.0% |
| Engineering | 1 | 12.5% |
| Multidisciplinary Studies | 3 | 37.5% |
| Science & Technology | 0 | 0.0% |
| Business | 2 | 25.0% |
| Education | 0 | 0.0% |
| Literature & Languages | 0 | 0.0% |
| Liberal Arts & History | 0 | 0.0% |
| Visual & Performing Arts | 0 | 0.0% |
| Communications | 0 | 0.0% |
| Arts & Humanities | 0 | 0.0% |
| Total | 8 | 100.0% |
Transportation & Commute in Bear Lake borough
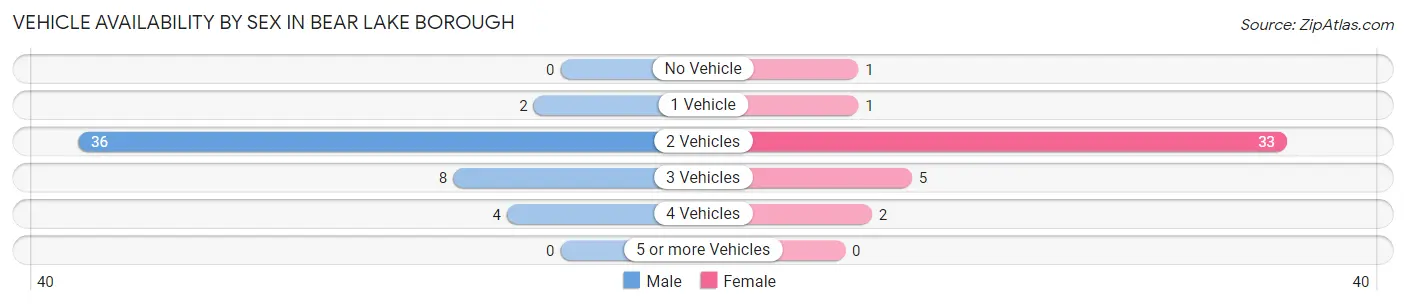
Vehicle Availability by Sex in Bear Lake borough
The most prevalent vehicle ownership categories in Bear Lake borough are males with 2 vehicles (36, accounting for 72.0%) and females with 2 vehicles (33, making up 85.7%).
| Vehicles Available | Male | Female |
| No Vehicle | 0 (0.0%) | 1 (2.4%) |
| 1 Vehicle | 2 (4.0%) | 1 (2.4%) |
| 2 Vehicles | 36 (72.0%) | 33 (78.6%) |
| 3 Vehicles | 8 (16.0%) | 5 (11.9%) |
| 4 Vehicles | 4 (8.0%) | 2 (4.8%) |
| 5 or more Vehicles | 0 (0.0%) | 0 (0.0%) |
| Total | 50 (100.0%) | 42 (100.0%) |
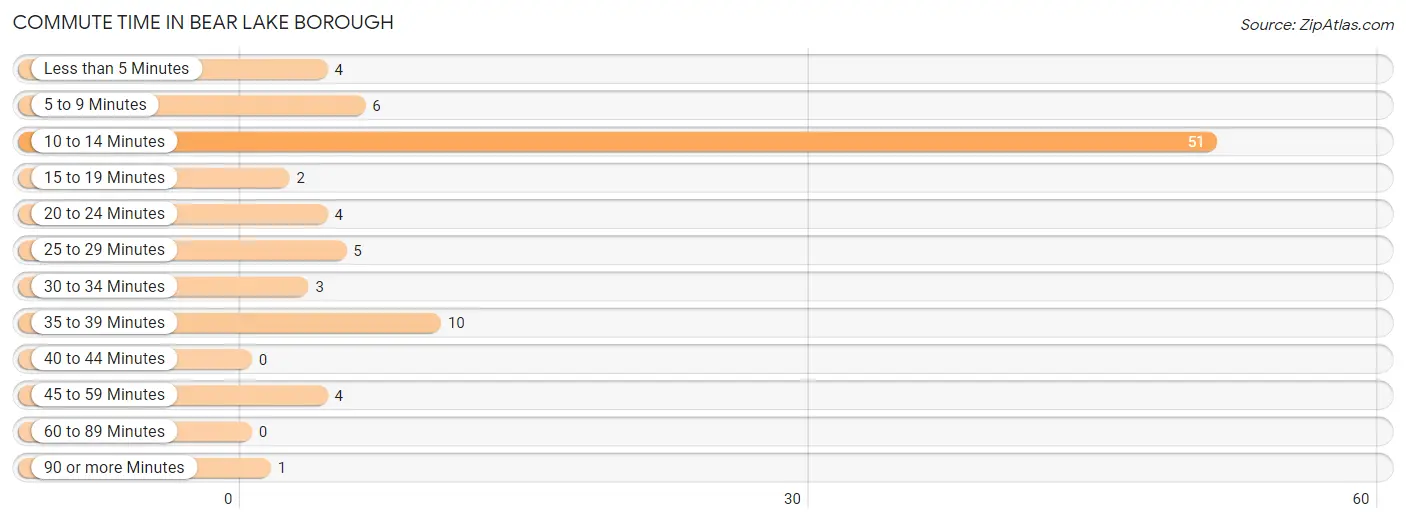
Commute Time in Bear Lake borough
The most frequently occuring commute durations in Bear Lake borough are 10 to 14 minutes (51 commuters, 56.7%), 35 to 39 minutes (10 commuters, 11.1%), and 5 to 9 minutes (6 commuters, 6.7%).
| Commute Time | # Commuters | % Commuters |
| Less than 5 Minutes | 4 | 4.4% |
| 5 to 9 Minutes | 6 | 6.7% |
| 10 to 14 Minutes | 51 | 56.7% |
| 15 to 19 Minutes | 2 | 2.2% |
| 20 to 24 Minutes | 4 | 4.4% |
| 25 to 29 Minutes | 5 | 5.6% |
| 30 to 34 Minutes | 3 | 3.3% |
| 35 to 39 Minutes | 10 | 11.1% |
| 40 to 44 Minutes | 0 | 0.0% |
| 45 to 59 Minutes | 4 | 4.4% |
| 60 to 89 Minutes | 0 | 0.0% |
| 90 or more Minutes | 1 | 1.1% |
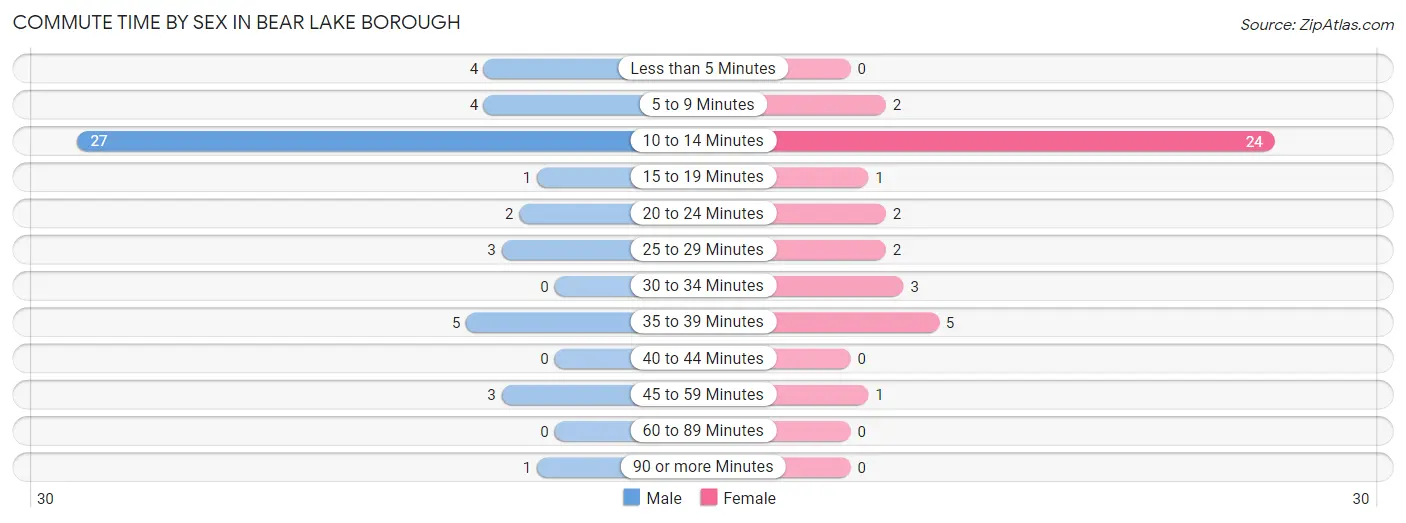
Commute Time by Sex in Bear Lake borough
The most common commute times in Bear Lake borough are 10 to 14 minutes (27 commuters, 54.0%) for males and 10 to 14 minutes (24 commuters, 60.0%) for females.
| Commute Time | Male | Female |
| Less than 5 Minutes | 4 (8.0%) | 0 (0.0%) |
| 5 to 9 Minutes | 4 (8.0%) | 2 (5.0%) |
| 10 to 14 Minutes | 27 (54.0%) | 24 (60.0%) |
| 15 to 19 Minutes | 1 (2.0%) | 1 (2.5%) |
| 20 to 24 Minutes | 2 (4.0%) | 2 (5.0%) |
| 25 to 29 Minutes | 3 (6.0%) | 2 (5.0%) |
| 30 to 34 Minutes | 0 (0.0%) | 3 (7.5%) |
| 35 to 39 Minutes | 5 (10.0%) | 5 (12.5%) |
| 40 to 44 Minutes | 0 (0.0%) | 0 (0.0%) |
| 45 to 59 Minutes | 3 (6.0%) | 1 (2.5%) |
| 60 to 89 Minutes | 0 (0.0%) | 0 (0.0%) |
| 90 or more Minutes | 1 (2.0%) | 0 (0.0%) |
Time of Departure to Work by Sex in Bear Lake borough
The most frequent times of departure to work in Bear Lake borough are 10:00 AM to 10:59 AM (27, 54.0%) for males and 6:30 AM to 6:59 AM (29, 72.5%) for females.
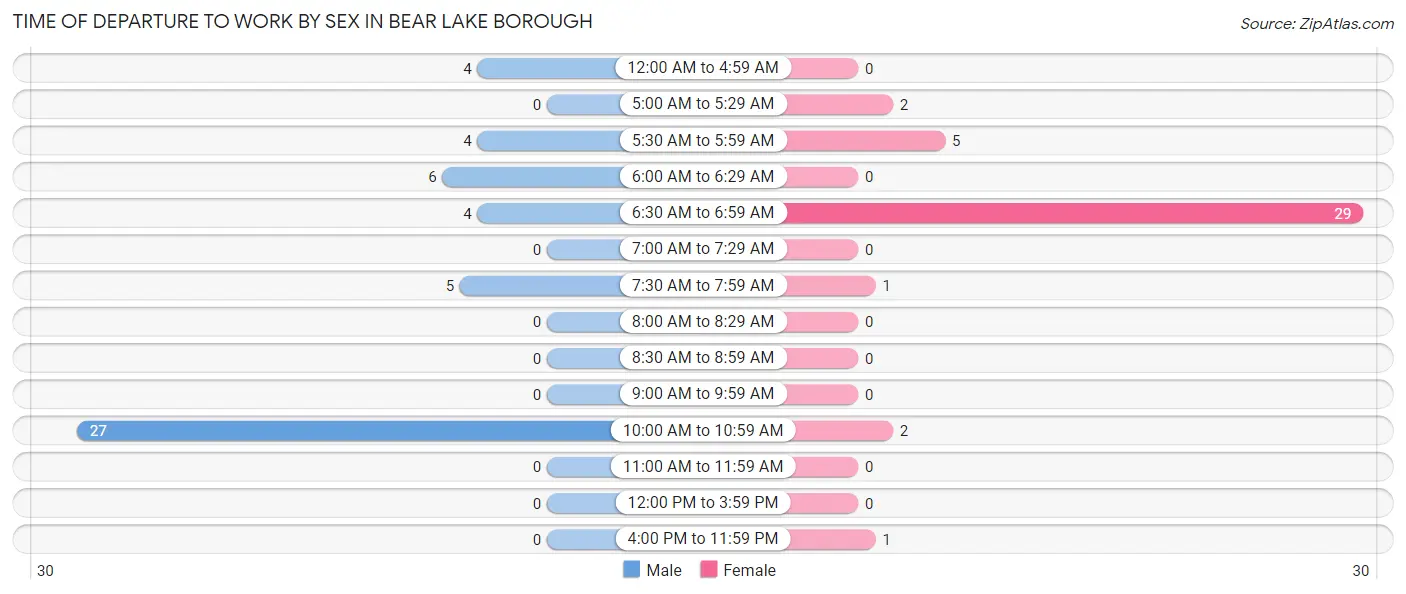
| Time of Departure | Male | Female |
| 12:00 AM to 4:59 AM | 4 (8.0%) | 0 (0.0%) |
| 5:00 AM to 5:29 AM | 0 (0.0%) | 2 (5.0%) |
| 5:30 AM to 5:59 AM | 4 (8.0%) | 5 (12.5%) |
| 6:00 AM to 6:29 AM | 6 (12.0%) | 0 (0.0%) |
| 6:30 AM to 6:59 AM | 4 (8.0%) | 29 (72.5%) |
| 7:00 AM to 7:29 AM | 0 (0.0%) | 0 (0.0%) |
| 7:30 AM to 7:59 AM | 5 (10.0%) | 1 (2.5%) |
| 8:00 AM to 8:29 AM | 0 (0.0%) | 0 (0.0%) |
| 8:30 AM to 8:59 AM | 0 (0.0%) | 0 (0.0%) |
| 9:00 AM to 9:59 AM | 0 (0.0%) | 0 (0.0%) |
| 10:00 AM to 10:59 AM | 27 (54.0%) | 2 (5.0%) |
| 11:00 AM to 11:59 AM | 0 (0.0%) | 0 (0.0%) |
| 12:00 PM to 3:59 PM | 0 (0.0%) | 0 (0.0%) |
| 4:00 PM to 11:59 PM | 0 (0.0%) | 1 (2.5%) |
| Total | 50 (100.0%) | 40 (100.0%) |
Housing Occupancy in Bear Lake borough
Occupancy by Ownership in Bear Lake borough
Of the total 71 dwellings in Bear Lake borough, owner-occupied units account for 60 (84.5%), while renter-occupied units make up 11 (15.5%).
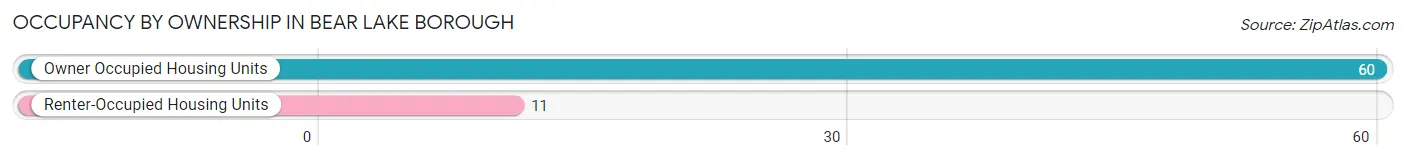
| Occupancy | # Housing Units | % Housing Units |
| Owner Occupied Housing Units | 60 | 84.5% |
| Renter-Occupied Housing Units | 11 | 15.5% |
| Total Occupied Housing Units | 71 | 100.0% |
Occupancy by Household Size in Bear Lake borough
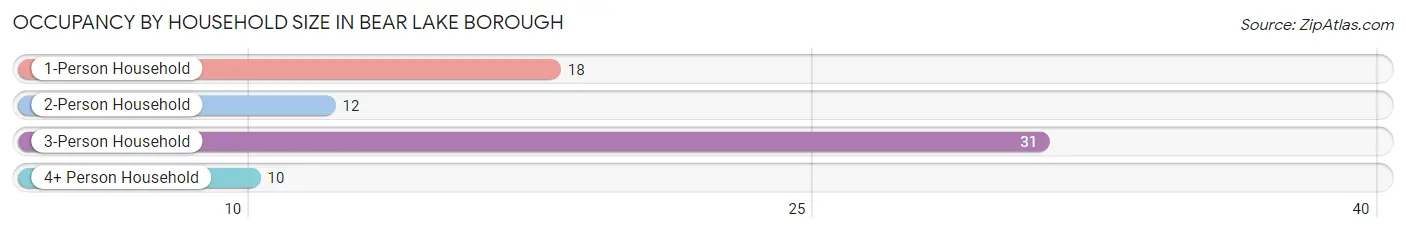
| Household Size | # Housing Units | % Housing Units |
| 1-Person Household | 18 | 25.4% |
| 2-Person Household | 12 | 16.9% |
| 3-Person Household | 31 | 43.7% |
| 4+ Person Household | 10 | 14.1% |
| Total Housing Units | 71 | 100.0% |
Occupancy by Ownership by Household Size in Bear Lake borough
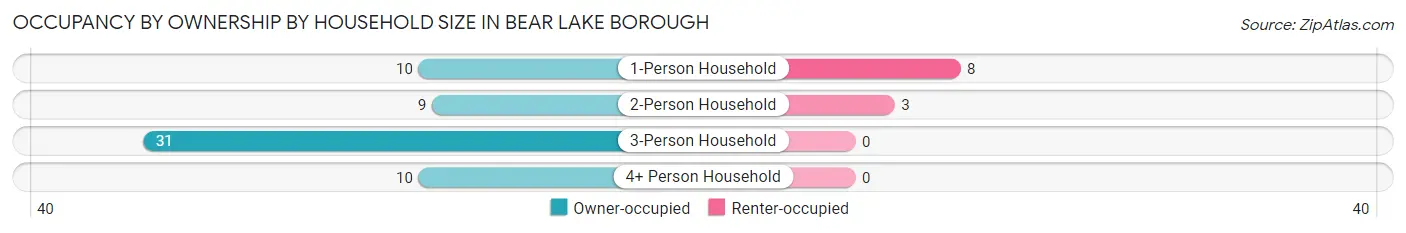
| Household Size | Owner-occupied | Renter-occupied |
| 1-Person Household | 10 (55.6%) | 8 (44.4%) |
| 2-Person Household | 9 (75.0%) | 3 (25.0%) |
| 3-Person Household | 31 (100.0%) | 0 (0.0%) |
| 4+ Person Household | 10 (100.0%) | 0 (0.0%) |
| Total Housing Units | 60 (84.5%) | 11 (15.5%) |
Occupancy by Educational Attainment in Bear Lake borough
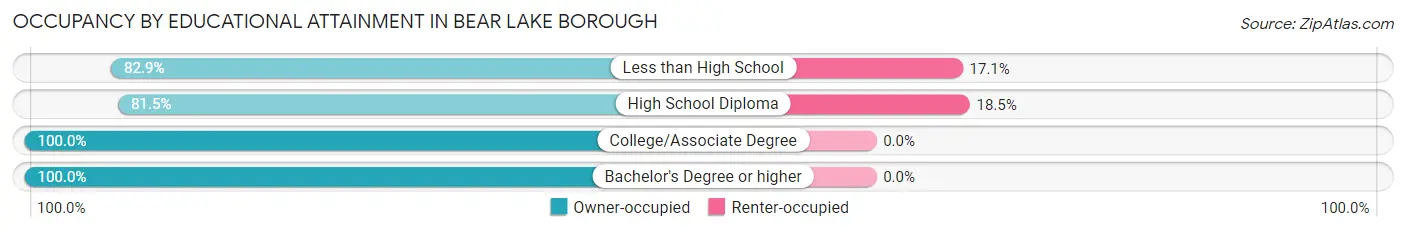
| Household Size | Owner-occupied | Renter-occupied |
| Less than High School | 29 (82.9%) | 6 (17.1%) |
| High School Diploma | 22 (81.5%) | 5 (18.5%) |
| College/Associate Degree | 6 (100.0%) | 0 (0.0%) |
| Bachelor's Degree or higher | 3 (100.0%) | 0 (0.0%) |
Occupancy by Age of Householder in Bear Lake borough
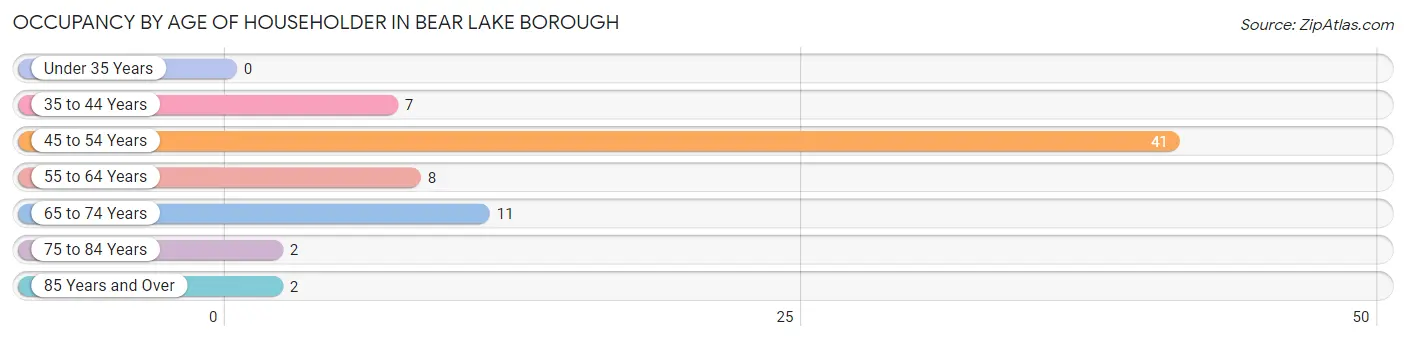
| Age Bracket | # Households | % Households |
| Under 35 Years | 0 | 0.0% |
| 35 to 44 Years | 7 | 9.9% |
| 45 to 54 Years | 41 | 57.8% |
| 55 to 64 Years | 8 | 11.3% |
| 65 to 74 Years | 11 | 15.5% |
| 75 to 84 Years | 2 | 2.8% |
| 85 Years and Over | 2 | 2.8% |
| Total | 71 | 100.0% |
Housing Finances in Bear Lake borough
Median Income by Occupancy in Bear Lake borough
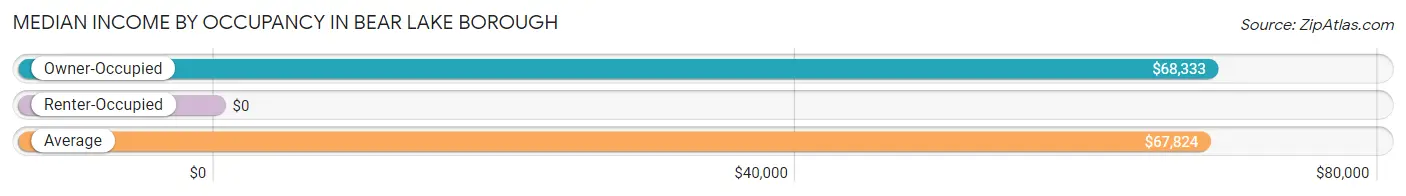
| Occupancy Type | # Households | Median Income |
| Owner-Occupied | 60 (84.5%) | $68,333 |
| Renter-Occupied | 11 (15.5%) | $0 |
| Average | 71 (100.0%) | $67,824 |
Occupancy by Householder Income Bracket in Bear Lake borough
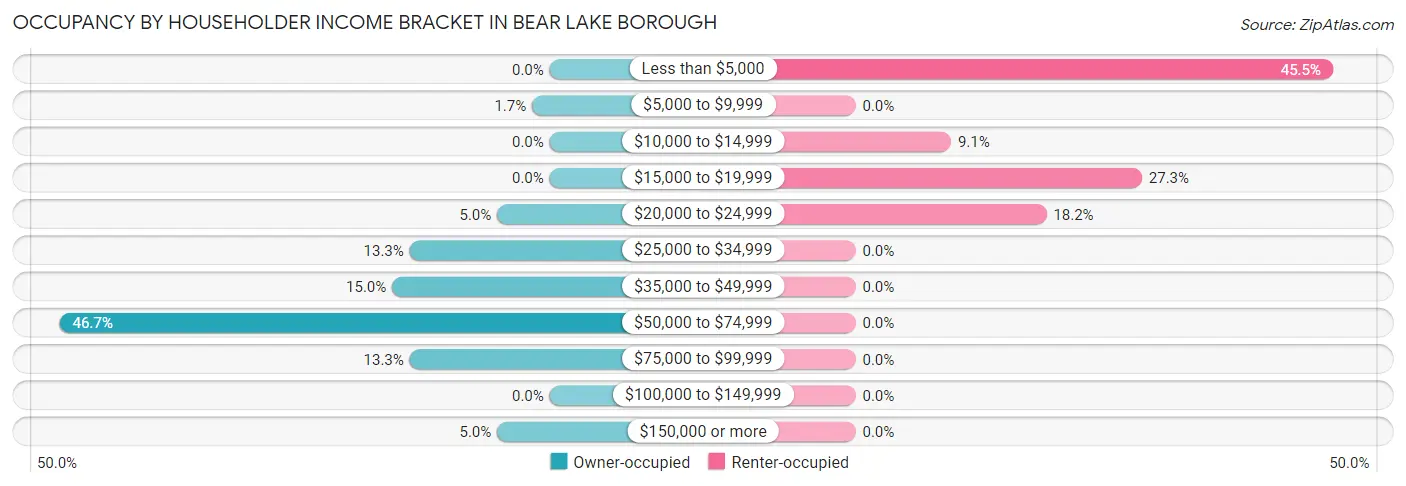
| Income Bracket | Owner-occupied | Renter-occupied |
| Less than $5,000 | 0 (0.0%) | 5 (45.5%) |
| $5,000 to $9,999 | 1 (1.7%) | 0 (0.0%) |
| $10,000 to $14,999 | 0 (0.0%) | 1 (9.1%) |
| $15,000 to $19,999 | 0 (0.0%) | 3 (27.3%) |
| $20,000 to $24,999 | 3 (5.0%) | 2 (18.2%) |
| $25,000 to $34,999 | 8 (13.3%) | 0 (0.0%) |
| $35,000 to $49,999 | 9 (15.0%) | 0 (0.0%) |
| $50,000 to $74,999 | 28 (46.7%) | 0 (0.0%) |
| $75,000 to $99,999 | 8 (13.3%) | 0 (0.0%) |
| $100,000 to $149,999 | 0 (0.0%) | 0 (0.0%) |
| $150,000 or more | 3 (5.0%) | 0 (0.0%) |
| Total | 60 (100.0%) | 11 (100.0%) |
Monthly Housing Cost Tiers in Bear Lake borough
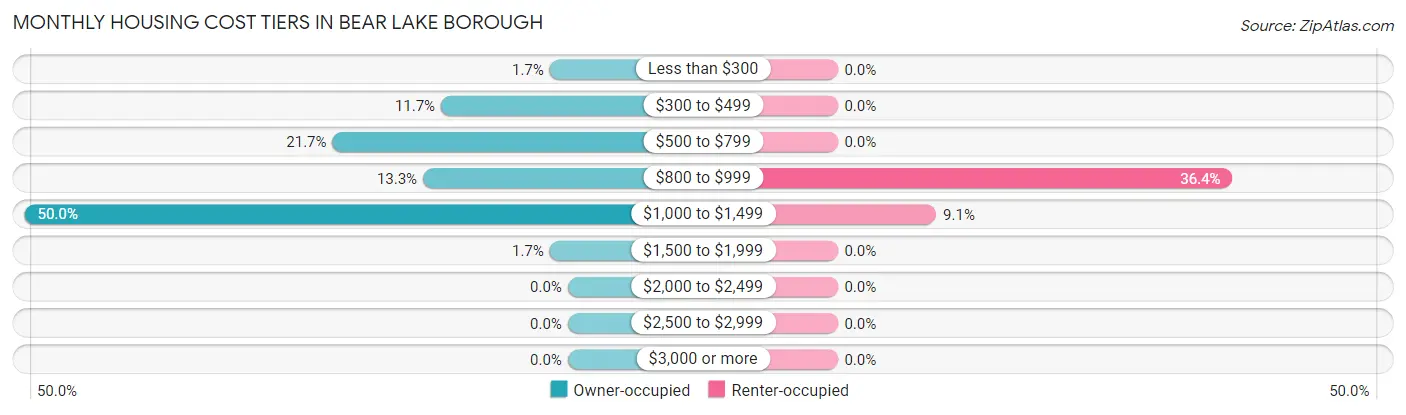
| Monthly Cost | Owner-occupied | Renter-occupied |
| Less than $300 | 1 (1.7%) | 0 (0.0%) |
| $300 to $499 | 7 (11.7%) | 0 (0.0%) |
| $500 to $799 | 13 (21.7%) | 0 (0.0%) |
| $800 to $999 | 8 (13.3%) | 4 (36.4%) |
| $1,000 to $1,499 | 30 (50.0%) | 1 (9.1%) |
| $1,500 to $1,999 | 1 (1.7%) | 0 (0.0%) |
| $2,000 to $2,499 | 0 (0.0%) | 0 (0.0%) |
| $2,500 to $2,999 | 0 (0.0%) | 0 (0.0%) |
| $3,000 or more | 0 (0.0%) | 0 (0.0%) |
| Total | 60 (100.0%) | 11 (100.0%) |
Physical Housing Characteristics in Bear Lake borough
Housing Structures in Bear Lake borough
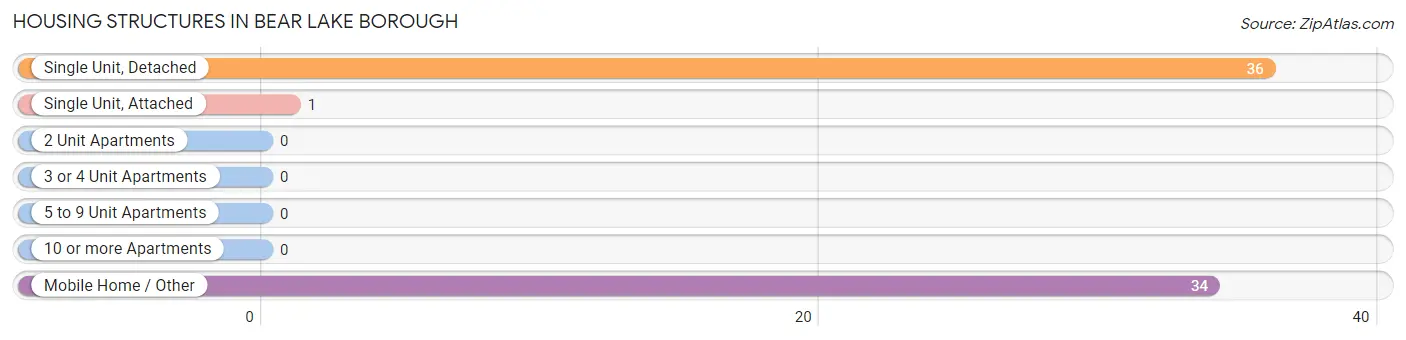
| Structure Type | # Housing Units | % Housing Units |
| Single Unit, Detached | 36 | 50.7% |
| Single Unit, Attached | 1 | 1.4% |
| 2 Unit Apartments | 0 | 0.0% |
| 3 or 4 Unit Apartments | 0 | 0.0% |
| 5 to 9 Unit Apartments | 0 | 0.0% |
| 10 or more Apartments | 0 | 0.0% |
| Mobile Home / Other | 34 | 47.9% |
| Total | 71 | 100.0% |
Housing Structures by Occupancy in Bear Lake borough
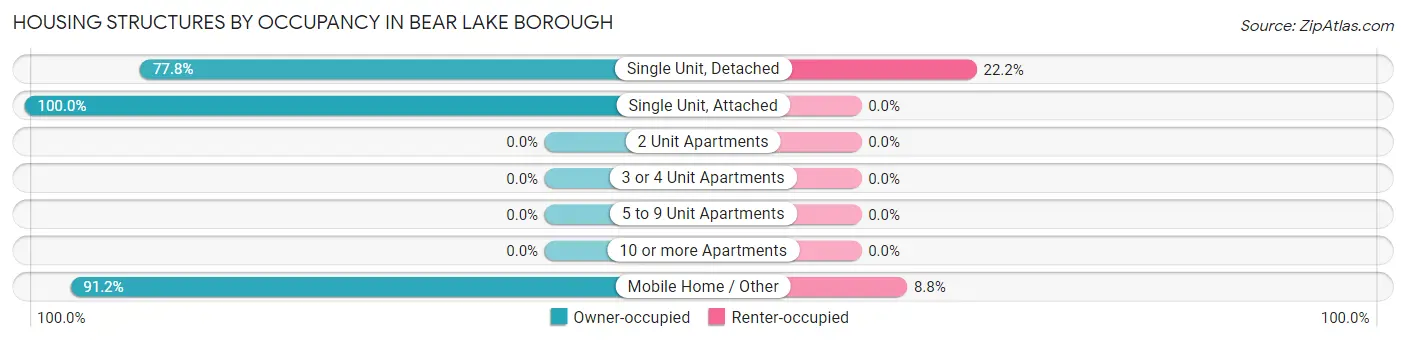
| Structure Type | Owner-occupied | Renter-occupied |
| Single Unit, Detached | 28 (77.8%) | 8 (22.2%) |
| Single Unit, Attached | 1 (100.0%) | 0 (0.0%) |
| 2 Unit Apartments | 0 (0.0%) | 0 (0.0%) |
| 3 or 4 Unit Apartments | 0 (0.0%) | 0 (0.0%) |
| 5 to 9 Unit Apartments | 0 (0.0%) | 0 (0.0%) |
| 10 or more Apartments | 0 (0.0%) | 0 (0.0%) |
| Mobile Home / Other | 31 (91.2%) | 3 (8.8%) |
| Total | 60 (84.5%) | 11 (15.5%) |
Housing Structures by Number of Rooms in Bear Lake borough
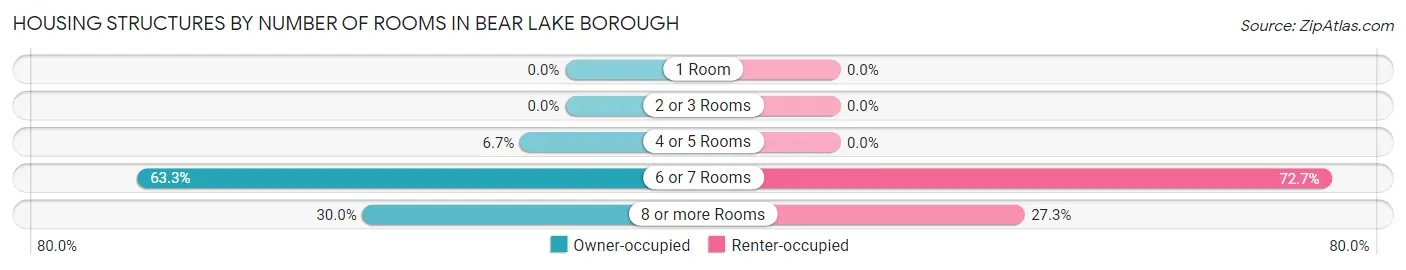
| Number of Rooms | Owner-occupied | Renter-occupied |
| 1 Room | 0 (0.0%) | 0 (0.0%) |
| 2 or 3 Rooms | 0 (0.0%) | 0 (0.0%) |
| 4 or 5 Rooms | 4 (6.7%) | 0 (0.0%) |
| 6 or 7 Rooms | 38 (63.3%) | 8 (72.7%) |
| 8 or more Rooms | 18 (30.0%) | 3 (27.3%) |
| Total | 60 (100.0%) | 11 (100.0%) |
Housing Structure by Heating Type in Bear Lake borough
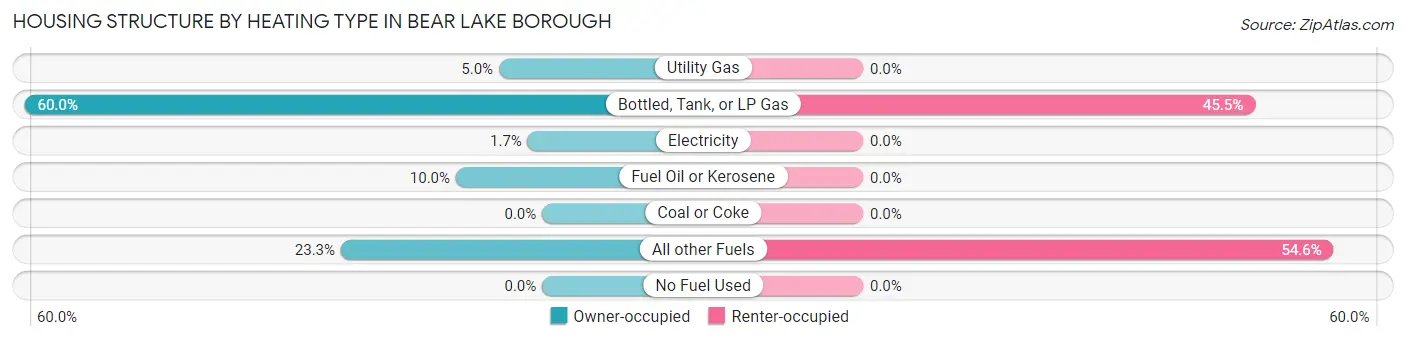
| Heating Type | Owner-occupied | Renter-occupied |
| Utility Gas | 3 (5.0%) | 0 (0.0%) |
| Bottled, Tank, or LP Gas | 36 (60.0%) | 5 (45.5%) |
| Electricity | 1 (1.7%) | 0 (0.0%) |
| Fuel Oil or Kerosene | 6 (10.0%) | 0 (0.0%) |
| Coal or Coke | 0 (0.0%) | 0 (0.0%) |
| All other Fuels | 14 (23.3%) | 6 (54.5%) |
| No Fuel Used | 0 (0.0%) | 0 (0.0%) |
| Total | 60 (100.0%) | 11 (100.0%) |
Household Vehicle Usage in Bear Lake borough
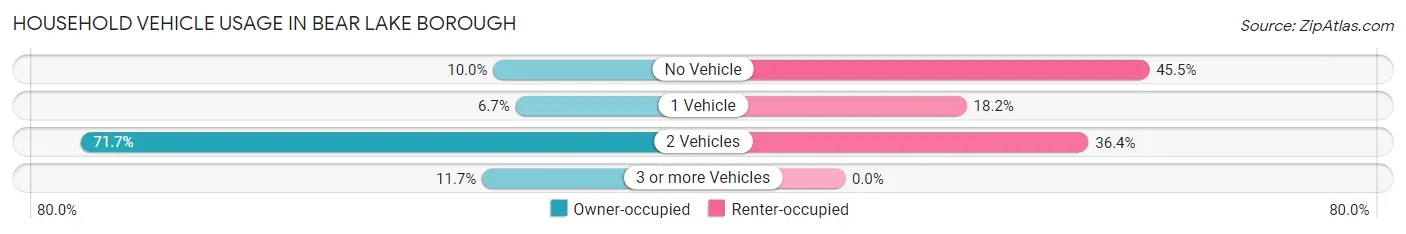
| Vehicles per Household | Owner-occupied | Renter-occupied |
| No Vehicle | 6 (10.0%) | 5 (45.5%) |
| 1 Vehicle | 4 (6.7%) | 2 (18.2%) |
| 2 Vehicles | 43 (71.7%) | 4 (36.4%) |
| 3 or more Vehicles | 7 (11.7%) | 0 (0.0%) |
| Total | 60 (100.0%) | 11 (100.0%) |
Real Estate & Mortgages in Bear Lake borough
Real Estate and Mortgage Overview in Bear Lake borough
| Characteristic | Without Mortgage | With Mortgage |
| Housing Units | 43 | 17 |
| Median Property Value | $109,400 | $69,000 |
| Median Household Income | $68,287 | $3 |
| Monthly Housing Costs | $1,320 | $0 |
| Real Estate Taxes | $2,306 | $0 |
Property Value by Mortgage Status in Bear Lake borough
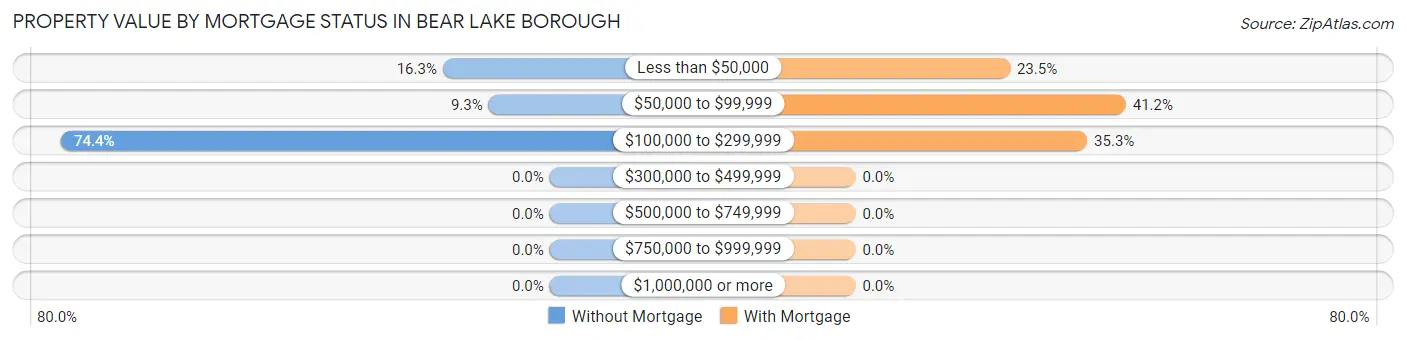
| Property Value | Without Mortgage | With Mortgage |
| Less than $50,000 | 7 (16.3%) | 4 (23.5%) |
| $50,000 to $99,999 | 4 (9.3%) | 7 (41.2%) |
| $100,000 to $299,999 | 32 (74.4%) | 6 (35.3%) |
| $300,000 to $499,999 | 0 (0.0%) | 0 (0.0%) |
| $500,000 to $749,999 | 0 (0.0%) | 0 (0.0%) |
| $750,000 to $999,999 | 0 (0.0%) | 0 (0.0%) |
| $1,000,000 or more | 0 (0.0%) | 0 (0.0%) |
| Total | 43 (100.0%) | 17 (100.0%) |
Household Income by Mortgage Status in Bear Lake borough
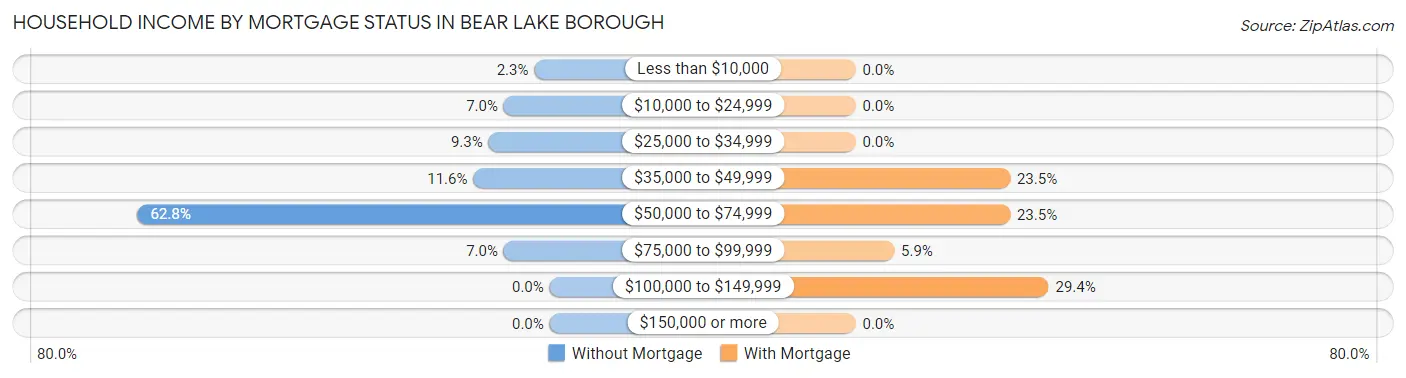
| Household Income | Without Mortgage | With Mortgage |
| Less than $10,000 | 1 (2.3%) | 0 (0.0%) |
| $10,000 to $24,999 | 3 (7.0%) | 0 (0.0%) |
| $25,000 to $34,999 | 4 (9.3%) | 0 (0.0%) |
| $35,000 to $49,999 | 5 (11.6%) | 4 (23.5%) |
| $50,000 to $74,999 | 27 (62.8%) | 4 (23.5%) |
| $75,000 to $99,999 | 3 (7.0%) | 1 (5.9%) |
| $100,000 to $149,999 | 0 (0.0%) | 5 (29.4%) |
| $150,000 or more | 0 (0.0%) | 0 (0.0%) |
| Total | 43 (100.0%) | 17 (100.0%) |
Property Value to Household Income Ratio in Bear Lake borough
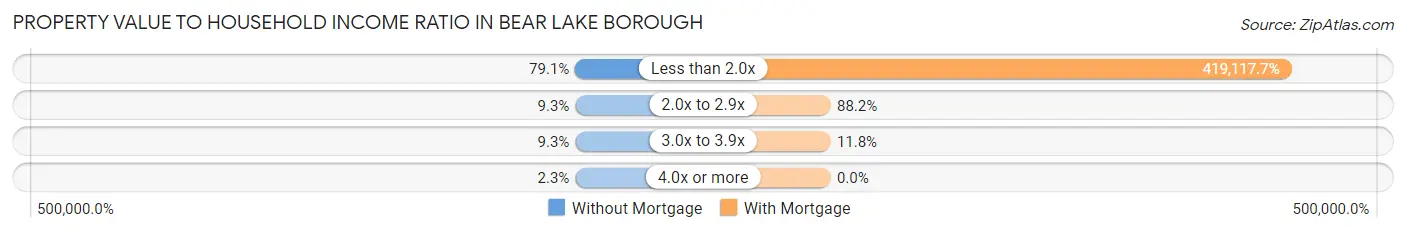
| Value-to-Income Ratio | Without Mortgage | With Mortgage |
| Less than 2.0x | 34 (79.1%) | 71,250 (419,117.6%) |
| 2.0x to 2.9x | 4 (9.3%) | 15 (88.2%) |
| 3.0x to 3.9x | 4 (9.3%) | 2 (11.8%) |
| 4.0x or more | 1 (2.3%) | 0 (0.0%) |
| Total | 43 (100.0%) | 17 (100.0%) |
Real Estate Taxes by Mortgage Status in Bear Lake borough
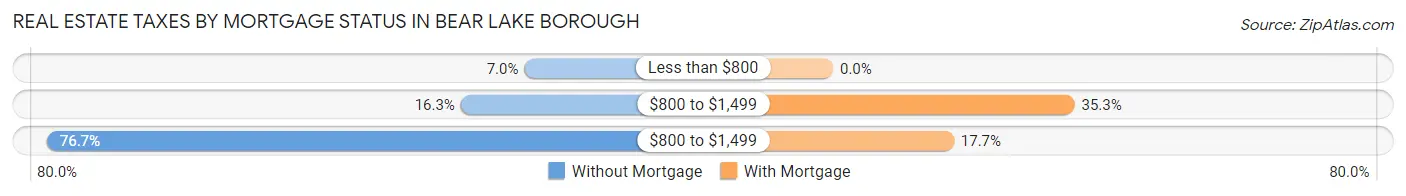
| Property Taxes | Without Mortgage | With Mortgage |
| Less than $800 | 3 (7.0%) | 0 (0.0%) |
| $800 to $1,499 | 7 (16.3%) | 6 (35.3%) |
| $800 to $1,499 | 33 (76.7%) | 3 (17.6%) |
| Total | 43 (100.0%) | 17 (100.0%) |
Health & Disability in Bear Lake borough
Health Insurance Coverage by Age in Bear Lake borough
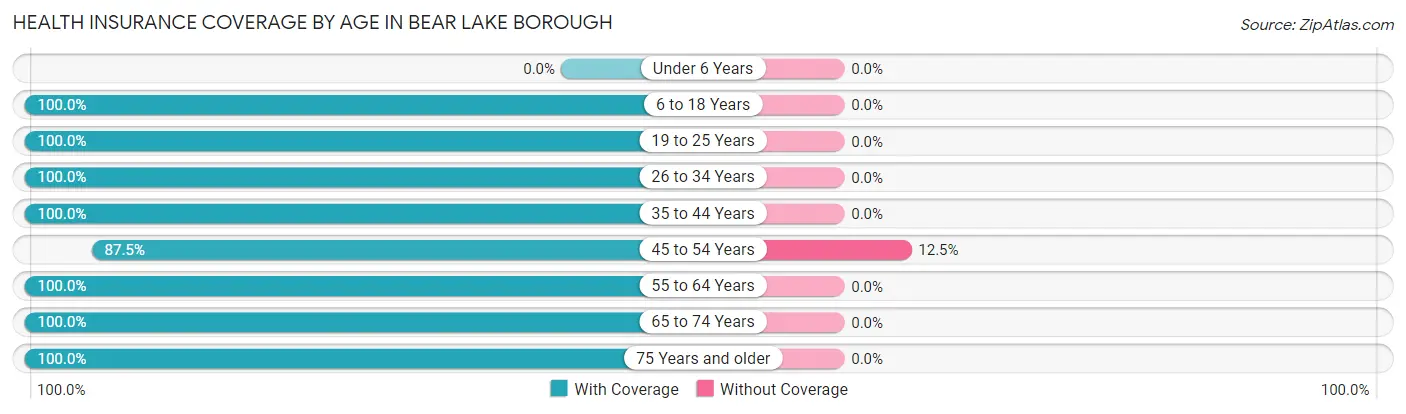
| Age Bracket | With Coverage | Without Coverage |
| Under 6 Years | 0 (0.0%) | 0 (0.0%) |
| 6 to 18 Years | 48 (100.0%) | 0 (0.0%) |
| 19 to 25 Years | 13 (100.0%) | 0 (0.0%) |
| 26 to 34 Years | 7 (100.0%) | 0 (0.0%) |
| 35 to 44 Years | 33 (100.0%) | 0 (0.0%) |
| 45 to 54 Years | 42 (87.5%) | 6 (12.5%) |
| 55 to 64 Years | 18 (100.0%) | 0 (0.0%) |
| 65 to 74 Years | 18 (100.0%) | 0 (0.0%) |
| 75 Years and older | 9 (100.0%) | 0 (0.0%) |
| Total | 188 (96.9%) | 6 (3.1%) |
Health Insurance Coverage by Citizenship Status in Bear Lake borough
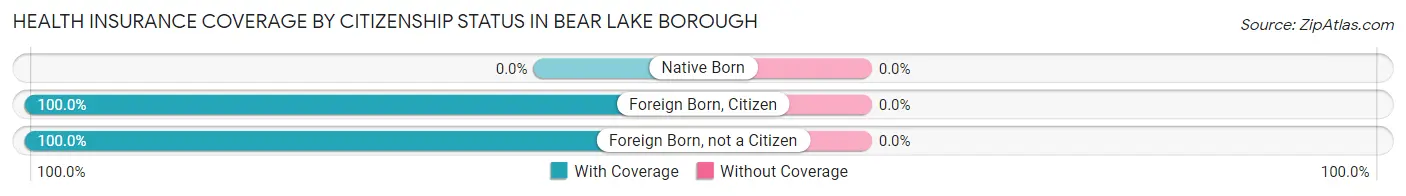
| Citizenship Status | With Coverage | Without Coverage |
| Native Born | 0 (0.0%) | 0 (0.0%) |
| Foreign Born, Citizen | 48 (100.0%) | 0 (0.0%) |
| Foreign Born, not a Citizen | 13 (100.0%) | 0 (0.0%) |
Health Insurance Coverage by Household Income in Bear Lake borough
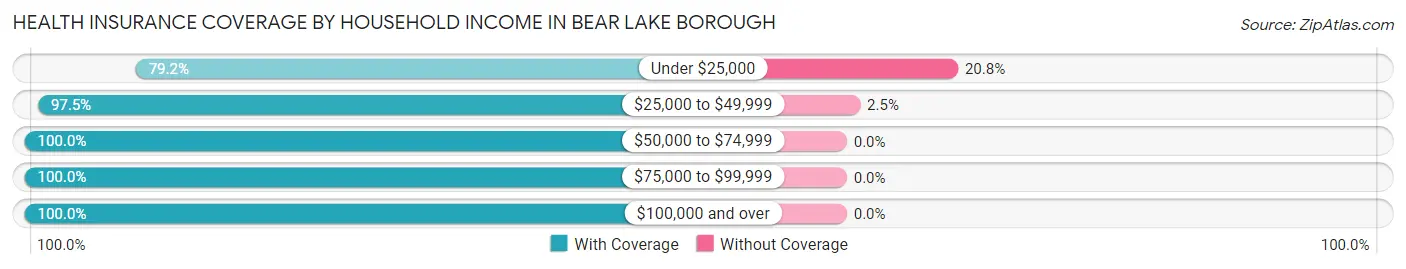
| Household Income | With Coverage | Without Coverage |
| Under $25,000 | 19 (79.2%) | 5 (20.8%) |
| $25,000 to $49,999 | 39 (97.5%) | 1 (2.5%) |
| $50,000 to $74,999 | 90 (100.0%) | 0 (0.0%) |
| $75,000 to $99,999 | 23 (100.0%) | 0 (0.0%) |
| $100,000 and over | 17 (100.0%) | 0 (0.0%) |
Public vs Private Health Insurance Coverage by Age in Bear Lake borough
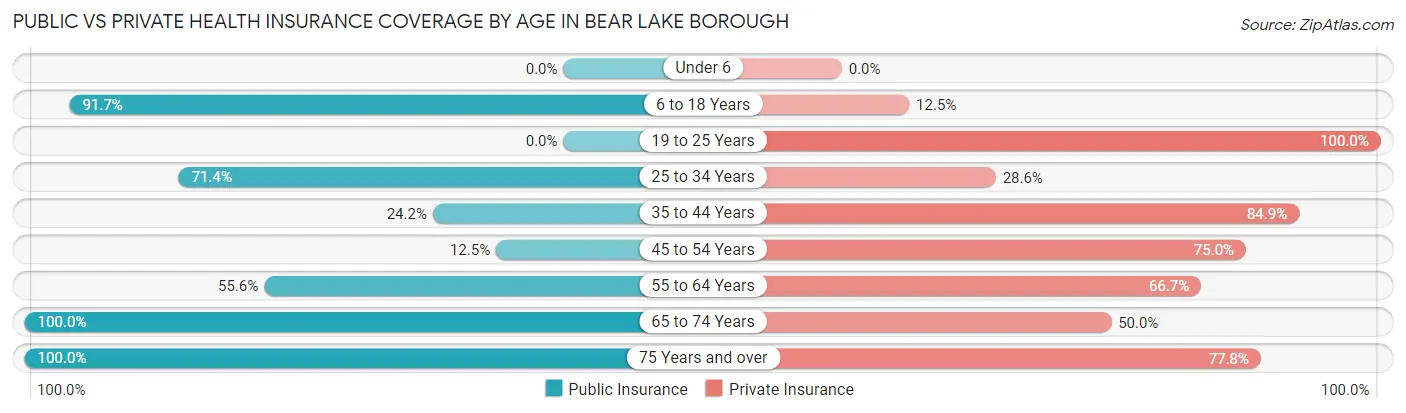
| Age Bracket | Public Insurance | Private Insurance |
| Under 6 | 0 (0.0%) | 0 (0.0%) |
| 6 to 18 Years | 44 (91.7%) | 6 (12.5%) |
| 19 to 25 Years | 0 (0.0%) | 13 (100.0%) |
| 25 to 34 Years | 5 (71.4%) | 2 (28.6%) |
| 35 to 44 Years | 8 (24.2%) | 28 (84.9%) |
| 45 to 54 Years | 6 (12.5%) | 36 (75.0%) |
| 55 to 64 Years | 10 (55.6%) | 12 (66.7%) |
| 65 to 74 Years | 18 (100.0%) | 9 (50.0%) |
| 75 Years and over | 9 (100.0%) | 7 (77.8%) |
| Total | 100 (51.5%) | 113 (58.3%) |
Disability Status by Sex by Age in Bear Lake borough
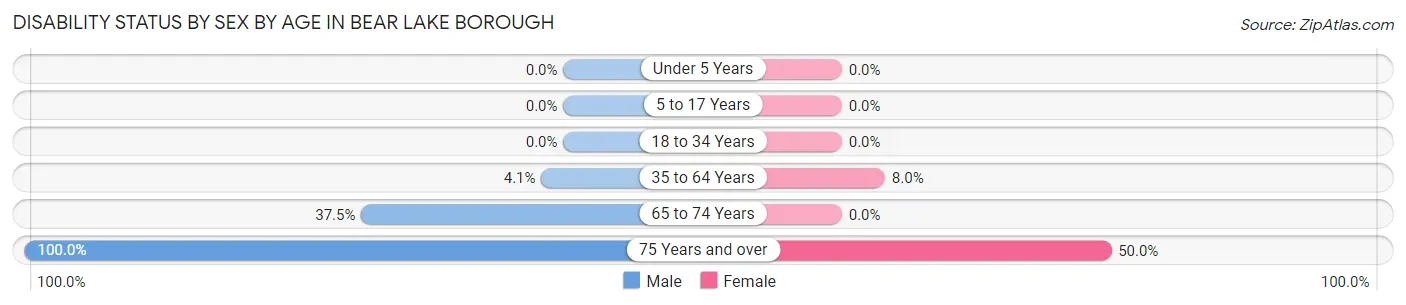
| Age Bracket | Male | Female |
| Under 5 Years | 0 (0.0%) | 0 (0.0%) |
| 5 to 17 Years | 0 (0.0%) | 0 (0.0%) |
| 18 to 34 Years | 0 (0.0%) | 0 (0.0%) |
| 35 to 64 Years | 2 (4.1%) | 4 (8.0%) |
| 65 to 74 Years | 3 (37.5%) | 0 (0.0%) |
| 75 Years and over | 5 (100.0%) | 2 (50.0%) |
Disability Class by Sex by Age in Bear Lake borough
Disability Class: Hearing Difficulty
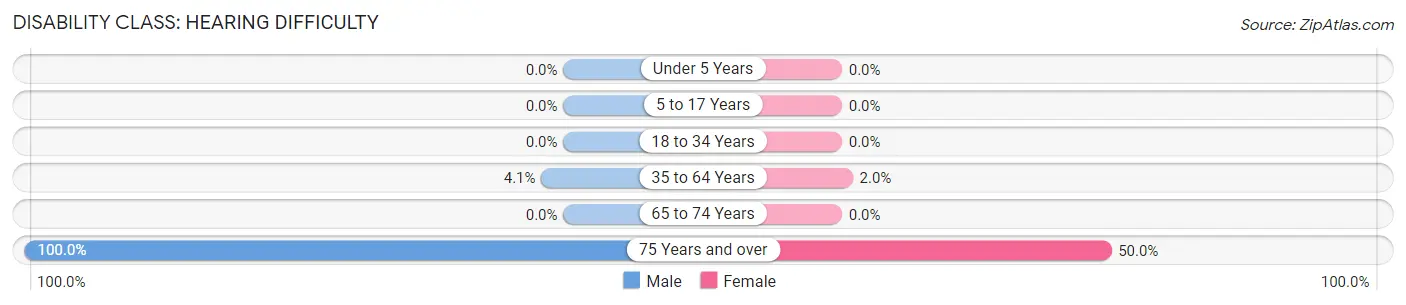
| Age Bracket | Male | Female |
| Under 5 Years | 0 (0.0%) | 0 (0.0%) |
| 5 to 17 Years | 0 (0.0%) | 0 (0.0%) |
| 18 to 34 Years | 0 (0.0%) | 0 (0.0%) |
| 35 to 64 Years | 2 (4.1%) | 1 (2.0%) |
| 65 to 74 Years | 0 (0.0%) | 0 (0.0%) |
| 75 Years and over | 5 (100.0%) | 2 (50.0%) |
Disability Class: Vision Difficulty
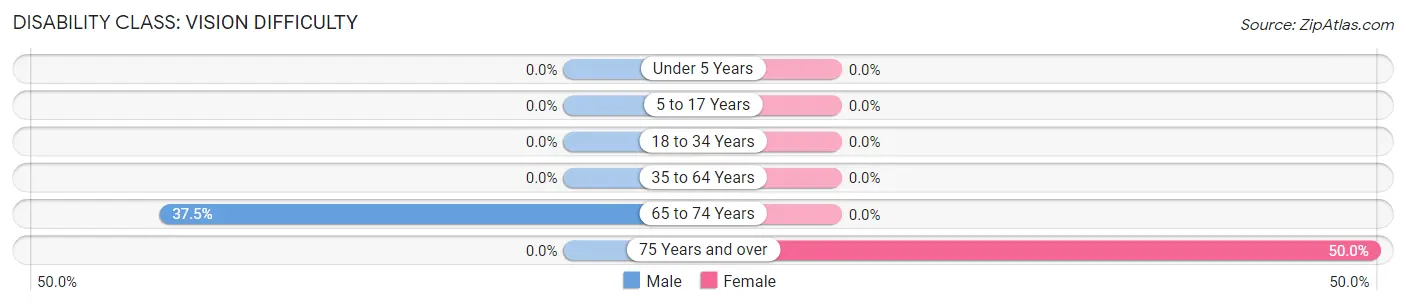
| Age Bracket | Male | Female |
| Under 5 Years | 0 (0.0%) | 0 (0.0%) |
| 5 to 17 Years | 0 (0.0%) | 0 (0.0%) |
| 18 to 34 Years | 0 (0.0%) | 0 (0.0%) |
| 35 to 64 Years | 0 (0.0%) | 0 (0.0%) |
| 65 to 74 Years | 3 (37.5%) | 0 (0.0%) |
| 75 Years and over | 0 (0.0%) | 2 (50.0%) |
Disability Class: Cognitive Difficulty
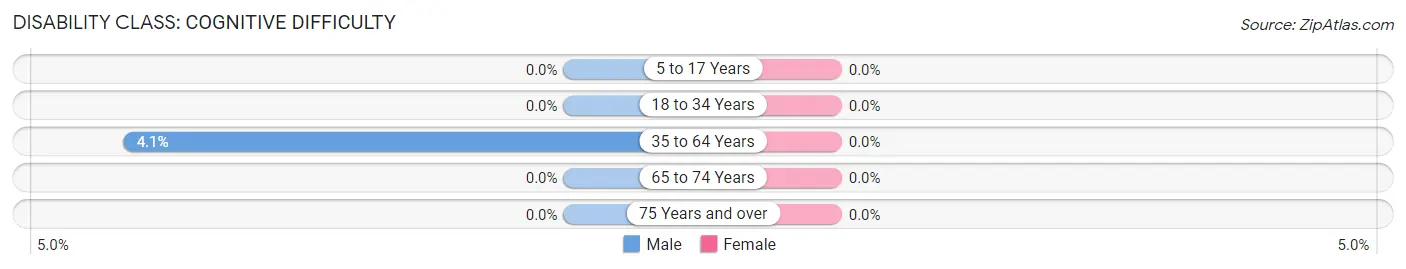
| Age Bracket | Male | Female |
| 5 to 17 Years | 0 (0.0%) | 0 (0.0%) |
| 18 to 34 Years | 0 (0.0%) | 0 (0.0%) |
| 35 to 64 Years | 2 (4.1%) | 0 (0.0%) |
| 65 to 74 Years | 0 (0.0%) | 0 (0.0%) |
| 75 Years and over | 0 (0.0%) | 0 (0.0%) |
Disability Class: Ambulatory Difficulty
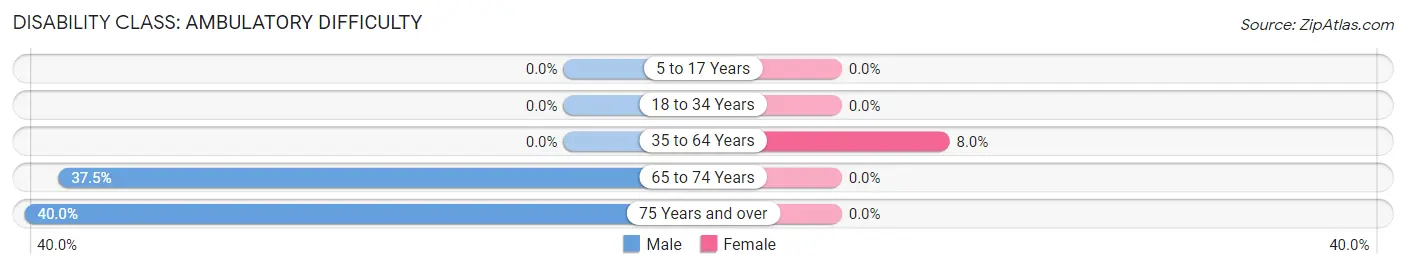
| Age Bracket | Male | Female |
| 5 to 17 Years | 0 (0.0%) | 0 (0.0%) |
| 18 to 34 Years | 0 (0.0%) | 0 (0.0%) |
| 35 to 64 Years | 0 (0.0%) | 4 (8.0%) |
| 65 to 74 Years | 3 (37.5%) | 0 (0.0%) |
| 75 Years and over | 2 (40.0%) | 0 (0.0%) |
Disability Class: Self-Care Difficulty
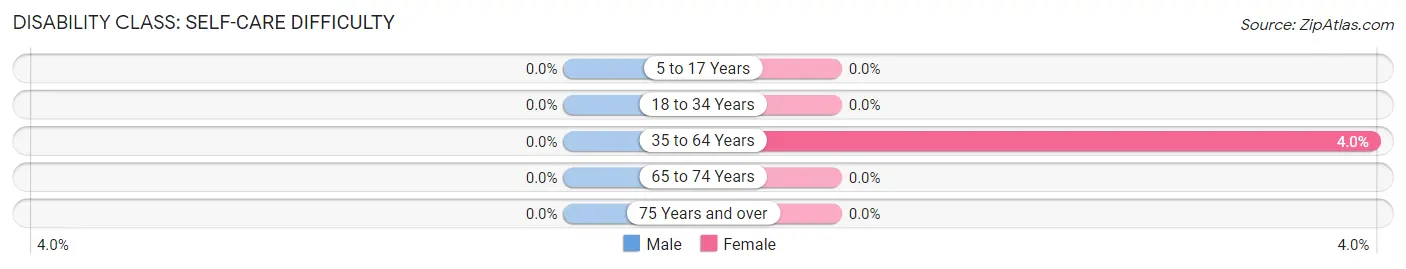
| Age Bracket | Male | Female |
| 5 to 17 Years | 0 (0.0%) | 0 (0.0%) |
| 18 to 34 Years | 0 (0.0%) | 0 (0.0%) |
| 35 to 64 Years | 0 (0.0%) | 2 (4.0%) |
| 65 to 74 Years | 0 (0.0%) | 0 (0.0%) |
| 75 Years and over | 0 (0.0%) | 0 (0.0%) |
Technology Access in Bear Lake borough
Computing Device Access in Bear Lake borough
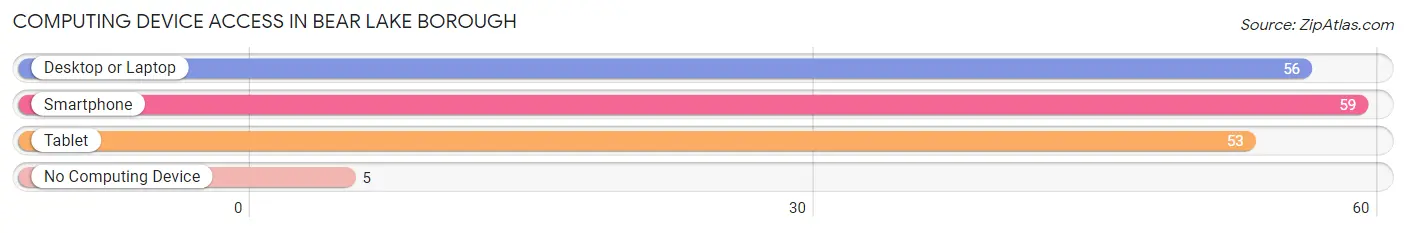
| Device Type | # Households | % Households |
| Desktop or Laptop | 56 | 78.9% |
| Smartphone | 59 | 83.1% |
| Tablet | 53 | 74.7% |
| No Computing Device | 5 | 7.0% |
| Total | 71 | 100.0% |
Internet Access in Bear Lake borough
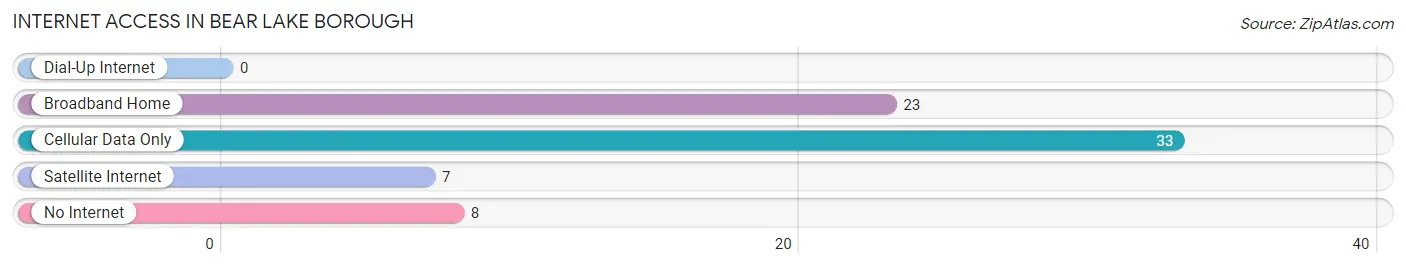
| Internet Type | # Households | % Households |
| Dial-Up Internet | 0 | 0.0% |
| Broadband Home | 23 | 32.4% |
| Cellular Data Only | 33 | 46.5% |
| Satellite Internet | 7 | 9.9% |
| No Internet | 8 | 11.3% |
| Total | 71 | 100.0% |
Bear Lake borough Summary
Lake Borough is a borough located in the state of Pennsylvania, United States. It is located in the northwest corner of the state, in Warren County. The population of the borough was 1,845 at the 2010 census.
History
The area that is now Lake Borough was first settled in the late 1700s by a group of settlers from New England. The area was originally known as "Bear Lake" due to the abundance of bears in the area. The name was changed to Lake Borough in 1845 when the borough was officially incorporated.
The borough was originally a farming community, but in the late 1800s, the area began to develop into a resort destination. The first hotel was built in 1887, and the area quickly became a popular destination for vacationers. The area was also known for its mineral springs, which were believed to have healing properties.
The borough was also home to a number of industries, including a sawmill, a grist mill, and a tannery. The tannery was the largest employer in the area, and it was in operation until the early 1900s.
Geography
Lake Borough is located in the northwest corner of Pennsylvania, in Warren County. It is bordered by the Allegheny National Forest to the north, and the borough of Sheffield to the south. The borough is located in the Allegheny Plateau region of Pennsylvania, and is characterized by rolling hills and forests.
The borough is located at an elevation of 1,845 feet (562 m). The borough has a total area of 2.2 square miles (5.7 km2), all of which is land.
Economy
The economy of Lake Borough is largely based on tourism. The area is a popular destination for vacationers, and there are a number of hotels, restaurants, and other businesses catering to tourists. The borough is also home to a number of small businesses, including a sawmill, a grist mill, and a tannery.
Demographics
As of the 2010 census, the population of Lake Borough was 1,845. The racial makeup of the borough was 97.3% White, 0.7% African American, 0.2% Native American, 0.2% Asian, 0.2% from other races, and 1.4% from two or more races. Hispanic or Latino of any race were 0.7% of the population.
The median income for a household in the borough was $37,500, and the median income for a family was $45,000. The per capita income for the borough was $19,000. About 10.3% of families and 13.2% of the population were below the poverty line, including 17.2% of those under age 18 and 8.3% of those age 65 or over.
Common Questions
What is Per Capita Income in Bear Lake borough?
Per Capita income in Bear Lake borough is $21,095.
What is the Median Family Income in Bear Lake borough?
Median Family Income in Bear Lake borough is $43,750.
What is the Median Household income in Bear Lake borough?
Median Household Income in Bear Lake borough is $67,824.
What is Income or Wage Gap in Bear Lake borough?
Income or Wage Gap in Bear Lake borough is 57.1%.
Women in Bear Lake borough earn 42.9 cents for every dollar earned by a man.
What is Inequality or Gini Index in Bear Lake borough?
Inequality or Gini Index in Bear Lake borough is 0.32.
What is the Total Population of Bear Lake borough?
Total Population of Bear Lake borough is 194.
What is the Total Male Population of Bear Lake borough?
Total Male Population of Bear Lake borough is 117.
What is the Total Female Population of Bear Lake borough?
Total Female Population of Bear Lake borough is 77.
What is the Ratio of Males per 100 Females in Bear Lake borough?
There are 151.95 Males per 100 Females in Bear Lake borough.
What is the Ratio of Females per 100 Males in Bear Lake borough?
There are 65.81 Females per 100 Males in Bear Lake borough.
What is the Median Population Age in Bear Lake borough?
Median Population Age in Bear Lake borough is 44.9 Years.
What is the Average Family Size in Bear Lake borough
Average Family Size in Bear Lake borough is 3.4 People.
What is the Average Household Size in Bear Lake borough
Average Household Size in Bear Lake borough is 2.7 People.
How Large is the Labor Force in Bear Lake borough?
There are 107 People in the Labor Forcein in Bear Lake borough.
What is the Percentage of People in the Labor Force in Bear Lake borough?
56.0% of People are in the Labor Force in Bear Lake borough.
What is the Unemployment Rate in Bear Lake borough?
Unemployment Rate in Bear Lake borough is 14.0%.