Spinnerstown, PA Map & Demographics
Spinnerstown Map
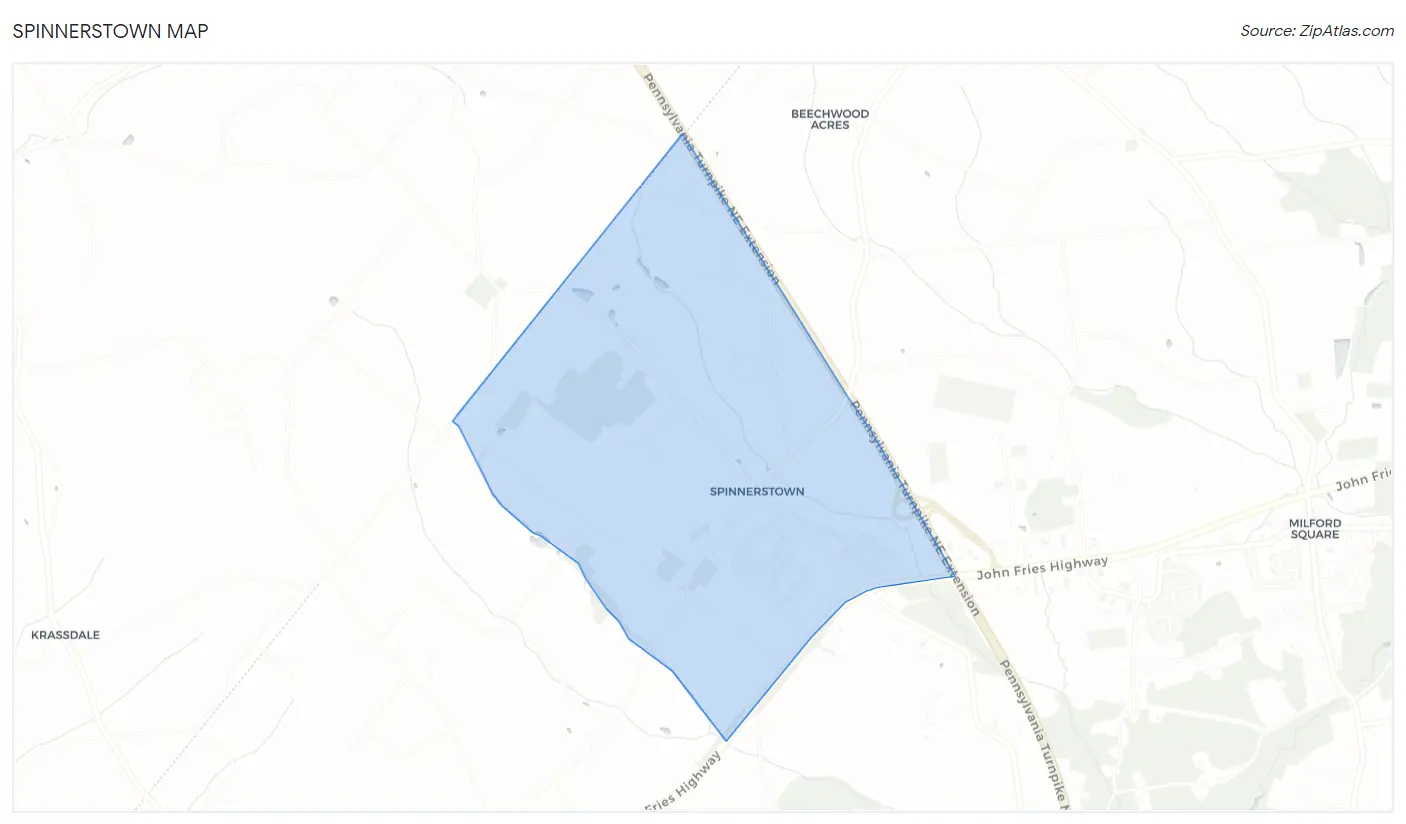
Spinnerstown Overview
$46,546
PER CAPITA INCOME
$146,745
AVG FAMILY INCOME
$145,865
AVG HOUSEHOLD INCOME
43.5%
WAGE / INCOME GAP [ % ]
56.5¢/ $1
WAGE / INCOME GAP [ $ ]
0.24
INEQUALITY / GINI INDEX
1,966
TOTAL POPULATION
877
MALE POPULATION
1,089
FEMALE POPULATION
80.53
MALES / 100 FEMALES
124.17
FEMALES / 100 MALES
45.9
MEDIAN AGE
3.2
AVG FAMILY SIZE
3.0
AVG HOUSEHOLD SIZE
1,110
LABOR FORCE [ PEOPLE ]
71.4%
PERCENT IN LABOR FORCE
4.0%
UNEMPLOYMENT RATE
Spinnerstown Area Codes
Income in Spinnerstown
Income Overview in Spinnerstown
Per Capita Income in Spinnerstown is $46,546, while median incomes of families and households are $146,745 and $145,865 respectively.
| Characteristic | Number | Measure |
| Per Capita Income | 1,966 | $46,546 |
| Median Family Income | 573 | $146,745 |
| Mean Family Income | 573 | $150,790 |
| Median Household Income | 651 | $145,865 |
| Mean Household Income | 651 | $139,239 |
| Income Deficit | 573 | $0 |
| Wage / Income Gap (%) | 1,966 | 43.54% |
| Wage / Income Gap ($) | 1,966 | 56.46¢ per $1 |
| Gini / Inequality Index | 1,966 | 0.24 |
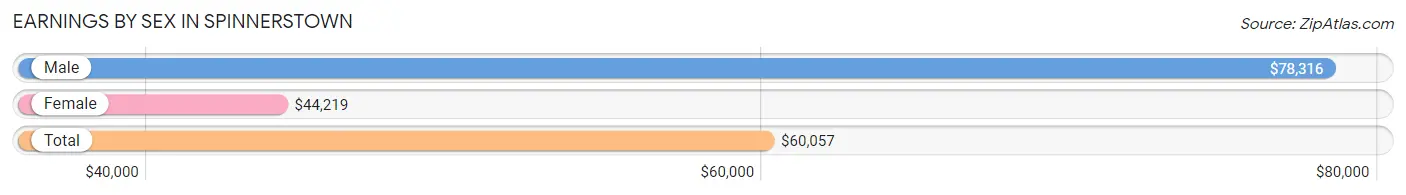
Earnings by Sex in Spinnerstown
Average Earnings in Spinnerstown are $60,057, $78,316 for men and $44,219 for women, a difference of 43.5%.
| Sex | Number | Average Earnings |
| Male | 616 (54.6%) | $78,316 |
| Female | 513 (45.4%) | $44,219 |
| Total | 1,129 (100.0%) | $60,057 |
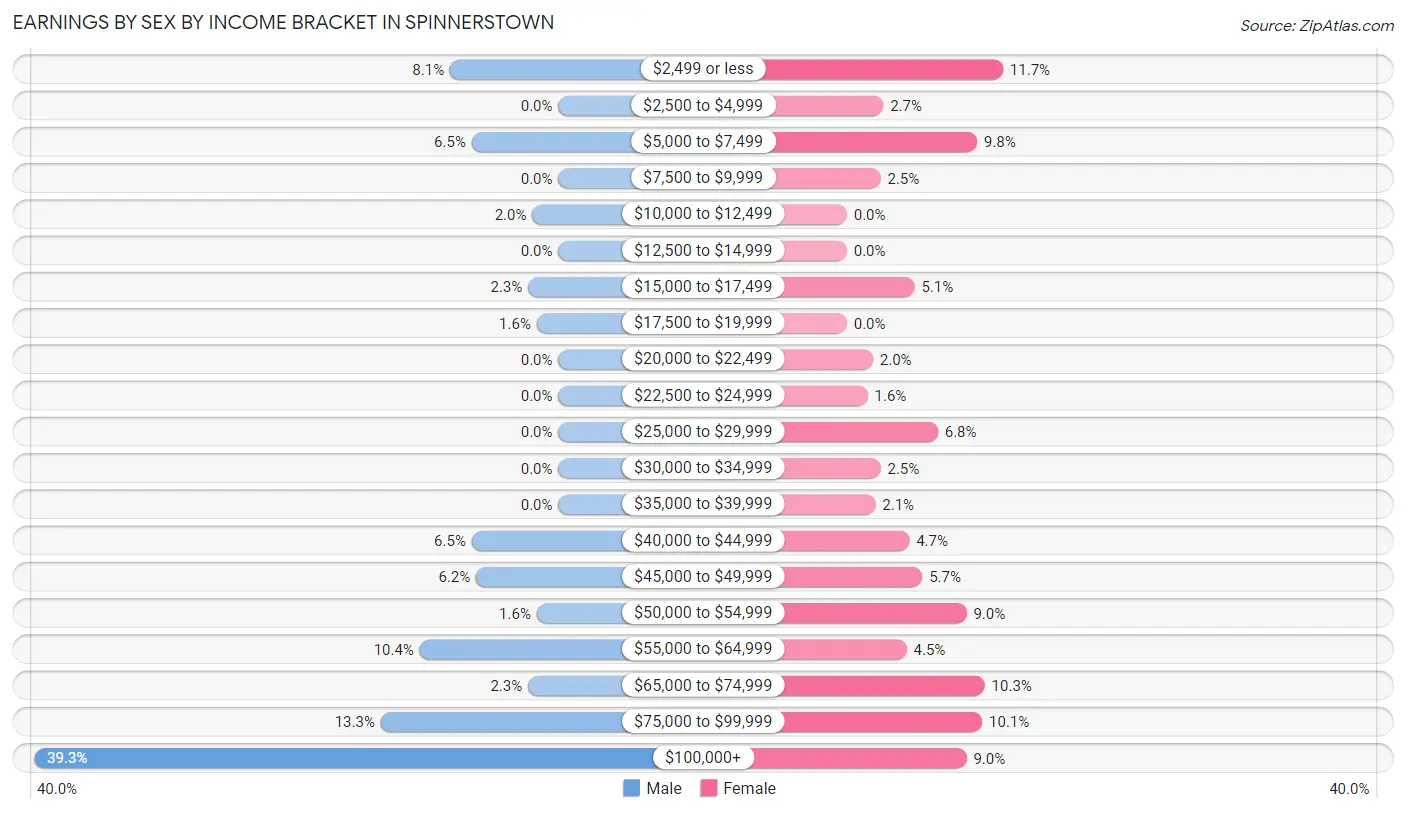
Earnings by Sex by Income Bracket in Spinnerstown
The most common earnings brackets in Spinnerstown are $100,000+ for men (242 | 39.3%) and $2,499 or less for women (60 | 11.7%).
| Income | Male | Female |
| $2,499 or less | 50 (8.1%) | 60 (11.7%) |
| $2,500 to $4,999 | 0 (0.0%) | 14 (2.7%) |
| $5,000 to $7,499 | 40 (6.5%) | 50 (9.8%) |
| $7,500 to $9,999 | 0 (0.0%) | 13 (2.5%) |
| $10,000 to $12,499 | 12 (1.9%) | 0 (0.0%) |
| $12,500 to $14,999 | 0 (0.0%) | 0 (0.0%) |
| $15,000 to $17,499 | 14 (2.3%) | 26 (5.1%) |
| $17,500 to $19,999 | 10 (1.6%) | 0 (0.0%) |
| $20,000 to $22,499 | 0 (0.0%) | 10 (1.9%) |
| $22,500 to $24,999 | 0 (0.0%) | 8 (1.6%) |
| $25,000 to $29,999 | 0 (0.0%) | 35 (6.8%) |
| $30,000 to $34,999 | 0 (0.0%) | 13 (2.5%) |
| $35,000 to $39,999 | 0 (0.0%) | 11 (2.1%) |
| $40,000 to $44,999 | 40 (6.5%) | 24 (4.7%) |
| $45,000 to $49,999 | 38 (6.2%) | 29 (5.7%) |
| $50,000 to $54,999 | 10 (1.6%) | 46 (9.0%) |
| $55,000 to $64,999 | 64 (10.4%) | 23 (4.5%) |
| $65,000 to $74,999 | 14 (2.3%) | 53 (10.3%) |
| $75,000 to $99,999 | 82 (13.3%) | 52 (10.1%) |
| $100,000+ | 242 (39.3%) | 46 (9.0%) |
| Total | 616 (100.0%) | 513 (100.0%) |
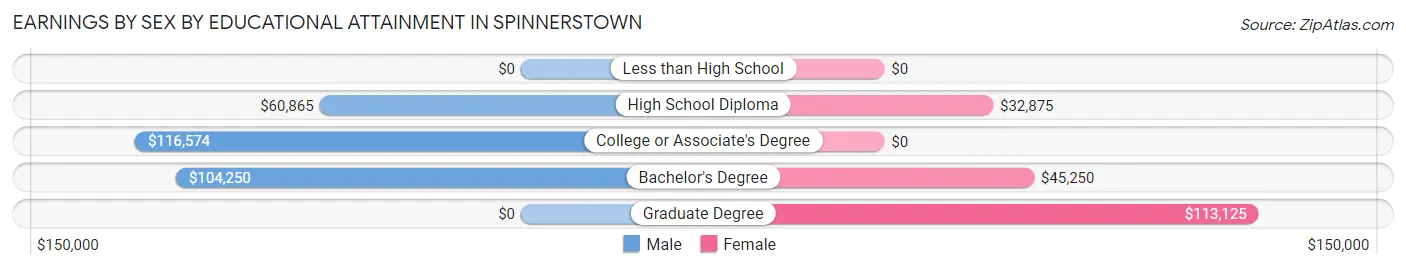
Earnings by Sex by Educational Attainment in Spinnerstown
Average earnings in Spinnerstown are $83,947 for men and $48,393 for women, a difference of 42.3%. Men with an educational attainment of college or associate's degree enjoy the highest average annual earnings of $116,574, while those with high school diploma education earn the least with $60,865. Women with an educational attainment of graduate degree earn the most with the average annual earnings of $113,125, while those with high school diploma education have the smallest earnings of $32,875.
| Educational Attainment | Male Income | Female Income |
| Less than High School | - | - |
| High School Diploma | $60,865 | $32,875 |
| College or Associate's Degree | $116,574 | $0 |
| Bachelor's Degree | $104,250 | $45,250 |
| Graduate Degree | - | - |
| Total | $83,947 | $48,393 |
Family Income in Spinnerstown
Family Income Brackets in Spinnerstown
According to the Spinnerstown family income data, there are 208 families falling into the $100,000 to $149,999 income range, which is the most common income bracket and makes up 36.3% of all families.
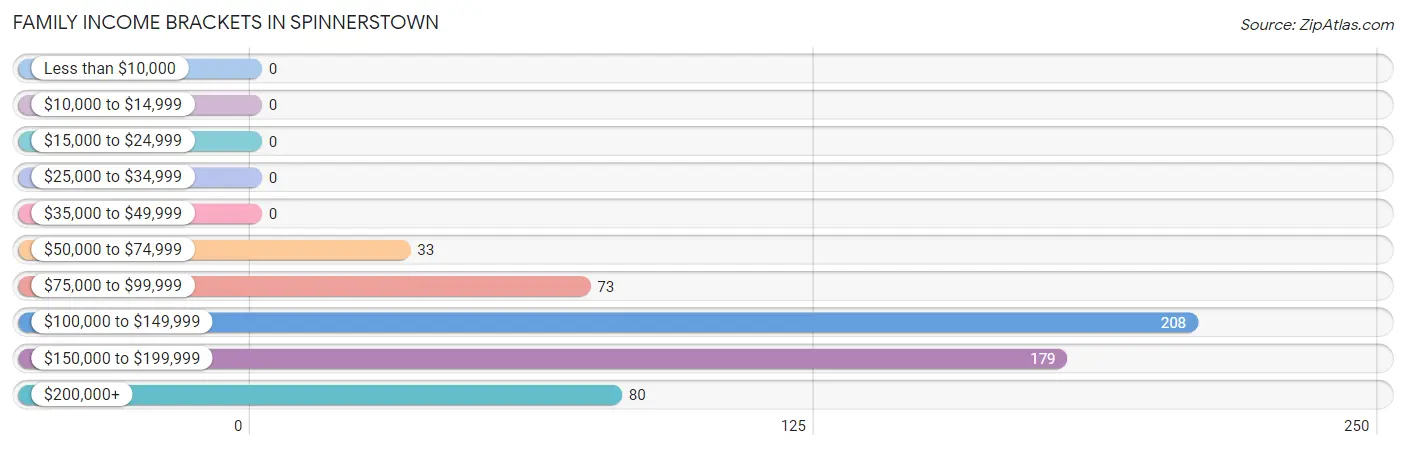
| Income Bracket | # Families | % Families |
| Less than $10,000 | 0 | 0.0% |
| $10,000 to $14,999 | 0 | 0.0% |
| $15,000 to $24,999 | 0 | 0.0% |
| $25,000 to $34,999 | 0 | 0.0% |
| $35,000 to $49,999 | 0 | 0.0% |
| $50,000 to $74,999 | 33 | 5.8% |
| $75,000 to $99,999 | 73 | 12.7% |
| $100,000 to $149,999 | 208 | 36.3% |
| $150,000 to $199,999 | 179 | 31.2% |
| $200,000+ | 80 | 14.0% |
Family Income by Famaliy Size in Spinnerstown
4-person families (124 | 21.6%) account for the highest median family income in Spinnerstown with $195,250 per family, while 2-person families (227 | 39.6%) have the highest median income of $72,556 per family member.
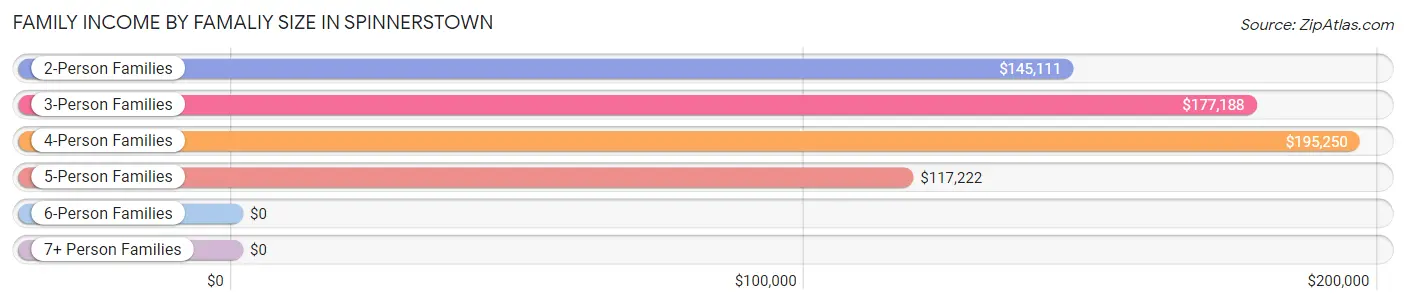
| Income Bracket | # Families | Median Income |
| 2-Person Families | 227 (39.6%) | $145,111 |
| 3-Person Families | 159 (27.8%) | $177,188 |
| 4-Person Families | 124 (21.6%) | $195,250 |
| 5-Person Families | 32 (5.6%) | $117,222 |
| 6-Person Families | 0 (0.0%) | $0 |
| 7+ Person Families | 31 (5.4%) | $0 |
| Total | 573 (100.0%) | $146,745 |
Family Income by Number of Earners in Spinnerstown
The median family income in Spinnerstown is $146,745, with families comprising 2 earners (205) having the highest median family income of $178,792, while families with 1 earner (123) have the lowest median family income of $116,895, accounting for 35.8% and 21.5% of families, respectively.
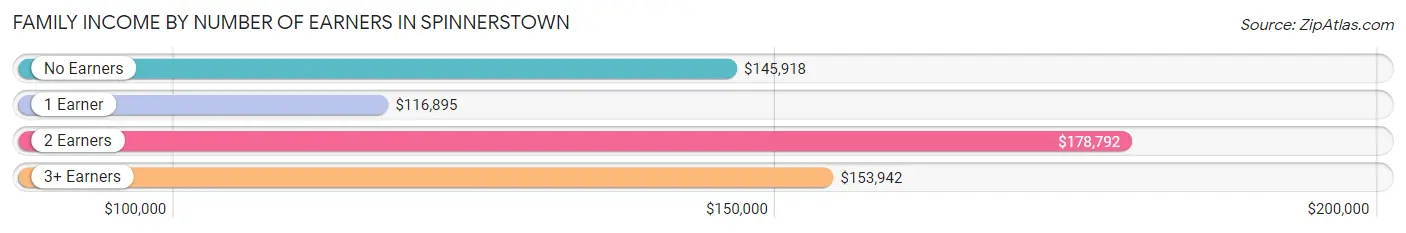
| Number of Earners | # Families | Median Income |
| No Earners | 100 (17.4%) | $145,918 |
| 1 Earner | 123 (21.5%) | $116,895 |
| 2 Earners | 205 (35.8%) | $178,792 |
| 3+ Earners | 145 (25.3%) | $153,942 |
| Total | 573 (100.0%) | $146,745 |
Household Income in Spinnerstown
Household Income Brackets in Spinnerstown
With 222 households falling in the category, the $100,000 to $149,999 income range is the most frequent in Spinnerstown, accounting for 34.1% of all households.
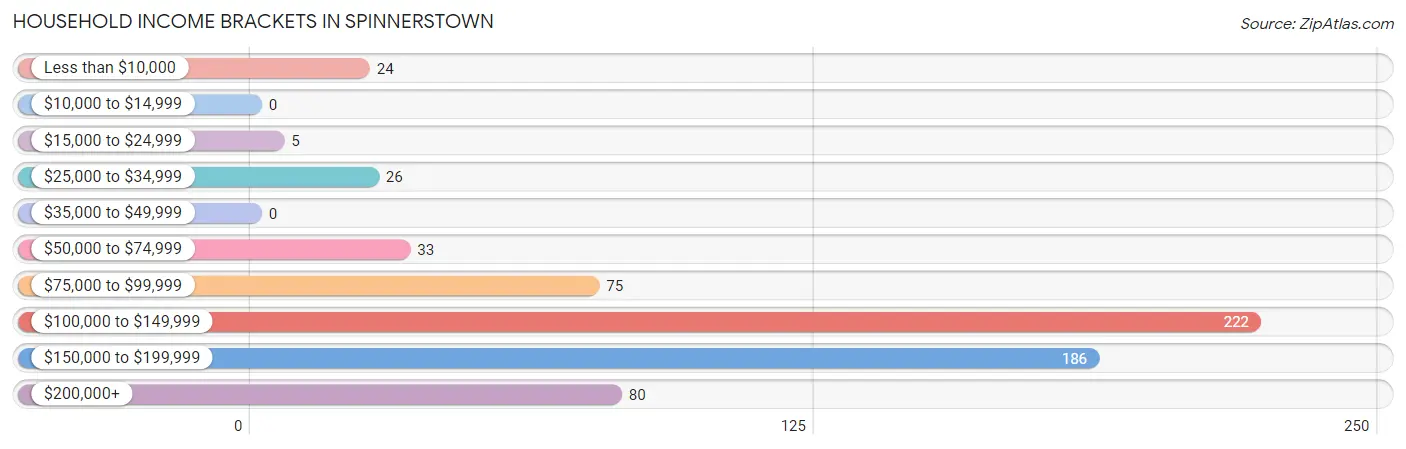
| Income Bracket | # Households | % Households |
| Less than $10,000 | 24 | 3.7% |
| $10,000 to $14,999 | 0 | 0.0% |
| $15,000 to $24,999 | 5 | 0.8% |
| $25,000 to $34,999 | 26 | 4.0% |
| $35,000 to $49,999 | 0 | 0.0% |
| $50,000 to $74,999 | 33 | 5.1% |
| $75,000 to $99,999 | 75 | 11.5% |
| $100,000 to $149,999 | 222 | 34.1% |
| $150,000 to $199,999 | 186 | 28.6% |
| $200,000+ | 80 | 12.3% |
Household Income by Householder Age in Spinnerstown
The median household income in Spinnerstown is $145,865, with the highest median household income of $189,286 found in the 25 to 44 years age bracket for the primary householder. A total of 100 households (15.4%) fall into this category.
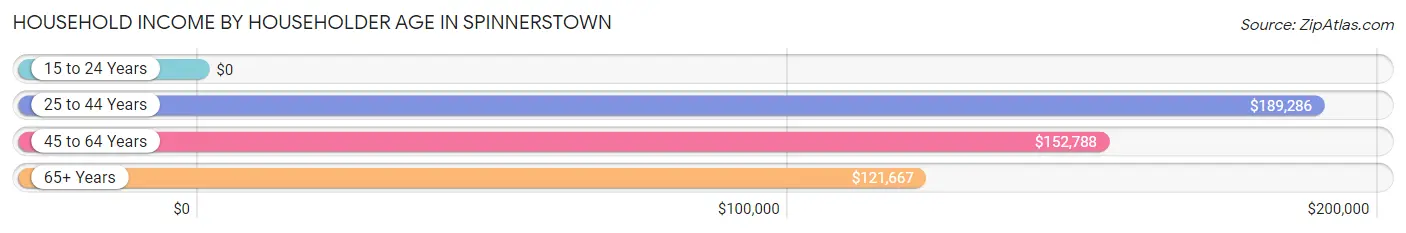
| Income Bracket | # Households | Median Income |
| 15 to 24 Years | 0 (0.0%) | $0 |
| 25 to 44 Years | 100 (15.4%) | $189,286 |
| 45 to 64 Years | 363 (55.8%) | $152,788 |
| 65+ Years | 188 (28.9%) | $121,667 |
| Total | 651 (100.0%) | $145,865 |
Poverty in Spinnerstown
Income Below Poverty by Sex and Age in Spinnerstown
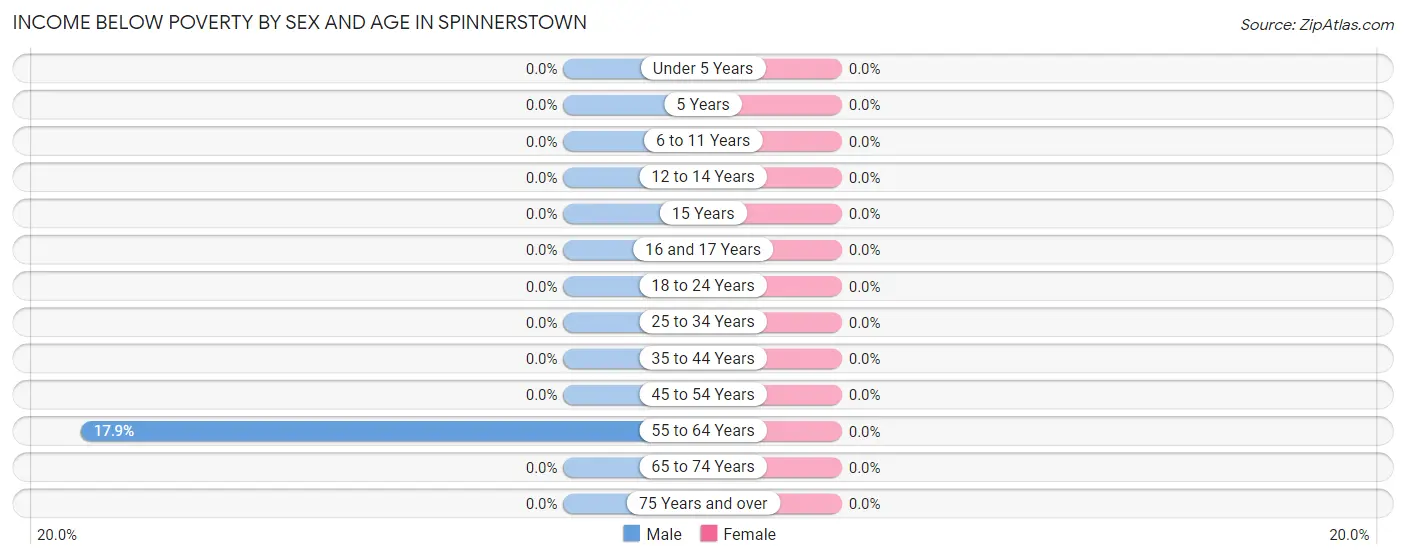
| Age Bracket | Male | Female |
| Under 5 Years | 0 (0.0%) | 0 (0.0%) |
| 5 Years | 0 (0.0%) | 0 (0.0%) |
| 6 to 11 Years | 0 (0.0%) | 0 (0.0%) |
| 12 to 14 Years | 0 (0.0%) | 0 (0.0%) |
| 15 Years | 0 (0.0%) | 0 (0.0%) |
| 16 and 17 Years | 0 (0.0%) | 0 (0.0%) |
| 18 to 24 Years | 0 (0.0%) | 0 (0.0%) |
| 25 to 34 Years | 0 (0.0%) | 0 (0.0%) |
| 35 to 44 Years | 0 (0.0%) | 0 (0.0%) |
| 45 to 54 Years | 0 (0.0%) | 0 (0.0%) |
| 55 to 64 Years | 24 (17.9%) | 0 (0.0%) |
| 65 to 74 Years | 0 (0.0%) | 0 (0.0%) |
| 75 Years and over | 0 (0.0%) | 0 (0.0%) |
| Total | 24 (2.7%) | 0 (0.0%) |
Income Above Poverty by Sex and Age in Spinnerstown
According to the poverty statistics in Spinnerstown, males aged under 5 years and females aged under 5 years are the age groups that are most secure financially, with 100.0% of males and 100.0% of females in these age groups living above the poverty line.
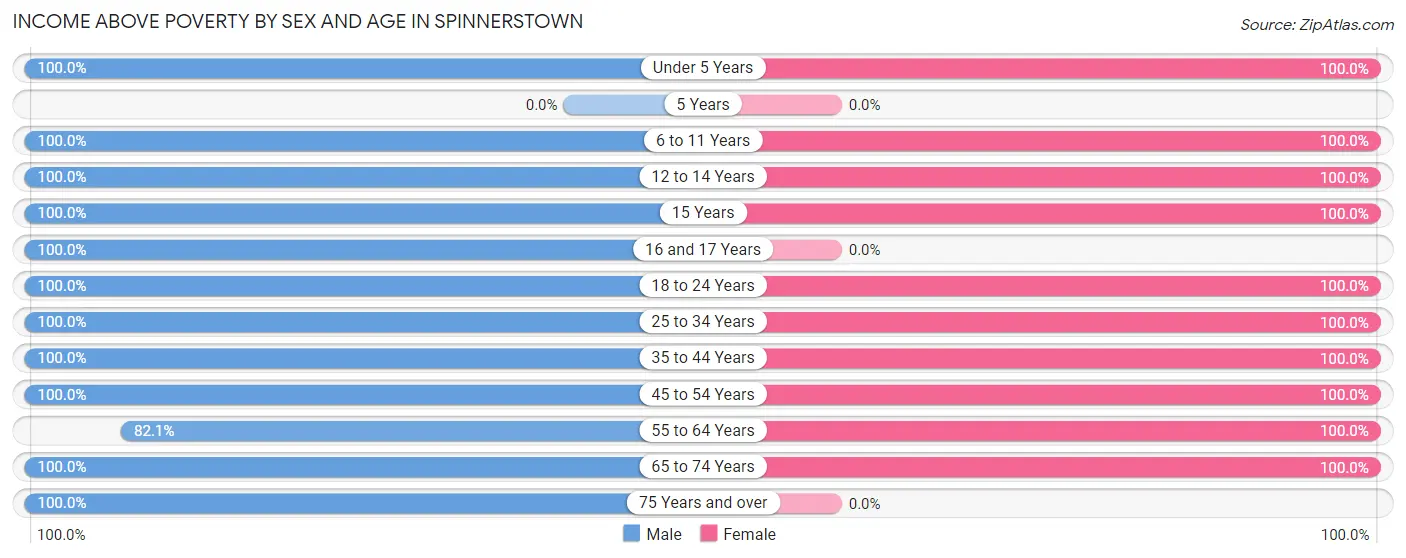
| Age Bracket | Male | Female |
| Under 5 Years | 20 (100.0%) | 74 (100.0%) |
| 5 Years | 0 (0.0%) | 0 (0.0%) |
| 6 to 11 Years | 23 (100.0%) | 155 (100.0%) |
| 12 to 14 Years | 44 (100.0%) | 32 (100.0%) |
| 15 Years | 11 (100.0%) | 44 (100.0%) |
| 16 and 17 Years | 82 (100.0%) | 0 (0.0%) |
| 18 to 24 Years | 58 (100.0%) | 98 (100.0%) |
| 25 to 34 Years | 122 (100.0%) | 77 (100.0%) |
| 35 to 44 Years | 52 (100.0%) | 58 (100.0%) |
| 45 to 54 Years | 152 (100.0%) | 259 (100.0%) |
| 55 to 64 Years | 110 (82.1%) | 163 (100.0%) |
| 65 to 74 Years | 170 (100.0%) | 120 (100.0%) |
| 75 Years and over | 9 (100.0%) | 0 (0.0%) |
| Total | 853 (97.3%) | 1,080 (100.0%) |
Income Below Poverty Among Married-Couple Families in Spinnerstown
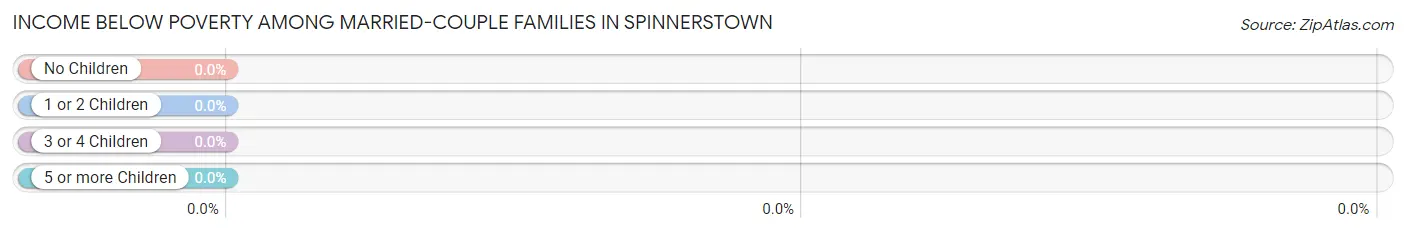
| Children | Above Poverty | Below Poverty |
| No Children | 297 (100.0%) | 0 (0.0%) |
| 1 or 2 Children | 186 (100.0%) | 0 (0.0%) |
| 3 or 4 Children | 45 (100.0%) | 0 (0.0%) |
| 5 or more Children | 0 (0.0%) | 0 (0.0%) |
| Total | 528 (100.0%) | 0 (0.0%) |
Income Below Poverty Among Single-Parent Households in Spinnerstown
| Children | Single Father | Single Mother |
| No Children | 0 (0.0%) | 0 (0.0%) |
| 1 or 2 Children | 0 (0.0%) | 0 (0.0%) |
| 3 or 4 Children | 0 (0.0%) | 0 (0.0%) |
| 5 or more Children | 0 (0.0%) | 0 (0.0%) |
| Total | 0 (0.0%) | 0 (0.0%) |
Income Below Poverty Among Married-Couple vs Single-Parent Households in Spinnerstown
| Children | Married-Couple Families | Single-Parent Households |
| No Children | 0 (0.0%) | 0 (0.0%) |
| 1 or 2 Children | 0 (0.0%) | 0 (0.0%) |
| 3 or 4 Children | 0 (0.0%) | 0 (0.0%) |
| 5 or more Children | 0 (0.0%) | 0 (0.0%) |
| Total | 0 (0.0%) | 0 (0.0%) |
Race in Spinnerstown
The most populous races in Spinnerstown are White / Caucasian (1,755 | 89.3%), Hispanic or Latino (127 | 6.5%), and Two or more Races (95 | 4.8%).
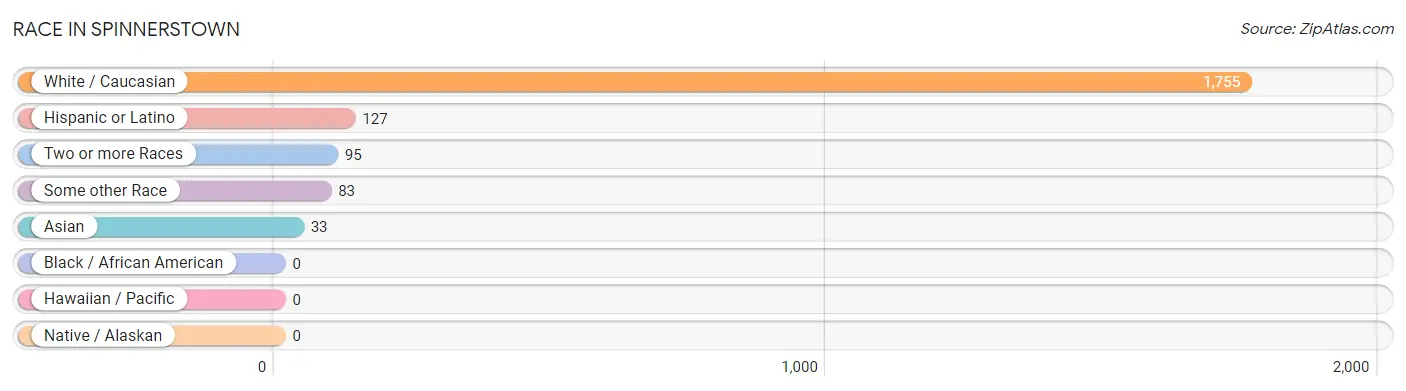
| Race | # Population | % Population |
| Asian | 33 | 1.7% |
| Black / African American | 0 | 0.0% |
| Hawaiian / Pacific | 0 | 0.0% |
| Hispanic or Latino | 127 | 6.5% |
| Native / Alaskan | 0 | 0.0% |
| White / Caucasian | 1,755 | 89.3% |
| Two or more Races | 95 | 4.8% |
| Some other Race | 83 | 4.2% |
| Total | 1,966 | 100.0% |
Ancestry in Spinnerstown
The most populous ancestries reported in Spinnerstown are German (378 | 19.2%), Irish (352 | 17.9%), Pennsylvania German (338 | 17.2%), Italian (208 | 10.6%), and Polish (121 | 6.1%), together accounting for 71.0% of all Spinnerstown residents.
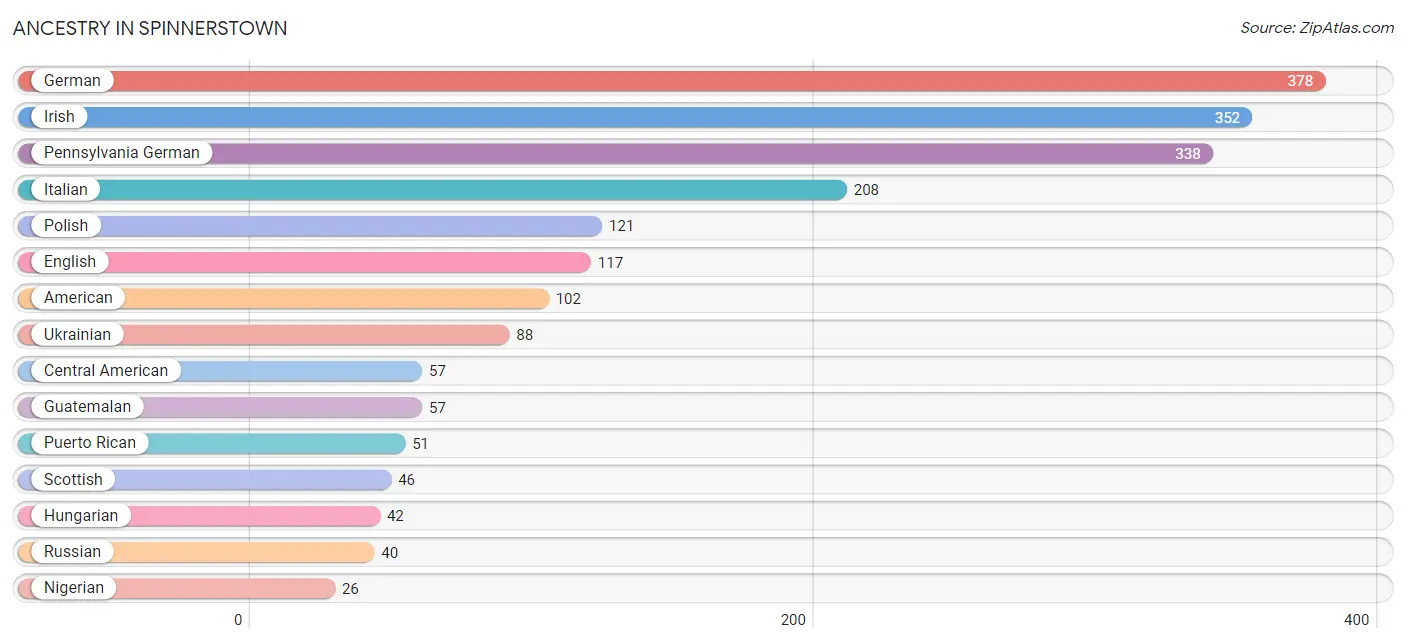
| Ancestry | # Population | % Population |
| American | 102 | 5.2% |
| Argentinean | 7 | 0.4% |
| Burmese | 11 | 0.6% |
| Central American | 57 | 2.9% |
| Dominican | 12 | 0.6% |
| Eastern European | 13 | 0.7% |
| English | 117 | 5.9% |
| European | 21 | 1.1% |
| Finnish | 13 | 0.7% |
| French | 18 | 0.9% |
| German | 378 | 19.2% |
| Guatemalan | 57 | 2.9% |
| Hungarian | 42 | 2.1% |
| Indian (Asian) | 22 | 1.1% |
| Irish | 352 | 17.9% |
| Italian | 208 | 10.6% |
| Lithuanian | 19 | 1.0% |
| Nigerian | 26 | 1.3% |
| Pennsylvania German | 338 | 17.2% |
| Polish | 121 | 6.1% |
| Puerto Rican | 51 | 2.6% |
| Romanian | 7 | 0.4% |
| Russian | 40 | 2.0% |
| Scottish | 46 | 2.3% |
| South American | 7 | 0.4% |
| Sri Lankan | 11 | 0.6% |
| Subsaharan African | 26 | 1.3% |
| Swiss | 9 | 0.5% |
| Ukrainian | 88 | 4.5% |
| Yugoslavian | 10 | 0.5% | View All 30 Rows |
Immigrants in Spinnerstown
The most numerous immigrant groups reported in Spinnerstown came from Eastern Europe (37 | 1.9%), Europe (37 | 1.9%), Ukraine (28 | 1.4%), Central America (20 | 1.0%), and Guatemala (20 | 1.0%), together accounting for 7.2% of all Spinnerstown residents.
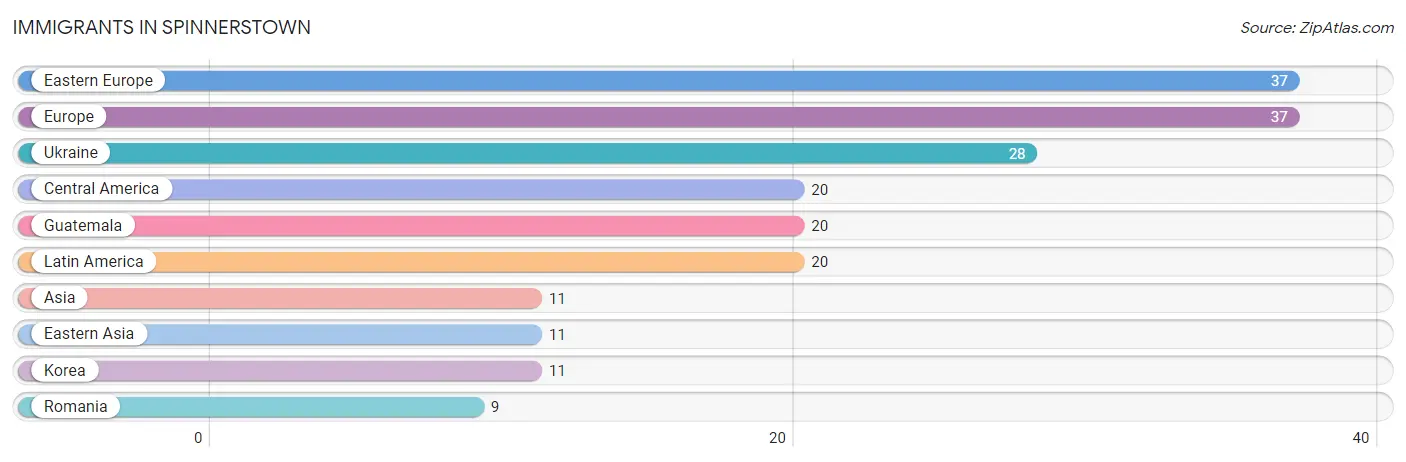
| Immigration Origin | # Population | % Population |
| Asia | 11 | 0.6% |
| Central America | 20 | 1.0% |
| Eastern Asia | 11 | 0.6% |
| Eastern Europe | 37 | 1.9% |
| Europe | 37 | 1.9% |
| Guatemala | 20 | 1.0% |
| Korea | 11 | 0.6% |
| Latin America | 20 | 1.0% |
| Romania | 9 | 0.5% |
| Ukraine | 28 | 1.4% | View All 10 Rows |
Sex and Age in Spinnerstown
Sex and Age in Spinnerstown
The most populous age groups in Spinnerstown are 15 to 19 Years (123 | 14.0%) for men and 45 to 49 Years (133 | 12.2%) for women.
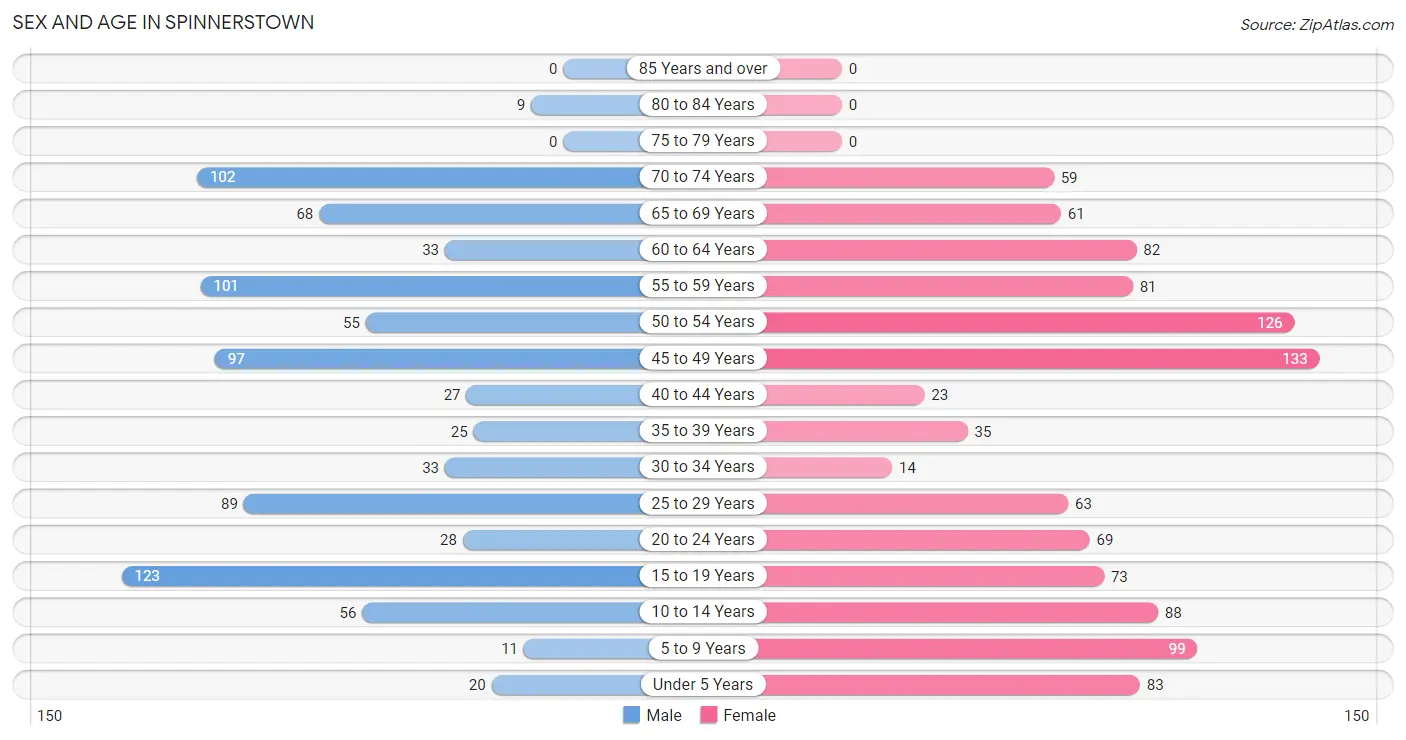
| Age Bracket | Male | Female |
| Under 5 Years | 20 (2.3%) | 83 (7.6%) |
| 5 to 9 Years | 11 (1.3%) | 99 (9.1%) |
| 10 to 14 Years | 56 (6.4%) | 88 (8.1%) |
| 15 to 19 Years | 123 (14.0%) | 73 (6.7%) |
| 20 to 24 Years | 28 (3.2%) | 69 (6.3%) |
| 25 to 29 Years | 89 (10.2%) | 63 (5.8%) |
| 30 to 34 Years | 33 (3.8%) | 14 (1.3%) |
| 35 to 39 Years | 25 (2.9%) | 35 (3.2%) |
| 40 to 44 Years | 27 (3.1%) | 23 (2.1%) |
| 45 to 49 Years | 97 (11.1%) | 133 (12.2%) |
| 50 to 54 Years | 55 (6.3%) | 126 (11.6%) |
| 55 to 59 Years | 101 (11.5%) | 81 (7.4%) |
| 60 to 64 Years | 33 (3.8%) | 82 (7.5%) |
| 65 to 69 Years | 68 (7.7%) | 61 (5.6%) |
| 70 to 74 Years | 102 (11.6%) | 59 (5.4%) |
| 75 to 79 Years | 0 (0.0%) | 0 (0.0%) |
| 80 to 84 Years | 9 (1.0%) | 0 (0.0%) |
| 85 Years and over | 0 (0.0%) | 0 (0.0%) |
| Total | 877 (100.0%) | 1,089 (100.0%) |
Families and Households in Spinnerstown
Median Family Size in Spinnerstown
The median family size in Spinnerstown is 3.24 persons per family, with single male/father families (35 | 6.1%) accounting for the largest median family size of 3.63 persons per family. On the other hand, married-couple families (528 | 92.1%) represent the smallest median family size with 3.20 persons per family.
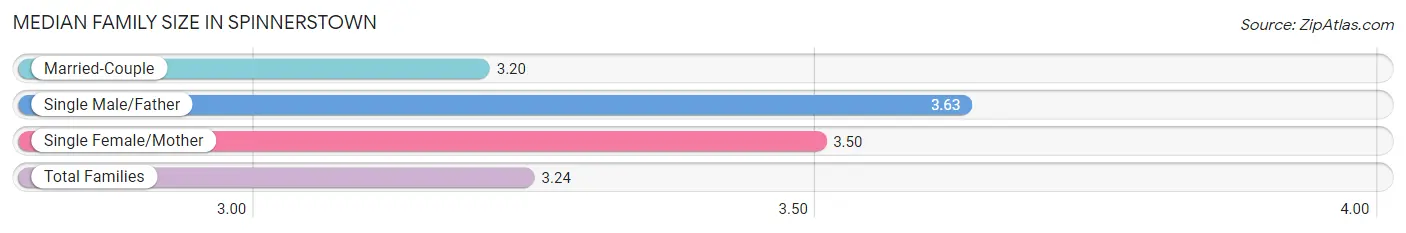
| Family Type | # Families | Family Size |
| Married-Couple | 528 (92.1%) | 3.20 |
| Single Male/Father | 35 (6.1%) | 3.63 |
| Single Female/Mother | 10 (1.8%) | 3.50 |
| Total Families | 573 (100.0%) | 3.24 |
Median Household Size in Spinnerstown
The median household size in Spinnerstown is 3.02 persons per household, with single female/mother households (10 | 1.5%) accounting for the largest median household size of 4.4 persons per household. non-family households (78 | 12.0%) represent the smallest median household size with 1.19 persons per household.
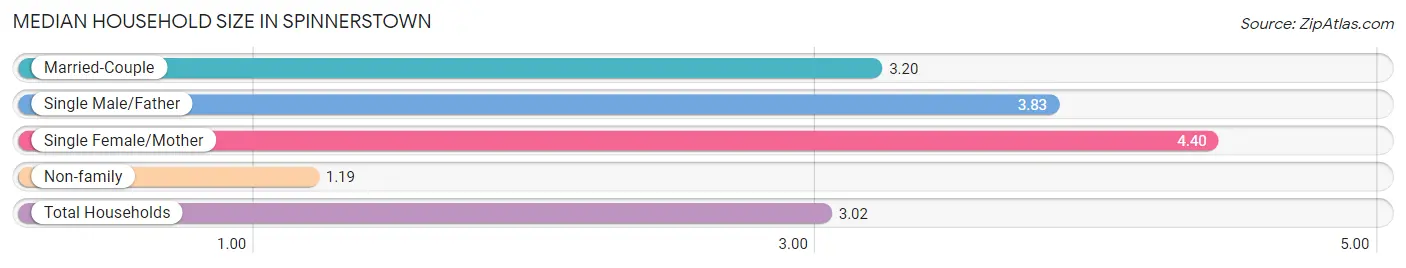
| Household Type | # Households | Household Size |
| Married-Couple | 528 (81.1%) | 3.20 |
| Single Male/Father | 35 (5.4%) | 3.83 |
| Single Female/Mother | 10 (1.5%) | 4.40 |
| Non-family | 78 (12.0%) | 1.19 |
| Total Households | 651 (100.0%) | 3.02 |
Household Size by Marriage Status in Spinnerstown
Out of a total of 651 households in Spinnerstown, 573 (88.0%) are family households, while 78 (12.0%) are nonfamily households. The most numerous type of family households are 2-person households, comprising 220, and the most common type of nonfamily households are 1-person households, comprising 64.
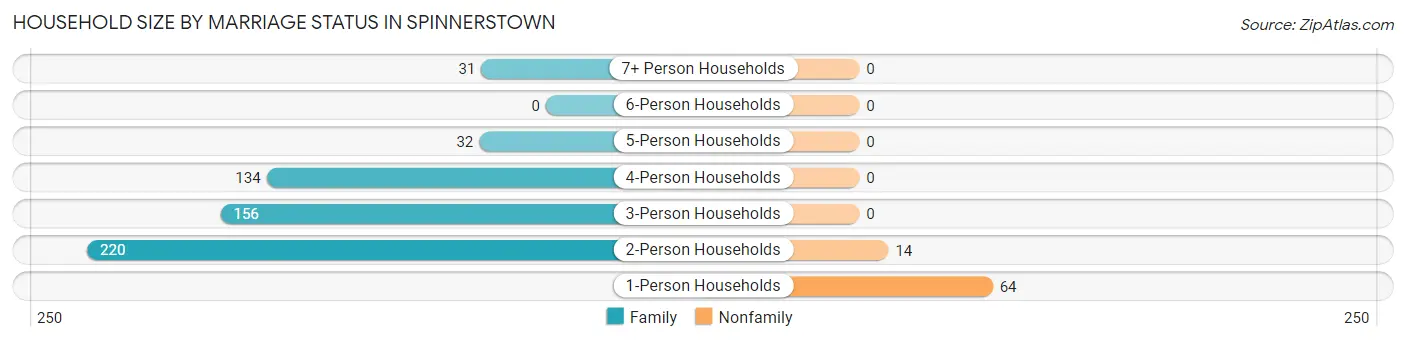
| Household Size | Family Households | Nonfamily Households |
| 1-Person Households | - | 64 (9.8%) |
| 2-Person Households | 220 (33.8%) | 14 (2.1%) |
| 3-Person Households | 156 (24.0%) | 0 (0.0%) |
| 4-Person Households | 134 (20.6%) | 0 (0.0%) |
| 5-Person Households | 32 (4.9%) | 0 (0.0%) |
| 6-Person Households | 0 (0.0%) | 0 (0.0%) |
| 7+ Person Households | 31 (4.8%) | 0 (0.0%) |
| Total | 573 (88.0%) | 78 (12.0%) |
Female Fertility in Spinnerstown
Fertility by Age in Spinnerstown
| Age Bracket | Women with Births | Births / 1,000 Women |
| 15 to 19 years | 0 (0.0%) | 0.0 |
| 20 to 34 years | 0 (0.0%) | 0.0 |
| 35 to 50 years | 0 (0.0%) | 0.0 |
| Total | 0 (0.0%) | 0.0 |
Fertility by Age by Marriage Status in Spinnerstown
| Age Bracket | Married | Unmarried |
| 15 to 19 years | 0 (0.0%) | 0 (0.0%) |
| 20 to 34 years | 0 (0.0%) | 0 (0.0%) |
| 35 to 50 years | 0 (0.0%) | 0 (0.0%) |
| Total | 0 (0.0%) | 0 (0.0%) |
Fertility by Education in Spinnerstown
| Educational Attainment | Women with Births | Births / 1,000 Women |
| Less than High School | 0 (0.0%) | 0.0 |
| High School Diploma | 0 (0.0%) | 0.0 |
| College or Associate's Degree | 0 (0.0%) | 0.0 |
| Bachelor's Degree | 0 (0.0%) | 0.0 |
| Graduate Degree | 0 (0.0%) | 0.0 |
| Total | 0 (0.0%) | 0.0 |
Fertility by Education by Marriage Status in Spinnerstown
| Educational Attainment | Married | Unmarried |
| Less than High School | 0 (0.0%) | 0 (0.0%) |
| High School Diploma | 0 (0.0%) | 0 (0.0%) |
| College or Associate's Degree | 0 (0.0%) | 0 (0.0%) |
| Bachelor's Degree | 0 (0.0%) | 0 (0.0%) |
| Graduate Degree | 0 (0.0%) | 0 (0.0%) |
| Total | 0 (0.0%) | 0 (0.0%) |
Employment Characteristics in Spinnerstown
Employment by Class of Employer in Spinnerstown
Among the 1,065 employed individuals in Spinnerstown, private company employees (612 | 57.5%), local government employees (158 | 14.8%), and not-for-profit organizations (113 | 10.6%) make up the most common classes of employment.
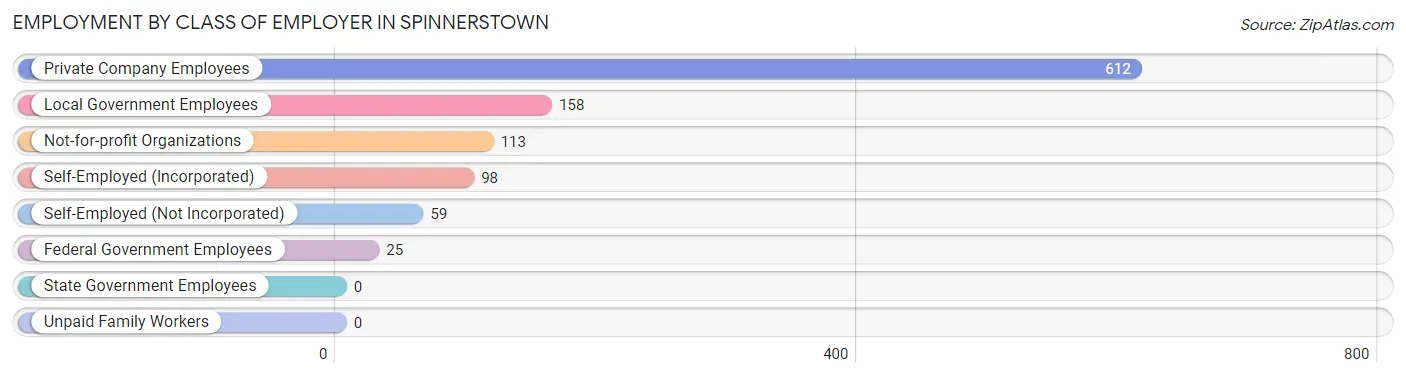
| Employer Class | # Employees | % Employees |
| Private Company Employees | 612 | 57.5% |
| Self-Employed (Incorporated) | 98 | 9.2% |
| Self-Employed (Not Incorporated) | 59 | 5.5% |
| Not-for-profit Organizations | 113 | 10.6% |
| Local Government Employees | 158 | 14.8% |
| State Government Employees | 0 | 0.0% |
| Federal Government Employees | 25 | 2.4% |
| Unpaid Family Workers | 0 | 0.0% |
| Total | 1,065 | 100.0% |
Employment Status by Age in Spinnerstown
According to the labor force statistics for Spinnerstown, out of the total population over 16 years of age (1,554), 71.4% or 1,110 individuals are in the labor force, with 4.0% or 44 of them unemployed. The age group with the highest labor force participation rate is 30 to 34 years, with 100.0% or 47 individuals in the labor force. Within the labor force, the 55 to 59 years age range has the highest percentage of unemployed individuals, with 14.8% or 24 of them being unemployed.
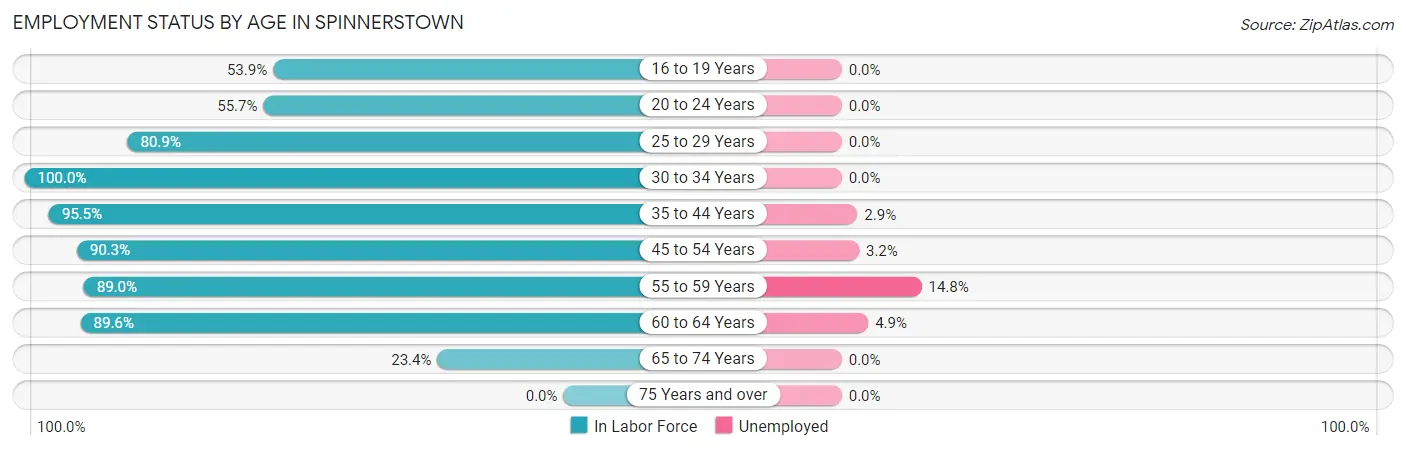
| Age Bracket | In Labor Force | Unemployed |
| 16 to 19 Years | 76 (53.9%) | 0 (0.0%) |
| 20 to 24 Years | 54 (55.7%) | 0 (0.0%) |
| 25 to 29 Years | 123 (80.9%) | 0 (0.0%) |
| 30 to 34 Years | 47 (100.0%) | 0 (0.0%) |
| 35 to 44 Years | 105 (95.5%) | 3 (2.9%) |
| 45 to 54 Years | 371 (90.3%) | 12 (3.2%) |
| 55 to 59 Years | 162 (89.0%) | 24 (14.8%) |
| 60 to 64 Years | 103 (89.6%) | 5 (4.9%) |
| 65 to 74 Years | 68 (23.4%) | 0 (0.0%) |
| 75 Years and over | 0 (0.0%) | 0 (0.0%) |
| Total | 1,110 (71.4%) | 44 (4.0%) |
Employment Status by Educational Attainment in Spinnerstown
According to labor force statistics for Spinnerstown, 89.6% of individuals (911) out of the total population between 25 and 64 years of age (1,017) are in the labor force, with 4.9% or 45 of them being unemployed. The group with the highest labor force participation rate are those with the educational attainment of college / associate degree, with 100.0% or 252 individuals in the labor force. Within the labor force, individuals with high school diploma education have the highest percentage of unemployment, with 11.9% or 27 of them being unemployed.
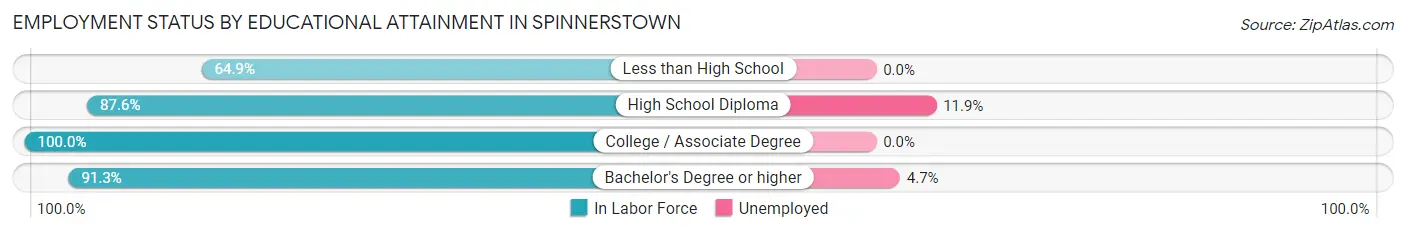
| Educational Attainment | In Labor Force | Unemployed |
| Less than High School | 74 (64.9%) | 0 (0.0%) |
| High School Diploma | 226 (87.6%) | 31 (11.9%) |
| College / Associate Degree | 252 (100.0%) | 0 (0.0%) |
| Bachelor's Degree or higher | 359 (91.3%) | 18 (4.7%) |
| Total | 911 (89.6%) | 50 (4.9%) |
Employment Occupations by Sex in Spinnerstown
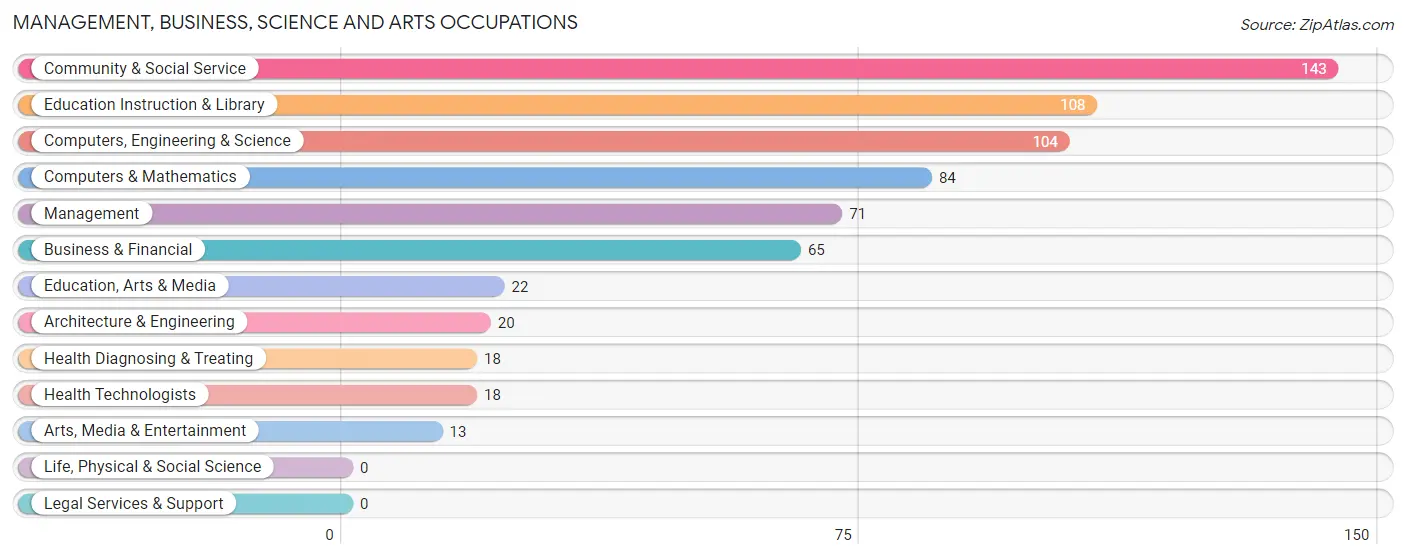
Management, Business, Science and Arts Occupations
The most common Management, Business, Science and Arts occupations in Spinnerstown are Community & Social Service (143 | 13.6%), Education Instruction & Library (108 | 10.3%), Computers, Engineering & Science (104 | 9.9%), Computers & Mathematics (84 | 8.0%), and Management (71 | 6.8%).
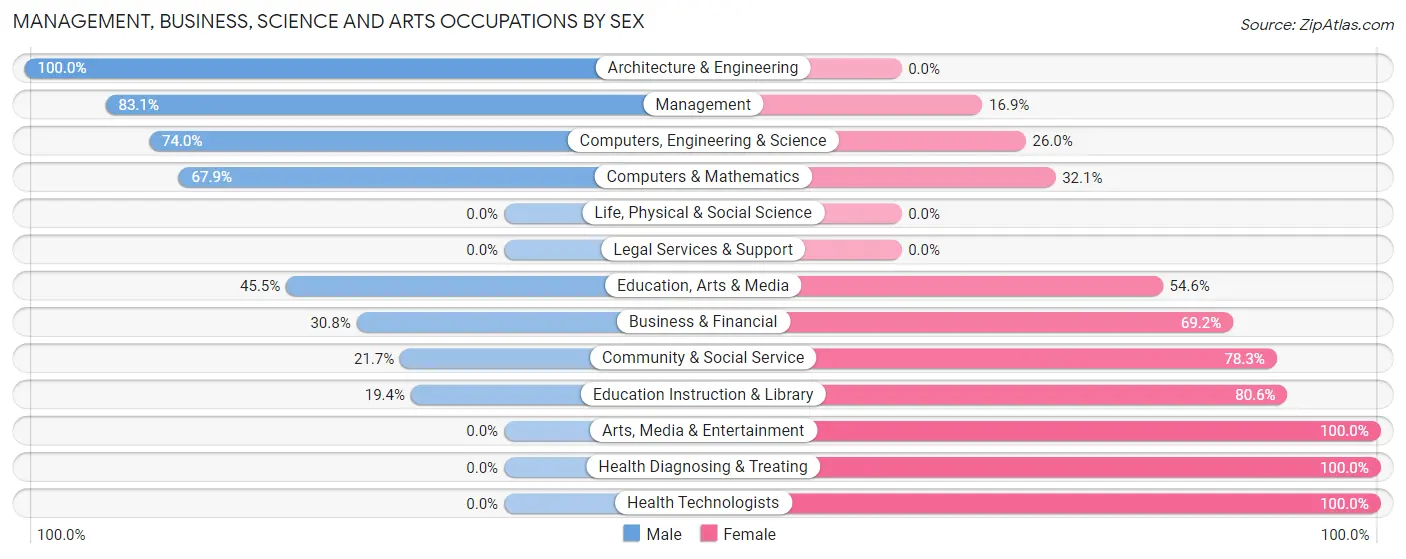
Management, Business, Science and Arts Occupations by Sex
Within the Management, Business, Science and Arts occupations in Spinnerstown, the most male-oriented occupations are Architecture & Engineering (100.0%), Management (83.1%), and Computers, Engineering & Science (74.0%), while the most female-oriented occupations are Arts, Media & Entertainment (100.0%), Health Diagnosing & Treating (100.0%), and Health Technologists (100.0%).
| Occupation | Male | Female |
| Management | 59 (83.1%) | 12 (16.9%) |
| Business & Financial | 20 (30.8%) | 45 (69.2%) |
| Computers, Engineering & Science | 77 (74.0%) | 27 (26.0%) |
| Computers & Mathematics | 57 (67.9%) | 27 (32.1%) |
| Architecture & Engineering | 20 (100.0%) | 0 (0.0%) |
| Life, Physical & Social Science | 0 (0.0%) | 0 (0.0%) |
| Community & Social Service | 31 (21.7%) | 112 (78.3%) |
| Education, Arts & Media | 10 (45.5%) | 12 (54.5%) |
| Legal Services & Support | 0 (0.0%) | 0 (0.0%) |
| Education Instruction & Library | 21 (19.4%) | 87 (80.6%) |
| Arts, Media & Entertainment | 0 (0.0%) | 13 (100.0%) |
| Health Diagnosing & Treating | 0 (0.0%) | 18 (100.0%) |
| Health Technologists | 0 (0.0%) | 18 (100.0%) |
| Total (Category) | 187 (46.6%) | 214 (53.4%) |
| Total (Overall) | 548 (52.1%) | 503 (47.9%) |
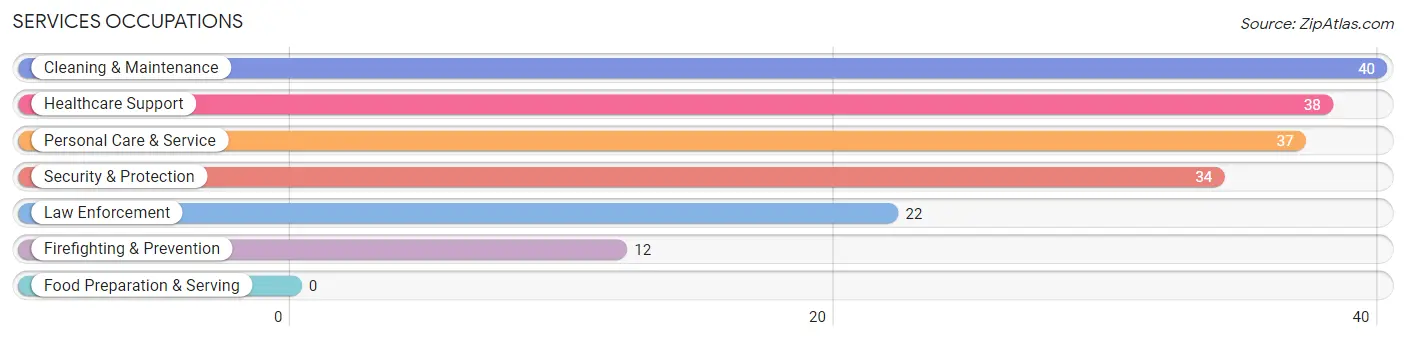
Services Occupations
The most common Services occupations in Spinnerstown are Cleaning & Maintenance (40 | 3.8%), Healthcare Support (38 | 3.6%), Personal Care & Service (37 | 3.5%), Security & Protection (34 | 3.2%), and Law Enforcement (22 | 2.1%).
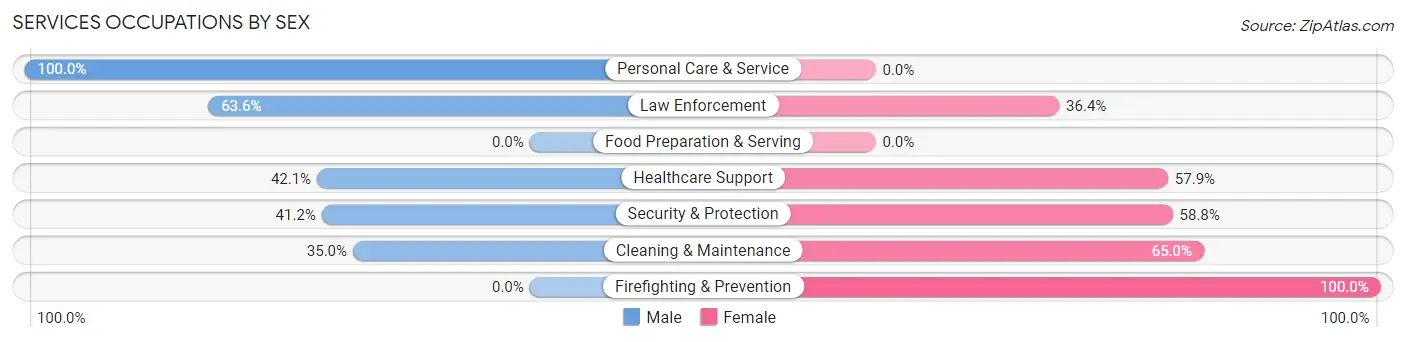
Services Occupations by Sex
Within the Services occupations in Spinnerstown, the most male-oriented occupations are Personal Care & Service (100.0%), Law Enforcement (63.6%), and Healthcare Support (42.1%), while the most female-oriented occupations are Firefighting & Prevention (100.0%), Cleaning & Maintenance (65.0%), and Security & Protection (58.8%).
| Occupation | Male | Female |
| Healthcare Support | 16 (42.1%) | 22 (57.9%) |
| Security & Protection | 14 (41.2%) | 20 (58.8%) |
| Firefighting & Prevention | 0 (0.0%) | 12 (100.0%) |
| Law Enforcement | 14 (63.6%) | 8 (36.4%) |
| Food Preparation & Serving | 0 (0.0%) | 0 (0.0%) |
| Cleaning & Maintenance | 14 (35.0%) | 26 (65.0%) |
| Personal Care & Service | 37 (100.0%) | 0 (0.0%) |
| Total (Category) | 81 (54.4%) | 68 (45.6%) |
| Total (Overall) | 548 (52.1%) | 503 (47.9%) |
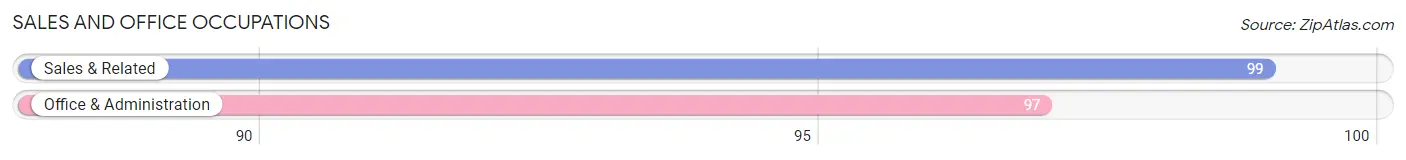
Sales and Office Occupations
The most common Sales and Office occupations in Spinnerstown are Sales & Related (99 | 9.4%), and Office & Administration (97 | 9.2%).
Sales and Office Occupations by Sex
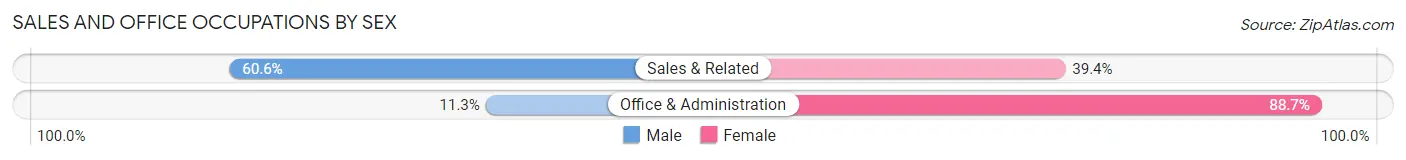
| Occupation | Male | Female |
| Sales & Related | 60 (60.6%) | 39 (39.4%) |
| Office & Administration | 11 (11.3%) | 86 (88.7%) |
| Total (Category) | 71 (36.2%) | 125 (63.8%) |
| Total (Overall) | 548 (52.1%) | 503 (47.9%) |
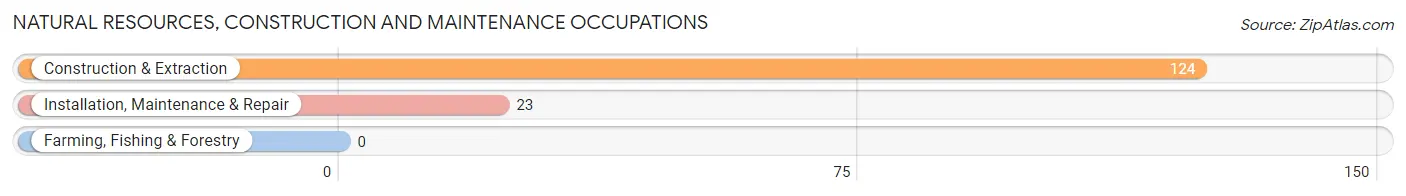
Natural Resources, Construction and Maintenance Occupations
The most common Natural Resources, Construction and Maintenance occupations in Spinnerstown are Construction & Extraction (124 | 11.8%), and Installation, Maintenance & Repair (23 | 2.2%).
Natural Resources, Construction and Maintenance Occupations by Sex
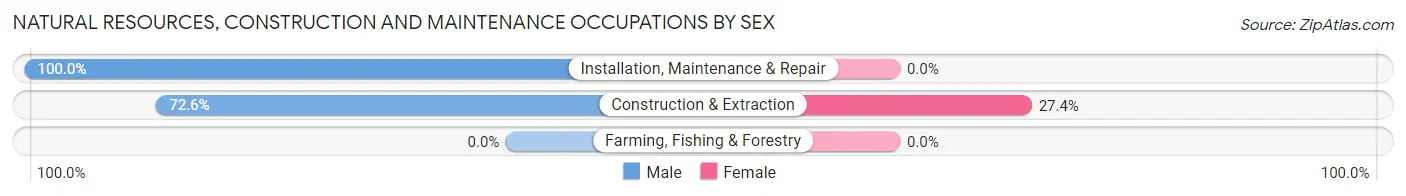
| Occupation | Male | Female |
| Farming, Fishing & Forestry | 0 (0.0%) | 0 (0.0%) |
| Construction & Extraction | 90 (72.6%) | 34 (27.4%) |
| Installation, Maintenance & Repair | 23 (100.0%) | 0 (0.0%) |
| Total (Category) | 113 (76.9%) | 34 (23.1%) |
| Total (Overall) | 548 (52.1%) | 503 (47.9%) |
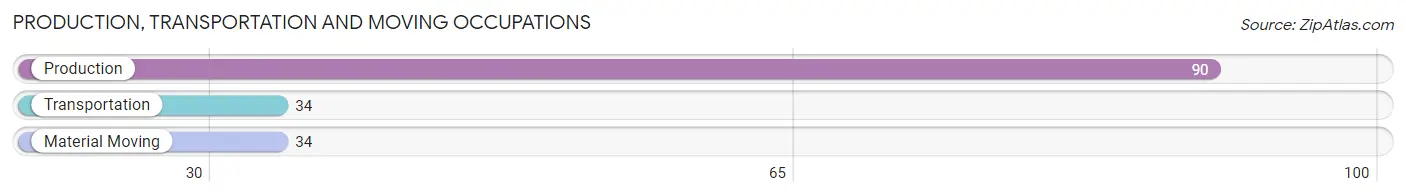
Production, Transportation and Moving Occupations
The most common Production, Transportation and Moving occupations in Spinnerstown are Production (90 | 8.6%), Transportation (34 | 3.2%), and Material Moving (34 | 3.2%).
Production, Transportation and Moving Occupations by Sex
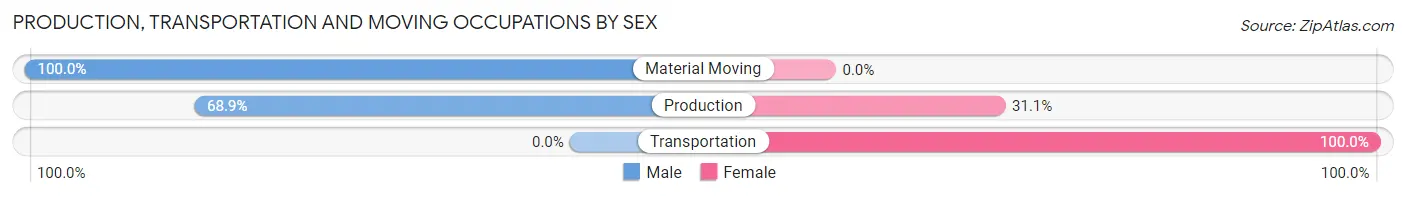
| Occupation | Male | Female |
| Production | 62 (68.9%) | 28 (31.1%) |
| Transportation | 0 (0.0%) | 34 (100.0%) |
| Material Moving | 34 (100.0%) | 0 (0.0%) |
| Total (Category) | 96 (60.8%) | 62 (39.2%) |
| Total (Overall) | 548 (52.1%) | 503 (47.9%) |
Employment Industries by Sex in Spinnerstown
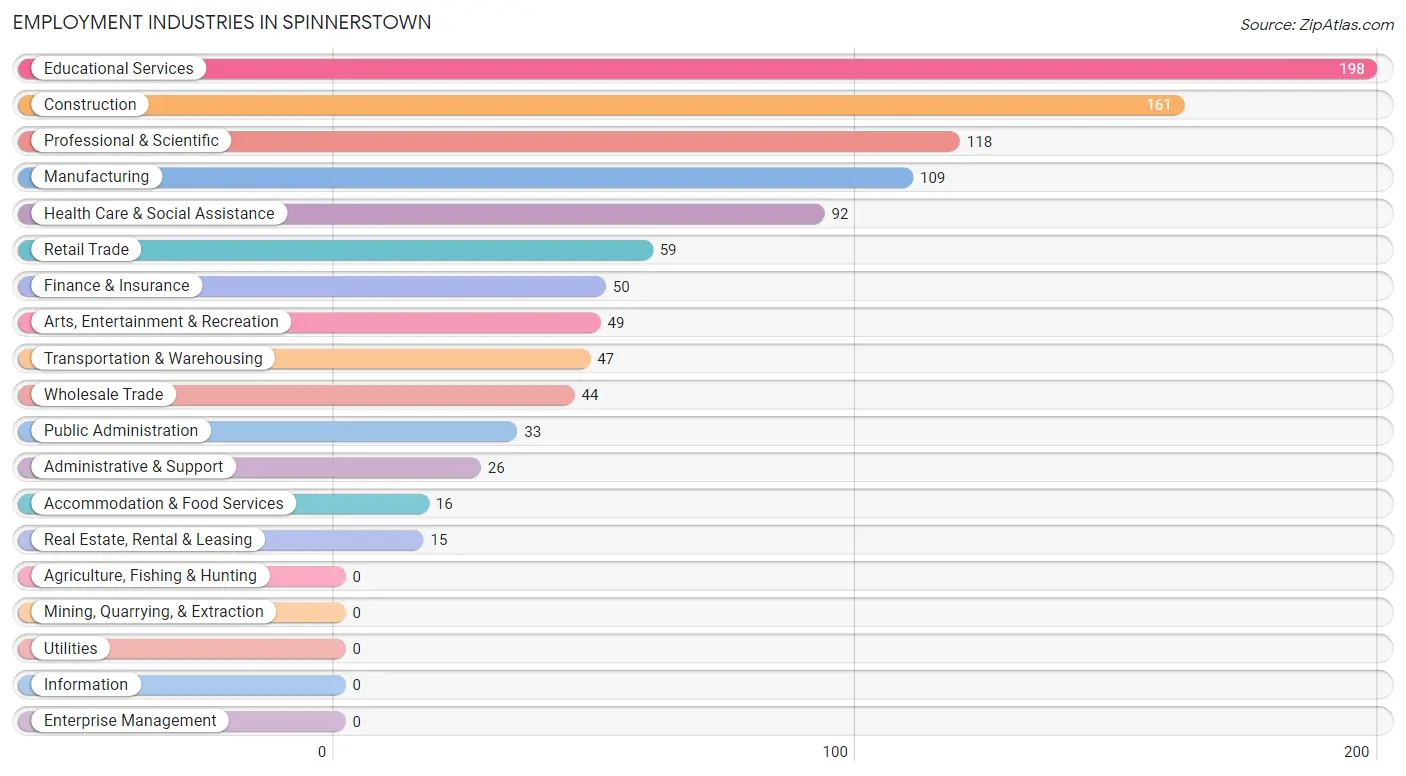
Employment Industries in Spinnerstown
The major employment industries in Spinnerstown include Educational Services (198 | 18.8%), Construction (161 | 15.3%), Professional & Scientific (118 | 11.2%), Manufacturing (109 | 10.4%), and Health Care & Social Assistance (92 | 8.7%).
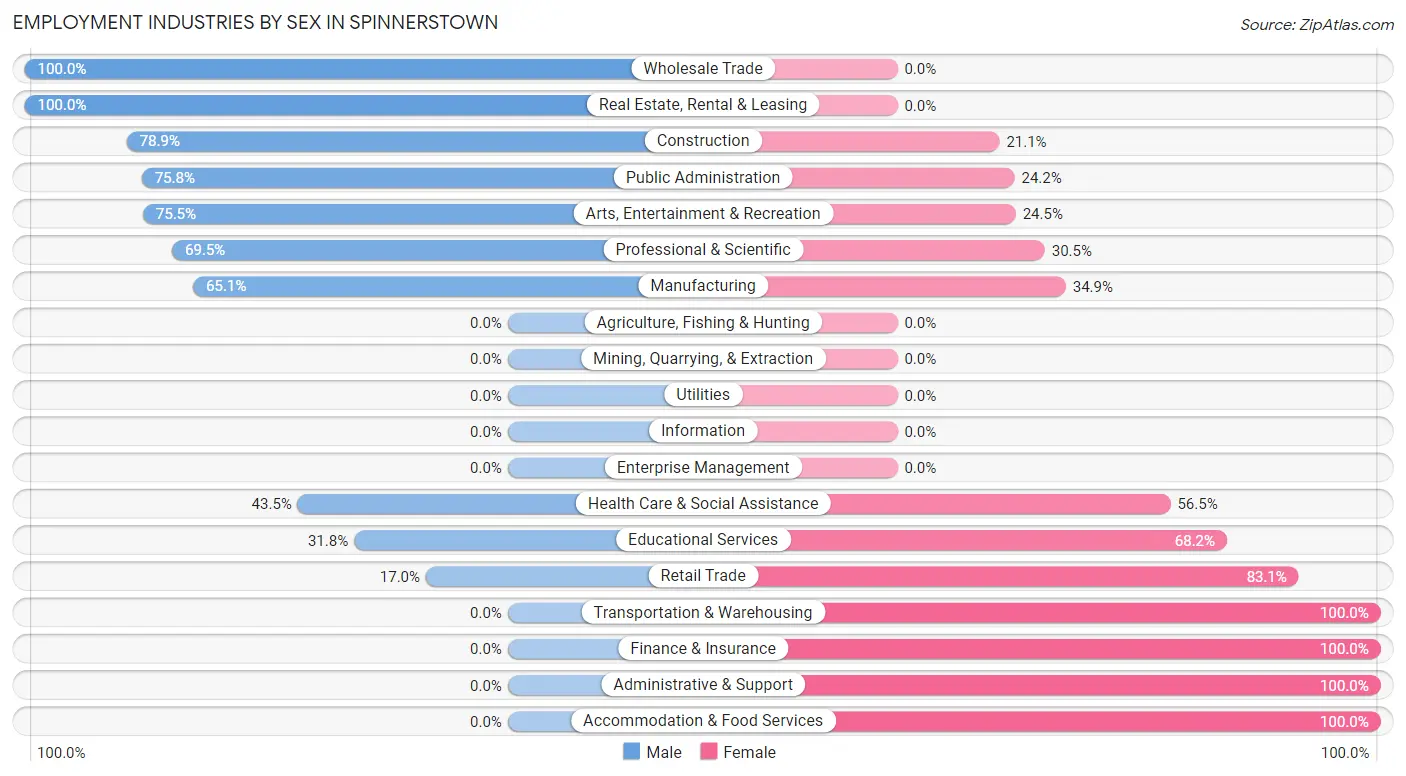
Employment Industries by Sex in Spinnerstown
The Spinnerstown industries that see more men than women are Wholesale Trade (100.0%), Real Estate, Rental & Leasing (100.0%), and Construction (78.9%), whereas the industries that tend to have a higher number of women are Transportation & Warehousing (100.0%), Finance & Insurance (100.0%), and Administrative & Support (100.0%).
| Industry | Male | Female |
| Agriculture, Fishing & Hunting | 0 (0.0%) | 0 (0.0%) |
| Mining, Quarrying, & Extraction | 0 (0.0%) | 0 (0.0%) |
| Construction | 127 (78.9%) | 34 (21.1%) |
| Manufacturing | 71 (65.1%) | 38 (34.9%) |
| Wholesale Trade | 44 (100.0%) | 0 (0.0%) |
| Retail Trade | 10 (17.0%) | 49 (83.1%) |
| Transportation & Warehousing | 0 (0.0%) | 47 (100.0%) |
| Utilities | 0 (0.0%) | 0 (0.0%) |
| Information | 0 (0.0%) | 0 (0.0%) |
| Finance & Insurance | 0 (0.0%) | 50 (100.0%) |
| Real Estate, Rental & Leasing | 15 (100.0%) | 0 (0.0%) |
| Professional & Scientific | 82 (69.5%) | 36 (30.5%) |
| Enterprise Management | 0 (0.0%) | 0 (0.0%) |
| Administrative & Support | 0 (0.0%) | 26 (100.0%) |
| Educational Services | 63 (31.8%) | 135 (68.2%) |
| Health Care & Social Assistance | 40 (43.5%) | 52 (56.5%) |
| Arts, Entertainment & Recreation | 37 (75.5%) | 12 (24.5%) |
| Accommodation & Food Services | 0 (0.0%) | 16 (100.0%) |
| Public Administration | 25 (75.8%) | 8 (24.2%) |
| Total | 548 (52.1%) | 503 (47.9%) |
Education in Spinnerstown
School Enrollment in Spinnerstown
The most common levels of schooling among the 508 students in Spinnerstown are high school (136 | 26.8%), middle school (128 | 25.2%), and elementary school (110 | 21.6%).
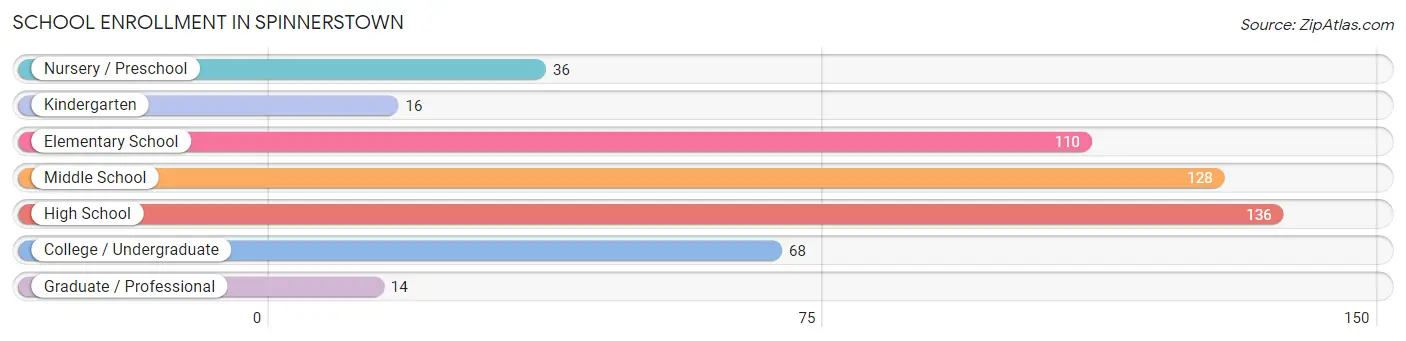
| School Level | # Students | % Students |
| Nursery / Preschool | 36 | 7.1% |
| Kindergarten | 16 | 3.2% |
| Elementary School | 110 | 21.6% |
| Middle School | 128 | 25.2% |
| High School | 136 | 26.8% |
| College / Undergraduate | 68 | 13.4% |
| Graduate / Professional | 14 | 2.8% |
| Total | 508 | 100.0% |
School Enrollment by Age by Funding Source in Spinnerstown
Out of a total of 508 students who are enrolled in schools in Spinnerstown, 169 (33.3%) attend a private institution, while the remaining 339 (66.7%) are enrolled in public schools. The age group of 20 to 24 year olds has the highest likelihood of being enrolled in private schools, with 14 (100.0% in the age bracket) enrolled. Conversely, the age group of 35 years and over has the lowest likelihood of being enrolled in a private school, with 8 (100.0% in the age bracket) attending a public institution.
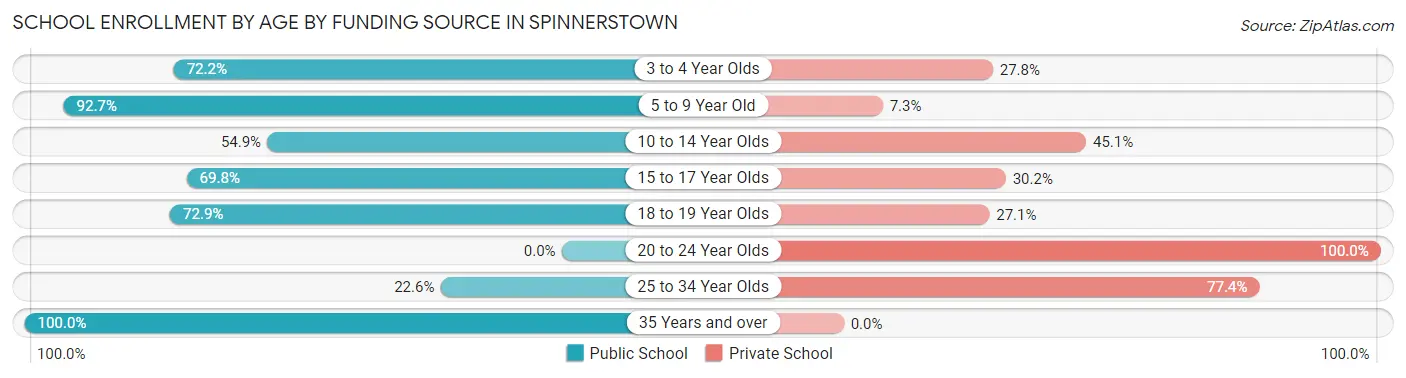
| Age Bracket | Public School | Private School |
| 3 to 4 Year Olds | 26 (72.2%) | 10 (27.8%) |
| 5 to 9 Year Old | 102 (92.7%) | 8 (7.3%) |
| 10 to 14 Year Olds | 79 (54.9%) | 65 (45.1%) |
| 15 to 17 Year Olds | 74 (69.8%) | 32 (30.2%) |
| 18 to 19 Year Olds | 43 (72.9%) | 16 (27.1%) |
| 20 to 24 Year Olds | 0 (0.0%) | 14 (100.0%) |
| 25 to 34 Year Olds | 7 (22.6%) | 24 (77.4%) |
| 35 Years and over | 8 (100.0%) | 0 (0.0%) |
| Total | 339 (66.7%) | 169 (33.3%) |
Educational Attainment by Field of Study in Spinnerstown
Business (112 | 16.1%), engineering (111 | 16.0%), computers & mathematics (96 | 13.8%), education (82 | 11.8%), and bio, nature & agricultural (51 | 7.3%) are the most common fields of study among 694 individuals in Spinnerstown who have obtained a bachelor's degree or higher.
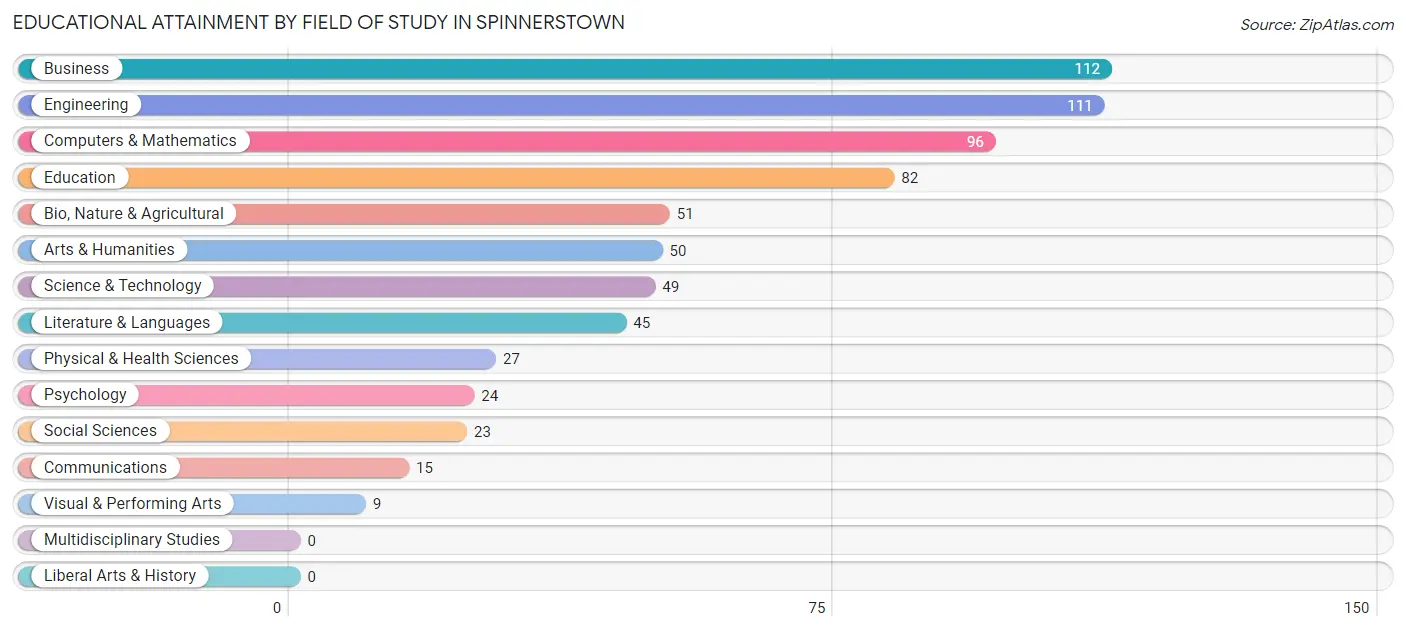
| Field of Study | # Graduates | % Graduates |
| Computers & Mathematics | 96 | 13.8% |
| Bio, Nature & Agricultural | 51 | 7.3% |
| Physical & Health Sciences | 27 | 3.9% |
| Psychology | 24 | 3.5% |
| Social Sciences | 23 | 3.3% |
| Engineering | 111 | 16.0% |
| Multidisciplinary Studies | 0 | 0.0% |
| Science & Technology | 49 | 7.1% |
| Business | 112 | 16.1% |
| Education | 82 | 11.8% |
| Literature & Languages | 45 | 6.5% |
| Liberal Arts & History | 0 | 0.0% |
| Visual & Performing Arts | 9 | 1.3% |
| Communications | 15 | 2.2% |
| Arts & Humanities | 50 | 7.2% |
| Total | 694 | 100.0% |
Transportation & Commute in Spinnerstown
Vehicle Availability by Sex in Spinnerstown
The most prevalent vehicle ownership categories in Spinnerstown are males with 2 vehicles (254, accounting for 45.8%) and females with 2 vehicles (244, making up 49.8%).
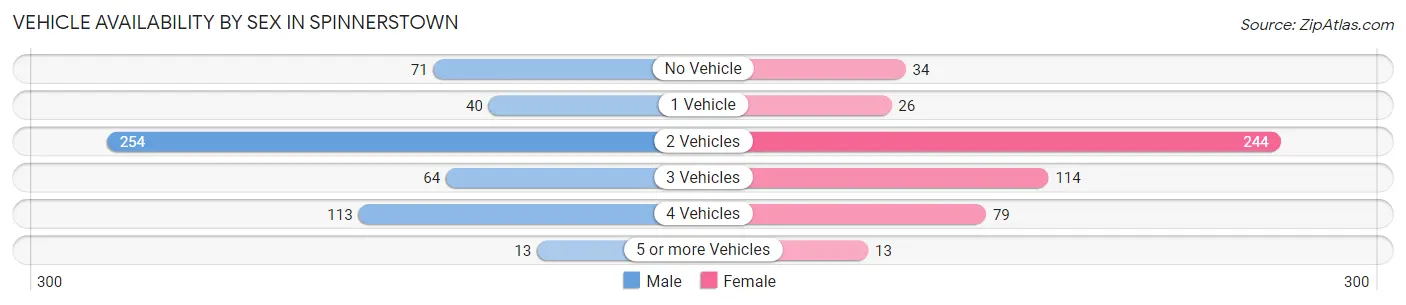
| Vehicles Available | Male | Female |
| No Vehicle | 71 (12.8%) | 34 (6.7%) |
| 1 Vehicle | 40 (7.2%) | 26 (5.1%) |
| 2 Vehicles | 254 (45.8%) | 244 (47.8%) |
| 3 Vehicles | 64 (11.5%) | 114 (22.4%) |
| 4 Vehicles | 113 (20.4%) | 79 (15.5%) |
| 5 or more Vehicles | 13 (2.3%) | 13 (2.5%) |
| Total | 555 (100.0%) | 510 (100.0%) |
Commute Time in Spinnerstown
The most frequently occuring commute durations in Spinnerstown are 30 to 34 minutes (188 commuters, 20.6%), 45 to 59 minutes (145 commuters, 15.9%), and 20 to 24 minutes (104 commuters, 11.4%).
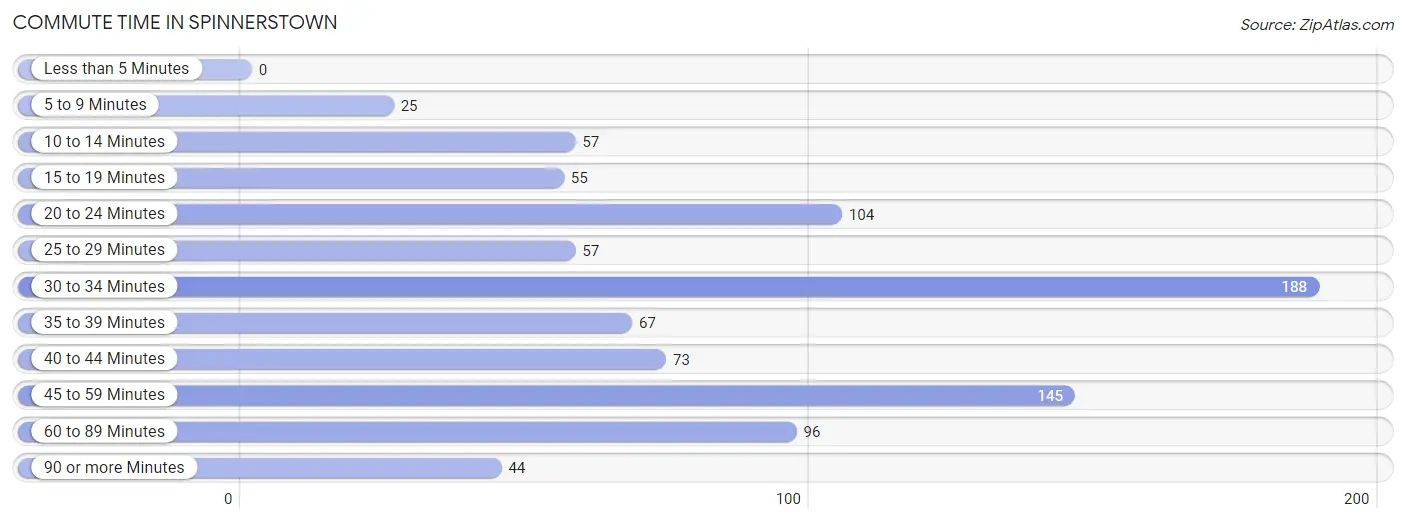
| Commute Time | # Commuters | % Commuters |
| Less than 5 Minutes | 0 | 0.0% |
| 5 to 9 Minutes | 25 | 2.7% |
| 10 to 14 Minutes | 57 | 6.3% |
| 15 to 19 Minutes | 55 | 6.0% |
| 20 to 24 Minutes | 104 | 11.4% |
| 25 to 29 Minutes | 57 | 6.3% |
| 30 to 34 Minutes | 188 | 20.6% |
| 35 to 39 Minutes | 67 | 7.3% |
| 40 to 44 Minutes | 73 | 8.0% |
| 45 to 59 Minutes | 145 | 15.9% |
| 60 to 89 Minutes | 96 | 10.5% |
| 90 or more Minutes | 44 | 4.8% |
Commute Time by Sex in Spinnerstown
The most common commute times in Spinnerstown are 30 to 34 minutes (132 commuters, 27.9%) for males and 45 to 59 minutes (107 commuters, 24.5%) for females.
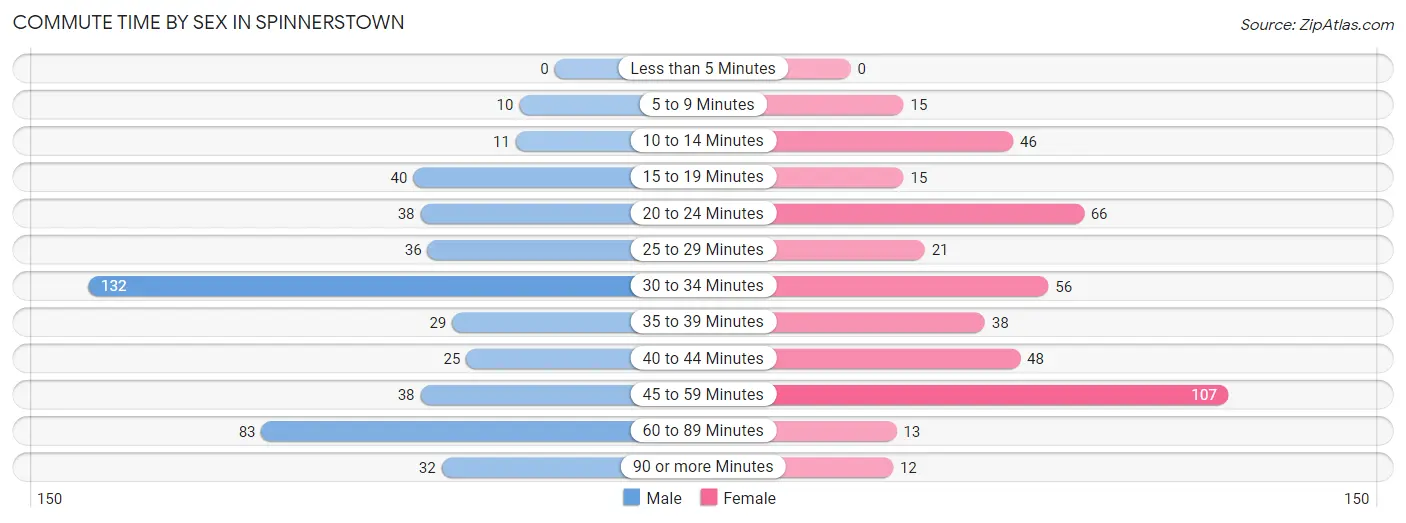
| Commute Time | Male | Female |
| Less than 5 Minutes | 0 (0.0%) | 0 (0.0%) |
| 5 to 9 Minutes | 10 (2.1%) | 15 (3.4%) |
| 10 to 14 Minutes | 11 (2.3%) | 46 (10.5%) |
| 15 to 19 Minutes | 40 (8.4%) | 15 (3.4%) |
| 20 to 24 Minutes | 38 (8.0%) | 66 (15.1%) |
| 25 to 29 Minutes | 36 (7.6%) | 21 (4.8%) |
| 30 to 34 Minutes | 132 (27.9%) | 56 (12.8%) |
| 35 to 39 Minutes | 29 (6.1%) | 38 (8.7%) |
| 40 to 44 Minutes | 25 (5.3%) | 48 (11.0%) |
| 45 to 59 Minutes | 38 (8.0%) | 107 (24.5%) |
| 60 to 89 Minutes | 83 (17.5%) | 13 (3.0%) |
| 90 or more Minutes | 32 (6.8%) | 12 (2.8%) |
Time of Departure to Work by Sex in Spinnerstown
The most frequent times of departure to work in Spinnerstown are 7:00 AM to 7:29 AM (113, 23.8%) for males and 7:30 AM to 7:59 AM (97, 22.2%) for females.
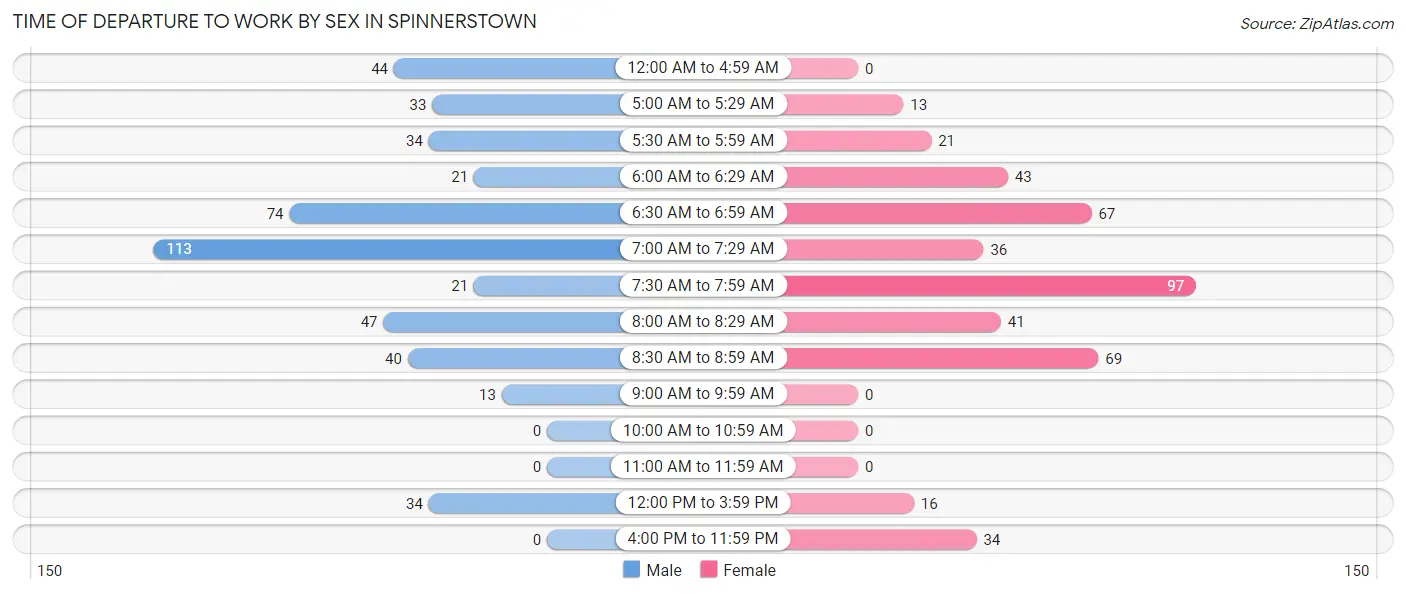
| Time of Departure | Male | Female |
| 12:00 AM to 4:59 AM | 44 (9.3%) | 0 (0.0%) |
| 5:00 AM to 5:29 AM | 33 (7.0%) | 13 (3.0%) |
| 5:30 AM to 5:59 AM | 34 (7.2%) | 21 (4.8%) |
| 6:00 AM to 6:29 AM | 21 (4.4%) | 43 (9.8%) |
| 6:30 AM to 6:59 AM | 74 (15.6%) | 67 (15.3%) |
| 7:00 AM to 7:29 AM | 113 (23.8%) | 36 (8.2%) |
| 7:30 AM to 7:59 AM | 21 (4.4%) | 97 (22.2%) |
| 8:00 AM to 8:29 AM | 47 (9.9%) | 41 (9.4%) |
| 8:30 AM to 8:59 AM | 40 (8.4%) | 69 (15.8%) |
| 9:00 AM to 9:59 AM | 13 (2.7%) | 0 (0.0%) |
| 10:00 AM to 10:59 AM | 0 (0.0%) | 0 (0.0%) |
| 11:00 AM to 11:59 AM | 0 (0.0%) | 0 (0.0%) |
| 12:00 PM to 3:59 PM | 34 (7.2%) | 16 (3.7%) |
| 4:00 PM to 11:59 PM | 0 (0.0%) | 34 (7.8%) |
| Total | 474 (100.0%) | 437 (100.0%) |
Housing Occupancy in Spinnerstown
Occupancy by Ownership in Spinnerstown
Of the total 651 dwellings in Spinnerstown, owner-occupied units account for 633 (97.2%), while renter-occupied units make up 18 (2.8%).
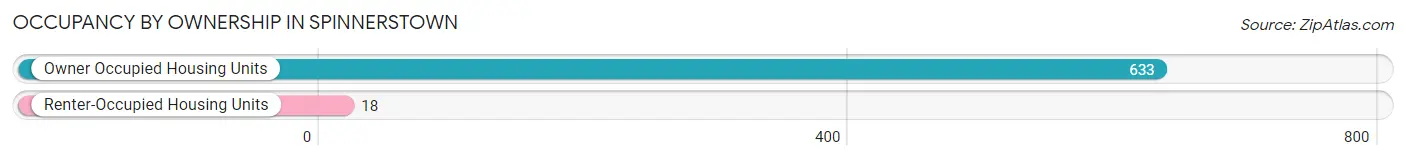
| Occupancy | # Housing Units | % Housing Units |
| Owner Occupied Housing Units | 633 | 97.2% |
| Renter-Occupied Housing Units | 18 | 2.8% |
| Total Occupied Housing Units | 651 | 100.0% |
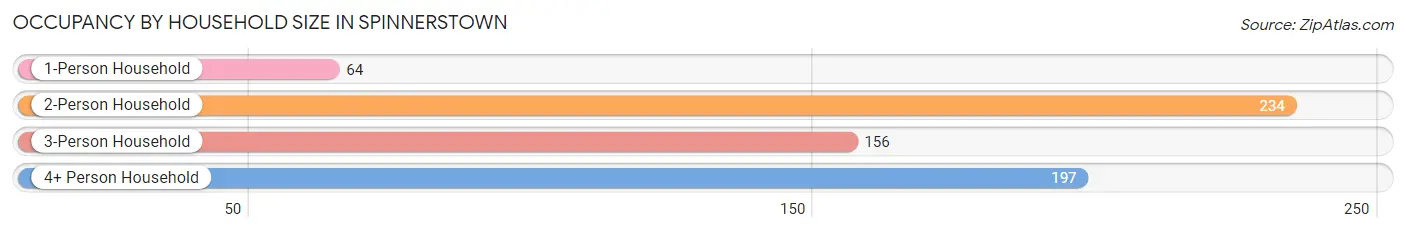
Occupancy by Household Size in Spinnerstown
| Household Size | # Housing Units | % Housing Units |
| 1-Person Household | 64 | 9.8% |
| 2-Person Household | 234 | 35.9% |
| 3-Person Household | 156 | 24.0% |
| 4+ Person Household | 197 | 30.3% |
| Total Housing Units | 651 | 100.0% |
Occupancy by Ownership by Household Size in Spinnerstown
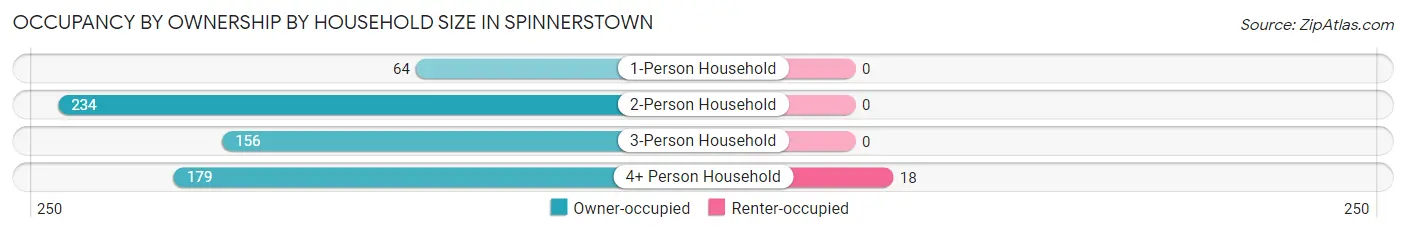
| Household Size | Owner-occupied | Renter-occupied |
| 1-Person Household | 64 (100.0%) | 0 (0.0%) |
| 2-Person Household | 234 (100.0%) | 0 (0.0%) |
| 3-Person Household | 156 (100.0%) | 0 (0.0%) |
| 4+ Person Household | 179 (90.9%) | 18 (9.1%) |
| Total Housing Units | 633 (97.2%) | 18 (2.8%) |
Occupancy by Educational Attainment in Spinnerstown
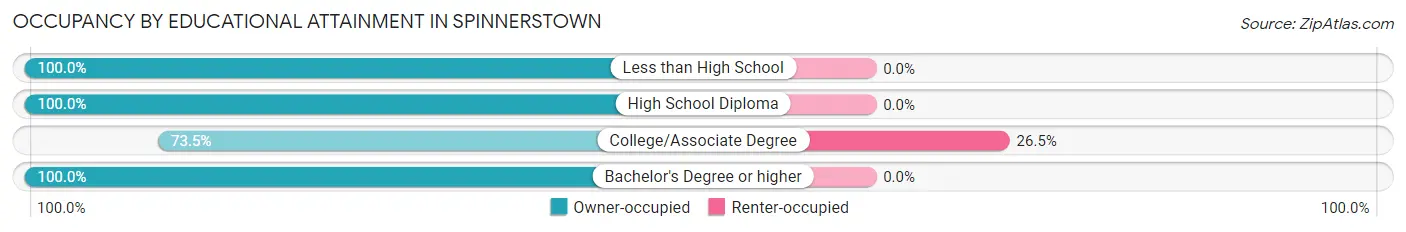
| Household Size | Owner-occupied | Renter-occupied |
| Less than High School | 42 (100.0%) | 0 (0.0%) |
| High School Diploma | 156 (100.0%) | 0 (0.0%) |
| College/Associate Degree | 50 (73.5%) | 18 (26.5%) |
| Bachelor's Degree or higher | 385 (100.0%) | 0 (0.0%) |
Occupancy by Age of Householder in Spinnerstown
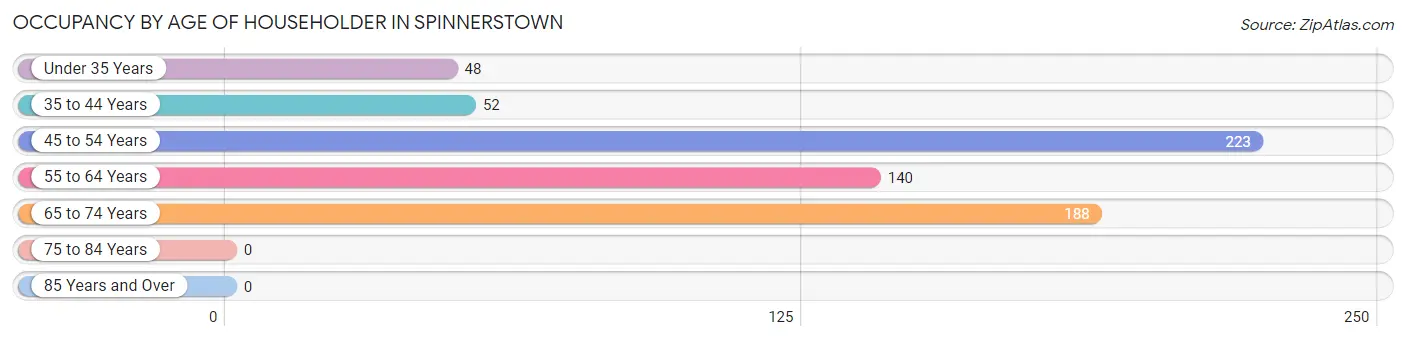
| Age Bracket | # Households | % Households |
| Under 35 Years | 48 | 7.4% |
| 35 to 44 Years | 52 | 8.0% |
| 45 to 54 Years | 223 | 34.3% |
| 55 to 64 Years | 140 | 21.5% |
| 65 to 74 Years | 188 | 28.9% |
| 75 to 84 Years | 0 | 0.0% |
| 85 Years and Over | 0 | 0.0% |
| Total | 651 | 100.0% |
Housing Finances in Spinnerstown
Median Income by Occupancy in Spinnerstown
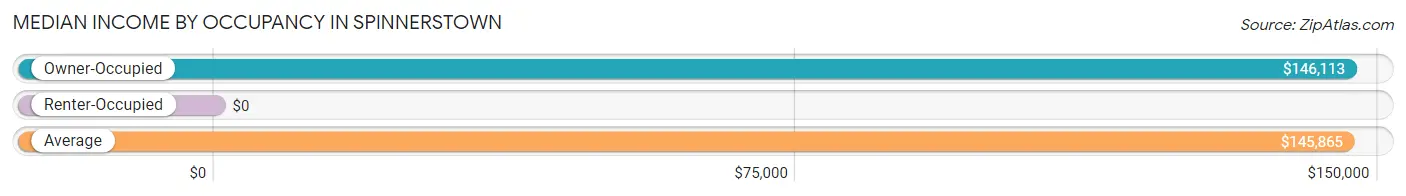
| Occupancy Type | # Households | Median Income |
| Owner-Occupied | 633 (97.2%) | $146,113 |
| Renter-Occupied | 18 (2.8%) | $0 |
| Average | 651 (100.0%) | $145,865 |
Occupancy by Householder Income Bracket in Spinnerstown
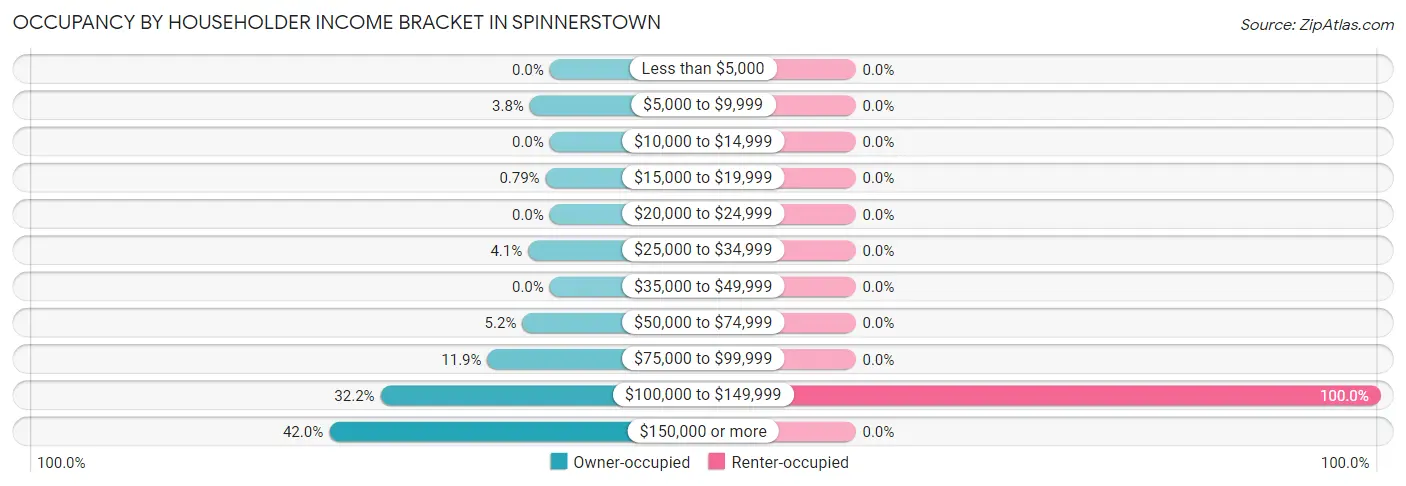
| Income Bracket | Owner-occupied | Renter-occupied |
| Less than $5,000 | 0 (0.0%) | 0 (0.0%) |
| $5,000 to $9,999 | 24 (3.8%) | 0 (0.0%) |
| $10,000 to $14,999 | 0 (0.0%) | 0 (0.0%) |
| $15,000 to $19,999 | 5 (0.8%) | 0 (0.0%) |
| $20,000 to $24,999 | 0 (0.0%) | 0 (0.0%) |
| $25,000 to $34,999 | 26 (4.1%) | 0 (0.0%) |
| $35,000 to $49,999 | 0 (0.0%) | 0 (0.0%) |
| $50,000 to $74,999 | 33 (5.2%) | 0 (0.0%) |
| $75,000 to $99,999 | 75 (11.8%) | 0 (0.0%) |
| $100,000 to $149,999 | 204 (32.2%) | 18 (100.0%) |
| $150,000 or more | 266 (42.0%) | 0 (0.0%) |
| Total | 633 (100.0%) | 18 (100.0%) |
Monthly Housing Cost Tiers in Spinnerstown
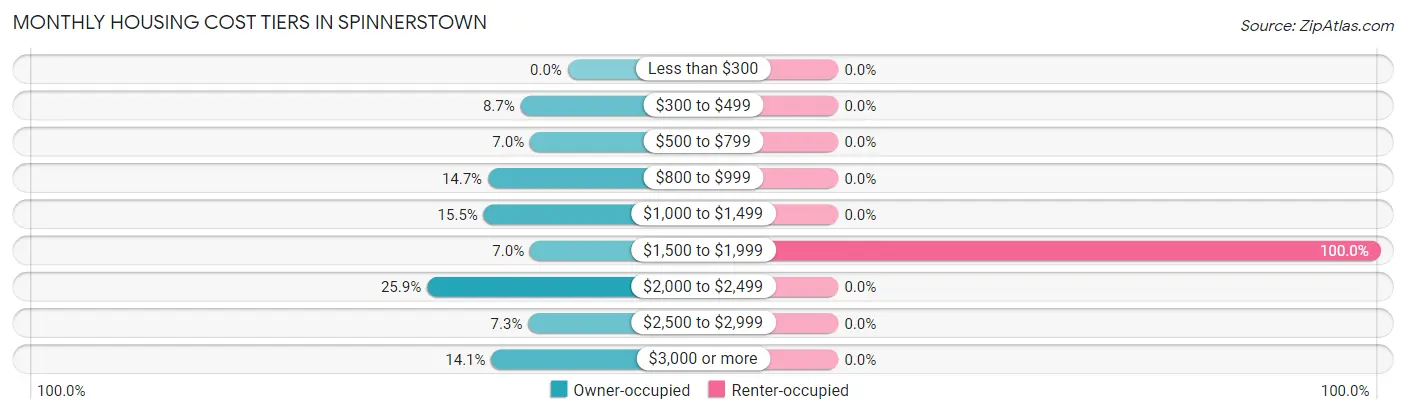
| Monthly Cost | Owner-occupied | Renter-occupied |
| Less than $300 | 0 (0.0%) | 0 (0.0%) |
| $300 to $499 | 55 (8.7%) | 0 (0.0%) |
| $500 to $799 | 44 (7.0%) | 0 (0.0%) |
| $800 to $999 | 93 (14.7%) | 0 (0.0%) |
| $1,000 to $1,499 | 98 (15.5%) | 0 (0.0%) |
| $1,500 to $1,999 | 44 (7.0%) | 18 (100.0%) |
| $2,000 to $2,499 | 164 (25.9%) | 0 (0.0%) |
| $2,500 to $2,999 | 46 (7.3%) | 0 (0.0%) |
| $3,000 or more | 89 (14.1%) | 0 (0.0%) |
| Total | 633 (100.0%) | 18 (100.0%) |
Physical Housing Characteristics in Spinnerstown
Housing Structures in Spinnerstown
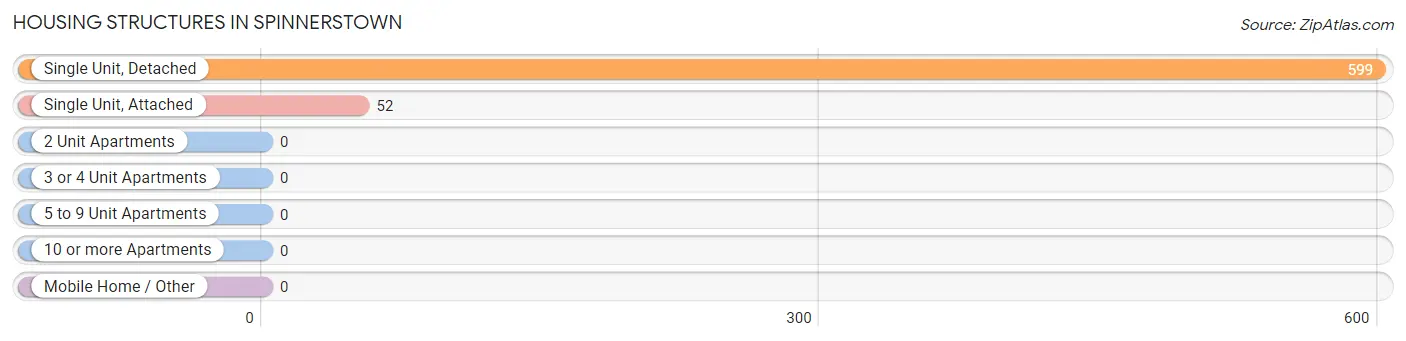
| Structure Type | # Housing Units | % Housing Units |
| Single Unit, Detached | 599 | 92.0% |
| Single Unit, Attached | 52 | 8.0% |
| 2 Unit Apartments | 0 | 0.0% |
| 3 or 4 Unit Apartments | 0 | 0.0% |
| 5 to 9 Unit Apartments | 0 | 0.0% |
| 10 or more Apartments | 0 | 0.0% |
| Mobile Home / Other | 0 | 0.0% |
| Total | 651 | 100.0% |
Housing Structures by Occupancy in Spinnerstown
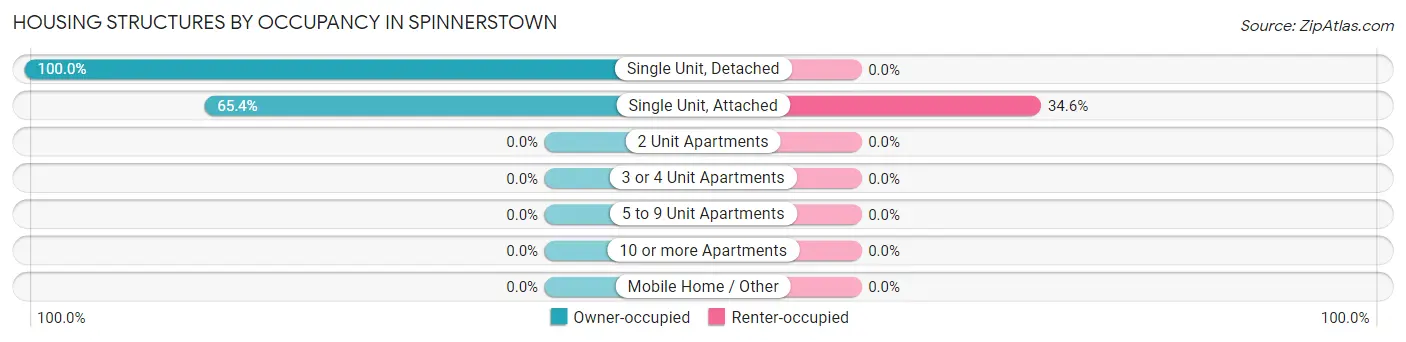
| Structure Type | Owner-occupied | Renter-occupied |
| Single Unit, Detached | 599 (100.0%) | 0 (0.0%) |
| Single Unit, Attached | 34 (65.4%) | 18 (34.6%) |
| 2 Unit Apartments | 0 (0.0%) | 0 (0.0%) |
| 3 or 4 Unit Apartments | 0 (0.0%) | 0 (0.0%) |
| 5 to 9 Unit Apartments | 0 (0.0%) | 0 (0.0%) |
| 10 or more Apartments | 0 (0.0%) | 0 (0.0%) |
| Mobile Home / Other | 0 (0.0%) | 0 (0.0%) |
| Total | 633 (97.2%) | 18 (2.8%) |
Housing Structures by Number of Rooms in Spinnerstown
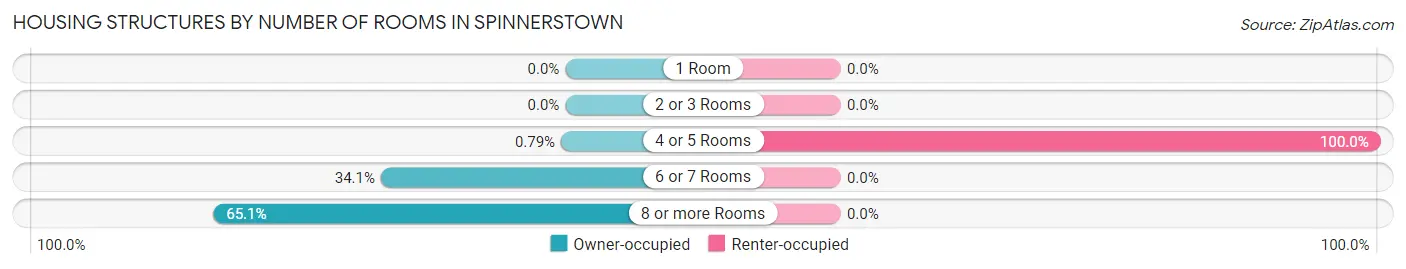
| Number of Rooms | Owner-occupied | Renter-occupied |
| 1 Room | 0 (0.0%) | 0 (0.0%) |
| 2 or 3 Rooms | 0 (0.0%) | 0 (0.0%) |
| 4 or 5 Rooms | 5 (0.8%) | 18 (100.0%) |
| 6 or 7 Rooms | 216 (34.1%) | 0 (0.0%) |
| 8 or more Rooms | 412 (65.1%) | 0 (0.0%) |
| Total | 633 (100.0%) | 18 (100.0%) |
Housing Structure by Heating Type in Spinnerstown
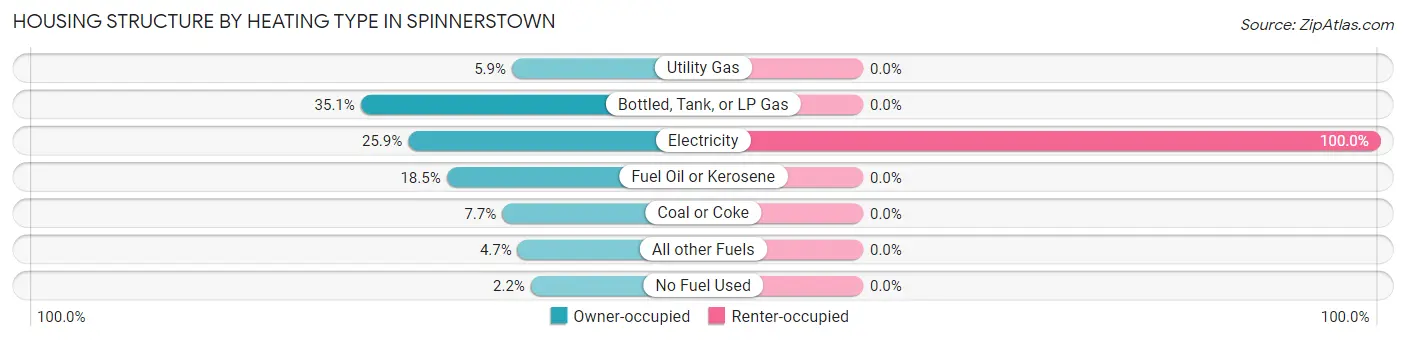
| Heating Type | Owner-occupied | Renter-occupied |
| Utility Gas | 37 (5.9%) | 0 (0.0%) |
| Bottled, Tank, or LP Gas | 222 (35.1%) | 0 (0.0%) |
| Electricity | 164 (25.9%) | 18 (100.0%) |
| Fuel Oil or Kerosene | 117 (18.5%) | 0 (0.0%) |
| Coal or Coke | 49 (7.7%) | 0 (0.0%) |
| All other Fuels | 30 (4.7%) | 0 (0.0%) |
| No Fuel Used | 14 (2.2%) | 0 (0.0%) |
| Total | 633 (100.0%) | 18 (100.0%) |
Household Vehicle Usage in Spinnerstown
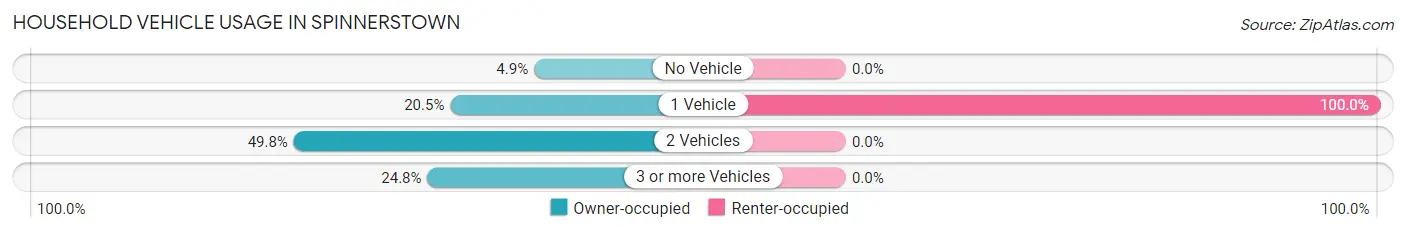
| Vehicles per Household | Owner-occupied | Renter-occupied |
| No Vehicle | 31 (4.9%) | 0 (0.0%) |
| 1 Vehicle | 130 (20.5%) | 18 (100.0%) |
| 2 Vehicles | 315 (49.8%) | 0 (0.0%) |
| 3 or more Vehicles | 157 (24.8%) | 0 (0.0%) |
| Total | 633 (100.0%) | 18 (100.0%) |
Real Estate & Mortgages in Spinnerstown
Real Estate and Mortgage Overview in Spinnerstown
| Characteristic | Without Mortgage | With Mortgage |
| Housing Units | 211 | 422 |
| Median Property Value | $344,200 | $388,500 |
| Median Household Income | $126,307 | $182 |
| Monthly Housing Costs | $824 | $89 |
| Real Estate Taxes | $5,431 | $0 |
Property Value by Mortgage Status in Spinnerstown
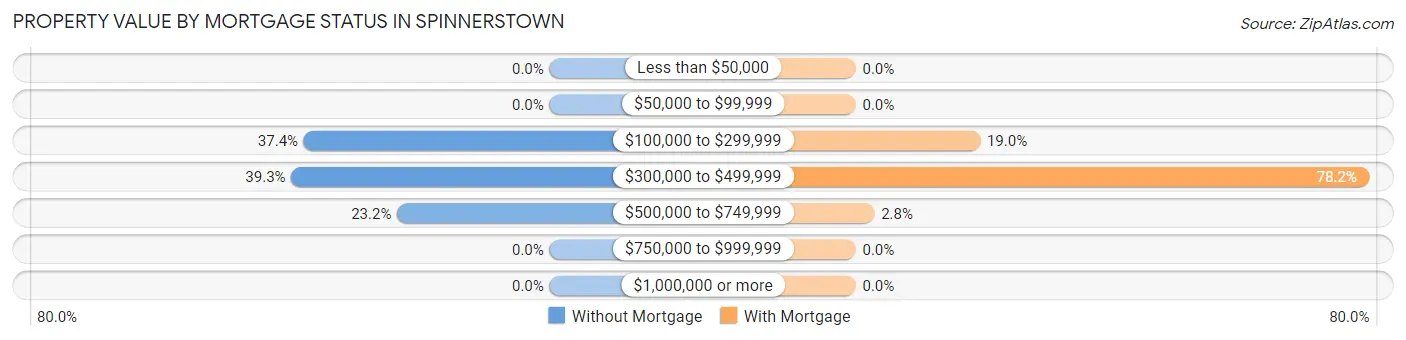
| Property Value | Without Mortgage | With Mortgage |
| Less than $50,000 | 0 (0.0%) | 0 (0.0%) |
| $50,000 to $99,999 | 0 (0.0%) | 0 (0.0%) |
| $100,000 to $299,999 | 79 (37.4%) | 80 (19.0%) |
| $300,000 to $499,999 | 83 (39.3%) | 330 (78.2%) |
| $500,000 to $749,999 | 49 (23.2%) | 12 (2.8%) |
| $750,000 to $999,999 | 0 (0.0%) | 0 (0.0%) |
| $1,000,000 or more | 0 (0.0%) | 0 (0.0%) |
| Total | 211 (100.0%) | 422 (100.0%) |
Household Income by Mortgage Status in Spinnerstown
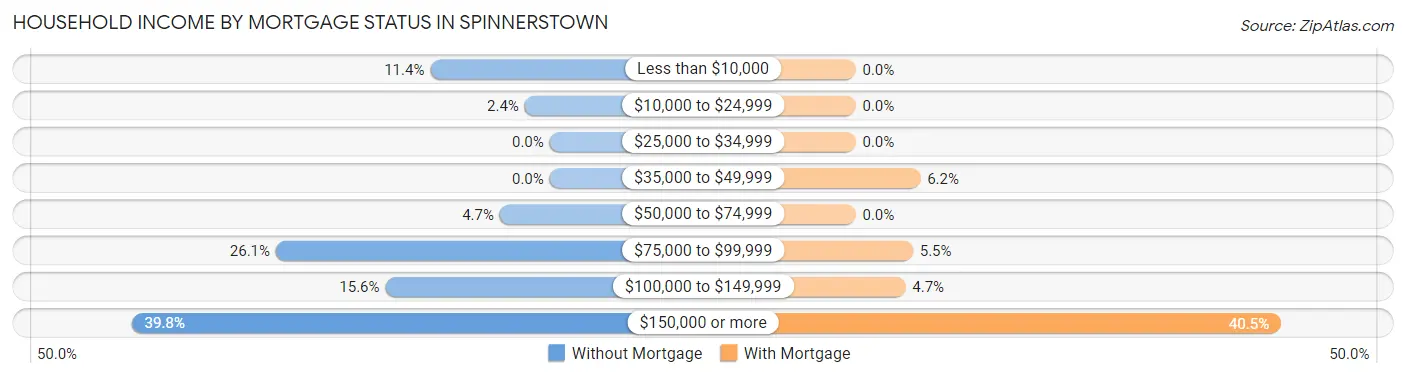
| Household Income | Without Mortgage | With Mortgage |
| Less than $10,000 | 24 (11.4%) | 0 (0.0%) |
| $10,000 to $24,999 | 5 (2.4%) | 0 (0.0%) |
| $25,000 to $34,999 | 0 (0.0%) | 0 (0.0%) |
| $35,000 to $49,999 | 0 (0.0%) | 26 (6.2%) |
| $50,000 to $74,999 | 10 (4.7%) | 0 (0.0%) |
| $75,000 to $99,999 | 55 (26.1%) | 23 (5.4%) |
| $100,000 to $149,999 | 33 (15.6%) | 20 (4.7%) |
| $150,000 or more | 84 (39.8%) | 171 (40.5%) |
| Total | 211 (100.0%) | 422 (100.0%) |
Property Value to Household Income Ratio in Spinnerstown
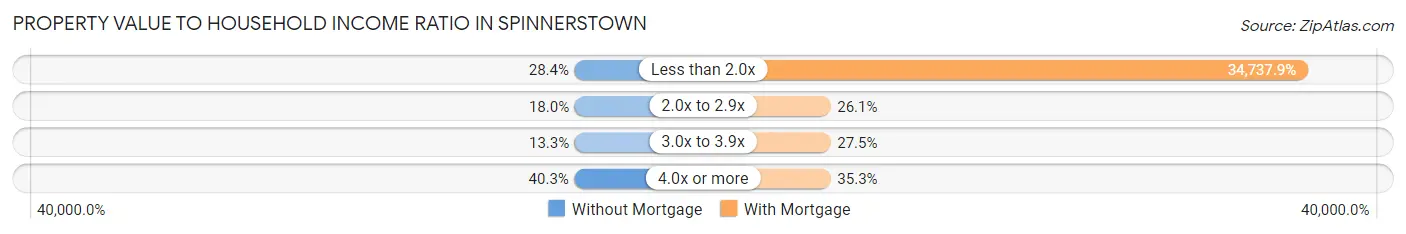
| Value-to-Income Ratio | Without Mortgage | With Mortgage |
| Less than 2.0x | 60 (28.4%) | 146,594 (34,737.9%) |
| 2.0x to 2.9x | 38 (18.0%) | 110 (26.1%) |
| 3.0x to 3.9x | 28 (13.3%) | 116 (27.5%) |
| 4.0x or more | 85 (40.3%) | 149 (35.3%) |
| Total | 211 (100.0%) | 422 (100.0%) |
Real Estate Taxes by Mortgage Status in Spinnerstown
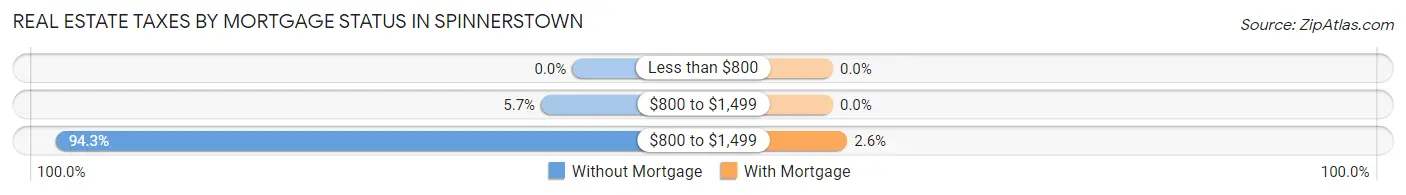
| Property Taxes | Without Mortgage | With Mortgage |
| Less than $800 | 0 (0.0%) | 0 (0.0%) |
| $800 to $1,499 | 12 (5.7%) | 0 (0.0%) |
| $800 to $1,499 | 199 (94.3%) | 11 (2.6%) |
| Total | 211 (100.0%) | 422 (100.0%) |
Health & Disability in Spinnerstown
Health Insurance Coverage by Age in Spinnerstown
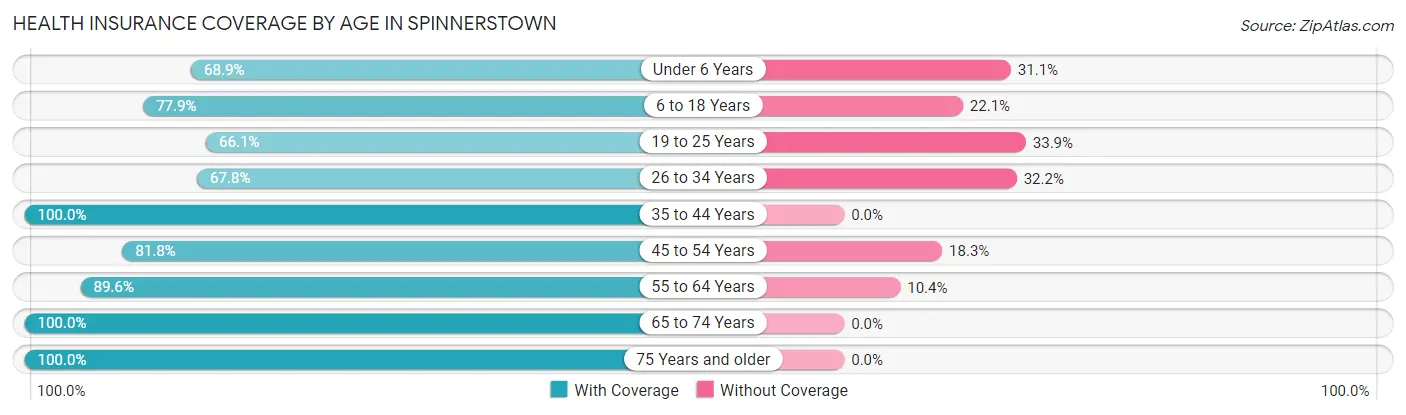
| Age Bracket | With Coverage | Without Coverage |
| Under 6 Years | 71 (68.9%) | 32 (31.1%) |
| 6 to 18 Years | 338 (77.9%) | 96 (22.1%) |
| 19 to 25 Years | 84 (66.1%) | 43 (33.9%) |
| 26 to 34 Years | 116 (67.8%) | 55 (32.2%) |
| 35 to 44 Years | 110 (100.0%) | 0 (0.0%) |
| 45 to 54 Years | 336 (81.8%) | 75 (18.2%) |
| 55 to 64 Years | 266 (89.6%) | 31 (10.4%) |
| 65 to 74 Years | 290 (100.0%) | 0 (0.0%) |
| 75 Years and older | 9 (100.0%) | 0 (0.0%) |
| Total | 1,620 (83.0%) | 332 (17.0%) |
Health Insurance Coverage by Citizenship Status in Spinnerstown
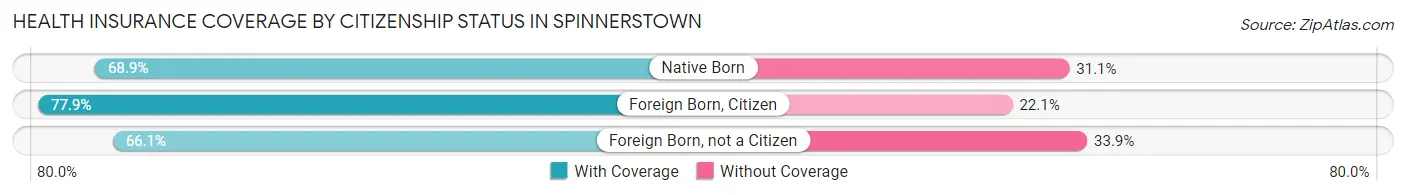
| Citizenship Status | With Coverage | Without Coverage |
| Native Born | 71 (68.9%) | 32 (31.1%) |
| Foreign Born, Citizen | 338 (77.9%) | 96 (22.1%) |
| Foreign Born, not a Citizen | 84 (66.1%) | 43 (33.9%) |
Health Insurance Coverage by Household Income in Spinnerstown
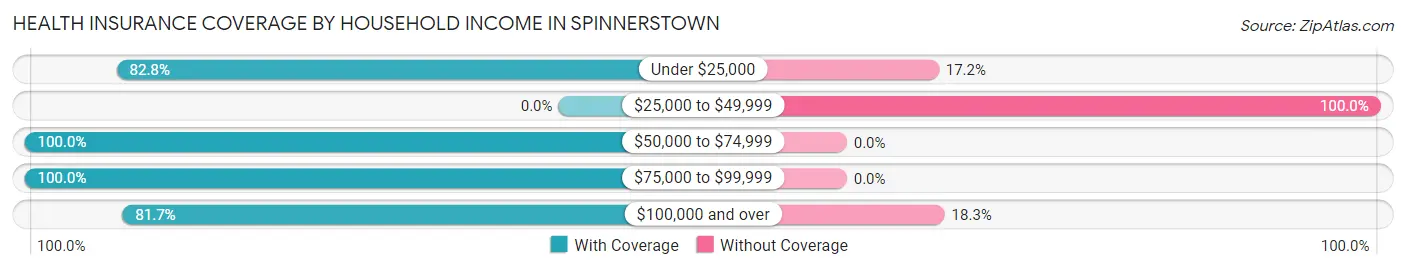
| Household Income | With Coverage | Without Coverage |
| Under $25,000 | 24 (82.8%) | 5 (17.2%) |
| $25,000 to $49,999 | 0 (0.0%) | 26 (100.0%) |
| $50,000 to $74,999 | 66 (100.0%) | 0 (0.0%) |
| $75,000 to $99,999 | 186 (100.0%) | 0 (0.0%) |
| $100,000 and over | 1,341 (81.7%) | 301 (18.3%) |
Public vs Private Health Insurance Coverage by Age in Spinnerstown
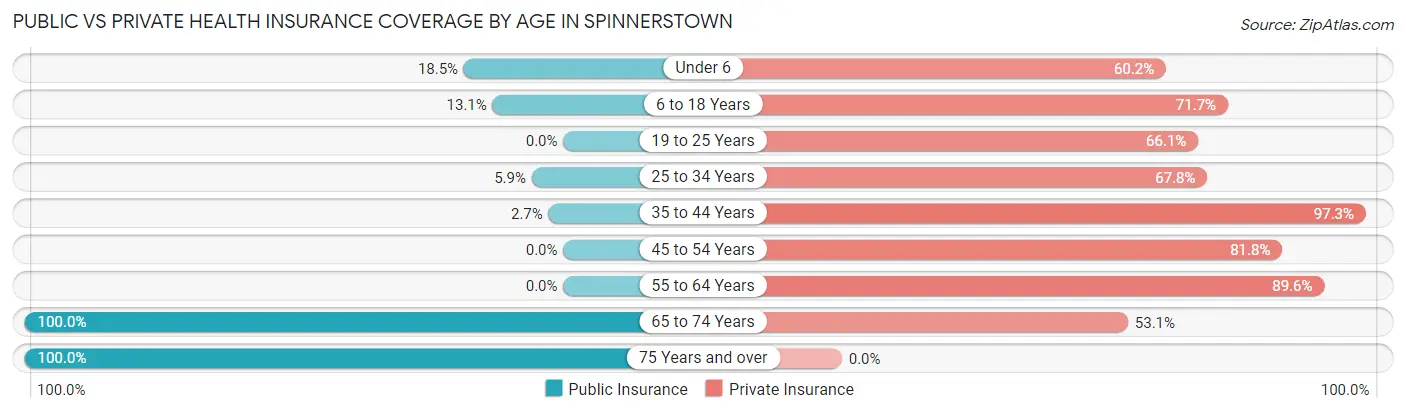
| Age Bracket | Public Insurance | Private Insurance |
| Under 6 | 19 (18.4%) | 62 (60.2%) |
| 6 to 18 Years | 57 (13.1%) | 311 (71.7%) |
| 19 to 25 Years | 0 (0.0%) | 84 (66.1%) |
| 25 to 34 Years | 10 (5.9%) | 116 (67.8%) |
| 35 to 44 Years | 3 (2.7%) | 107 (97.3%) |
| 45 to 54 Years | 0 (0.0%) | 336 (81.8%) |
| 55 to 64 Years | 0 (0.0%) | 266 (89.6%) |
| 65 to 74 Years | 290 (100.0%) | 154 (53.1%) |
| 75 Years and over | 9 (100.0%) | 0 (0.0%) |
| Total | 388 (19.9%) | 1,436 (73.6%) |
Disability Status by Sex by Age in Spinnerstown
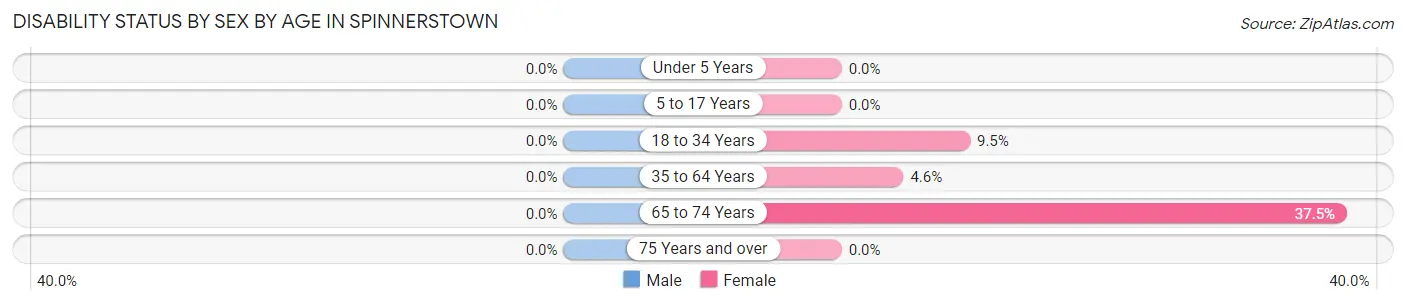
| Age Bracket | Male | Female |
| Under 5 Years | 0 (0.0%) | 0 (0.0%) |
| 5 to 17 Years | 0 (0.0%) | 0 (0.0%) |
| 18 to 34 Years | 0 (0.0%) | 16 (9.5%) |
| 35 to 64 Years | 0 (0.0%) | 22 (4.6%) |
| 65 to 74 Years | 0 (0.0%) | 45 (37.5%) |
| 75 Years and over | 0 (0.0%) | 0 (0.0%) |
Disability Class by Sex by Age in Spinnerstown
Disability Class: Hearing Difficulty
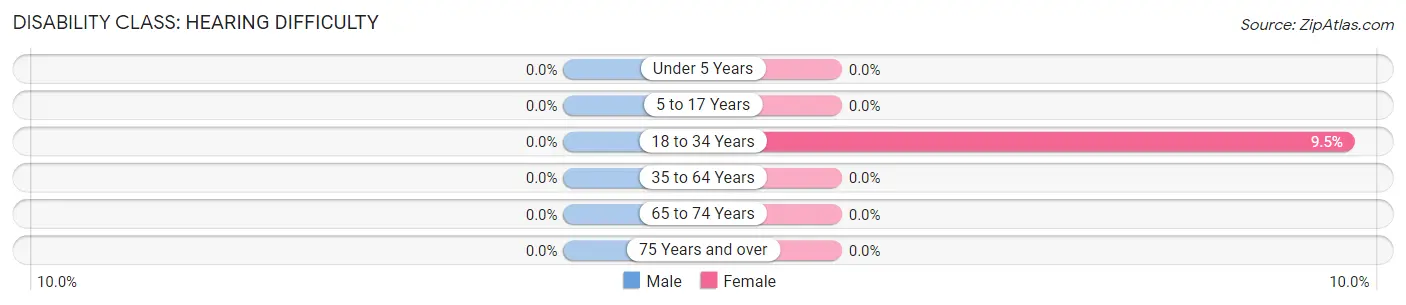
| Age Bracket | Male | Female |
| Under 5 Years | 0 (0.0%) | 0 (0.0%) |
| 5 to 17 Years | 0 (0.0%) | 0 (0.0%) |
| 18 to 34 Years | 0 (0.0%) | 16 (9.5%) |
| 35 to 64 Years | 0 (0.0%) | 0 (0.0%) |
| 65 to 74 Years | 0 (0.0%) | 0 (0.0%) |
| 75 Years and over | 0 (0.0%) | 0 (0.0%) |
Disability Class: Vision Difficulty
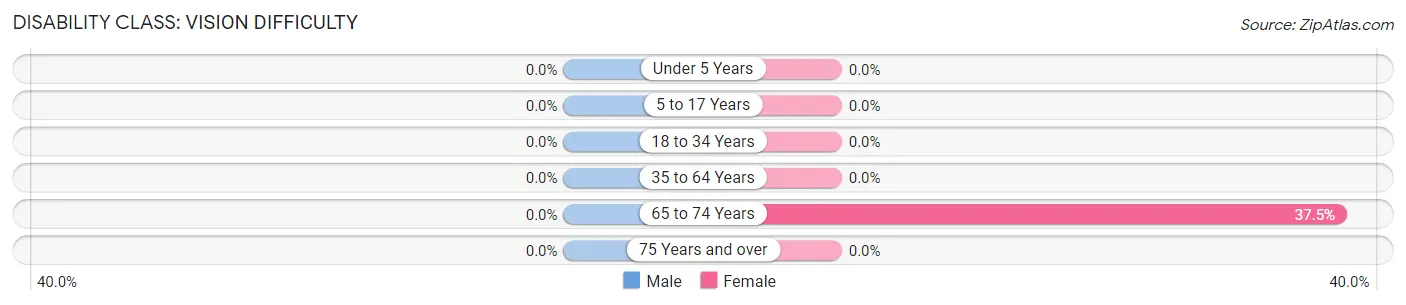
| Age Bracket | Male | Female |
| Under 5 Years | 0 (0.0%) | 0 (0.0%) |
| 5 to 17 Years | 0 (0.0%) | 0 (0.0%) |
| 18 to 34 Years | 0 (0.0%) | 0 (0.0%) |
| 35 to 64 Years | 0 (0.0%) | 0 (0.0%) |
| 65 to 74 Years | 0 (0.0%) | 45 (37.5%) |
| 75 Years and over | 0 (0.0%) | 0 (0.0%) |
Disability Class: Cognitive Difficulty
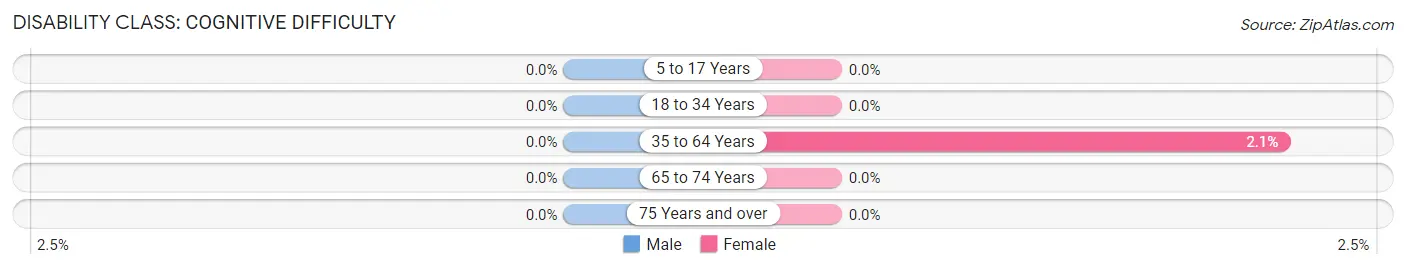
| Age Bracket | Male | Female |
| 5 to 17 Years | 0 (0.0%) | 0 (0.0%) |
| 18 to 34 Years | 0 (0.0%) | 0 (0.0%) |
| 35 to 64 Years | 0 (0.0%) | 10 (2.1%) |
| 65 to 74 Years | 0 (0.0%) | 0 (0.0%) |
| 75 Years and over | 0 (0.0%) | 0 (0.0%) |
Disability Class: Ambulatory Difficulty
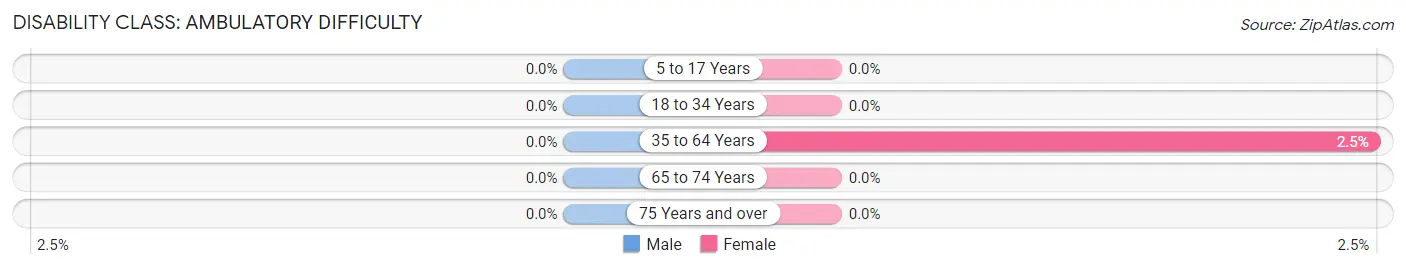
| Age Bracket | Male | Female |
| 5 to 17 Years | 0 (0.0%) | 0 (0.0%) |
| 18 to 34 Years | 0 (0.0%) | 0 (0.0%) |
| 35 to 64 Years | 0 (0.0%) | 12 (2.5%) |
| 65 to 74 Years | 0 (0.0%) | 0 (0.0%) |
| 75 Years and over | 0 (0.0%) | 0 (0.0%) |
Disability Class: Self-Care Difficulty
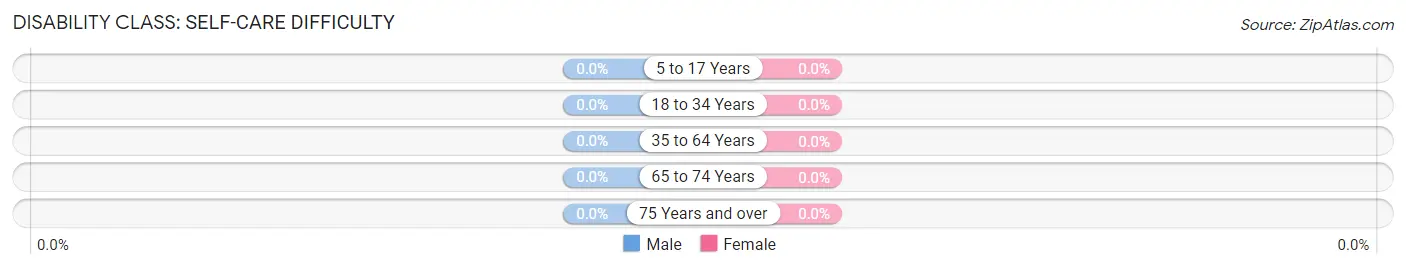
| Age Bracket | Male | Female |
| 5 to 17 Years | 0 (0.0%) | 0 (0.0%) |
| 18 to 34 Years | 0 (0.0%) | 0 (0.0%) |
| 35 to 64 Years | 0 (0.0%) | 0 (0.0%) |
| 65 to 74 Years | 0 (0.0%) | 0 (0.0%) |
| 75 Years and over | 0 (0.0%) | 0 (0.0%) |
Technology Access in Spinnerstown
Computing Device Access in Spinnerstown
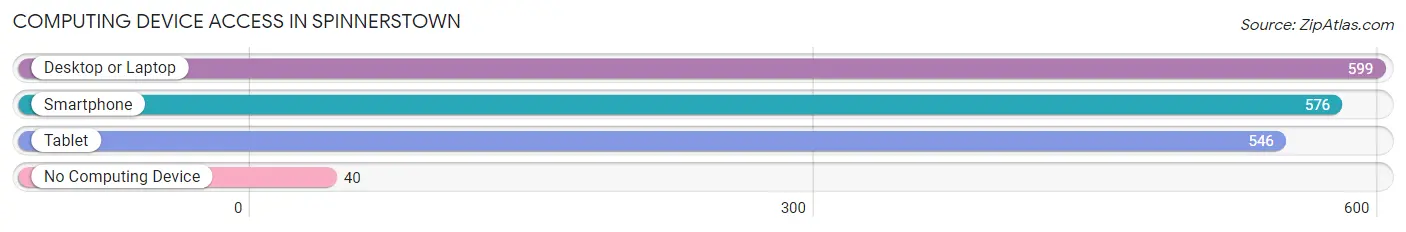
| Device Type | # Households | % Households |
| Desktop or Laptop | 599 | 92.0% |
| Smartphone | 576 | 88.5% |
| Tablet | 546 | 83.9% |
| No Computing Device | 40 | 6.1% |
| Total | 651 | 100.0% |
Internet Access in Spinnerstown
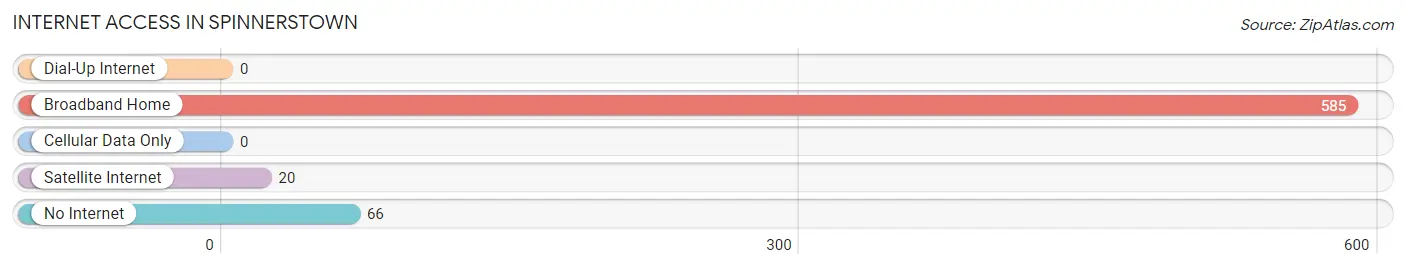
| Internet Type | # Households | % Households |
| Dial-Up Internet | 0 | 0.0% |
| Broadband Home | 585 | 89.9% |
| Cellular Data Only | 0 | 0.0% |
| Satellite Internet | 20 | 3.1% |
| No Internet | 66 | 10.1% |
| Total | 651 | 100.0% |
Spinnerstown Summary
Spinnerstown is a small unincorporated community located in Bucks County, Pennsylvania. It is situated in the northern part of the county, about 20 miles north of Philadelphia. The community is located along the banks of the Tohickon Creek, which is a tributary of the Delaware River. The population of Spinnerstown was estimated to be 1,845 in 2019.
History
The area that is now Spinnerstown was first settled in the late 1700s by German immigrants. The first settlers were mostly farmers and craftsmen, and the area was known for its spinning mills. The name “Spinnerstown” was derived from the spinning mills that were located in the area. The first post office in Spinnerstown was established in 1817.
In the late 1800s, the area began to experience a period of growth and development. The railroad was extended to Spinnerstown in 1871, and the community became a popular destination for tourists. The railroad also allowed for the transportation of goods and services to and from the area.
In the early 1900s, the area experienced a period of decline. The spinning mills closed and the railroad was abandoned. The population of Spinnerstown decreased significantly during this time.
Geography
Spinnerstown is located in the northern part of Bucks County, Pennsylvania. It is situated along the banks of the Tohickon Creek, which is a tributary of the Delaware River. The community is located about 20 miles north of Philadelphia.
The terrain of Spinnerstown is mostly flat, with some rolling hills. The area is mostly rural, with some residential and commercial development. The climate of the area is humid continental, with hot summers and cold winters.
Economy
The economy of Spinnerstown is largely based on agriculture and tourism. The area is home to several farms, which produce a variety of crops, including corn, soybeans, and hay. The area is also home to several wineries, which produce a variety of wines.
The area is also home to several small businesses, including restaurants, shops, and other services. The area is also home to several bed and breakfasts, which attract tourists from all over the world.
Demographics
The population of Spinnerstown was estimated to be 1,845 in 2019. The population is mostly white (94.3%), with a small percentage of African Americans (2.2%) and Hispanics (2.2%). The median household income in Spinnerstown is $63,917, and the median home value is $250,000.
The majority of the population (90.3%) is over the age of 18, and the median age is 43. The population is mostly married (60.3%), and the majority of the population (90.3%) is employed. The most common industries in the area are manufacturing (17.3%), retail (14.3%), and health care (13.3%).
Conclusion
Spinnerstown is a small unincorporated community located in Bucks County, Pennsylvania. It is situated in the northern part of the county, about 20 miles north of Philadelphia. The area was first settled in the late 1700s by German immigrants, and the area was known for its spinning mills. The economy of Spinnerstown is largely based on agriculture and tourism, and the population of the area was estimated to be 1,845 in 2019. The population is mostly white, with a small percentage of African Americans and Hispanics. The median household income in Spinnerstown is $63,917, and the median home value is $250,000.
Common Questions
What is Per Capita Income in Spinnerstown?
Per Capita income in Spinnerstown is $46,546.
What is the Median Family Income in Spinnerstown?
Median Family Income in Spinnerstown is $146,745.
What is the Median Household income in Spinnerstown?
Median Household Income in Spinnerstown is $145,865.
What is Income or Wage Gap in Spinnerstown?
Income or Wage Gap in Spinnerstown is 43.5%.
Women in Spinnerstown earn 56.5 cents for every dollar earned by a man.
What is Inequality or Gini Index in Spinnerstown?
Inequality or Gini Index in Spinnerstown is 0.24.
What is the Total Population of Spinnerstown?
Total Population of Spinnerstown is 1,966.
What is the Total Male Population of Spinnerstown?
Total Male Population of Spinnerstown is 877.
What is the Total Female Population of Spinnerstown?
Total Female Population of Spinnerstown is 1,089.
What is the Ratio of Males per 100 Females in Spinnerstown?
There are 80.53 Males per 100 Females in Spinnerstown.
What is the Ratio of Females per 100 Males in Spinnerstown?
There are 124.17 Females per 100 Males in Spinnerstown.
What is the Median Population Age in Spinnerstown?
Median Population Age in Spinnerstown is 45.9 Years.
What is the Average Family Size in Spinnerstown
Average Family Size in Spinnerstown is 3.2 People.
What is the Average Household Size in Spinnerstown
Average Household Size in Spinnerstown is 3.0 People.
How Large is the Labor Force in Spinnerstown?
There are 1,110 People in the Labor Forcein in Spinnerstown.
What is the Percentage of People in the Labor Force in Spinnerstown?
71.4% of People are in the Labor Force in Spinnerstown.
What is the Unemployment Rate in Spinnerstown?
Unemployment Rate in Spinnerstown is 4.0%.