Homestead borough, PA Map & Demographics
Homestead borough Overview
$28,380
PER CAPITA INCOME
$37,071
AVG FAMILY INCOME
$29,306
AVG HOUSEHOLD INCOME
29.4%
WAGE / INCOME GAP [ % ]
70.6¢/ $1
WAGE / INCOME GAP [ $ ]
0.55
INEQUALITY / GINI INDEX
2,905
TOTAL POPULATION
1,403
MALE POPULATION
1,502
FEMALE POPULATION
93.41
MALES / 100 FEMALES
107.06
FEMALES / 100 MALES
32.2
MEDIAN AGE
3.4
AVG FAMILY SIZE
2.3
AVG HOUSEHOLD SIZE
1,139
LABOR FORCE [ PEOPLE ]
50.1%
PERCENT IN LABOR FORCE
9.9%
UNEMPLOYMENT RATE
Income in Homestead borough
Income Overview in Homestead borough
Per Capita Income in Homestead borough is $28,380, while median incomes of families and households are $37,071 and $29,306 respectively.
| Characteristic | Number | Measure |
| Per Capita Income | 2,905 | $28,380 |
| Median Family Income | 615 | $37,071 |
| Mean Family Income | 615 | $73,753 |
| Median Household Income | 1,264 | $29,306 |
| Mean Household Income | 1,264 | $52,640 |
| Income Deficit | 615 | $0 |
| Wage / Income Gap (%) | 2,905 | 29.40% |
| Wage / Income Gap ($) | 2,905 | 70.60¢ per $1 |
| Gini / Inequality Index | 2,905 | 0.55 |
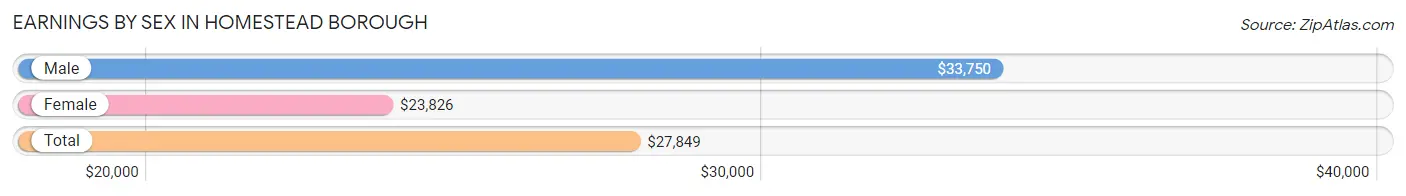
Earnings by Sex in Homestead borough
Average Earnings in Homestead borough are $27,849, $33,750 for men and $23,826 for women, a difference of 29.4%.
| Sex | Number | Average Earnings |
| Male | 558 (48.5%) | $33,750 |
| Female | 592 (51.5%) | $23,826 |
| Total | 1,150 (100.0%) | $27,849 |
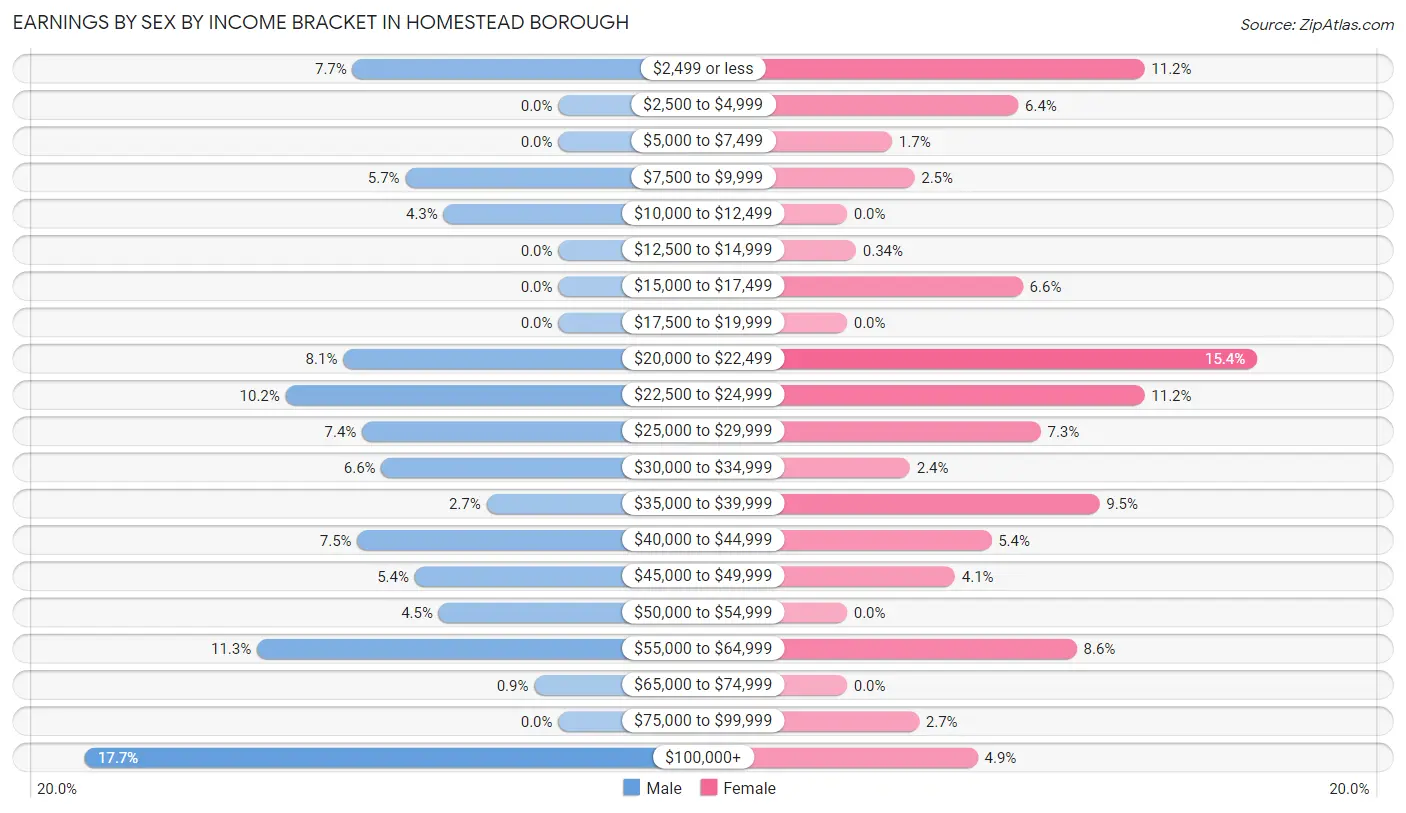
Earnings by Sex by Income Bracket in Homestead borough
The most common earnings brackets in Homestead borough are $100,000+ for men (99 | 17.7%) and $20,000 to $22,499 for women (91 | 15.4%).
| Income | Male | Female |
| $2,499 or less | 43 (7.7%) | 66 (11.2%) |
| $2,500 to $4,999 | 0 (0.0%) | 38 (6.4%) |
| $5,000 to $7,499 | 0 (0.0%) | 10 (1.7%) |
| $7,500 to $9,999 | 32 (5.7%) | 15 (2.5%) |
| $10,000 to $12,499 | 24 (4.3%) | 0 (0.0%) |
| $12,500 to $14,999 | 0 (0.0%) | 2 (0.3%) |
| $15,000 to $17,499 | 0 (0.0%) | 39 (6.6%) |
| $17,500 to $19,999 | 0 (0.0%) | 0 (0.0%) |
| $20,000 to $22,499 | 45 (8.1%) | 91 (15.4%) |
| $22,500 to $24,999 | 57 (10.2%) | 66 (11.2%) |
| $25,000 to $29,999 | 41 (7.3%) | 43 (7.3%) |
| $30,000 to $34,999 | 37 (6.6%) | 14 (2.4%) |
| $35,000 to $39,999 | 15 (2.7%) | 56 (9.5%) |
| $40,000 to $44,999 | 42 (7.5%) | 32 (5.4%) |
| $45,000 to $49,999 | 30 (5.4%) | 24 (4.1%) |
| $50,000 to $54,999 | 25 (4.5%) | 0 (0.0%) |
| $55,000 to $64,999 | 63 (11.3%) | 51 (8.6%) |
| $65,000 to $74,999 | 5 (0.9%) | 0 (0.0%) |
| $75,000 to $99,999 | 0 (0.0%) | 16 (2.7%) |
| $100,000+ | 99 (17.7%) | 29 (4.9%) |
| Total | 558 (100.0%) | 592 (100.0%) |
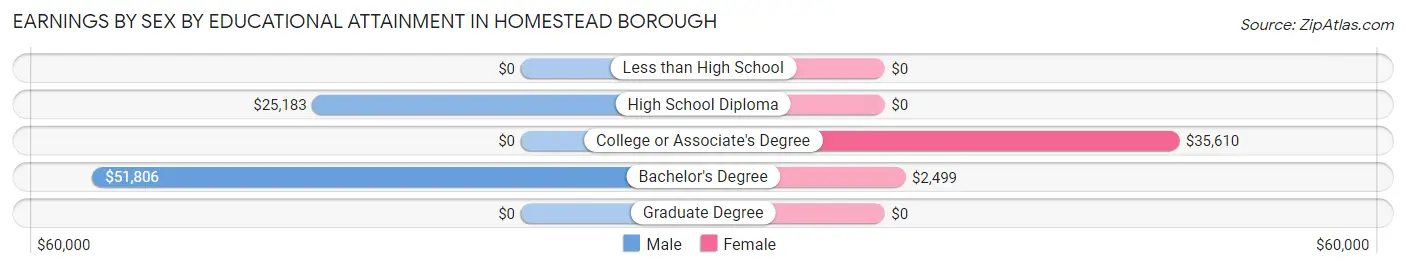
Earnings by Sex by Educational Attainment in Homestead borough
Average earnings in Homestead borough are $40,208 for men and $29,302 for women, a difference of 27.1%. Men with an educational attainment of bachelor's degree enjoy the highest average annual earnings of $51,806, while those with high school diploma education earn the least with $25,183. Women with an educational attainment of college or associate's degree earn the most with the average annual earnings of $35,610, while those with bachelor's degree education have the smallest earnings of $2,499.
| Educational Attainment | Male Income | Female Income |
| Less than High School | - | - |
| High School Diploma | $25,183 | $0 |
| College or Associate's Degree | - | - |
| Bachelor's Degree | $51,806 | $2,499 |
| Graduate Degree | - | - |
| Total | $40,208 | $29,302 |
Family Income in Homestead borough
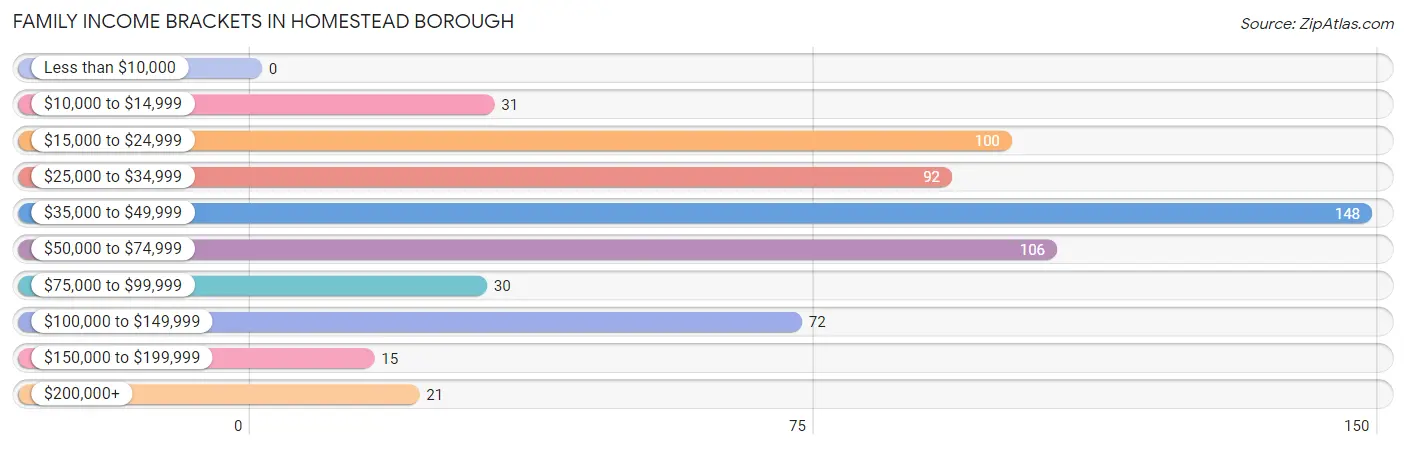
Family Income Brackets in Homestead borough
According to the Homestead borough family income data, there are 148 families falling into the $35,000 to $49,999 income range, which is the most common income bracket and makes up 24.1% of all families.
| Income Bracket | # Families | % Families |
| Less than $10,000 | 0 | 0.0% |
| $10,000 to $14,999 | 31 | 5.0% |
| $15,000 to $24,999 | 100 | 16.3% |
| $25,000 to $34,999 | 92 | 15.0% |
| $35,000 to $49,999 | 148 | 24.1% |
| $50,000 to $74,999 | 106 | 17.2% |
| $75,000 to $99,999 | 30 | 4.9% |
| $100,000 to $149,999 | 72 | 11.7% |
| $150,000 to $199,999 | 15 | 2.4% |
| $200,000+ | 21 | 3.4% |
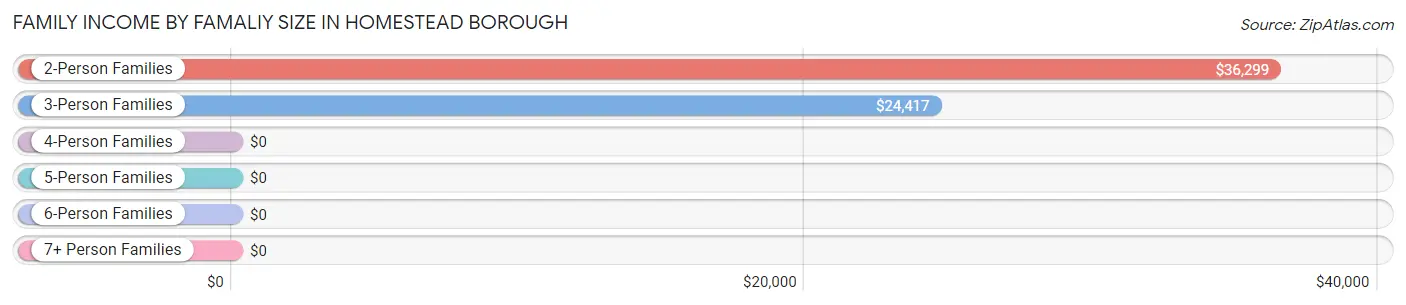
Family Income by Famaliy Size in Homestead borough
2-person families (304 | 49.4%) account for the highest median family income in Homestead borough with $36,299 per family, while 2-person families (304 | 49.4%) have the highest median income of $18,150 per family member.
| Income Bracket | # Families | Median Income |
| 2-Person Families | 304 (49.4%) | $36,299 |
| 3-Person Families | 136 (22.1%) | $24,417 |
| 4-Person Families | 142 (23.1%) | $0 |
| 5-Person Families | 15 (2.4%) | $0 |
| 6-Person Families | 0 (0.0%) | $0 |
| 7+ Person Families | 18 (2.9%) | $0 |
| Total | 615 (100.0%) | $37,071 |
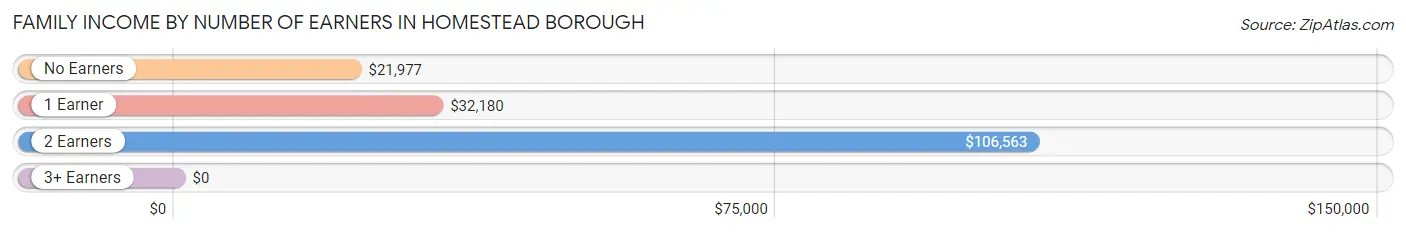
Family Income by Number of Earners in Homestead borough
| Number of Earners | # Families | Median Income |
| No Earners | 184 (29.9%) | $21,977 |
| 1 Earner | 211 (34.3%) | $32,180 |
| 2 Earners | 142 (23.1%) | $106,563 |
| 3+ Earners | 78 (12.7%) | $0 |
| Total | 615 (100.0%) | $37,071 |
Household Income in Homestead borough
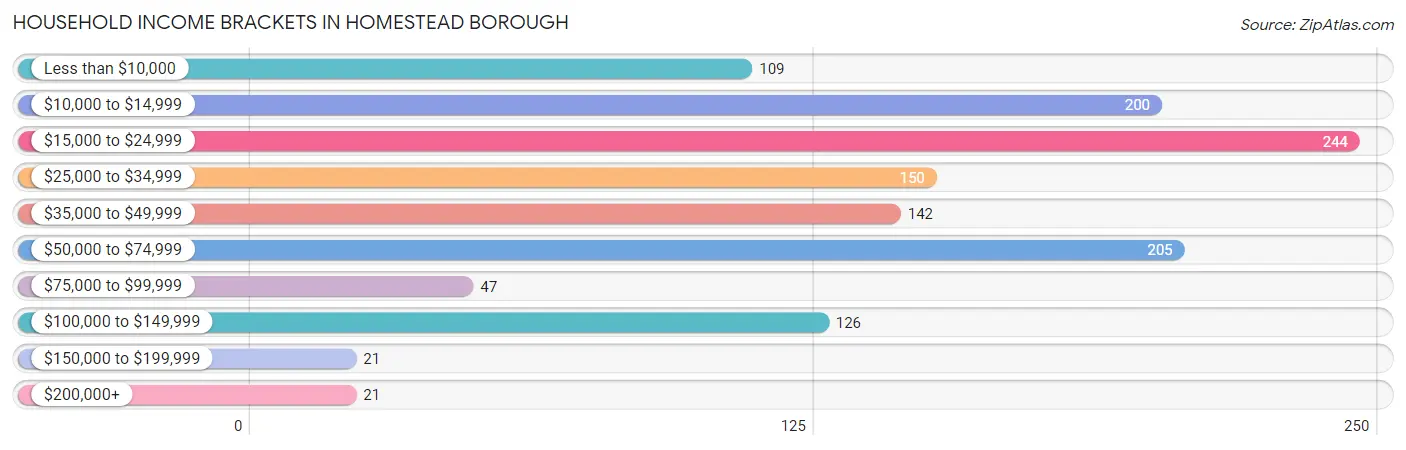
Household Income Brackets in Homestead borough
With 244 households falling in the category, the $15,000 to $24,999 income range is the most frequent in Homestead borough, accounting for 19.3% of all households. In contrast, only 21 households (1.7%) fall into the $150,000 to $199,999 income bracket, making it the least populous group.
| Income Bracket | # Households | % Households |
| Less than $10,000 | 109 | 8.6% |
| $10,000 to $14,999 | 200 | 15.8% |
| $15,000 to $24,999 | 244 | 19.3% |
| $25,000 to $34,999 | 150 | 11.9% |
| $35,000 to $49,999 | 142 | 11.2% |
| $50,000 to $74,999 | 205 | 16.2% |
| $75,000 to $99,999 | 47 | 3.7% |
| $100,000 to $149,999 | 126 | 10.0% |
| $150,000 to $199,999 | 21 | 1.7% |
| $200,000+ | 21 | 1.7% |
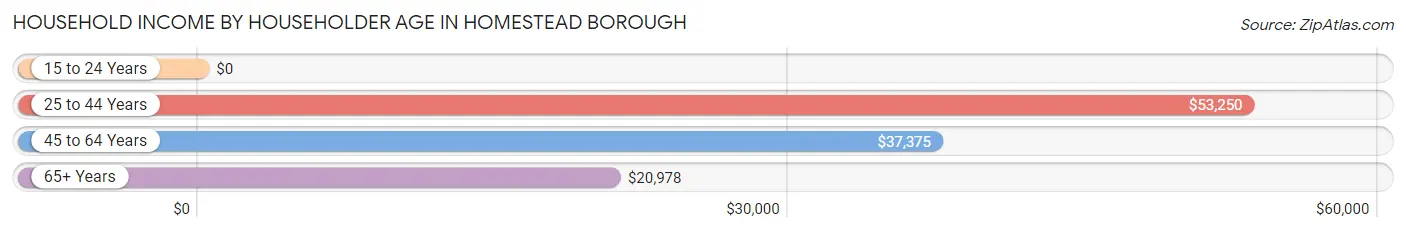
Household Income by Householder Age in Homestead borough
The median household income in Homestead borough is $29,306, with the highest median household income of $53,250 found in the 25 to 44 years age bracket for the primary householder. A total of 300 households (23.7%) fall into this category. Meanwhile, the 15 to 24 years age bracket for the primary householder has the lowest median household income of $0, with 38 households (3.0%) in this group.
| Income Bracket | # Households | Median Income |
| 15 to 24 Years | 38 (3.0%) | $0 |
| 25 to 44 Years | 300 (23.7%) | $53,250 |
| 45 to 64 Years | 392 (31.0%) | $37,375 |
| 65+ Years | 534 (42.2%) | $20,978 |
| Total | 1,264 (100.0%) | $29,306 |
Poverty in Homestead borough
Income Below Poverty by Sex and Age in Homestead borough
With 27.2% poverty level for males and 26.5% for females among the residents of Homestead borough, 16 and 17 year old males and 65 to 74 year old females are the most vulnerable to poverty, with 18 males (100.0%) and 85 females (51.5%) in their respective age groups living below the poverty level.
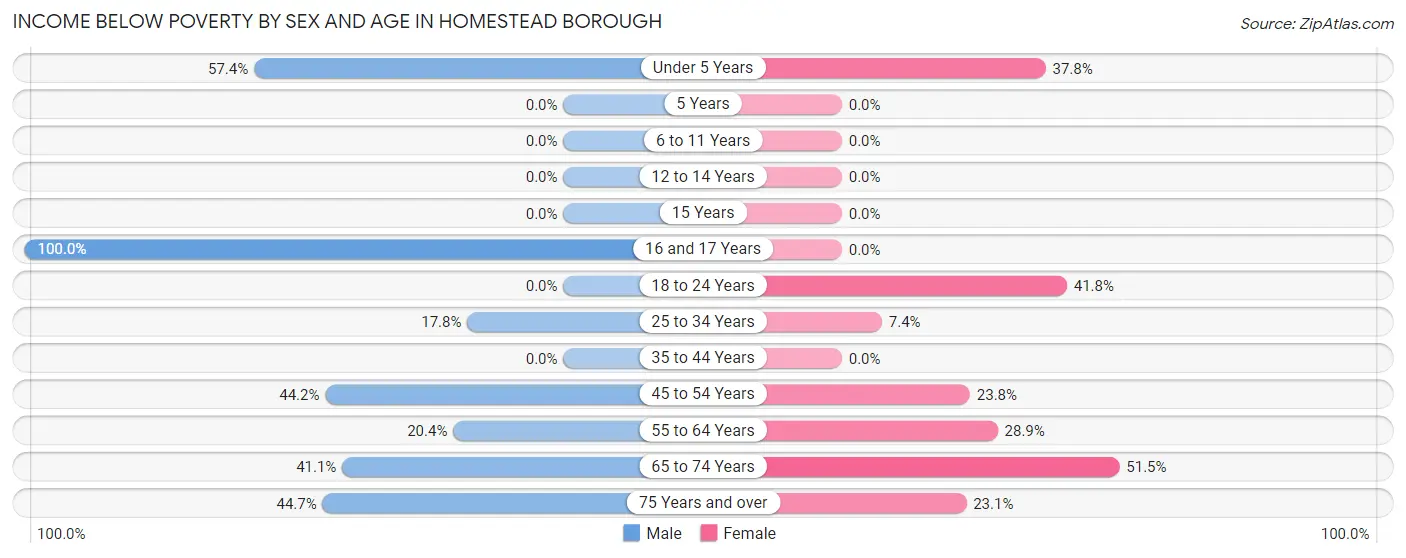
| Age Bracket | Male | Female |
| Under 5 Years | 124 (57.4%) | 45 (37.8%) |
| 5 Years | 0 (0.0%) | 0 (0.0%) |
| 6 to 11 Years | 0 (0.0%) | 0 (0.0%) |
| 12 to 14 Years | 0 (0.0%) | 0 (0.0%) |
| 15 Years | 0 (0.0%) | 0 (0.0%) |
| 16 and 17 Years | 18 (100.0%) | 0 (0.0%) |
| 18 to 24 Years | 0 (0.0%) | 109 (41.8%) |
| 25 to 34 Years | 56 (17.8%) | 15 (7.4%) |
| 35 to 44 Years | 0 (0.0%) | 0 (0.0%) |
| 45 to 54 Years | 19 (44.2%) | 29 (23.8%) |
| 55 to 64 Years | 28 (20.4%) | 48 (28.9%) |
| 65 to 74 Years | 39 (41.0%) | 85 (51.5%) |
| 75 Years and over | 97 (44.7%) | 67 (23.1%) |
| Total | 381 (27.2%) | 398 (26.5%) |
Income Above Poverty by Sex and Age in Homestead borough
According to the poverty statistics in Homestead borough, males aged 5 years and females aged 6 to 11 years are the age groups that are most secure financially, with 100.0% of males and 100.0% of females in these age groups living above the poverty line.
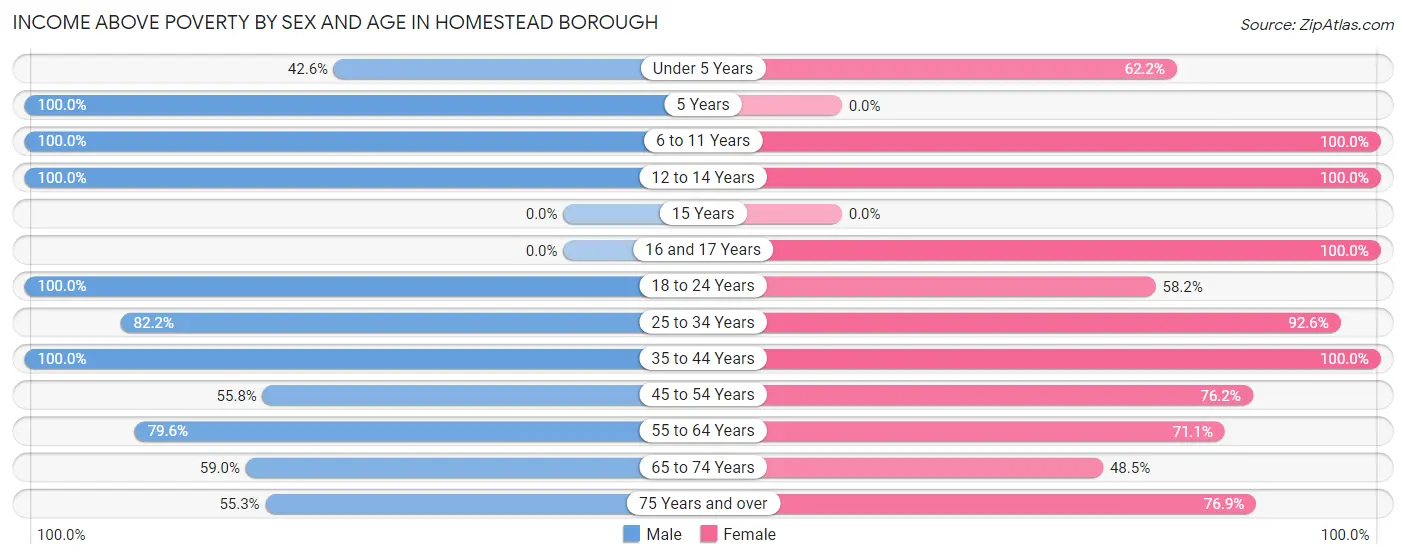
| Age Bracket | Male | Female |
| Under 5 Years | 92 (42.6%) | 74 (62.2%) |
| 5 Years | 18 (100.0%) | 0 (0.0%) |
| 6 to 11 Years | 203 (100.0%) | 34 (100.0%) |
| 12 to 14 Years | 9 (100.0%) | 32 (100.0%) |
| 15 Years | 0 (0.0%) | 0 (0.0%) |
| 16 and 17 Years | 0 (0.0%) | 49 (100.0%) |
| 18 to 24 Years | 37 (100.0%) | 152 (58.2%) |
| 25 to 34 Years | 258 (82.2%) | 187 (92.6%) |
| 35 to 44 Years | 96 (100.0%) | 62 (100.0%) |
| 45 to 54 Years | 24 (55.8%) | 93 (76.2%) |
| 55 to 64 Years | 109 (79.6%) | 118 (71.1%) |
| 65 to 74 Years | 56 (59.0%) | 80 (48.5%) |
| 75 Years and over | 120 (55.3%) | 223 (76.9%) |
| Total | 1,022 (72.8%) | 1,104 (73.5%) |
Income Below Poverty Among Married-Couple Families in Homestead borough
The poverty statistics for married-couple families in Homestead borough show that 9.6% or 31 of the total 323 families live below the poverty line. Families with no children have the highest poverty rate of 16.3%, comprising of 31 families. On the other hand, families with 1 or 2 children have the lowest poverty rate of 0.0%, which includes 0 families.
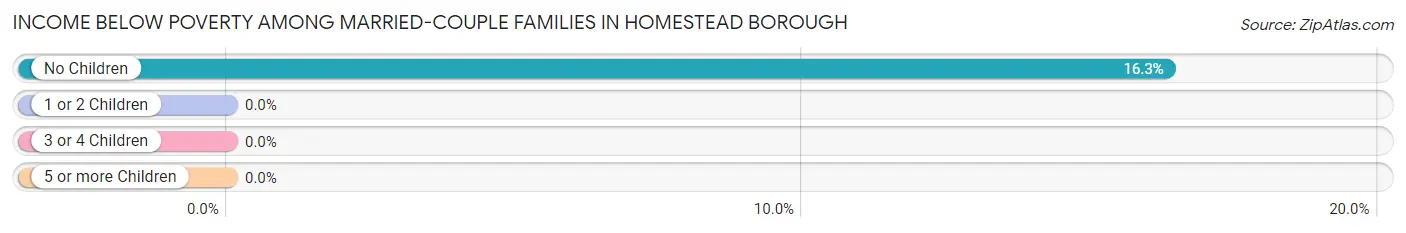
| Children | Above Poverty | Below Poverty |
| No Children | 159 (83.7%) | 31 (16.3%) |
| 1 or 2 Children | 100 (100.0%) | 0 (0.0%) |
| 3 or 4 Children | 15 (100.0%) | 0 (0.0%) |
| 5 or more Children | 18 (100.0%) | 0 (0.0%) |
| Total | 292 (90.4%) | 31 (9.6%) |
Income Below Poverty Among Single-Parent Households in Homestead borough
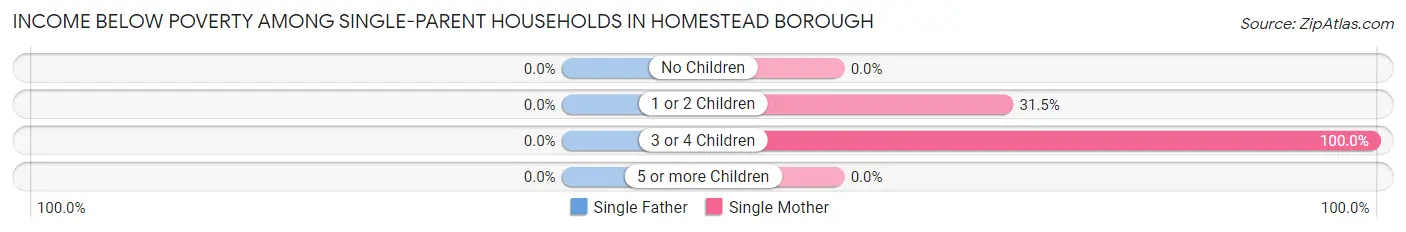
| Children | Single Father | Single Mother |
| No Children | 0 (0.0%) | 0 (0.0%) |
| 1 or 2 Children | 0 (0.0%) | 45 (31.5%) |
| 3 or 4 Children | 0 (0.0%) | 38 (100.0%) |
| 5 or more Children | 0 (0.0%) | 0 (0.0%) |
| Total | 0 (0.0%) | 83 (29.9%) |
Income Below Poverty Among Married-Couple vs Single-Parent Households in Homestead borough
The poverty data for Homestead borough shows that 31 of the married-couple family households (9.6%) and 83 of the single-parent households (28.4%) are living below the poverty level. Within the married-couple family households, those with no children have the highest poverty rate, with 31 households (16.3%) falling below the poverty line. Among the single-parent households, those with 3 or 4 children have the highest poverty rate, with 38 household (100.0%) living below poverty.
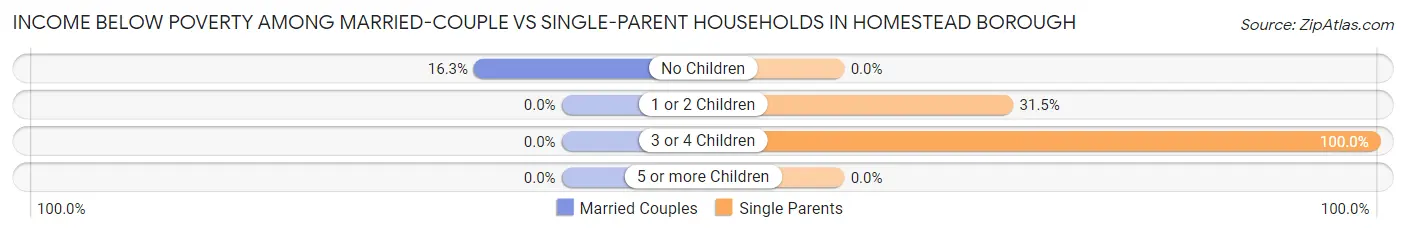
| Children | Married-Couple Families | Single-Parent Households |
| No Children | 31 (16.3%) | 0 (0.0%) |
| 1 or 2 Children | 0 (0.0%) | 45 (31.5%) |
| 3 or 4 Children | 0 (0.0%) | 38 (100.0%) |
| 5 or more Children | 0 (0.0%) | 0 (0.0%) |
| Total | 31 (9.6%) | 83 (28.4%) |
Race in Homestead borough
The most populous races in Homestead borough are Black / African American (1,786 | 61.5%), White / Caucasian (863 | 29.7%), and Two or more Races (155 | 5.3%).
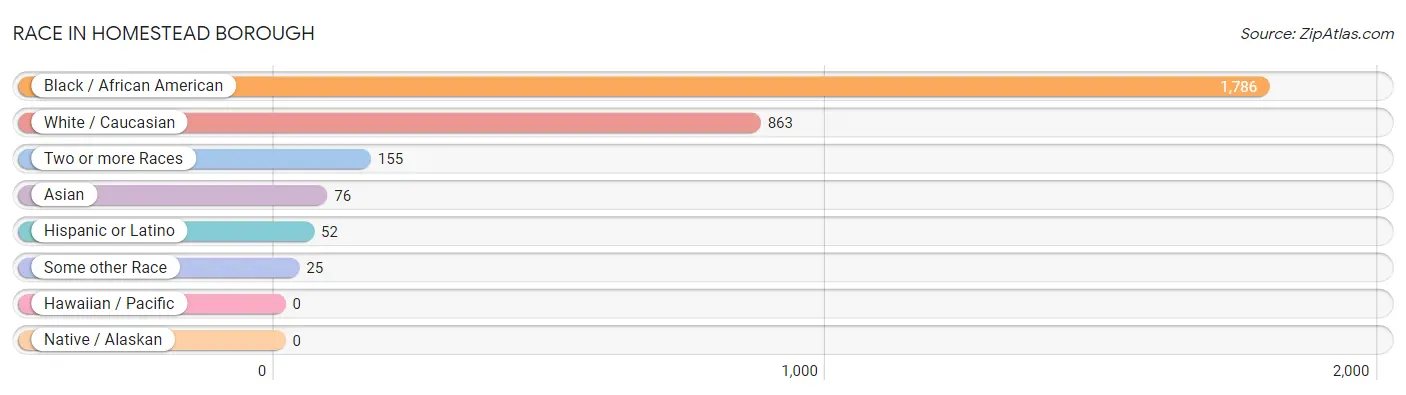
| Race | # Population | % Population |
| Asian | 76 | 2.6% |
| Black / African American | 1,786 | 61.5% |
| Hawaiian / Pacific | 0 | 0.0% |
| Hispanic or Latino | 52 | 1.8% |
| Native / Alaskan | 0 | 0.0% |
| White / Caucasian | 863 | 29.7% |
| Two or more Races | 155 | 5.3% |
| Some other Race | 25 | 0.9% |
| Total | 2,905 | 100.0% |
Ancestry in Homestead borough
The most populous ancestries reported in Homestead borough are German (320 | 11.0%), Irish (293 | 10.1%), Italian (166 | 5.7%), Subsaharan African (147 | 5.1%), and American (99 | 3.4%), together accounting for 35.3% of all Homestead borough residents.
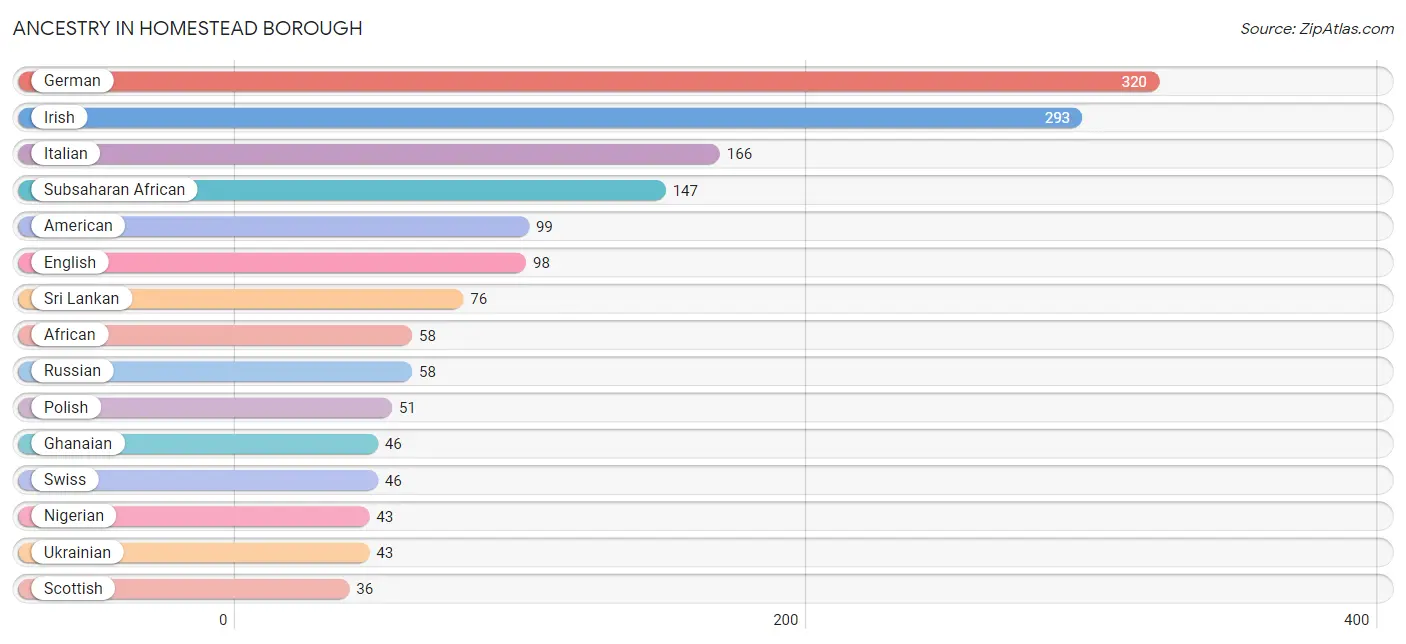
| Ancestry | # Population | % Population |
| African | 58 | 2.0% |
| American | 99 | 3.4% |
| Argentinean | 11 | 0.4% |
| Carpatho Rusyn | 5 | 0.2% |
| Cherokee | 12 | 0.4% |
| Cuban | 16 | 0.5% |
| Eastern European | 2 | 0.1% |
| English | 98 | 3.4% |
| German | 320 | 11.0% |
| Ghanaian | 46 | 1.6% |
| Greek | 5 | 0.2% |
| Hungarian | 3 | 0.1% |
| Irish | 293 | 10.1% |
| Italian | 166 | 5.7% |
| Nigerian | 43 | 1.5% |
| Polish | 51 | 1.8% |
| Puerto Rican | 25 | 0.9% |
| Russian | 58 | 2.0% |
| Scotch-Irish | 5 | 0.2% |
| Scottish | 36 | 1.2% |
| Slovak | 26 | 0.9% |
| South American | 11 | 0.4% |
| Sri Lankan | 76 | 2.6% |
| Subsaharan African | 147 | 5.1% |
| Swedish | 30 | 1.0% |
| Swiss | 46 | 1.6% |
| Ukrainian | 43 | 1.5% | View All 27 Rows |
Immigrants in Homestead borough
The most numerous immigrant groups reported in Homestead borough came from Eastern Europe (103 | 3.5%), Europe (103 | 3.5%), Asia (86 | 3.0%), Ukraine (51 | 1.8%), and Russia (31 | 1.1%), together accounting for 12.9% of all Homestead borough residents.
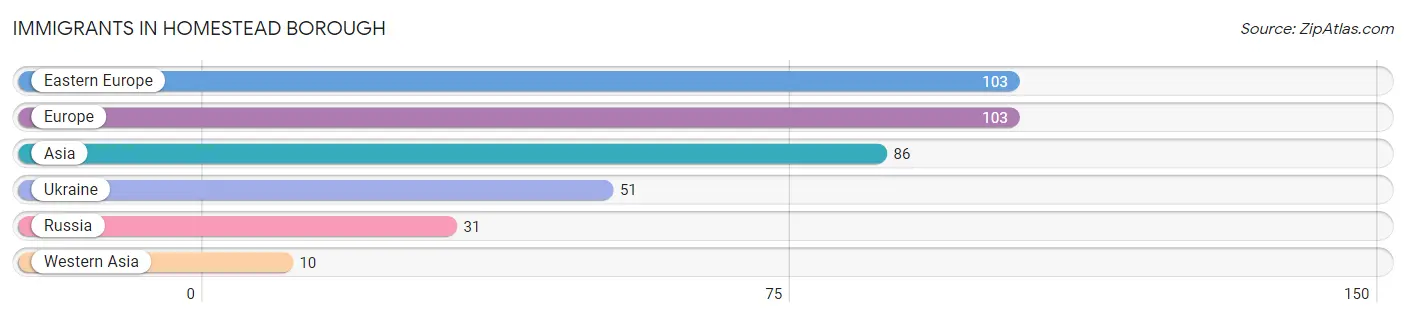
| Immigration Origin | # Population | % Population |
| Asia | 86 | 3.0% |
| Eastern Europe | 103 | 3.5% |
| Europe | 103 | 3.5% |
| Russia | 31 | 1.1% |
| Ukraine | 51 | 1.8% |
| Western Asia | 10 | 0.3% | View All 6 Rows |
Sex and Age in Homestead borough
Sex and Age in Homestead borough
The most populous age groups in Homestead borough are 25 to 29 Years (278 | 19.8%) for men and 20 to 24 Years (238 | 15.9%) for women.
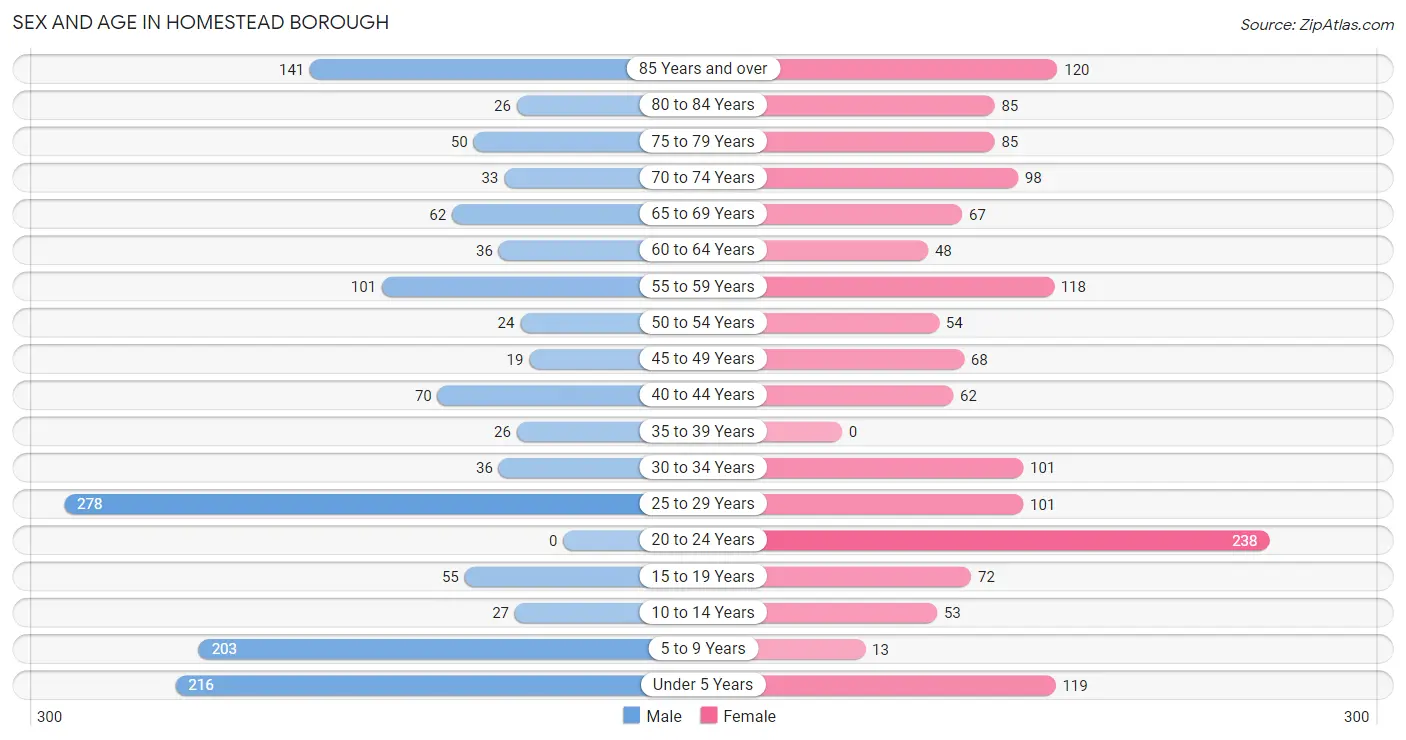
| Age Bracket | Male | Female |
| Under 5 Years | 216 (15.4%) | 119 (7.9%) |
| 5 to 9 Years | 203 (14.5%) | 13 (0.9%) |
| 10 to 14 Years | 27 (1.9%) | 53 (3.5%) |
| 15 to 19 Years | 55 (3.9%) | 72 (4.8%) |
| 20 to 24 Years | 0 (0.0%) | 238 (15.9%) |
| 25 to 29 Years | 278 (19.8%) | 101 (6.7%) |
| 30 to 34 Years | 36 (2.6%) | 101 (6.7%) |
| 35 to 39 Years | 26 (1.8%) | 0 (0.0%) |
| 40 to 44 Years | 70 (5.0%) | 62 (4.1%) |
| 45 to 49 Years | 19 (1.3%) | 68 (4.5%) |
| 50 to 54 Years | 24 (1.7%) | 54 (3.6%) |
| 55 to 59 Years | 101 (7.2%) | 118 (7.9%) |
| 60 to 64 Years | 36 (2.6%) | 48 (3.2%) |
| 65 to 69 Years | 62 (4.4%) | 67 (4.5%) |
| 70 to 74 Years | 33 (2.4%) | 98 (6.5%) |
| 75 to 79 Years | 50 (3.6%) | 85 (5.7%) |
| 80 to 84 Years | 26 (1.8%) | 85 (5.7%) |
| 85 Years and over | 141 (10.1%) | 120 (8.0%) |
| Total | 1,403 (100.0%) | 1,502 (100.0%) |
Families and Households in Homestead borough
Median Family Size in Homestead borough
The median family size in Homestead borough is 3.42 persons per family, with married-couple families (323 | 52.5%) accounting for the largest median family size of 3.66 persons per family. On the other hand, single male/father families (14 | 2.3%) represent the smallest median family size with 2.14 persons per family.
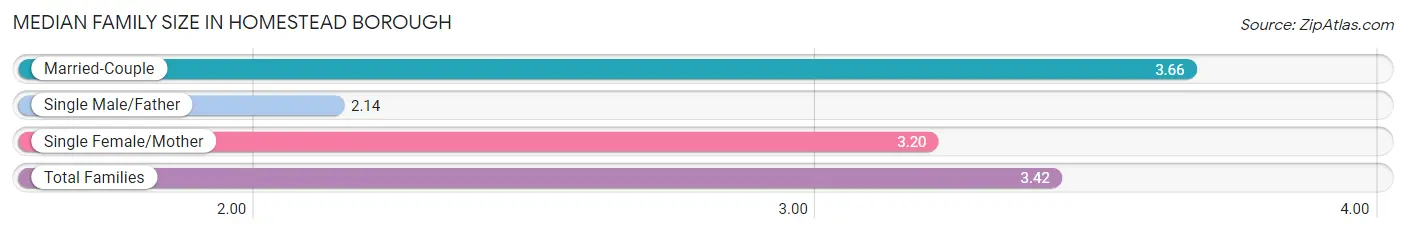
| Family Type | # Families | Family Size |
| Married-Couple | 323 (52.5%) | 3.66 |
| Single Male/Father | 14 (2.3%) | 2.14 |
| Single Female/Mother | 278 (45.2%) | 3.20 |
| Total Families | 615 (100.0%) | 3.42 |
Median Household Size in Homestead borough
The median household size in Homestead borough is 2.27 persons per household, with married-couple households (323 | 25.6%) accounting for the largest median household size of 3.73 persons per household. non-family households (649 | 51.3%) represent the smallest median household size with 1.13 persons per household.
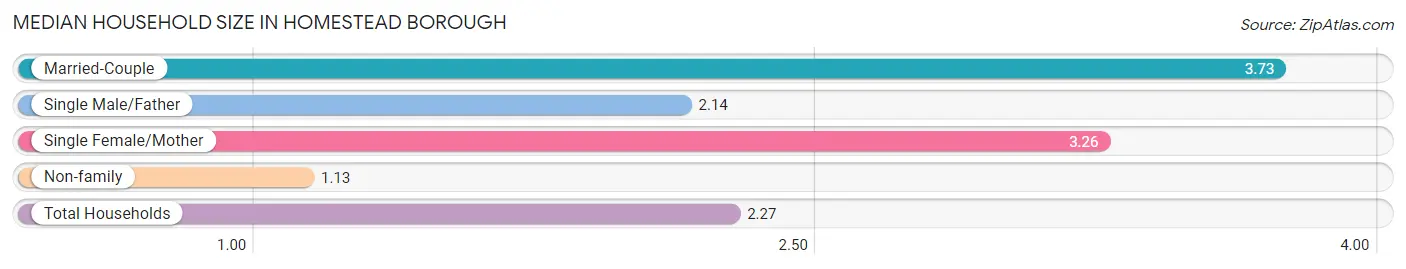
| Household Type | # Households | Household Size |
| Married-Couple | 323 (25.6%) | 3.73 |
| Single Male/Father | 14 (1.1%) | 2.14 |
| Single Female/Mother | 278 (22.0%) | 3.26 |
| Non-family | 649 (51.3%) | 1.13 |
| Total Households | 1,264 (100.0%) | 2.27 |
Household Size by Marriage Status in Homestead borough
Out of a total of 1,264 households in Homestead borough, 615 (48.7%) are family households, while 649 (51.3%) are nonfamily households. The most numerous type of family households are 2-person households, comprising 304, and the most common type of nonfamily households are 1-person households, comprising 576.
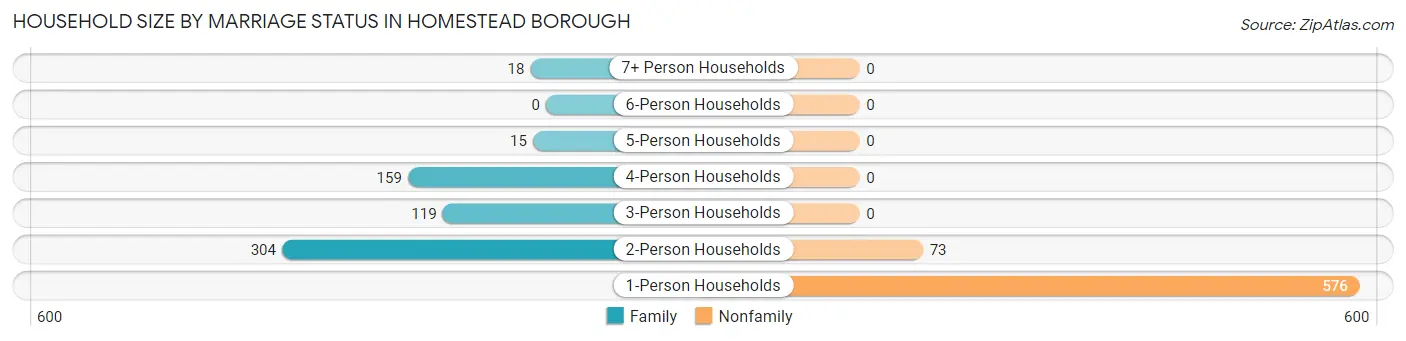
| Household Size | Family Households | Nonfamily Households |
| 1-Person Households | - | 576 (45.6%) |
| 2-Person Households | 304 (24.0%) | 73 (5.8%) |
| 3-Person Households | 119 (9.4%) | 0 (0.0%) |
| 4-Person Households | 159 (12.6%) | 0 (0.0%) |
| 5-Person Households | 15 (1.2%) | 0 (0.0%) |
| 6-Person Households | 0 (0.0%) | 0 (0.0%) |
| 7+ Person Households | 18 (1.4%) | 0 (0.0%) |
| Total | 615 (48.7%) | 649 (51.3%) |
Female Fertility in Homestead borough
Fertility by Age in Homestead borough
Average fertility rate in Homestead borough is 140.0 births per 1,000 women. Women in the age bracket of 20 to 34 years have the highest fertility rate with 164.0 births per 1,000 women. Women in the age bracket of 20 to 34 years acount for 80.0% of all women with births.
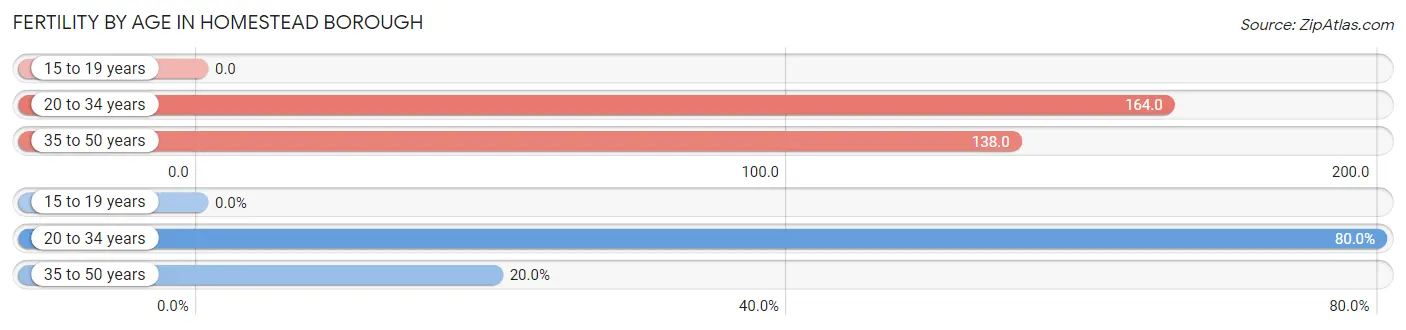
| Age Bracket | Women with Births | Births / 1,000 Women |
| 15 to 19 years | 0 (0.0%) | 0.0 |
| 20 to 34 years | 72 (80.0%) | 164.0 |
| 35 to 50 years | 18 (20.0%) | 138.0 |
| Total | 90 (100.0%) | 140.0 |
Fertility by Age by Marriage Status in Homestead borough
36.7% of women with births (90) in Homestead borough are married. The highest percentage of unmarried women with births falls into 20 to 34 years age bracket with 79.2% of them unmarried at the time of birth, while the lowest percentage of unmarried women with births belong to 35 to 50 years age bracket with 0.0% of them unmarried.
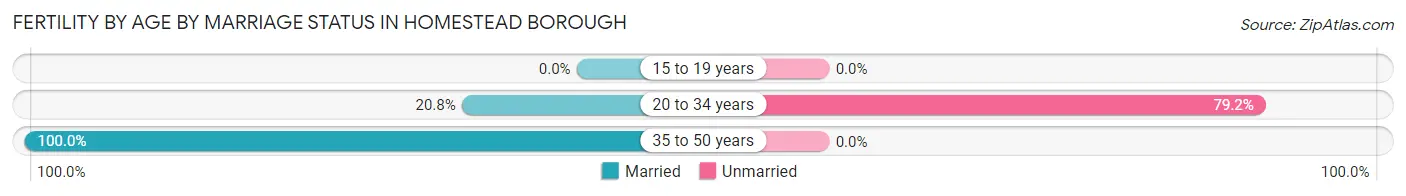
| Age Bracket | Married | Unmarried |
| 15 to 19 years | 0 (0.0%) | 0 (0.0%) |
| 20 to 34 years | 15 (20.8%) | 57 (79.2%) |
| 35 to 50 years | 18 (100.0%) | 0 (0.0%) |
| Total | 33 (36.7%) | 57 (63.3%) |
Fertility by Education in Homestead borough
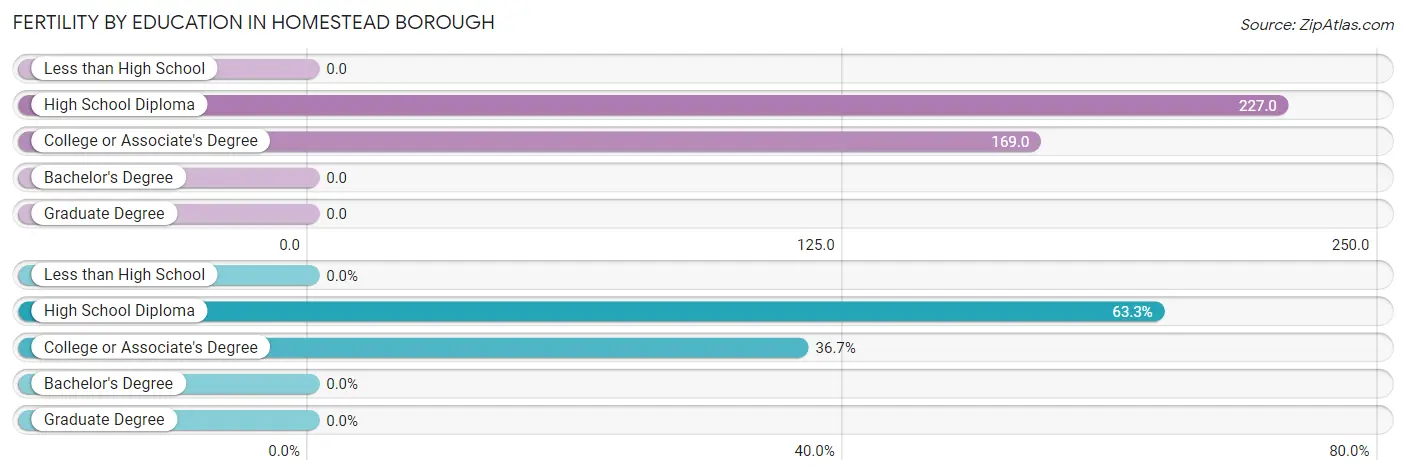
| Educational Attainment | Women with Births | Births / 1,000 Women |
| Less than High School | 0 (0.0%) | 0.0 |
| High School Diploma | 57 (63.3%) | 227.0 |
| College or Associate's Degree | 33 (36.7%) | 169.0 |
| Bachelor's Degree | 0 (0.0%) | 0.0 |
| Graduate Degree | 0 (0.0%) | 0.0 |
| Total | 90 (100.0%) | 140.0 |
Fertility by Education by Marriage Status in Homestead borough
63.3% of women with births in Homestead borough are unmarried. Women with the educational attainment of college or associate's degree are most likely to be married with 100.0% of them married at childbirth, while women with the educational attainment of high school diploma are least likely to be married with 100.0% of them unmarried at childbirth.
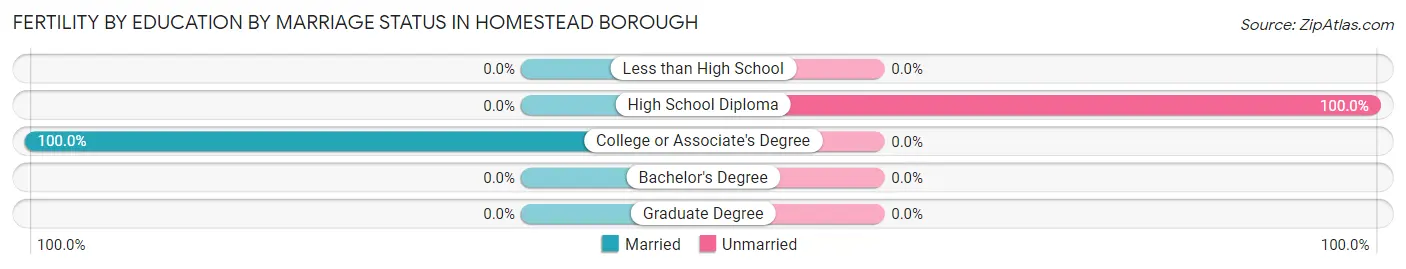
| Educational Attainment | Married | Unmarried |
| Less than High School | 0 (0.0%) | 0 (0.0%) |
| High School Diploma | 0 (0.0%) | 57 (100.0%) |
| College or Associate's Degree | 33 (100.0%) | 0 (0.0%) |
| Bachelor's Degree | 0 (0.0%) | 0 (0.0%) |
| Graduate Degree | 0 (0.0%) | 0 (0.0%) |
| Total | 33 (36.7%) | 57 (63.3%) |
Employment Characteristics in Homestead borough
Employment by Class of Employer in Homestead borough
Among the 1,018 employed individuals in Homestead borough, private company employees (830 | 81.5%), not-for-profit organizations (98 | 9.6%), and self-employed (not incorporated) (43 | 4.2%) make up the most common classes of employment.
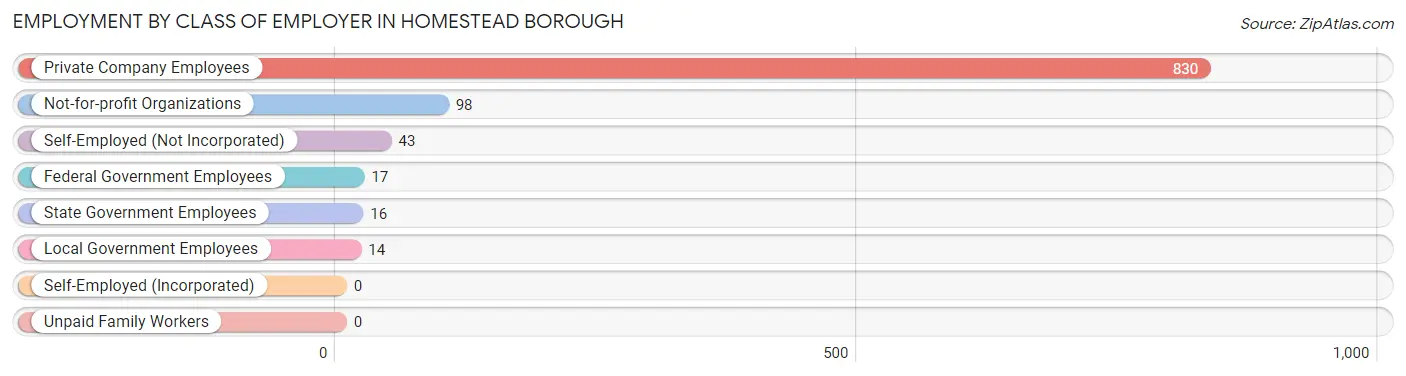
| Employer Class | # Employees | % Employees |
| Private Company Employees | 830 | 81.5% |
| Self-Employed (Incorporated) | 0 | 0.0% |
| Self-Employed (Not Incorporated) | 43 | 4.2% |
| Not-for-profit Organizations | 98 | 9.6% |
| Local Government Employees | 14 | 1.4% |
| State Government Employees | 16 | 1.6% |
| Federal Government Employees | 17 | 1.7% |
| Unpaid Family Workers | 0 | 0.0% |
| Total | 1,018 | 100.0% |
Employment Status by Age in Homestead borough
According to the labor force statistics for Homestead borough, out of the total population over 16 years of age (2,274), 50.1% or 1,139 individuals are in the labor force, with 9.9% or 113 of them unemployed. The age group with the highest labor force participation rate is 25 to 29 years, with 96.8% or 367 individuals in the labor force. Within the labor force, the 20 to 24 years age range has the highest percentage of unemployed individuals, with 29.7% or 41 of them being unemployed.
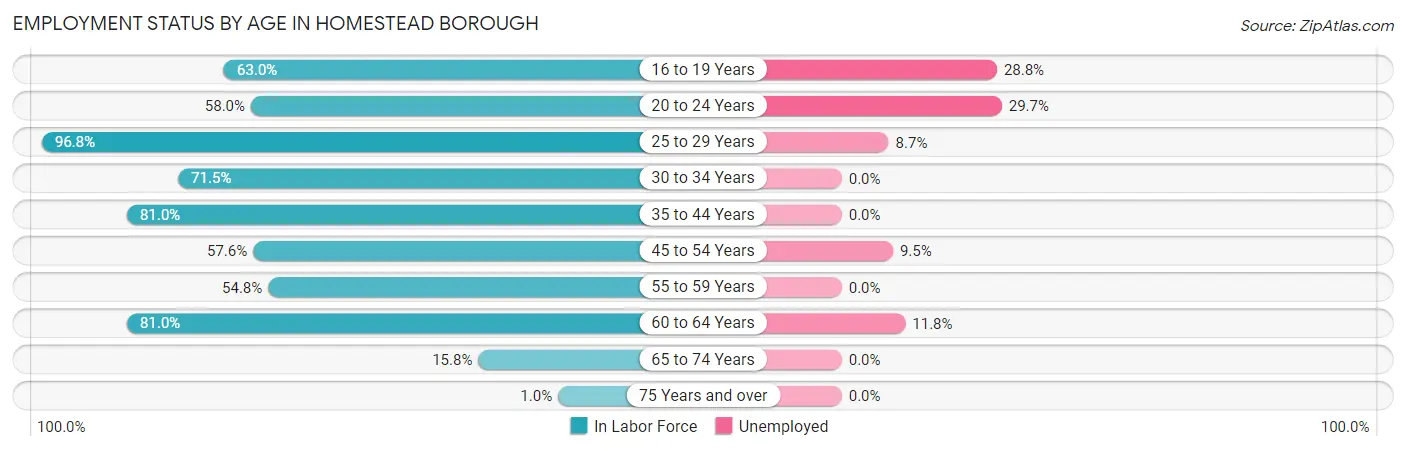
| Age Bracket | In Labor Force | Unemployed |
| 16 to 19 Years | 80 (63.0%) | 23 (28.8%) |
| 20 to 24 Years | 138 (58.0%) | 41 (29.7%) |
| 25 to 29 Years | 367 (96.8%) | 32 (8.7%) |
| 30 to 34 Years | 98 (71.5%) | 0 (0.0%) |
| 35 to 44 Years | 128 (81.0%) | 0 (0.0%) |
| 45 to 54 Years | 95 (57.6%) | 9 (9.5%) |
| 55 to 59 Years | 120 (54.8%) | 0 (0.0%) |
| 60 to 64 Years | 68 (81.0%) | 8 (11.8%) |
| 65 to 74 Years | 41 (15.8%) | 0 (0.0%) |
| 75 Years and over | 5 (1.0%) | 0 (0.0%) |
| Total | 1,139 (50.1%) | 113 (9.9%) |
Employment Status by Educational Attainment in Homestead borough
According to labor force statistics for Homestead borough, 76.7% of individuals (876) out of the total population between 25 and 64 years of age (1,142) are in the labor force, with 5.6% or 49 of them being unemployed. The group with the highest labor force participation rate are those with the educational attainment of college / associate degree, with 90.6% or 414 individuals in the labor force. Within the labor force, individuals with college / associate degree education have the highest percentage of unemployment, with 11.1% or 46 of them being unemployed.
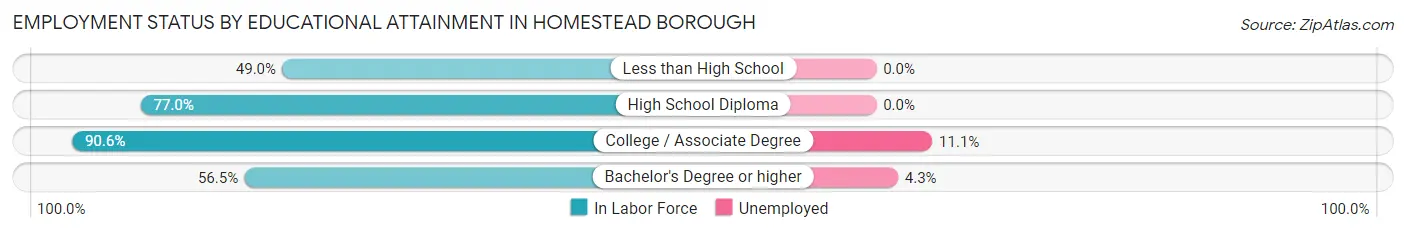
| Educational Attainment | In Labor Force | Unemployed |
| Less than High School | 70 (49.0%) | 0 (0.0%) |
| High School Diploma | 322 (77.0%) | 0 (0.0%) |
| College / Associate Degree | 414 (90.6%) | 51 (11.1%) |
| Bachelor's Degree or higher | 70 (56.5%) | 5 (4.3%) |
| Total | 876 (76.7%) | 64 (5.6%) |
Employment Occupations by Sex in Homestead borough
Management, Business, Science and Arts Occupations
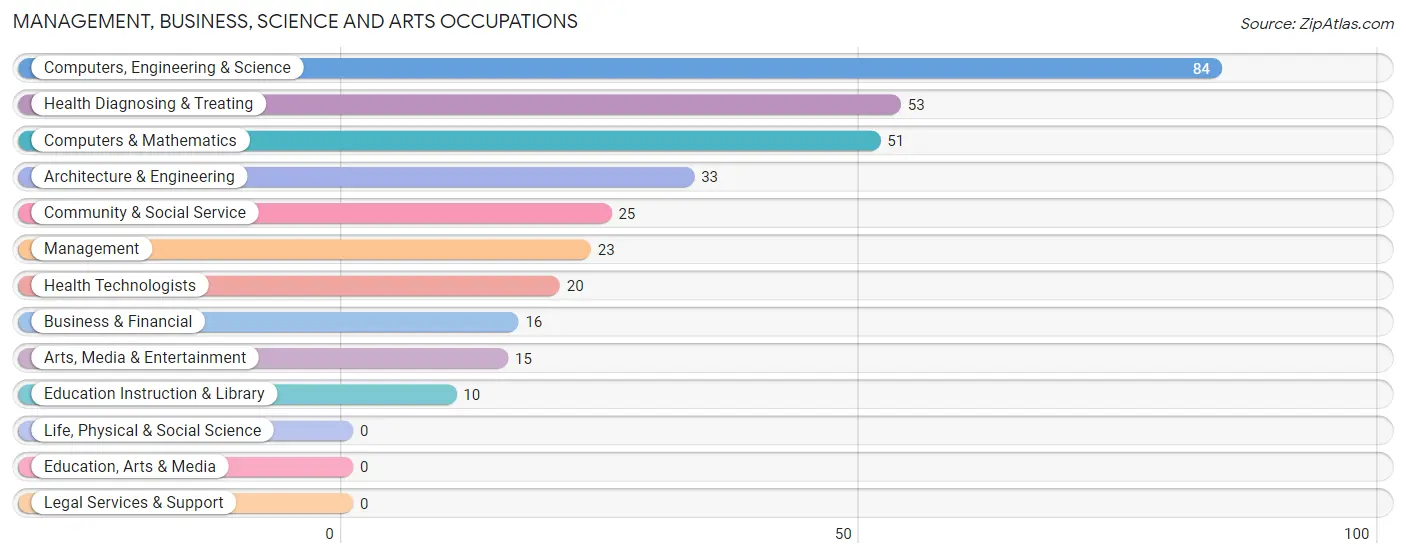
The most common Management, Business, Science and Arts occupations in Homestead borough are Computers, Engineering & Science (84 | 8.2%), Health Diagnosing & Treating (53 | 5.2%), Computers & Mathematics (51 | 5.0%), Architecture & Engineering (33 | 3.2%), and Community & Social Service (25 | 2.4%).
Management, Business, Science and Arts Occupations by Sex
Within the Management, Business, Science and Arts occupations in Homestead borough, the most male-oriented occupations are Management (100.0%), Business & Financial (100.0%), and Arts, Media & Entertainment (100.0%), while the most female-oriented occupations are Education Instruction & Library (100.0%), Health Diagnosing & Treating (100.0%), and Health Technologists (100.0%).
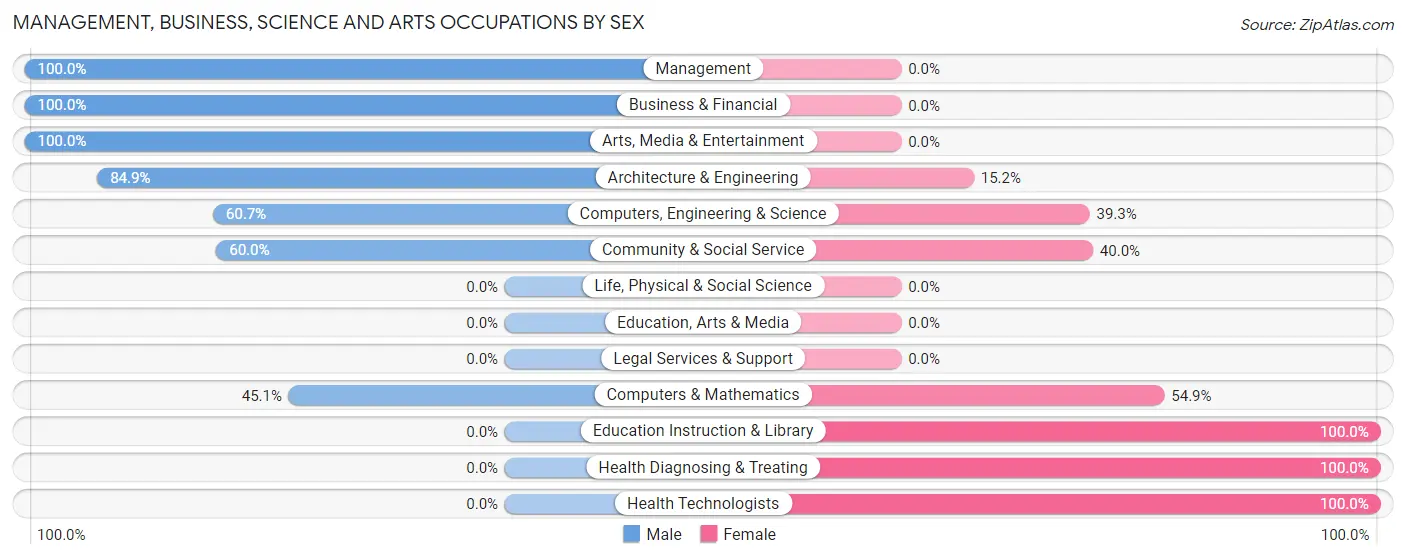
| Occupation | Male | Female |
| Management | 23 (100.0%) | 0 (0.0%) |
| Business & Financial | 16 (100.0%) | 0 (0.0%) |
| Computers, Engineering & Science | 51 (60.7%) | 33 (39.3%) |
| Computers & Mathematics | 23 (45.1%) | 28 (54.9%) |
| Architecture & Engineering | 28 (84.9%) | 5 (15.1%) |
| Life, Physical & Social Science | 0 (0.0%) | 0 (0.0%) |
| Community & Social Service | 15 (60.0%) | 10 (40.0%) |
| Education, Arts & Media | 0 (0.0%) | 0 (0.0%) |
| Legal Services & Support | 0 (0.0%) | 0 (0.0%) |
| Education Instruction & Library | 0 (0.0%) | 10 (100.0%) |
| Arts, Media & Entertainment | 15 (100.0%) | 0 (0.0%) |
| Health Diagnosing & Treating | 0 (0.0%) | 53 (100.0%) |
| Health Technologists | 0 (0.0%) | 20 (100.0%) |
| Total (Category) | 105 (52.2%) | 96 (47.8%) |
| Total (Overall) | 523 (50.9%) | 504 (49.1%) |
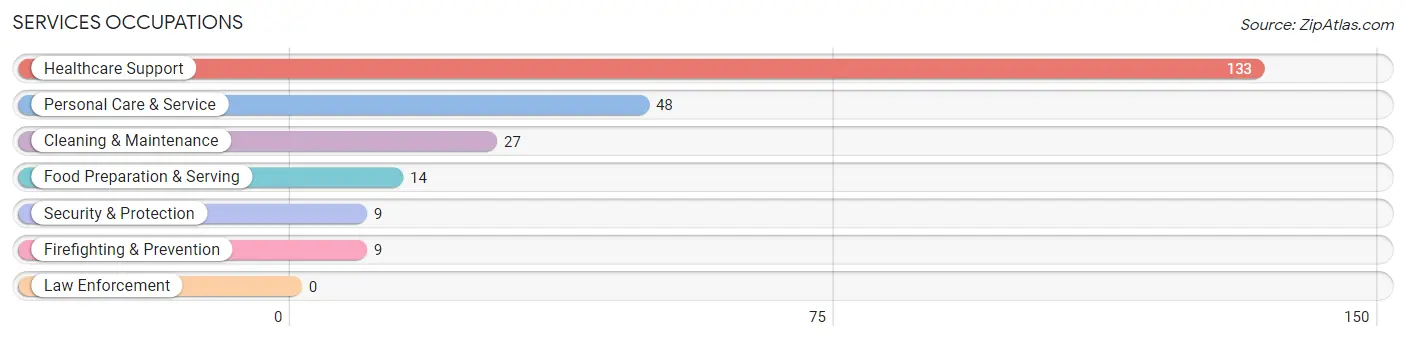
Services Occupations
The most common Services occupations in Homestead borough are Healthcare Support (133 | 13.0%), Personal Care & Service (48 | 4.7%), Cleaning & Maintenance (27 | 2.6%), Food Preparation & Serving (14 | 1.4%), and Security & Protection (9 | 0.9%).
Services Occupations by Sex
Within the Services occupations in Homestead borough, the most male-oriented occupations are Security & Protection (100.0%), Firefighting & Prevention (100.0%), and Cleaning & Maintenance (100.0%), while the most female-oriented occupations are Food Preparation & Serving (100.0%), Personal Care & Service (83.3%), and Healthcare Support (69.2%).
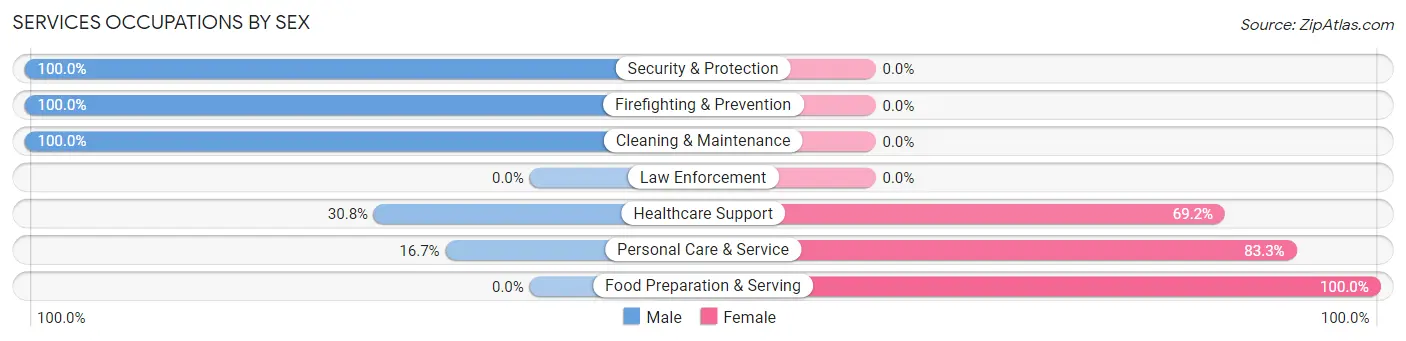
| Occupation | Male | Female |
| Healthcare Support | 41 (30.8%) | 92 (69.2%) |
| Security & Protection | 9 (100.0%) | 0 (0.0%) |
| Firefighting & Prevention | 9 (100.0%) | 0 (0.0%) |
| Law Enforcement | 0 (0.0%) | 0 (0.0%) |
| Food Preparation & Serving | 0 (0.0%) | 14 (100.0%) |
| Cleaning & Maintenance | 27 (100.0%) | 0 (0.0%) |
| Personal Care & Service | 8 (16.7%) | 40 (83.3%) |
| Total (Category) | 85 (36.8%) | 146 (63.2%) |
| Total (Overall) | 523 (50.9%) | 504 (49.1%) |
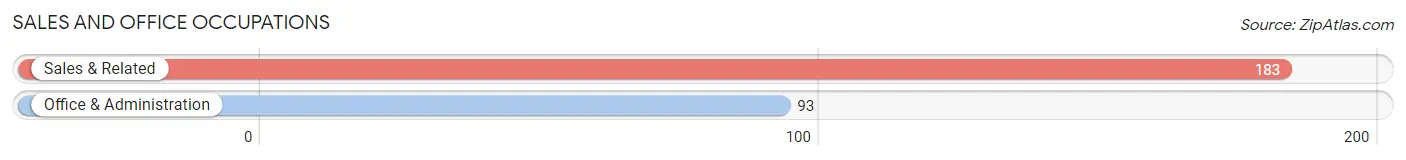
Sales and Office Occupations
The most common Sales and Office occupations in Homestead borough are Sales & Related (183 | 17.8%), and Office & Administration (93 | 9.1%).
Sales and Office Occupations by Sex
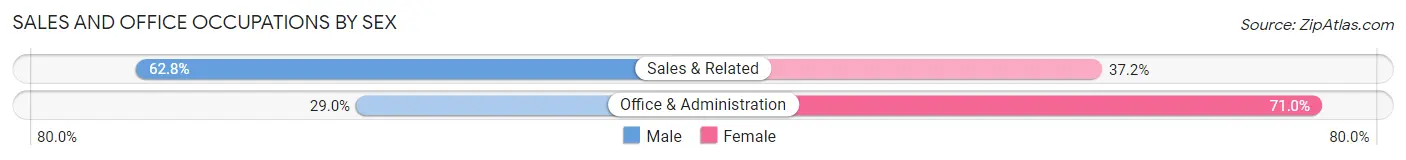
| Occupation | Male | Female |
| Sales & Related | 115 (62.8%) | 68 (37.2%) |
| Office & Administration | 27 (29.0%) | 66 (71.0%) |
| Total (Category) | 142 (51.4%) | 134 (48.5%) |
| Total (Overall) | 523 (50.9%) | 504 (49.1%) |
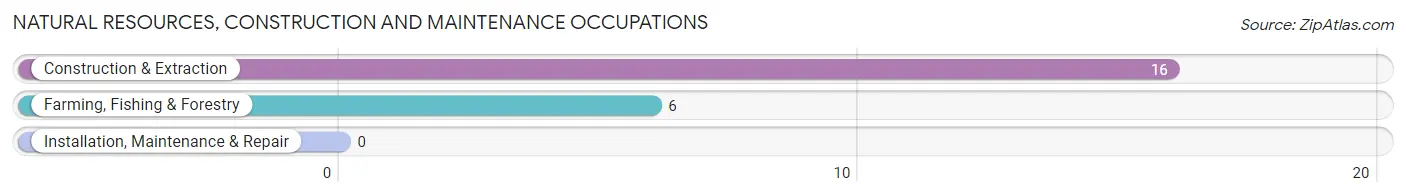
Natural Resources, Construction and Maintenance Occupations
The most common Natural Resources, Construction and Maintenance occupations in Homestead borough are Construction & Extraction (16 | 1.6%), and Farming, Fishing & Forestry (6 | 0.6%).
Natural Resources, Construction and Maintenance Occupations by Sex
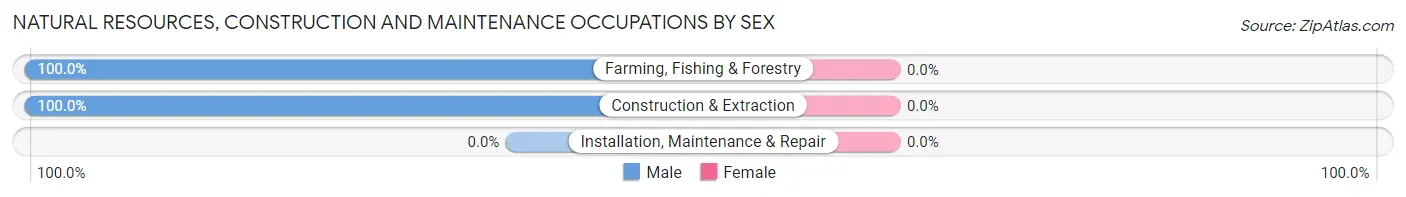
| Occupation | Male | Female |
| Farming, Fishing & Forestry | 6 (100.0%) | 0 (0.0%) |
| Construction & Extraction | 16 (100.0%) | 0 (0.0%) |
| Installation, Maintenance & Repair | 0 (0.0%) | 0 (0.0%) |
| Total (Category) | 22 (100.0%) | 0 (0.0%) |
| Total (Overall) | 523 (50.9%) | 504 (49.1%) |
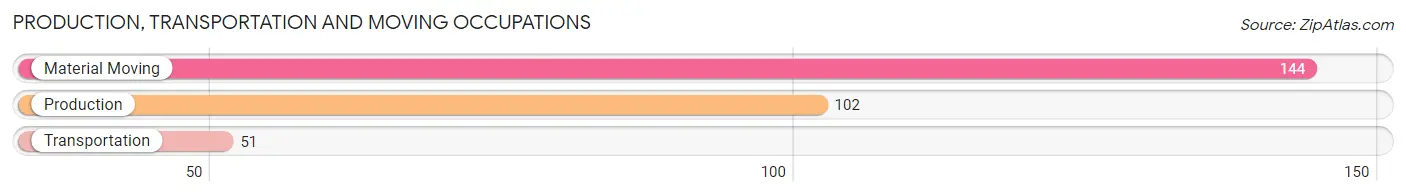
Production, Transportation and Moving Occupations
The most common Production, Transportation and Moving occupations in Homestead borough are Material Moving (144 | 14.0%), Production (102 | 9.9%), and Transportation (51 | 5.0%).
Production, Transportation and Moving Occupations by Sex
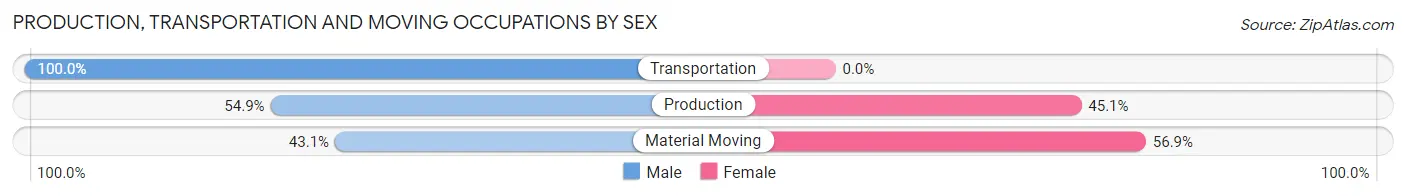
| Occupation | Male | Female |
| Production | 56 (54.9%) | 46 (45.1%) |
| Transportation | 51 (100.0%) | 0 (0.0%) |
| Material Moving | 62 (43.1%) | 82 (56.9%) |
| Total (Category) | 169 (56.9%) | 128 (43.1%) |
| Total (Overall) | 523 (50.9%) | 504 (49.1%) |
Employment Industries by Sex in Homestead borough
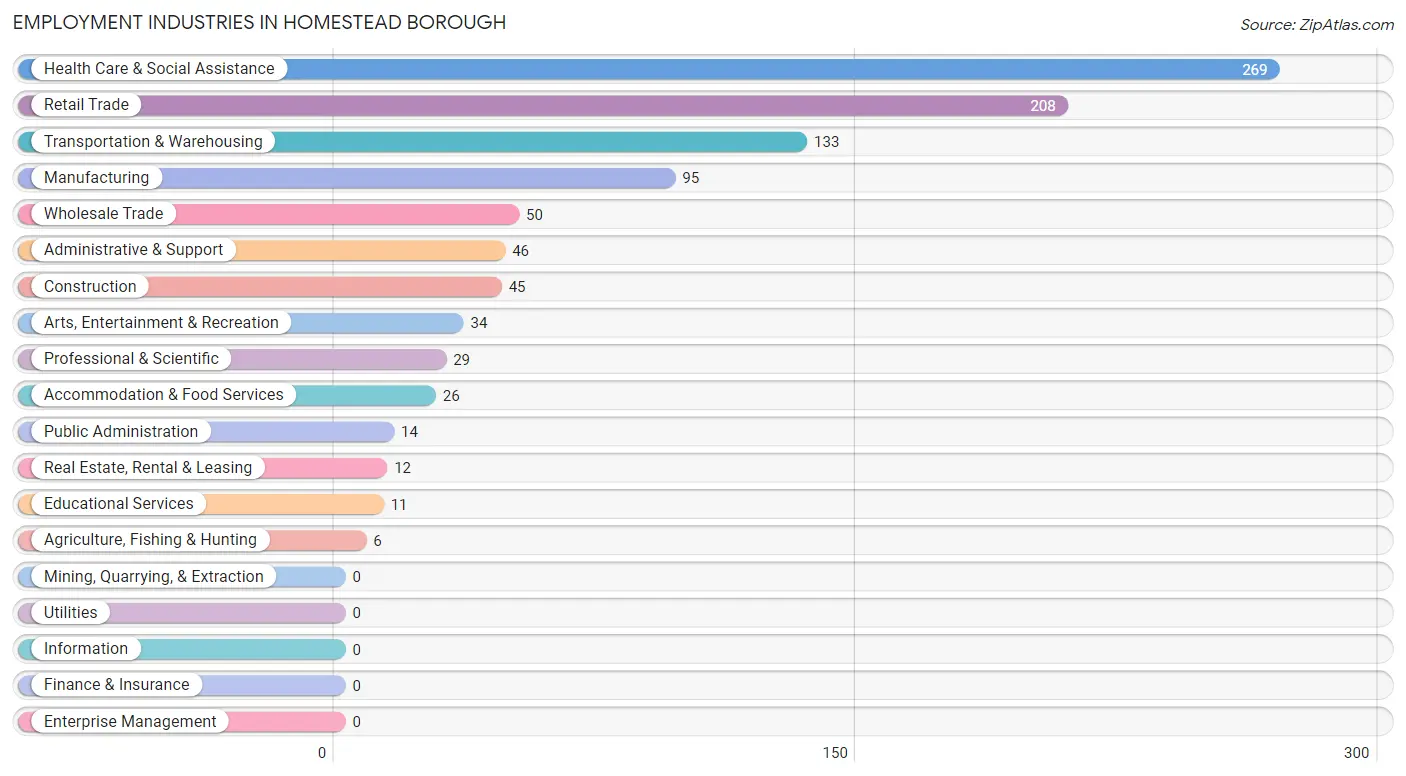
Employment Industries in Homestead borough
The major employment industries in Homestead borough include Health Care & Social Assistance (269 | 26.2%), Retail Trade (208 | 20.3%), Transportation & Warehousing (133 | 13.0%), Manufacturing (95 | 9.2%), and Wholesale Trade (50 | 4.9%).
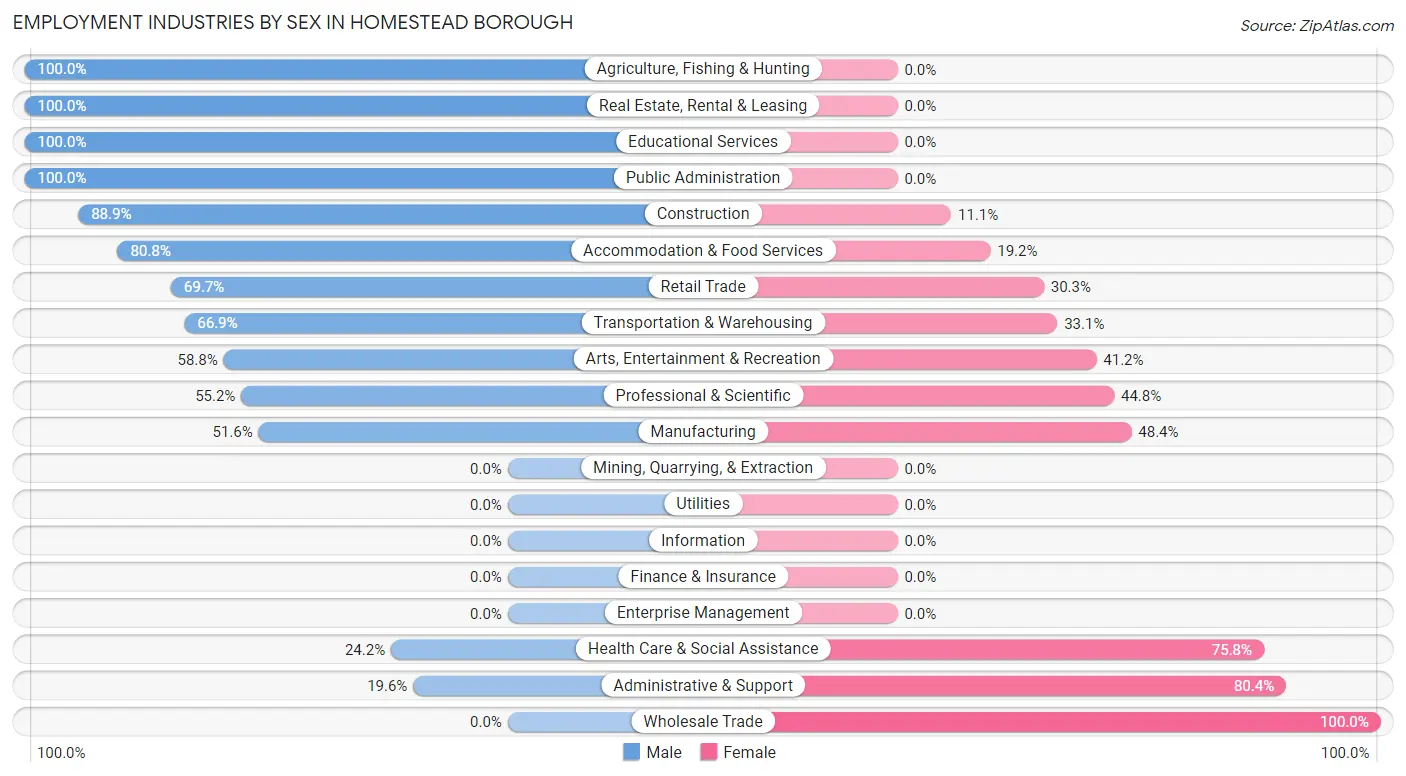
Employment Industries by Sex in Homestead borough
The Homestead borough industries that see more men than women are Agriculture, Fishing & Hunting (100.0%), Real Estate, Rental & Leasing (100.0%), and Educational Services (100.0%), whereas the industries that tend to have a higher number of women are Wholesale Trade (100.0%), Administrative & Support (80.4%), and Health Care & Social Assistance (75.8%).
| Industry | Male | Female |
| Agriculture, Fishing & Hunting | 6 (100.0%) | 0 (0.0%) |
| Mining, Quarrying, & Extraction | 0 (0.0%) | 0 (0.0%) |
| Construction | 40 (88.9%) | 5 (11.1%) |
| Manufacturing | 49 (51.6%) | 46 (48.4%) |
| Wholesale Trade | 0 (0.0%) | 50 (100.0%) |
| Retail Trade | 145 (69.7%) | 63 (30.3%) |
| Transportation & Warehousing | 89 (66.9%) | 44 (33.1%) |
| Utilities | 0 (0.0%) | 0 (0.0%) |
| Information | 0 (0.0%) | 0 (0.0%) |
| Finance & Insurance | 0 (0.0%) | 0 (0.0%) |
| Real Estate, Rental & Leasing | 12 (100.0%) | 0 (0.0%) |
| Professional & Scientific | 16 (55.2%) | 13 (44.8%) |
| Enterprise Management | 0 (0.0%) | 0 (0.0%) |
| Administrative & Support | 9 (19.6%) | 37 (80.4%) |
| Educational Services | 11 (100.0%) | 0 (0.0%) |
| Health Care & Social Assistance | 65 (24.2%) | 204 (75.8%) |
| Arts, Entertainment & Recreation | 20 (58.8%) | 14 (41.2%) |
| Accommodation & Food Services | 21 (80.8%) | 5 (19.2%) |
| Public Administration | 14 (100.0%) | 0 (0.0%) |
| Total | 523 (50.9%) | 504 (49.1%) |
Education in Homestead borough
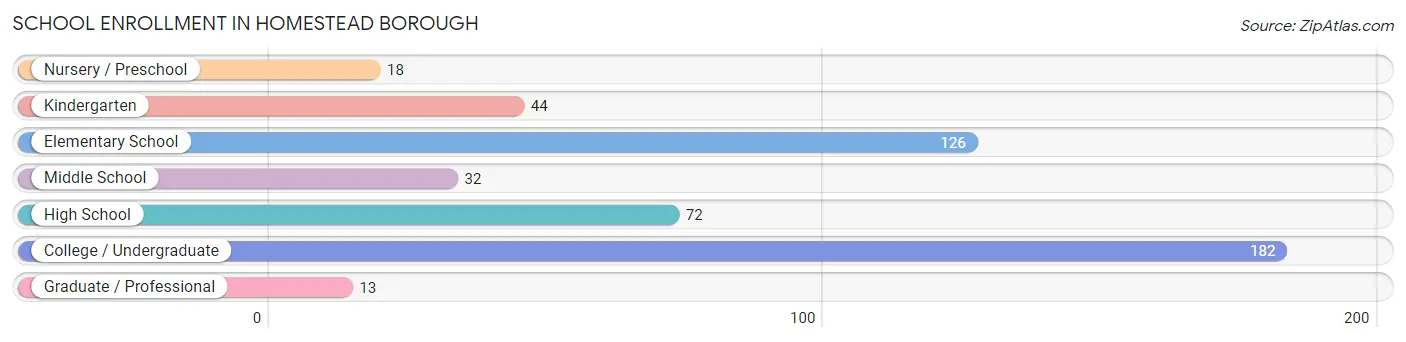
School Enrollment in Homestead borough
The most common levels of schooling among the 487 students in Homestead borough are college / undergraduate (182 | 37.4%), elementary school (126 | 25.9%), and high school (72 | 14.8%).
| School Level | # Students | % Students |
| Nursery / Preschool | 18 | 3.7% |
| Kindergarten | 44 | 9.0% |
| Elementary School | 126 | 25.9% |
| Middle School | 32 | 6.6% |
| High School | 72 | 14.8% |
| College / Undergraduate | 182 | 37.4% |
| Graduate / Professional | 13 | 2.7% |
| Total | 487 | 100.0% |
School Enrollment by Age by Funding Source in Homestead borough
Out of a total of 487 students who are enrolled in schools in Homestead borough, 117 (24.0%) attend a private institution, while the remaining 370 (76.0%) are enrolled in public schools. The age group of 25 to 34 year olds has the highest likelihood of being enrolled in private schools, with 96 (74.4% in the age bracket) enrolled. Conversely, the age group of 5 to 9 year old has the lowest likelihood of being enrolled in a private school, with 149 (100.0% in the age bracket) attending a public institution.
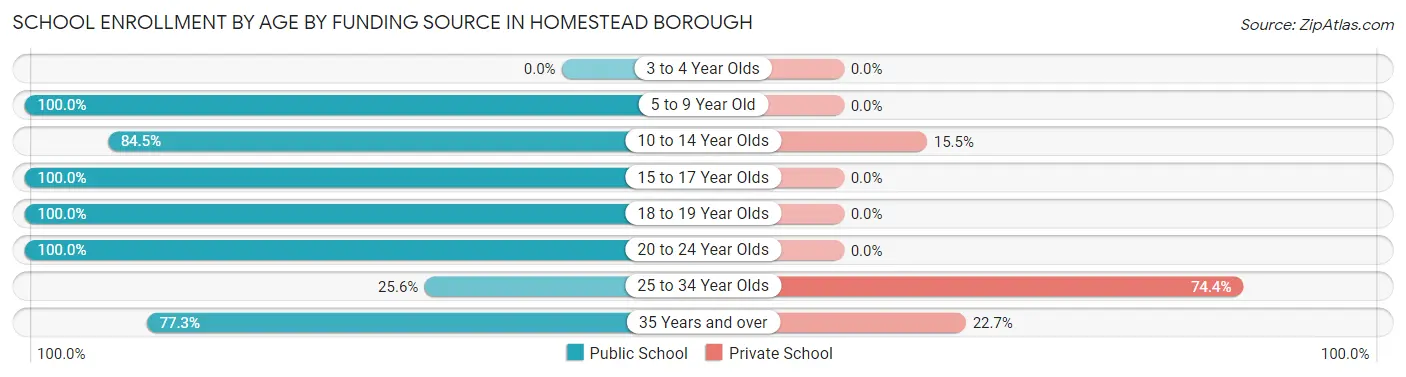
| Age Bracket | Public School | Private School |
| 3 to 4 Year Olds | 0 (0.0%) | 0 (0.0%) |
| 5 to 9 Year Old | 149 (100.0%) | 0 (0.0%) |
| 10 to 14 Year Olds | 60 (84.5%) | 11 (15.5%) |
| 15 to 17 Year Olds | 67 (100.0%) | 0 (0.0%) |
| 18 to 19 Year Olds | 5 (100.0%) | 0 (0.0%) |
| 20 to 24 Year Olds | 22 (100.0%) | 0 (0.0%) |
| 25 to 34 Year Olds | 33 (25.6%) | 96 (74.4%) |
| 35 Years and over | 34 (77.3%) | 10 (22.7%) |
| Total | 370 (76.0%) | 117 (24.0%) |
Educational Attainment by Field of Study in Homestead borough
Business (80 | 27.5%), computers & mathematics (52 | 17.9%), engineering (51 | 17.5%), liberal arts & history (26 | 8.9%), and arts & humanities (18 | 6.2%) are the most common fields of study among 291 individuals in Homestead borough who have obtained a bachelor's degree or higher.
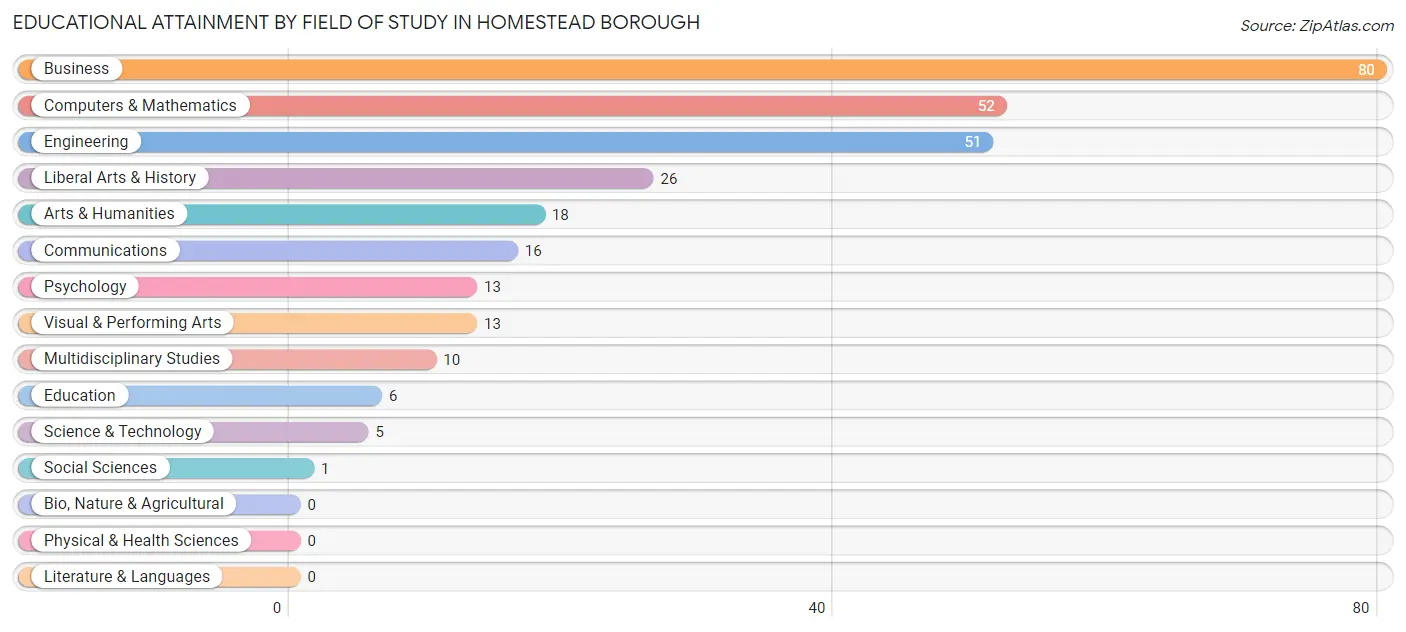
| Field of Study | # Graduates | % Graduates |
| Computers & Mathematics | 52 | 17.9% |
| Bio, Nature & Agricultural | 0 | 0.0% |
| Physical & Health Sciences | 0 | 0.0% |
| Psychology | 13 | 4.5% |
| Social Sciences | 1 | 0.3% |
| Engineering | 51 | 17.5% |
| Multidisciplinary Studies | 10 | 3.4% |
| Science & Technology | 5 | 1.7% |
| Business | 80 | 27.5% |
| Education | 6 | 2.1% |
| Literature & Languages | 0 | 0.0% |
| Liberal Arts & History | 26 | 8.9% |
| Visual & Performing Arts | 13 | 4.5% |
| Communications | 16 | 5.5% |
| Arts & Humanities | 18 | 6.2% |
| Total | 291 | 100.0% |
Transportation & Commute in Homestead borough
Vehicle Availability by Sex in Homestead borough
The most prevalent vehicle ownership categories in Homestead borough are males with 1 vehicle (216, accounting for 41.8%) and females with 1 vehicle (210, making up 43.6%).
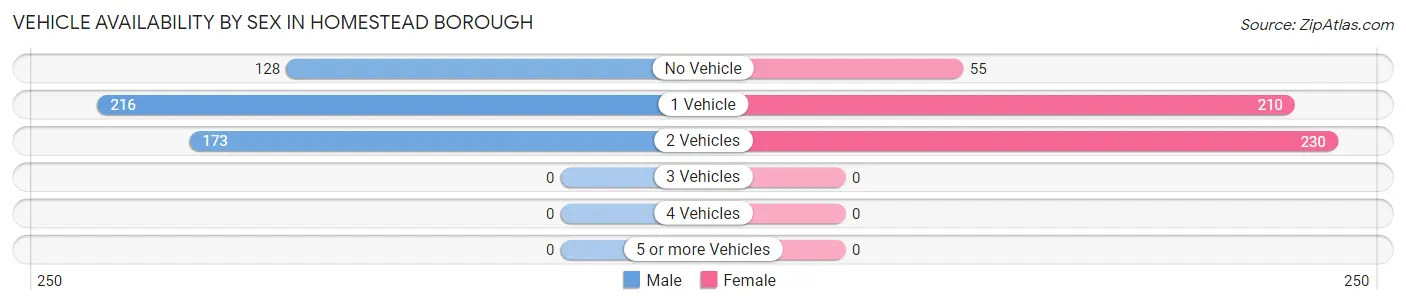
| Vehicles Available | Male | Female |
| No Vehicle | 128 (24.8%) | 55 (11.1%) |
| 1 Vehicle | 216 (41.8%) | 210 (42.4%) |
| 2 Vehicles | 173 (33.5%) | 230 (46.5%) |
| 3 Vehicles | 0 (0.0%) | 0 (0.0%) |
| 4 Vehicles | 0 (0.0%) | 0 (0.0%) |
| 5 or more Vehicles | 0 (0.0%) | 0 (0.0%) |
| Total | 517 (100.0%) | 495 (100.0%) |
Commute Time in Homestead borough
The most frequently occuring commute durations in Homestead borough are 25 to 29 minutes (172 commuters, 18.8%), 60 to 89 minutes (169 commuters, 18.4%), and 15 to 19 minutes (140 commuters, 15.3%).
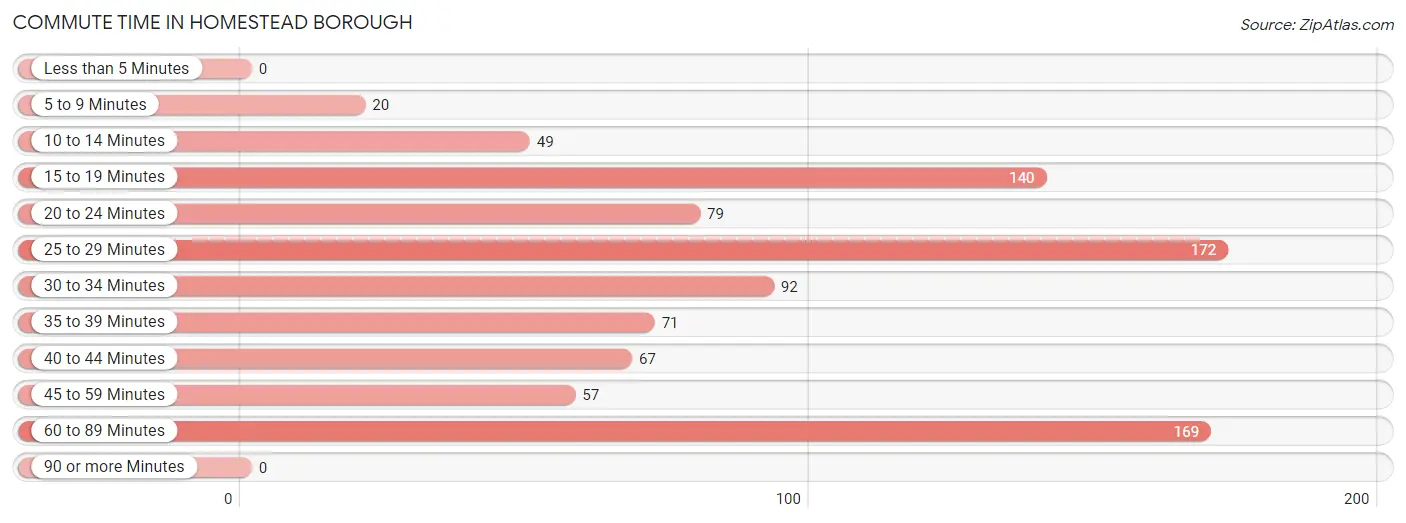
| Commute Time | # Commuters | % Commuters |
| Less than 5 Minutes | 0 | 0.0% |
| 5 to 9 Minutes | 20 | 2.2% |
| 10 to 14 Minutes | 49 | 5.3% |
| 15 to 19 Minutes | 140 | 15.3% |
| 20 to 24 Minutes | 79 | 8.6% |
| 25 to 29 Minutes | 172 | 18.8% |
| 30 to 34 Minutes | 92 | 10.0% |
| 35 to 39 Minutes | 71 | 7.7% |
| 40 to 44 Minutes | 67 | 7.3% |
| 45 to 59 Minutes | 57 | 6.2% |
| 60 to 89 Minutes | 169 | 18.4% |
| 90 or more Minutes | 0 | 0.0% |
Commute Time by Sex in Homestead borough
The most common commute times in Homestead borough are 25 to 29 minutes (154 commuters, 30.8%) for males and 60 to 89 minutes (83 commuters, 20.0%) for females.
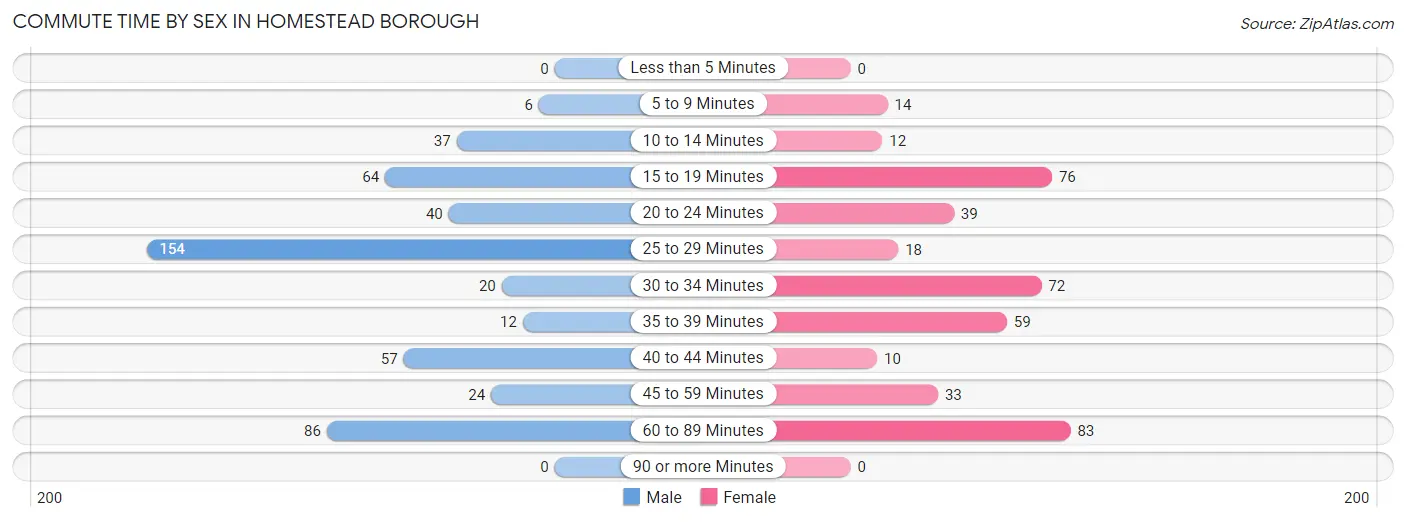
| Commute Time | Male | Female |
| Less than 5 Minutes | 0 (0.0%) | 0 (0.0%) |
| 5 to 9 Minutes | 6 (1.2%) | 14 (3.4%) |
| 10 to 14 Minutes | 37 (7.4%) | 12 (2.9%) |
| 15 to 19 Minutes | 64 (12.8%) | 76 (18.3%) |
| 20 to 24 Minutes | 40 (8.0%) | 39 (9.4%) |
| 25 to 29 Minutes | 154 (30.8%) | 18 (4.3%) |
| 30 to 34 Minutes | 20 (4.0%) | 72 (17.3%) |
| 35 to 39 Minutes | 12 (2.4%) | 59 (14.2%) |
| 40 to 44 Minutes | 57 (11.4%) | 10 (2.4%) |
| 45 to 59 Minutes | 24 (4.8%) | 33 (7.9%) |
| 60 to 89 Minutes | 86 (17.2%) | 83 (20.0%) |
| 90 or more Minutes | 0 (0.0%) | 0 (0.0%) |
Time of Departure to Work by Sex in Homestead borough
The most frequent times of departure to work in Homestead borough are 9:00 AM to 9:59 AM (117, 23.4%) for males and 8:00 AM to 8:29 AM (67, 16.1%) for females.
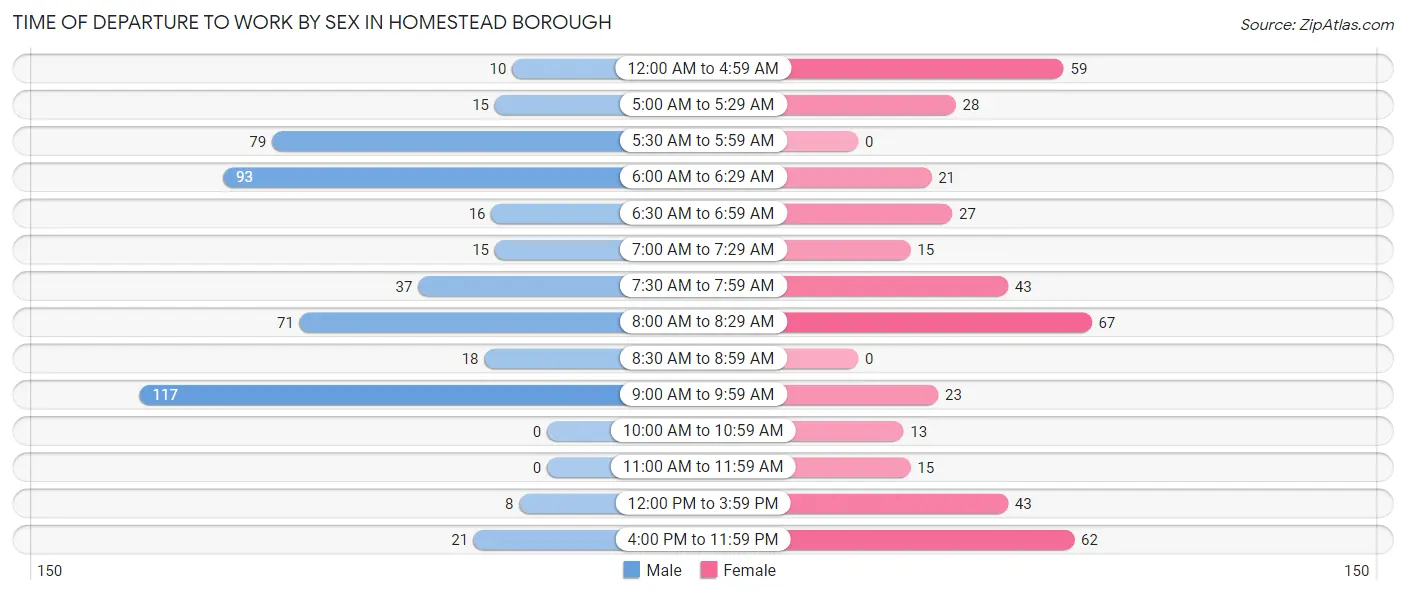
| Time of Departure | Male | Female |
| 12:00 AM to 4:59 AM | 10 (2.0%) | 59 (14.2%) |
| 5:00 AM to 5:29 AM | 15 (3.0%) | 28 (6.7%) |
| 5:30 AM to 5:59 AM | 79 (15.8%) | 0 (0.0%) |
| 6:00 AM to 6:29 AM | 93 (18.6%) | 21 (5.1%) |
| 6:30 AM to 6:59 AM | 16 (3.2%) | 27 (6.5%) |
| 7:00 AM to 7:29 AM | 15 (3.0%) | 15 (3.6%) |
| 7:30 AM to 7:59 AM | 37 (7.4%) | 43 (10.3%) |
| 8:00 AM to 8:29 AM | 71 (14.2%) | 67 (16.1%) |
| 8:30 AM to 8:59 AM | 18 (3.6%) | 0 (0.0%) |
| 9:00 AM to 9:59 AM | 117 (23.4%) | 23 (5.5%) |
| 10:00 AM to 10:59 AM | 0 (0.0%) | 13 (3.1%) |
| 11:00 AM to 11:59 AM | 0 (0.0%) | 15 (3.6%) |
| 12:00 PM to 3:59 PM | 8 (1.6%) | 43 (10.3%) |
| 4:00 PM to 11:59 PM | 21 (4.2%) | 62 (14.9%) |
| Total | 500 (100.0%) | 416 (100.0%) |
Housing Occupancy in Homestead borough
Occupancy by Ownership in Homestead borough
Of the total 1,264 dwellings in Homestead borough, owner-occupied units account for 348 (27.5%), while renter-occupied units make up 916 (72.5%).
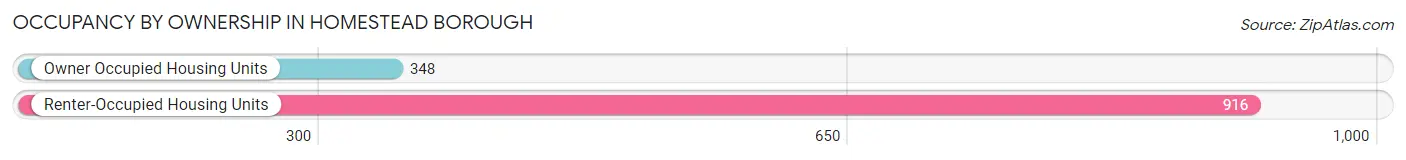
| Occupancy | # Housing Units | % Housing Units |
| Owner Occupied Housing Units | 348 | 27.5% |
| Renter-Occupied Housing Units | 916 | 72.5% |
| Total Occupied Housing Units | 1,264 | 100.0% |
Occupancy by Household Size in Homestead borough
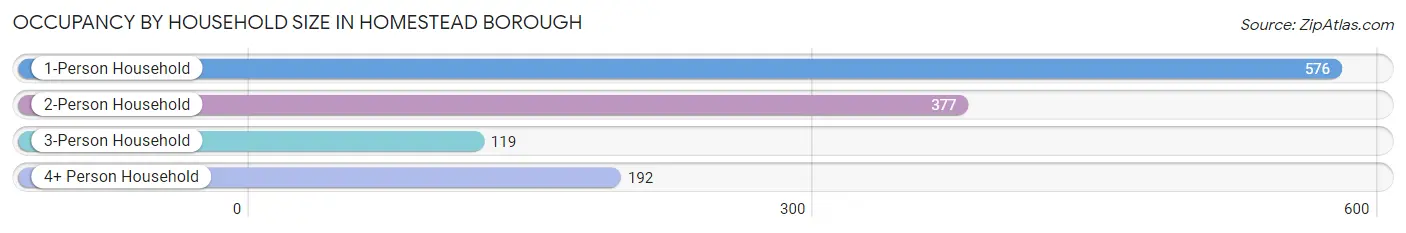
| Household Size | # Housing Units | % Housing Units |
| 1-Person Household | 576 | 45.6% |
| 2-Person Household | 377 | 29.8% |
| 3-Person Household | 119 | 9.4% |
| 4+ Person Household | 192 | 15.2% |
| Total Housing Units | 1,264 | 100.0% |
Occupancy by Ownership by Household Size in Homestead borough
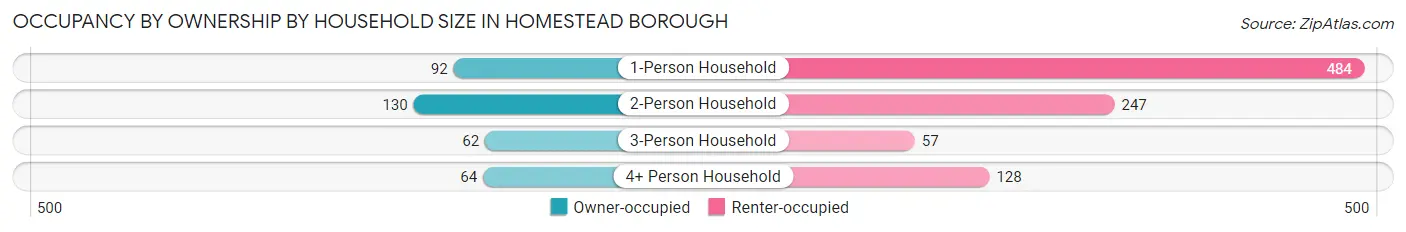
| Household Size | Owner-occupied | Renter-occupied |
| 1-Person Household | 92 (16.0%) | 484 (84.0%) |
| 2-Person Household | 130 (34.5%) | 247 (65.5%) |
| 3-Person Household | 62 (52.1%) | 57 (47.9%) |
| 4+ Person Household | 64 (33.3%) | 128 (66.7%) |
| Total Housing Units | 348 (27.5%) | 916 (72.5%) |
Occupancy by Educational Attainment in Homestead borough
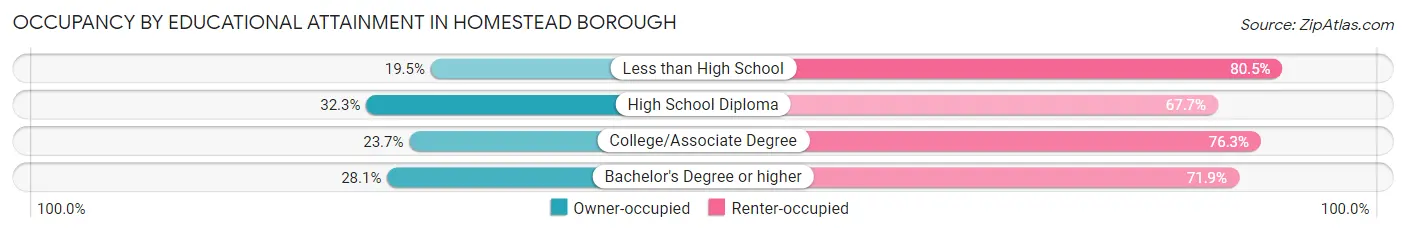
| Household Size | Owner-occupied | Renter-occupied |
| Less than High School | 22 (19.5%) | 91 (80.5%) |
| High School Diploma | 160 (32.3%) | 336 (67.7%) |
| College/Associate Degree | 98 (23.7%) | 315 (76.3%) |
| Bachelor's Degree or higher | 68 (28.1%) | 174 (71.9%) |
Occupancy by Age of Householder in Homestead borough
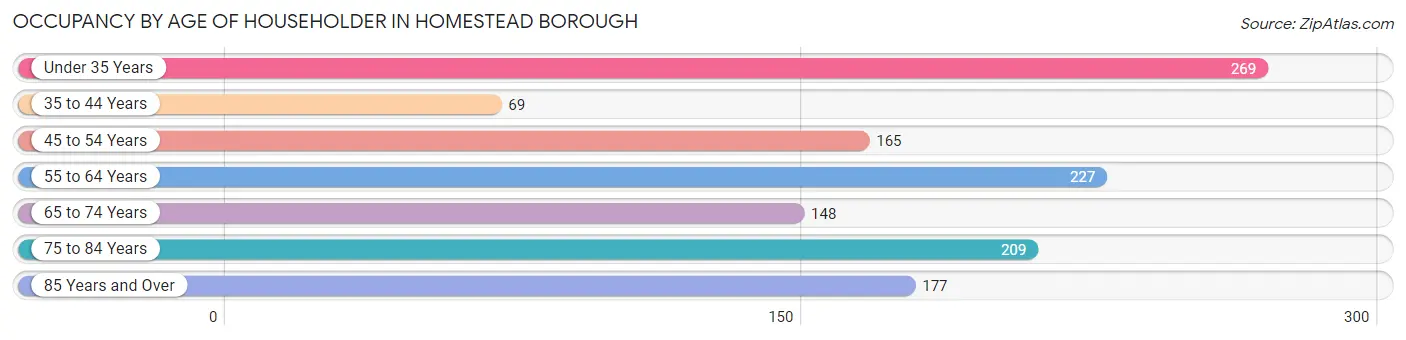
| Age Bracket | # Households | % Households |
| Under 35 Years | 269 | 21.3% |
| 35 to 44 Years | 69 | 5.5% |
| 45 to 54 Years | 165 | 13.1% |
| 55 to 64 Years | 227 | 18.0% |
| 65 to 74 Years | 148 | 11.7% |
| 75 to 84 Years | 209 | 16.5% |
| 85 Years and Over | 177 | 14.0% |
| Total | 1,264 | 100.0% |
Housing Finances in Homestead borough
Median Income by Occupancy in Homestead borough
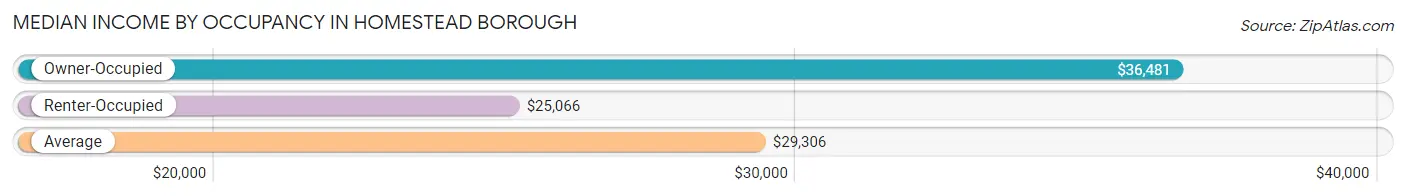
| Occupancy Type | # Households | Median Income |
| Owner-Occupied | 348 (27.5%) | $36,481 |
| Renter-Occupied | 916 (72.5%) | $25,066 |
| Average | 1,264 (100.0%) | $29,306 |
Occupancy by Householder Income Bracket in Homestead borough
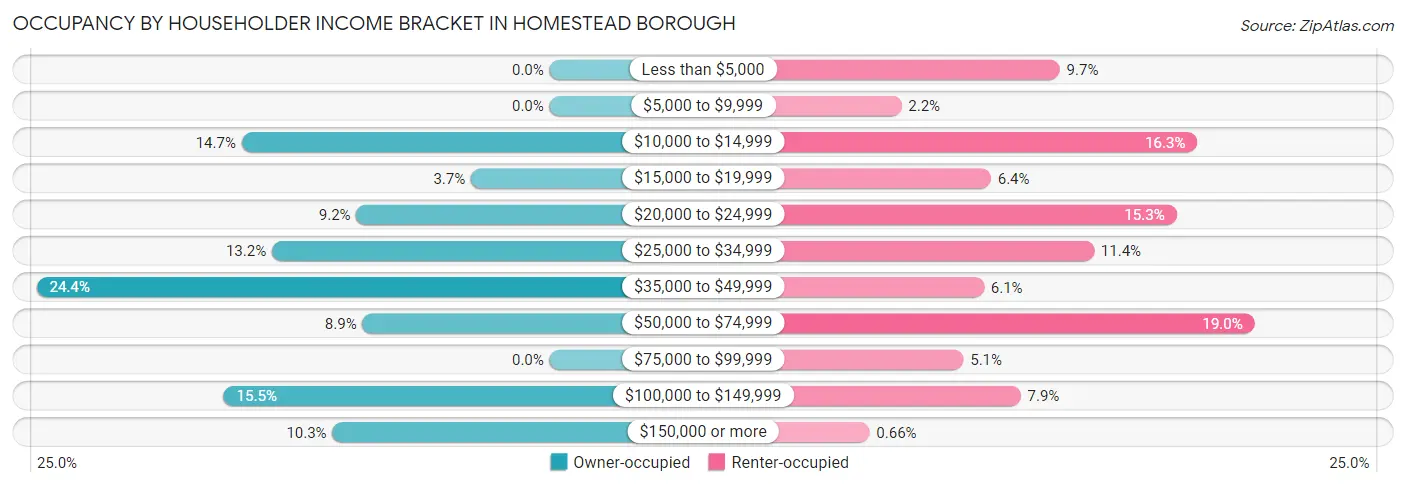
| Income Bracket | Owner-occupied | Renter-occupied |
| Less than $5,000 | 0 (0.0%) | 89 (9.7%) |
| $5,000 to $9,999 | 0 (0.0%) | 20 (2.2%) |
| $10,000 to $14,999 | 51 (14.7%) | 149 (16.3%) |
| $15,000 to $19,999 | 13 (3.7%) | 59 (6.4%) |
| $20,000 to $24,999 | 32 (9.2%) | 140 (15.3%) |
| $25,000 to $34,999 | 46 (13.2%) | 104 (11.4%) |
| $35,000 to $49,999 | 85 (24.4%) | 56 (6.1%) |
| $50,000 to $74,999 | 31 (8.9%) | 174 (19.0%) |
| $75,000 to $99,999 | 0 (0.0%) | 47 (5.1%) |
| $100,000 to $149,999 | 54 (15.5%) | 72 (7.9%) |
| $150,000 or more | 36 (10.3%) | 6 (0.7%) |
| Total | 348 (100.0%) | 916 (100.0%) |
Monthly Housing Cost Tiers in Homestead borough
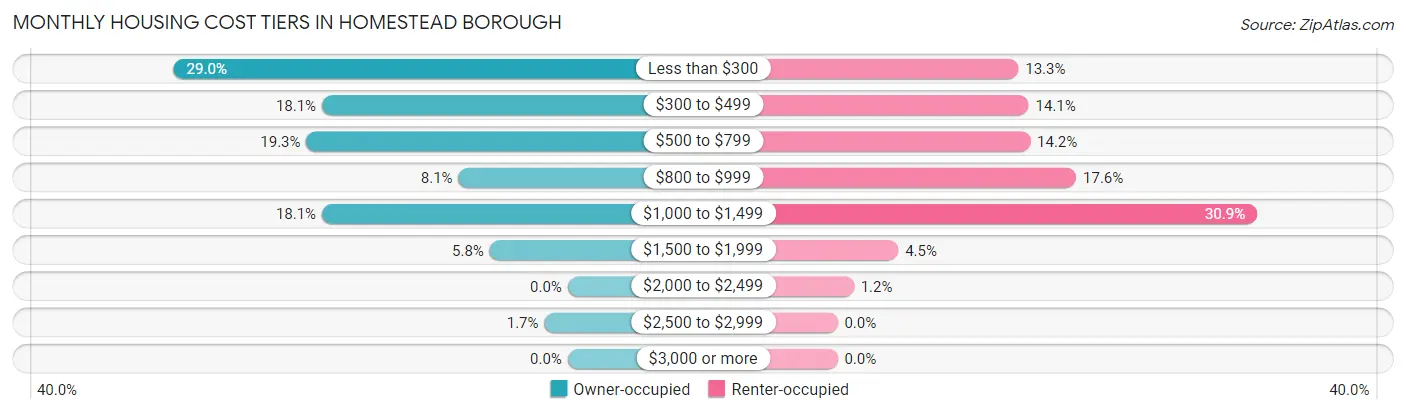
| Monthly Cost | Owner-occupied | Renter-occupied |
| Less than $300 | 101 (29.0%) | 122 (13.3%) |
| $300 to $499 | 63 (18.1%) | 129 (14.1%) |
| $500 to $799 | 67 (19.3%) | 130 (14.2%) |
| $800 to $999 | 28 (8.1%) | 161 (17.6%) |
| $1,000 to $1,499 | 63 (18.1%) | 283 (30.9%) |
| $1,500 to $1,999 | 20 (5.8%) | 41 (4.5%) |
| $2,000 to $2,499 | 0 (0.0%) | 11 (1.2%) |
| $2,500 to $2,999 | 6 (1.7%) | 0 (0.0%) |
| $3,000 or more | 0 (0.0%) | 0 (0.0%) |
| Total | 348 (100.0%) | 916 (100.0%) |
Physical Housing Characteristics in Homestead borough
Housing Structures in Homestead borough
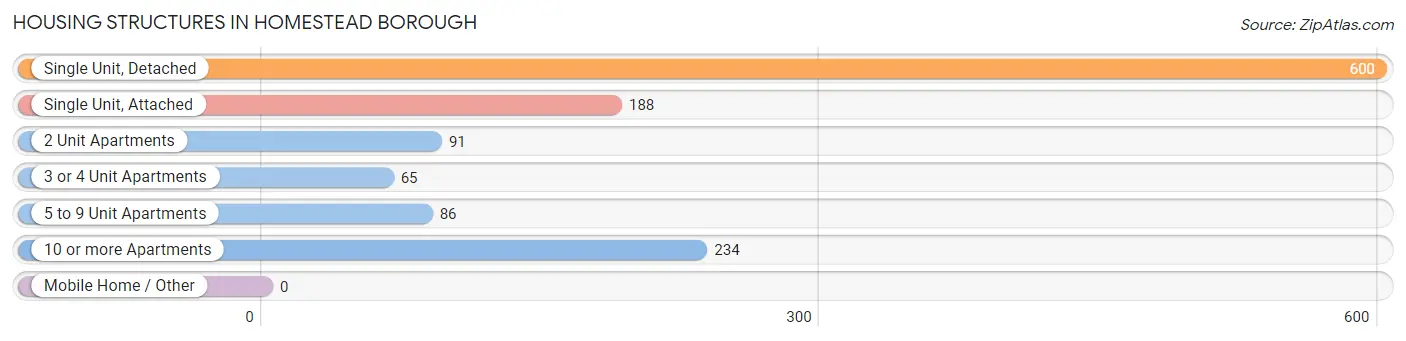
| Structure Type | # Housing Units | % Housing Units |
| Single Unit, Detached | 600 | 47.5% |
| Single Unit, Attached | 188 | 14.9% |
| 2 Unit Apartments | 91 | 7.2% |
| 3 or 4 Unit Apartments | 65 | 5.1% |
| 5 to 9 Unit Apartments | 86 | 6.8% |
| 10 or more Apartments | 234 | 18.5% |
| Mobile Home / Other | 0 | 0.0% |
| Total | 1,264 | 100.0% |
Housing Structures by Occupancy in Homestead borough
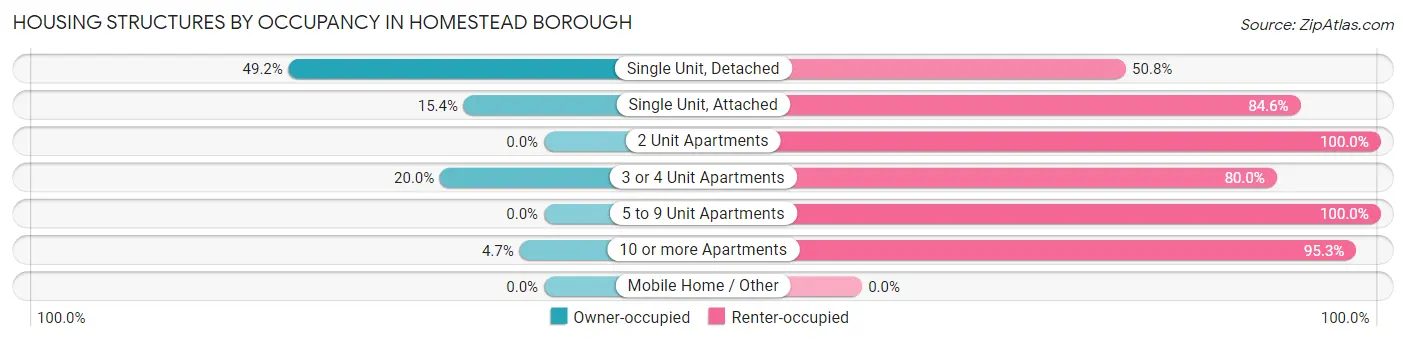
| Structure Type | Owner-occupied | Renter-occupied |
| Single Unit, Detached | 295 (49.2%) | 305 (50.8%) |
| Single Unit, Attached | 29 (15.4%) | 159 (84.6%) |
| 2 Unit Apartments | 0 (0.0%) | 91 (100.0%) |
| 3 or 4 Unit Apartments | 13 (20.0%) | 52 (80.0%) |
| 5 to 9 Unit Apartments | 0 (0.0%) | 86 (100.0%) |
| 10 or more Apartments | 11 (4.7%) | 223 (95.3%) |
| Mobile Home / Other | 0 (0.0%) | 0 (0.0%) |
| Total | 348 (27.5%) | 916 (72.5%) |
Housing Structures by Number of Rooms in Homestead borough
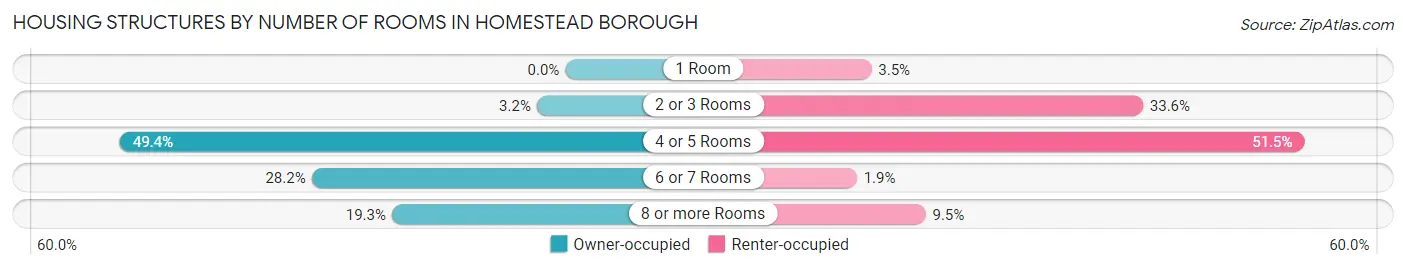
| Number of Rooms | Owner-occupied | Renter-occupied |
| 1 Room | 0 (0.0%) | 32 (3.5%) |
| 2 or 3 Rooms | 11 (3.2%) | 308 (33.6%) |
| 4 or 5 Rooms | 172 (49.4%) | 472 (51.5%) |
| 6 or 7 Rooms | 98 (28.2%) | 17 (1.9%) |
| 8 or more Rooms | 67 (19.3%) | 87 (9.5%) |
| Total | 348 (100.0%) | 916 (100.0%) |
Housing Structure by Heating Type in Homestead borough
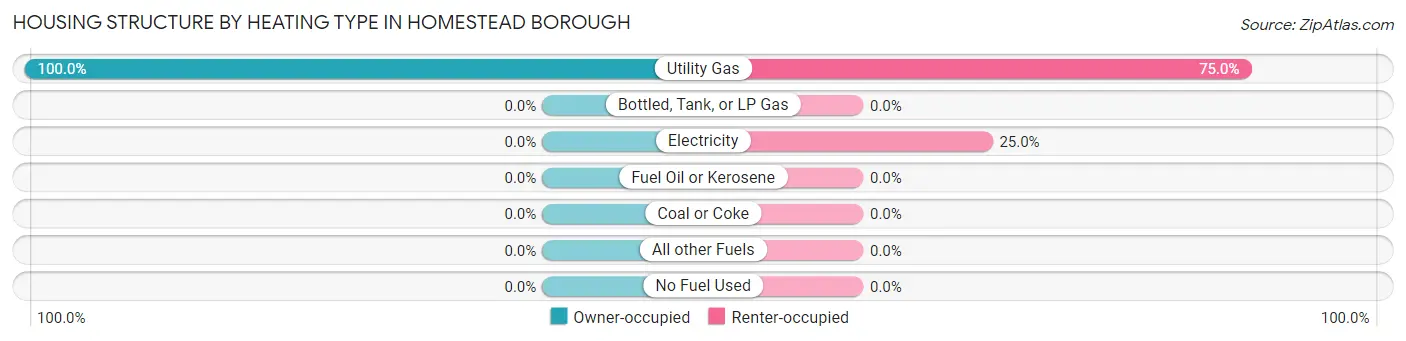
| Heating Type | Owner-occupied | Renter-occupied |
| Utility Gas | 348 (100.0%) | 687 (75.0%) |
| Bottled, Tank, or LP Gas | 0 (0.0%) | 0 (0.0%) |
| Electricity | 0 (0.0%) | 229 (25.0%) |
| Fuel Oil or Kerosene | 0 (0.0%) | 0 (0.0%) |
| Coal or Coke | 0 (0.0%) | 0 (0.0%) |
| All other Fuels | 0 (0.0%) | 0 (0.0%) |
| No Fuel Used | 0 (0.0%) | 0 (0.0%) |
| Total | 348 (100.0%) | 916 (100.0%) |
Household Vehicle Usage in Homestead borough
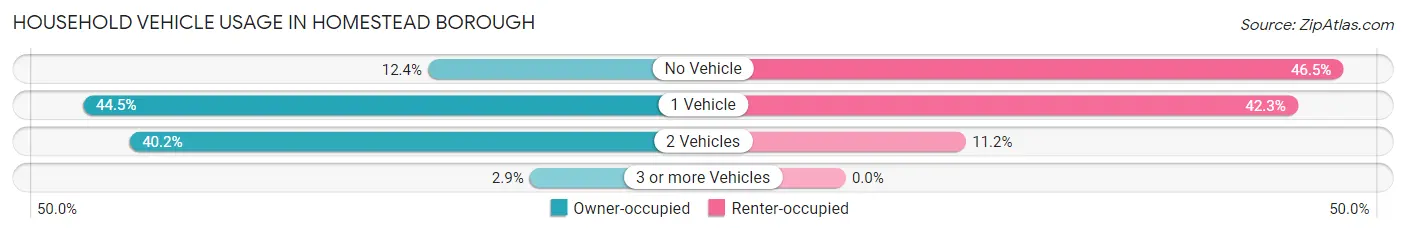
| Vehicles per Household | Owner-occupied | Renter-occupied |
| No Vehicle | 43 (12.4%) | 426 (46.5%) |
| 1 Vehicle | 155 (44.5%) | 387 (42.2%) |
| 2 Vehicles | 140 (40.2%) | 103 (11.2%) |
| 3 or more Vehicles | 10 (2.9%) | 0 (0.0%) |
| Total | 348 (100.0%) | 916 (100.0%) |
Real Estate & Mortgages in Homestead borough
Real Estate and Mortgage Overview in Homestead borough
| Characteristic | Without Mortgage | With Mortgage |
| Housing Units | 228 | 120 |
| Median Property Value | $64,400 | $117,500 |
| Median Household Income | $35,370 | $26 |
| Monthly Housing Costs | $350 | $0 |
| Real Estate Taxes | $199 | $10 |
Property Value by Mortgage Status in Homestead borough
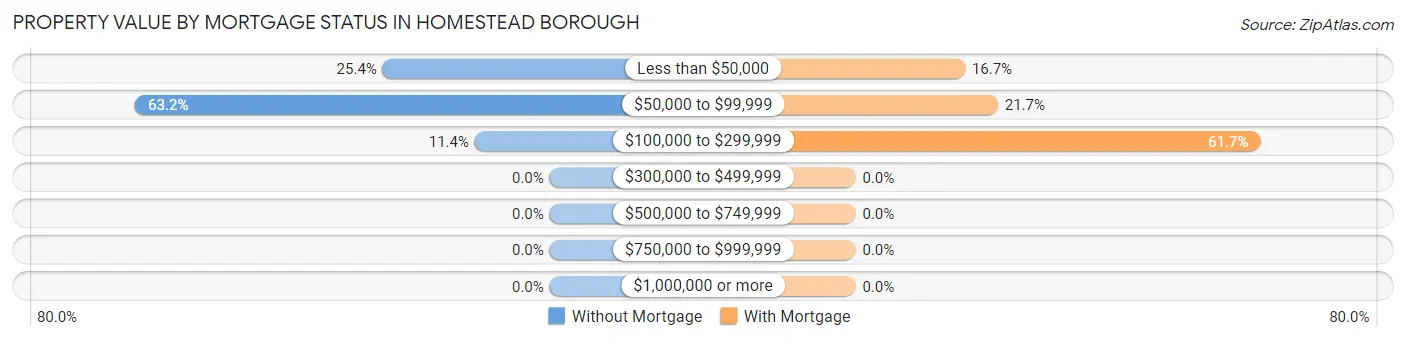
| Property Value | Without Mortgage | With Mortgage |
| Less than $50,000 | 58 (25.4%) | 20 (16.7%) |
| $50,000 to $99,999 | 144 (63.2%) | 26 (21.7%) |
| $100,000 to $299,999 | 26 (11.4%) | 74 (61.7%) |
| $300,000 to $499,999 | 0 (0.0%) | 0 (0.0%) |
| $500,000 to $749,999 | 0 (0.0%) | 0 (0.0%) |
| $750,000 to $999,999 | 0 (0.0%) | 0 (0.0%) |
| $1,000,000 or more | 0 (0.0%) | 0 (0.0%) |
| Total | 228 (100.0%) | 120 (100.0%) |
Household Income by Mortgage Status in Homestead borough
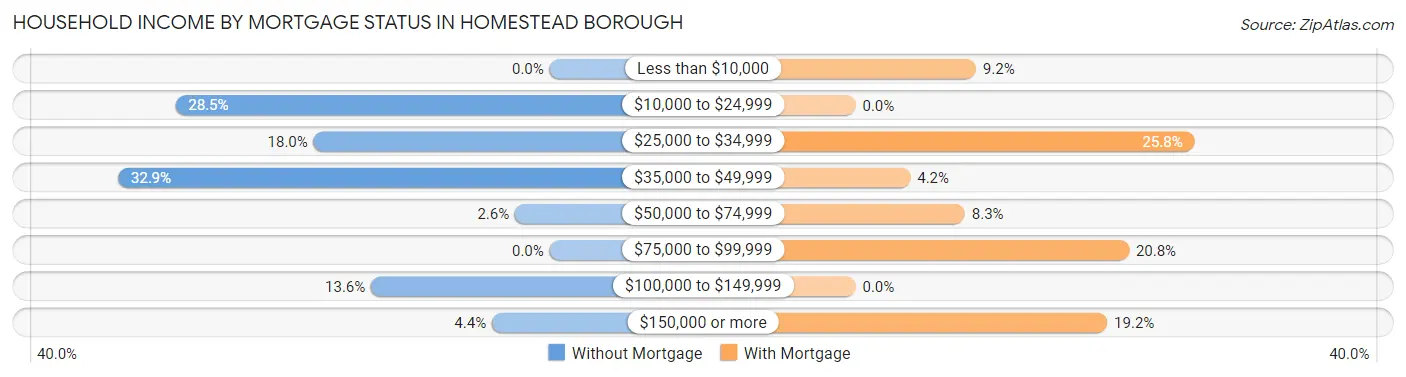
| Household Income | Without Mortgage | With Mortgage |
| Less than $10,000 | 0 (0.0%) | 11 (9.2%) |
| $10,000 to $24,999 | 65 (28.5%) | 0 (0.0%) |
| $25,000 to $34,999 | 41 (18.0%) | 31 (25.8%) |
| $35,000 to $49,999 | 75 (32.9%) | 5 (4.2%) |
| $50,000 to $74,999 | 6 (2.6%) | 10 (8.3%) |
| $75,000 to $99,999 | 0 (0.0%) | 25 (20.8%) |
| $100,000 to $149,999 | 31 (13.6%) | 0 (0.0%) |
| $150,000 or more | 10 (4.4%) | 23 (19.2%) |
| Total | 228 (100.0%) | 120 (100.0%) |
Property Value to Household Income Ratio in Homestead borough
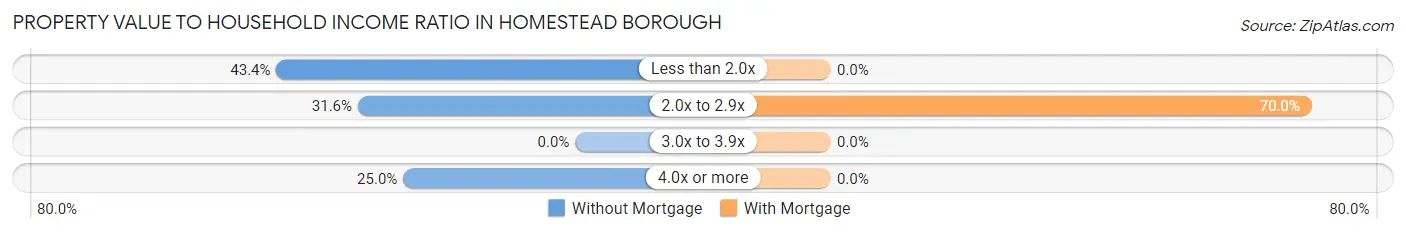
| Value-to-Income Ratio | Without Mortgage | With Mortgage |
| Less than 2.0x | 99 (43.4%) | 0 (0.0%) |
| 2.0x to 2.9x | 72 (31.6%) | 84 (70.0%) |
| 3.0x to 3.9x | 0 (0.0%) | 0 (0.0%) |
| 4.0x or more | 57 (25.0%) | 0 (0.0%) |
| Total | 228 (100.0%) | 120 (100.0%) |
Real Estate Taxes by Mortgage Status in Homestead borough
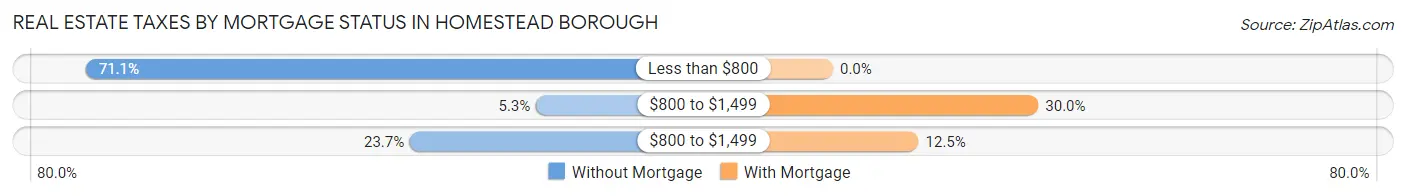
| Property Taxes | Without Mortgage | With Mortgage |
| Less than $800 | 162 (71.1%) | 0 (0.0%) |
| $800 to $1,499 | 12 (5.3%) | 36 (30.0%) |
| $800 to $1,499 | 54 (23.7%) | 15 (12.5%) |
| Total | 228 (100.0%) | 120 (100.0%) |
Health & Disability in Homestead borough
Health Insurance Coverage by Age in Homestead borough
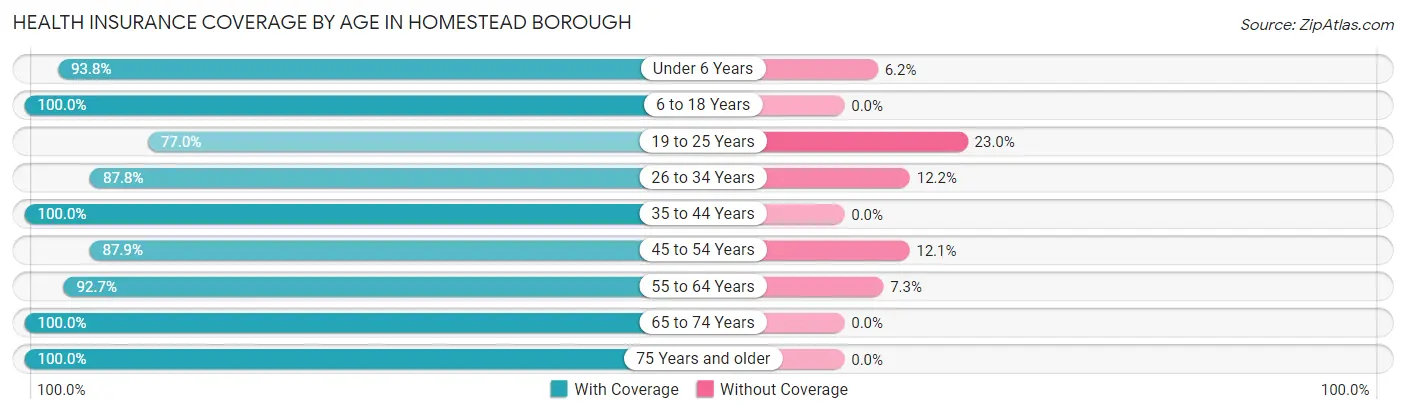
| Age Bracket | With Coverage | Without Coverage |
| Under 6 Years | 331 (93.8%) | 22 (6.2%) |
| 6 to 18 Years | 405 (100.0%) | 0 (0.0%) |
| 19 to 25 Years | 221 (77.0%) | 66 (23.0%) |
| 26 to 34 Years | 410 (87.8%) | 57 (12.2%) |
| 35 to 44 Years | 158 (100.0%) | 0 (0.0%) |
| 45 to 54 Years | 145 (87.9%) | 20 (12.1%) |
| 55 to 64 Years | 281 (92.7%) | 22 (7.3%) |
| 65 to 74 Years | 260 (100.0%) | 0 (0.0%) |
| 75 Years and older | 507 (100.0%) | 0 (0.0%) |
| Total | 2,718 (93.6%) | 187 (6.4%) |
Health Insurance Coverage by Citizenship Status in Homestead borough
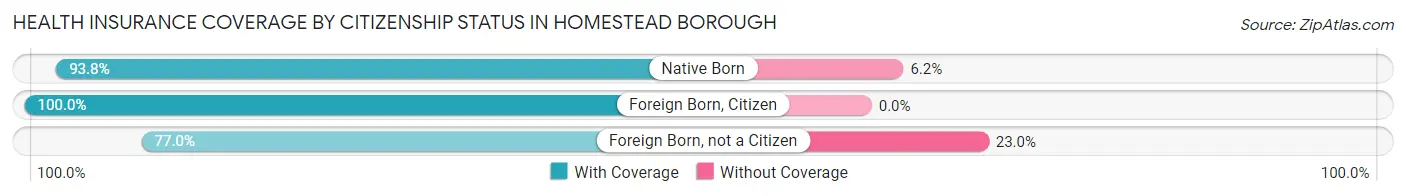
| Citizenship Status | With Coverage | Without Coverage |
| Native Born | 331 (93.8%) | 22 (6.2%) |
| Foreign Born, Citizen | 405 (100.0%) | 0 (0.0%) |
| Foreign Born, not a Citizen | 221 (77.0%) | 66 (23.0%) |
Health Insurance Coverage by Household Income in Homestead borough
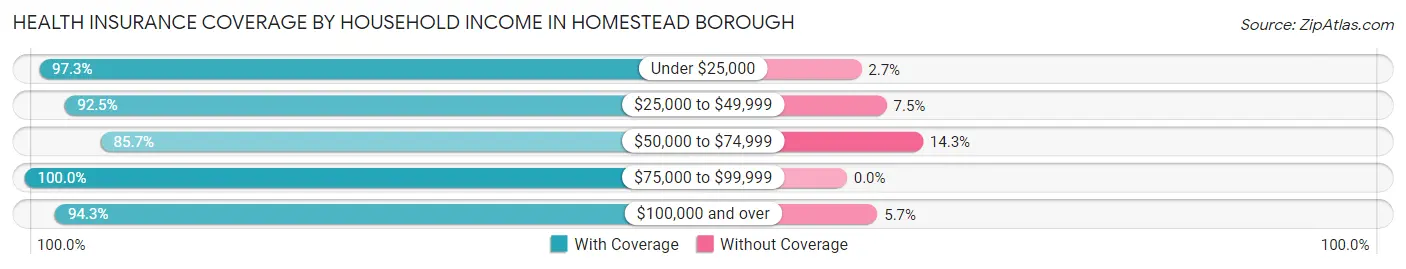
| Household Income | With Coverage | Without Coverage |
| Under $25,000 | 787 (97.3%) | 22 (2.7%) |
| $25,000 to $49,999 | 620 (92.5%) | 50 (7.5%) |
| $50,000 to $74,999 | 427 (85.7%) | 71 (14.3%) |
| $75,000 to $99,999 | 124 (100.0%) | 0 (0.0%) |
| $100,000 and over | 727 (94.3%) | 44 (5.7%) |
Public vs Private Health Insurance Coverage by Age in Homestead borough
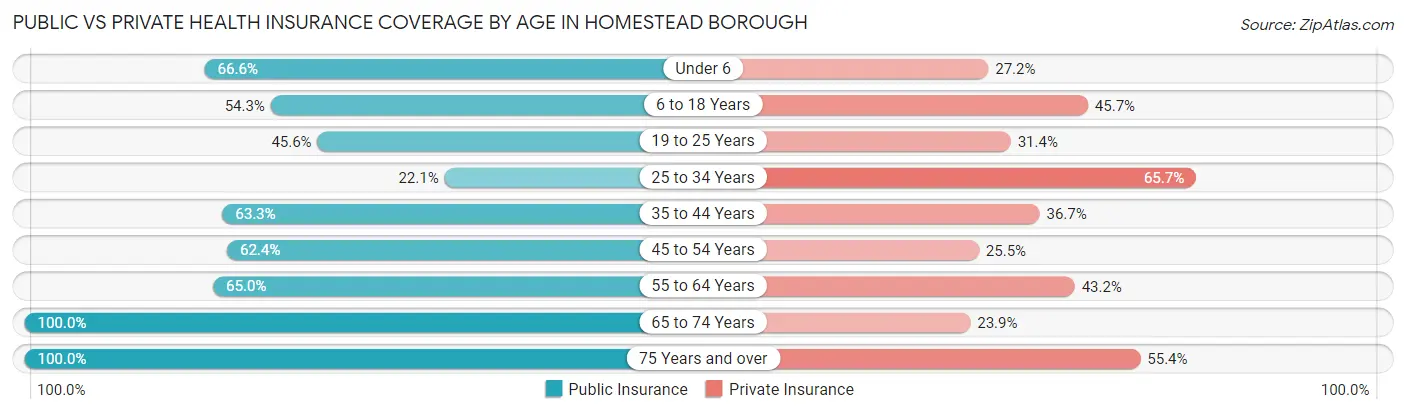
| Age Bracket | Public Insurance | Private Insurance |
| Under 6 | 235 (66.6%) | 96 (27.2%) |
| 6 to 18 Years | 220 (54.3%) | 185 (45.7%) |
| 19 to 25 Years | 131 (45.6%) | 90 (31.4%) |
| 25 to 34 Years | 103 (22.1%) | 307 (65.7%) |
| 35 to 44 Years | 100 (63.3%) | 58 (36.7%) |
| 45 to 54 Years | 103 (62.4%) | 42 (25.5%) |
| 55 to 64 Years | 197 (65.0%) | 131 (43.2%) |
| 65 to 74 Years | 260 (100.0%) | 62 (23.8%) |
| 75 Years and over | 507 (100.0%) | 281 (55.4%) |
| Total | 1,856 (63.9%) | 1,252 (43.1%) |
Disability Status by Sex by Age in Homestead borough
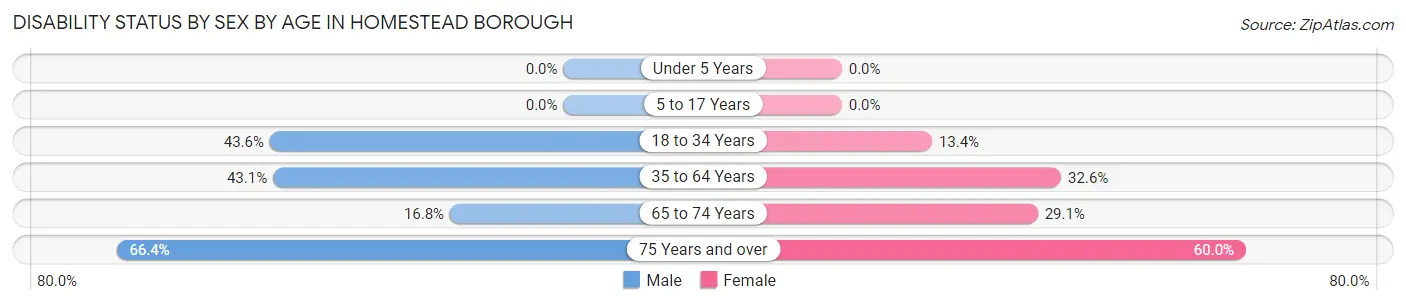
| Age Bracket | Male | Female |
| Under 5 Years | 0 (0.0%) | 0 (0.0%) |
| 5 to 17 Years | 0 (0.0%) | 0 (0.0%) |
| 18 to 34 Years | 153 (43.6%) | 62 (13.4%) |
| 35 to 64 Years | 119 (43.1%) | 114 (32.6%) |
| 65 to 74 Years | 16 (16.8%) | 48 (29.1%) |
| 75 Years and over | 144 (66.4%) | 174 (60.0%) |
Disability Class by Sex by Age in Homestead borough
Disability Class: Hearing Difficulty
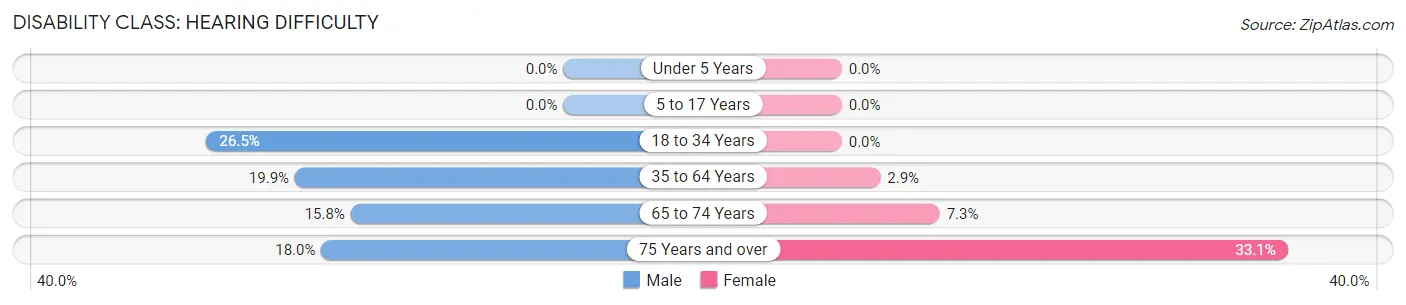
| Age Bracket | Male | Female |
| Under 5 Years | 0 (0.0%) | 0 (0.0%) |
| 5 to 17 Years | 0 (0.0%) | 0 (0.0%) |
| 18 to 34 Years | 93 (26.5%) | 0 (0.0%) |
| 35 to 64 Years | 55 (19.9%) | 10 (2.9%) |
| 65 to 74 Years | 15 (15.8%) | 12 (7.3%) |
| 75 Years and over | 39 (18.0%) | 96 (33.1%) |
Disability Class: Vision Difficulty
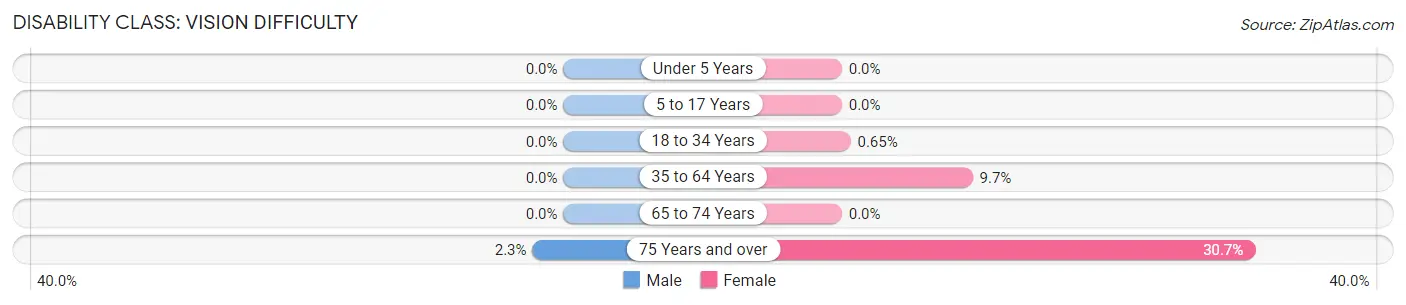
| Age Bracket | Male | Female |
| Under 5 Years | 0 (0.0%) | 0 (0.0%) |
| 5 to 17 Years | 0 (0.0%) | 0 (0.0%) |
| 18 to 34 Years | 0 (0.0%) | 3 (0.6%) |
| 35 to 64 Years | 0 (0.0%) | 34 (9.7%) |
| 65 to 74 Years | 0 (0.0%) | 0 (0.0%) |
| 75 Years and over | 5 (2.3%) | 89 (30.7%) |
Disability Class: Cognitive Difficulty
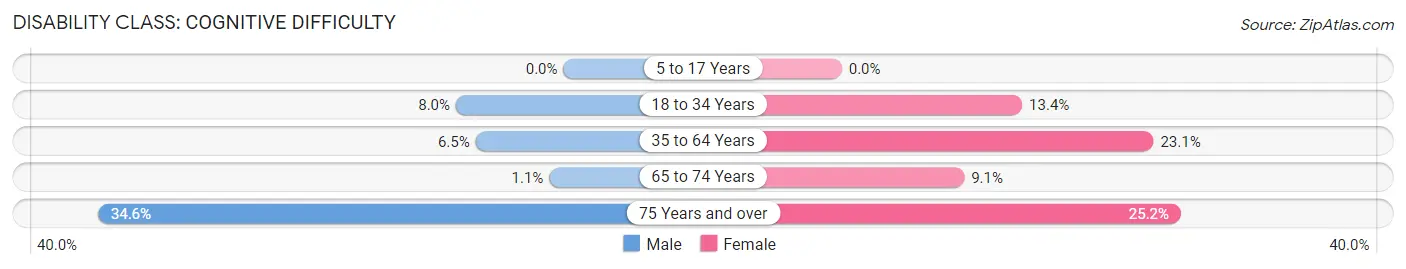
| Age Bracket | Male | Female |
| 5 to 17 Years | 0 (0.0%) | 0 (0.0%) |
| 18 to 34 Years | 28 (8.0%) | 62 (13.4%) |
| 35 to 64 Years | 18 (6.5%) | 81 (23.1%) |
| 65 to 74 Years | 1 (1.1%) | 15 (9.1%) |
| 75 Years and over | 75 (34.6%) | 73 (25.2%) |
Disability Class: Ambulatory Difficulty
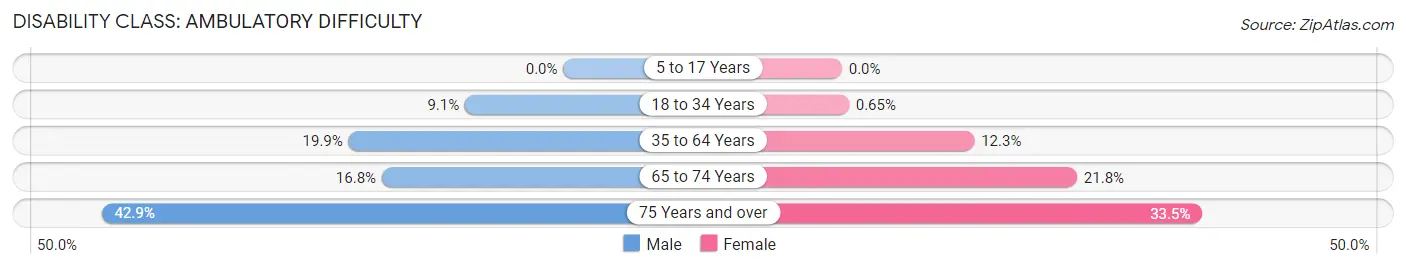
| Age Bracket | Male | Female |
| 5 to 17 Years | 0 (0.0%) | 0 (0.0%) |
| 18 to 34 Years | 32 (9.1%) | 3 (0.6%) |
| 35 to 64 Years | 55 (19.9%) | 43 (12.3%) |
| 65 to 74 Years | 16 (16.8%) | 36 (21.8%) |
| 75 Years and over | 93 (42.9%) | 97 (33.5%) |
Disability Class: Self-Care Difficulty
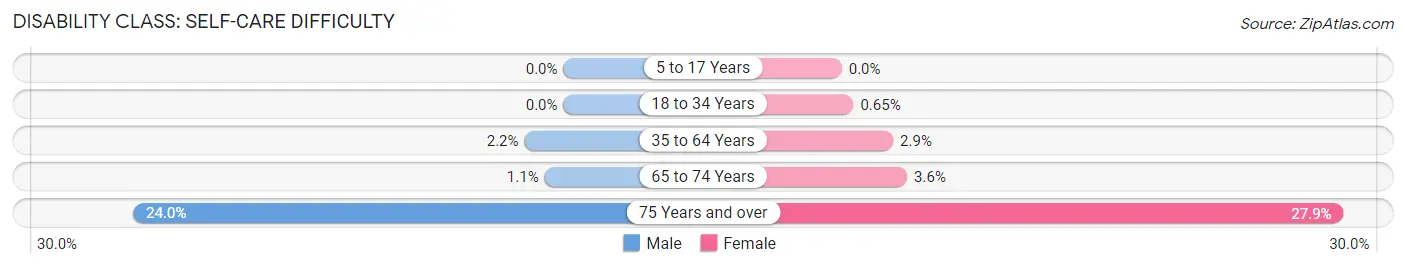
| Age Bracket | Male | Female |
| 5 to 17 Years | 0 (0.0%) | 0 (0.0%) |
| 18 to 34 Years | 0 (0.0%) | 3 (0.6%) |
| 35 to 64 Years | 6 (2.2%) | 10 (2.9%) |
| 65 to 74 Years | 1 (1.1%) | 6 (3.6%) |
| 75 Years and over | 52 (24.0%) | 81 (27.9%) |
Technology Access in Homestead borough
Computing Device Access in Homestead borough
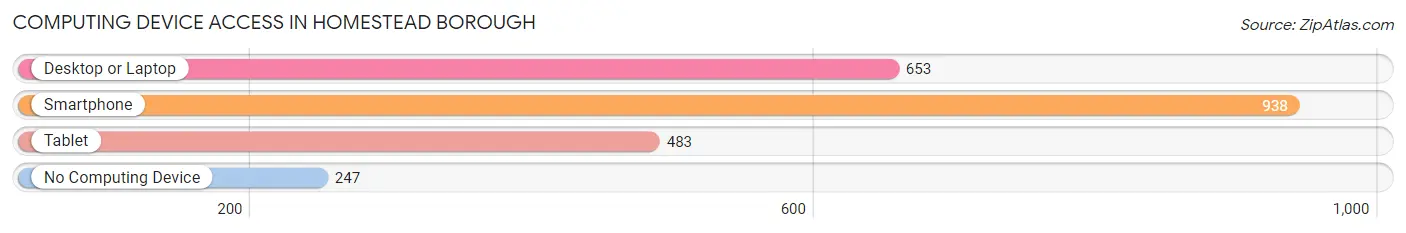
| Device Type | # Households | % Households |
| Desktop or Laptop | 653 | 51.7% |
| Smartphone | 938 | 74.2% |
| Tablet | 483 | 38.2% |
| No Computing Device | 247 | 19.5% |
| Total | 1,264 | 100.0% |
Internet Access in Homestead borough
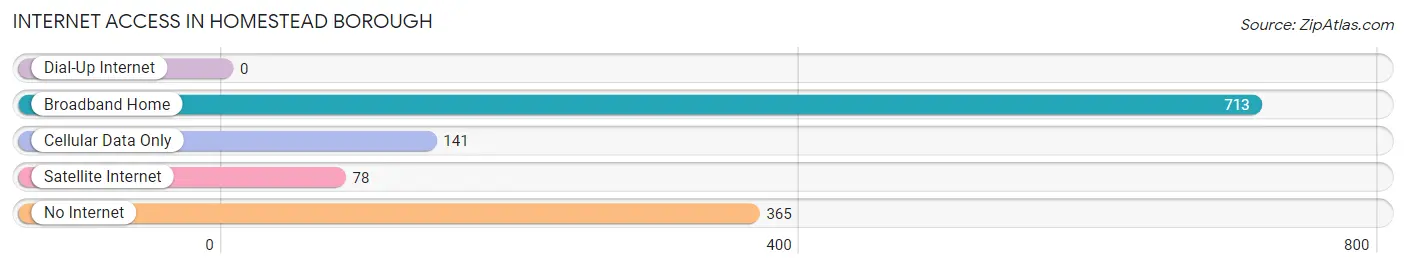
| Internet Type | # Households | % Households |
| Dial-Up Internet | 0 | 0.0% |
| Broadband Home | 713 | 56.4% |
| Cellular Data Only | 141 | 11.2% |
| Satellite Internet | 78 | 6.2% |
| No Internet | 365 | 28.9% |
| Total | 1,264 | 100.0% |
Homestead borough Summary
Homestead Borough is a borough located in Allegheny County, Pennsylvania. It is part of the Pittsburgh metropolitan area and is located just south of the city of Pittsburgh. The borough was incorporated in 1876 and is home to approximately 5,000 people.
Geography
Homestead Borough is located in the southwestern corner of Allegheny County, Pennsylvania. It is bordered by the Monongahela River to the north, the city of Pittsburgh to the east, and the boroughs of Munhall and West Homestead to the south and west, respectively. The borough covers an area of 1.3 square miles and is situated at an elevation of 830 feet above sea level.
The borough is located in the Allegheny Plateau region of Pennsylvania and is characterized by rolling hills and valleys. The borough is home to several parks, including the Homestead Park, which is located along the Monongahela River and features a playground, picnic area, and walking trails.
Economy
Homestead Borough has a diverse economy that is largely driven by the steel industry. The borough is home to the U.S. Steel Homestead Works, which is the largest steel mill in the United States. The mill employs over 2,000 people and produces a variety of steel products, including sheet steel, tin plate, and galvanized steel.
The borough is also home to several other businesses, including a variety of retail stores, restaurants, and professional services. The Homestead Waterfront, which is located along the Monongahela River, is a popular destination for shopping, dining, and entertainment.
Demographics
As of the 2010 census, the population of Homestead Borough was 5,076. The racial makeup of the borough was 79.2% White, 15.2% African American, 0.3% Native American, 0.7% Asian, 0.1% Pacific Islander, and 4.5% from other races. Hispanic or Latino of any race were 2.2% of the population.
The median household income in the borough was $31,944, and the median family income was $37,917. The per capita income was $17,845. About 17.2% of families and 20.2% of the population were below the poverty line, including 28.3% of those under age 18 and 11.2% of those age 65 or over.
Conclusion
Homestead Borough is a borough located in Allegheny County, Pennsylvania. It is part of the Pittsburgh metropolitan area and is home to approximately 5,000 people. The borough is characterized by rolling hills and valleys and is home to several parks, including the Homestead Park. The borough has a diverse economy that is largely driven by the steel industry, and the population is largely White with a significant African American population. The median household income in the borough is lower than the national average, and a significant portion of the population is below the poverty line.
Common Questions
What is Per Capita Income in Homestead borough?
Per Capita income in Homestead borough is $28,380.
What is the Median Family Income in Homestead borough?
Median Family Income in Homestead borough is $37,071.
What is the Median Household income in Homestead borough?
Median Household Income in Homestead borough is $29,306.
What is Income or Wage Gap in Homestead borough?
Income or Wage Gap in Homestead borough is 29.4%.
Women in Homestead borough earn 70.6 cents for every dollar earned by a man.
What is Inequality or Gini Index in Homestead borough?
Inequality or Gini Index in Homestead borough is 0.55.
What is the Total Population of Homestead borough?
Total Population of Homestead borough is 2,905.
What is the Total Male Population of Homestead borough?
Total Male Population of Homestead borough is 1,403.
What is the Total Female Population of Homestead borough?
Total Female Population of Homestead borough is 1,502.
What is the Ratio of Males per 100 Females in Homestead borough?
There are 93.41 Males per 100 Females in Homestead borough.
What is the Ratio of Females per 100 Males in Homestead borough?
There are 107.06 Females per 100 Males in Homestead borough.
What is the Median Population Age in Homestead borough?
Median Population Age in Homestead borough is 32.2 Years.
What is the Average Family Size in Homestead borough
Average Family Size in Homestead borough is 3.4 People.
What is the Average Household Size in Homestead borough
Average Household Size in Homestead borough is 2.3 People.
How Large is the Labor Force in Homestead borough?
There are 1,139 People in the Labor Forcein in Homestead borough.
What is the Percentage of People in the Labor Force in Homestead borough?
50.1% of People are in the Labor Force in Homestead borough.
What is the Unemployment Rate in Homestead borough?
Unemployment Rate in Homestead borough is 9.9%.