Shanksville borough, PA Map & Demographics
Shanksville borough Overview
$27,098
PER CAPITA INCOME
$76,250
AVG FAMILY INCOME
$39,375
AVG HOUSEHOLD INCOME
7.2%
WAGE / INCOME GAP [ % ]
92.8¢/ $1
WAGE / INCOME GAP [ $ ]
0.36
INEQUALITY / GINI INDEX
166
TOTAL POPULATION
88
MALE POPULATION
78
FEMALE POPULATION
112.82
MALES / 100 FEMALES
88.64
FEMALES / 100 MALES
40.8
MEDIAN AGE
3.0
AVG FAMILY SIZE
2.5
AVG HOUSEHOLD SIZE
88
LABOR FORCE [ PEOPLE ]
67.7%
PERCENT IN LABOR FORCE
2.3%
UNEMPLOYMENT RATE
Income in Shanksville borough
Income Overview in Shanksville borough
Per Capita Income in Shanksville borough is $27,098, while median incomes of families and households are $76,250 and $39,375 respectively.
| Characteristic | Number | Measure |
| Per Capita Income | 166 | $27,098 |
| Median Family Income | 49 | $76,250 |
| Mean Family Income | 49 | $75,476 |
| Median Household Income | 67 | $39,375 |
| Mean Household Income | 67 | $63,501 |
| Income Deficit | 49 | $0 |
| Wage / Income Gap (%) | 166 | 7.24% |
| Wage / Income Gap ($) | 166 | 92.76¢ per $1 |
| Gini / Inequality Index | 166 | 0.36 |
Earnings by Sex in Shanksville borough
Average Earnings in Shanksville borough are $33,281, $33,958 for men and $31,500 for women, a difference of 7.2%.
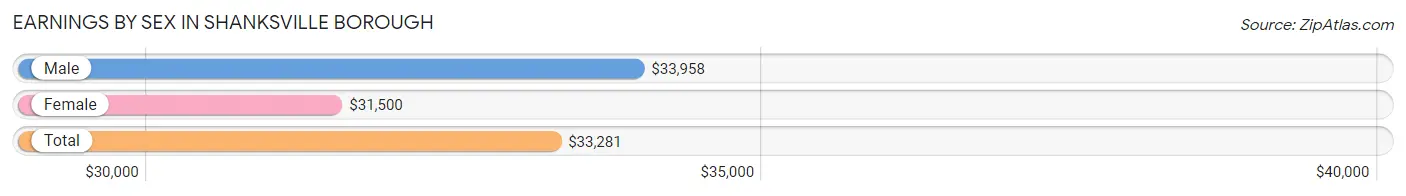
| Sex | Number | Average Earnings |
| Male | 46 (53.5%) | $33,958 |
| Female | 40 (46.5%) | $31,500 |
| Total | 86 (100.0%) | $33,281 |
Earnings by Sex by Income Bracket in Shanksville borough
The most common earnings brackets in Shanksville borough are $30,000 to $34,999 for men (12 | 26.1%) and $30,000 to $34,999 for women (9 | 22.5%).
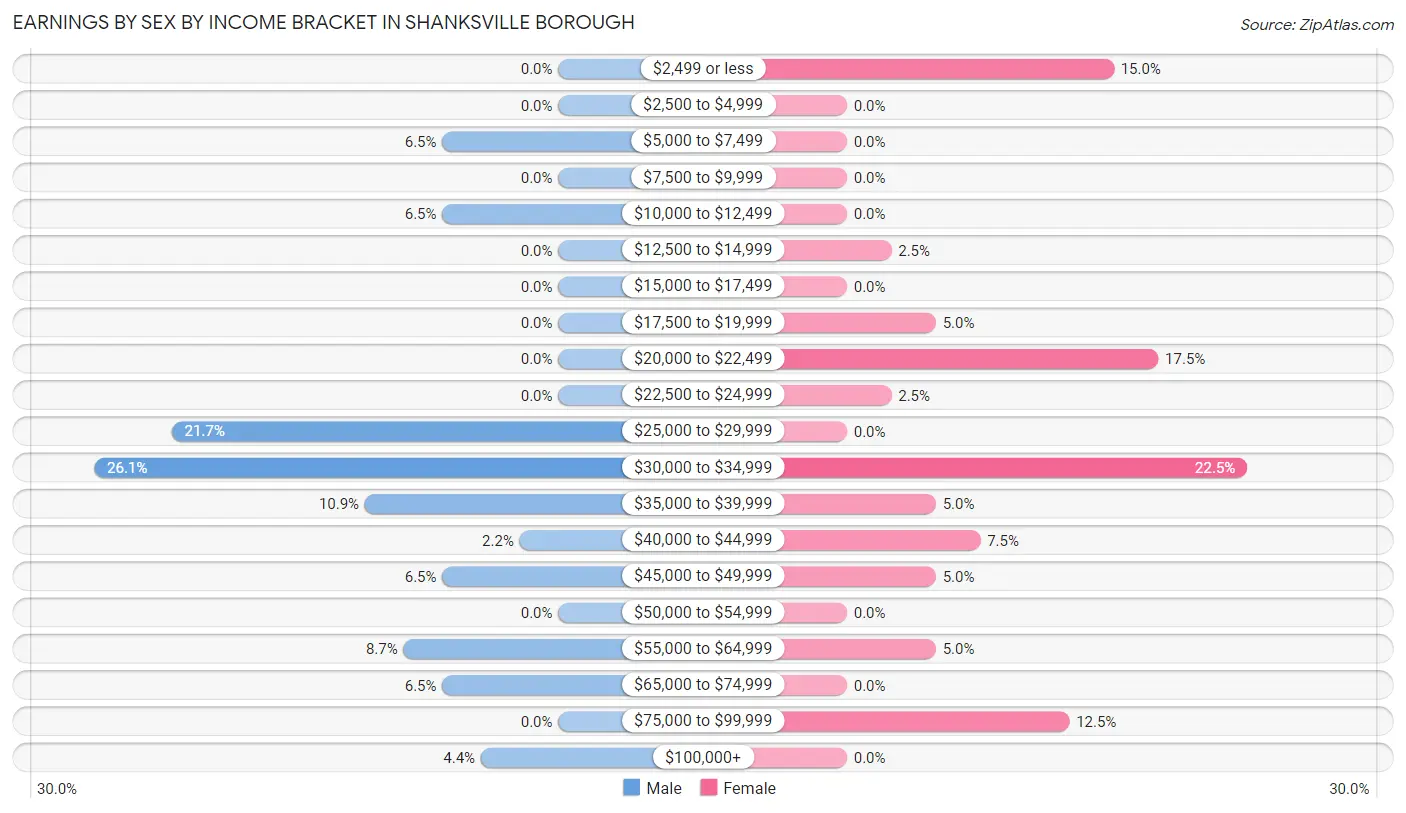
| Income | Male | Female |
| $2,499 or less | 0 (0.0%) | 6 (15.0%) |
| $2,500 to $4,999 | 0 (0.0%) | 0 (0.0%) |
| $5,000 to $7,499 | 3 (6.5%) | 0 (0.0%) |
| $7,500 to $9,999 | 0 (0.0%) | 0 (0.0%) |
| $10,000 to $12,499 | 3 (6.5%) | 0 (0.0%) |
| $12,500 to $14,999 | 0 (0.0%) | 1 (2.5%) |
| $15,000 to $17,499 | 0 (0.0%) | 0 (0.0%) |
| $17,500 to $19,999 | 0 (0.0%) | 2 (5.0%) |
| $20,000 to $22,499 | 0 (0.0%) | 7 (17.5%) |
| $22,500 to $24,999 | 0 (0.0%) | 1 (2.5%) |
| $25,000 to $29,999 | 10 (21.7%) | 0 (0.0%) |
| $30,000 to $34,999 | 12 (26.1%) | 9 (22.5%) |
| $35,000 to $39,999 | 5 (10.9%) | 2 (5.0%) |
| $40,000 to $44,999 | 1 (2.2%) | 3 (7.5%) |
| $45,000 to $49,999 | 3 (6.5%) | 2 (5.0%) |
| $50,000 to $54,999 | 0 (0.0%) | 0 (0.0%) |
| $55,000 to $64,999 | 4 (8.7%) | 2 (5.0%) |
| $65,000 to $74,999 | 3 (6.5%) | 0 (0.0%) |
| $75,000 to $99,999 | 0 (0.0%) | 5 (12.5%) |
| $100,000+ | 2 (4.3%) | 0 (0.0%) |
| Total | 46 (100.0%) | 40 (100.0%) |
Earnings by Sex by Educational Attainment in Shanksville borough
Average earnings in Shanksville borough are $34,375 for men and $31,500 for women, a difference of 8.4%. Men with an educational attainment of high school diploma enjoy the highest average annual earnings of $37,917, while those with high school diploma education earn the least with $37,917. Women with an educational attainment of college or associate's degree earn the most with the average annual earnings of $34,063, while those with high school diploma education have the smallest earnings of $20,417.
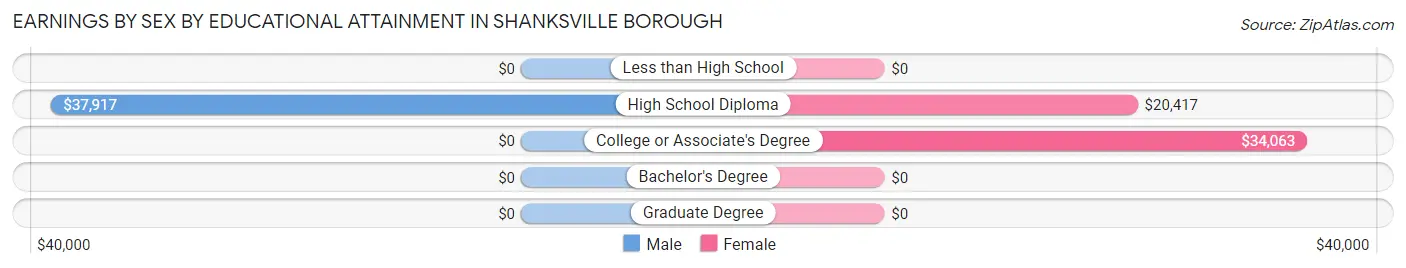
| Educational Attainment | Male Income | Female Income |
| Less than High School | - | - |
| High School Diploma | $37,917 | $20,417 |
| College or Associate's Degree | - | - |
| Bachelor's Degree | - | - |
| Graduate Degree | - | - |
| Total | $34,375 | $31,500 |
Family Income in Shanksville borough
Family Income Brackets in Shanksville borough
According to the Shanksville borough family income data, there are 14 families falling into the $100,000 to $149,999 income range, which is the most common income bracket and makes up 28.6% of all families.
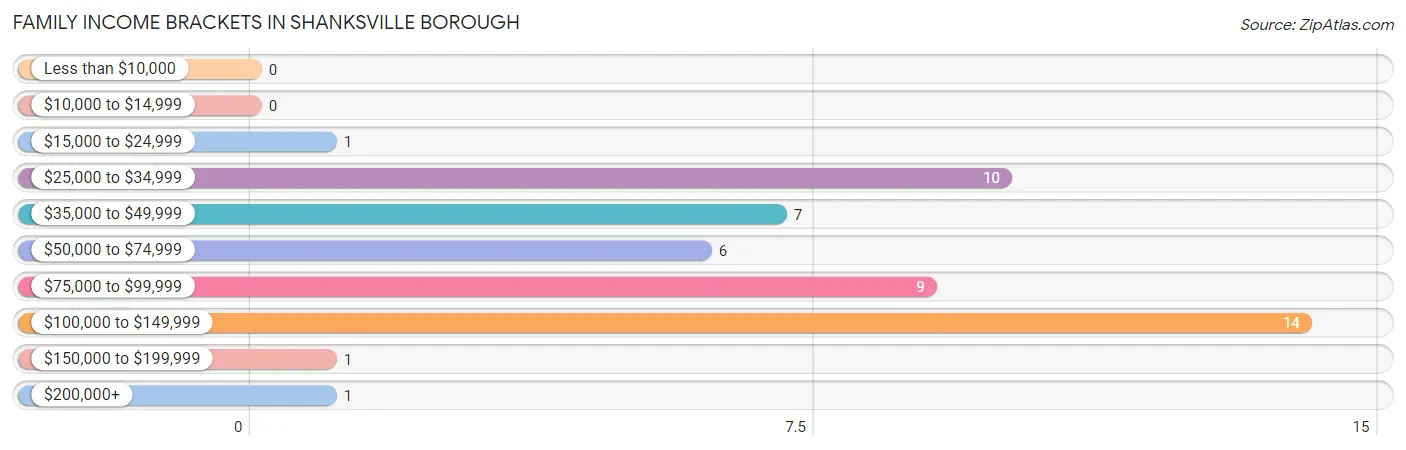
| Income Bracket | # Families | % Families |
| Less than $10,000 | 0 | 0.0% |
| $10,000 to $14,999 | 0 | 0.0% |
| $15,000 to $24,999 | 1 | 2.0% |
| $25,000 to $34,999 | 10 | 20.4% |
| $35,000 to $49,999 | 7 | 14.3% |
| $50,000 to $74,999 | 6 | 12.2% |
| $75,000 to $99,999 | 9 | 18.4% |
| $100,000 to $149,999 | 14 | 28.6% |
| $150,000 to $199,999 | 1 | 2.0% |
| $200,000+ | 1 | 2.0% |
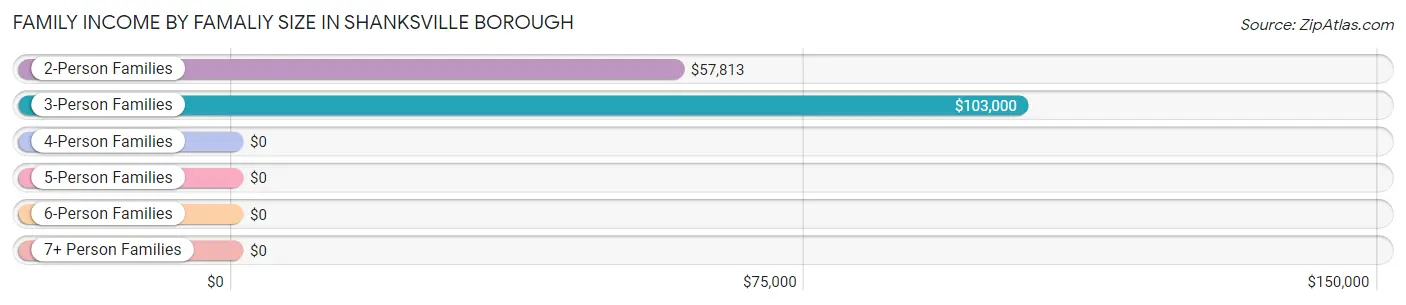
Family Income by Famaliy Size in Shanksville borough
3-person families (12 | 24.5%) account for the highest median family income in Shanksville borough with $103,000 per family, while 3-person families (12 | 24.5%) have the highest median income of $34,333 per family member.
| Income Bracket | # Families | Median Income |
| 2-Person Families | 23 (46.9%) | $57,813 |
| 3-Person Families | 12 (24.5%) | $103,000 |
| 4-Person Families | 10 (20.4%) | $0 |
| 5-Person Families | 4 (8.2%) | $0 |
| 6-Person Families | 0 (0.0%) | $0 |
| 7+ Person Families | 0 (0.0%) | $0 |
| Total | 49 (100.0%) | $76,250 |
Family Income by Number of Earners in Shanksville borough
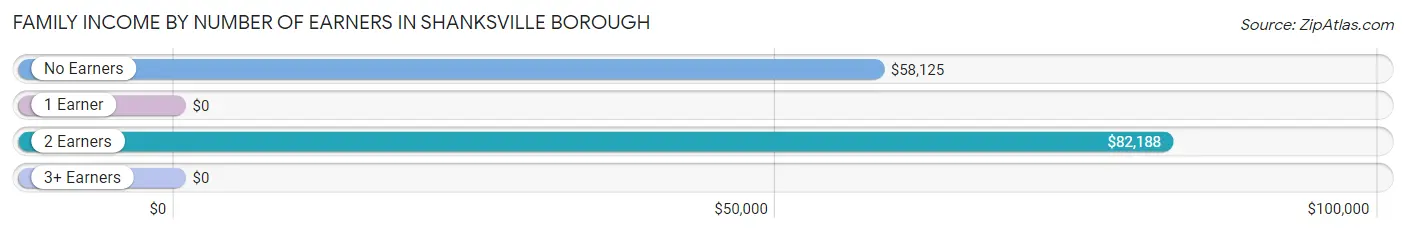
| Number of Earners | # Families | Median Income |
| No Earners | 10 (20.4%) | $58,125 |
| 1 Earner | 11 (22.5%) | $0 |
| 2 Earners | 23 (46.9%) | $82,188 |
| 3+ Earners | 5 (10.2%) | $0 |
| Total | 49 (100.0%) | $76,250 |
Household Income in Shanksville borough
Household Income Brackets in Shanksville borough
With 20 households falling in the category, the $25,000 to $34,999 income range is the most frequent in Shanksville borough, accounting for 29.8% of all households.
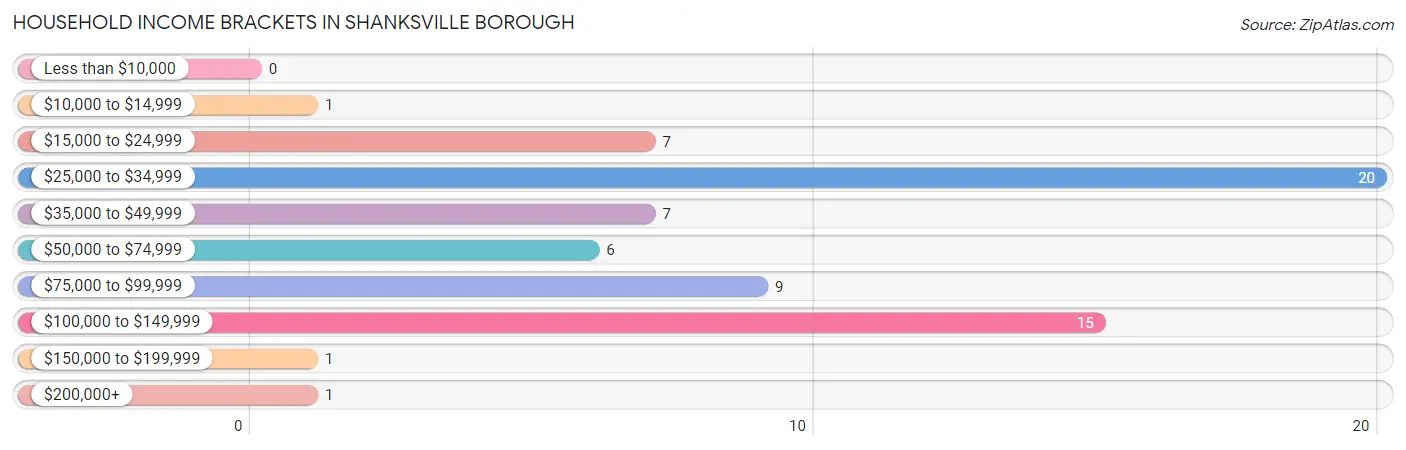
| Income Bracket | # Households | % Households |
| Less than $10,000 | 0 | 0.0% |
| $10,000 to $14,999 | 1 | 1.5% |
| $15,000 to $24,999 | 7 | 10.4% |
| $25,000 to $34,999 | 20 | 29.9% |
| $35,000 to $49,999 | 7 | 10.4% |
| $50,000 to $74,999 | 6 | 9.0% |
| $75,000 to $99,999 | 9 | 13.4% |
| $100,000 to $149,999 | 15 | 22.4% |
| $150,000 to $199,999 | 1 | 1.5% |
| $200,000+ | 1 | 1.5% |
Household Income by Householder Age in Shanksville borough
The median household income in Shanksville borough is $39,375, with the highest median household income of $80,625 found in the 25 to 44 years age bracket for the primary householder. A total of 27 households (40.3%) fall into this category.
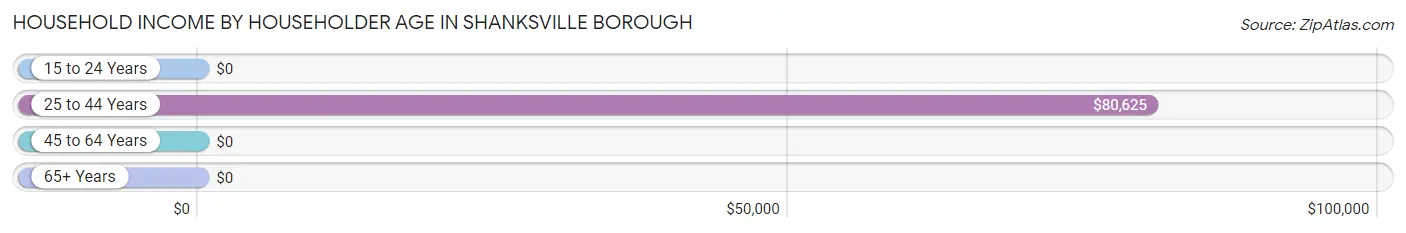
| Income Bracket | # Households | Median Income |
| 15 to 24 Years | 0 (0.0%) | $0 |
| 25 to 44 Years | 27 (40.3%) | $80,625 |
| 45 to 64 Years | 14 (20.9%) | $0 |
| 65+ Years | 26 (38.8%) | $0 |
| Total | 67 (100.0%) | $39,375 |
Poverty in Shanksville borough
Income Below Poverty by Sex and Age in Shanksville borough
With 19.3% poverty level for males and 6.4% for females among the residents of Shanksville borough, 6 to 11 year old males and 6 to 11 year old females are the most vulnerable to poverty, with 10 males (62.5%) and 4 females (50.0%) in their respective age groups living below the poverty level.
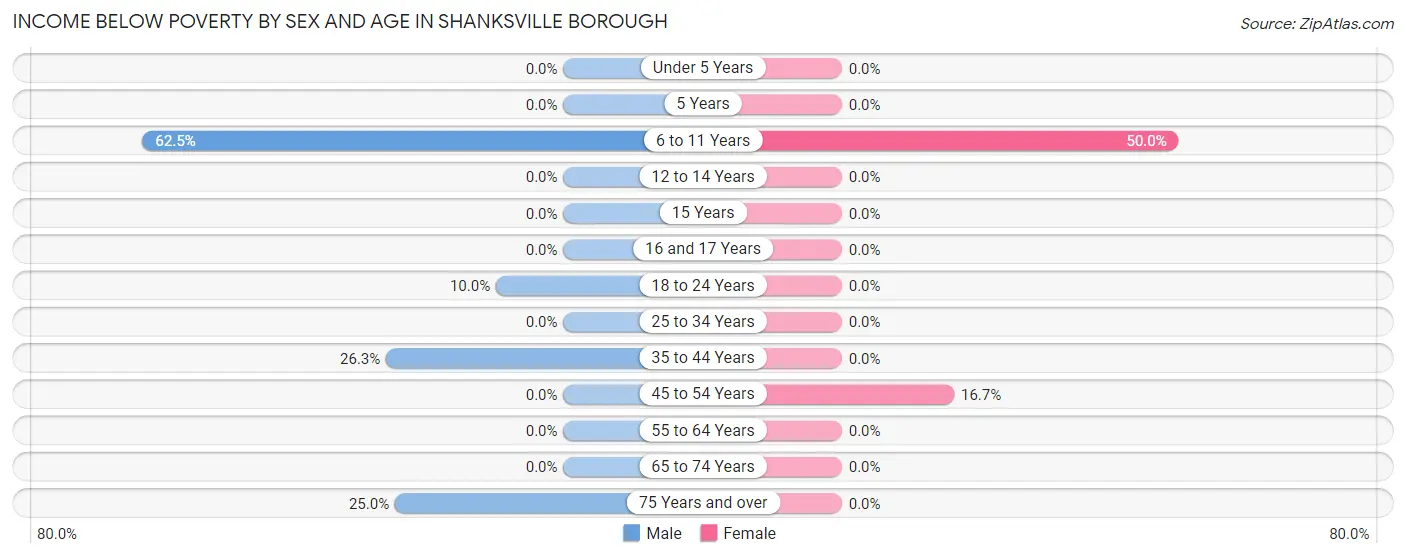
| Age Bracket | Male | Female |
| Under 5 Years | 0 (0.0%) | 0 (0.0%) |
| 5 Years | 0 (0.0%) | 0 (0.0%) |
| 6 to 11 Years | 10 (62.5%) | 4 (50.0%) |
| 12 to 14 Years | 0 (0.0%) | 0 (0.0%) |
| 15 Years | 0 (0.0%) | 0 (0.0%) |
| 16 and 17 Years | 0 (0.0%) | 0 (0.0%) |
| 18 to 24 Years | 1 (10.0%) | 0 (0.0%) |
| 25 to 34 Years | 0 (0.0%) | 0 (0.0%) |
| 35 to 44 Years | 5 (26.3%) | 0 (0.0%) |
| 45 to 54 Years | 0 (0.0%) | 1 (16.7%) |
| 55 to 64 Years | 0 (0.0%) | 0 (0.0%) |
| 65 to 74 Years | 0 (0.0%) | 0 (0.0%) |
| 75 Years and over | 1 (25.0%) | 0 (0.0%) |
| Total | 17 (19.3%) | 5 (6.4%) |
Income Above Poverty by Sex and Age in Shanksville borough
According to the poverty statistics in Shanksville borough, males aged under 5 years and females aged under 5 years are the age groups that are most secure financially, with 100.0% of males and 100.0% of females in these age groups living above the poverty line.
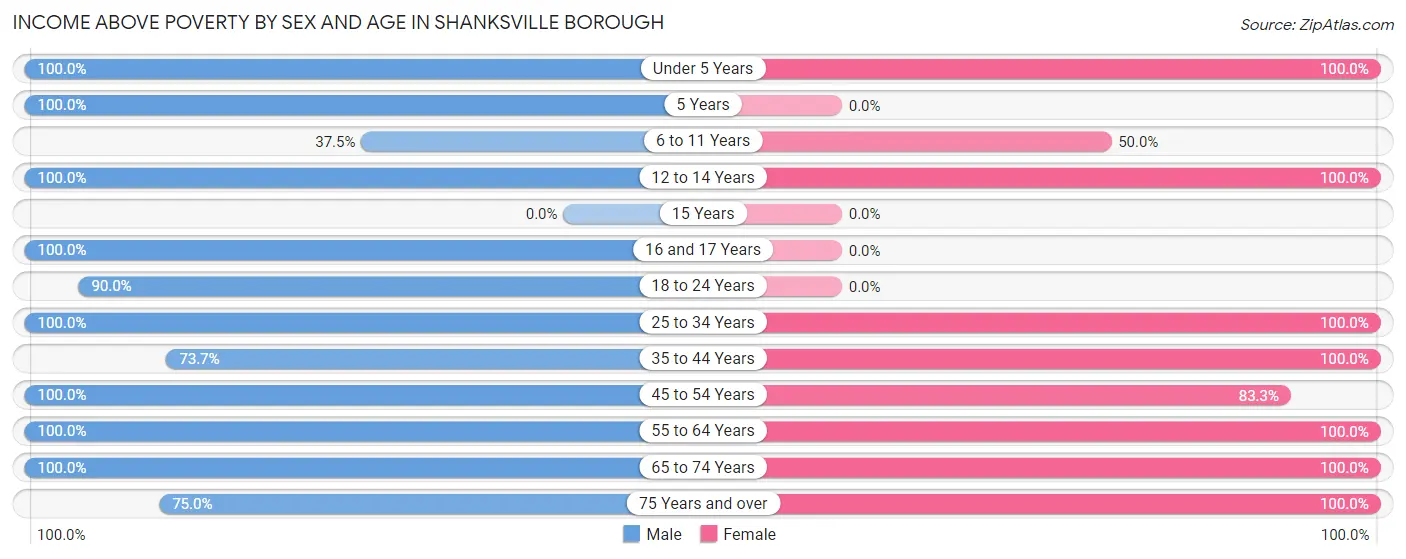
| Age Bracket | Male | Female |
| Under 5 Years | 1 (100.0%) | 2 (100.0%) |
| 5 Years | 2 (100.0%) | 0 (0.0%) |
| 6 to 11 Years | 6 (37.5%) | 4 (50.0%) |
| 12 to 14 Years | 5 (100.0%) | 2 (100.0%) |
| 15 Years | 0 (0.0%) | 0 (0.0%) |
| 16 and 17 Years | 3 (100.0%) | 0 (0.0%) |
| 18 to 24 Years | 9 (90.0%) | 0 (0.0%) |
| 25 to 34 Years | 5 (100.0%) | 11 (100.0%) |
| 35 to 44 Years | 14 (73.7%) | 14 (100.0%) |
| 45 to 54 Years | 6 (100.0%) | 5 (83.3%) |
| 55 to 64 Years | 6 (100.0%) | 11 (100.0%) |
| 65 to 74 Years | 11 (100.0%) | 9 (100.0%) |
| 75 Years and over | 3 (75.0%) | 15 (100.0%) |
| Total | 71 (80.7%) | 73 (93.6%) |
Income Below Poverty Among Married-Couple Families in Shanksville borough
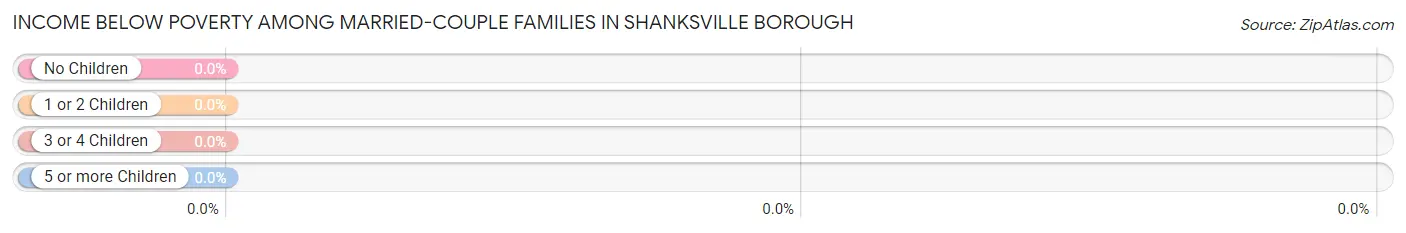
| Children | Above Poverty | Below Poverty |
| No Children | 24 (100.0%) | 0 (0.0%) |
| 1 or 2 Children | 10 (100.0%) | 0 (0.0%) |
| 3 or 4 Children | 4 (100.0%) | 0 (0.0%) |
| 5 or more Children | 0 (0.0%) | 0 (0.0%) |
| Total | 38 (100.0%) | 0 (0.0%) |
Income Below Poverty Among Single-Parent Households in Shanksville borough
According to the poverty data in Shanksville borough, 83.3% or 5 single-father households and 20.0% or 1 single-mother households are living below the poverty line. Among single-father households, those with 3 or 4 children have the highest poverty rate, with 5 households (100.0%) experiencing poverty. Likewise, among single-mother households, those with no children have the highest poverty rate, with 1 households (25.0%) falling below the poverty line.
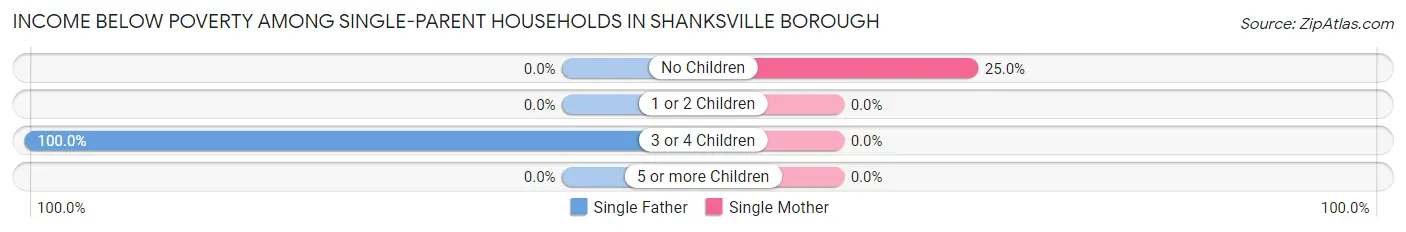
| Children | Single Father | Single Mother |
| No Children | 0 (0.0%) | 1 (25.0%) |
| 1 or 2 Children | 0 (0.0%) | 0 (0.0%) |
| 3 or 4 Children | 5 (100.0%) | 0 (0.0%) |
| 5 or more Children | 0 (0.0%) | 0 (0.0%) |
| Total | 5 (83.3%) | 1 (20.0%) |
Income Below Poverty Among Married-Couple vs Single-Parent Households in Shanksville borough
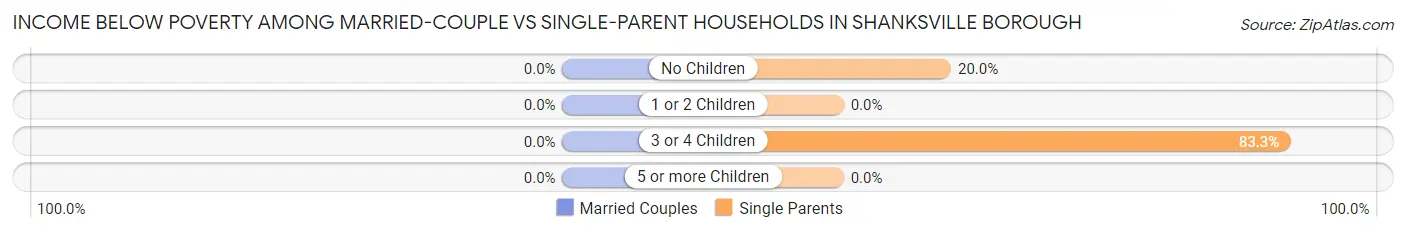
| Children | Married-Couple Families | Single-Parent Households |
| No Children | 0 (0.0%) | 1 (20.0%) |
| 1 or 2 Children | 0 (0.0%) | 0 (0.0%) |
| 3 or 4 Children | 0 (0.0%) | 5 (83.3%) |
| 5 or more Children | 0 (0.0%) | 0 (0.0%) |
| Total | 0 (0.0%) | 6 (54.5%) |
Race in Shanksville borough
The most populous races in Shanksville borough are , and White / Caucasian (166 | 100.0%).
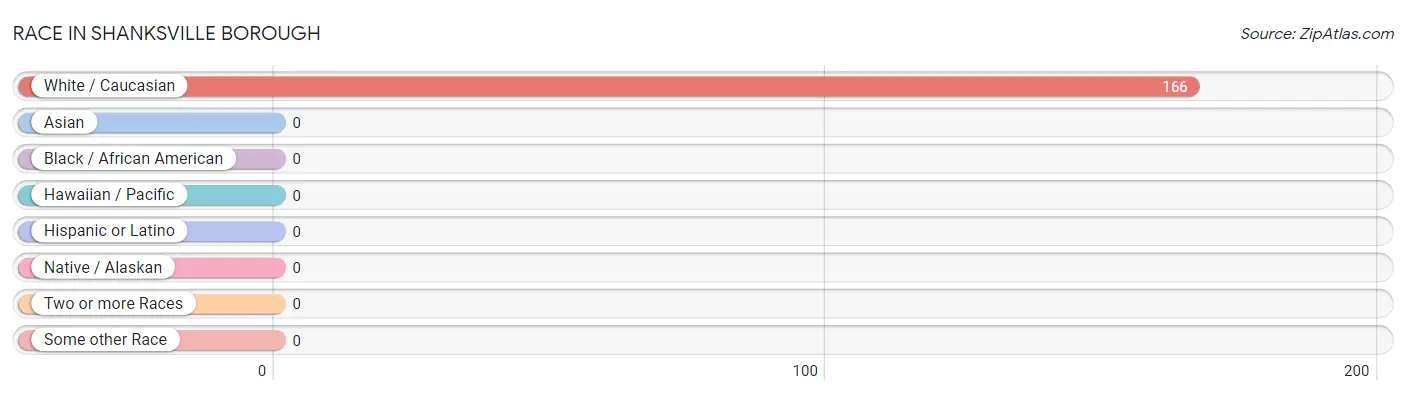
| Race | # Population | % Population |
| Asian | 0 | 0.0% |
| Black / African American | 0 | 0.0% |
| Hawaiian / Pacific | 0 | 0.0% |
| Hispanic or Latino | 0 | 0.0% |
| Native / Alaskan | 0 | 0.0% |
| White / Caucasian | 166 | 100.0% |
| Two or more Races | 0 | 0.0% |
| Some other Race | 0 | 0.0% |
| Total | 166 | 100.0% |
Ancestry in Shanksville borough
The most populous ancestries reported in Shanksville borough are German (84 | 50.6%), Irish (9 | 5.4%), Italian (9 | 5.4%), American (8 | 4.8%), and English (6 | 3.6%), together accounting for 69.9% of all Shanksville borough residents.
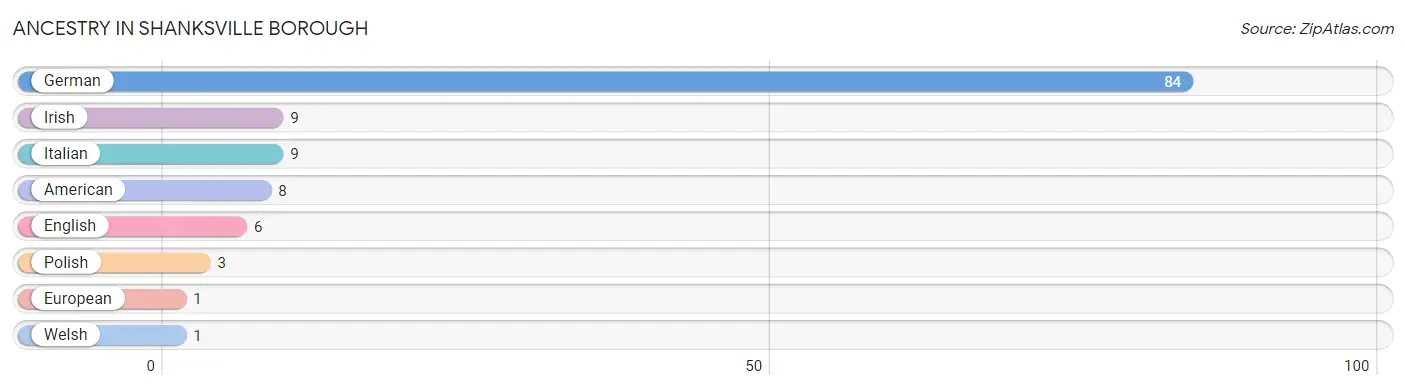
| Ancestry | # Population | % Population |
| American | 8 | 4.8% |
| English | 6 | 3.6% |
| European | 1 | 0.6% |
| German | 84 | 50.6% |
| Irish | 9 | 5.4% |
| Italian | 9 | 5.4% |
| Polish | 3 | 1.8% |
| Welsh | 1 | 0.6% | View All 8 Rows |
Immigrants in Shanksville borough

| Immigration Origin | # Population | % Population | View All 0 Rows |
Sex and Age in Shanksville borough
Sex and Age in Shanksville borough
The most populous age groups in Shanksville borough are 5 to 9 Years (12 | 13.6%) for men and 40 to 44 Years (10 | 12.8%) for women.
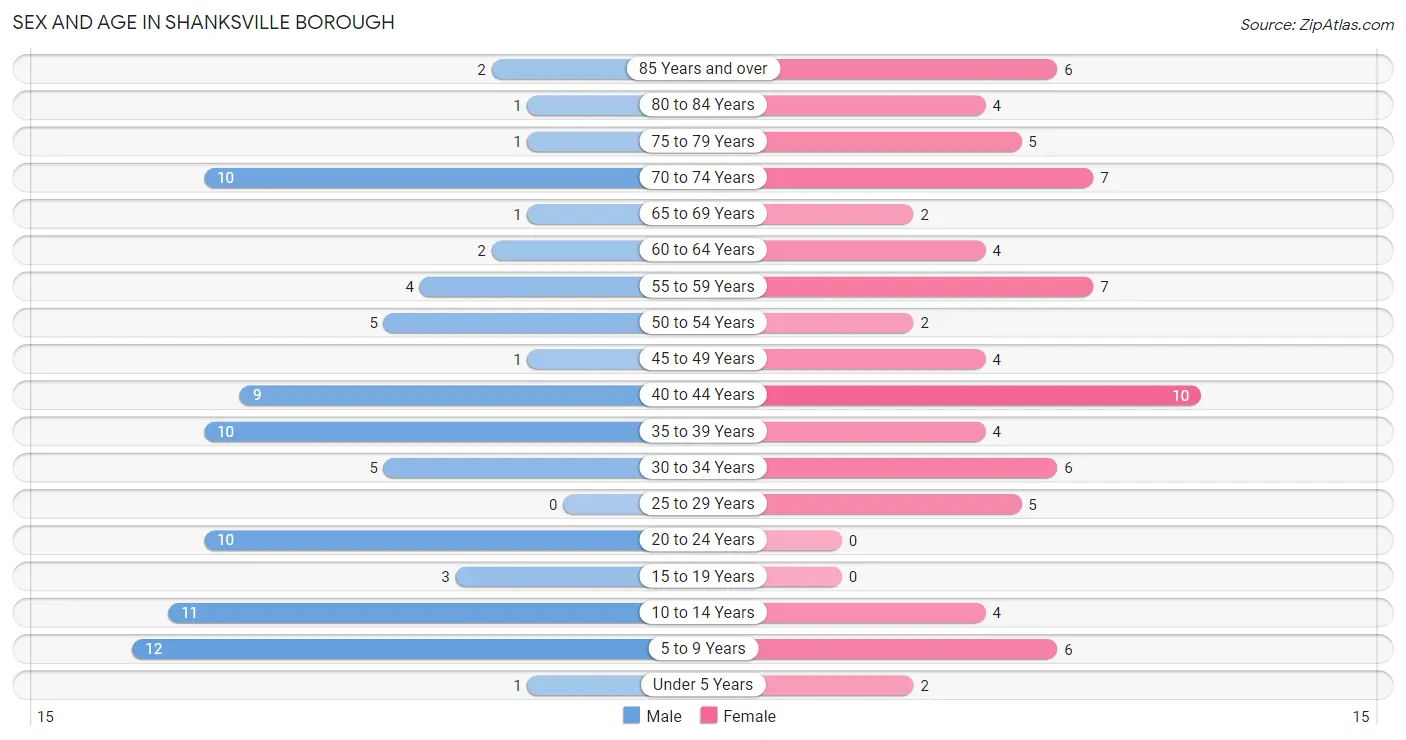
| Age Bracket | Male | Female |
| Under 5 Years | 1 (1.1%) | 2 (2.6%) |
| 5 to 9 Years | 12 (13.6%) | 6 (7.7%) |
| 10 to 14 Years | 11 (12.5%) | 4 (5.1%) |
| 15 to 19 Years | 3 (3.4%) | 0 (0.0%) |
| 20 to 24 Years | 10 (11.4%) | 0 (0.0%) |
| 25 to 29 Years | 0 (0.0%) | 5 (6.4%) |
| 30 to 34 Years | 5 (5.7%) | 6 (7.7%) |
| 35 to 39 Years | 10 (11.4%) | 4 (5.1%) |
| 40 to 44 Years | 9 (10.2%) | 10 (12.8%) |
| 45 to 49 Years | 1 (1.1%) | 4 (5.1%) |
| 50 to 54 Years | 5 (5.7%) | 2 (2.6%) |
| 55 to 59 Years | 4 (4.5%) | 7 (9.0%) |
| 60 to 64 Years | 2 (2.3%) | 4 (5.1%) |
| 65 to 69 Years | 1 (1.1%) | 2 (2.6%) |
| 70 to 74 Years | 10 (11.4%) | 7 (9.0%) |
| 75 to 79 Years | 1 (1.1%) | 5 (6.4%) |
| 80 to 84 Years | 1 (1.1%) | 4 (5.1%) |
| 85 Years and over | 2 (2.3%) | 6 (7.7%) |
| Total | 88 (100.0%) | 78 (100.0%) |
Families and Households in Shanksville borough
Median Family Size in Shanksville borough
The median family size in Shanksville borough is 2.98 persons per family, with single female/mother families (5 | 10.2%) accounting for the largest median family size of 4 persons per family. On the other hand, married-couple families (38 | 77.5%) represent the smallest median family size with 2.74 persons per family.
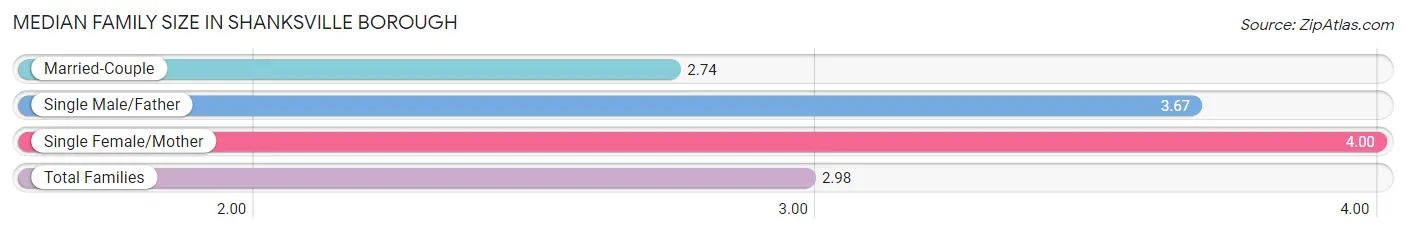
| Family Type | # Families | Family Size |
| Married-Couple | 38 (77.5%) | 2.74 |
| Single Male/Father | 6 (12.2%) | 3.67 |
| Single Female/Mother | 5 (10.2%) | 4.00 |
| Total Families | 49 (100.0%) | 2.98 |
Median Household Size in Shanksville borough
The median household size in Shanksville borough is 2.48 persons per household, with single female/mother households (5 | 7.5%) accounting for the largest median household size of 4 persons per household. non-family households (18 | 26.9%) represent the smallest median household size with 1.11 persons per household.
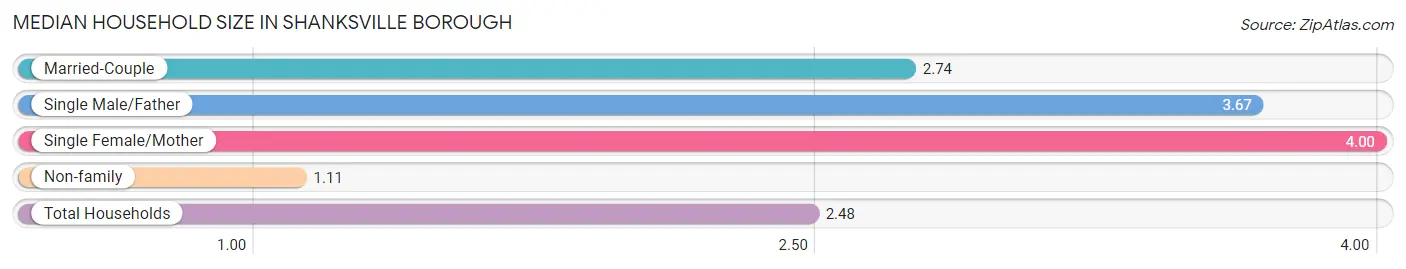
| Household Type | # Households | Household Size |
| Married-Couple | 38 (56.7%) | 2.74 |
| Single Male/Father | 6 (9.0%) | 3.67 |
| Single Female/Mother | 5 (7.5%) | 4.00 |
| Non-family | 18 (26.9%) | 1.11 |
| Total Households | 67 (100.0%) | 2.48 |
Household Size by Marriage Status in Shanksville borough
Out of a total of 67 households in Shanksville borough, 49 (73.1%) are family households, while 18 (26.9%) are nonfamily households. The most numerous type of family households are 2-person households, comprising 23, and the most common type of nonfamily households are 1-person households, comprising 17.
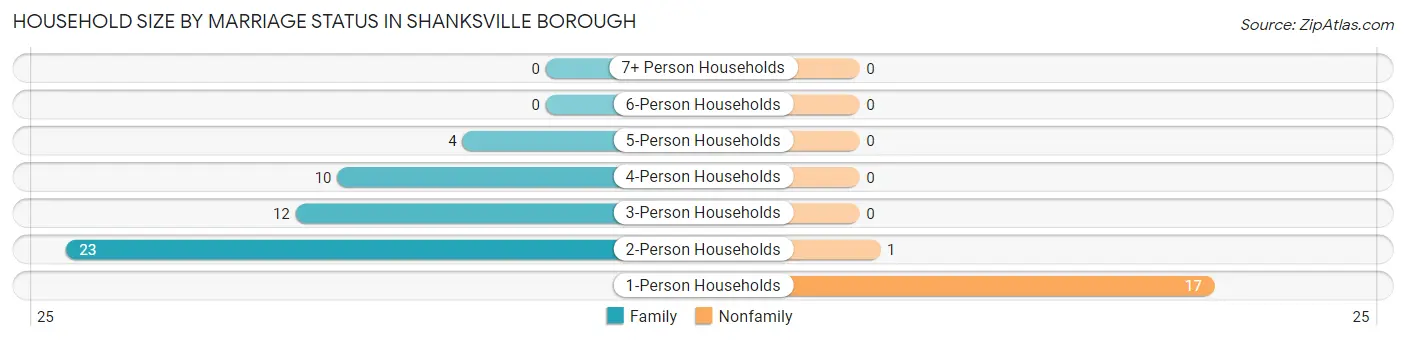
| Household Size | Family Households | Nonfamily Households |
| 1-Person Households | - | 17 (25.4%) |
| 2-Person Households | 23 (34.3%) | 1 (1.5%) |
| 3-Person Households | 12 (17.9%) | 0 (0.0%) |
| 4-Person Households | 10 (14.9%) | 0 (0.0%) |
| 5-Person Households | 4 (6.0%) | 0 (0.0%) |
| 6-Person Households | 0 (0.0%) | 0 (0.0%) |
| 7+ Person Households | 0 (0.0%) | 0 (0.0%) |
| Total | 49 (73.1%) | 18 (26.9%) |
Female Fertility in Shanksville borough
Fertility by Age in Shanksville borough
Average fertility rate in Shanksville borough is 34.0 births per 1,000 women. Women in the age bracket of 20 to 34 years have the highest fertility rate with 91.0 births per 1,000 women. Women in the age bracket of 20 to 34 years acount for 100.0% of all women with births.
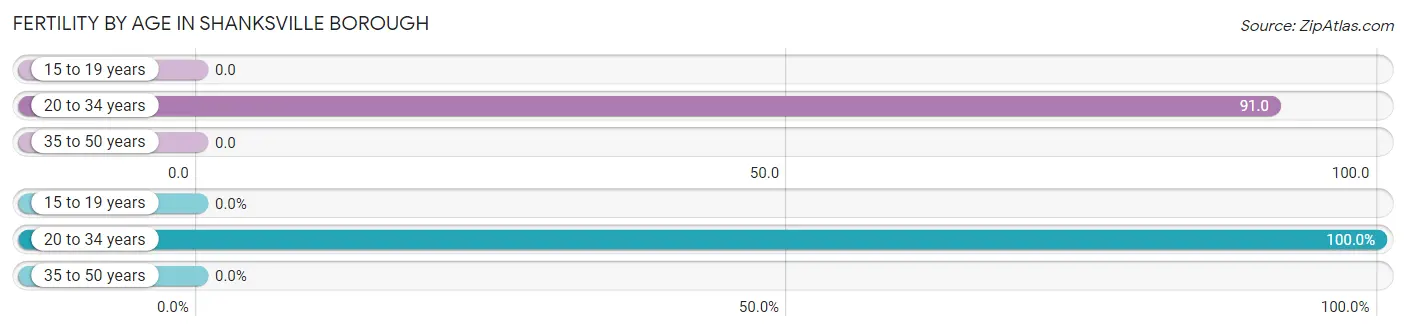
| Age Bracket | Women with Births | Births / 1,000 Women |
| 15 to 19 years | 0 (0.0%) | 0.0 |
| 20 to 34 years | 1 (100.0%) | 91.0 |
| 35 to 50 years | 0 (0.0%) | 0.0 |
| Total | 1 (100.0%) | 34.0 |
Fertility by Age by Marriage Status in Shanksville borough
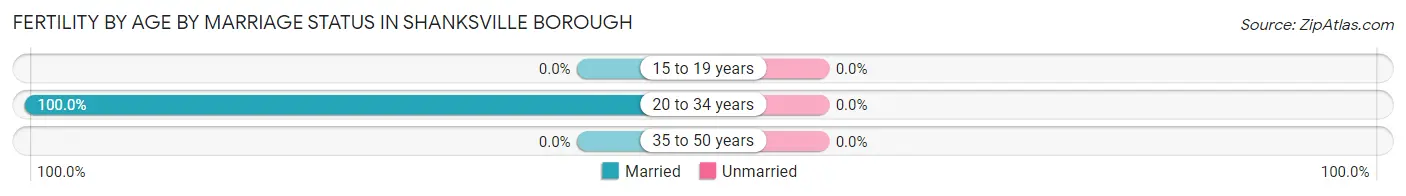
| Age Bracket | Married | Unmarried |
| 15 to 19 years | 0 (0.0%) | 0 (0.0%) |
| 20 to 34 years | 1 (100.0%) | 0 (0.0%) |
| 35 to 50 years | 0 (0.0%) | 0 (0.0%) |
| Total | 1 (100.0%) | 0 (0.0%) |
Fertility by Education in Shanksville borough
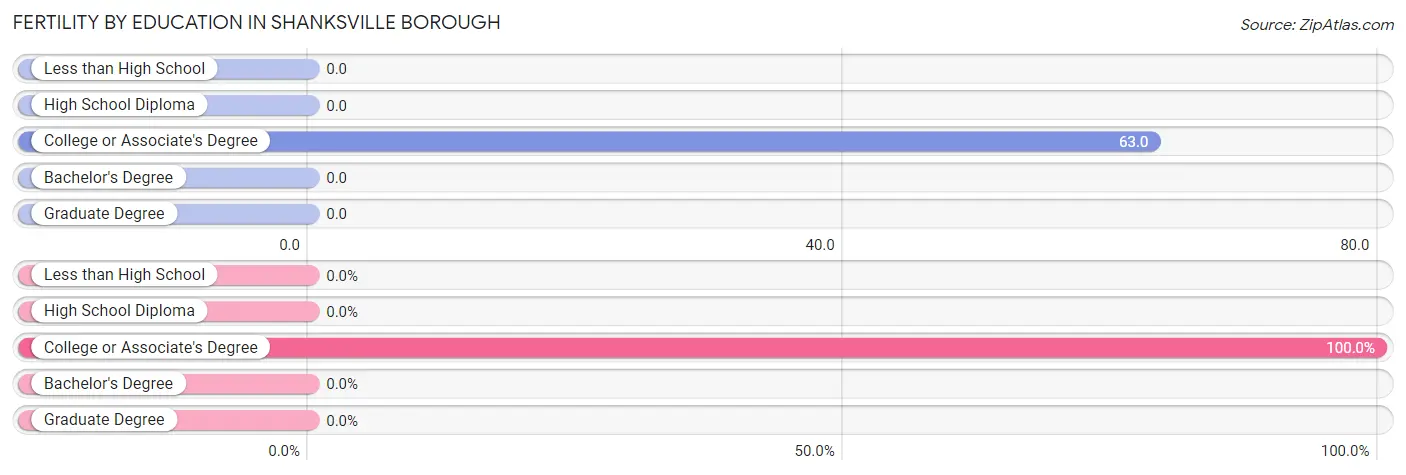
| Educational Attainment | Women with Births | Births / 1,000 Women |
| Less than High School | 0 (0.0%) | 0.0 |
| High School Diploma | 0 (0.0%) | 0.0 |
| College or Associate's Degree | 1 (100.0%) | 63.0 |
| Bachelor's Degree | 0 (0.0%) | 0.0 |
| Graduate Degree | 0 (0.0%) | 0.0 |
| Total | 1 (100.0%) | 34.0 |
Fertility by Education by Marriage Status in Shanksville borough
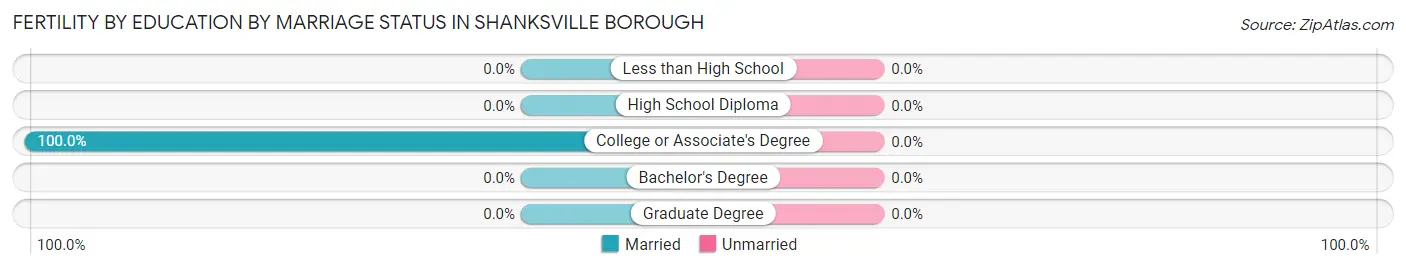
| Educational Attainment | Married | Unmarried |
| Less than High School | 0 (0.0%) | 0 (0.0%) |
| High School Diploma | 0 (0.0%) | 0 (0.0%) |
| College or Associate's Degree | 1 (100.0%) | 0 (0.0%) |
| Bachelor's Degree | 0 (0.0%) | 0 (0.0%) |
| Graduate Degree | 0 (0.0%) | 0 (0.0%) |
| Total | 1 (100.0%) | 0 (0.0%) |
Employment Characteristics in Shanksville borough
Employment by Class of Employer in Shanksville borough
Among the 80 employed individuals in Shanksville borough, private company employees (57 | 71.3%), self-employed (incorporated) (7 | 8.7%), and not-for-profit organizations (6 | 7.5%) make up the most common classes of employment.
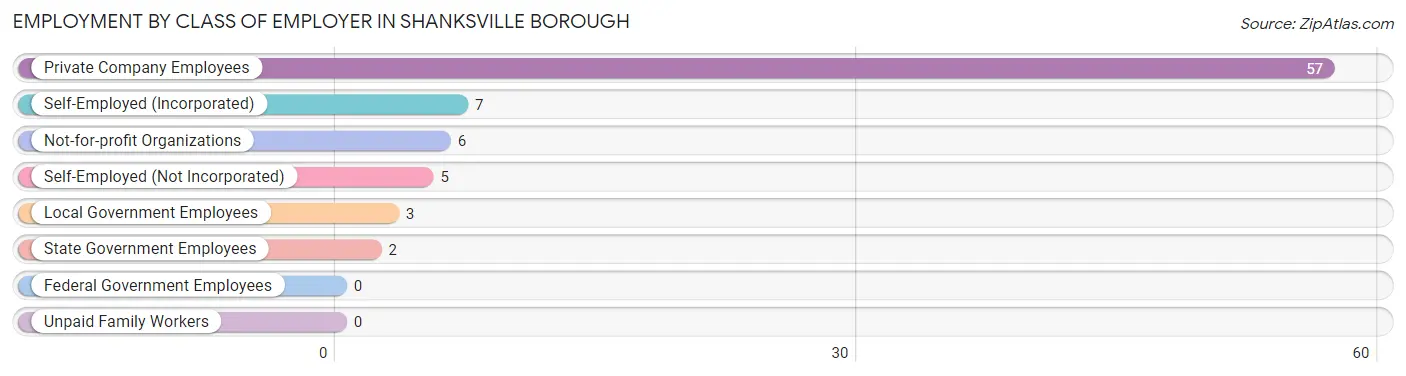
| Employer Class | # Employees | % Employees |
| Private Company Employees | 57 | 71.3% |
| Self-Employed (Incorporated) | 7 | 8.7% |
| Self-Employed (Not Incorporated) | 5 | 6.2% |
| Not-for-profit Organizations | 6 | 7.5% |
| Local Government Employees | 3 | 3.7% |
| State Government Employees | 2 | 2.5% |
| Federal Government Employees | 0 | 0.0% |
| Unpaid Family Workers | 0 | 0.0% |
| Total | 80 | 100.0% |
Employment Status by Age in Shanksville borough
According to the labor force statistics for Shanksville borough, out of the total population over 16 years of age (130), 67.7% or 88 individuals are in the labor force, with 2.3% or 2 of them unemployed. The age group with the highest labor force participation rate is 16 to 19 years, with 100.0% or 3 individuals in the labor force. Within the labor force, the 20 to 24 years age range has the highest percentage of unemployed individuals, with 28.6% or 2 of them being unemployed.
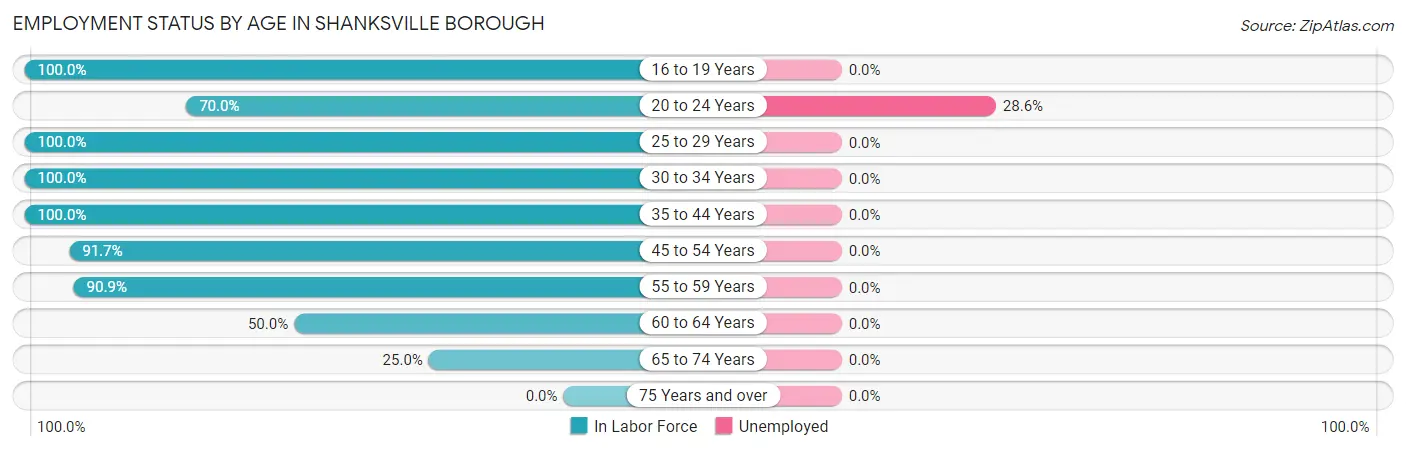
| Age Bracket | In Labor Force | Unemployed |
| 16 to 19 Years | 3 (100.0%) | 0 (0.0%) |
| 20 to 24 Years | 7 (70.0%) | 2 (28.6%) |
| 25 to 29 Years | 5 (100.0%) | 0 (0.0%) |
| 30 to 34 Years | 11 (100.0%) | 0 (0.0%) |
| 35 to 44 Years | 33 (100.0%) | 0 (0.0%) |
| 45 to 54 Years | 11 (91.7%) | 0 (0.0%) |
| 55 to 59 Years | 10 (90.9%) | 0 (0.0%) |
| 60 to 64 Years | 3 (50.0%) | 0 (0.0%) |
| 65 to 74 Years | 5 (25.0%) | 0 (0.0%) |
| 75 Years and over | 0 (0.0%) | 0 (0.0%) |
| Total | 88 (67.7%) | 2 (2.3%) |
Employment Status by Educational Attainment in Shanksville borough
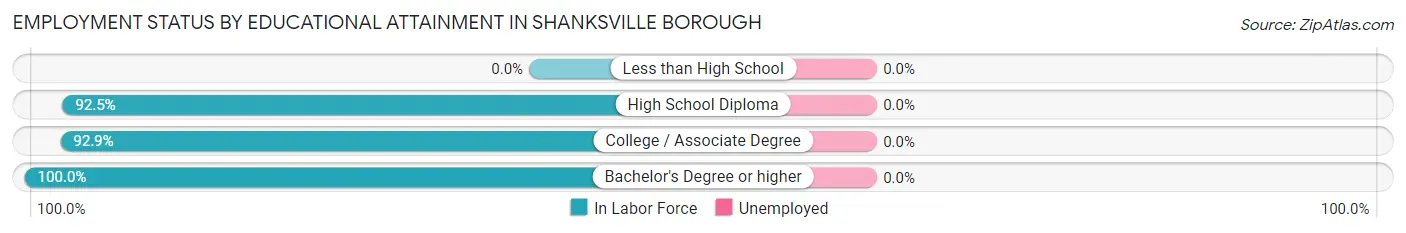
| Educational Attainment | In Labor Force | Unemployed |
| Less than High School | 0 (0.0%) | 0 (0.0%) |
| High School Diploma | 37 (92.5%) | 0 (0.0%) |
| College / Associate Degree | 26 (92.9%) | 0 (0.0%) |
| Bachelor's Degree or higher | 10 (100.0%) | 0 (0.0%) |
| Total | 73 (93.6%) | 0 (0.0%) |
Employment Occupations by Sex in Shanksville borough
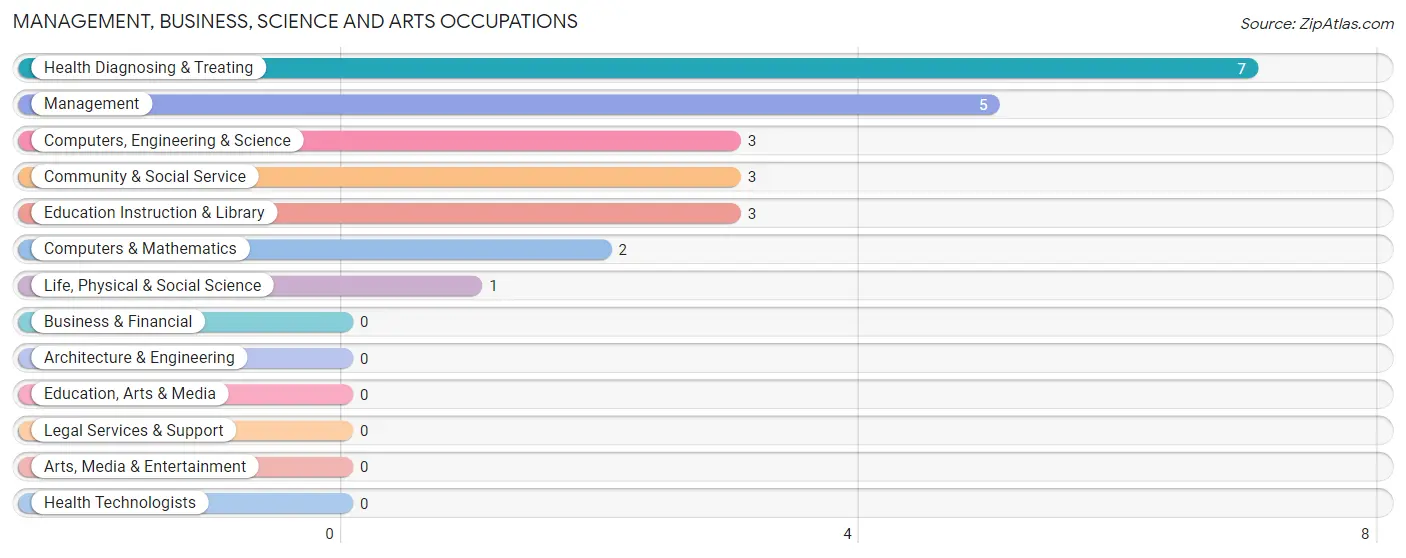
Management, Business, Science and Arts Occupations
The most common Management, Business, Science and Arts occupations in Shanksville borough are Health Diagnosing & Treating (7 | 8.1%), Management (5 | 5.8%), Computers, Engineering & Science (3 | 3.5%), Community & Social Service (3 | 3.5%), and Education Instruction & Library (3 | 3.5%).
Management, Business, Science and Arts Occupations by Sex
Within the Management, Business, Science and Arts occupations in Shanksville borough, the most male-oriented occupations are Computers, Engineering & Science (100.0%), Computers & Mathematics (100.0%), and Life, Physical & Social Science (100.0%), while the most female-oriented occupations are Community & Social Service (100.0%), Education Instruction & Library (100.0%), and Health Diagnosing & Treating (100.0%).
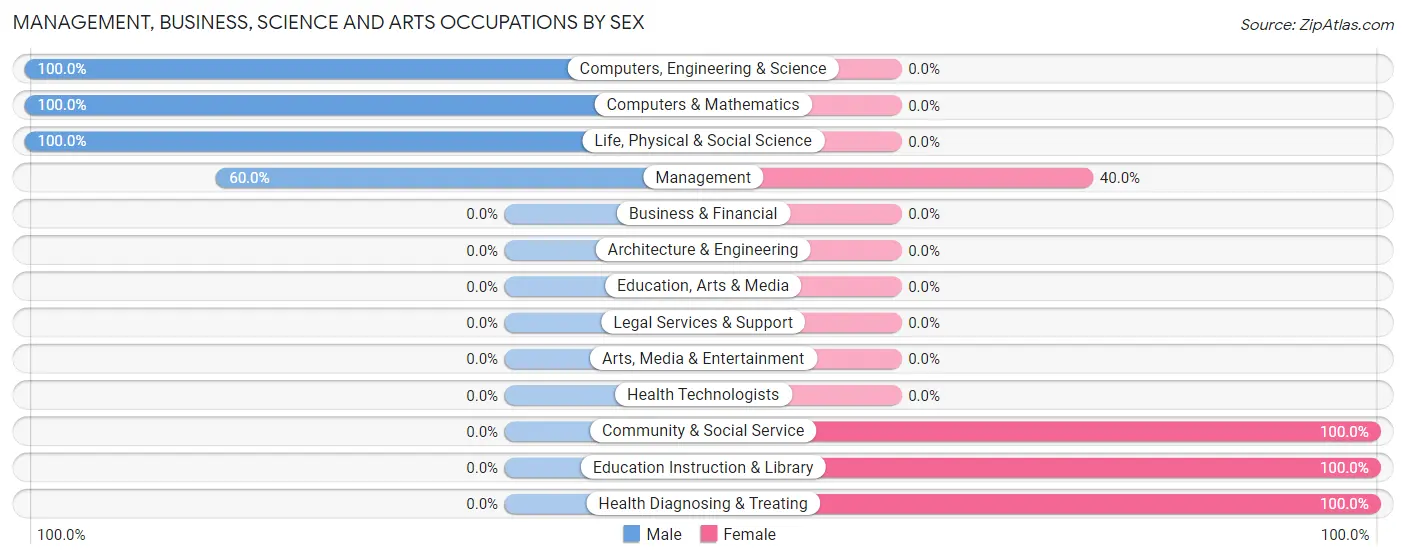
| Occupation | Male | Female |
| Management | 3 (60.0%) | 2 (40.0%) |
| Business & Financial | 0 (0.0%) | 0 (0.0%) |
| Computers, Engineering & Science | 3 (100.0%) | 0 (0.0%) |
| Computers & Mathematics | 2 (100.0%) | 0 (0.0%) |
| Architecture & Engineering | 0 (0.0%) | 0 (0.0%) |
| Life, Physical & Social Science | 1 (100.0%) | 0 (0.0%) |
| Community & Social Service | 0 (0.0%) | 3 (100.0%) |
| Education, Arts & Media | 0 (0.0%) | 0 (0.0%) |
| Legal Services & Support | 0 (0.0%) | 0 (0.0%) |
| Education Instruction & Library | 0 (0.0%) | 3 (100.0%) |
| Arts, Media & Entertainment | 0 (0.0%) | 0 (0.0%) |
| Health Diagnosing & Treating | 0 (0.0%) | 7 (100.0%) |
| Health Technologists | 0 (0.0%) | 0 (0.0%) |
| Total (Category) | 6 (33.3%) | 12 (66.7%) |
| Total (Overall) | 46 (53.5%) | 40 (46.5%) |
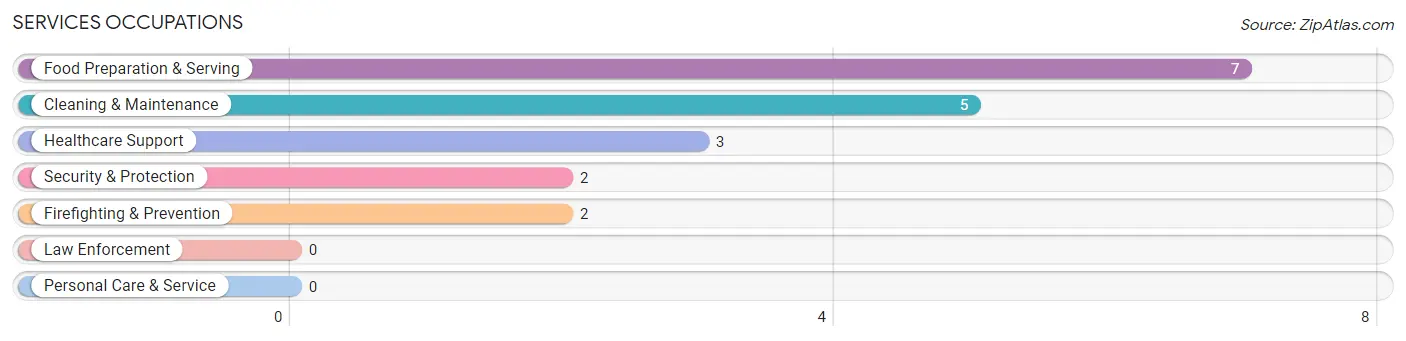
Services Occupations
The most common Services occupations in Shanksville borough are Food Preparation & Serving (7 | 8.1%), Cleaning & Maintenance (5 | 5.8%), Healthcare Support (3 | 3.5%), Security & Protection (2 | 2.3%), and Firefighting & Prevention (2 | 2.3%).
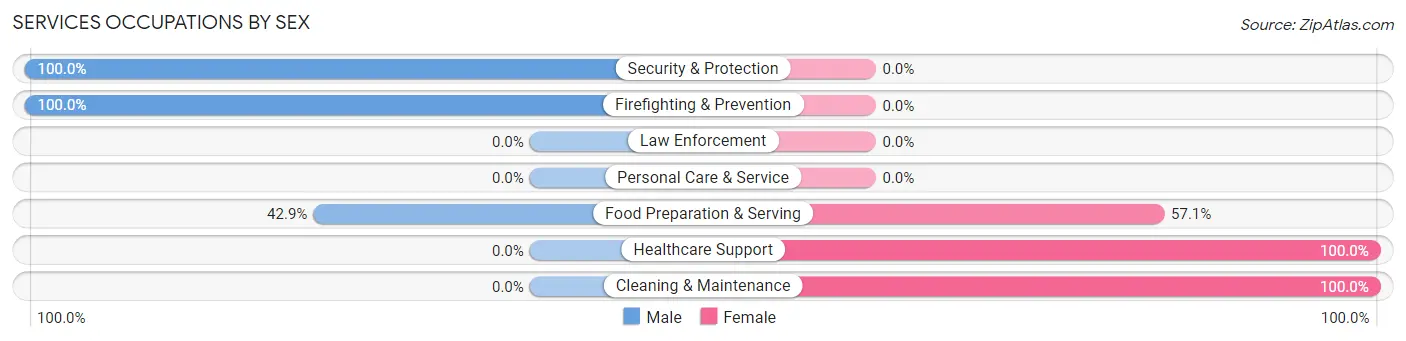
Services Occupations by Sex
Within the Services occupations in Shanksville borough, the most male-oriented occupations are Security & Protection (100.0%), Firefighting & Prevention (100.0%), and Food Preparation & Serving (42.9%), while the most female-oriented occupations are Healthcare Support (100.0%), Cleaning & Maintenance (100.0%), and Food Preparation & Serving (57.1%).
| Occupation | Male | Female |
| Healthcare Support | 0 (0.0%) | 3 (100.0%) |
| Security & Protection | 2 (100.0%) | 0 (0.0%) |
| Firefighting & Prevention | 2 (100.0%) | 0 (0.0%) |
| Law Enforcement | 0 (0.0%) | 0 (0.0%) |
| Food Preparation & Serving | 3 (42.9%) | 4 (57.1%) |
| Cleaning & Maintenance | 0 (0.0%) | 5 (100.0%) |
| Personal Care & Service | 0 (0.0%) | 0 (0.0%) |
| Total (Category) | 5 (29.4%) | 12 (70.6%) |
| Total (Overall) | 46 (53.5%) | 40 (46.5%) |
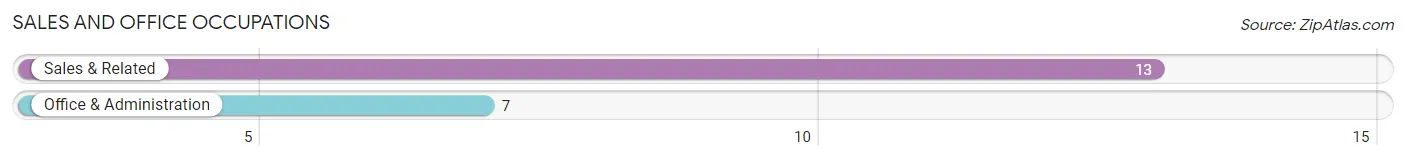
Sales and Office Occupations
The most common Sales and Office occupations in Shanksville borough are Sales & Related (13 | 15.1%), and Office & Administration (7 | 8.1%).
Sales and Office Occupations by Sex
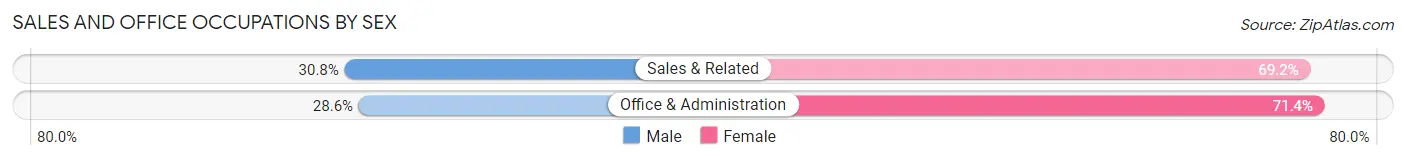
| Occupation | Male | Female |
| Sales & Related | 4 (30.8%) | 9 (69.2%) |
| Office & Administration | 2 (28.6%) | 5 (71.4%) |
| Total (Category) | 6 (30.0%) | 14 (70.0%) |
| Total (Overall) | 46 (53.5%) | 40 (46.5%) |
Natural Resources, Construction and Maintenance Occupations
The most common Natural Resources, Construction and Maintenance occupations in Shanksville borough are Construction & Extraction (13 | 15.1%), and Installation, Maintenance & Repair (5 | 5.8%).
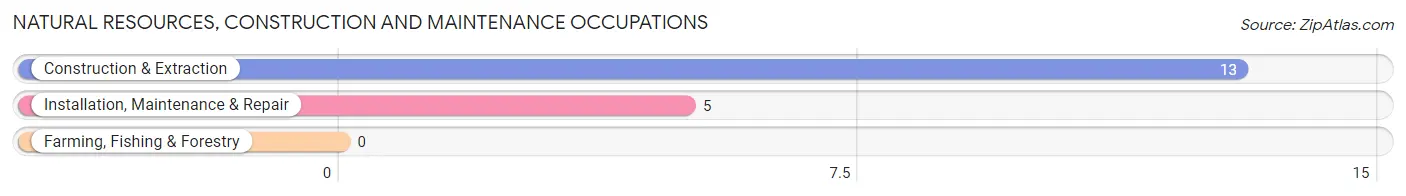
Natural Resources, Construction and Maintenance Occupations by Sex
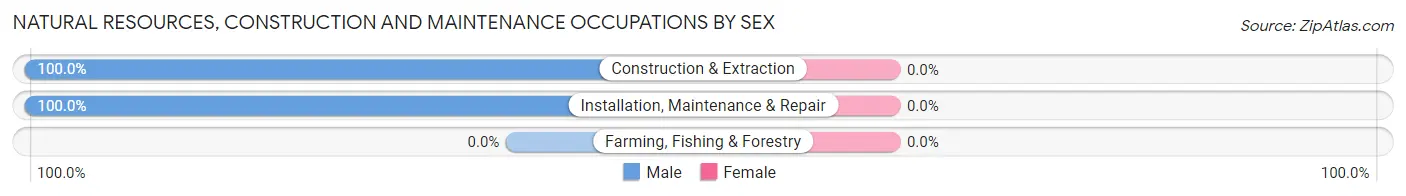
| Occupation | Male | Female |
| Farming, Fishing & Forestry | 0 (0.0%) | 0 (0.0%) |
| Construction & Extraction | 13 (100.0%) | 0 (0.0%) |
| Installation, Maintenance & Repair | 5 (100.0%) | 0 (0.0%) |
| Total (Category) | 18 (100.0%) | 0 (0.0%) |
| Total (Overall) | 46 (53.5%) | 40 (46.5%) |
Production, Transportation and Moving Occupations
The most common Production, Transportation and Moving occupations in Shanksville borough are Material Moving (6 | 7.0%), Production (4 | 4.6%), and Transportation (3 | 3.5%).
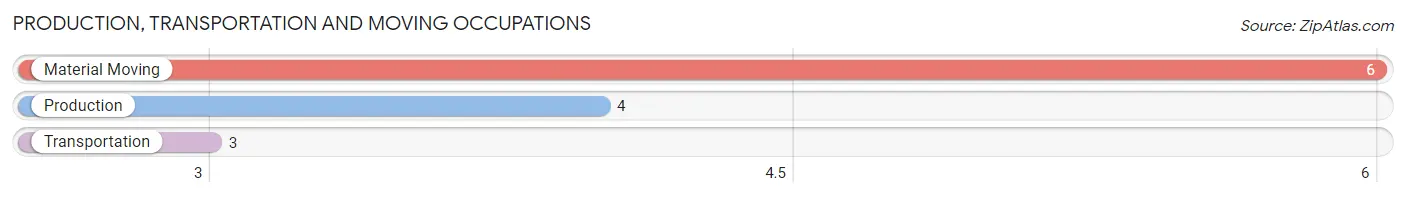
Production, Transportation and Moving Occupations by Sex
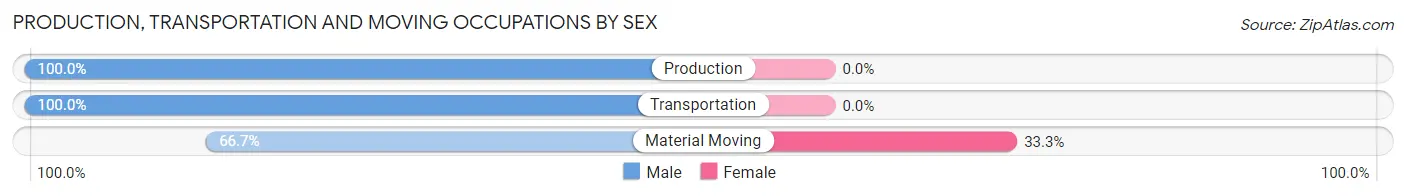
| Occupation | Male | Female |
| Production | 4 (100.0%) | 0 (0.0%) |
| Transportation | 3 (100.0%) | 0 (0.0%) |
| Material Moving | 4 (66.7%) | 2 (33.3%) |
| Total (Category) | 11 (84.6%) | 2 (15.4%) |
| Total (Overall) | 46 (53.5%) | 40 (46.5%) |
Employment Industries by Sex in Shanksville borough
Employment Industries in Shanksville borough
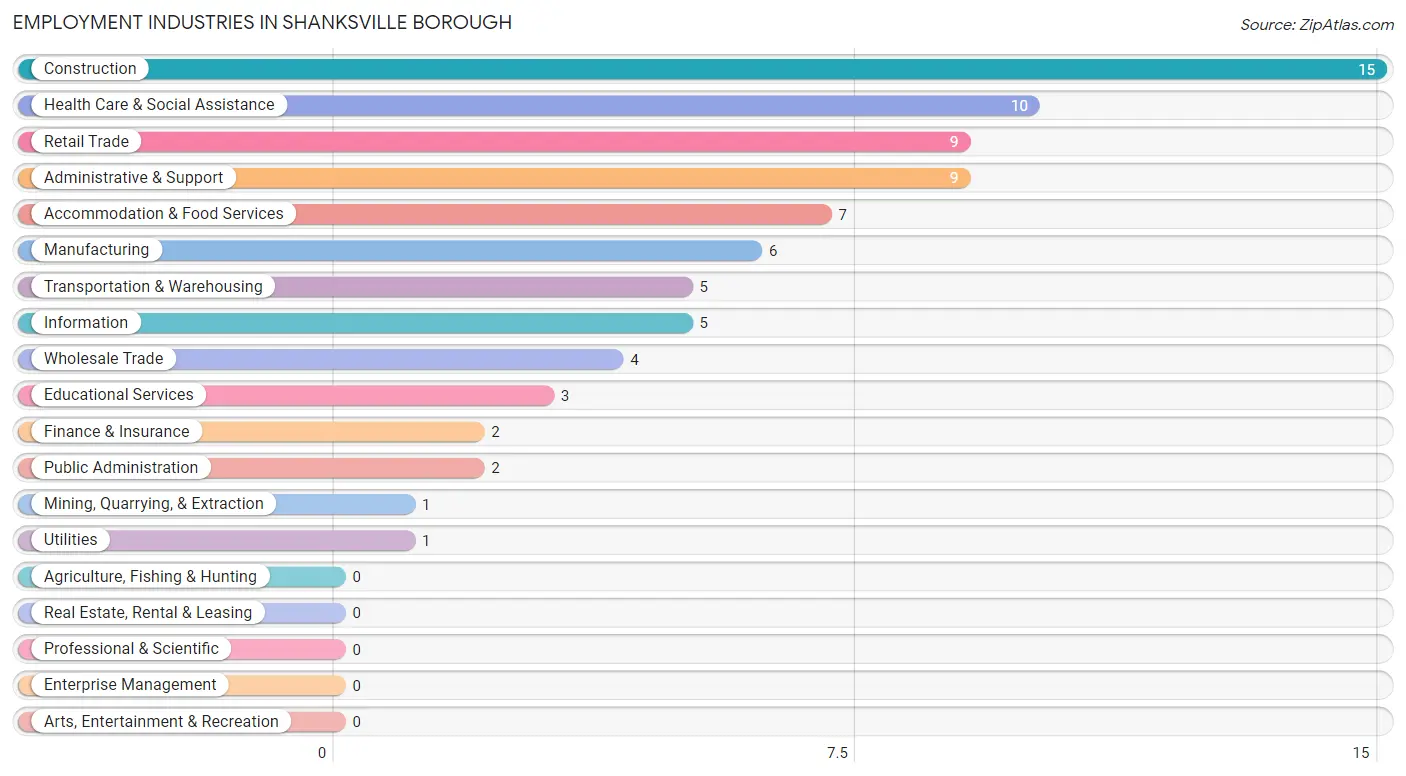
The major employment industries in Shanksville borough include Construction (15 | 17.4%), Health Care & Social Assistance (10 | 11.6%), Retail Trade (9 | 10.5%), Administrative & Support (9 | 10.5%), and Accommodation & Food Services (7 | 8.1%).
Employment Industries by Sex in Shanksville borough
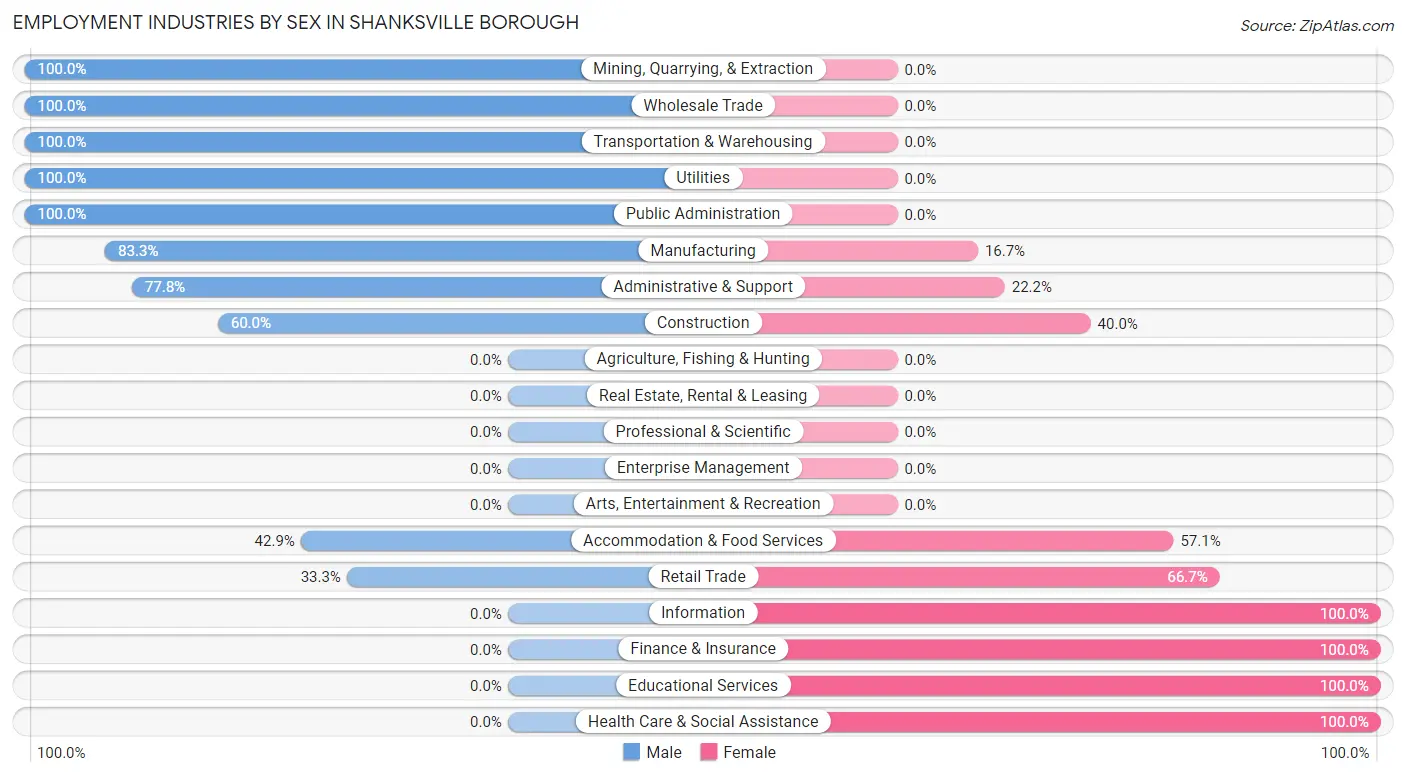
The Shanksville borough industries that see more men than women are Mining, Quarrying, & Extraction (100.0%), Wholesale Trade (100.0%), and Transportation & Warehousing (100.0%), whereas the industries that tend to have a higher number of women are Information (100.0%), Finance & Insurance (100.0%), and Educational Services (100.0%).
| Industry | Male | Female |
| Agriculture, Fishing & Hunting | 0 (0.0%) | 0 (0.0%) |
| Mining, Quarrying, & Extraction | 1 (100.0%) | 0 (0.0%) |
| Construction | 9 (60.0%) | 6 (40.0%) |
| Manufacturing | 5 (83.3%) | 1 (16.7%) |
| Wholesale Trade | 4 (100.0%) | 0 (0.0%) |
| Retail Trade | 3 (33.3%) | 6 (66.7%) |
| Transportation & Warehousing | 5 (100.0%) | 0 (0.0%) |
| Utilities | 1 (100.0%) | 0 (0.0%) |
| Information | 0 (0.0%) | 5 (100.0%) |
| Finance & Insurance | 0 (0.0%) | 2 (100.0%) |
| Real Estate, Rental & Leasing | 0 (0.0%) | 0 (0.0%) |
| Professional & Scientific | 0 (0.0%) | 0 (0.0%) |
| Enterprise Management | 0 (0.0%) | 0 (0.0%) |
| Administrative & Support | 7 (77.8%) | 2 (22.2%) |
| Educational Services | 0 (0.0%) | 3 (100.0%) |
| Health Care & Social Assistance | 0 (0.0%) | 10 (100.0%) |
| Arts, Entertainment & Recreation | 0 (0.0%) | 0 (0.0%) |
| Accommodation & Food Services | 3 (42.9%) | 4 (57.1%) |
| Public Administration | 2 (100.0%) | 0 (0.0%) |
| Total | 46 (53.5%) | 40 (46.5%) |
Education in Shanksville borough
School Enrollment in Shanksville borough
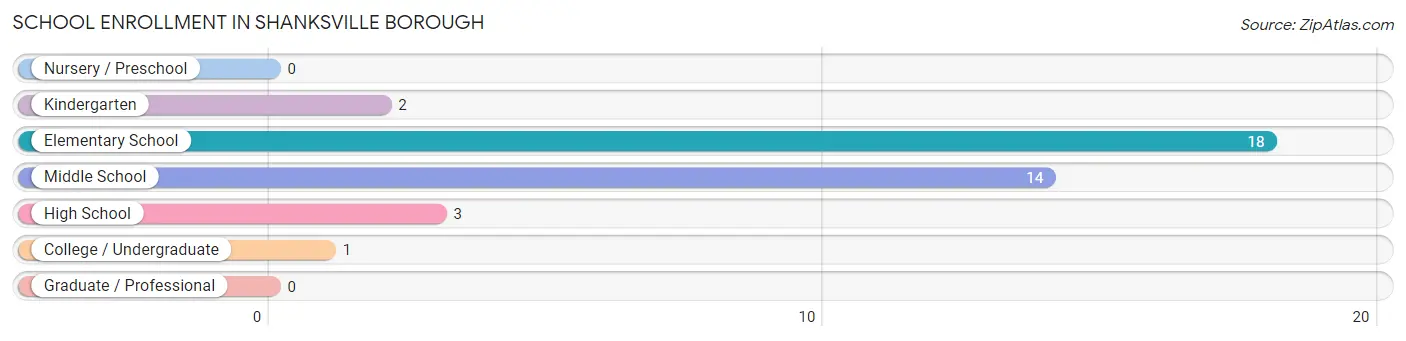
The most common levels of schooling among the 38 students in Shanksville borough are elementary school (18 | 47.4%), middle school (14 | 36.8%), and high school (3 | 7.9%).
| School Level | # Students | % Students |
| Nursery / Preschool | 0 | 0.0% |
| Kindergarten | 2 | 5.3% |
| Elementary School | 18 | 47.4% |
| Middle School | 14 | 36.8% |
| High School | 3 | 7.9% |
| College / Undergraduate | 1 | 2.6% |
| Graduate / Professional | 0 | 0.0% |
| Total | 38 | 100.0% |
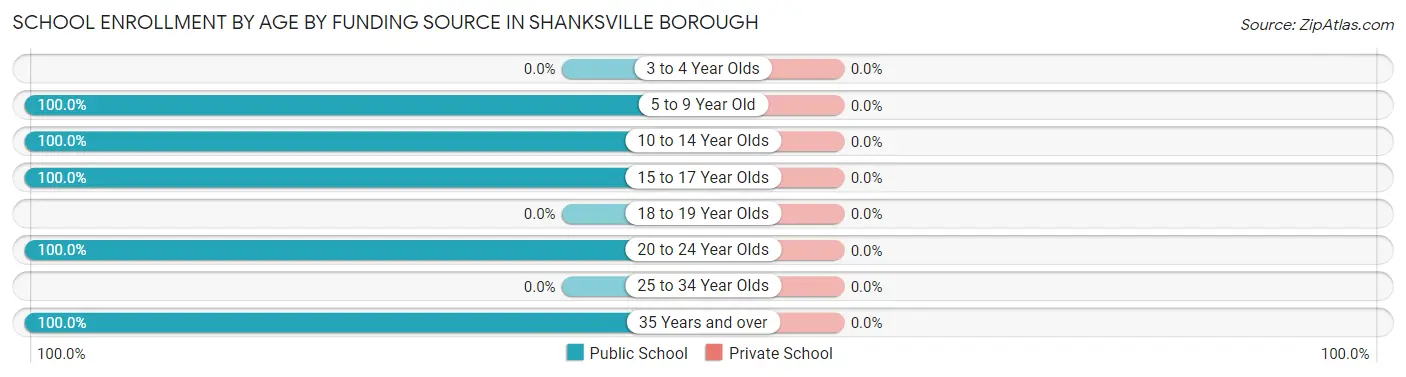
School Enrollment by Age by Funding Source in Shanksville borough
| Age Bracket | Public School | Private School |
| 3 to 4 Year Olds | 0 (0.0%) | 0 (0.0%) |
| 5 to 9 Year Old | 18 (100.0%) | 0 (0.0%) |
| 10 to 14 Year Olds | 15 (100.0%) | 0 (0.0%) |
| 15 to 17 Year Olds | 3 (100.0%) | 0 (0.0%) |
| 18 to 19 Year Olds | 0 (0.0%) | 0 (0.0%) |
| 20 to 24 Year Olds | 1 (100.0%) | 0 (0.0%) |
| 25 to 34 Year Olds | 0 (0.0%) | 0 (0.0%) |
| 35 Years and over | 1 (100.0%) | 0 (0.0%) |
| Total | 38 (100.0%) | 0 (0.0%) |
Educational Attainment by Field of Study in Shanksville borough
Bio, nature & agricultural (4 | 26.7%), computers & mathematics (3 | 20.0%), physical & health sciences (2 | 13.3%), social sciences (2 | 13.3%), and arts & humanities (2 | 13.3%) are the most common fields of study among 15 individuals in Shanksville borough who have obtained a bachelor's degree or higher.
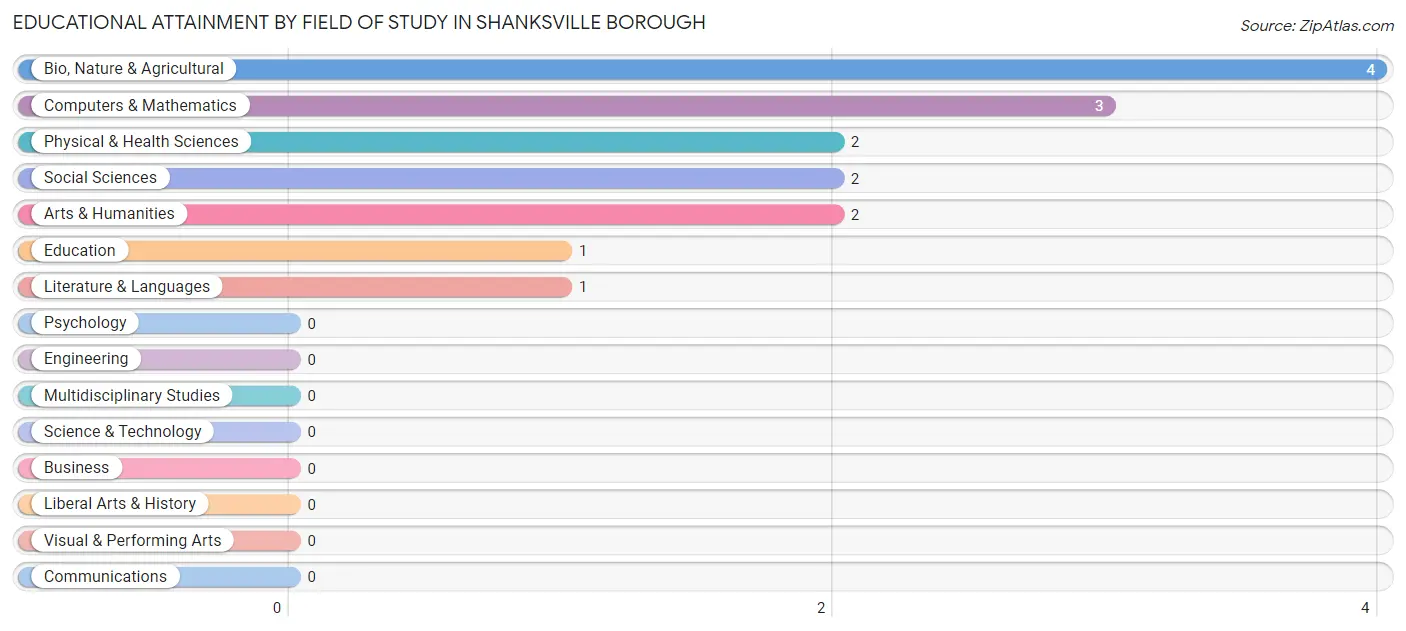
| Field of Study | # Graduates | % Graduates |
| Computers & Mathematics | 3 | 20.0% |
| Bio, Nature & Agricultural | 4 | 26.7% |
| Physical & Health Sciences | 2 | 13.3% |
| Psychology | 0 | 0.0% |
| Social Sciences | 2 | 13.3% |
| Engineering | 0 | 0.0% |
| Multidisciplinary Studies | 0 | 0.0% |
| Science & Technology | 0 | 0.0% |
| Business | 0 | 0.0% |
| Education | 1 | 6.7% |
| Literature & Languages | 1 | 6.7% |
| Liberal Arts & History | 0 | 0.0% |
| Visual & Performing Arts | 0 | 0.0% |
| Communications | 0 | 0.0% |
| Arts & Humanities | 2 | 13.3% |
| Total | 15 | 100.0% |
Transportation & Commute in Shanksville borough
Vehicle Availability by Sex in Shanksville borough
The most prevalent vehicle ownership categories in Shanksville borough are males with 2 vehicles (19, accounting for 47.5%) and females with 2 vehicles (24, making up 47.5%).
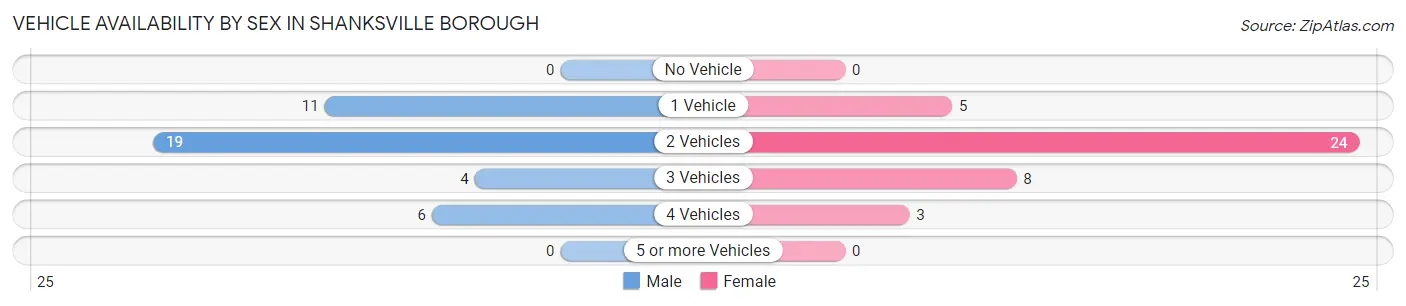
| Vehicles Available | Male | Female |
| No Vehicle | 0 (0.0%) | 0 (0.0%) |
| 1 Vehicle | 11 (27.5%) | 5 (12.5%) |
| 2 Vehicles | 19 (47.5%) | 24 (60.0%) |
| 3 Vehicles | 4 (10.0%) | 8 (20.0%) |
| 4 Vehicles | 6 (15.0%) | 3 (7.5%) |
| 5 or more Vehicles | 0 (0.0%) | 0 (0.0%) |
| Total | 40 (100.0%) | 40 (100.0%) |
Commute Time in Shanksville borough
The most frequently occuring commute durations in Shanksville borough are 15 to 19 minutes (22 commuters, 32.4%), 20 to 24 minutes (18 commuters, 26.5%), and 5 to 9 minutes (13 commuters, 19.1%).
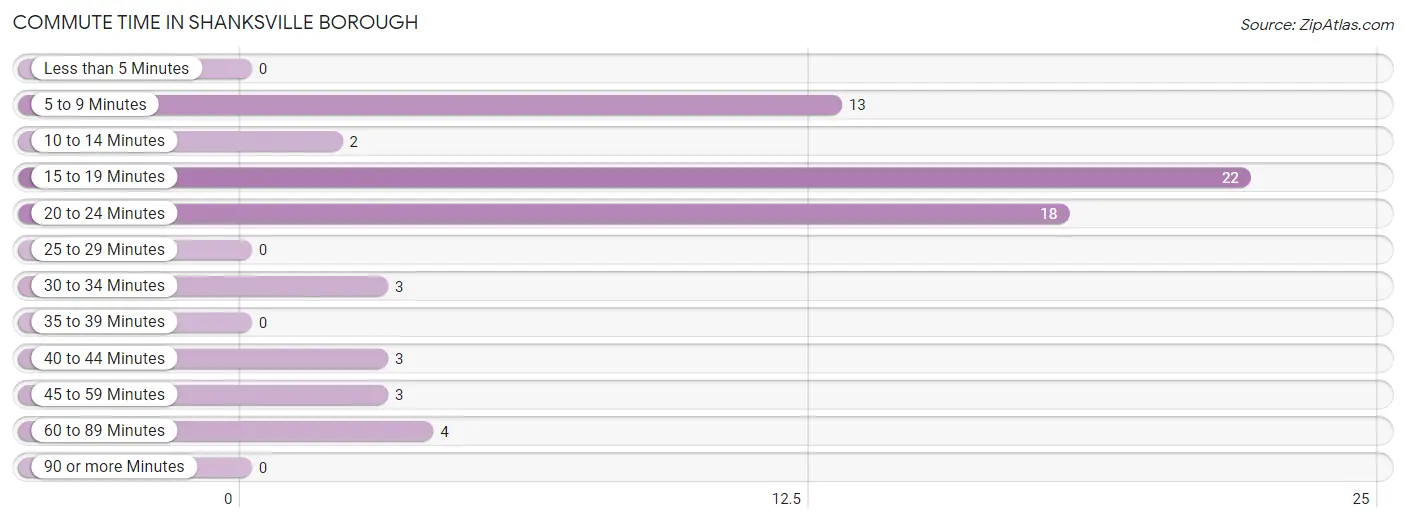
| Commute Time | # Commuters | % Commuters |
| Less than 5 Minutes | 0 | 0.0% |
| 5 to 9 Minutes | 13 | 19.1% |
| 10 to 14 Minutes | 2 | 2.9% |
| 15 to 19 Minutes | 22 | 32.4% |
| 20 to 24 Minutes | 18 | 26.5% |
| 25 to 29 Minutes | 0 | 0.0% |
| 30 to 34 Minutes | 3 | 4.4% |
| 35 to 39 Minutes | 0 | 0.0% |
| 40 to 44 Minutes | 3 | 4.4% |
| 45 to 59 Minutes | 3 | 4.4% |
| 60 to 89 Minutes | 4 | 5.9% |
| 90 or more Minutes | 0 | 0.0% |
Commute Time by Sex in Shanksville borough
The most common commute times in Shanksville borough are 15 to 19 minutes (15 commuters, 41.7%) for males and 5 to 9 minutes (8 commuters, 25.0%) for females.
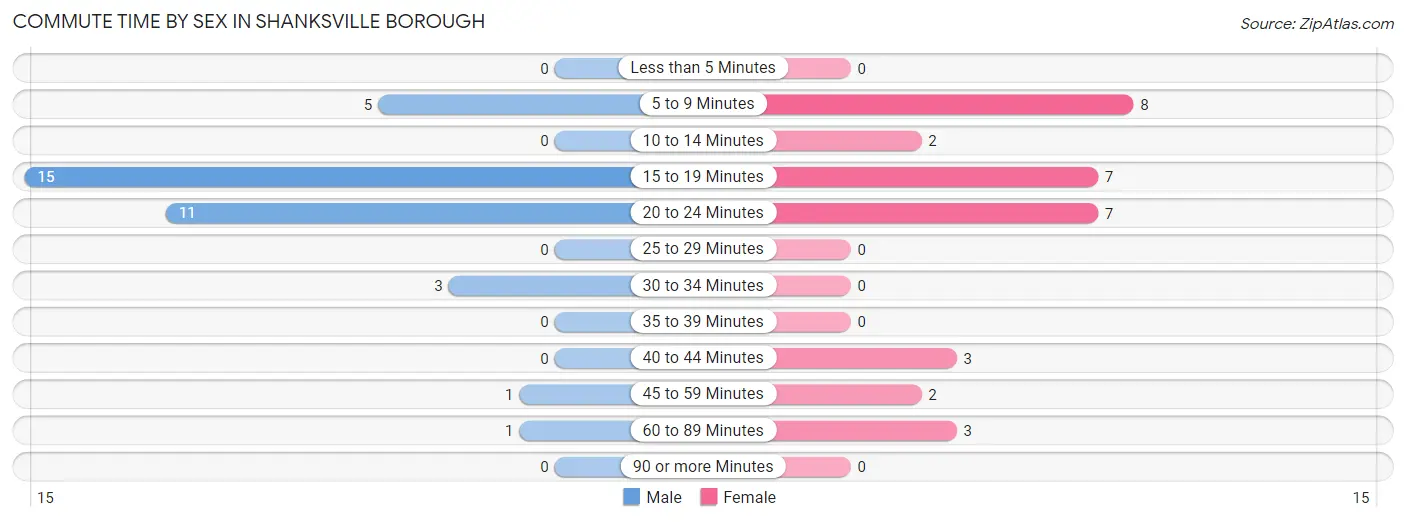
| Commute Time | Male | Female |
| Less than 5 Minutes | 0 (0.0%) | 0 (0.0%) |
| 5 to 9 Minutes | 5 (13.9%) | 8 (25.0%) |
| 10 to 14 Minutes | 0 (0.0%) | 2 (6.2%) |
| 15 to 19 Minutes | 15 (41.7%) | 7 (21.9%) |
| 20 to 24 Minutes | 11 (30.6%) | 7 (21.9%) |
| 25 to 29 Minutes | 0 (0.0%) | 0 (0.0%) |
| 30 to 34 Minutes | 3 (8.3%) | 0 (0.0%) |
| 35 to 39 Minutes | 0 (0.0%) | 0 (0.0%) |
| 40 to 44 Minutes | 0 (0.0%) | 3 (9.4%) |
| 45 to 59 Minutes | 1 (2.8%) | 2 (6.2%) |
| 60 to 89 Minutes | 1 (2.8%) | 3 (9.4%) |
| 90 or more Minutes | 0 (0.0%) | 0 (0.0%) |
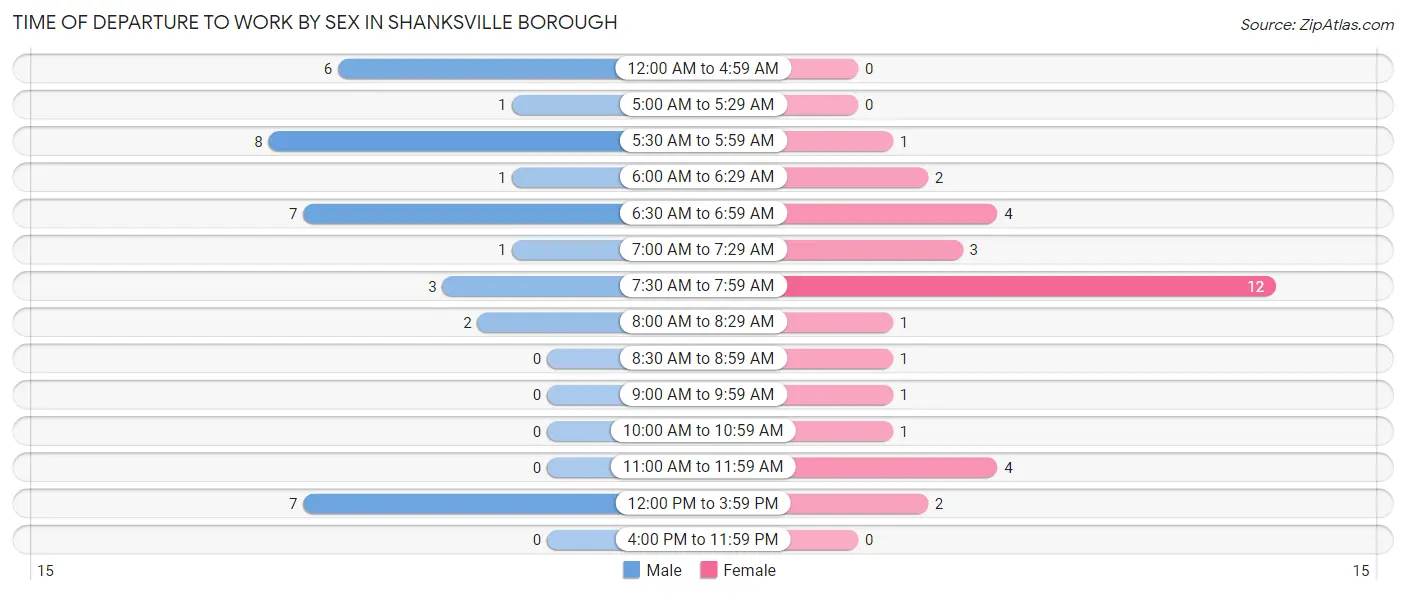
Time of Departure to Work by Sex in Shanksville borough
The most frequent times of departure to work in Shanksville borough are 5:30 AM to 5:59 AM (8, 22.2%) for males and 7:30 AM to 7:59 AM (12, 37.5%) for females.
| Time of Departure | Male | Female |
| 12:00 AM to 4:59 AM | 6 (16.7%) | 0 (0.0%) |
| 5:00 AM to 5:29 AM | 1 (2.8%) | 0 (0.0%) |
| 5:30 AM to 5:59 AM | 8 (22.2%) | 1 (3.1%) |
| 6:00 AM to 6:29 AM | 1 (2.8%) | 2 (6.2%) |
| 6:30 AM to 6:59 AM | 7 (19.4%) | 4 (12.5%) |
| 7:00 AM to 7:29 AM | 1 (2.8%) | 3 (9.4%) |
| 7:30 AM to 7:59 AM | 3 (8.3%) | 12 (37.5%) |
| 8:00 AM to 8:29 AM | 2 (5.6%) | 1 (3.1%) |
| 8:30 AM to 8:59 AM | 0 (0.0%) | 1 (3.1%) |
| 9:00 AM to 9:59 AM | 0 (0.0%) | 1 (3.1%) |
| 10:00 AM to 10:59 AM | 0 (0.0%) | 1 (3.1%) |
| 11:00 AM to 11:59 AM | 0 (0.0%) | 4 (12.5%) |
| 12:00 PM to 3:59 PM | 7 (19.4%) | 2 (6.2%) |
| 4:00 PM to 11:59 PM | 0 (0.0%) | 0 (0.0%) |
| Total | 36 (100.0%) | 32 (100.0%) |
Housing Occupancy in Shanksville borough
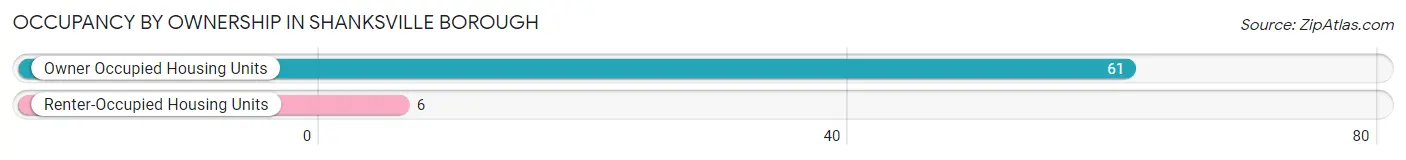
Occupancy by Ownership in Shanksville borough
Of the total 67 dwellings in Shanksville borough, owner-occupied units account for 61 (91.0%), while renter-occupied units make up 6 (9.0%).
| Occupancy | # Housing Units | % Housing Units |
| Owner Occupied Housing Units | 61 | 91.0% |
| Renter-Occupied Housing Units | 6 | 9.0% |
| Total Occupied Housing Units | 67 | 100.0% |
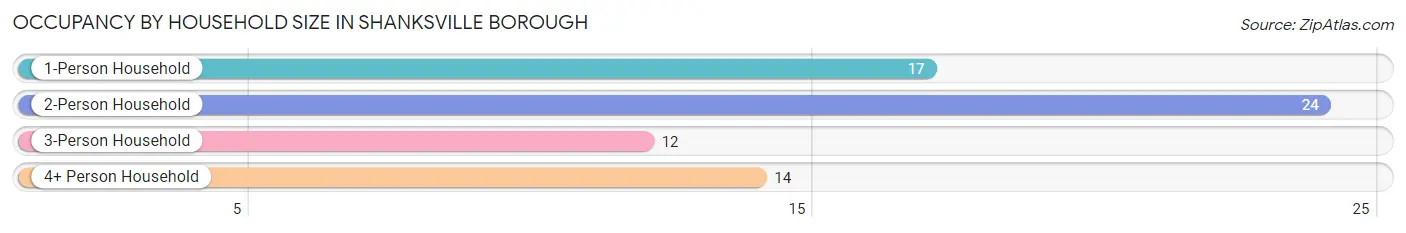
Occupancy by Household Size in Shanksville borough
| Household Size | # Housing Units | % Housing Units |
| 1-Person Household | 17 | 25.4% |
| 2-Person Household | 24 | 35.8% |
| 3-Person Household | 12 | 17.9% |
| 4+ Person Household | 14 | 20.9% |
| Total Housing Units | 67 | 100.0% |
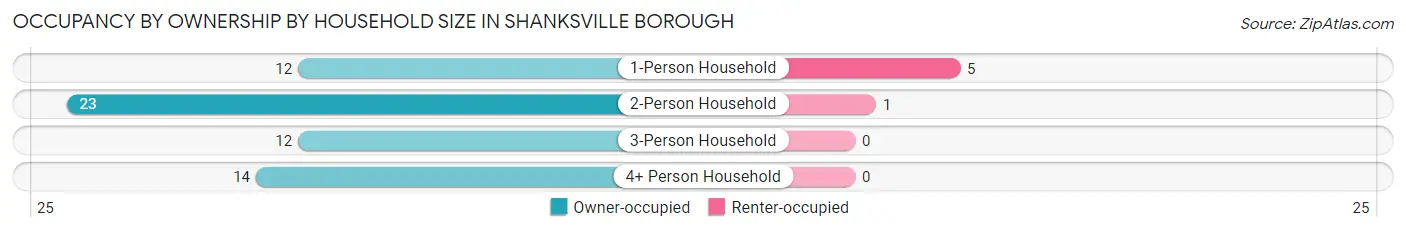
Occupancy by Ownership by Household Size in Shanksville borough
| Household Size | Owner-occupied | Renter-occupied |
| 1-Person Household | 12 (70.6%) | 5 (29.4%) |
| 2-Person Household | 23 (95.8%) | 1 (4.2%) |
| 3-Person Household | 12 (100.0%) | 0 (0.0%) |
| 4+ Person Household | 14 (100.0%) | 0 (0.0%) |
| Total Housing Units | 61 (91.0%) | 6 (9.0%) |
Occupancy by Educational Attainment in Shanksville borough
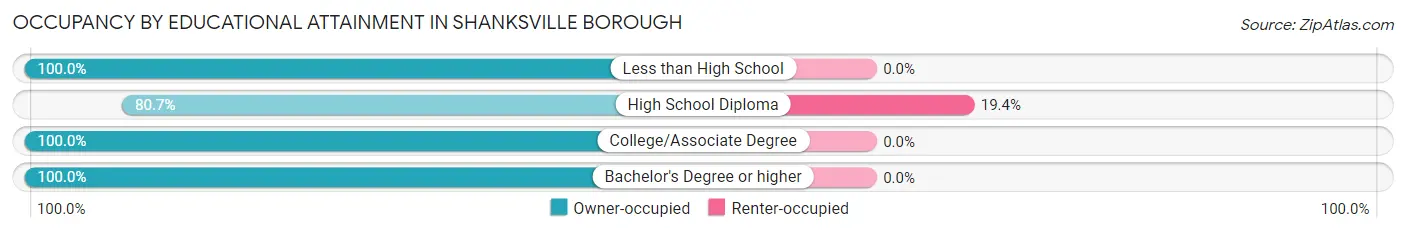
| Household Size | Owner-occupied | Renter-occupied |
| Less than High School | 7 (100.0%) | 0 (0.0%) |
| High School Diploma | 25 (80.6%) | 6 (19.4%) |
| College/Associate Degree | 17 (100.0%) | 0 (0.0%) |
| Bachelor's Degree or higher | 12 (100.0%) | 0 (0.0%) |
Occupancy by Age of Householder in Shanksville borough
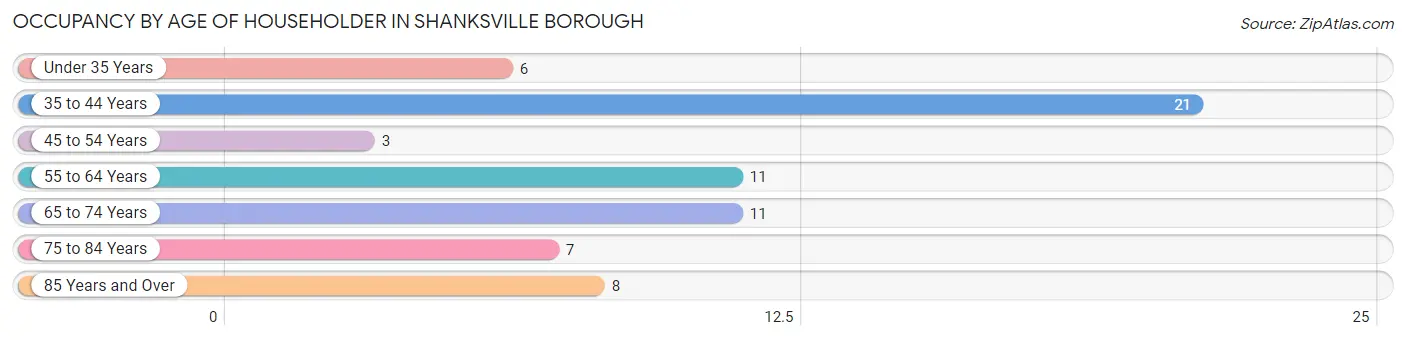
| Age Bracket | # Households | % Households |
| Under 35 Years | 6 | 9.0% |
| 35 to 44 Years | 21 | 31.3% |
| 45 to 54 Years | 3 | 4.5% |
| 55 to 64 Years | 11 | 16.4% |
| 65 to 74 Years | 11 | 16.4% |
| 75 to 84 Years | 7 | 10.4% |
| 85 Years and Over | 8 | 11.9% |
| Total | 67 | 100.0% |
Housing Finances in Shanksville borough
Median Income by Occupancy in Shanksville borough
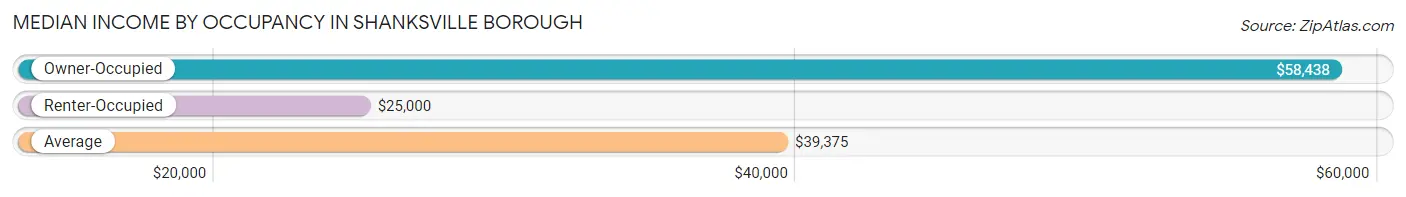
| Occupancy Type | # Households | Median Income |
| Owner-Occupied | 61 (91.0%) | $58,438 |
| Renter-Occupied | 6 (9.0%) | $25,000 |
| Average | 67 (100.0%) | $39,375 |
Occupancy by Householder Income Bracket in Shanksville borough
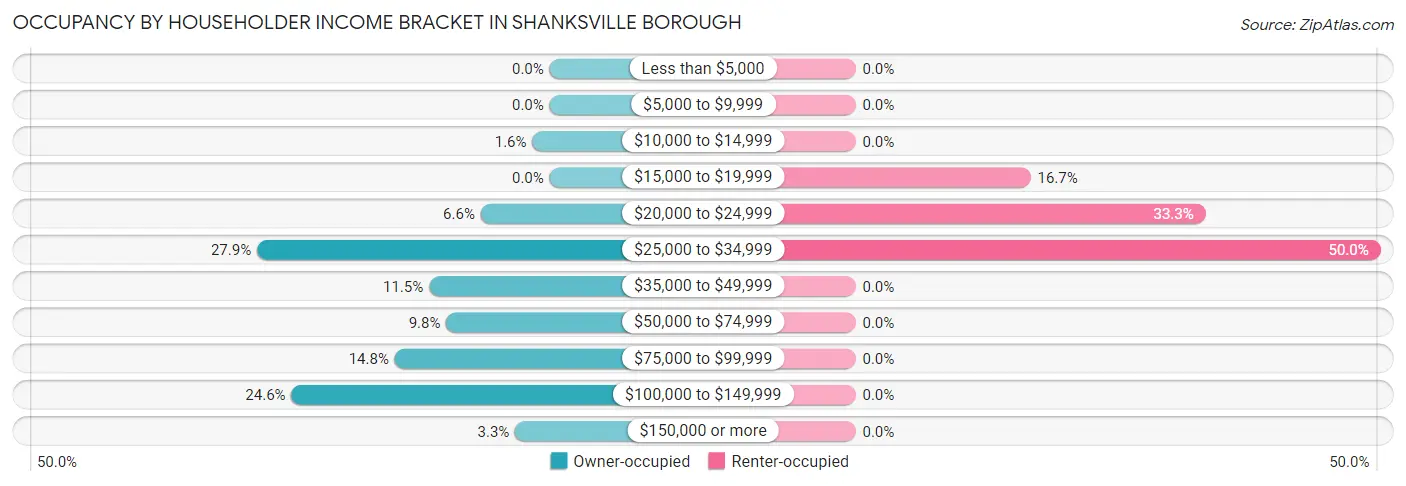
| Income Bracket | Owner-occupied | Renter-occupied |
| Less than $5,000 | 0 (0.0%) | 0 (0.0%) |
| $5,000 to $9,999 | 0 (0.0%) | 0 (0.0%) |
| $10,000 to $14,999 | 1 (1.6%) | 0 (0.0%) |
| $15,000 to $19,999 | 0 (0.0%) | 1 (16.7%) |
| $20,000 to $24,999 | 4 (6.6%) | 2 (33.3%) |
| $25,000 to $34,999 | 17 (27.9%) | 3 (50.0%) |
| $35,000 to $49,999 | 7 (11.5%) | 0 (0.0%) |
| $50,000 to $74,999 | 6 (9.8%) | 0 (0.0%) |
| $75,000 to $99,999 | 9 (14.7%) | 0 (0.0%) |
| $100,000 to $149,999 | 15 (24.6%) | 0 (0.0%) |
| $150,000 or more | 2 (3.3%) | 0 (0.0%) |
| Total | 61 (100.0%) | 6 (100.0%) |
Monthly Housing Cost Tiers in Shanksville borough
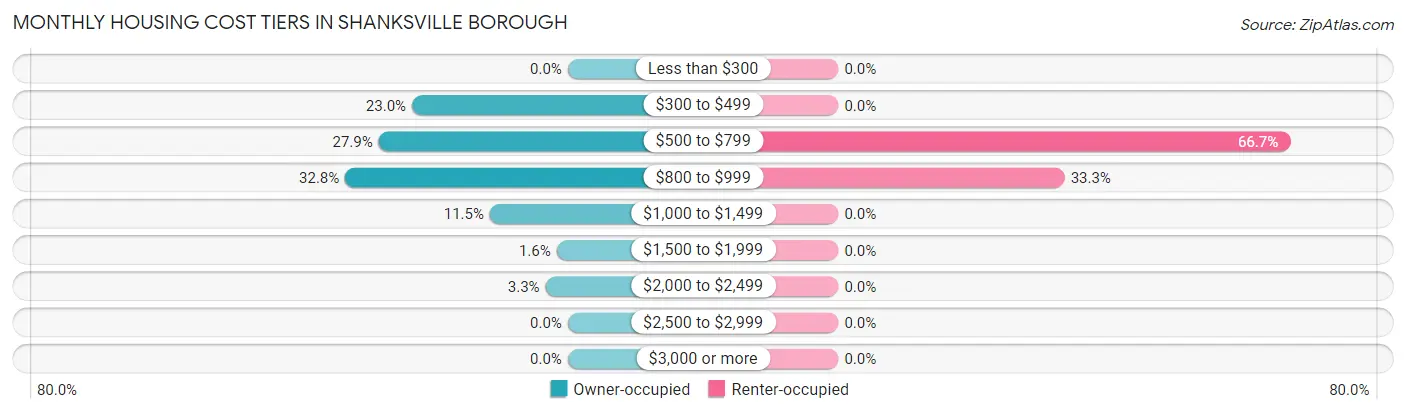
| Monthly Cost | Owner-occupied | Renter-occupied |
| Less than $300 | 0 (0.0%) | 0 (0.0%) |
| $300 to $499 | 14 (23.0%) | 0 (0.0%) |
| $500 to $799 | 17 (27.9%) | 4 (66.7%) |
| $800 to $999 | 20 (32.8%) | 2 (33.3%) |
| $1,000 to $1,499 | 7 (11.5%) | 0 (0.0%) |
| $1,500 to $1,999 | 1 (1.6%) | 0 (0.0%) |
| $2,000 to $2,499 | 2 (3.3%) | 0 (0.0%) |
| $2,500 to $2,999 | 0 (0.0%) | 0 (0.0%) |
| $3,000 or more | 0 (0.0%) | 0 (0.0%) |
| Total | 61 (100.0%) | 6 (100.0%) |
Physical Housing Characteristics in Shanksville borough
Housing Structures in Shanksville borough
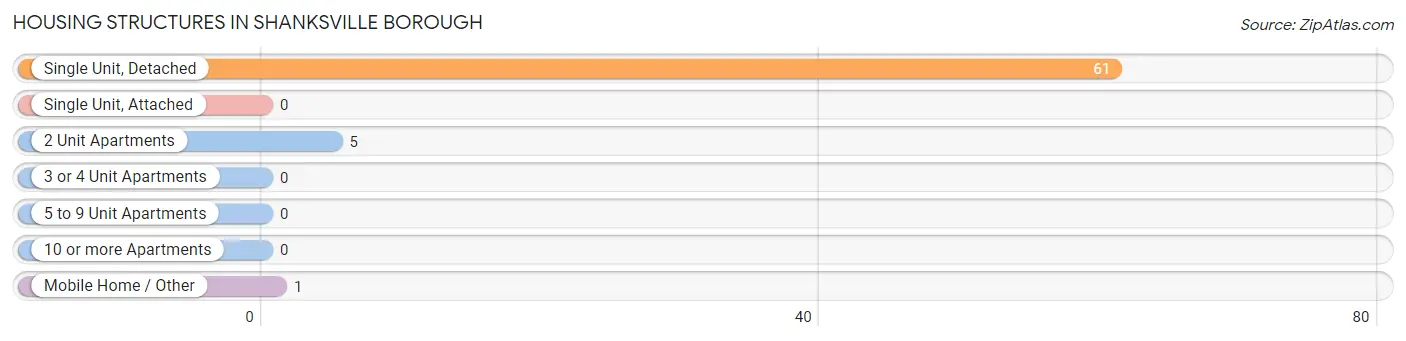
| Structure Type | # Housing Units | % Housing Units |
| Single Unit, Detached | 61 | 91.0% |
| Single Unit, Attached | 0 | 0.0% |
| 2 Unit Apartments | 5 | 7.5% |
| 3 or 4 Unit Apartments | 0 | 0.0% |
| 5 to 9 Unit Apartments | 0 | 0.0% |
| 10 or more Apartments | 0 | 0.0% |
| Mobile Home / Other | 1 | 1.5% |
| Total | 67 | 100.0% |
Housing Structures by Occupancy in Shanksville borough
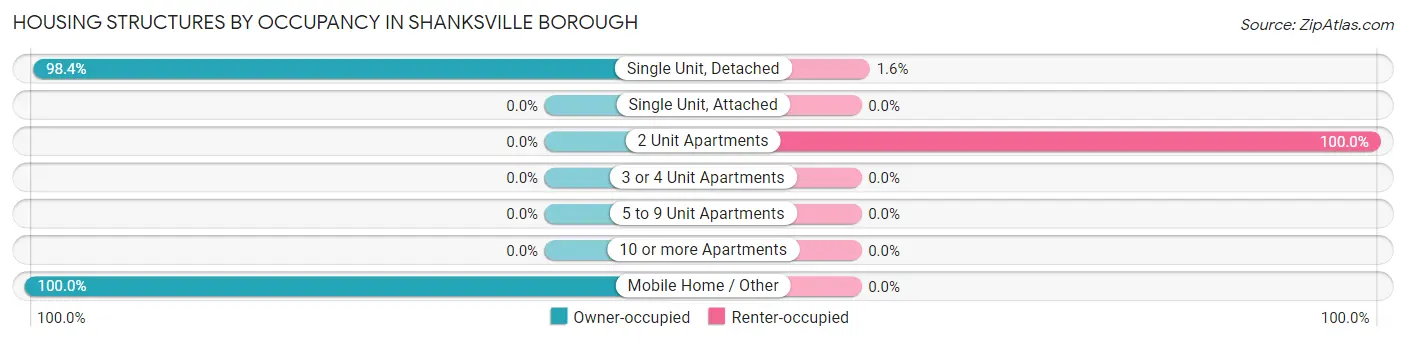
| Structure Type | Owner-occupied | Renter-occupied |
| Single Unit, Detached | 60 (98.4%) | 1 (1.6%) |
| Single Unit, Attached | 0 (0.0%) | 0 (0.0%) |
| 2 Unit Apartments | 0 (0.0%) | 5 (100.0%) |
| 3 or 4 Unit Apartments | 0 (0.0%) | 0 (0.0%) |
| 5 to 9 Unit Apartments | 0 (0.0%) | 0 (0.0%) |
| 10 or more Apartments | 0 (0.0%) | 0 (0.0%) |
| Mobile Home / Other | 1 (100.0%) | 0 (0.0%) |
| Total | 61 (91.0%) | 6 (9.0%) |
Housing Structures by Number of Rooms in Shanksville borough
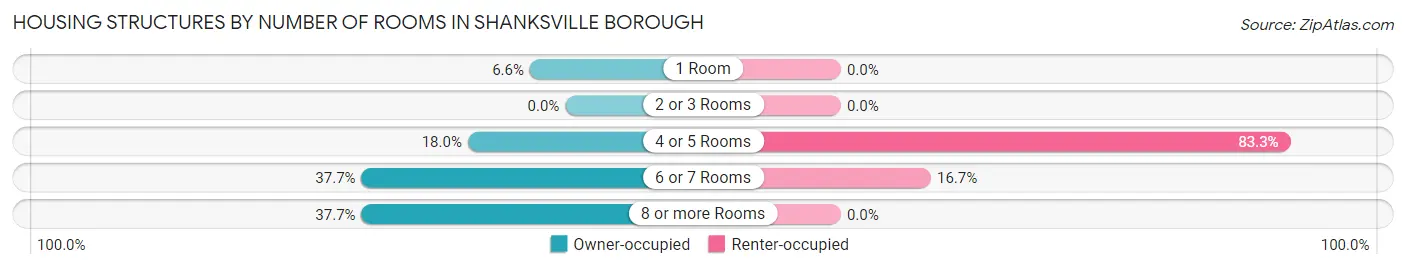
| Number of Rooms | Owner-occupied | Renter-occupied |
| 1 Room | 4 (6.6%) | 0 (0.0%) |
| 2 or 3 Rooms | 0 (0.0%) | 0 (0.0%) |
| 4 or 5 Rooms | 11 (18.0%) | 5 (83.3%) |
| 6 or 7 Rooms | 23 (37.7%) | 1 (16.7%) |
| 8 or more Rooms | 23 (37.7%) | 0 (0.0%) |
| Total | 61 (100.0%) | 6 (100.0%) |
Housing Structure by Heating Type in Shanksville borough
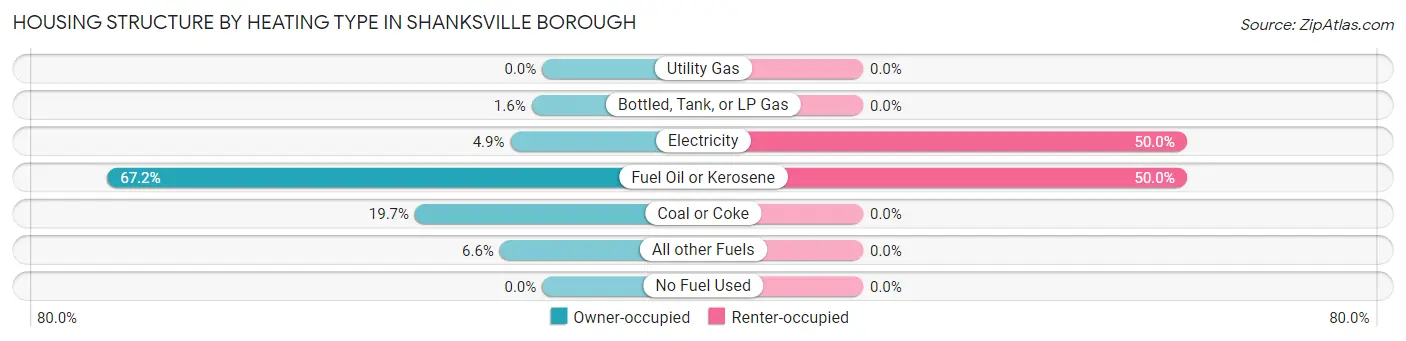
| Heating Type | Owner-occupied | Renter-occupied |
| Utility Gas | 0 (0.0%) | 0 (0.0%) |
| Bottled, Tank, or LP Gas | 1 (1.6%) | 0 (0.0%) |
| Electricity | 3 (4.9%) | 3 (50.0%) |
| Fuel Oil or Kerosene | 41 (67.2%) | 3 (50.0%) |
| Coal or Coke | 12 (19.7%) | 0 (0.0%) |
| All other Fuels | 4 (6.6%) | 0 (0.0%) |
| No Fuel Used | 0 (0.0%) | 0 (0.0%) |
| Total | 61 (100.0%) | 6 (100.0%) |
Household Vehicle Usage in Shanksville borough
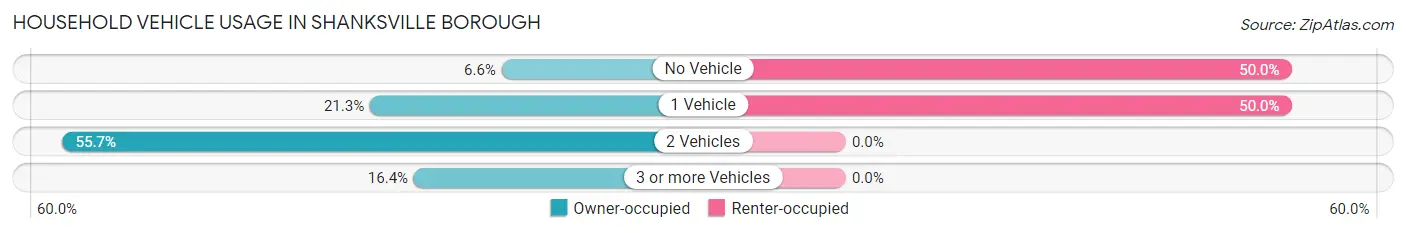
| Vehicles per Household | Owner-occupied | Renter-occupied |
| No Vehicle | 4 (6.6%) | 3 (50.0%) |
| 1 Vehicle | 13 (21.3%) | 3 (50.0%) |
| 2 Vehicles | 34 (55.7%) | 0 (0.0%) |
| 3 or more Vehicles | 10 (16.4%) | 0 (0.0%) |
| Total | 61 (100.0%) | 6 (100.0%) |
Real Estate & Mortgages in Shanksville borough
Real Estate and Mortgage Overview in Shanksville borough
| Characteristic | Without Mortgage | With Mortgage |
| Housing Units | 30 | 31 |
| Median Property Value | $86,400 | $103,100 |
| Median Household Income | - | - |
| Monthly Housing Costs | $514 | $0 |
| Real Estate Taxes | $1,179 | $0 |
Property Value by Mortgage Status in Shanksville borough
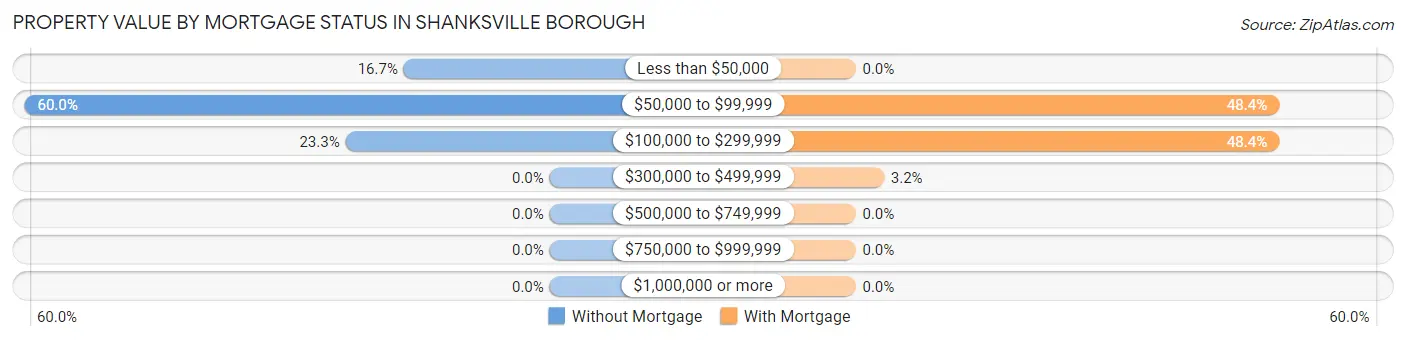
| Property Value | Without Mortgage | With Mortgage |
| Less than $50,000 | 5 (16.7%) | 0 (0.0%) |
| $50,000 to $99,999 | 18 (60.0%) | 15 (48.4%) |
| $100,000 to $299,999 | 7 (23.3%) | 15 (48.4%) |
| $300,000 to $499,999 | 0 (0.0%) | 1 (3.2%) |
| $500,000 to $749,999 | 0 (0.0%) | 0 (0.0%) |
| $750,000 to $999,999 | 0 (0.0%) | 0 (0.0%) |
| $1,000,000 or more | 0 (0.0%) | 0 (0.0%) |
| Total | 30 (100.0%) | 31 (100.0%) |
Household Income by Mortgage Status in Shanksville borough
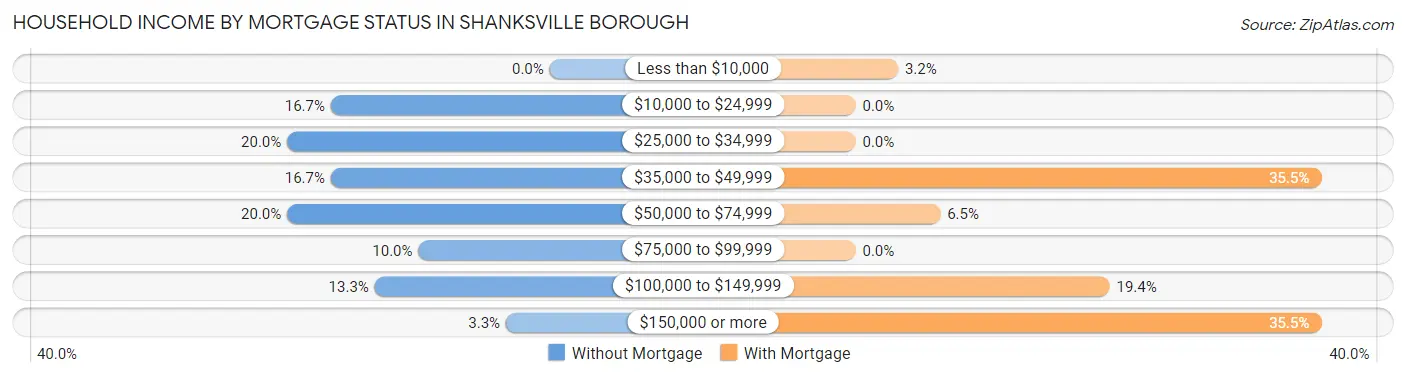
| Household Income | Without Mortgage | With Mortgage |
| Less than $10,000 | 0 (0.0%) | 1 (3.2%) |
| $10,000 to $24,999 | 5 (16.7%) | 0 (0.0%) |
| $25,000 to $34,999 | 6 (20.0%) | 0 (0.0%) |
| $35,000 to $49,999 | 5 (16.7%) | 11 (35.5%) |
| $50,000 to $74,999 | 6 (20.0%) | 2 (6.5%) |
| $75,000 to $99,999 | 3 (10.0%) | 0 (0.0%) |
| $100,000 to $149,999 | 4 (13.3%) | 6 (19.4%) |
| $150,000 or more | 1 (3.3%) | 11 (35.5%) |
| Total | 30 (100.0%) | 31 (100.0%) |
Property Value to Household Income Ratio in Shanksville borough
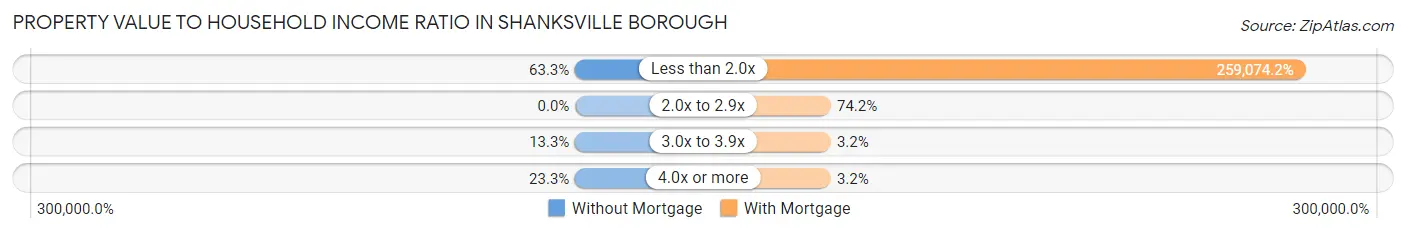
| Value-to-Income Ratio | Without Mortgage | With Mortgage |
| Less than 2.0x | 19 (63.3%) | 80,313 (259,074.2%) |
| 2.0x to 2.9x | 0 (0.0%) | 23 (74.2%) |
| 3.0x to 3.9x | 4 (13.3%) | 1 (3.2%) |
| 4.0x or more | 7 (23.3%) | 1 (3.2%) |
| Total | 30 (100.0%) | 31 (100.0%) |
Real Estate Taxes by Mortgage Status in Shanksville borough
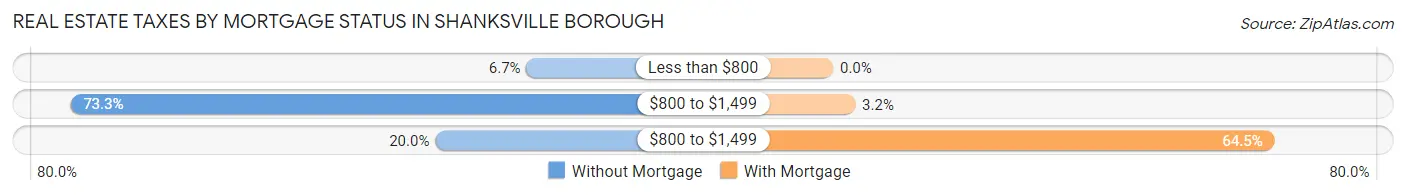
| Property Taxes | Without Mortgage | With Mortgage |
| Less than $800 | 2 (6.7%) | 0 (0.0%) |
| $800 to $1,499 | 22 (73.3%) | 1 (3.2%) |
| $800 to $1,499 | 6 (20.0%) | 20 (64.5%) |
| Total | 30 (100.0%) | 31 (100.0%) |
Health & Disability in Shanksville borough
Health Insurance Coverage by Age in Shanksville borough
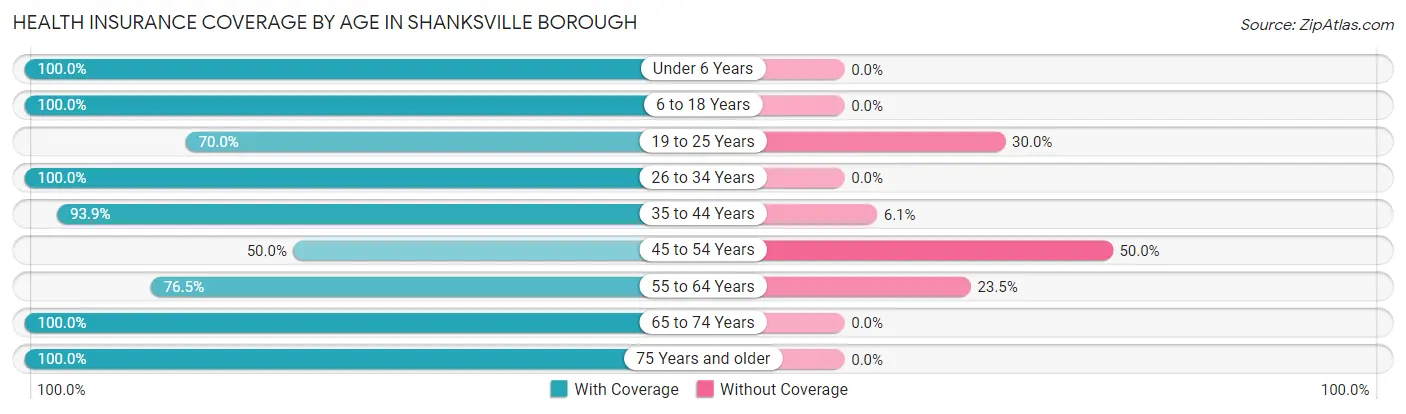
| Age Bracket | With Coverage | Without Coverage |
| Under 6 Years | 5 (100.0%) | 0 (0.0%) |
| 6 to 18 Years | 34 (100.0%) | 0 (0.0%) |
| 19 to 25 Years | 7 (70.0%) | 3 (30.0%) |
| 26 to 34 Years | 16 (100.0%) | 0 (0.0%) |
| 35 to 44 Years | 31 (93.9%) | 2 (6.1%) |
| 45 to 54 Years | 6 (50.0%) | 6 (50.0%) |
| 55 to 64 Years | 13 (76.5%) | 4 (23.5%) |
| 65 to 74 Years | 20 (100.0%) | 0 (0.0%) |
| 75 Years and older | 19 (100.0%) | 0 (0.0%) |
| Total | 151 (91.0%) | 15 (9.0%) |
Health Insurance Coverage by Citizenship Status in Shanksville borough
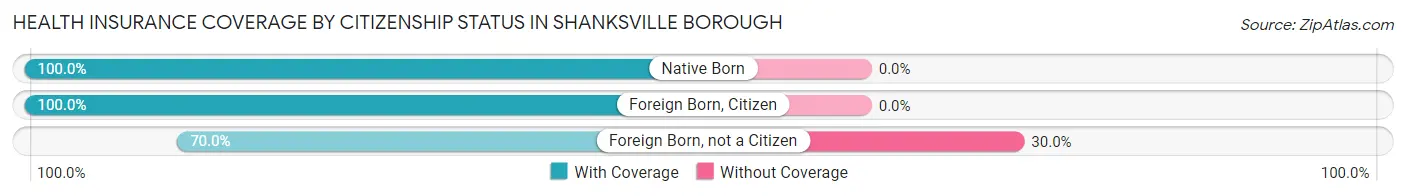
| Citizenship Status | With Coverage | Without Coverage |
| Native Born | 5 (100.0%) | 0 (0.0%) |
| Foreign Born, Citizen | 34 (100.0%) | 0 (0.0%) |
| Foreign Born, not a Citizen | 7 (70.0%) | 3 (30.0%) |
Health Insurance Coverage by Household Income in Shanksville borough
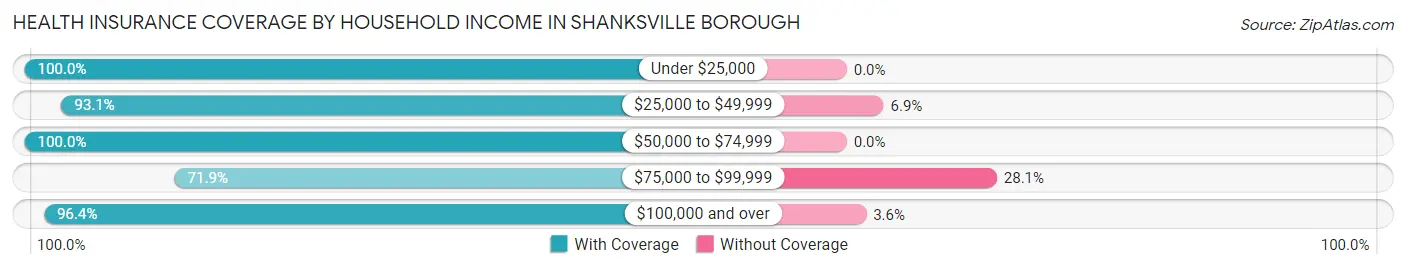
| Household Income | With Coverage | Without Coverage |
| Under $25,000 | 9 (100.0%) | 0 (0.0%) |
| $25,000 to $49,999 | 54 (93.1%) | 4 (6.9%) |
| $50,000 to $74,999 | 12 (100.0%) | 0 (0.0%) |
| $75,000 to $99,999 | 23 (71.9%) | 9 (28.1%) |
| $100,000 and over | 53 (96.4%) | 2 (3.6%) |
Public vs Private Health Insurance Coverage by Age in Shanksville borough
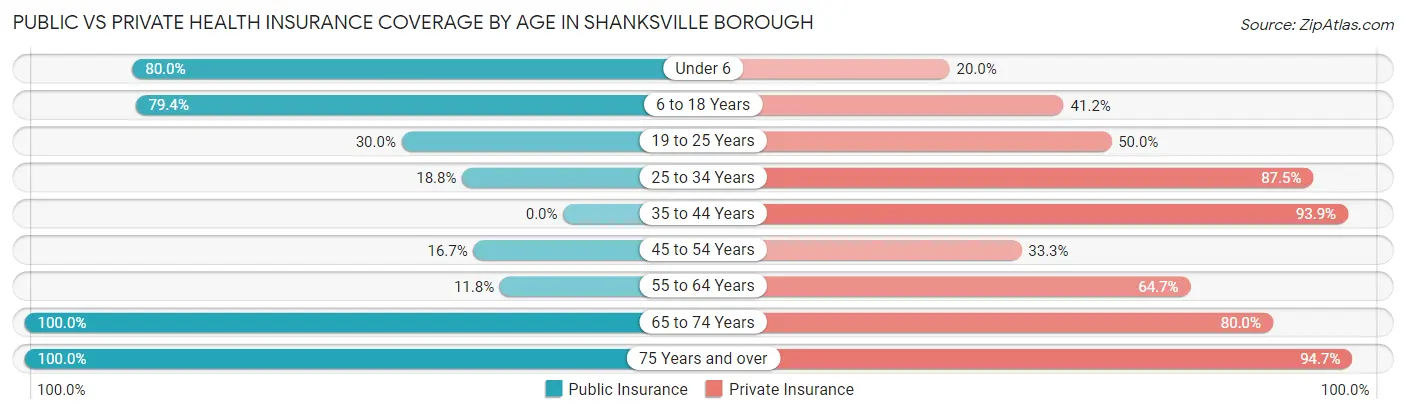
| Age Bracket | Public Insurance | Private Insurance |
| Under 6 | 4 (80.0%) | 1 (20.0%) |
| 6 to 18 Years | 27 (79.4%) | 14 (41.2%) |
| 19 to 25 Years | 3 (30.0%) | 5 (50.0%) |
| 25 to 34 Years | 3 (18.8%) | 14 (87.5%) |
| 35 to 44 Years | 0 (0.0%) | 31 (93.9%) |
| 45 to 54 Years | 2 (16.7%) | 4 (33.3%) |
| 55 to 64 Years | 2 (11.8%) | 11 (64.7%) |
| 65 to 74 Years | 20 (100.0%) | 16 (80.0%) |
| 75 Years and over | 19 (100.0%) | 18 (94.7%) |
| Total | 80 (48.2%) | 114 (68.7%) |
Disability Status by Sex by Age in Shanksville borough
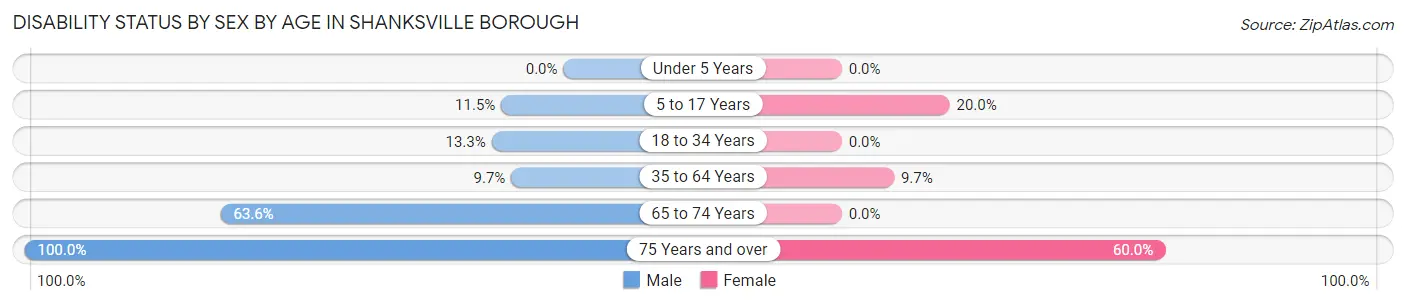
| Age Bracket | Male | Female |
| Under 5 Years | 0 (0.0%) | 0 (0.0%) |
| 5 to 17 Years | 3 (11.5%) | 2 (20.0%) |
| 18 to 34 Years | 2 (13.3%) | 0 (0.0%) |
| 35 to 64 Years | 3 (9.7%) | 3 (9.7%) |
| 65 to 74 Years | 7 (63.6%) | 0 (0.0%) |
| 75 Years and over | 4 (100.0%) | 9 (60.0%) |
Disability Class by Sex by Age in Shanksville borough
Disability Class: Hearing Difficulty
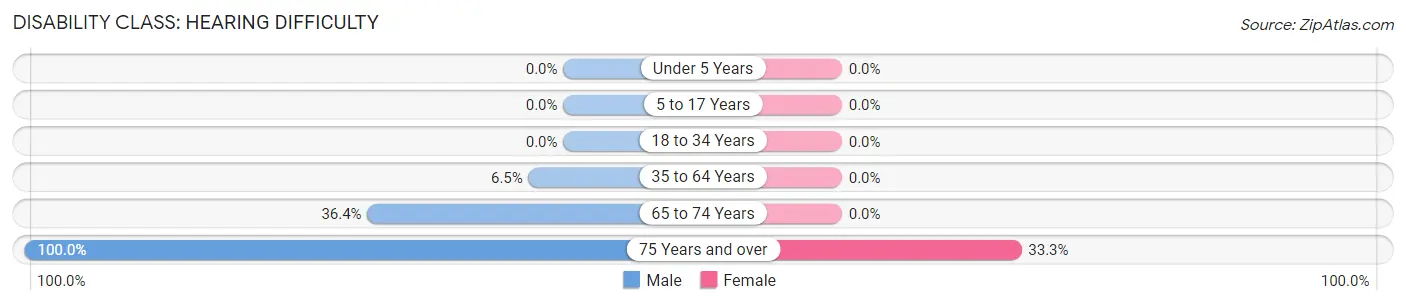
| Age Bracket | Male | Female |
| Under 5 Years | 0 (0.0%) | 0 (0.0%) |
| 5 to 17 Years | 0 (0.0%) | 0 (0.0%) |
| 18 to 34 Years | 0 (0.0%) | 0 (0.0%) |
| 35 to 64 Years | 2 (6.5%) | 0 (0.0%) |
| 65 to 74 Years | 4 (36.4%) | 0 (0.0%) |
| 75 Years and over | 4 (100.0%) | 5 (33.3%) |
Disability Class: Vision Difficulty
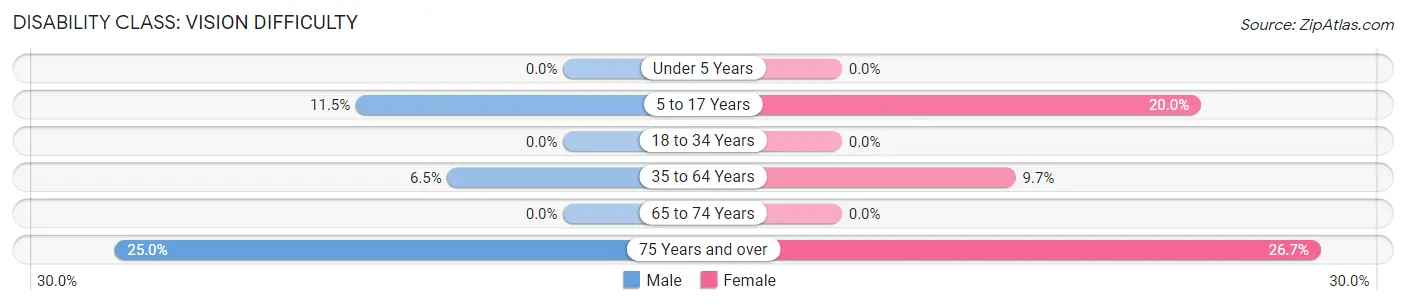
| Age Bracket | Male | Female |
| Under 5 Years | 0 (0.0%) | 0 (0.0%) |
| 5 to 17 Years | 3 (11.5%) | 2 (20.0%) |
| 18 to 34 Years | 0 (0.0%) | 0 (0.0%) |
| 35 to 64 Years | 2 (6.5%) | 3 (9.7%) |
| 65 to 74 Years | 0 (0.0%) | 0 (0.0%) |
| 75 Years and over | 1 (25.0%) | 4 (26.7%) |
Disability Class: Cognitive Difficulty
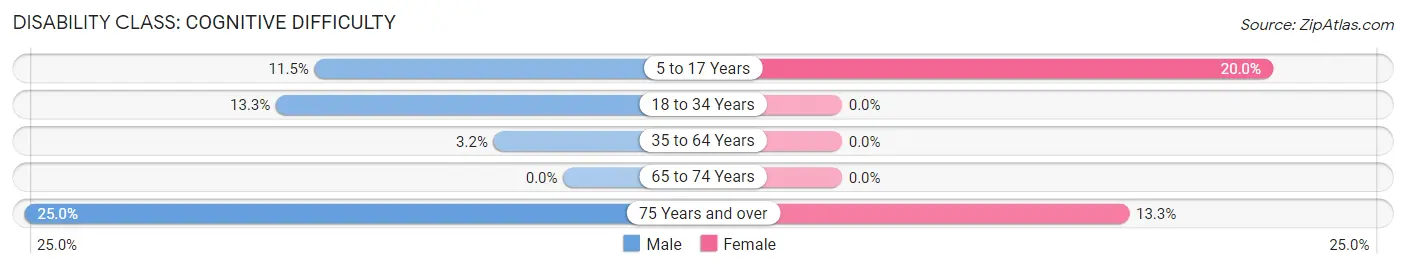
| Age Bracket | Male | Female |
| 5 to 17 Years | 3 (11.5%) | 2 (20.0%) |
| 18 to 34 Years | 2 (13.3%) | 0 (0.0%) |
| 35 to 64 Years | 1 (3.2%) | 0 (0.0%) |
| 65 to 74 Years | 0 (0.0%) | 0 (0.0%) |
| 75 Years and over | 1 (25.0%) | 2 (13.3%) |
Disability Class: Ambulatory Difficulty
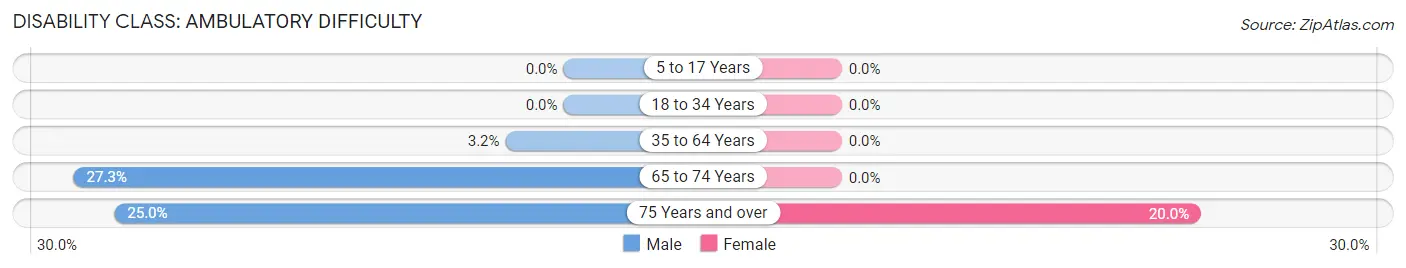
| Age Bracket | Male | Female |
| 5 to 17 Years | 0 (0.0%) | 0 (0.0%) |
| 18 to 34 Years | 0 (0.0%) | 0 (0.0%) |
| 35 to 64 Years | 1 (3.2%) | 0 (0.0%) |
| 65 to 74 Years | 3 (27.3%) | 0 (0.0%) |
| 75 Years and over | 1 (25.0%) | 3 (20.0%) |
Disability Class: Self-Care Difficulty
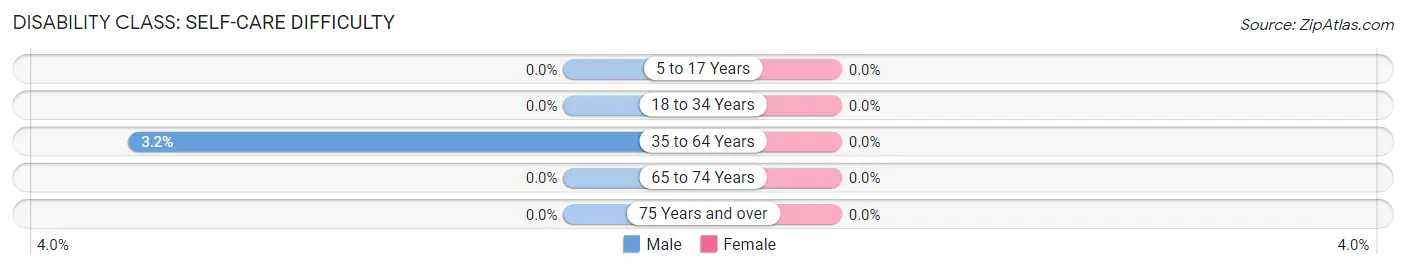
| Age Bracket | Male | Female |
| 5 to 17 Years | 0 (0.0%) | 0 (0.0%) |
| 18 to 34 Years | 0 (0.0%) | 0 (0.0%) |
| 35 to 64 Years | 1 (3.2%) | 0 (0.0%) |
| 65 to 74 Years | 0 (0.0%) | 0 (0.0%) |
| 75 Years and over | 0 (0.0%) | 0 (0.0%) |
Technology Access in Shanksville borough
Computing Device Access in Shanksville borough
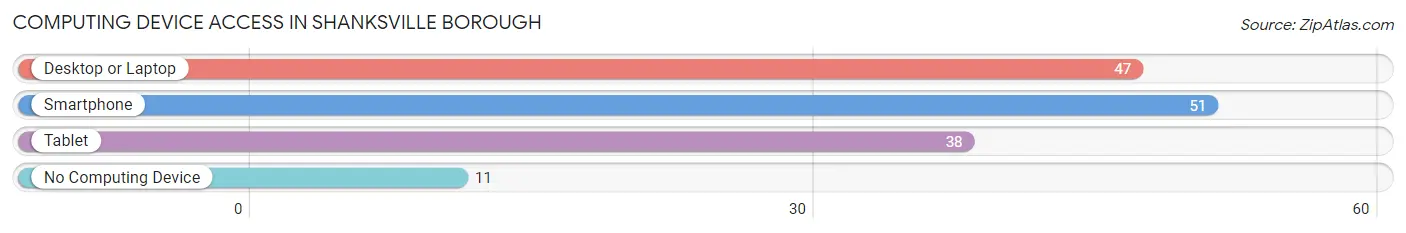
| Device Type | # Households | % Households |
| Desktop or Laptop | 47 | 70.2% |
| Smartphone | 51 | 76.1% |
| Tablet | 38 | 56.7% |
| No Computing Device | 11 | 16.4% |
| Total | 67 | 100.0% |
Internet Access in Shanksville borough
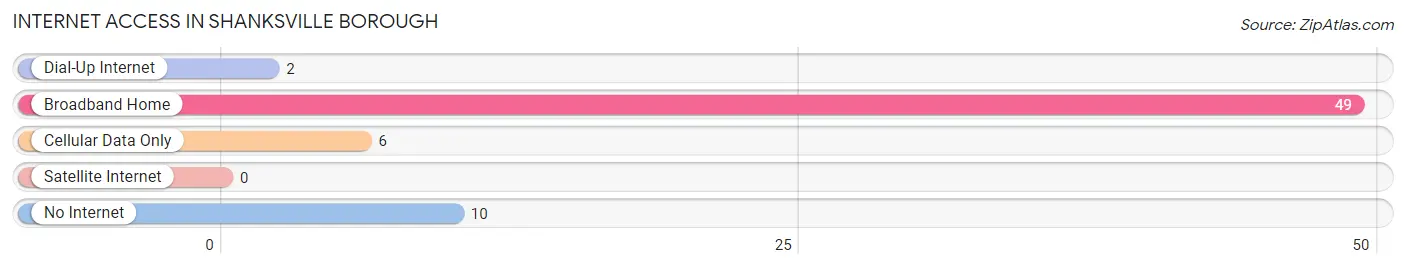
| Internet Type | # Households | % Households |
| Dial-Up Internet | 2 | 3.0% |
| Broadband Home | 49 | 73.1% |
| Cellular Data Only | 6 | 9.0% |
| Satellite Internet | 0 | 0.0% |
| No Internet | 10 | 14.9% |
| Total | 67 | 100.0% |
Shanksville borough Summary
Shanksville Borough is a small borough located in Somerset County, Pennsylvania. It is situated in the foothills of the Allegheny Mountains, approximately 70 miles southeast of Pittsburgh. The borough is home to a population of approximately 250 people, and is known for its rural charm and small-town atmosphere.
History
Shanksville Borough was founded in 1845 by John Shanks, a local farmer. The borough was originally known as Shanksville Station, and was a stop on the Somerset and Cambria Railroad. The railroad was built in the late 1840s to connect the towns of Somerset and Cambria. The railroad was a major factor in the growth of the borough, as it allowed for the transportation of goods and people to and from the area.
In the late 19th century, the borough began to experience a period of growth and development. The population increased from just over 200 in 1880 to nearly 500 by 1900. During this time, the borough saw the construction of several churches, a school, and a post office.
Geography
Shanksville Borough is located in the foothills of the Allegheny Mountains in Somerset County, Pennsylvania. The borough is situated on the banks of the Stonycreek River, which flows through the borough and is a major source of recreation for the area. The borough is surrounded by a number of small towns and villages, including Stoystown, Hooversville, and Indian Lake.
The borough is located approximately 70 miles southeast of Pittsburgh, and is accessible via the Pennsylvania Turnpike and US Route 30. The borough is also served by the Somerset County Airport, which is located just outside of the borough limits.
Economy
The economy of Shanksville Borough is largely based on agriculture and tourism. The borough is home to a number of small farms, which produce a variety of crops, including corn, soybeans, and hay. The borough is also home to a number of small businesses, including restaurants, shops, and a local winery.
Tourism is a major part of the borough’s economy, as it is home to a number of attractions, including the Flight 93 National Memorial, which commemorates the victims of the September 11th terrorist attacks. The memorial is located on the site of the crash of United Airlines Flight 93, which crashed in a field near the borough on September 11th, 2001.
Demographics
As of the 2010 census, the population of Shanksville Borough was 250 people. The racial makeup of the borough was 97.2% White, 0.8% African American, 0.4% Native American, 0.4% Asian, and 1.2% from other races. The median household income was $41,250, and the median family income was $45,833.
The borough is home to a number of churches, including the Shanksville United Methodist Church, the Shanksville Presbyterian Church, and the Shanksville Lutheran Church. The borough is also home to a number of schools, including the Shanksville-Stonycreek Elementary School and the Shanksville-Stonycreek High School.
Conclusion
Shanksville Borough is a small borough located in Somerset County, Pennsylvania. It is situated in the foothills of the Allegheny Mountains, approximately 70 miles southeast of Pittsburgh. The borough is home to a population of approximately 250 people, and is known for its rural charm and small-town atmosphere. The economy of the borough is largely based on agriculture and tourism, and the borough is home to a number of attractions, including the Flight 93 National Memorial. The borough is also home to a number of churches and schools, and is served by the Somerset County Airport.
Common Questions
What is Per Capita Income in Shanksville borough?
Per Capita income in Shanksville borough is $27,098.
What is the Median Family Income in Shanksville borough?
Median Family Income in Shanksville borough is $76,250.
What is the Median Household income in Shanksville borough?
Median Household Income in Shanksville borough is $39,375.
What is Income or Wage Gap in Shanksville borough?
Income or Wage Gap in Shanksville borough is 7.2%.
Women in Shanksville borough earn 92.8 cents for every dollar earned by a man.
What is Inequality or Gini Index in Shanksville borough?
Inequality or Gini Index in Shanksville borough is 0.36.
What is the Total Population of Shanksville borough?
Total Population of Shanksville borough is 166.
What is the Total Male Population of Shanksville borough?
Total Male Population of Shanksville borough is 88.
What is the Total Female Population of Shanksville borough?
Total Female Population of Shanksville borough is 78.
What is the Ratio of Males per 100 Females in Shanksville borough?
There are 112.82 Males per 100 Females in Shanksville borough.
What is the Ratio of Females per 100 Males in Shanksville borough?
There are 88.64 Females per 100 Males in Shanksville borough.
What is the Median Population Age in Shanksville borough?
Median Population Age in Shanksville borough is 40.8 Years.
What is the Average Family Size in Shanksville borough
Average Family Size in Shanksville borough is 3.0 People.
What is the Average Household Size in Shanksville borough
Average Household Size in Shanksville borough is 2.5 People.
How Large is the Labor Force in Shanksville borough?
There are 88 People in the Labor Forcein in Shanksville borough.
What is the Percentage of People in the Labor Force in Shanksville borough?
67.7% of People are in the Labor Force in Shanksville borough.
What is the Unemployment Rate in Shanksville borough?
Unemployment Rate in Shanksville borough is 2.3%.