Collingdale borough, PA Map & Demographics
Collingdale borough Overview
$24,726
PER CAPITA INCOME
$65,264
AVG FAMILY INCOME
$49,819
AVG HOUSEHOLD INCOME
9.3%
WAGE / INCOME GAP [ % ]
90.7¢/ $1
WAGE / INCOME GAP [ $ ]
0.44
INEQUALITY / GINI INDEX
8,865
TOTAL POPULATION
4,039
MALE POPULATION
4,826
FEMALE POPULATION
83.69
MALES / 100 FEMALES
119.49
FEMALES / 100 MALES
36.5
MEDIAN AGE
3.4
AVG FAMILY SIZE
2.6
AVG HOUSEHOLD SIZE
4,615
LABOR FORCE [ PEOPLE ]
64.5%
PERCENT IN LABOR FORCE
8.6%
UNEMPLOYMENT RATE
Income in Collingdale borough
Income Overview in Collingdale borough
Per Capita Income in Collingdale borough is $24,726, while median incomes of families and households are $65,264 and $49,819 respectively.
| Characteristic | Number | Measure |
| Per Capita Income | 8,865 | $24,726 |
| Median Family Income | 2,021 | $65,264 |
| Mean Family Income | 2,021 | $72,897 |
| Median Household Income | 3,395 | $49,819 |
| Mean Household Income | 3,395 | $62,842 |
| Income Deficit | 2,021 | $0 |
| Wage / Income Gap (%) | 8,865 | 9.31% |
| Wage / Income Gap ($) | 8,865 | 90.69¢ per $1 |
| Gini / Inequality Index | 8,865 | 0.44 |
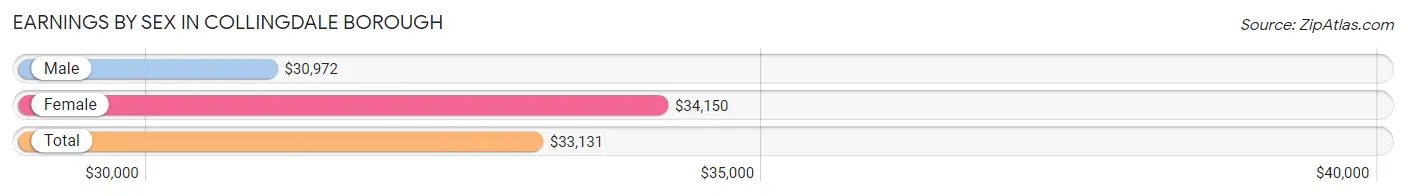
Earnings by Sex in Collingdale borough
Average Earnings in Collingdale borough are $33,131, $30,972 for men and $34,150 for women, a difference of 9.3%.
| Sex | Number | Average Earnings |
| Male | 2,044 (43.4%) | $30,972 |
| Female | 2,668 (56.6%) | $34,150 |
| Total | 4,712 (100.0%) | $33,131 |
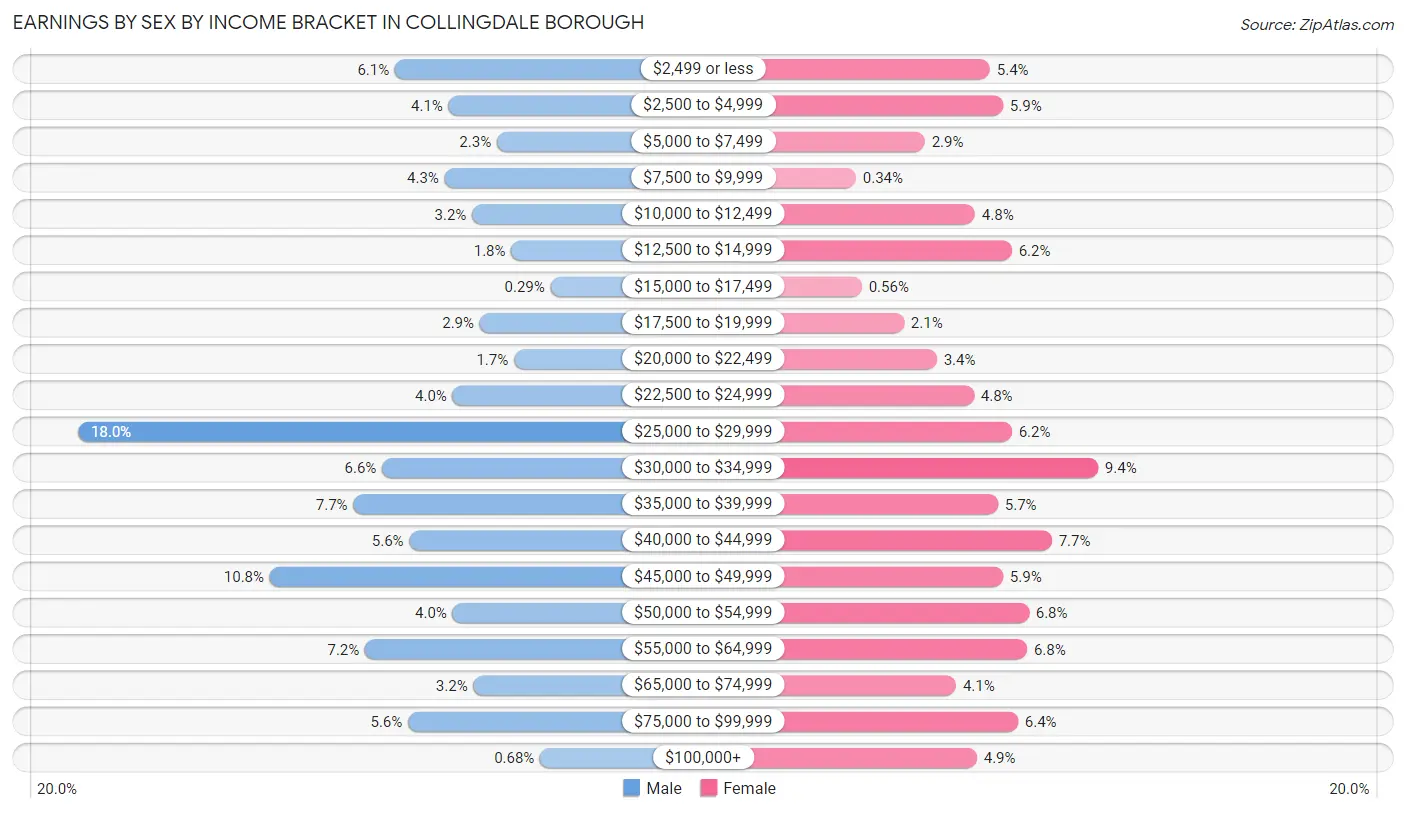
Earnings by Sex by Income Bracket in Collingdale borough
The most common earnings brackets in Collingdale borough are $25,000 to $29,999 for men (368 | 18.0%) and $30,000 to $34,999 for women (251 | 9.4%).
| Income | Male | Female |
| $2,499 or less | 125 (6.1%) | 143 (5.4%) |
| $2,500 to $4,999 | 84 (4.1%) | 156 (5.9%) |
| $5,000 to $7,499 | 47 (2.3%) | 78 (2.9%) |
| $7,500 to $9,999 | 87 (4.3%) | 9 (0.3%) |
| $10,000 to $12,499 | 66 (3.2%) | 128 (4.8%) |
| $12,500 to $14,999 | 36 (1.8%) | 165 (6.2%) |
| $15,000 to $17,499 | 6 (0.3%) | 15 (0.6%) |
| $17,500 to $19,999 | 60 (2.9%) | 57 (2.1%) |
| $20,000 to $22,499 | 34 (1.7%) | 90 (3.4%) |
| $22,500 to $24,999 | 81 (4.0%) | 127 (4.8%) |
| $25,000 to $29,999 | 368 (18.0%) | 165 (6.2%) |
| $30,000 to $34,999 | 135 (6.6%) | 251 (9.4%) |
| $35,000 to $39,999 | 157 (7.7%) | 151 (5.7%) |
| $40,000 to $44,999 | 114 (5.6%) | 205 (7.7%) |
| $45,000 to $49,999 | 221 (10.8%) | 156 (5.9%) |
| $50,000 to $54,999 | 81 (4.0%) | 182 (6.8%) |
| $55,000 to $64,999 | 148 (7.2%) | 180 (6.8%) |
| $65,000 to $74,999 | 65 (3.2%) | 109 (4.1%) |
| $75,000 to $99,999 | 115 (5.6%) | 171 (6.4%) |
| $100,000+ | 14 (0.7%) | 130 (4.9%) |
| Total | 2,044 (100.0%) | 2,668 (100.0%) |
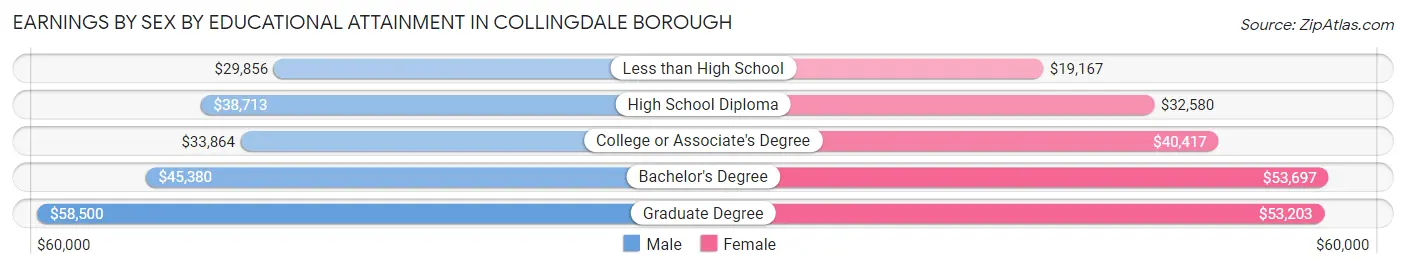
Earnings by Sex by Educational Attainment in Collingdale borough
Average earnings in Collingdale borough are $35,631 for men and $37,113 for women, a difference of 4.0%. Men with an educational attainment of graduate degree enjoy the highest average annual earnings of $58,500, while those with less than high school education earn the least with $29,856. Women with an educational attainment of bachelor's degree earn the most with the average annual earnings of $53,697, while those with less than high school education have the smallest earnings of $19,167.
| Educational Attainment | Male Income | Female Income |
| Less than High School | $29,856 | $19,167 |
| High School Diploma | $38,713 | $32,580 |
| College or Associate's Degree | $33,864 | $40,417 |
| Bachelor's Degree | $45,380 | $53,697 |
| Graduate Degree | $58,500 | $53,203 |
| Total | $35,631 | $37,113 |
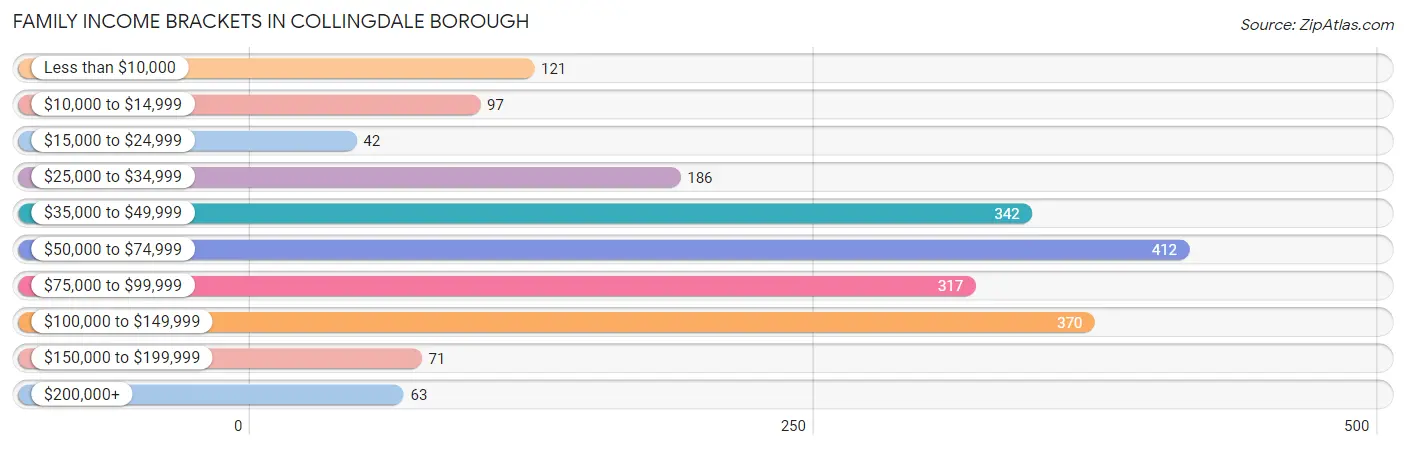
Family Income in Collingdale borough
Family Income Brackets in Collingdale borough
According to the Collingdale borough family income data, there are 412 families falling into the $50,000 to $74,999 income range, which is the most common income bracket and makes up 20.4% of all families. Conversely, the $15,000 to $24,999 income bracket is the least frequent group with only 42 families (2.1%) belonging to this category.
| Income Bracket | # Families | % Families |
| Less than $10,000 | 121 | 6.0% |
| $10,000 to $14,999 | 97 | 4.8% |
| $15,000 to $24,999 | 42 | 2.1% |
| $25,000 to $34,999 | 186 | 9.2% |
| $35,000 to $49,999 | 342 | 16.9% |
| $50,000 to $74,999 | 412 | 20.4% |
| $75,000 to $99,999 | 317 | 15.7% |
| $100,000 to $149,999 | 370 | 18.3% |
| $150,000 to $199,999 | 71 | 3.5% |
| $200,000+ | 63 | 3.1% |
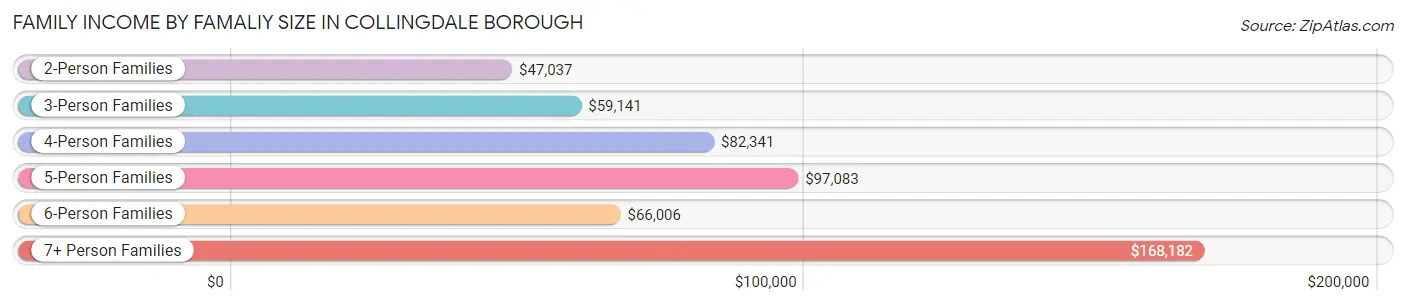
Family Income by Famaliy Size in Collingdale borough
7+ person families (82 | 4.1%) account for the highest median family income in Collingdale borough with $168,182 per family, while 7+ person families (82 | 4.1%) have the highest median income of $24,026 per family member.
| Income Bracket | # Families | Median Income |
| 2-Person Families | 792 (39.2%) | $47,037 |
| 3-Person Families | 582 (28.8%) | $59,141 |
| 4-Person Families | 242 (12.0%) | $82,341 |
| 5-Person Families | 128 (6.3%) | $97,083 |
| 6-Person Families | 195 (9.7%) | $66,006 |
| 7+ Person Families | 82 (4.1%) | $168,182 |
| Total | 2,021 (100.0%) | $65,264 |
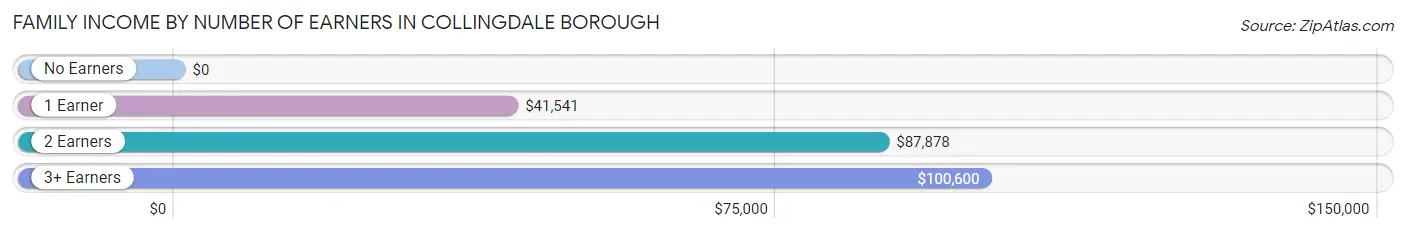
Family Income by Number of Earners in Collingdale borough
| Number of Earners | # Families | Median Income |
| No Earners | 175 (8.7%) | $0 |
| 1 Earner | 783 (38.7%) | $41,541 |
| 2 Earners | 665 (32.9%) | $87,878 |
| 3+ Earners | 398 (19.7%) | $100,600 |
| Total | 2,021 (100.0%) | $65,264 |
Household Income in Collingdale borough
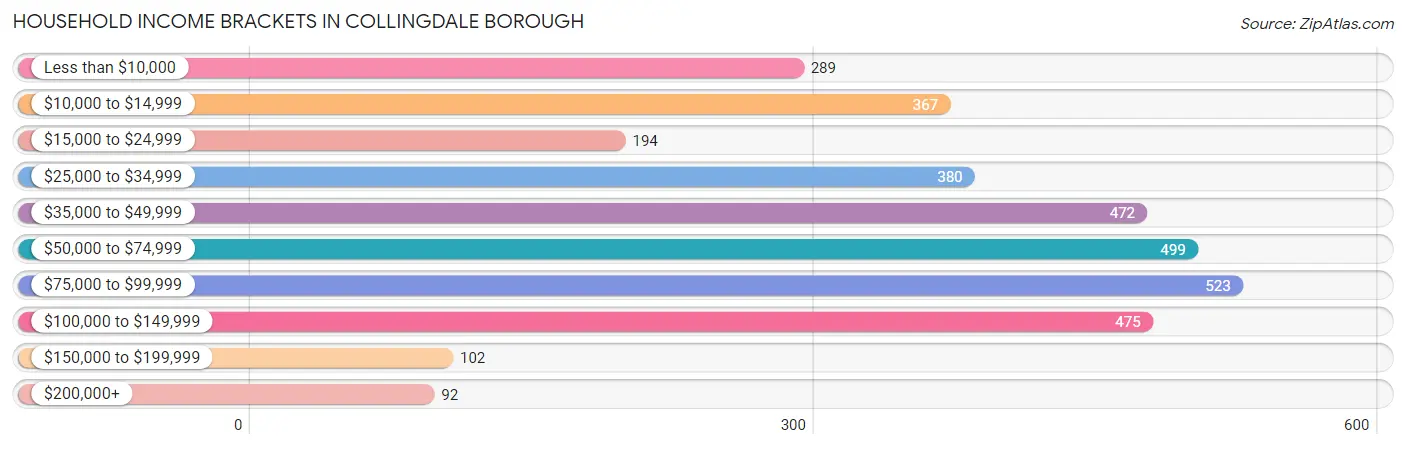
Household Income Brackets in Collingdale borough
With 523 households falling in the category, the $75,000 to $99,999 income range is the most frequent in Collingdale borough, accounting for 15.4% of all households. In contrast, only 92 households (2.7%) fall into the $200,000+ income bracket, making it the least populous group.
| Income Bracket | # Households | % Households |
| Less than $10,000 | 289 | 8.5% |
| $10,000 to $14,999 | 367 | 10.8% |
| $15,000 to $24,999 | 194 | 5.7% |
| $25,000 to $34,999 | 380 | 11.2% |
| $35,000 to $49,999 | 472 | 13.9% |
| $50,000 to $74,999 | 499 | 14.7% |
| $75,000 to $99,999 | 523 | 15.4% |
| $100,000 to $149,999 | 475 | 14.0% |
| $150,000 to $199,999 | 102 | 3.0% |
| $200,000+ | 92 | 2.7% |
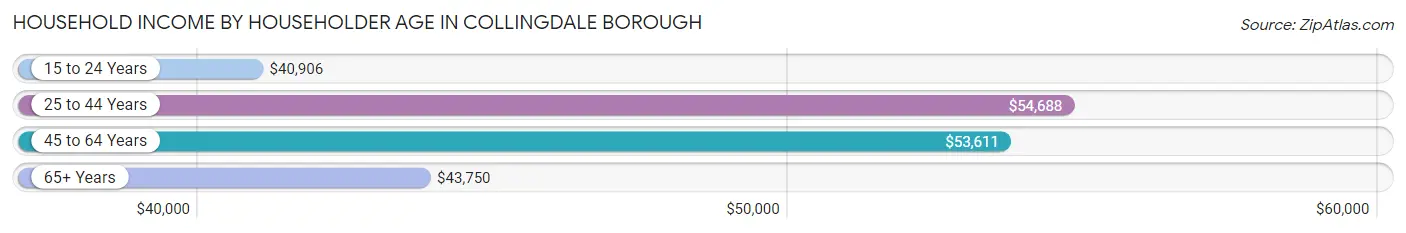
Household Income by Householder Age in Collingdale borough
The median household income in Collingdale borough is $49,819, with the highest median household income of $54,688 found in the 25 to 44 years age bracket for the primary householder. A total of 934 households (27.5%) fall into this category. Meanwhile, the 15 to 24 years age bracket for the primary householder has the lowest median household income of $40,906, with 85 households (2.5%) in this group.
| Income Bracket | # Households | Median Income |
| 15 to 24 Years | 85 (2.5%) | $40,906 |
| 25 to 44 Years | 934 (27.5%) | $54,688 |
| 45 to 64 Years | 1,808 (53.2%) | $53,611 |
| 65+ Years | 568 (16.7%) | $43,750 |
| Total | 3,395 (100.0%) | $49,819 |
Poverty in Collingdale borough
Income Below Poverty by Sex and Age in Collingdale borough
With 19.4% poverty level for males and 23.2% for females among the residents of Collingdale borough, 16 and 17 year old males and under 5 year old females are the most vulnerable to poverty, with 181 males (53.2%) and 75 females (42.9%) in their respective age groups living below the poverty level.
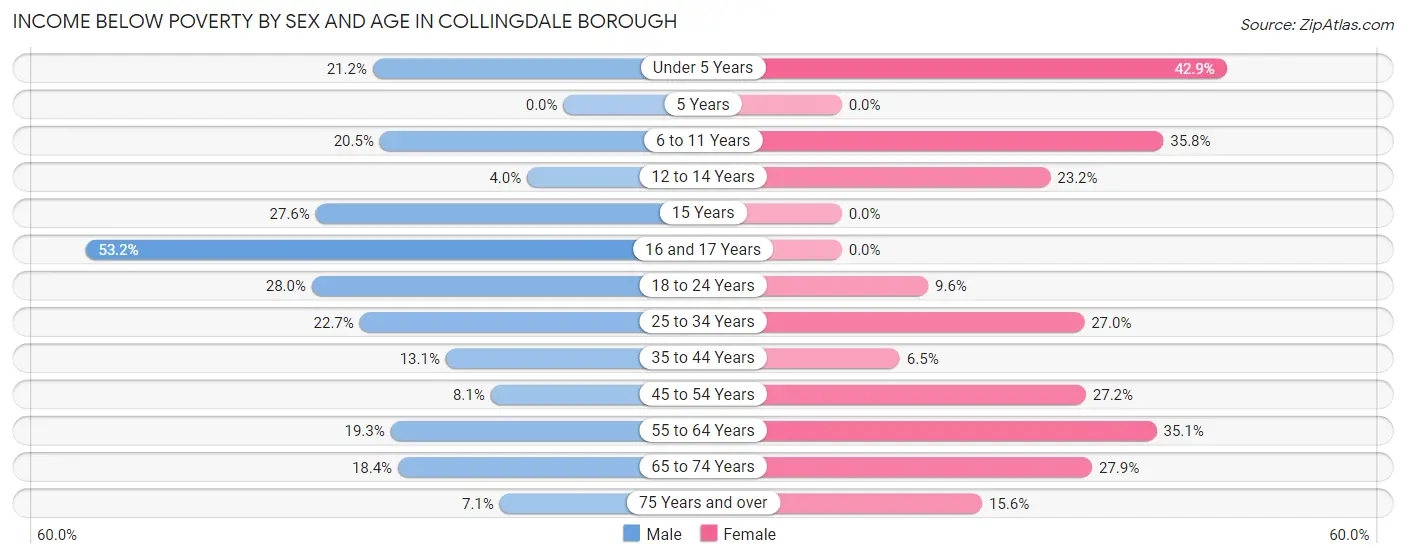
| Age Bracket | Male | Female |
| Under 5 Years | 31 (21.2%) | 75 (42.9%) |
| 5 Years | 0 (0.0%) | 0 (0.0%) |
| 6 to 11 Years | 81 (20.4%) | 140 (35.8%) |
| 12 to 14 Years | 9 (4.0%) | 46 (23.2%) |
| 15 Years | 16 (27.6%) | 0 (0.0%) |
| 16 and 17 Years | 181 (53.2%) | 0 (0.0%) |
| 18 to 24 Years | 102 (28.0%) | 61 (9.6%) |
| 25 to 34 Years | 98 (22.7%) | 172 (27.0%) |
| 35 to 44 Years | 74 (13.1%) | 42 (6.5%) |
| 45 to 54 Years | 52 (8.1%) | 218 (27.2%) |
| 55 to 64 Years | 92 (19.3%) | 245 (35.0%) |
| 65 to 74 Years | 35 (18.4%) | 85 (27.9%) |
| 75 Years and over | 11 (7.1%) | 35 (15.6%) |
| Total | 782 (19.4%) | 1,119 (23.2%) |
Income Above Poverty by Sex and Age in Collingdale borough
According to the poverty statistics in Collingdale borough, males aged 5 years and females aged 5 years are the age groups that are most secure financially, with 100.0% of males and 100.0% of females in these age groups living above the poverty line.
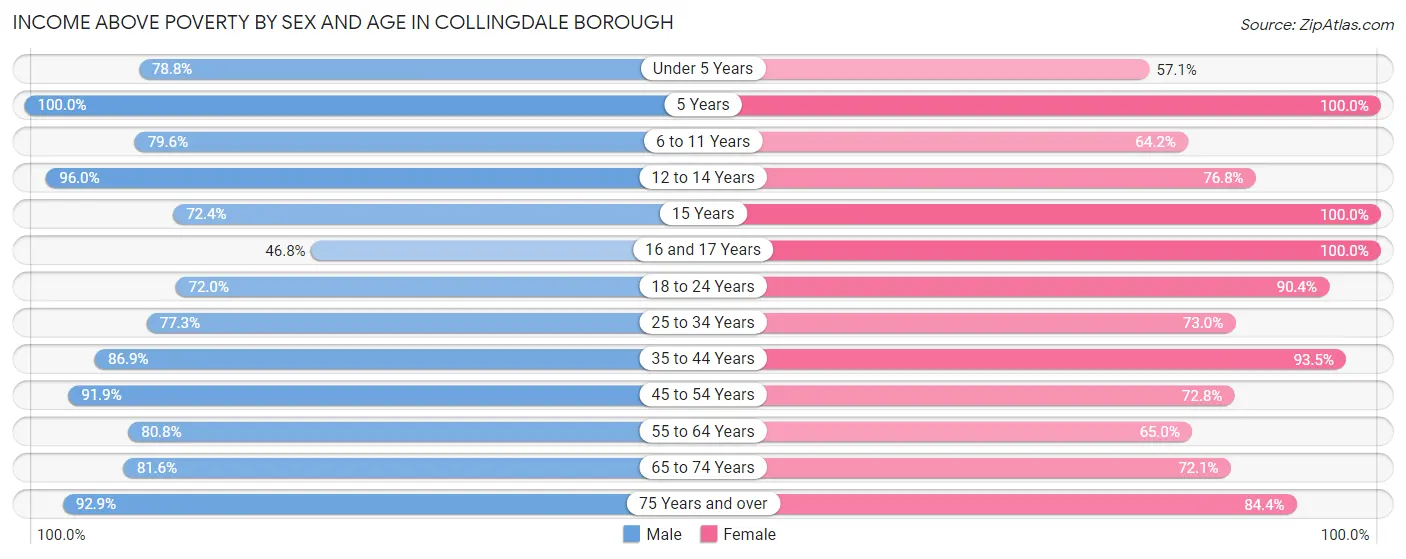
| Age Bracket | Male | Female |
| Under 5 Years | 115 (78.8%) | 100 (57.1%) |
| 5 Years | 42 (100.0%) | 6 (100.0%) |
| 6 to 11 Years | 315 (79.5%) | 251 (64.2%) |
| 12 to 14 Years | 214 (96.0%) | 152 (76.8%) |
| 15 Years | 42 (72.4%) | 66 (100.0%) |
| 16 and 17 Years | 159 (46.8%) | 39 (100.0%) |
| 18 to 24 Years | 262 (72.0%) | 574 (90.4%) |
| 25 to 34 Years | 334 (77.3%) | 465 (73.0%) |
| 35 to 44 Years | 491 (86.9%) | 607 (93.5%) |
| 45 to 54 Years | 589 (91.9%) | 584 (72.8%) |
| 55 to 64 Years | 386 (80.7%) | 454 (64.9%) |
| 65 to 74 Years | 155 (81.6%) | 220 (72.1%) |
| 75 Years and over | 144 (92.9%) | 189 (84.4%) |
| Total | 3,248 (80.6%) | 3,707 (76.8%) |
Income Below Poverty Among Married-Couple Families in Collingdale borough
The poverty statistics for married-couple families in Collingdale borough show that 10.3% or 80 of the total 777 families live below the poverty line. Families with no children have the highest poverty rate of 13.2%, comprising of 61 families. On the other hand, families with 3 or 4 children have the lowest poverty rate of 0.0%, which includes 0 families.
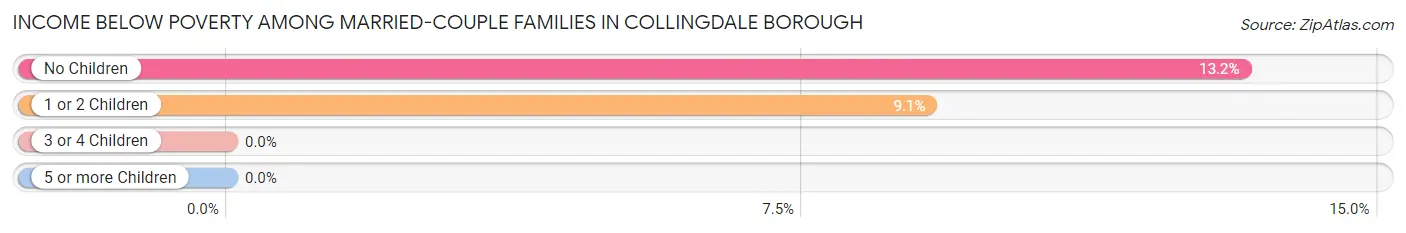
| Children | Above Poverty | Below Poverty |
| No Children | 400 (86.8%) | 61 (13.2%) |
| 1 or 2 Children | 189 (90.9%) | 19 (9.1%) |
| 3 or 4 Children | 108 (100.0%) | 0 (0.0%) |
| 5 or more Children | 0 (0.0%) | 0 (0.0%) |
| Total | 697 (89.7%) | 80 (10.3%) |
Income Below Poverty Among Single-Parent Households in Collingdale borough
According to the poverty data in Collingdale borough, 18.3% or 28 single-father households and 22.8% or 249 single-mother households are living below the poverty line. Among single-father households, those with 1 or 2 children have the highest poverty rate, with 28 households (40.0%) experiencing poverty. Likewise, among single-mother households, those with 3 or 4 children have the highest poverty rate, with 95 households (69.9%) falling below the poverty line.
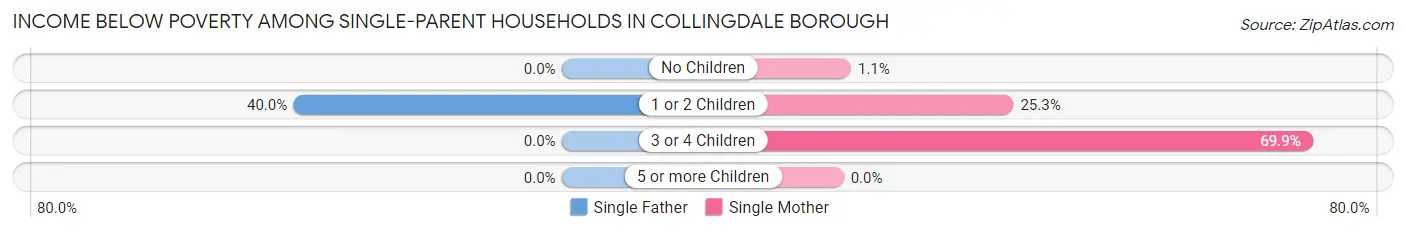
| Children | Single Father | Single Mother |
| No Children | 0 (0.0%) | 4 (1.1%) |
| 1 or 2 Children | 28 (40.0%) | 150 (25.3%) |
| 3 or 4 Children | 0 (0.0%) | 95 (69.9%) |
| 5 or more Children | 0 (0.0%) | 0 (0.0%) |
| Total | 28 (18.3%) | 249 (22.8%) |
Income Below Poverty Among Married-Couple vs Single-Parent Households in Collingdale borough
The poverty data for Collingdale borough shows that 80 of the married-couple family households (10.3%) and 277 of the single-parent households (22.3%) are living below the poverty level. Within the married-couple family households, those with no children have the highest poverty rate, with 61 households (13.2%) falling below the poverty line. Among the single-parent households, those with 3 or 4 children have the highest poverty rate, with 95 household (69.9%) living below poverty.
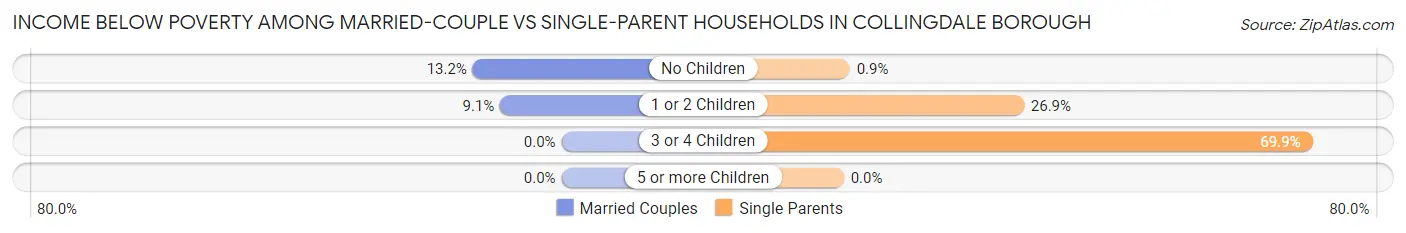
| Children | Married-Couple Families | Single-Parent Households |
| No Children | 61 (13.2%) | 4 (0.9%) |
| 1 or 2 Children | 19 (9.1%) | 178 (26.9%) |
| 3 or 4 Children | 0 (0.0%) | 95 (69.9%) |
| 5 or more Children | 0 (0.0%) | 0 (0.0%) |
| Total | 80 (10.3%) | 277 (22.3%) |
Race in Collingdale borough
The most populous races in Collingdale borough are Black / African American (5,239 | 59.1%), White / Caucasian (2,718 | 30.7%), and Hispanic or Latino (558 | 6.3%).
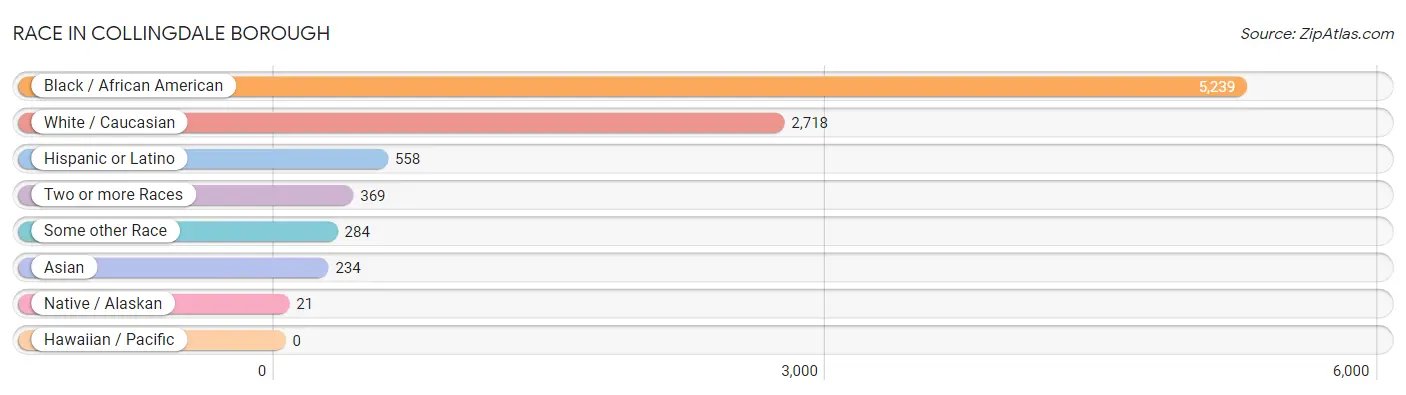
| Race | # Population | % Population |
| Asian | 234 | 2.6% |
| Black / African American | 5,239 | 59.1% |
| Hawaiian / Pacific | 0 | 0.0% |
| Hispanic or Latino | 558 | 6.3% |
| Native / Alaskan | 21 | 0.2% |
| White / Caucasian | 2,718 | 30.7% |
| Two or more Races | 369 | 4.2% |
| Some other Race | 284 | 3.2% |
| Total | 8,865 | 100.0% |
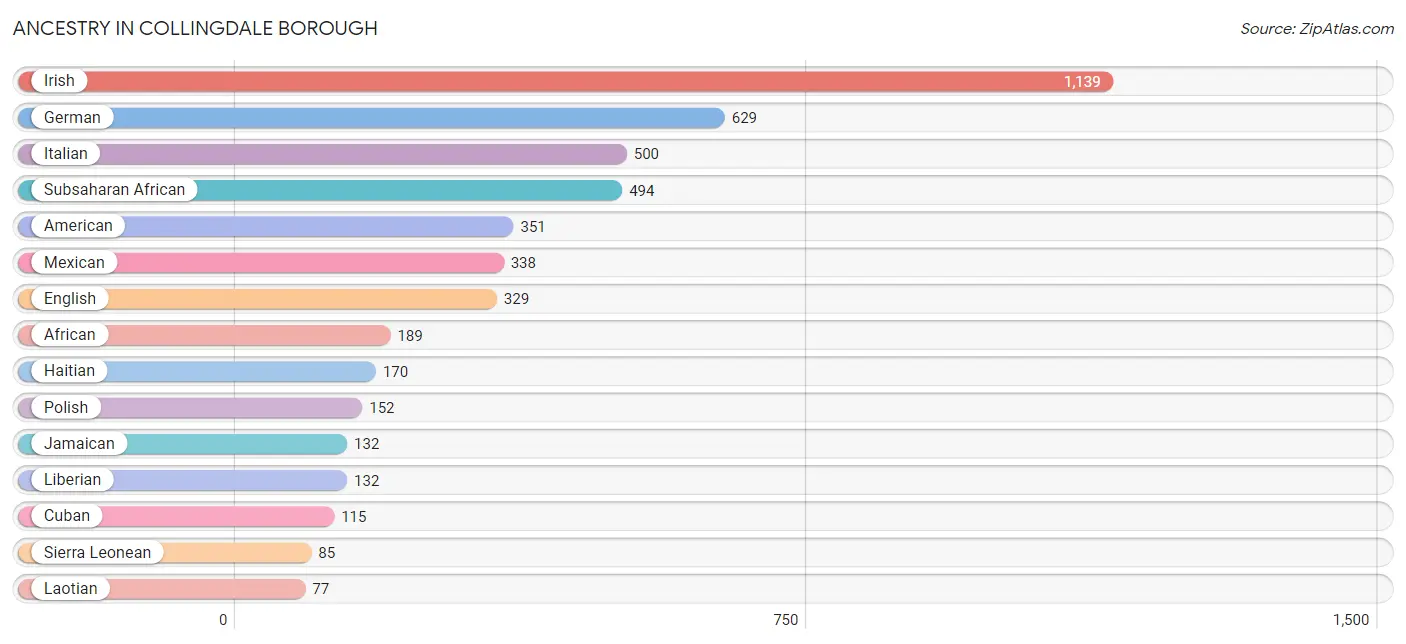
Ancestry in Collingdale borough
The most populous ancestries reported in Collingdale borough are Irish (1,139 | 12.9%), German (629 | 7.1%), Italian (500 | 5.6%), Subsaharan African (494 | 5.6%), and American (351 | 4.0%), together accounting for 35.1% of all Collingdale borough residents.
| Ancestry | # Population | % Population |
| African | 189 | 2.1% |
| American | 351 | 4.0% |
| Arab | 18 | 0.2% |
| British | 39 | 0.4% |
| Cuban | 115 | 1.3% |
| Dominican | 17 | 0.2% |
| Dutch | 1 | 0.0% |
| English | 329 | 3.7% |
| European | 27 | 0.3% |
| German | 629 | 7.1% |
| Haitian | 170 | 1.9% |
| Hungarian | 7 | 0.1% |
| Indian (Asian) | 41 | 0.5% |
| Inupiat | 9 | 0.1% |
| Irish | 1,139 | 12.9% |
| Italian | 500 | 5.6% |
| Jamaican | 132 | 1.5% |
| Japanese | 58 | 0.6% |
| Laotian | 77 | 0.9% |
| Lebanese | 18 | 0.2% |
| Liberian | 132 | 1.5% |
| Malaysian | 59 | 0.7% |
| Mexican | 338 | 3.8% |
| Pakistani | 59 | 0.7% |
| Pennsylvania German | 5 | 0.1% |
| Polish | 152 | 1.7% |
| Portuguese | 4 | 0.1% |
| Puerto Rican | 28 | 0.3% |
| Russian | 14 | 0.2% |
| Scotch-Irish | 11 | 0.1% |
| Scottish | 36 | 0.4% |
| Sierra Leonean | 85 | 1.0% |
| Spanish | 19 | 0.2% |
| Subsaharan African | 494 | 5.6% |
| Swedish | 11 | 0.1% |
| Welsh | 36 | 0.4% | View All 36 Rows |
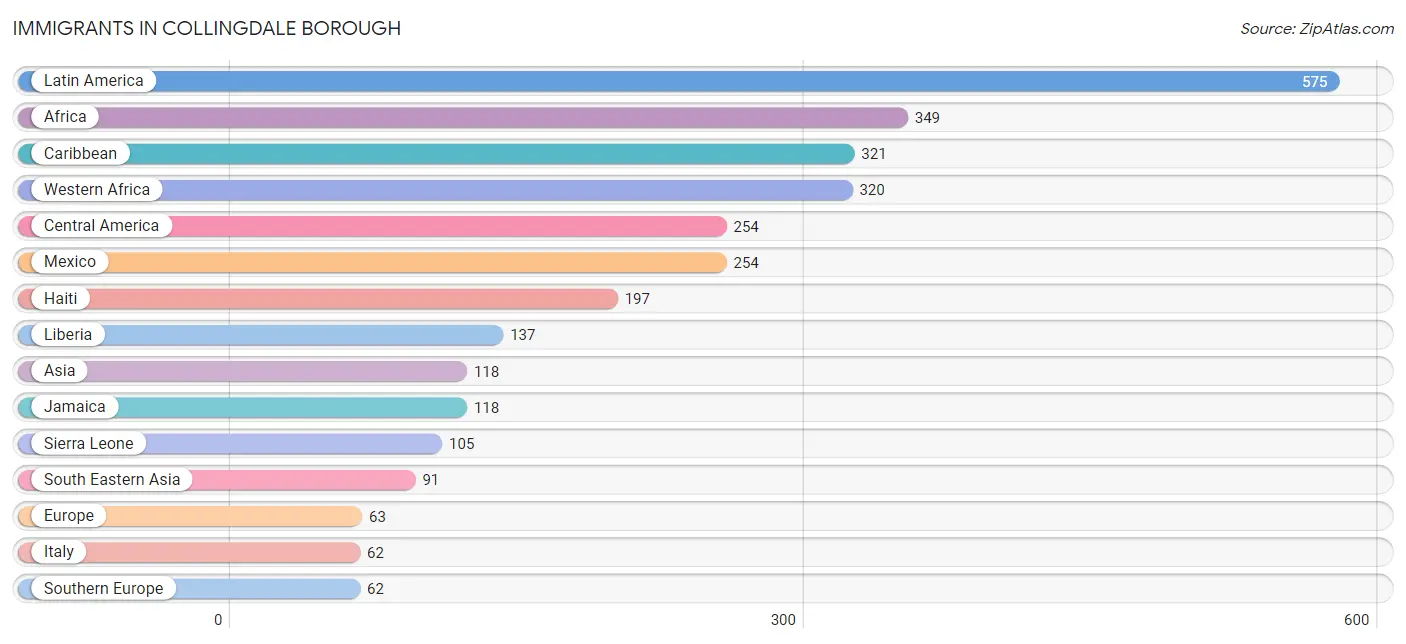
Immigrants in Collingdale borough
The most numerous immigrant groups reported in Collingdale borough came from Latin America (575 | 6.5%), Africa (349 | 3.9%), Caribbean (321 | 3.6%), Western Africa (320 | 3.6%), and Central America (254 | 2.9%), together accounting for 20.5% of all Collingdale borough residents.
| Immigration Origin | # Population | % Population |
| Africa | 349 | 3.9% |
| Asia | 118 | 1.3% |
| Cambodia | 38 | 0.4% |
| Caribbean | 321 | 3.6% |
| Central America | 254 | 2.9% |
| China | 27 | 0.3% |
| Dominican Republic | 6 | 0.1% |
| Eastern Asia | 27 | 0.3% |
| Europe | 63 | 0.7% |
| Ghana | 21 | 0.2% |
| Haiti | 197 | 2.2% |
| Indonesia | 53 | 0.6% |
| Italy | 62 | 0.7% |
| Jamaica | 118 | 1.3% |
| Latin America | 575 | 6.5% |
| Liberia | 137 | 1.5% |
| Mexico | 254 | 2.9% |
| Netherlands | 1 | 0.0% |
| Sierra Leone | 105 | 1.2% |
| South Eastern Asia | 91 | 1.0% |
| Southern Europe | 62 | 0.7% |
| Western Africa | 320 | 3.6% |
| Western Europe | 1 | 0.0% | View All 23 Rows |
Sex and Age in Collingdale borough
Sex and Age in Collingdale borough
The most populous age groups in Collingdale borough are 15 to 19 Years (496 | 12.3%) for men and 45 to 49 Years (563 | 11.7%) for women.
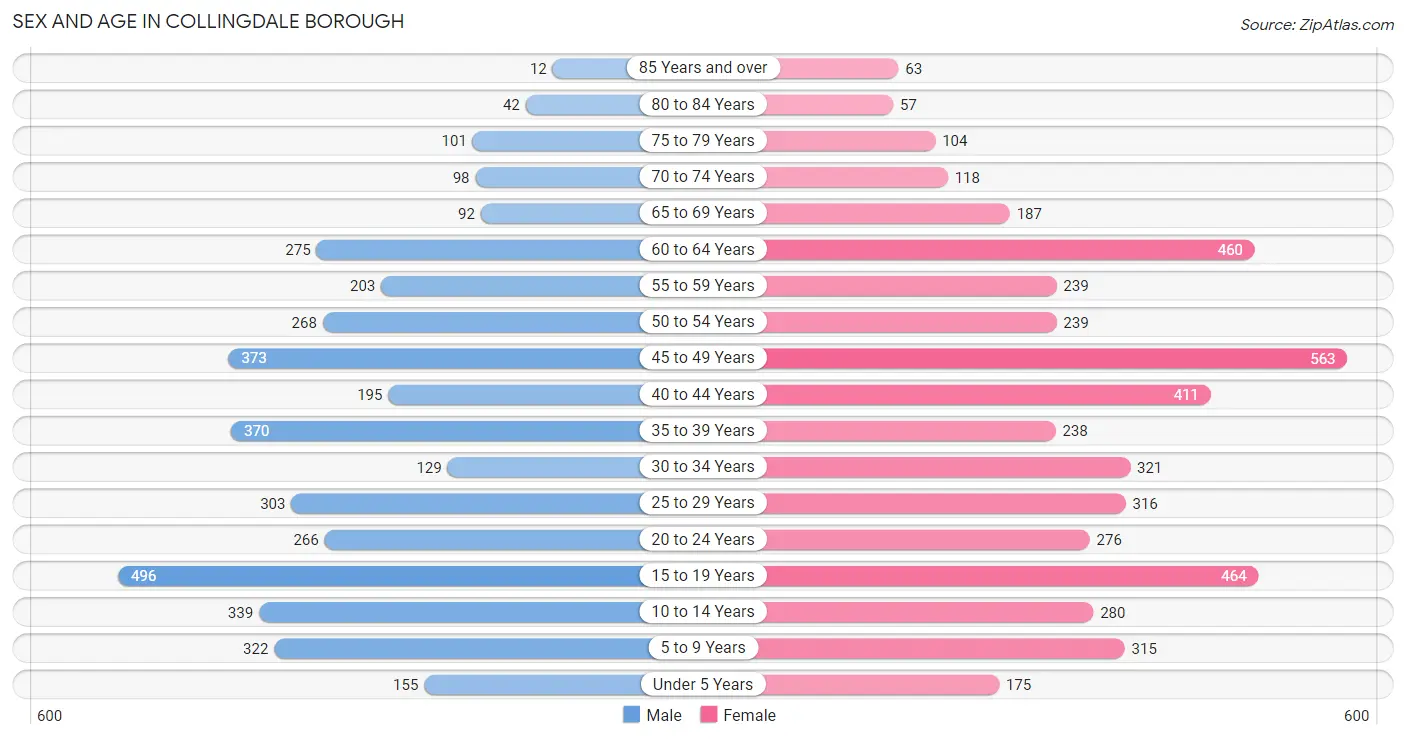
| Age Bracket | Male | Female |
| Under 5 Years | 155 (3.8%) | 175 (3.6%) |
| 5 to 9 Years | 322 (8.0%) | 315 (6.5%) |
| 10 to 14 Years | 339 (8.4%) | 280 (5.8%) |
| 15 to 19 Years | 496 (12.3%) | 464 (9.6%) |
| 20 to 24 Years | 266 (6.6%) | 276 (5.7%) |
| 25 to 29 Years | 303 (7.5%) | 316 (6.6%) |
| 30 to 34 Years | 129 (3.2%) | 321 (6.7%) |
| 35 to 39 Years | 370 (9.2%) | 238 (4.9%) |
| 40 to 44 Years | 195 (4.8%) | 411 (8.5%) |
| 45 to 49 Years | 373 (9.2%) | 563 (11.7%) |
| 50 to 54 Years | 268 (6.6%) | 239 (5.0%) |
| 55 to 59 Years | 203 (5.0%) | 239 (5.0%) |
| 60 to 64 Years | 275 (6.8%) | 460 (9.5%) |
| 65 to 69 Years | 92 (2.3%) | 187 (3.9%) |
| 70 to 74 Years | 98 (2.4%) | 118 (2.5%) |
| 75 to 79 Years | 101 (2.5%) | 104 (2.1%) |
| 80 to 84 Years | 42 (1.0%) | 57 (1.2%) |
| 85 Years and over | 12 (0.3%) | 63 (1.3%) |
| Total | 4,039 (100.0%) | 4,826 (100.0%) |
Families and Households in Collingdale borough
Median Family Size in Collingdale borough
The median family size in Collingdale borough is 3.44 persons per family, with married-couple families (777 | 38.5%) accounting for the largest median family size of 3.68 persons per family. On the other hand, single female/mother families (1,091 | 54.0%) represent the smallest median family size with 3.26 persons per family.
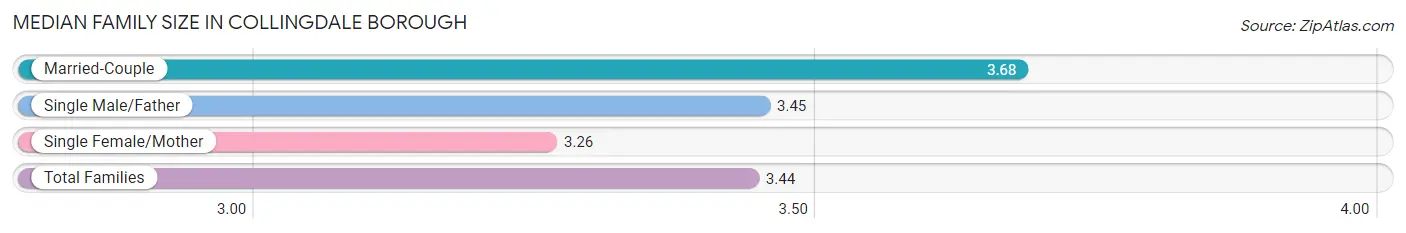
| Family Type | # Families | Family Size |
| Married-Couple | 777 (38.5%) | 3.68 |
| Single Male/Father | 153 (7.6%) | 3.45 |
| Single Female/Mother | 1,091 (54.0%) | 3.26 |
| Total Families | 2,021 (100.0%) | 3.44 |
Median Household Size in Collingdale borough
The median household size in Collingdale borough is 2.61 persons per household, with married-couple households (777 | 22.9%) accounting for the largest median household size of 3.71 persons per household. non-family households (1,374 | 40.5%) represent the smallest median household size with 1.24 persons per household.
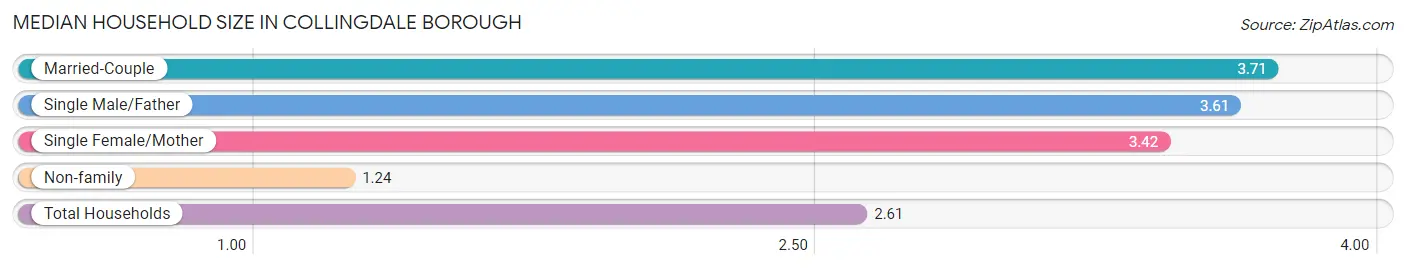
| Household Type | # Households | Household Size |
| Married-Couple | 777 (22.9%) | 3.71 |
| Single Male/Father | 153 (4.5%) | 3.61 |
| Single Female/Mother | 1,091 (32.1%) | 3.42 |
| Non-family | 1,374 (40.5%) | 1.24 |
| Total Households | 3,395 (100.0%) | 2.61 |
Household Size by Marriage Status in Collingdale borough
Out of a total of 3,395 households in Collingdale borough, 2,021 (59.5%) are family households, while 1,374 (40.5%) are nonfamily households. The most numerous type of family households are 2-person households, comprising 687, and the most common type of nonfamily households are 1-person households, comprising 1,226.
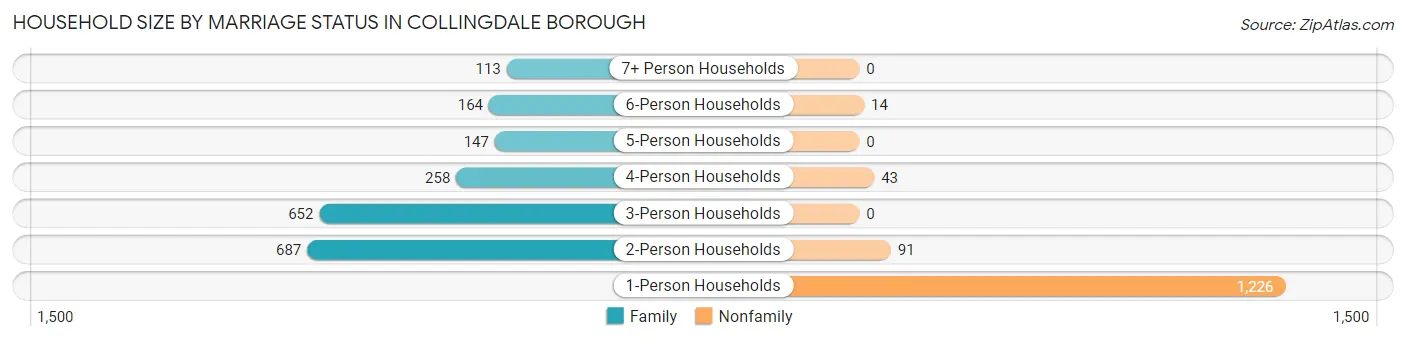
| Household Size | Family Households | Nonfamily Households |
| 1-Person Households | - | 1,226 (36.1%) |
| 2-Person Households | 687 (20.2%) | 91 (2.7%) |
| 3-Person Households | 652 (19.2%) | 0 (0.0%) |
| 4-Person Households | 258 (7.6%) | 43 (1.3%) |
| 5-Person Households | 147 (4.3%) | 0 (0.0%) |
| 6-Person Households | 164 (4.8%) | 14 (0.4%) |
| 7+ Person Households | 113 (3.3%) | 0 (0.0%) |
| Total | 2,021 (59.5%) | 1,374 (40.5%) |
Female Fertility in Collingdale borough
Fertility by Age in Collingdale borough
Average fertility rate in Collingdale borough is 18.0 births per 1,000 women. Women in the age bracket of 15 to 19 years have the highest fertility rate with 50.0 births per 1,000 women. Women in the age bracket of 15 to 19 years acount for 46.9% of all women with births.
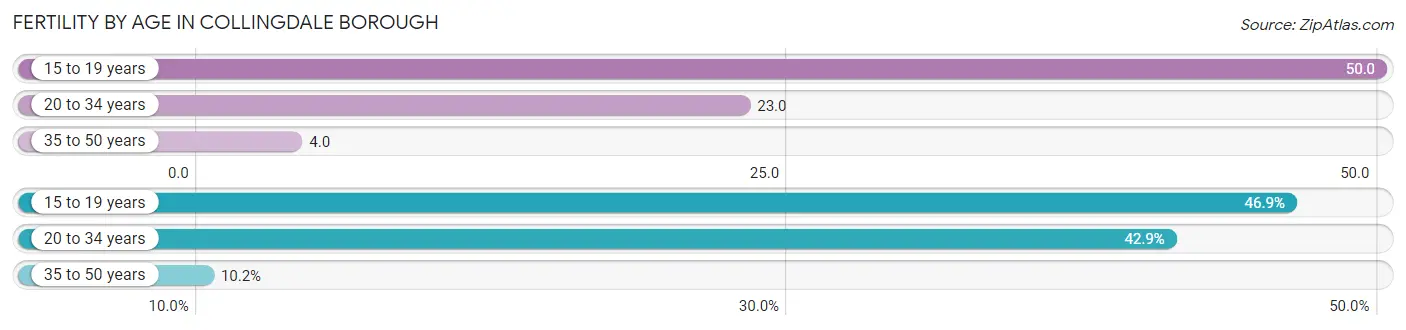
| Age Bracket | Women with Births | Births / 1,000 Women |
| 15 to 19 years | 23 (46.9%) | 50.0 |
| 20 to 34 years | 21 (42.9%) | 23.0 |
| 35 to 50 years | 5 (10.2%) | 4.0 |
| Total | 49 (100.0%) | 18.0 |
Fertility by Age by Marriage Status in Collingdale borough
10.2% of women with births (49) in Collingdale borough are married. The highest percentage of unmarried women with births falls into 15 to 19 years age bracket with 100.0% of them unmarried at the time of birth, while the lowest percentage of unmarried women with births belong to 35 to 50 years age bracket with 0.0% of them unmarried.
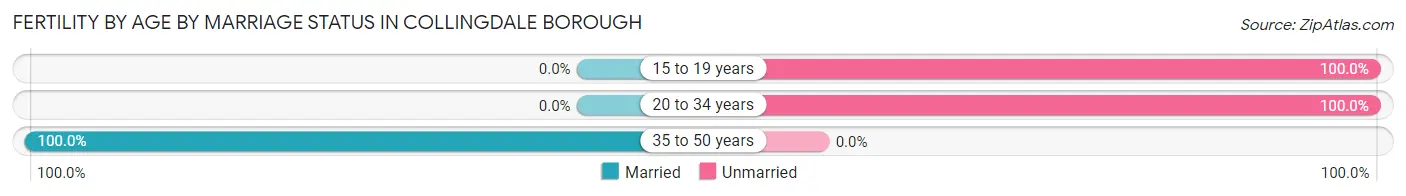
| Age Bracket | Married | Unmarried |
| 15 to 19 years | 0 (0.0%) | 23 (100.0%) |
| 20 to 34 years | 0 (0.0%) | 21 (100.0%) |
| 35 to 50 years | 5 (100.0%) | 0 (0.0%) |
| Total | 5 (10.2%) | 44 (89.8%) |
Fertility by Education in Collingdale borough
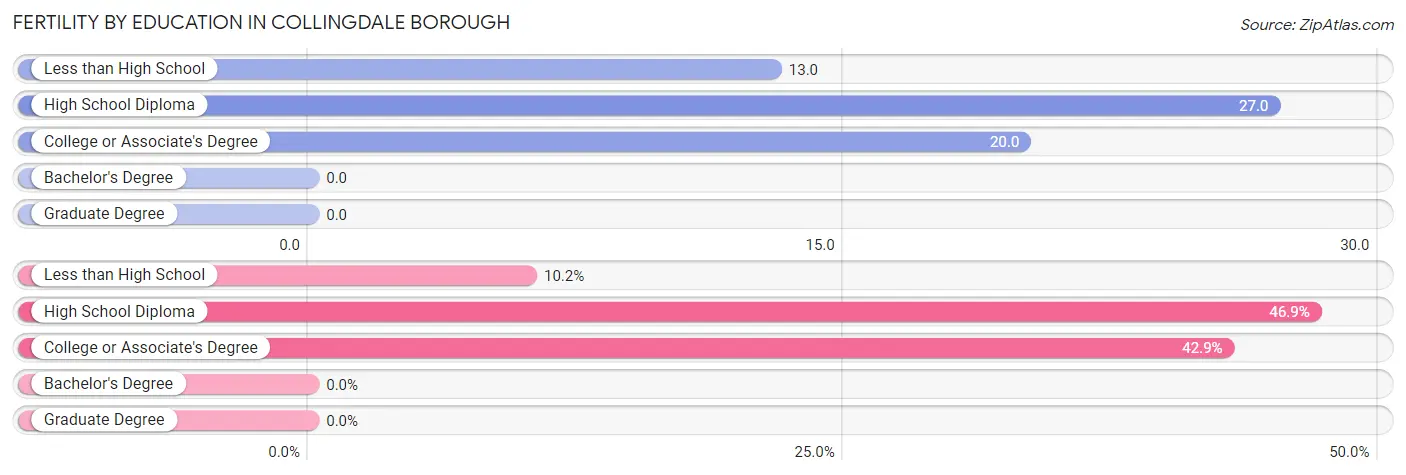
| Educational Attainment | Women with Births | Births / 1,000 Women |
| Less than High School | 5 (10.2%) | 13.0 |
| High School Diploma | 23 (46.9%) | 27.0 |
| College or Associate's Degree | 21 (42.9%) | 20.0 |
| Bachelor's Degree | 0 (0.0%) | 0.0 |
| Graduate Degree | 0 (0.0%) | 0.0 |
| Total | 49 (100.0%) | 18.0 |
Fertility by Education by Marriage Status in Collingdale borough
89.8% of women with births in Collingdale borough are unmarried. Women with the educational attainment of less than high school are most likely to be married with 100.0% of them married at childbirth, while women with the educational attainment of high school diploma are least likely to be married with 100.0% of them unmarried at childbirth.
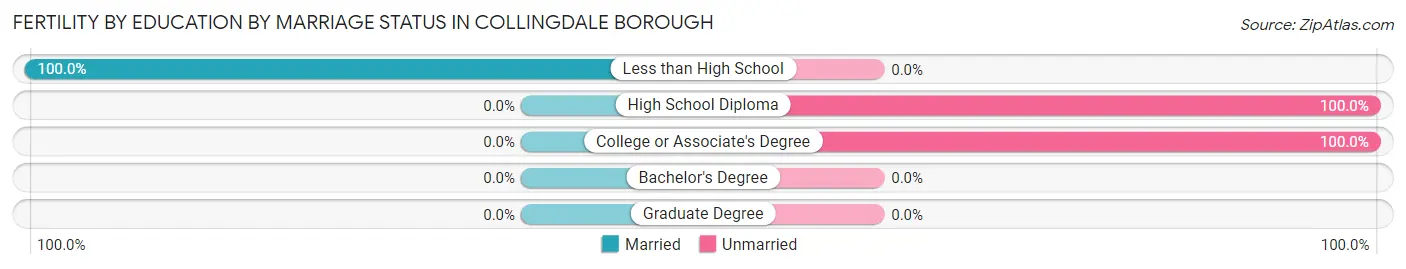
| Educational Attainment | Married | Unmarried |
| Less than High School | 5 (100.0%) | 0 (0.0%) |
| High School Diploma | 0 (0.0%) | 23 (100.0%) |
| College or Associate's Degree | 0 (0.0%) | 21 (100.0%) |
| Bachelor's Degree | 0 (0.0%) | 0 (0.0%) |
| Graduate Degree | 0 (0.0%) | 0 (0.0%) |
| Total | 5 (10.2%) | 44 (89.8%) |
Employment Characteristics in Collingdale borough
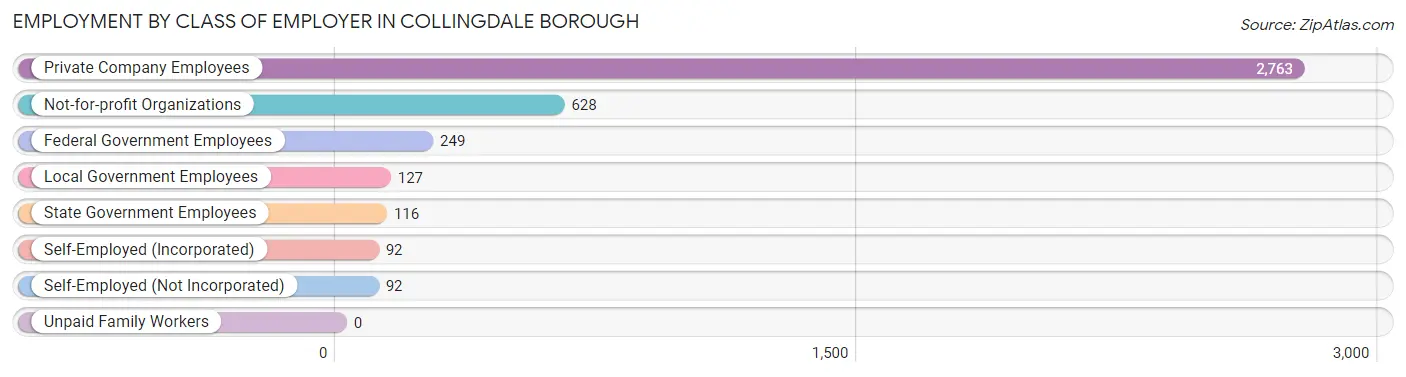
Employment by Class of Employer in Collingdale borough
Among the 4,067 employed individuals in Collingdale borough, private company employees (2,763 | 67.9%), not-for-profit organizations (628 | 15.4%), and federal government employees (249 | 6.1%) make up the most common classes of employment.
| Employer Class | # Employees | % Employees |
| Private Company Employees | 2,763 | 67.9% |
| Self-Employed (Incorporated) | 92 | 2.3% |
| Self-Employed (Not Incorporated) | 92 | 2.3% |
| Not-for-profit Organizations | 628 | 15.4% |
| Local Government Employees | 127 | 3.1% |
| State Government Employees | 116 | 2.9% |
| Federal Government Employees | 249 | 6.1% |
| Unpaid Family Workers | 0 | 0.0% |
| Total | 4,067 | 100.0% |
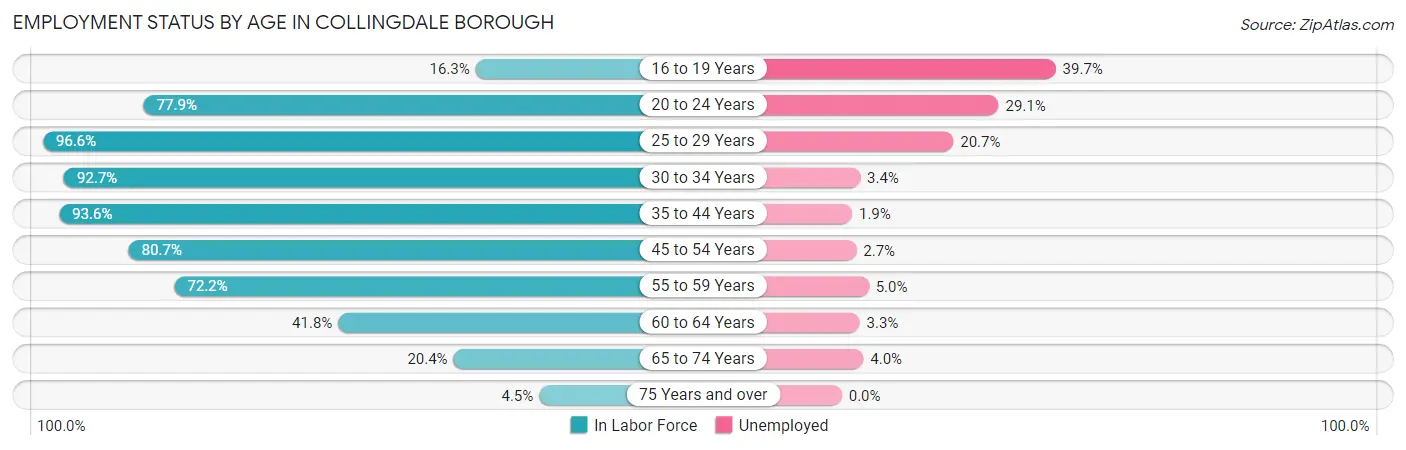
Employment Status by Age in Collingdale borough
According to the labor force statistics for Collingdale borough, out of the total population over 16 years of age (7,155), 64.5% or 4,615 individuals are in the labor force, with 8.6% or 397 of them unemployed. The age group with the highest labor force participation rate is 25 to 29 years, with 96.6% or 598 individuals in the labor force. Within the labor force, the 16 to 19 years age range has the highest percentage of unemployed individuals, with 39.7% or 54 of them being unemployed.
| Age Bracket | In Labor Force | Unemployed |
| 16 to 19 Years | 136 (16.3%) | 54 (39.7%) |
| 20 to 24 Years | 422 (77.9%) | 123 (29.1%) |
| 25 to 29 Years | 598 (96.6%) | 124 (20.7%) |
| 30 to 34 Years | 417 (92.7%) | 14 (3.4%) |
| 35 to 44 Years | 1,136 (93.6%) | 22 (1.9%) |
| 45 to 54 Years | 1,165 (80.7%) | 31 (2.7%) |
| 55 to 59 Years | 319 (72.2%) | 16 (5.0%) |
| 60 to 64 Years | 307 (41.8%) | 10 (3.3%) |
| 65 to 74 Years | 101 (20.4%) | 4 (4.0%) |
| 75 Years and over | 17 (4.5%) | 0 (0.0%) |
| Total | 4,615 (64.5%) | 397 (8.6%) |
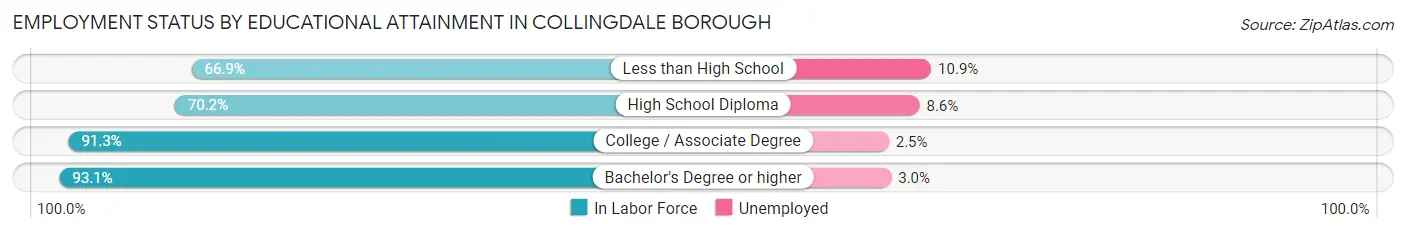
Employment Status by Educational Attainment in Collingdale borough
According to labor force statistics for Collingdale borough, 80.4% of individuals (3,942) out of the total population between 25 and 64 years of age (4,903) are in the labor force, with 5.5% or 217 of them being unemployed. The group with the highest labor force participation rate are those with the educational attainment of bachelor's degree or higher, with 93.1% or 666 individuals in the labor force. Within the labor force, individuals with less than high school education have the highest percentage of unemployment, with 10.9% or 48 of them being unemployed.
| Educational Attainment | In Labor Force | Unemployed |
| Less than High School | 440 (66.9%) | 72 (10.9%) |
| High School Diploma | 1,290 (70.2%) | 158 (8.6%) |
| College / Associate Degree | 1,545 (91.3%) | 42 (2.5%) |
| Bachelor's Degree or higher | 666 (93.1%) | 21 (3.0%) |
| Total | 3,942 (80.4%) | 270 (5.5%) |
Employment Occupations by Sex in Collingdale borough
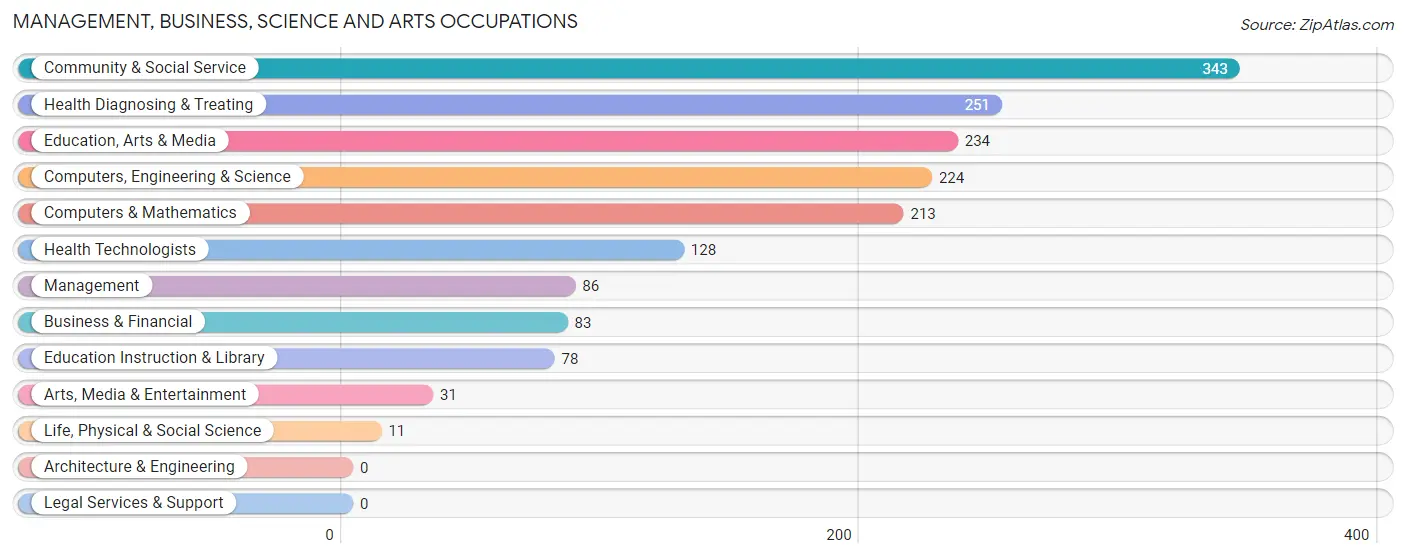
Management, Business, Science and Arts Occupations
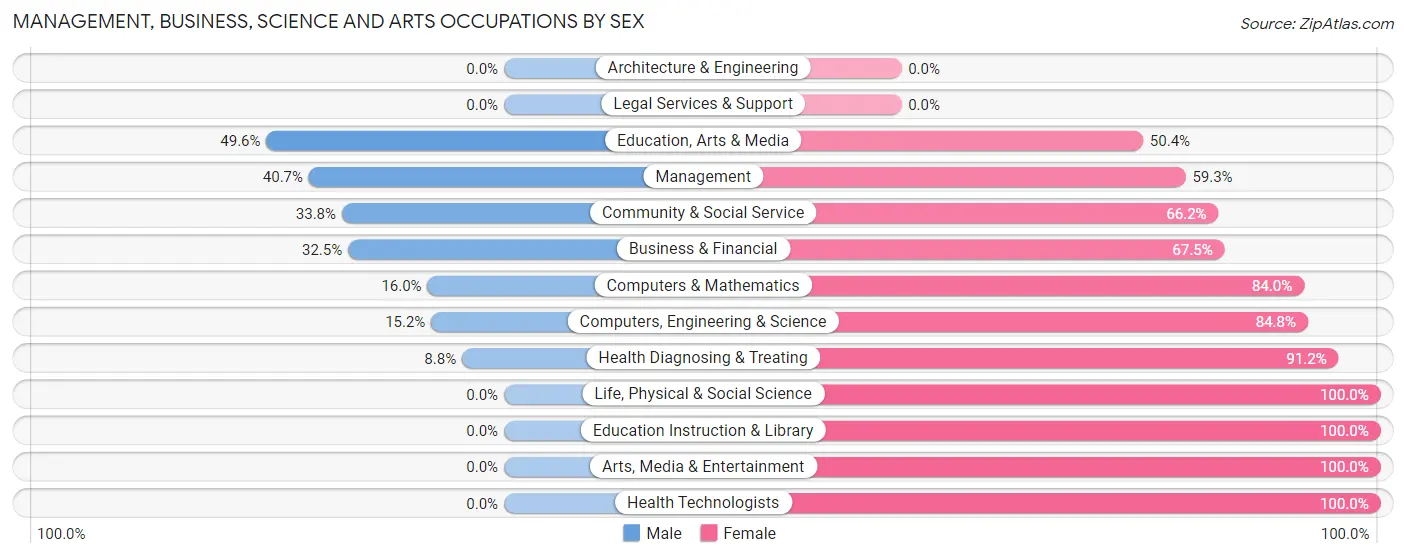
The most common Management, Business, Science and Arts occupations in Collingdale borough are Community & Social Service (343 | 8.1%), Health Diagnosing & Treating (251 | 5.9%), Education, Arts & Media (234 | 5.6%), Computers, Engineering & Science (224 | 5.3%), and Computers & Mathematics (213 | 5.1%).
Management, Business, Science and Arts Occupations by Sex
Within the Management, Business, Science and Arts occupations in Collingdale borough, the most male-oriented occupations are Education, Arts & Media (49.6%), Management (40.7%), and Community & Social Service (33.8%), while the most female-oriented occupations are Life, Physical & Social Science (100.0%), Education Instruction & Library (100.0%), and Arts, Media & Entertainment (100.0%).
| Occupation | Male | Female |
| Management | 35 (40.7%) | 51 (59.3%) |
| Business & Financial | 27 (32.5%) | 56 (67.5%) |
| Computers, Engineering & Science | 34 (15.2%) | 190 (84.8%) |
| Computers & Mathematics | 34 (16.0%) | 179 (84.0%) |
| Architecture & Engineering | 0 (0.0%) | 0 (0.0%) |
| Life, Physical & Social Science | 0 (0.0%) | 11 (100.0%) |
| Community & Social Service | 116 (33.8%) | 227 (66.2%) |
| Education, Arts & Media | 116 (49.6%) | 118 (50.4%) |
| Legal Services & Support | 0 (0.0%) | 0 (0.0%) |
| Education Instruction & Library | 0 (0.0%) | 78 (100.0%) |
| Arts, Media & Entertainment | 0 (0.0%) | 31 (100.0%) |
| Health Diagnosing & Treating | 22 (8.8%) | 229 (91.2%) |
| Health Technologists | 0 (0.0%) | 128 (100.0%) |
| Total (Category) | 234 (23.7%) | 753 (76.3%) |
| Total (Overall) | 1,872 (44.4%) | 2,347 (55.6%) |
Services Occupations
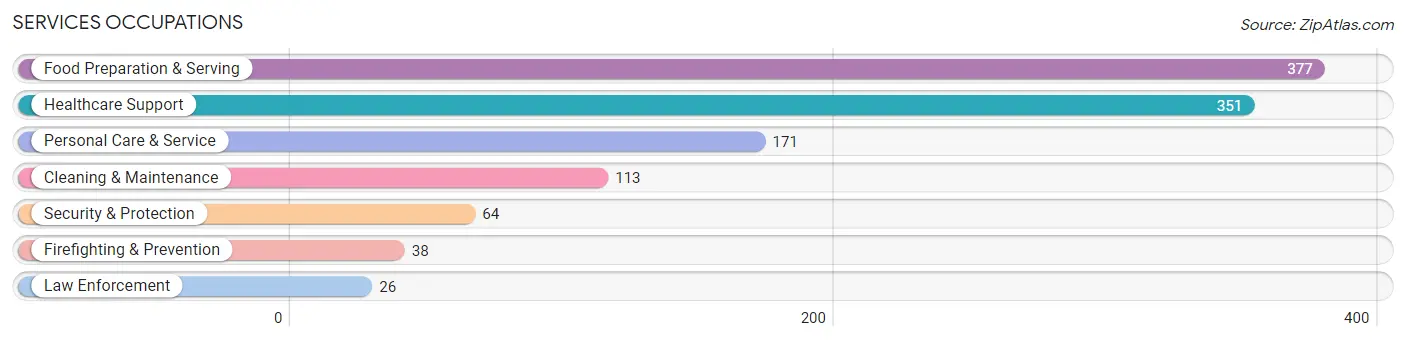
The most common Services occupations in Collingdale borough are Food Preparation & Serving (377 | 8.9%), Healthcare Support (351 | 8.3%), Personal Care & Service (171 | 4.1%), Cleaning & Maintenance (113 | 2.7%), and Security & Protection (64 | 1.5%).
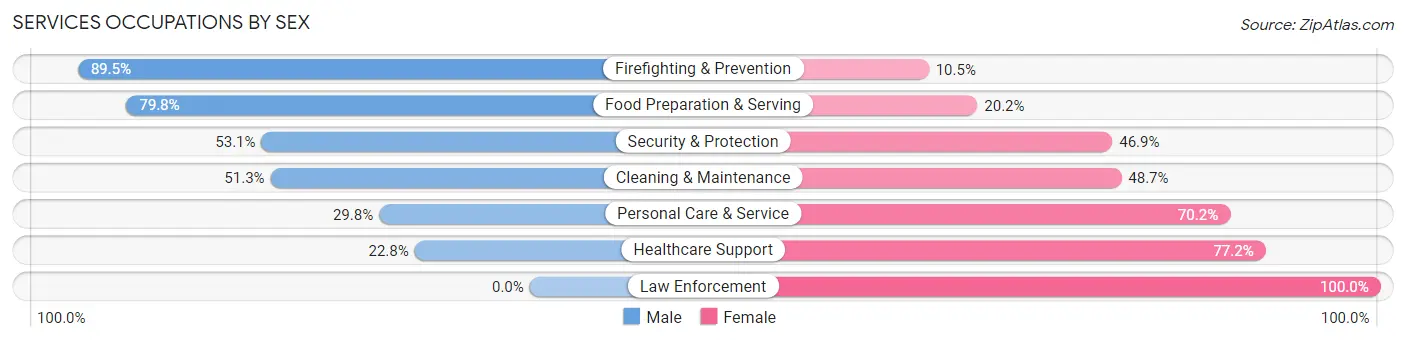
Services Occupations by Sex
Within the Services occupations in Collingdale borough, the most male-oriented occupations are Firefighting & Prevention (89.5%), Food Preparation & Serving (79.8%), and Security & Protection (53.1%), while the most female-oriented occupations are Law Enforcement (100.0%), Healthcare Support (77.2%), and Personal Care & Service (70.2%).
| Occupation | Male | Female |
| Healthcare Support | 80 (22.8%) | 271 (77.2%) |
| Security & Protection | 34 (53.1%) | 30 (46.9%) |
| Firefighting & Prevention | 34 (89.5%) | 4 (10.5%) |
| Law Enforcement | 0 (0.0%) | 26 (100.0%) |
| Food Preparation & Serving | 301 (79.8%) | 76 (20.2%) |
| Cleaning & Maintenance | 58 (51.3%) | 55 (48.7%) |
| Personal Care & Service | 51 (29.8%) | 120 (70.2%) |
| Total (Category) | 524 (48.7%) | 552 (51.3%) |
| Total (Overall) | 1,872 (44.4%) | 2,347 (55.6%) |
Sales and Office Occupations
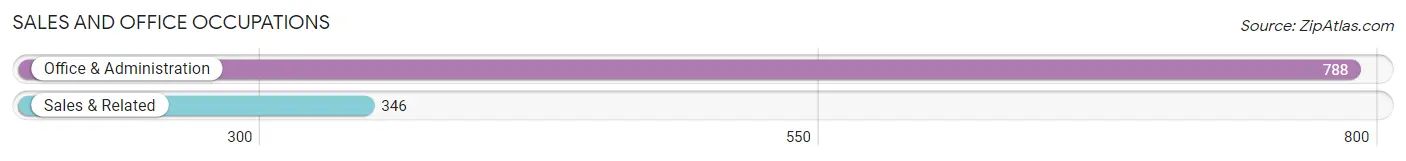
The most common Sales and Office occupations in Collingdale borough are Office & Administration (788 | 18.7%), and Sales & Related (346 | 8.2%).
Sales and Office Occupations by Sex
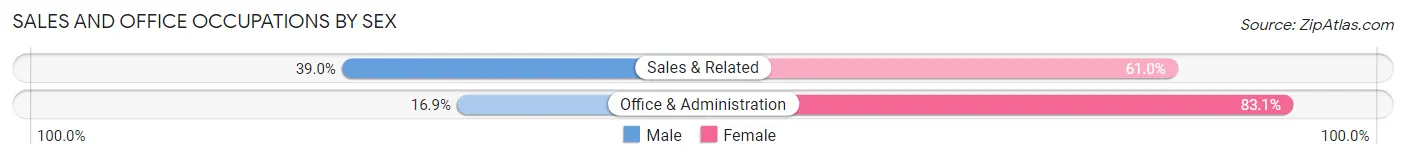
| Occupation | Male | Female |
| Sales & Related | 135 (39.0%) | 211 (61.0%) |
| Office & Administration | 133 (16.9%) | 655 (83.1%) |
| Total (Category) | 268 (23.6%) | 866 (76.4%) |
| Total (Overall) | 1,872 (44.4%) | 2,347 (55.6%) |
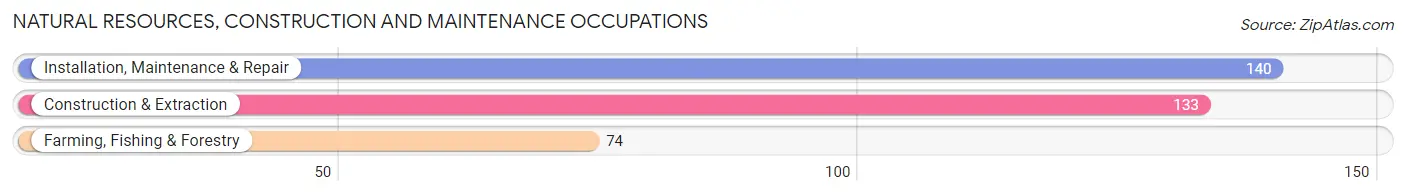
Natural Resources, Construction and Maintenance Occupations
The most common Natural Resources, Construction and Maintenance occupations in Collingdale borough are Installation, Maintenance & Repair (140 | 3.3%), Construction & Extraction (133 | 3.2%), and Farming, Fishing & Forestry (74 | 1.8%).
Natural Resources, Construction and Maintenance Occupations by Sex
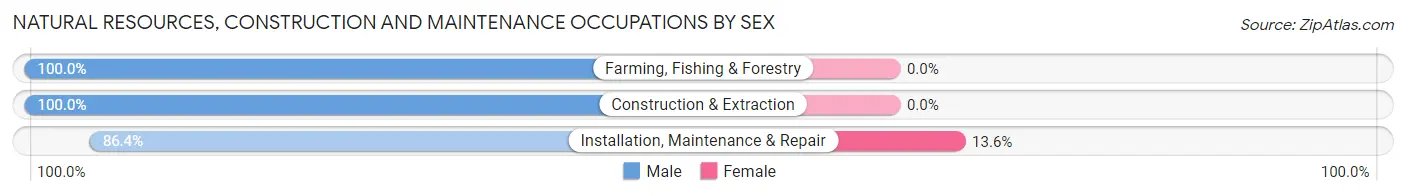
| Occupation | Male | Female |
| Farming, Fishing & Forestry | 74 (100.0%) | 0 (0.0%) |
| Construction & Extraction | 133 (100.0%) | 0 (0.0%) |
| Installation, Maintenance & Repair | 121 (86.4%) | 19 (13.6%) |
| Total (Category) | 328 (94.5%) | 19 (5.5%) |
| Total (Overall) | 1,872 (44.4%) | 2,347 (55.6%) |
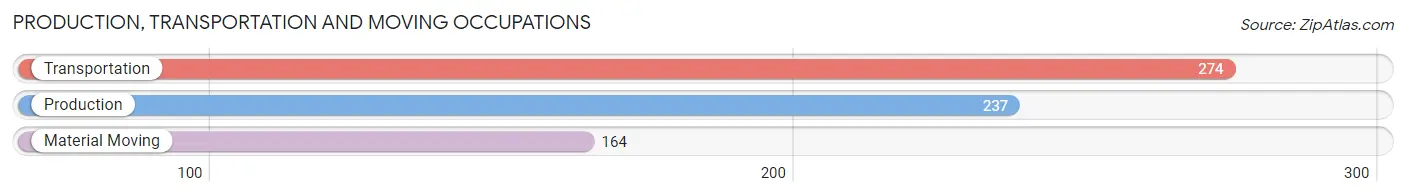
Production, Transportation and Moving Occupations
The most common Production, Transportation and Moving occupations in Collingdale borough are Transportation (274 | 6.5%), Production (237 | 5.6%), and Material Moving (164 | 3.9%).
Production, Transportation and Moving Occupations by Sex
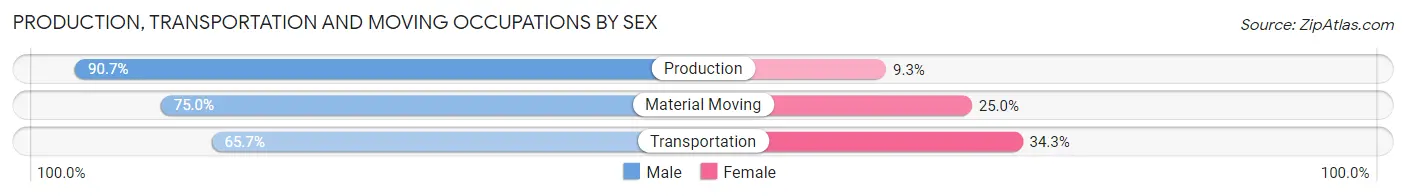
| Occupation | Male | Female |
| Production | 215 (90.7%) | 22 (9.3%) |
| Transportation | 180 (65.7%) | 94 (34.3%) |
| Material Moving | 123 (75.0%) | 41 (25.0%) |
| Total (Category) | 518 (76.7%) | 157 (23.3%) |
| Total (Overall) | 1,872 (44.4%) | 2,347 (55.6%) |
Employment Industries by Sex in Collingdale borough
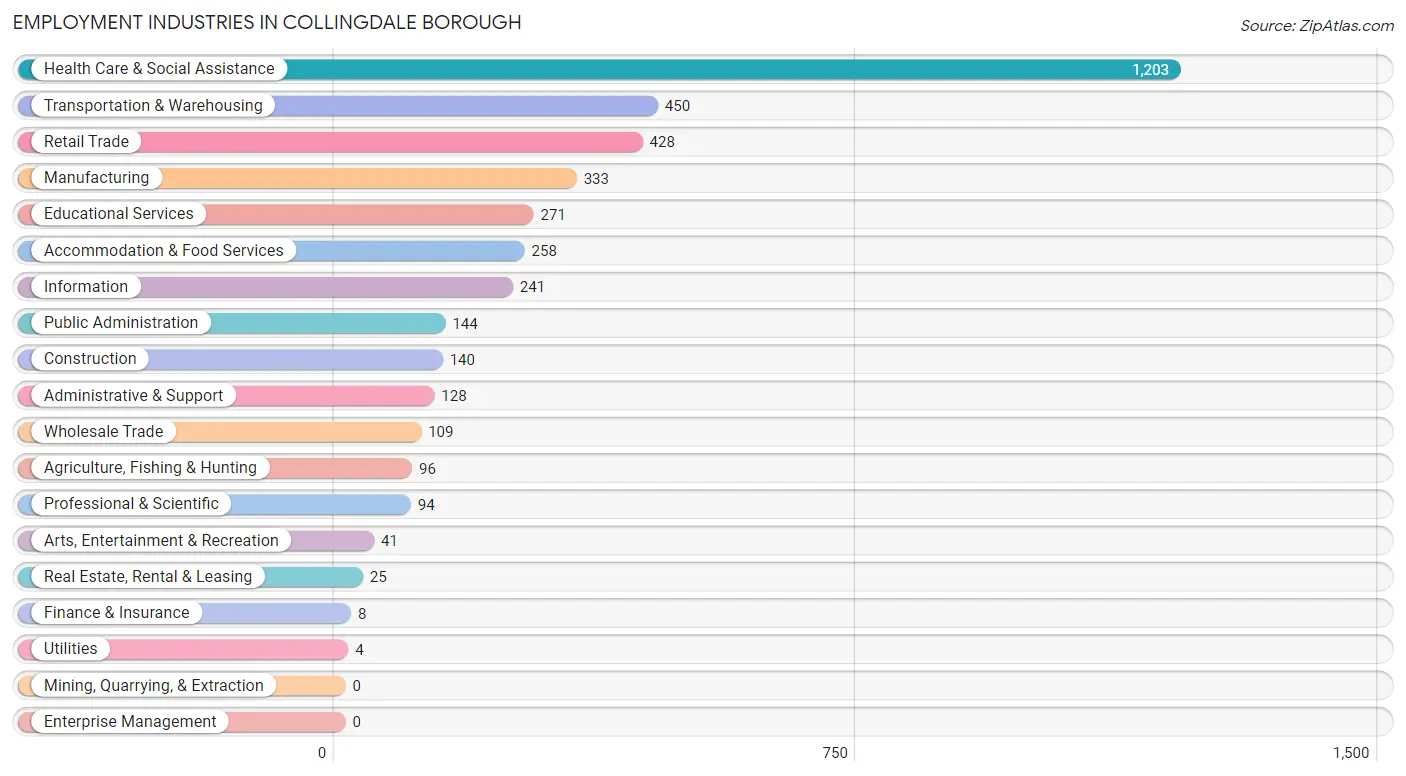
Employment Industries in Collingdale borough
The major employment industries in Collingdale borough include Health Care & Social Assistance (1,203 | 28.5%), Transportation & Warehousing (450 | 10.7%), Retail Trade (428 | 10.1%), Manufacturing (333 | 7.9%), and Educational Services (271 | 6.4%).
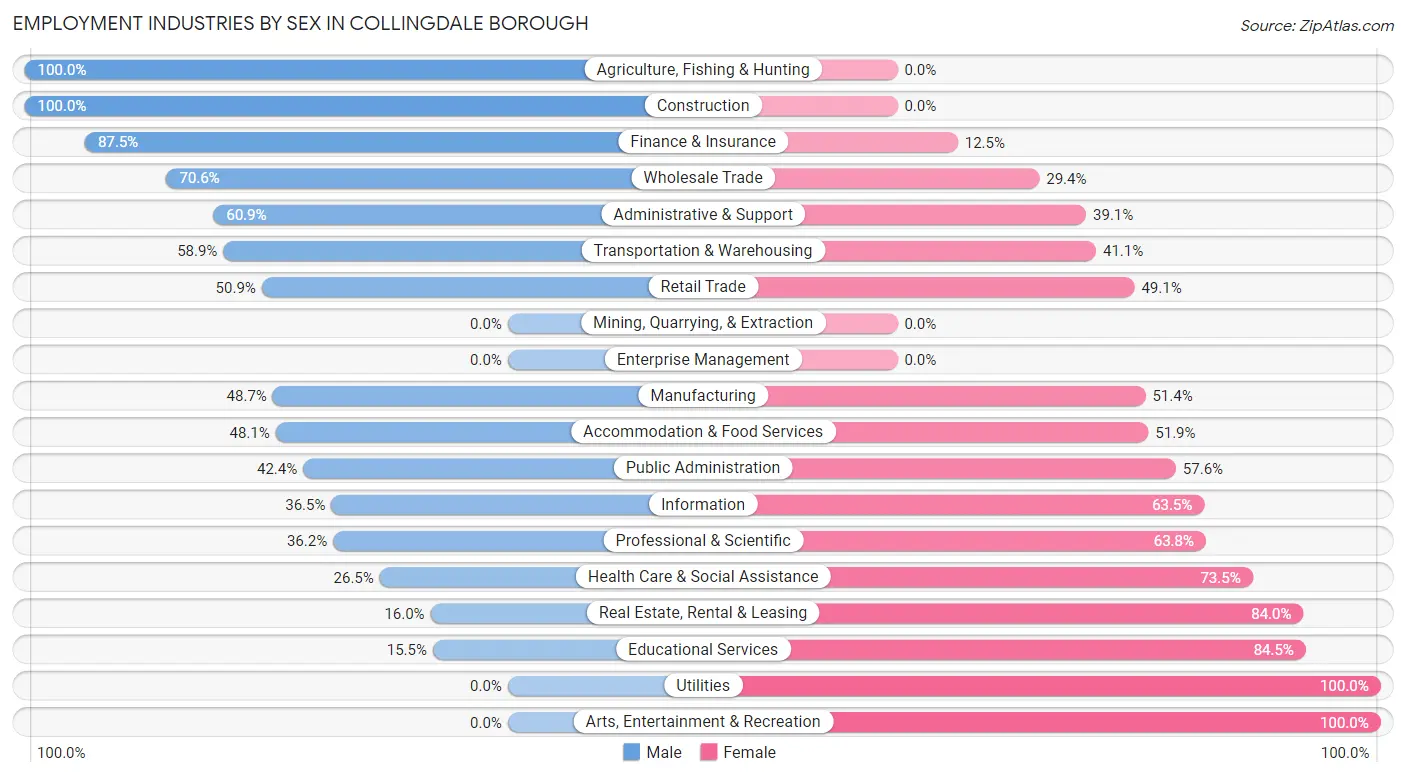
Employment Industries by Sex in Collingdale borough
The Collingdale borough industries that see more men than women are Agriculture, Fishing & Hunting (100.0%), Construction (100.0%), and Finance & Insurance (87.5%), whereas the industries that tend to have a higher number of women are Utilities (100.0%), Arts, Entertainment & Recreation (100.0%), and Educational Services (84.5%).
| Industry | Male | Female |
| Agriculture, Fishing & Hunting | 96 (100.0%) | 0 (0.0%) |
| Mining, Quarrying, & Extraction | 0 (0.0%) | 0 (0.0%) |
| Construction | 140 (100.0%) | 0 (0.0%) |
| Manufacturing | 162 (48.6%) | 171 (51.3%) |
| Wholesale Trade | 77 (70.6%) | 32 (29.4%) |
| Retail Trade | 218 (50.9%) | 210 (49.1%) |
| Transportation & Warehousing | 265 (58.9%) | 185 (41.1%) |
| Utilities | 0 (0.0%) | 4 (100.0%) |
| Information | 88 (36.5%) | 153 (63.5%) |
| Finance & Insurance | 7 (87.5%) | 1 (12.5%) |
| Real Estate, Rental & Leasing | 4 (16.0%) | 21 (84.0%) |
| Professional & Scientific | 34 (36.2%) | 60 (63.8%) |
| Enterprise Management | 0 (0.0%) | 0 (0.0%) |
| Administrative & Support | 78 (60.9%) | 50 (39.1%) |
| Educational Services | 42 (15.5%) | 229 (84.5%) |
| Health Care & Social Assistance | 319 (26.5%) | 884 (73.5%) |
| Arts, Entertainment & Recreation | 0 (0.0%) | 41 (100.0%) |
| Accommodation & Food Services | 124 (48.1%) | 134 (51.9%) |
| Public Administration | 61 (42.4%) | 83 (57.6%) |
| Total | 1,872 (44.4%) | 2,347 (55.6%) |
Education in Collingdale borough
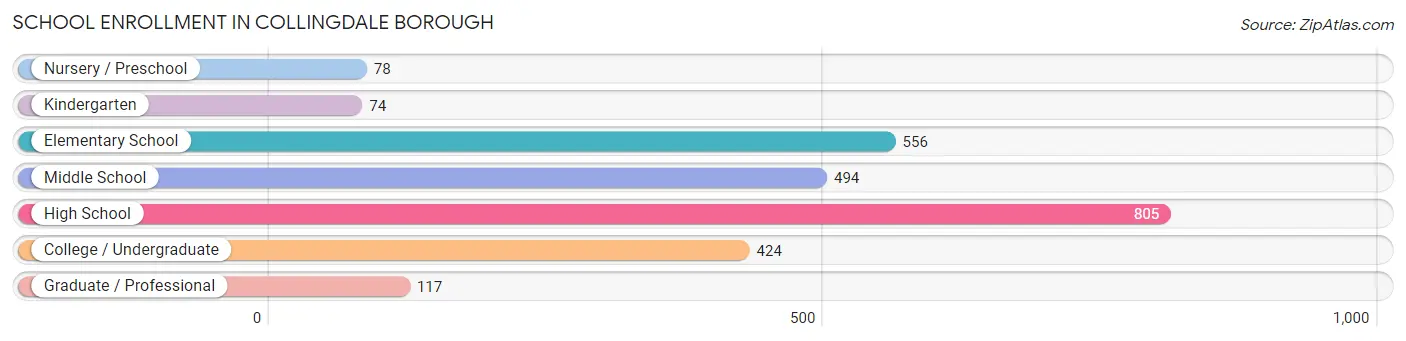
School Enrollment in Collingdale borough
The most common levels of schooling among the 2,548 students in Collingdale borough are high school (805 | 31.6%), elementary school (556 | 21.8%), and middle school (494 | 19.4%).
| School Level | # Students | % Students |
| Nursery / Preschool | 78 | 3.1% |
| Kindergarten | 74 | 2.9% |
| Elementary School | 556 | 21.8% |
| Middle School | 494 | 19.4% |
| High School | 805 | 31.6% |
| College / Undergraduate | 424 | 16.6% |
| Graduate / Professional | 117 | 4.6% |
| Total | 2,548 | 100.0% |
School Enrollment by Age by Funding Source in Collingdale borough
Out of a total of 2,548 students who are enrolled in schools in Collingdale borough, 586 (23.0%) attend a private institution, while the remaining 1,962 (77.0%) are enrolled in public schools. The age group of 18 to 19 year olds has the highest likelihood of being enrolled in private schools, with 179 (67.8% in the age bracket) enrolled. Conversely, the age group of 3 to 4 year olds has the lowest likelihood of being enrolled in a private school, with 97 (100.0% in the age bracket) attending a public institution.
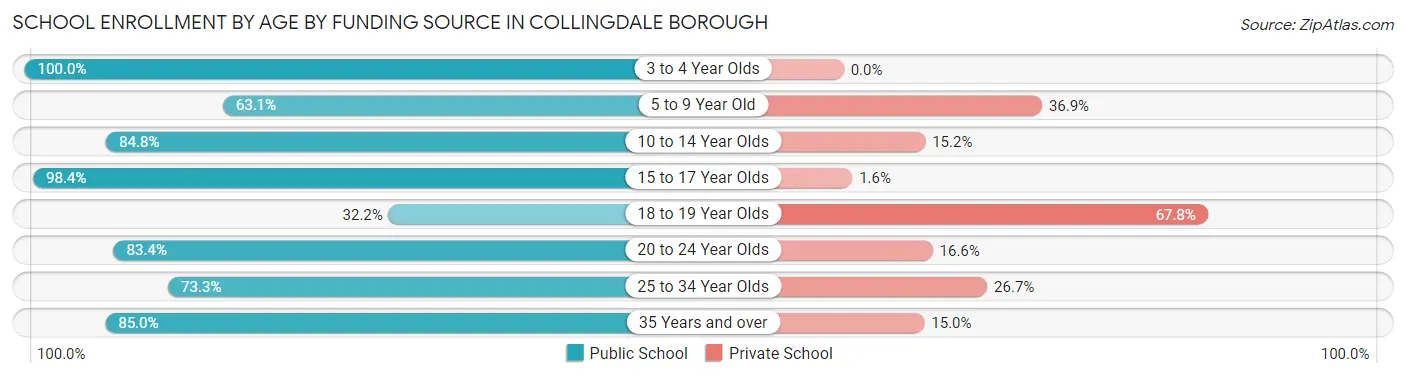
| Age Bracket | Public School | Private School |
| 3 to 4 Year Olds | 97 (100.0%) | 0 (0.0%) |
| 5 to 9 Year Old | 345 (63.1%) | 202 (36.9%) |
| 10 to 14 Year Olds | 525 (84.8%) | 94 (15.2%) |
| 15 to 17 Year Olds | 495 (98.4%) | 8 (1.6%) |
| 18 to 19 Year Olds | 85 (32.2%) | 179 (67.8%) |
| 20 to 24 Year Olds | 136 (83.4%) | 27 (16.6%) |
| 25 to 34 Year Olds | 148 (73.3%) | 54 (26.7%) |
| 35 Years and over | 130 (85.0%) | 23 (15.0%) |
| Total | 1,962 (77.0%) | 586 (23.0%) |
Educational Attainment by Field of Study in Collingdale borough
Computers & mathematics (163 | 18.2%), business (135 | 15.1%), science & technology (108 | 12.0%), psychology (107 | 11.9%), and social sciences (55 | 6.1%) are the most common fields of study among 896 individuals in Collingdale borough who have obtained a bachelor's degree or higher.
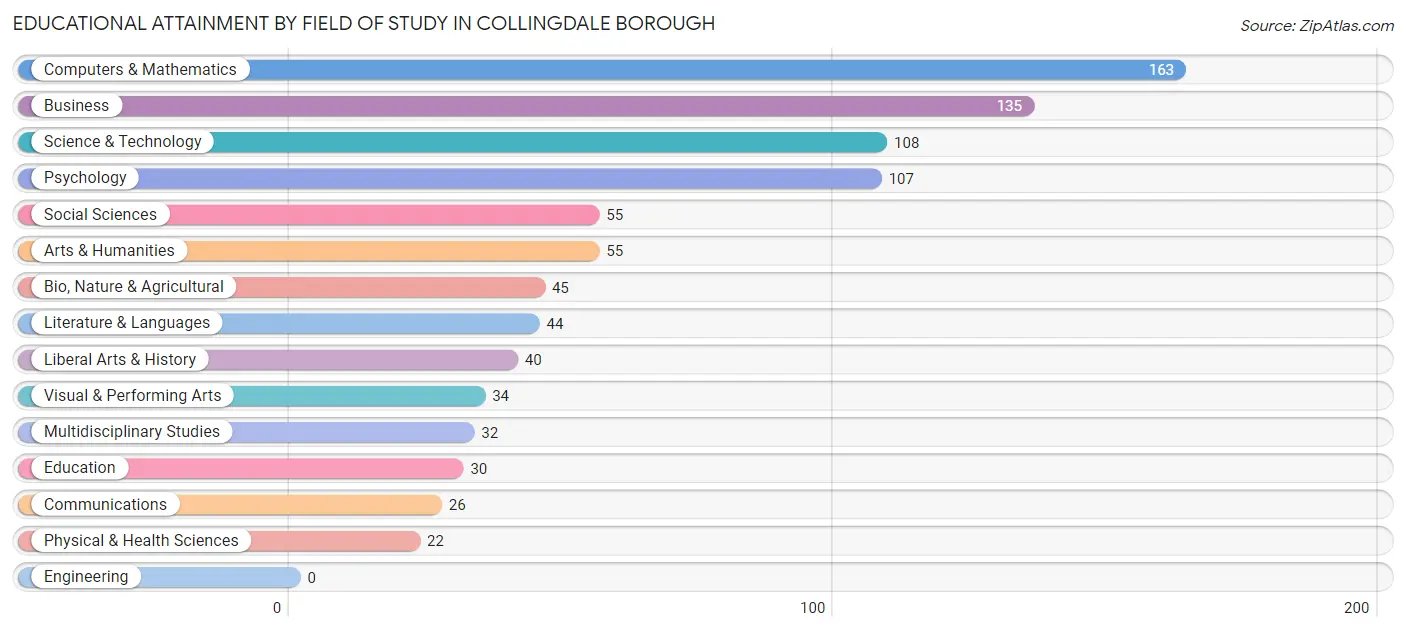
| Field of Study | # Graduates | % Graduates |
| Computers & Mathematics | 163 | 18.2% |
| Bio, Nature & Agricultural | 45 | 5.0% |
| Physical & Health Sciences | 22 | 2.5% |
| Psychology | 107 | 11.9% |
| Social Sciences | 55 | 6.1% |
| Engineering | 0 | 0.0% |
| Multidisciplinary Studies | 32 | 3.6% |
| Science & Technology | 108 | 12.0% |
| Business | 135 | 15.1% |
| Education | 30 | 3.4% |
| Literature & Languages | 44 | 4.9% |
| Liberal Arts & History | 40 | 4.5% |
| Visual & Performing Arts | 34 | 3.8% |
| Communications | 26 | 2.9% |
| Arts & Humanities | 55 | 6.1% |
| Total | 896 | 100.0% |
Transportation & Commute in Collingdale borough
Vehicle Availability by Sex in Collingdale borough
The most prevalent vehicle ownership categories in Collingdale borough are males with 1 vehicle (779, accounting for 43.4%) and females with 1 vehicle (735, making up 34.3%).
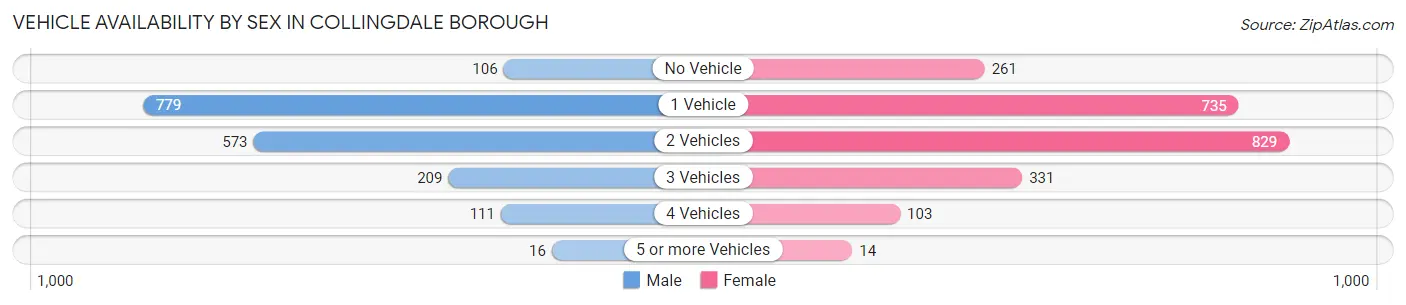
| Vehicles Available | Male | Female |
| No Vehicle | 106 (5.9%) | 261 (11.5%) |
| 1 Vehicle | 779 (43.4%) | 735 (32.3%) |
| 2 Vehicles | 573 (31.9%) | 829 (36.5%) |
| 3 Vehicles | 209 (11.7%) | 331 (14.6%) |
| 4 Vehicles | 111 (6.2%) | 103 (4.5%) |
| 5 or more Vehicles | 16 (0.9%) | 14 (0.6%) |
| Total | 1,794 (100.0%) | 2,273 (100.0%) |
Commute Time in Collingdale borough
The most frequently occuring commute durations in Collingdale borough are 30 to 34 minutes (828 commuters, 22.0%), 20 to 24 minutes (579 commuters, 15.4%), and 45 to 59 minutes (528 commuters, 14.0%).
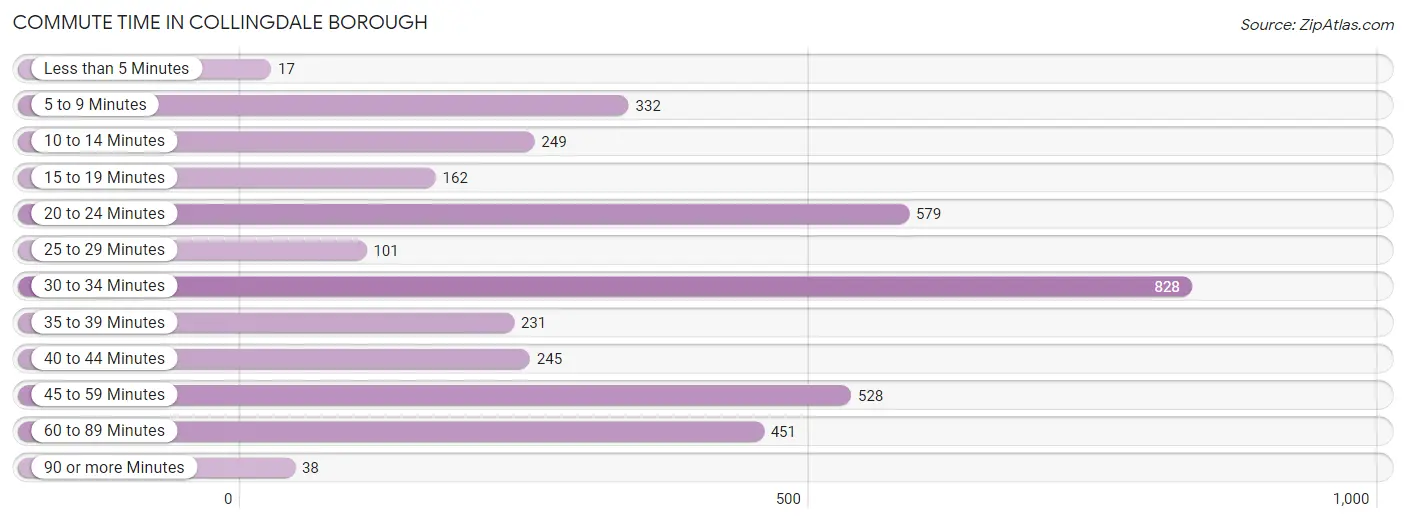
| Commute Time | # Commuters | % Commuters |
| Less than 5 Minutes | 17 | 0.4% |
| 5 to 9 Minutes | 332 | 8.8% |
| 10 to 14 Minutes | 249 | 6.6% |
| 15 to 19 Minutes | 162 | 4.3% |
| 20 to 24 Minutes | 579 | 15.4% |
| 25 to 29 Minutes | 101 | 2.7% |
| 30 to 34 Minutes | 828 | 22.0% |
| 35 to 39 Minutes | 231 | 6.1% |
| 40 to 44 Minutes | 245 | 6.5% |
| 45 to 59 Minutes | 528 | 14.0% |
| 60 to 89 Minutes | 451 | 12.0% |
| 90 or more Minutes | 38 | 1.0% |
Commute Time by Sex in Collingdale borough
The most common commute times in Collingdale borough are 30 to 34 minutes (374 commuters, 21.5%) for males and 30 to 34 minutes (454 commuters, 22.5%) for females.
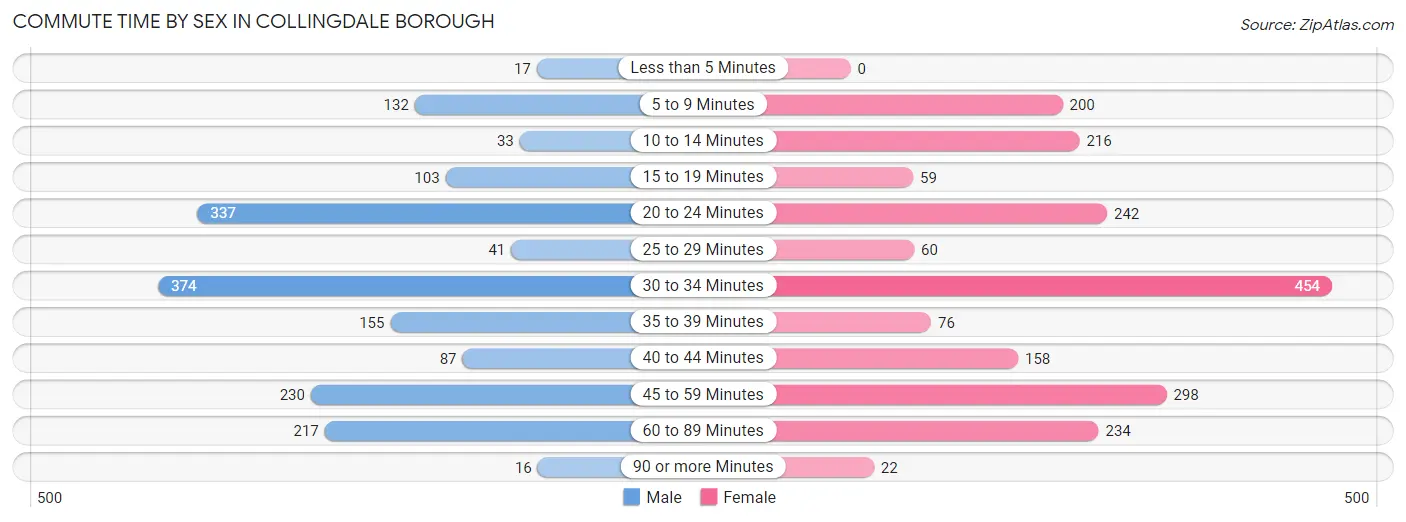
| Commute Time | Male | Female |
| Less than 5 Minutes | 17 (1.0%) | 0 (0.0%) |
| 5 to 9 Minutes | 132 (7.6%) | 200 (9.9%) |
| 10 to 14 Minutes | 33 (1.9%) | 216 (10.7%) |
| 15 to 19 Minutes | 103 (5.9%) | 59 (2.9%) |
| 20 to 24 Minutes | 337 (19.4%) | 242 (12.0%) |
| 25 to 29 Minutes | 41 (2.4%) | 60 (3.0%) |
| 30 to 34 Minutes | 374 (21.5%) | 454 (22.5%) |
| 35 to 39 Minutes | 155 (8.9%) | 76 (3.8%) |
| 40 to 44 Minutes | 87 (5.0%) | 158 (7.8%) |
| 45 to 59 Minutes | 230 (13.2%) | 298 (14.8%) |
| 60 to 89 Minutes | 217 (12.5%) | 234 (11.6%) |
| 90 or more Minutes | 16 (0.9%) | 22 (1.1%) |
Time of Departure to Work by Sex in Collingdale borough
The most frequent times of departure to work in Collingdale borough are 6:30 AM to 6:59 AM (316, 18.1%) for males and 8:00 AM to 8:29 AM (298, 14.8%) for females.
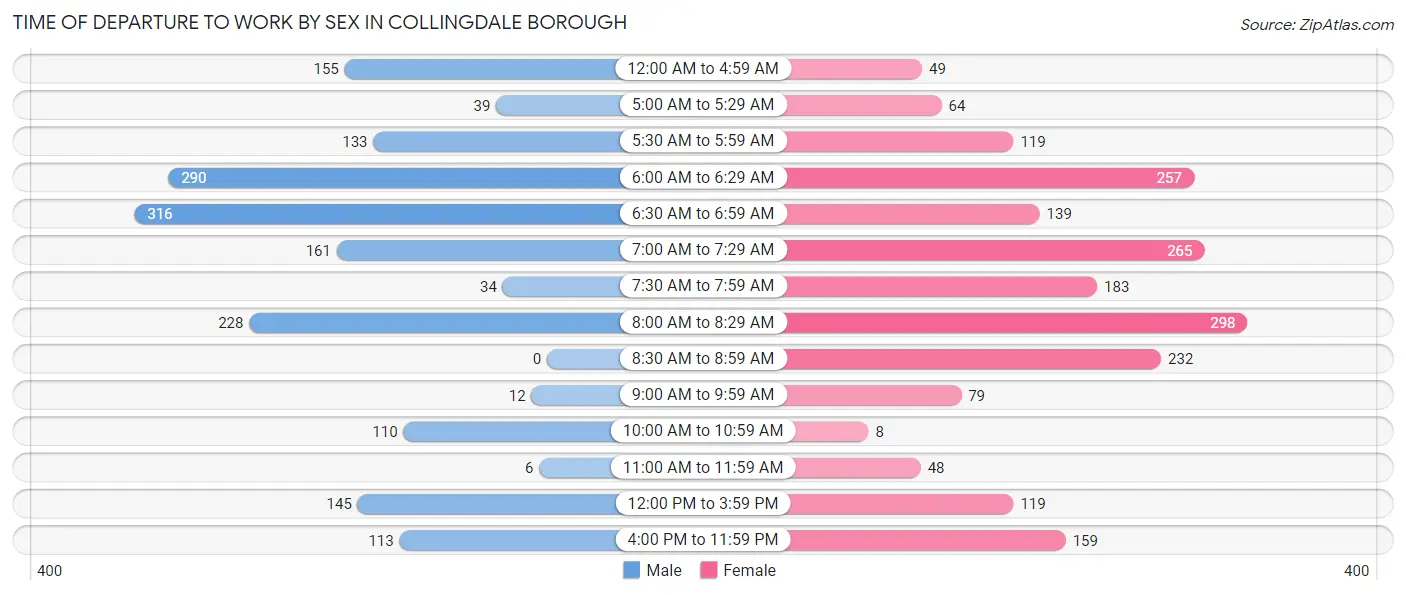
| Time of Departure | Male | Female |
| 12:00 AM to 4:59 AM | 155 (8.9%) | 49 (2.4%) |
| 5:00 AM to 5:29 AM | 39 (2.2%) | 64 (3.2%) |
| 5:30 AM to 5:59 AM | 133 (7.6%) | 119 (5.9%) |
| 6:00 AM to 6:29 AM | 290 (16.7%) | 257 (12.7%) |
| 6:30 AM to 6:59 AM | 316 (18.1%) | 139 (6.9%) |
| 7:00 AM to 7:29 AM | 161 (9.2%) | 265 (13.1%) |
| 7:30 AM to 7:59 AM | 34 (1.9%) | 183 (9.1%) |
| 8:00 AM to 8:29 AM | 228 (13.1%) | 298 (14.8%) |
| 8:30 AM to 8:59 AM | 0 (0.0%) | 232 (11.5%) |
| 9:00 AM to 9:59 AM | 12 (0.7%) | 79 (3.9%) |
| 10:00 AM to 10:59 AM | 110 (6.3%) | 8 (0.4%) |
| 11:00 AM to 11:59 AM | 6 (0.3%) | 48 (2.4%) |
| 12:00 PM to 3:59 PM | 145 (8.3%) | 119 (5.9%) |
| 4:00 PM to 11:59 PM | 113 (6.5%) | 159 (7.9%) |
| Total | 1,742 (100.0%) | 2,019 (100.0%) |
Housing Occupancy in Collingdale borough
Occupancy by Ownership in Collingdale borough
Of the total 3,395 dwellings in Collingdale borough, owner-occupied units account for 1,958 (57.7%), while renter-occupied units make up 1,437 (42.3%).
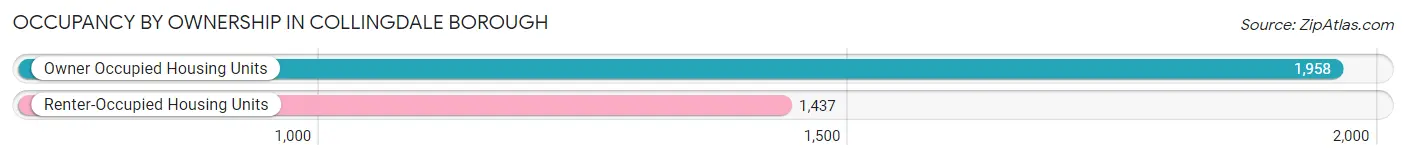
| Occupancy | # Housing Units | % Housing Units |
| Owner Occupied Housing Units | 1,958 | 57.7% |
| Renter-Occupied Housing Units | 1,437 | 42.3% |
| Total Occupied Housing Units | 3,395 | 100.0% |
Occupancy by Household Size in Collingdale borough
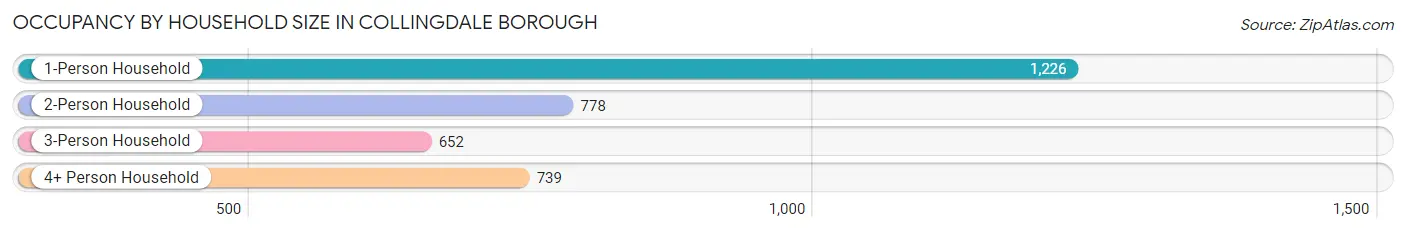
| Household Size | # Housing Units | % Housing Units |
| 1-Person Household | 1,226 | 36.1% |
| 2-Person Household | 778 | 22.9% |
| 3-Person Household | 652 | 19.2% |
| 4+ Person Household | 739 | 21.8% |
| Total Housing Units | 3,395 | 100.0% |
Occupancy by Ownership by Household Size in Collingdale borough
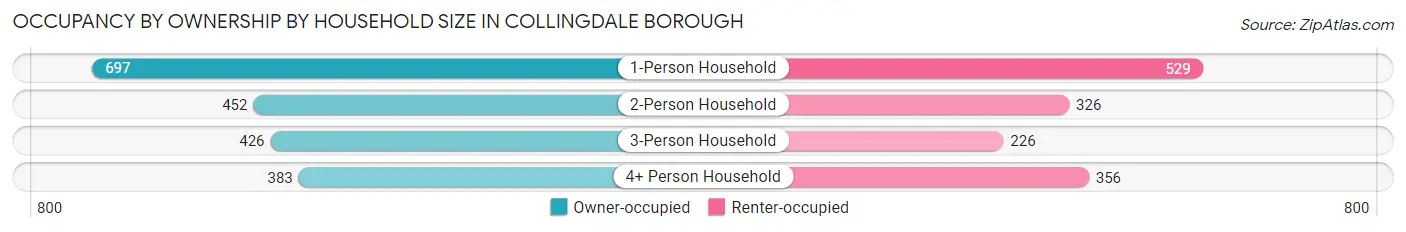
| Household Size | Owner-occupied | Renter-occupied |
| 1-Person Household | 697 (56.9%) | 529 (43.1%) |
| 2-Person Household | 452 (58.1%) | 326 (41.9%) |
| 3-Person Household | 426 (65.3%) | 226 (34.7%) |
| 4+ Person Household | 383 (51.8%) | 356 (48.2%) |
| Total Housing Units | 1,958 (57.7%) | 1,437 (42.3%) |
Occupancy by Educational Attainment in Collingdale borough
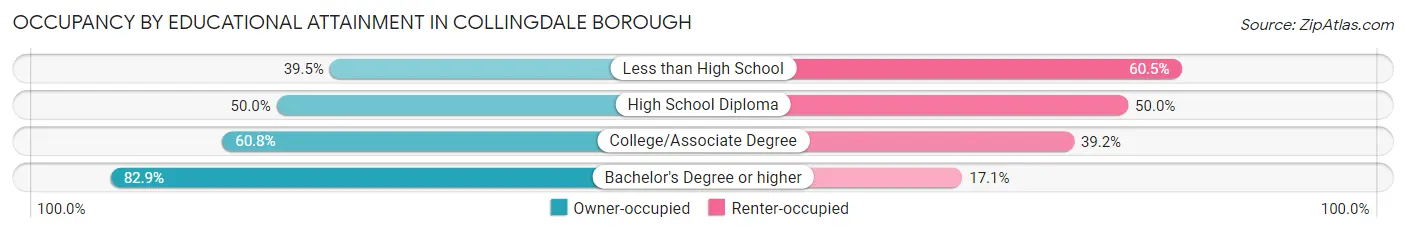
| Household Size | Owner-occupied | Renter-occupied |
| Less than High School | 128 (39.5%) | 196 (60.5%) |
| High School Diploma | 666 (50.0%) | 665 (50.0%) |
| College/Associate Degree | 766 (60.8%) | 494 (39.2%) |
| Bachelor's Degree or higher | 398 (82.9%) | 82 (17.1%) |
Occupancy by Age of Householder in Collingdale borough
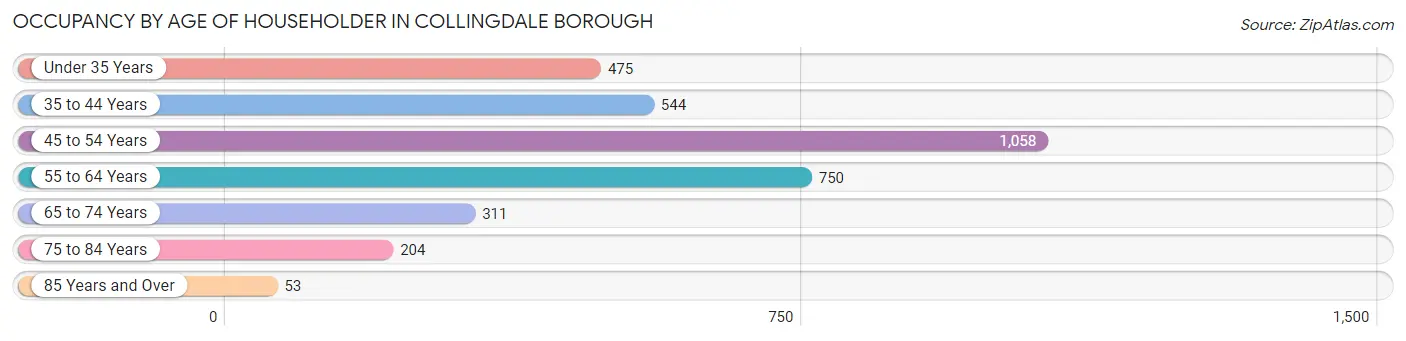
| Age Bracket | # Households | % Households |
| Under 35 Years | 475 | 14.0% |
| 35 to 44 Years | 544 | 16.0% |
| 45 to 54 Years | 1,058 | 31.2% |
| 55 to 64 Years | 750 | 22.1% |
| 65 to 74 Years | 311 | 9.2% |
| 75 to 84 Years | 204 | 6.0% |
| 85 Years and Over | 53 | 1.6% |
| Total | 3,395 | 100.0% |
Housing Finances in Collingdale borough
Median Income by Occupancy in Collingdale borough
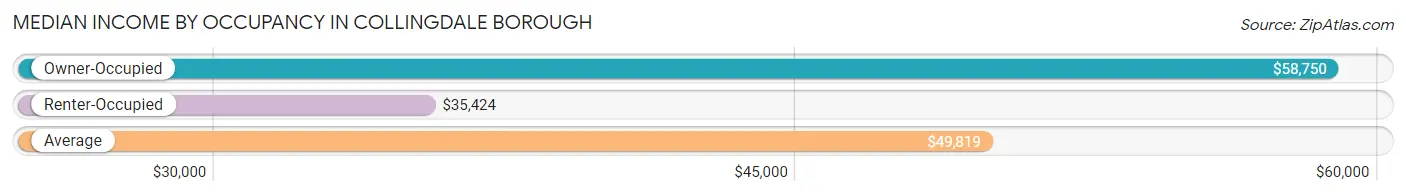
| Occupancy Type | # Households | Median Income |
| Owner-Occupied | 1,958 (57.7%) | $58,750 |
| Renter-Occupied | 1,437 (42.3%) | $35,424 |
| Average | 3,395 (100.0%) | $49,819 |
Occupancy by Householder Income Bracket in Collingdale borough
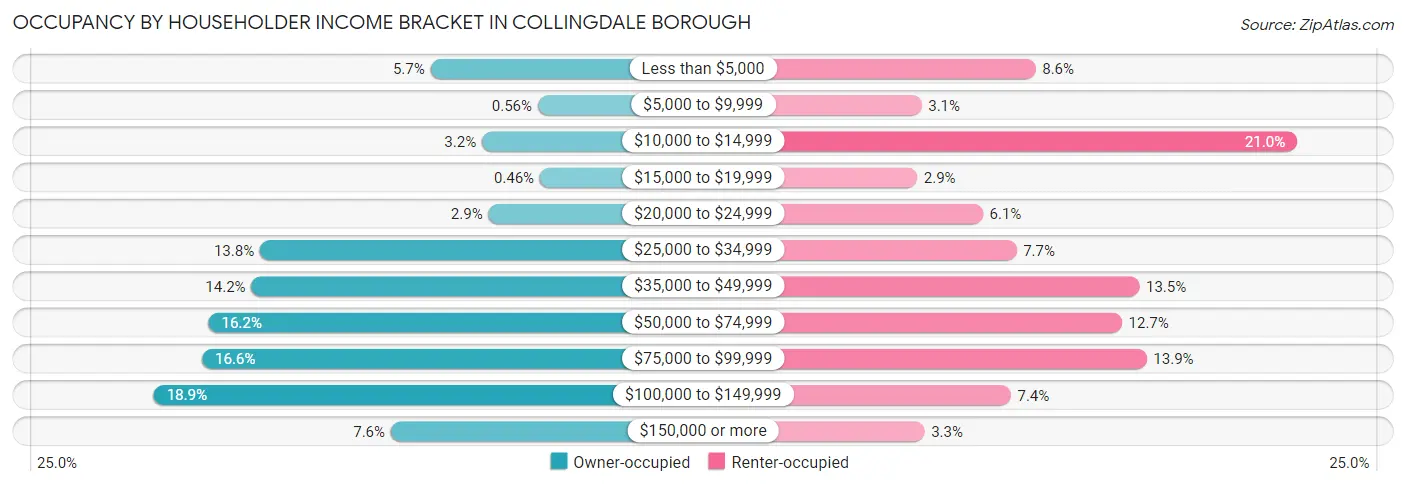
| Income Bracket | Owner-occupied | Renter-occupied |
| Less than $5,000 | 111 (5.7%) | 123 (8.6%) |
| $5,000 to $9,999 | 11 (0.6%) | 45 (3.1%) |
| $10,000 to $14,999 | 63 (3.2%) | 302 (21.0%) |
| $15,000 to $19,999 | 9 (0.5%) | 42 (2.9%) |
| $20,000 to $24,999 | 57 (2.9%) | 87 (6.0%) |
| $25,000 to $34,999 | 270 (13.8%) | 110 (7.6%) |
| $35,000 to $49,999 | 278 (14.2%) | 194 (13.5%) |
| $50,000 to $74,999 | 318 (16.2%) | 182 (12.7%) |
| $75,000 to $99,999 | 324 (16.6%) | 199 (13.9%) |
| $100,000 to $149,999 | 369 (18.9%) | 106 (7.4%) |
| $150,000 or more | 148 (7.6%) | 47 (3.3%) |
| Total | 1,958 (100.0%) | 1,437 (100.0%) |
Monthly Housing Cost Tiers in Collingdale borough
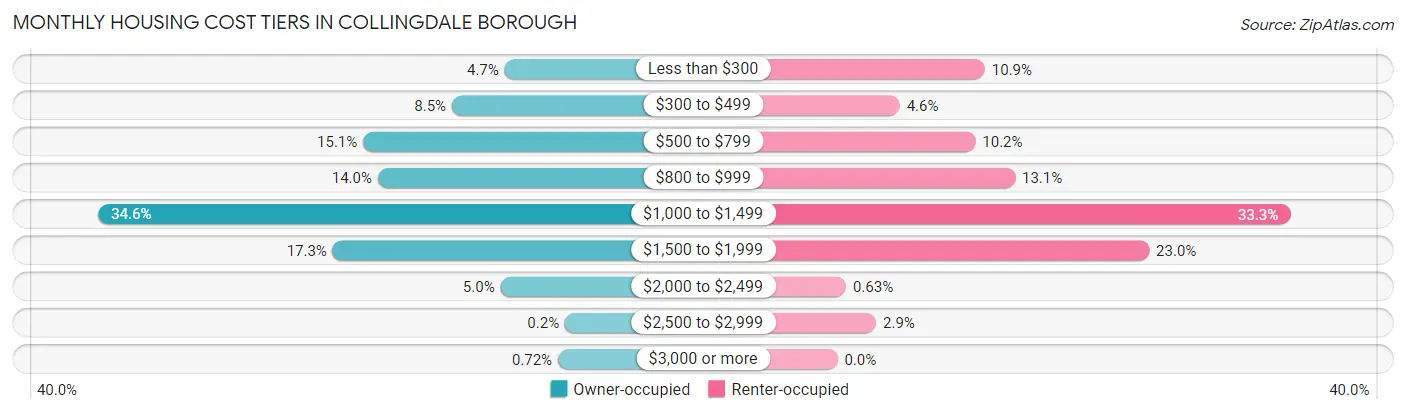
| Monthly Cost | Owner-occupied | Renter-occupied |
| Less than $300 | 91 (4.6%) | 156 (10.9%) |
| $300 to $499 | 167 (8.5%) | 66 (4.6%) |
| $500 to $799 | 295 (15.1%) | 146 (10.2%) |
| $800 to $999 | 274 (14.0%) | 188 (13.1%) |
| $1,000 to $1,499 | 677 (34.6%) | 479 (33.3%) |
| $1,500 to $1,999 | 339 (17.3%) | 330 (23.0%) |
| $2,000 to $2,499 | 97 (5.0%) | 9 (0.6%) |
| $2,500 to $2,999 | 4 (0.2%) | 41 (2.9%) |
| $3,000 or more | 14 (0.7%) | 0 (0.0%) |
| Total | 1,958 (100.0%) | 1,437 (100.0%) |
Physical Housing Characteristics in Collingdale borough
Housing Structures in Collingdale borough
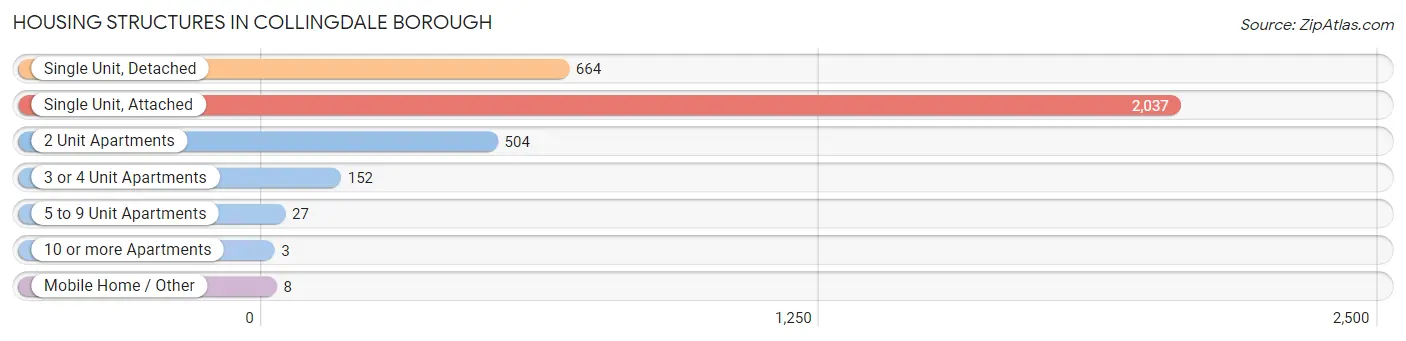
| Structure Type | # Housing Units | % Housing Units |
| Single Unit, Detached | 664 | 19.6% |
| Single Unit, Attached | 2,037 | 60.0% |
| 2 Unit Apartments | 504 | 14.8% |
| 3 or 4 Unit Apartments | 152 | 4.5% |
| 5 to 9 Unit Apartments | 27 | 0.8% |
| 10 or more Apartments | 3 | 0.1% |
| Mobile Home / Other | 8 | 0.2% |
| Total | 3,395 | 100.0% |
Housing Structures by Occupancy in Collingdale borough
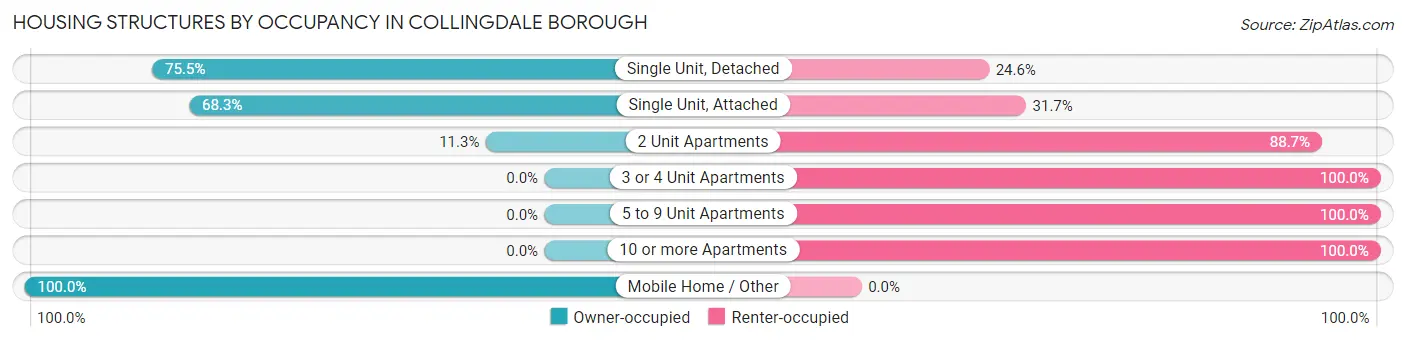
| Structure Type | Owner-occupied | Renter-occupied |
| Single Unit, Detached | 501 (75.4%) | 163 (24.5%) |
| Single Unit, Attached | 1,392 (68.3%) | 645 (31.7%) |
| 2 Unit Apartments | 57 (11.3%) | 447 (88.7%) |
| 3 or 4 Unit Apartments | 0 (0.0%) | 152 (100.0%) |
| 5 to 9 Unit Apartments | 0 (0.0%) | 27 (100.0%) |
| 10 or more Apartments | 0 (0.0%) | 3 (100.0%) |
| Mobile Home / Other | 8 (100.0%) | 0 (0.0%) |
| Total | 1,958 (57.7%) | 1,437 (42.3%) |
Housing Structures by Number of Rooms in Collingdale borough
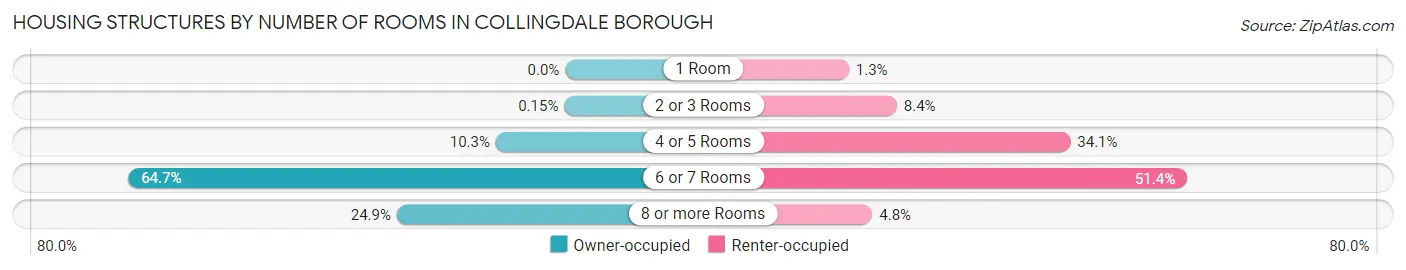
| Number of Rooms | Owner-occupied | Renter-occupied |
| 1 Room | 0 (0.0%) | 19 (1.3%) |
| 2 or 3 Rooms | 3 (0.2%) | 121 (8.4%) |
| 4 or 5 Rooms | 201 (10.3%) | 490 (34.1%) |
| 6 or 7 Rooms | 1,266 (64.7%) | 738 (51.4%) |
| 8 or more Rooms | 488 (24.9%) | 69 (4.8%) |
| Total | 1,958 (100.0%) | 1,437 (100.0%) |
Housing Structure by Heating Type in Collingdale borough
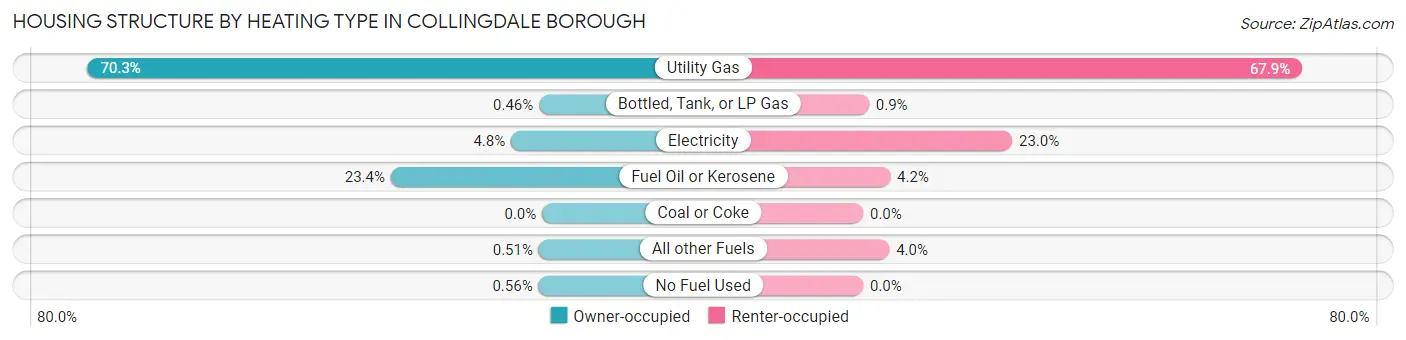
| Heating Type | Owner-occupied | Renter-occupied |
| Utility Gas | 1,376 (70.3%) | 975 (67.8%) |
| Bottled, Tank, or LP Gas | 9 (0.5%) | 13 (0.9%) |
| Electricity | 94 (4.8%) | 331 (23.0%) |
| Fuel Oil or Kerosene | 458 (23.4%) | 60 (4.2%) |
| Coal or Coke | 0 (0.0%) | 0 (0.0%) |
| All other Fuels | 10 (0.5%) | 58 (4.0%) |
| No Fuel Used | 11 (0.6%) | 0 (0.0%) |
| Total | 1,958 (100.0%) | 1,437 (100.0%) |
Household Vehicle Usage in Collingdale borough
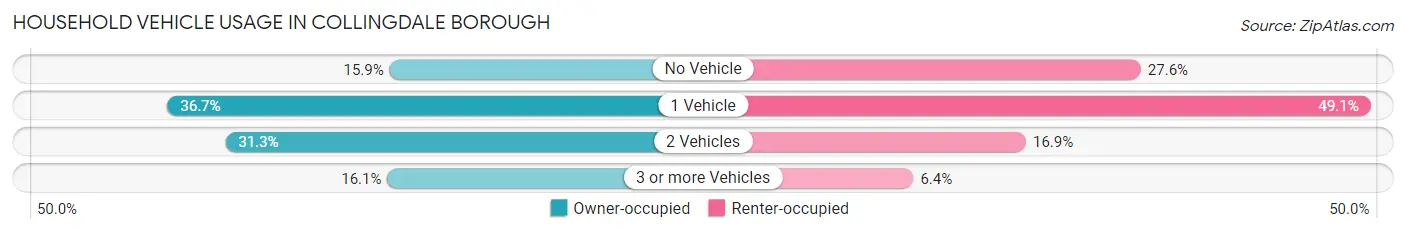
| Vehicles per Household | Owner-occupied | Renter-occupied |
| No Vehicle | 312 (15.9%) | 397 (27.6%) |
| 1 Vehicle | 718 (36.7%) | 705 (49.1%) |
| 2 Vehicles | 612 (31.3%) | 243 (16.9%) |
| 3 or more Vehicles | 316 (16.1%) | 92 (6.4%) |
| Total | 1,958 (100.0%) | 1,437 (100.0%) |
Real Estate & Mortgages in Collingdale borough
Real Estate and Mortgage Overview in Collingdale borough
| Characteristic | Without Mortgage | With Mortgage |
| Housing Units | 713 | 1,245 |
| Median Property Value | $124,500 | $130,500 |
| Median Household Income | $56,370 | $120 |
| Monthly Housing Costs | $627 | $14 |
| Real Estate Taxes | $4,128 | $12 |
Property Value by Mortgage Status in Collingdale borough
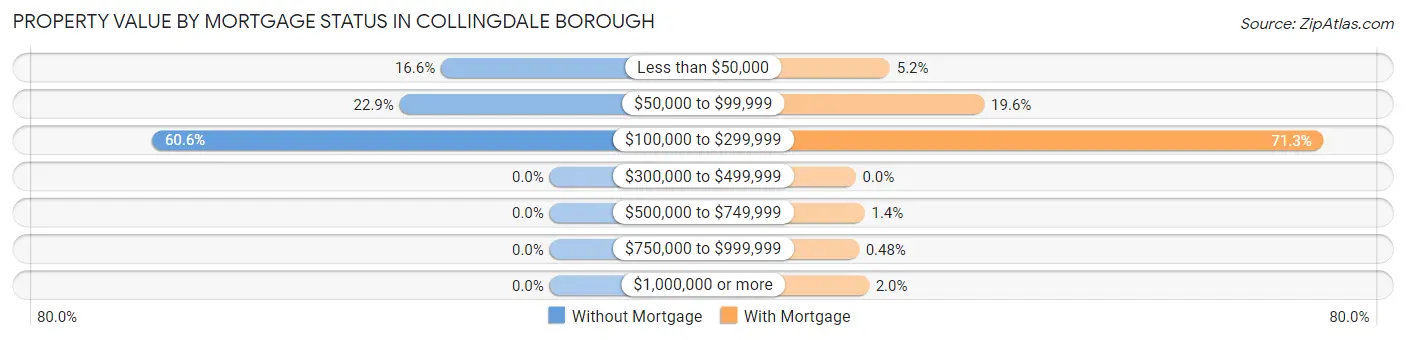
| Property Value | Without Mortgage | With Mortgage |
| Less than $50,000 | 118 (16.6%) | 65 (5.2%) |
| $50,000 to $99,999 | 163 (22.9%) | 244 (19.6%) |
| $100,000 to $299,999 | 432 (60.6%) | 888 (71.3%) |
| $300,000 to $499,999 | 0 (0.0%) | 0 (0.0%) |
| $500,000 to $749,999 | 0 (0.0%) | 17 (1.4%) |
| $750,000 to $999,999 | 0 (0.0%) | 6 (0.5%) |
| $1,000,000 or more | 0 (0.0%) | 25 (2.0%) |
| Total | 713 (100.0%) | 1,245 (100.0%) |
Household Income by Mortgage Status in Collingdale borough
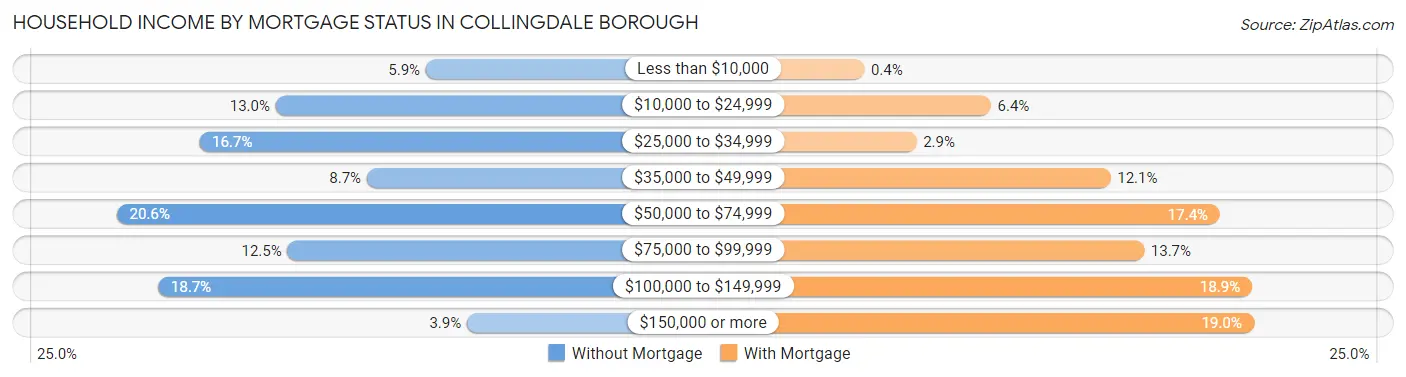
| Household Income | Without Mortgage | With Mortgage |
| Less than $10,000 | 42 (5.9%) | 5 (0.4%) |
| $10,000 to $24,999 | 93 (13.0%) | 80 (6.4%) |
| $25,000 to $34,999 | 119 (16.7%) | 36 (2.9%) |
| $35,000 to $49,999 | 62 (8.7%) | 151 (12.1%) |
| $50,000 to $74,999 | 147 (20.6%) | 216 (17.3%) |
| $75,000 to $99,999 | 89 (12.5%) | 171 (13.7%) |
| $100,000 to $149,999 | 133 (18.6%) | 235 (18.9%) |
| $150,000 or more | 28 (3.9%) | 236 (19.0%) |
| Total | 713 (100.0%) | 1,245 (100.0%) |
Property Value to Household Income Ratio in Collingdale borough
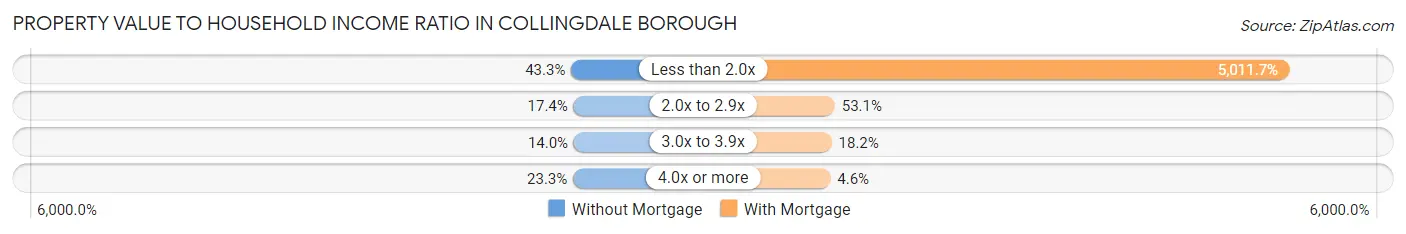
| Value-to-Income Ratio | Without Mortgage | With Mortgage |
| Less than 2.0x | 309 (43.3%) | 62,396 (5,011.7%) |
| 2.0x to 2.9x | 124 (17.4%) | 661 (53.1%) |
| 3.0x to 3.9x | 100 (14.0%) | 226 (18.1%) |
| 4.0x or more | 166 (23.3%) | 57 (4.6%) |
| Total | 713 (100.0%) | 1,245 (100.0%) |
Real Estate Taxes by Mortgage Status in Collingdale borough
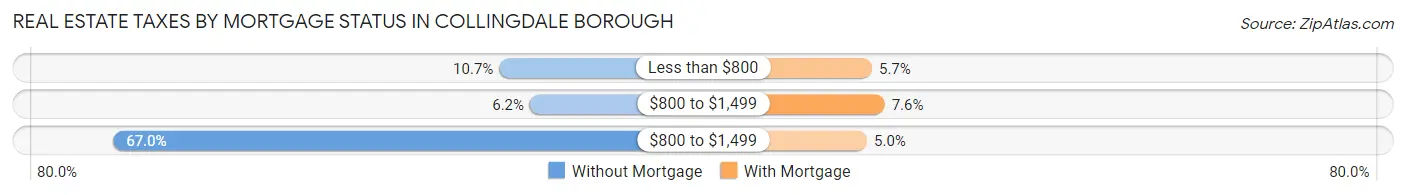
| Property Taxes | Without Mortgage | With Mortgage |
| Less than $800 | 76 (10.7%) | 71 (5.7%) |
| $800 to $1,499 | 44 (6.2%) | 94 (7.5%) |
| $800 to $1,499 | 478 (67.0%) | 62 (5.0%) |
| Total | 713 (100.0%) | 1,245 (100.0%) |
Health & Disability in Collingdale borough
Health Insurance Coverage by Age in Collingdale borough
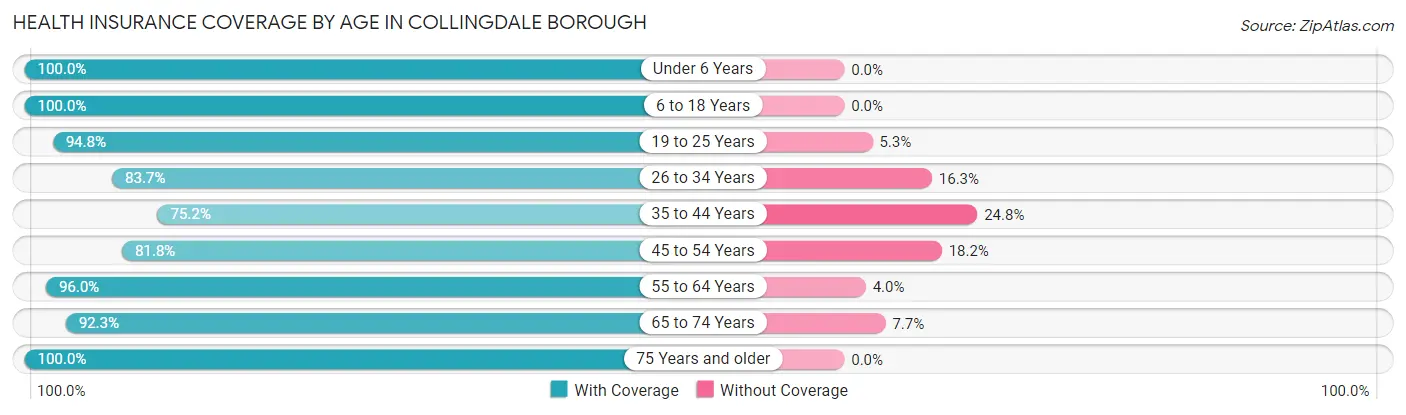
| Age Bracket | With Coverage | Without Coverage |
| Under 6 Years | 378 (100.0%) | 0 (0.0%) |
| 6 to 18 Years | 2,031 (100.0%) | 0 (0.0%) |
| 19 to 25 Years | 722 (94.8%) | 40 (5.2%) |
| 26 to 34 Years | 825 (83.7%) | 161 (16.3%) |
| 35 to 44 Years | 913 (75.2%) | 301 (24.8%) |
| 45 to 54 Years | 1,181 (81.8%) | 262 (18.2%) |
| 55 to 64 Years | 1,130 (96.0%) | 47 (4.0%) |
| 65 to 74 Years | 457 (92.3%) | 38 (7.7%) |
| 75 Years and older | 379 (100.0%) | 0 (0.0%) |
| Total | 8,016 (90.4%) | 849 (9.6%) |
Health Insurance Coverage by Citizenship Status in Collingdale borough
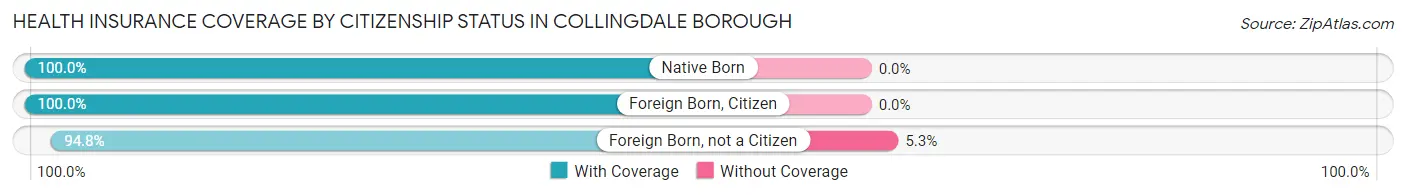
| Citizenship Status | With Coverage | Without Coverage |
| Native Born | 378 (100.0%) | 0 (0.0%) |
| Foreign Born, Citizen | 2,031 (100.0%) | 0 (0.0%) |
| Foreign Born, not a Citizen | 722 (94.8%) | 40 (5.2%) |
Health Insurance Coverage by Household Income in Collingdale borough
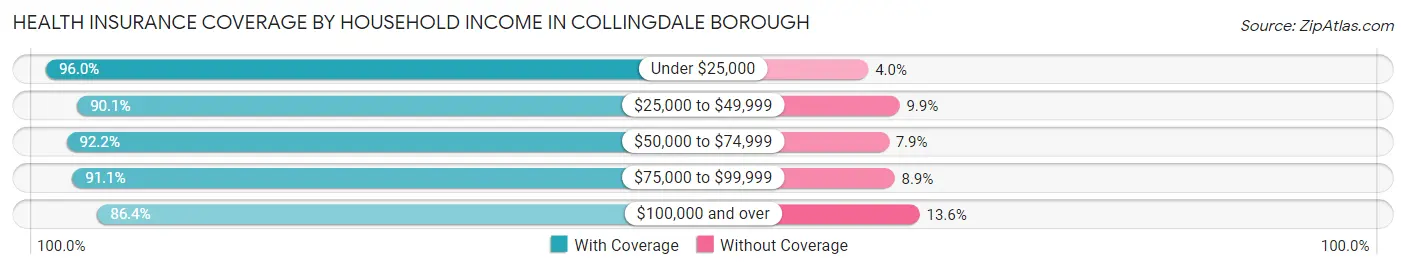
| Household Income | With Coverage | Without Coverage |
| Under $25,000 | 1,292 (96.0%) | 54 (4.0%) |
| $25,000 to $49,999 | 1,698 (90.1%) | 186 (9.9%) |
| $50,000 to $74,999 | 1,456 (92.1%) | 124 (7.9%) |
| $75,000 to $99,999 | 1,314 (91.1%) | 129 (8.9%) |
| $100,000 and over | 2,256 (86.4%) | 356 (13.6%) |
Public vs Private Health Insurance Coverage by Age in Collingdale borough
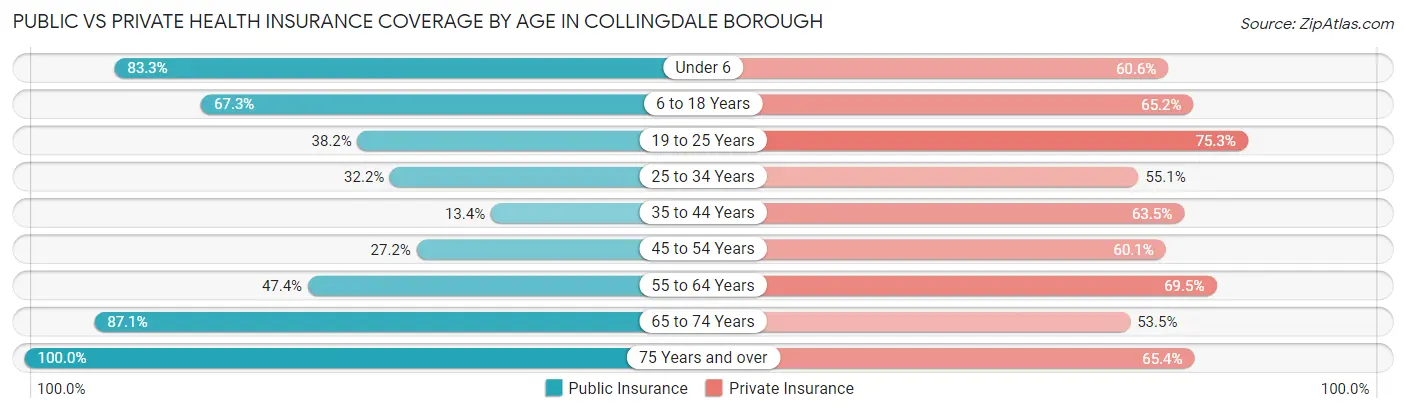
| Age Bracket | Public Insurance | Private Insurance |
| Under 6 | 315 (83.3%) | 229 (60.6%) |
| 6 to 18 Years | 1,366 (67.3%) | 1,325 (65.2%) |
| 19 to 25 Years | 291 (38.2%) | 574 (75.3%) |
| 25 to 34 Years | 317 (32.2%) | 543 (55.1%) |
| 35 to 44 Years | 163 (13.4%) | 771 (63.5%) |
| 45 to 54 Years | 393 (27.2%) | 867 (60.1%) |
| 55 to 64 Years | 558 (47.4%) | 818 (69.5%) |
| 65 to 74 Years | 431 (87.1%) | 265 (53.5%) |
| 75 Years and over | 379 (100.0%) | 248 (65.4%) |
| Total | 4,213 (47.5%) | 5,640 (63.6%) |
Disability Status by Sex by Age in Collingdale borough
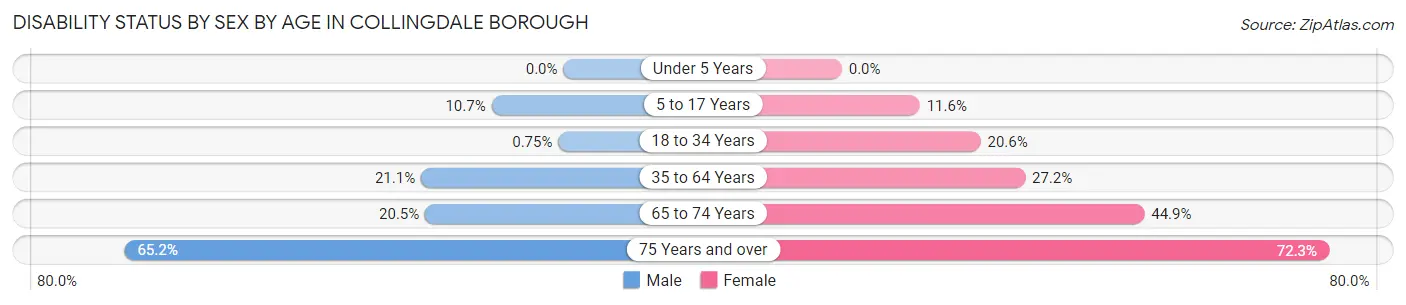
| Age Bracket | Male | Female |
| Under 5 Years | 0 (0.0%) | 0 (0.0%) |
| 5 to 17 Years | 113 (10.7%) | 81 (11.6%) |
| 18 to 34 Years | 6 (0.7%) | 262 (20.6%) |
| 35 to 64 Years | 356 (21.1%) | 585 (27.2%) |
| 65 to 74 Years | 39 (20.5%) | 137 (44.9%) |
| 75 Years and over | 101 (65.2%) | 162 (72.3%) |
Disability Class by Sex by Age in Collingdale borough
Disability Class: Hearing Difficulty
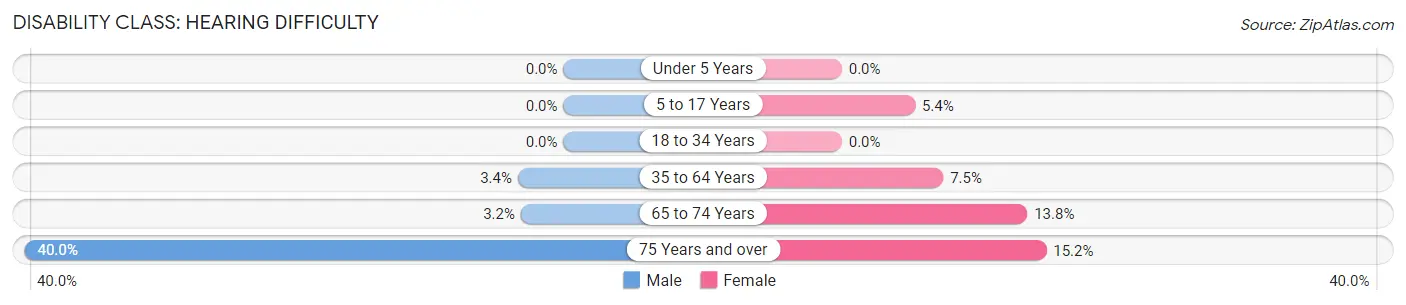
| Age Bracket | Male | Female |
| Under 5 Years | 0 (0.0%) | 0 (0.0%) |
| 5 to 17 Years | 0 (0.0%) | 38 (5.4%) |
| 18 to 34 Years | 0 (0.0%) | 0 (0.0%) |
| 35 to 64 Years | 57 (3.4%) | 162 (7.5%) |
| 65 to 74 Years | 6 (3.2%) | 42 (13.8%) |
| 75 Years and over | 62 (40.0%) | 34 (15.2%) |
Disability Class: Vision Difficulty
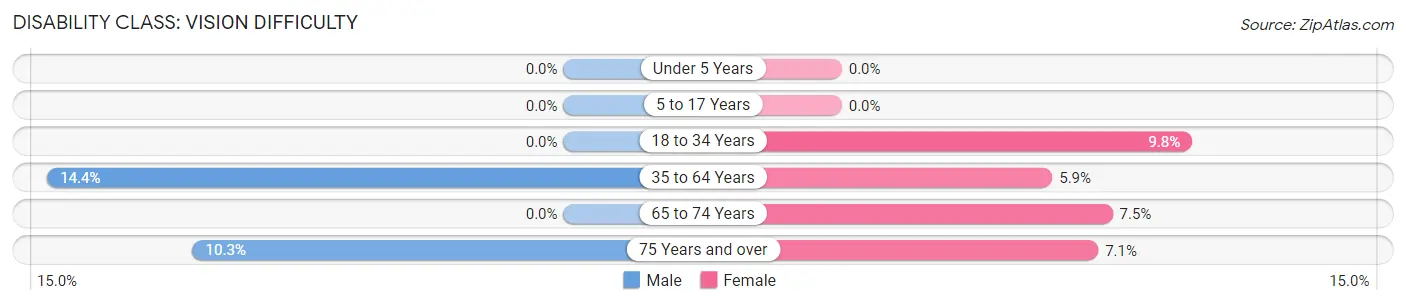
| Age Bracket | Male | Female |
| Under 5 Years | 0 (0.0%) | 0 (0.0%) |
| 5 to 17 Years | 0 (0.0%) | 0 (0.0%) |
| 18 to 34 Years | 0 (0.0%) | 124 (9.8%) |
| 35 to 64 Years | 242 (14.4%) | 126 (5.9%) |
| 65 to 74 Years | 0 (0.0%) | 23 (7.5%) |
| 75 Years and over | 16 (10.3%) | 16 (7.1%) |
Disability Class: Cognitive Difficulty
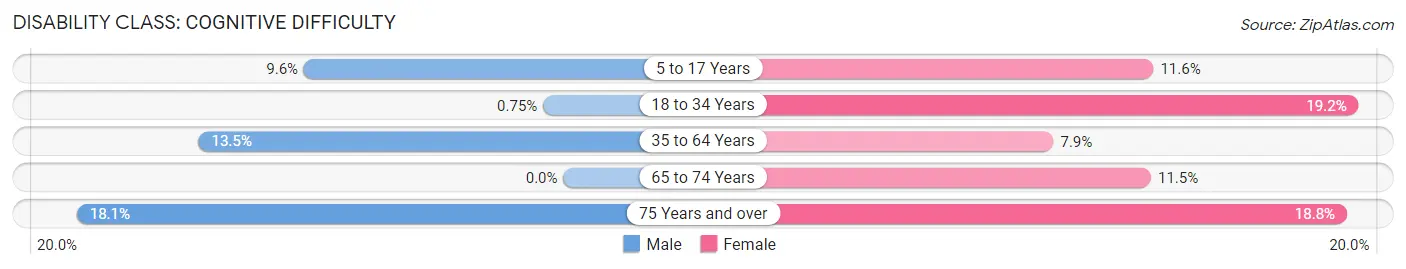
| Age Bracket | Male | Female |
| 5 to 17 Years | 102 (9.6%) | 81 (11.6%) |
| 18 to 34 Years | 6 (0.7%) | 244 (19.2%) |
| 35 to 64 Years | 228 (13.5%) | 169 (7.9%) |
| 65 to 74 Years | 0 (0.0%) | 35 (11.5%) |
| 75 Years and over | 28 (18.1%) | 42 (18.8%) |
Disability Class: Ambulatory Difficulty
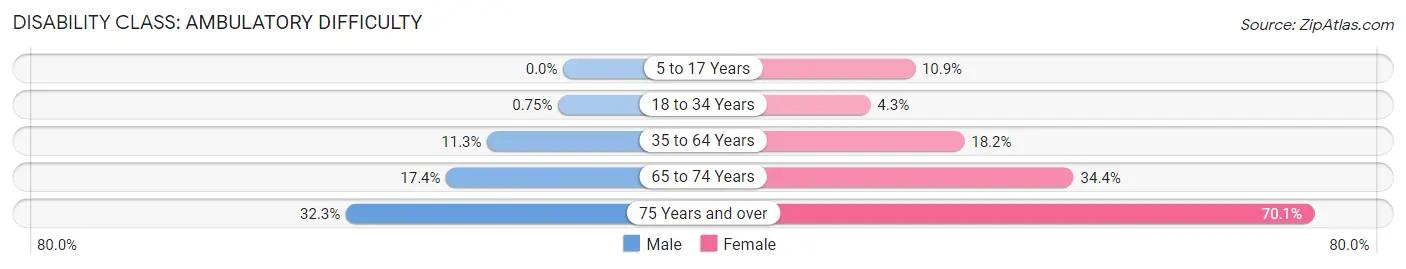
| Age Bracket | Male | Female |
| 5 to 17 Years | 0 (0.0%) | 76 (10.9%) |
| 18 to 34 Years | 6 (0.7%) | 54 (4.3%) |
| 35 to 64 Years | 190 (11.3%) | 391 (18.2%) |
| 65 to 74 Years | 33 (17.4%) | 105 (34.4%) |
| 75 Years and over | 50 (32.3%) | 157 (70.1%) |
Disability Class: Self-Care Difficulty
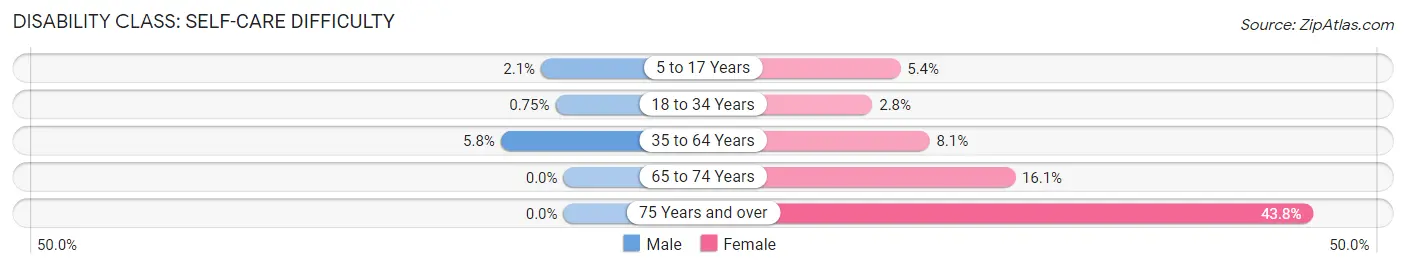
| Age Bracket | Male | Female |
| 5 to 17 Years | 22 (2.1%) | 38 (5.4%) |
| 18 to 34 Years | 6 (0.7%) | 36 (2.8%) |
| 35 to 64 Years | 98 (5.8%) | 175 (8.1%) |
| 65 to 74 Years | 0 (0.0%) | 49 (16.1%) |
| 75 Years and over | 0 (0.0%) | 98 (43.8%) |
Technology Access in Collingdale borough
Computing Device Access in Collingdale borough
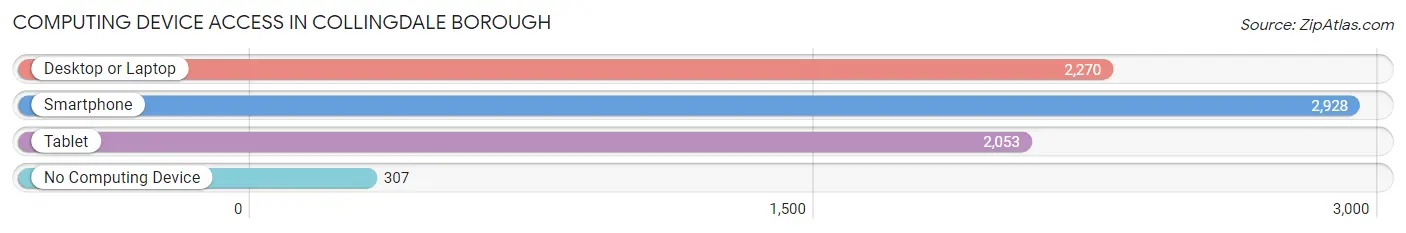
| Device Type | # Households | % Households |
| Desktop or Laptop | 2,270 | 66.9% |
| Smartphone | 2,928 | 86.2% |
| Tablet | 2,053 | 60.5% |
| No Computing Device | 307 | 9.0% |
| Total | 3,395 | 100.0% |
Internet Access in Collingdale borough
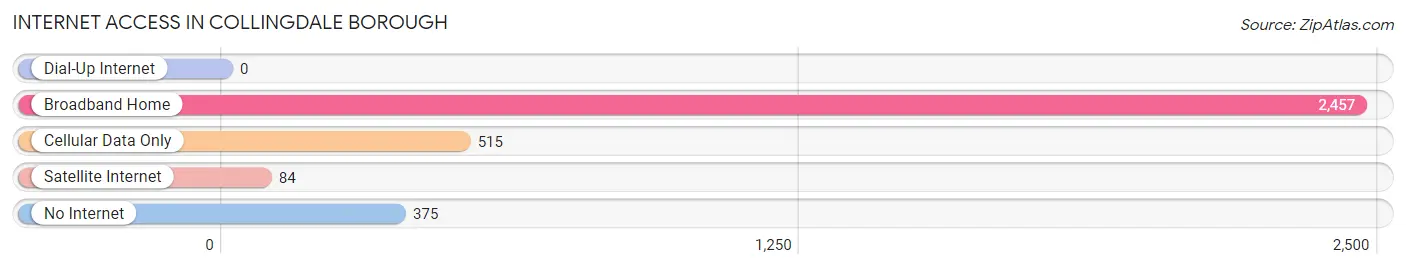
| Internet Type | # Households | % Households |
| Dial-Up Internet | 0 | 0.0% |
| Broadband Home | 2,457 | 72.4% |
| Cellular Data Only | 515 | 15.2% |
| Satellite Internet | 84 | 2.5% |
| No Internet | 375 | 11.1% |
| Total | 3,395 | 100.0% |
Collingdale borough Summary
Collingdale Borough is a small borough located in Delaware County, Pennsylvania. It is situated just south of the city of Philadelphia and is part of the Philadelphia metropolitan area. The borough was incorporated in 1891 and has a population of approximately 8,000 people.
History
The area that is now Collingdale Borough was originally inhabited by the Lenni Lenape Native Americans. The first European settlers arrived in the area in the late 1600s and early 1700s. The area was part of Darby Township until 1891 when it was incorporated as Collingdale Borough. The name of the borough is derived from the name of the Colling family, who were early settlers in the area.
The borough was primarily a rural farming community until the late 19th century when the Philadelphia and West Chester Railroad was built through the area. This allowed for the development of industry and commerce in the area, which led to the growth of the borough.
Geography
Collingdale Borough is located in southeastern Pennsylvania, just south of the city of Philadelphia. It is situated in Delaware County and is part of the Philadelphia metropolitan area. The borough is bordered by Darby Township to the north, Folcroft Borough to the east, Ridley Township to the south, and Springfield Township to the west.
The borough covers an area of 1.2 square miles and is mostly flat. The borough is located in the Piedmont region of Pennsylvania and is part of the Atlantic Coastal Plain. The borough is located in the Delaware River watershed and is drained by Darby Creek.
Economy
The economy of Collingdale Borough is primarily based on retail and services. The borough is home to several small businesses, including restaurants, convenience stores, and auto repair shops. The borough also has a few industrial businesses, including a printing company and a metal fabrication shop.
The borough is also home to a few large employers, including a medical center and a nursing home. The borough is also home to a few educational institutions, including a community college and a technical school.
Demographics
As of the 2010 census, Collingdale Borough had a population of 8,000 people. The racial makeup of the borough was 79.3% White, 13.2% African American, 0.3% Native American, 1.2% Asian, and 4.9% from other races. Hispanic or Latino of any race were 6.2% of the population.
The median household income in the borough was $41,000, and the median family income was $48,000. The per capita income in the borough was $20,000. About 11.3% of the population was below the poverty line.
Collingdale Borough is a small borough with a rich history and a diverse population. The borough is home to a variety of businesses and educational institutions, and is a great place to live and work.
Common Questions
What is Per Capita Income in Collingdale borough?
Per Capita income in Collingdale borough is $24,726.
What is the Median Family Income in Collingdale borough?
Median Family Income in Collingdale borough is $65,264.
What is the Median Household income in Collingdale borough?
Median Household Income in Collingdale borough is $49,819.
What is Income or Wage Gap in Collingdale borough?
Income or Wage Gap in Collingdale borough is 9.3%.
Women in Collingdale borough earn 90.7 cents for every dollar earned by a man.
What is Inequality or Gini Index in Collingdale borough?
Inequality or Gini Index in Collingdale borough is 0.44.
What is the Total Population of Collingdale borough?
Total Population of Collingdale borough is 8,865.
What is the Total Male Population of Collingdale borough?
Total Male Population of Collingdale borough is 4,039.
What is the Total Female Population of Collingdale borough?
Total Female Population of Collingdale borough is 4,826.
What is the Ratio of Males per 100 Females in Collingdale borough?
There are 83.69 Males per 100 Females in Collingdale borough.
What is the Ratio of Females per 100 Males in Collingdale borough?
There are 119.49 Females per 100 Males in Collingdale borough.
What is the Median Population Age in Collingdale borough?
Median Population Age in Collingdale borough is 36.5 Years.
What is the Average Family Size in Collingdale borough
Average Family Size in Collingdale borough is 3.4 People.
What is the Average Household Size in Collingdale borough
Average Household Size in Collingdale borough is 2.6 People.
How Large is the Labor Force in Collingdale borough?
There are 4,615 People in the Labor Forcein in Collingdale borough.
What is the Percentage of People in the Labor Force in Collingdale borough?
64.5% of People are in the Labor Force in Collingdale borough.
What is the Unemployment Rate in Collingdale borough?
Unemployment Rate in Collingdale borough is 8.6%.