Susquehanna Trails, PA Map & Demographics
Susquehanna Trails Map
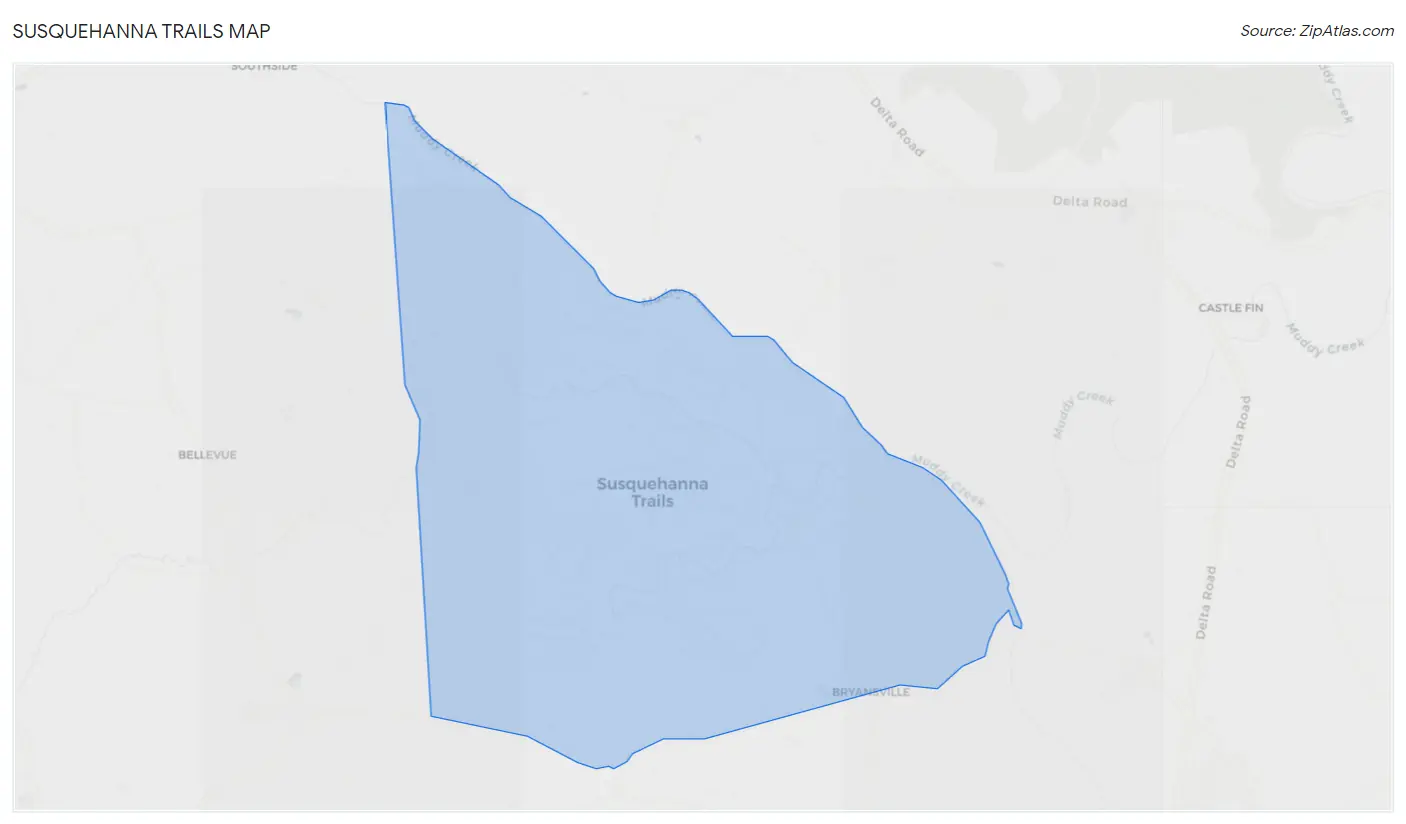
Susquehanna Trails Overview
$30,102
PER CAPITA INCOME
$64,615
AVG FAMILY INCOME
$59,393
AVG HOUSEHOLD INCOME
0.34
INEQUALITY / GINI INDEX
2,097
TOTAL POPULATION
1,031
MALE POPULATION
1,066
FEMALE POPULATION
96.72
MALES / 100 FEMALES
103.39
FEMALES / 100 MALES
36.2
MEDIAN AGE
2.9
AVG FAMILY SIZE
2.6
AVG HOUSEHOLD SIZE
1,291
LABOR FORCE [ PEOPLE ]
72.1%
PERCENT IN LABOR FORCE
3.0%
UNEMPLOYMENT RATE
Income in Susquehanna Trails
Income Overview in Susquehanna Trails
Per Capita Income in Susquehanna Trails is $30,102, while median incomes of families and households are $64,615 and $59,393 respectively.
| Characteristic | Number | Measure |
| Per Capita Income | 2,097 | $30,102 |
| Median Family Income | 622 | $64,615 |
| Mean Family Income | 622 | $86,487 |
| Median Household Income | 808 | $59,393 |
| Mean Household Income | 808 | $76,664 |
| Income Deficit | 622 | $0 |
| Wage / Income Gap (%) | 2,097 | 0.00% |
| Wage / Income Gap ($) | 2,097 | 100.00¢ per $1 |
| Gini / Inequality Index | 2,097 | 0.34 |
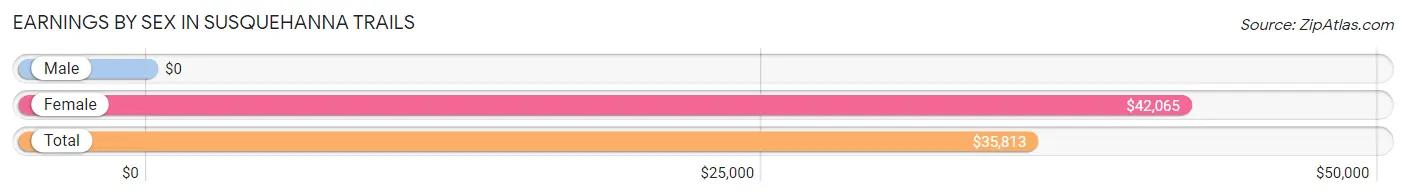
Earnings by Sex in Susquehanna Trails
| Sex | Number | Average Earnings |
| Male | 703 (52.1%) | $0 |
| Female | 646 (47.9%) | $42,065 |
| Total | 1,349 (100.0%) | $35,813 |
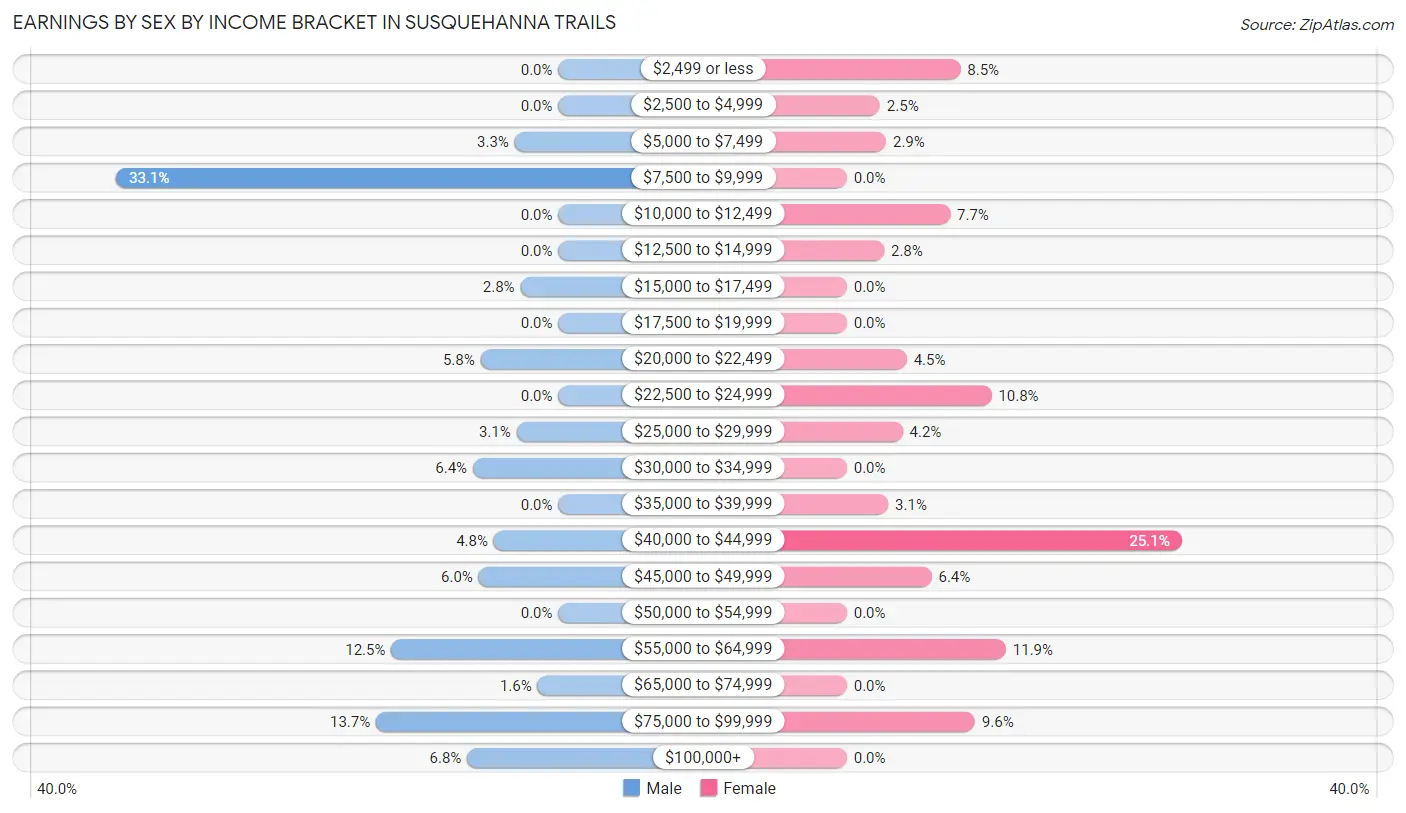
Earnings by Sex by Income Bracket in Susquehanna Trails
The most common earnings brackets in Susquehanna Trails are $7,500 to $9,999 for men (233 | 33.1%) and $40,000 to $44,999 for women (162 | 25.1%).
| Income | Male | Female |
| $2,499 or less | 0 (0.0%) | 55 (8.5%) |
| $2,500 to $4,999 | 0 (0.0%) | 16 (2.5%) |
| $5,000 to $7,499 | 23 (3.3%) | 19 (2.9%) |
| $7,500 to $9,999 | 233 (33.1%) | 0 (0.0%) |
| $10,000 to $12,499 | 0 (0.0%) | 50 (7.7%) |
| $12,500 to $14,999 | 0 (0.0%) | 18 (2.8%) |
| $15,000 to $17,499 | 20 (2.8%) | 0 (0.0%) |
| $17,500 to $19,999 | 0 (0.0%) | 0 (0.0%) |
| $20,000 to $22,499 | 41 (5.8%) | 29 (4.5%) |
| $22,500 to $24,999 | 0 (0.0%) | 70 (10.8%) |
| $25,000 to $29,999 | 22 (3.1%) | 27 (4.2%) |
| $30,000 to $34,999 | 45 (6.4%) | 0 (0.0%) |
| $35,000 to $39,999 | 0 (0.0%) | 20 (3.1%) |
| $40,000 to $44,999 | 34 (4.8%) | 162 (25.1%) |
| $45,000 to $49,999 | 42 (6.0%) | 41 (6.4%) |
| $50,000 to $54,999 | 0 (0.0%) | 0 (0.0%) |
| $55,000 to $64,999 | 88 (12.5%) | 77 (11.9%) |
| $65,000 to $74,999 | 11 (1.6%) | 0 (0.0%) |
| $75,000 to $99,999 | 96 (13.7%) | 62 (9.6%) |
| $100,000+ | 48 (6.8%) | 0 (0.0%) |
| Total | 703 (100.0%) | 646 (100.0%) |
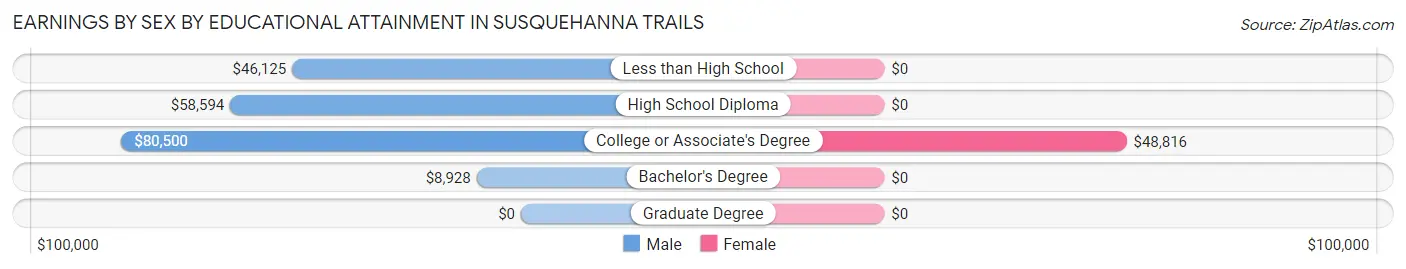
Earnings by Sex by Educational Attainment in Susquehanna Trails
| Educational Attainment | Male Income | Female Income |
| Less than High School | $46,125 | $0 |
| High School Diploma | $58,594 | $0 |
| College or Associate's Degree | $80,500 | $48,816 |
| Bachelor's Degree | $8,928 | $0 |
| Graduate Degree | - | - |
| Total | - | - |
Family Income in Susquehanna Trails
Family Income Brackets in Susquehanna Trails
According to the Susquehanna Trails family income data, there are 235 families falling into the $50,000 to $74,999 income range, which is the most common income bracket and makes up 37.8% of all families.
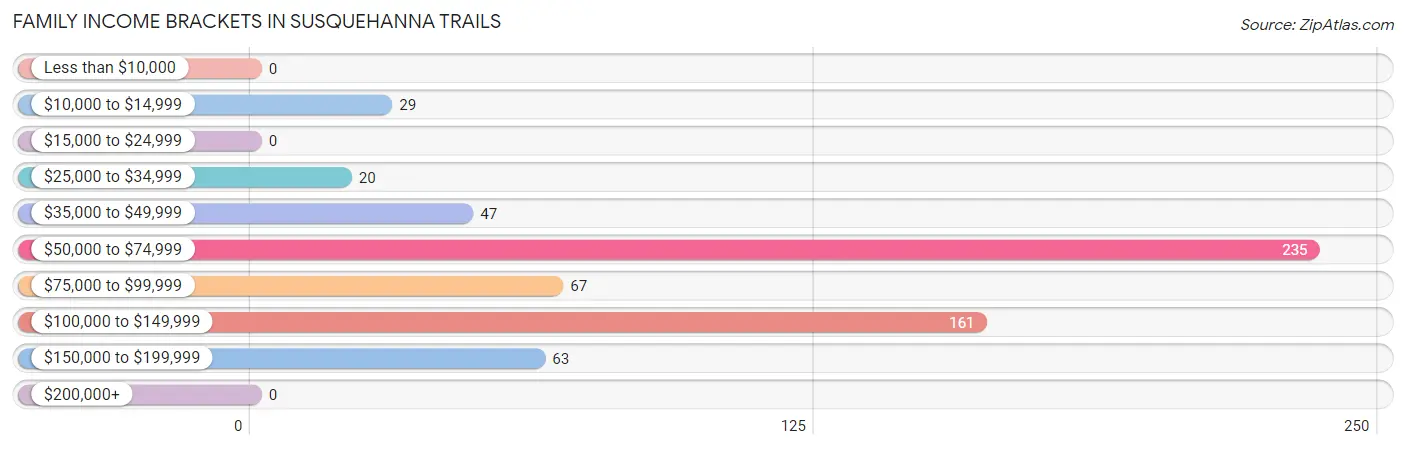
| Income Bracket | # Families | % Families |
| Less than $10,000 | 0 | 0.0% |
| $10,000 to $14,999 | 29 | 4.7% |
| $15,000 to $24,999 | 0 | 0.0% |
| $25,000 to $34,999 | 20 | 3.2% |
| $35,000 to $49,999 | 47 | 7.6% |
| $50,000 to $74,999 | 235 | 37.8% |
| $75,000 to $99,999 | 67 | 10.8% |
| $100,000 to $149,999 | 161 | 25.9% |
| $150,000 to $199,999 | 63 | 10.1% |
| $200,000+ | 0 | 0.0% |
Family Income by Famaliy Size in Susquehanna Trails
5-person families (62 | 10.0%) account for the highest median family income in Susquehanna Trails with $166,149 per family, while 3-person families (112 | 18.0%) have the highest median income of $44,861 per family member.
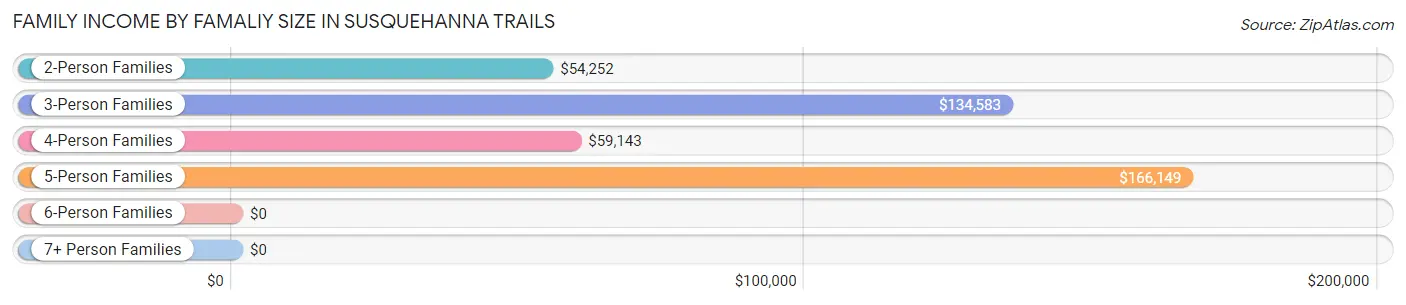
| Income Bracket | # Families | Median Income |
| 2-Person Families | 356 (57.2%) | $54,252 |
| 3-Person Families | 112 (18.0%) | $134,583 |
| 4-Person Families | 92 (14.8%) | $59,143 |
| 5-Person Families | 62 (10.0%) | $166,149 |
| 6-Person Families | 0 (0.0%) | $0 |
| 7+ Person Families | 0 (0.0%) | $0 |
| Total | 622 (100.0%) | $64,615 |
Family Income by Number of Earners in Susquehanna Trails
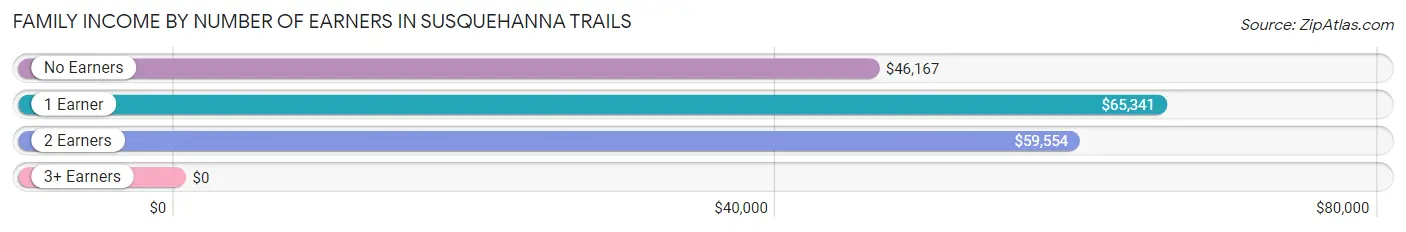
| Number of Earners | # Families | Median Income |
| No Earners | 72 (11.6%) | $46,167 |
| 1 Earner | 113 (18.2%) | $65,341 |
| 2 Earners | 395 (63.5%) | $59,554 |
| 3+ Earners | 42 (6.8%) | $0 |
| Total | 622 (100.0%) | $64,615 |
Household Income in Susquehanna Trails
Household Income Brackets in Susquehanna Trails
With 281 households falling in the category, the $50,000 to $74,999 income range is the most frequent in Susquehanna Trails, accounting for 34.8% of all households.
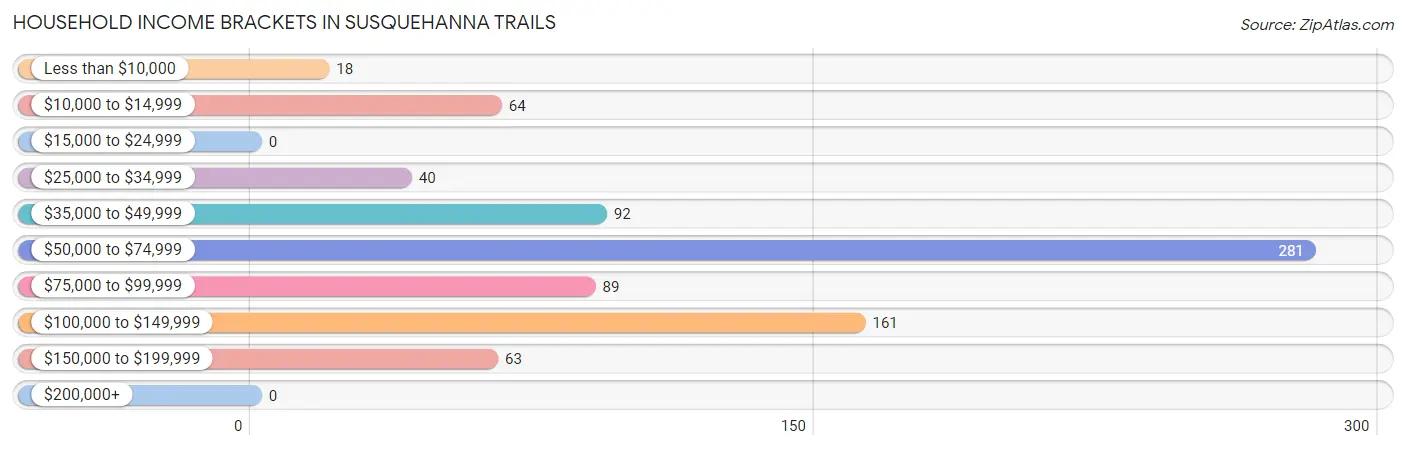
| Income Bracket | # Households | % Households |
| Less than $10,000 | 18 | 2.2% |
| $10,000 to $14,999 | 64 | 7.9% |
| $15,000 to $24,999 | 0 | 0.0% |
| $25,000 to $34,999 | 40 | 5.0% |
| $35,000 to $49,999 | 92 | 11.4% |
| $50,000 to $74,999 | 281 | 34.8% |
| $75,000 to $99,999 | 89 | 11.0% |
| $100,000 to $149,999 | 161 | 19.9% |
| $150,000 to $199,999 | 63 | 7.8% |
| $200,000+ | 0 | 0.0% |
Household Income by Householder Age in Susquehanna Trails
The median household income in Susquehanna Trails is $59,393, with the highest median household income of $55,250 found in the 45 to 64 years age bracket for the primary householder. A total of 412 households (51.0%) fall into this category.
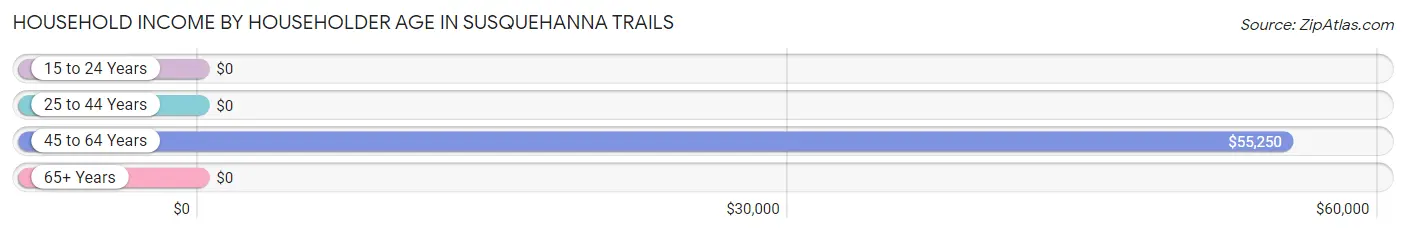
| Income Bracket | # Households | Median Income |
| 15 to 24 Years | 0 (0.0%) | $0 |
| 25 to 44 Years | 258 (31.9%) | $0 |
| 45 to 64 Years | 412 (51.0%) | $55,250 |
| 65+ Years | 138 (17.1%) | $0 |
| Total | 808 (100.0%) | $59,393 |
Poverty in Susquehanna Trails
Income Below Poverty by Sex and Age in Susquehanna Trails
With 1.3% poverty level for males and 15.5% for females among the residents of Susquehanna Trails, 75 year old and over males and 18 to 24 year old females are the most vulnerable to poverty, with 13 males (16.7%) and 19 females (100.0%) in their respective age groups living below the poverty level.
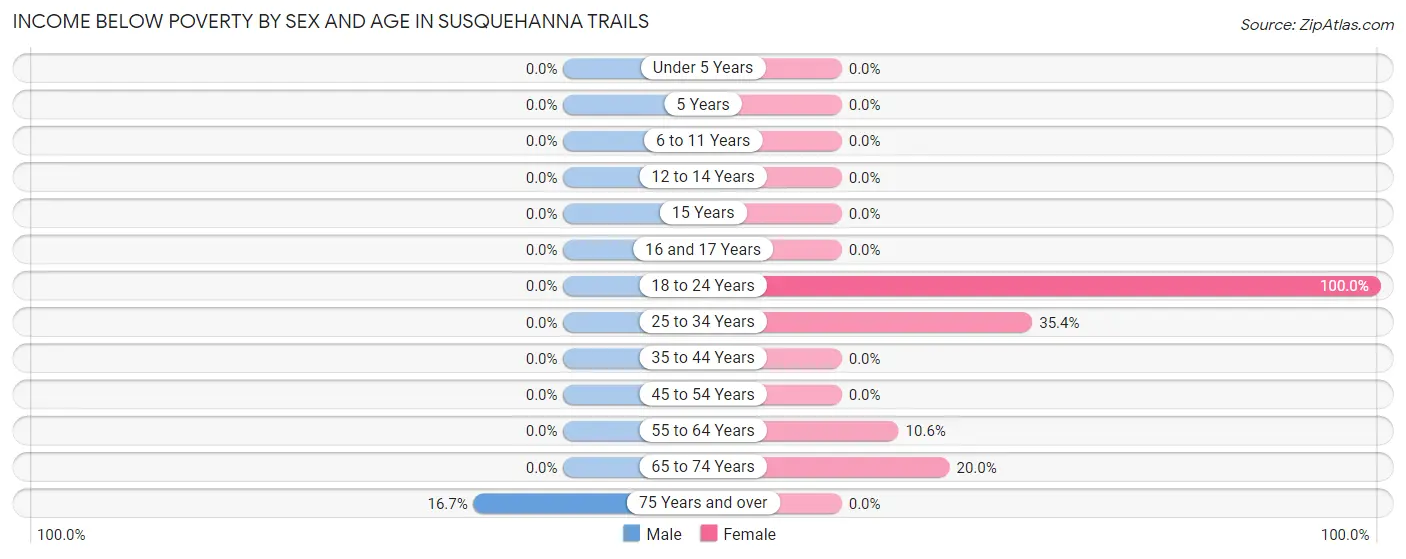
| Age Bracket | Male | Female |
| Under 5 Years | 0 (0.0%) | 0 (0.0%) |
| 5 Years | 0 (0.0%) | 0 (0.0%) |
| 6 to 11 Years | 0 (0.0%) | 0 (0.0%) |
| 12 to 14 Years | 0 (0.0%) | 0 (0.0%) |
| 15 Years | 0 (0.0%) | 0 (0.0%) |
| 16 and 17 Years | 0 (0.0%) | 0 (0.0%) |
| 18 to 24 Years | 0 (0.0%) | 19 (100.0%) |
| 25 to 34 Years | 0 (0.0%) | 99 (35.4%) |
| 35 to 44 Years | 0 (0.0%) | 0 (0.0%) |
| 45 to 54 Years | 0 (0.0%) | 0 (0.0%) |
| 55 to 64 Years | 0 (0.0%) | 29 (10.5%) |
| 65 to 74 Years | 0 (0.0%) | 18 (20.0%) |
| 75 Years and over | 13 (16.7%) | 0 (0.0%) |
| Total | 13 (1.3%) | 165 (15.5%) |
Income Above Poverty by Sex and Age in Susquehanna Trails
According to the poverty statistics in Susquehanna Trails, males aged under 5 years and females aged under 5 years are the age groups that are most secure financially, with 100.0% of males and 100.0% of females in these age groups living above the poverty line.
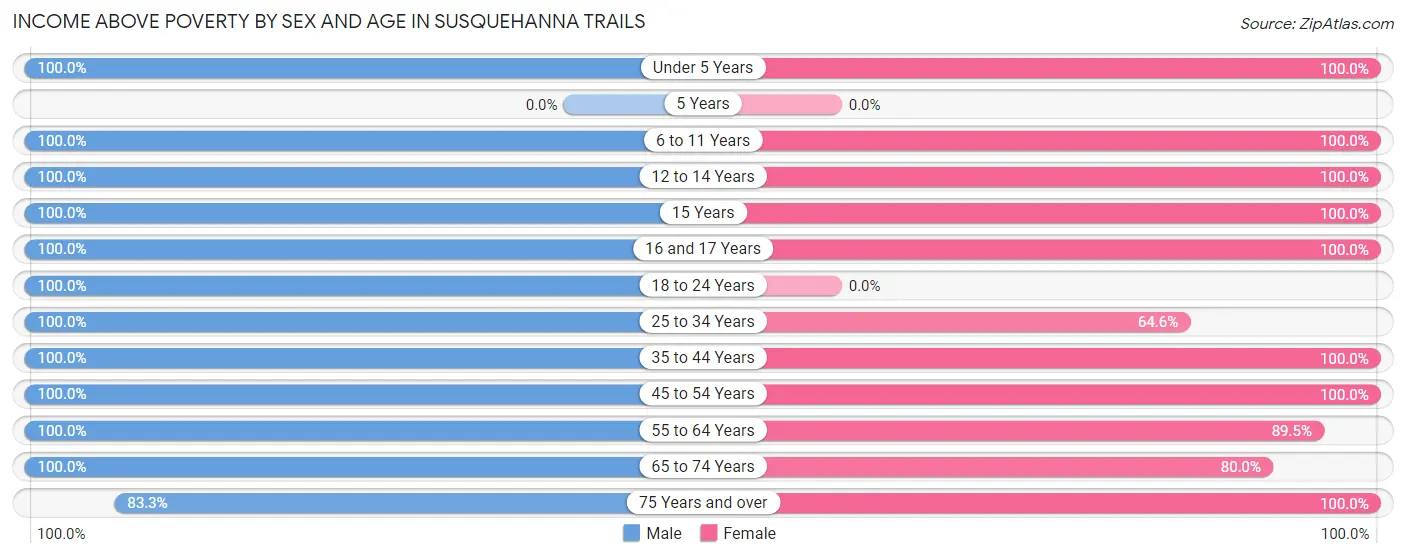
| Age Bracket | Male | Female |
| Under 5 Years | 30 (100.0%) | 15 (100.0%) |
| 5 Years | 0 (0.0%) | 0 (0.0%) |
| 6 to 11 Years | 33 (100.0%) | 60 (100.0%) |
| 12 to 14 Years | 51 (100.0%) | 44 (100.0%) |
| 15 Years | 21 (100.0%) | 52 (100.0%) |
| 16 and 17 Years | 37 (100.0%) | 4 (100.0%) |
| 18 to 24 Years | 70 (100.0%) | 0 (0.0%) |
| 25 to 34 Years | 328 (100.0%) | 181 (64.6%) |
| 35 to 44 Years | 134 (100.0%) | 71 (100.0%) |
| 45 to 54 Years | 90 (100.0%) | 139 (100.0%) |
| 55 to 64 Years | 129 (100.0%) | 246 (89.4%) |
| 65 to 74 Years | 30 (100.0%) | 72 (80.0%) |
| 75 Years and over | 65 (83.3%) | 17 (100.0%) |
| Total | 1,018 (98.7%) | 901 (84.5%) |
Income Below Poverty Among Married-Couple Families in Susquehanna Trails
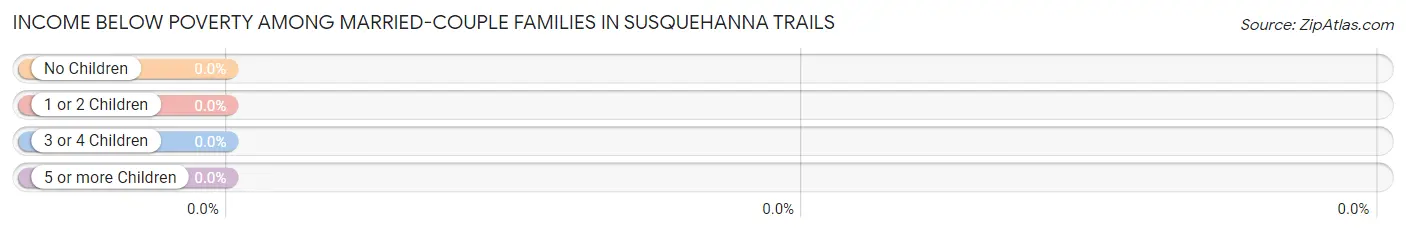
| Children | Above Poverty | Below Poverty |
| No Children | 235 (100.0%) | 0 (0.0%) |
| 1 or 2 Children | 114 (100.0%) | 0 (0.0%) |
| 3 or 4 Children | 48 (100.0%) | 0 (0.0%) |
| 5 or more Children | 0 (0.0%) | 0 (0.0%) |
| Total | 397 (100.0%) | 0 (0.0%) |
Income Below Poverty Among Single-Parent Households in Susquehanna Trails
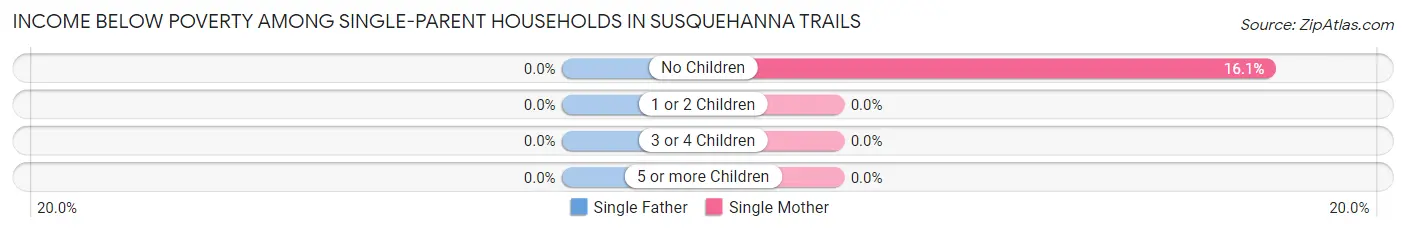
| Children | Single Father | Single Mother |
| No Children | 0 (0.0%) | 29 (16.1%) |
| 1 or 2 Children | 0 (0.0%) | 0 (0.0%) |
| 3 or 4 Children | 0 (0.0%) | 0 (0.0%) |
| 5 or more Children | 0 (0.0%) | 0 (0.0%) |
| Total | 0 (0.0%) | 29 (15.6%) |
Income Below Poverty Among Married-Couple vs Single-Parent Households in Susquehanna Trails
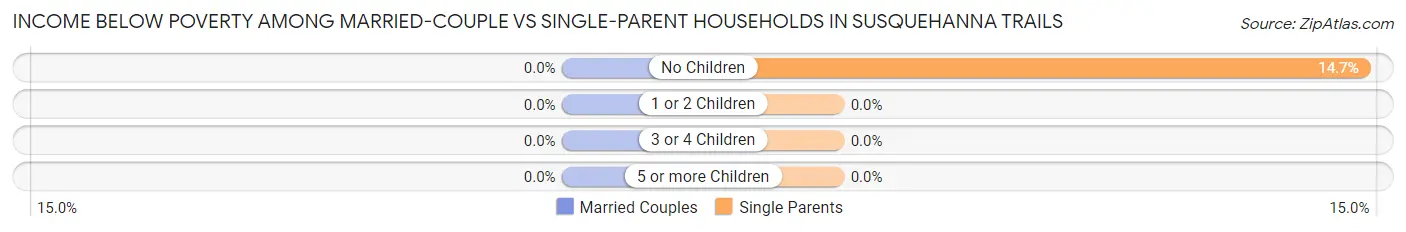
| Children | Married-Couple Families | Single-Parent Households |
| No Children | 0 (0.0%) | 29 (14.7%) |
| 1 or 2 Children | 0 (0.0%) | 0 (0.0%) |
| 3 or 4 Children | 0 (0.0%) | 0 (0.0%) |
| 5 or more Children | 0 (0.0%) | 0 (0.0%) |
| Total | 0 (0.0%) | 29 (12.9%) |
Race in Susquehanna Trails
The most populous races in Susquehanna Trails are White / Caucasian (2,080 | 99.2%), and Two or more Races (17 | 0.8%).
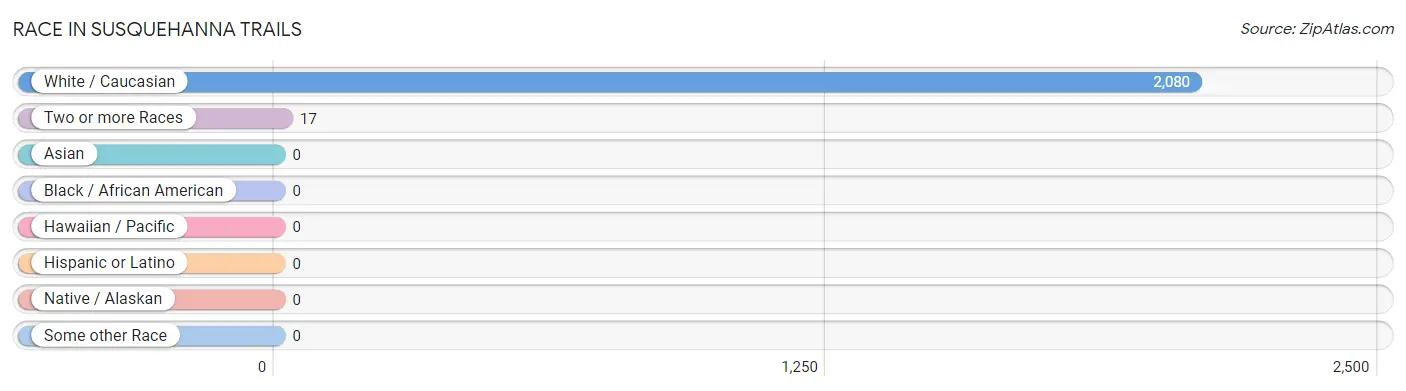
| Race | # Population | % Population |
| Asian | 0 | 0.0% |
| Black / African American | 0 | 0.0% |
| Hawaiian / Pacific | 0 | 0.0% |
| Hispanic or Latino | 0 | 0.0% |
| Native / Alaskan | 0 | 0.0% |
| White / Caucasian | 2,080 | 99.2% |
| Two or more Races | 17 | 0.8% |
| Some other Race | 0 | 0.0% |
| Total | 2,097 | 100.0% |
Ancestry in Susquehanna Trails
The most populous ancestries reported in Susquehanna Trails are Irish (598 | 28.5%), German (505 | 24.1%), American (250 | 11.9%), English (106 | 5.1%), and Italian (95 | 4.5%), together accounting for 74.1% of all Susquehanna Trails residents.
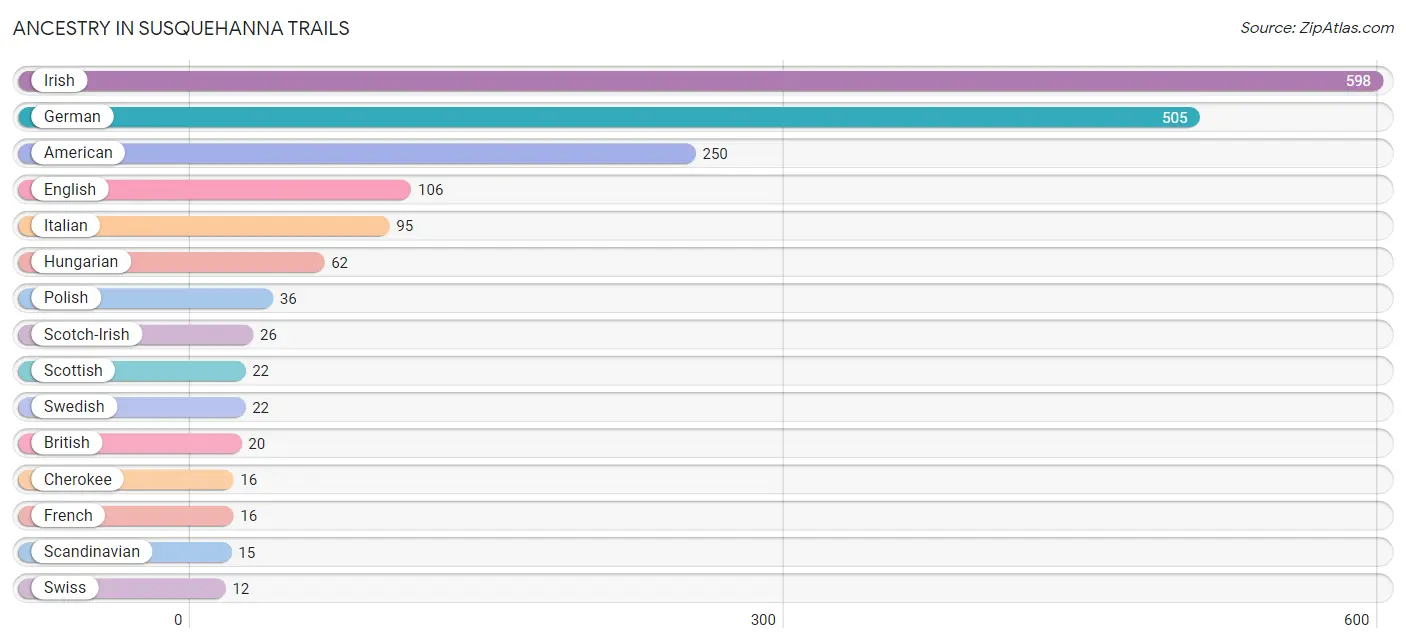
| Ancestry | # Population | % Population |
| American | 250 | 11.9% |
| British | 20 | 0.9% |
| Cherokee | 16 | 0.8% |
| Czechoslovakian | 11 | 0.5% |
| English | 106 | 5.1% |
| French | 16 | 0.8% |
| German | 505 | 24.1% |
| Hungarian | 62 | 3.0% |
| Irish | 598 | 28.5% |
| Italian | 95 | 4.5% |
| Polish | 36 | 1.7% |
| Scandinavian | 15 | 0.7% |
| Scotch-Irish | 26 | 1.2% |
| Scottish | 22 | 1.1% |
| Swedish | 22 | 1.1% |
| Swiss | 12 | 0.6% | View All 16 Rows |
Immigrants in Susquehanna Trails

| Immigration Origin | # Population | % Population | View All 0 Rows |
Sex and Age in Susquehanna Trails
Sex and Age in Susquehanna Trails
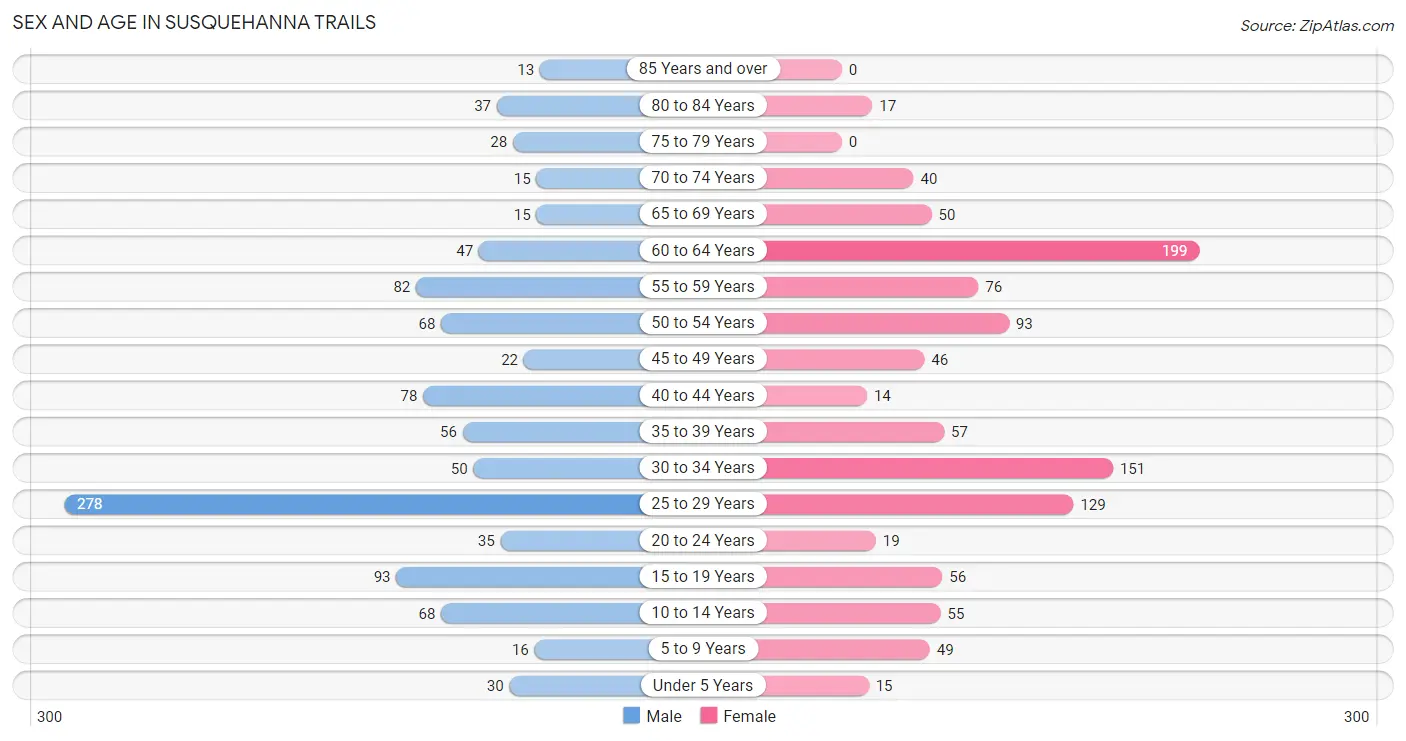
The most populous age groups in Susquehanna Trails are 25 to 29 Years (278 | 27.0%) for men and 60 to 64 Years (199 | 18.7%) for women.
| Age Bracket | Male | Female |
| Under 5 Years | 30 (2.9%) | 15 (1.4%) |
| 5 to 9 Years | 16 (1.5%) | 49 (4.6%) |
| 10 to 14 Years | 68 (6.6%) | 55 (5.2%) |
| 15 to 19 Years | 93 (9.0%) | 56 (5.2%) |
| 20 to 24 Years | 35 (3.4%) | 19 (1.8%) |
| 25 to 29 Years | 278 (27.0%) | 129 (12.1%) |
| 30 to 34 Years | 50 (4.9%) | 151 (14.2%) |
| 35 to 39 Years | 56 (5.4%) | 57 (5.3%) |
| 40 to 44 Years | 78 (7.6%) | 14 (1.3%) |
| 45 to 49 Years | 22 (2.1%) | 46 (4.3%) |
| 50 to 54 Years | 68 (6.6%) | 93 (8.7%) |
| 55 to 59 Years | 82 (8.0%) | 76 (7.1%) |
| 60 to 64 Years | 47 (4.6%) | 199 (18.7%) |
| 65 to 69 Years | 15 (1.5%) | 50 (4.7%) |
| 70 to 74 Years | 15 (1.5%) | 40 (3.7%) |
| 75 to 79 Years | 28 (2.7%) | 0 (0.0%) |
| 80 to 84 Years | 37 (3.6%) | 17 (1.6%) |
| 85 Years and over | 13 (1.3%) | 0 (0.0%) |
| Total | 1,031 (100.0%) | 1,066 (100.0%) |
Families and Households in Susquehanna Trails
Median Family Size in Susquehanna Trails
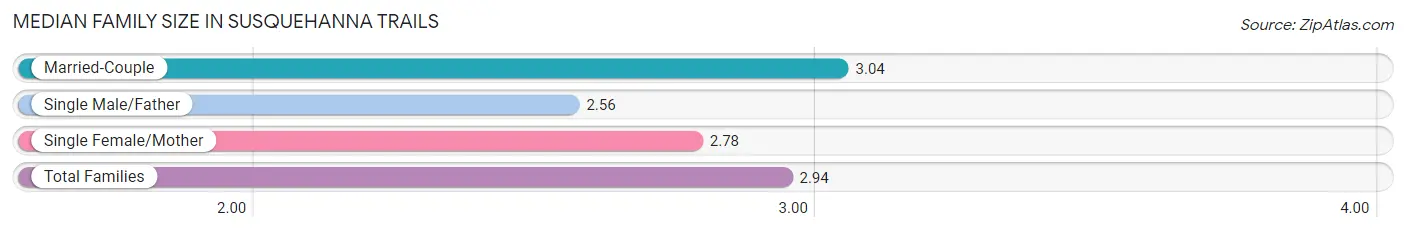
The median family size in Susquehanna Trails is 2.94 persons per family, with married-couple families (397 | 63.8%) accounting for the largest median family size of 3.04 persons per family. On the other hand, single male/father families (39 | 6.3%) represent the smallest median family size with 2.56 persons per family.
| Family Type | # Families | Family Size |
| Married-Couple | 397 (63.8%) | 3.04 |
| Single Male/Father | 39 (6.3%) | 2.56 |
| Single Female/Mother | 186 (29.9%) | 2.78 |
| Total Families | 622 (100.0%) | 2.94 |
Median Household Size in Susquehanna Trails
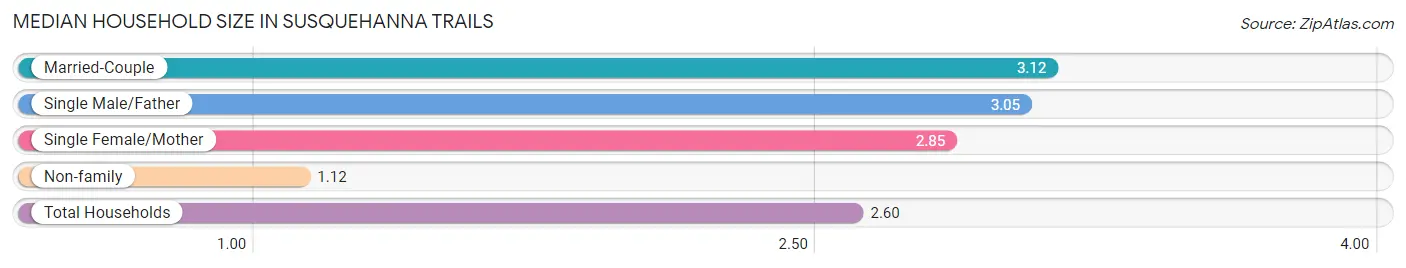
The median household size in Susquehanna Trails is 2.60 persons per household, with married-couple households (397 | 49.1%) accounting for the largest median household size of 3.12 persons per household. non-family households (186 | 23.0%) represent the smallest median household size with 1.12 persons per household.
| Household Type | # Households | Household Size |
| Married-Couple | 397 (49.1%) | 3.12 |
| Single Male/Father | 39 (4.8%) | 3.05 |
| Single Female/Mother | 186 (23.0%) | 2.85 |
| Non-family | 186 (23.0%) | 1.12 |
| Total Households | 808 (100.0%) | 2.60 |
Household Size by Marriage Status in Susquehanna Trails
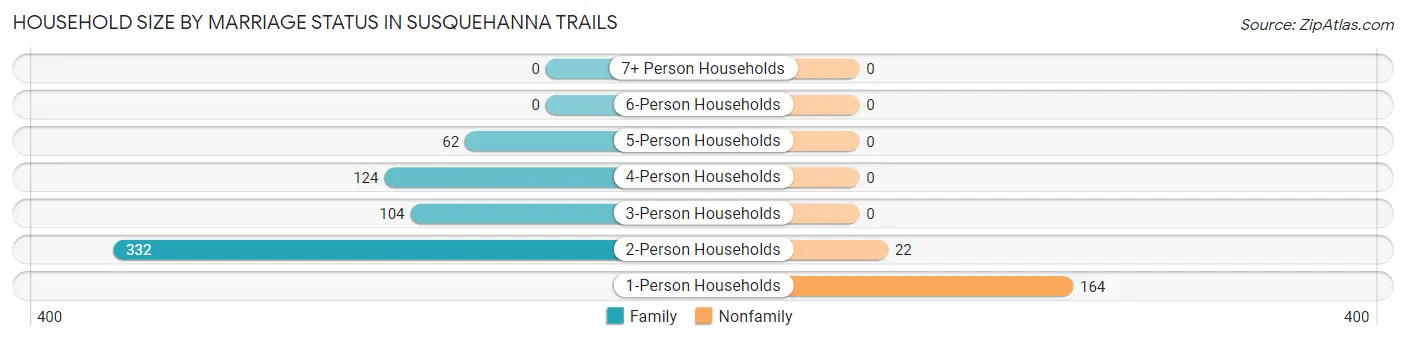
Out of a total of 808 households in Susquehanna Trails, 622 (77.0%) are family households, while 186 (23.0%) are nonfamily households. The most numerous type of family households are 2-person households, comprising 332, and the most common type of nonfamily households are 1-person households, comprising 164.
| Household Size | Family Households | Nonfamily Households |
| 1-Person Households | - | 164 (20.3%) |
| 2-Person Households | 332 (41.1%) | 22 (2.7%) |
| 3-Person Households | 104 (12.9%) | 0 (0.0%) |
| 4-Person Households | 124 (15.3%) | 0 (0.0%) |
| 5-Person Households | 62 (7.7%) | 0 (0.0%) |
| 6-Person Households | 0 (0.0%) | 0 (0.0%) |
| 7+ Person Households | 0 (0.0%) | 0 (0.0%) |
| Total | 622 (77.0%) | 186 (23.0%) |
Female Fertility in Susquehanna Trails
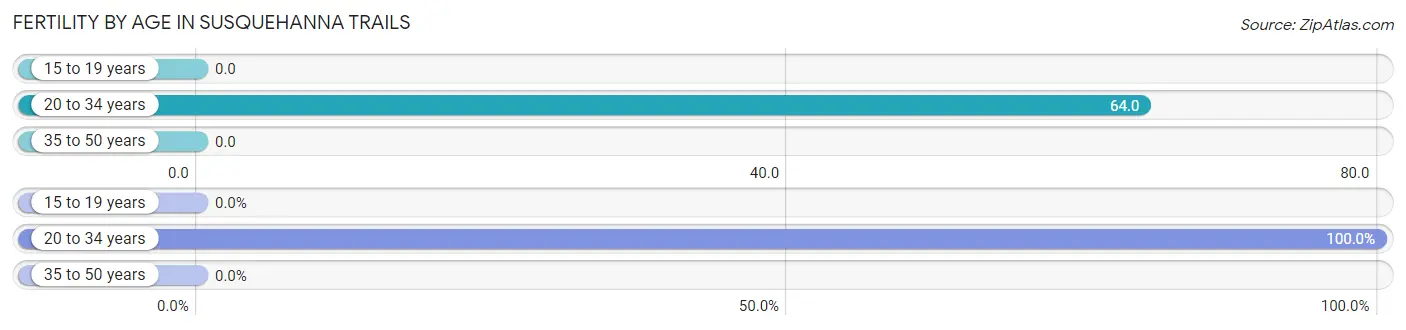
Fertility by Age in Susquehanna Trails
Average fertility rate in Susquehanna Trails is 39.0 births per 1,000 women. Women in the age bracket of 20 to 34 years have the highest fertility rate with 64.0 births per 1,000 women. Women in the age bracket of 20 to 34 years acount for 100.0% of all women with births.
| Age Bracket | Women with Births | Births / 1,000 Women |
| 15 to 19 years | 0 (0.0%) | 0.0 |
| 20 to 34 years | 19 (100.0%) | 64.0 |
| 35 to 50 years | 0 (0.0%) | 0.0 |
| Total | 19 (100.0%) | 39.0 |
Fertility by Age by Marriage Status in Susquehanna Trails
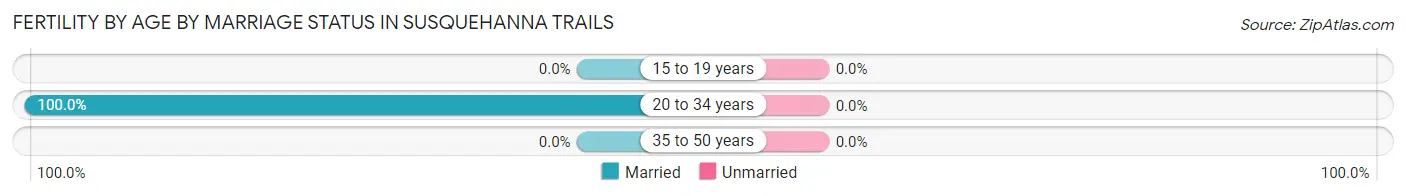
| Age Bracket | Married | Unmarried |
| 15 to 19 years | 0 (0.0%) | 0 (0.0%) |
| 20 to 34 years | 19 (100.0%) | 0 (0.0%) |
| 35 to 50 years | 0 (0.0%) | 0 (0.0%) |
| Total | 19 (100.0%) | 0 (0.0%) |
Fertility by Education in Susquehanna Trails
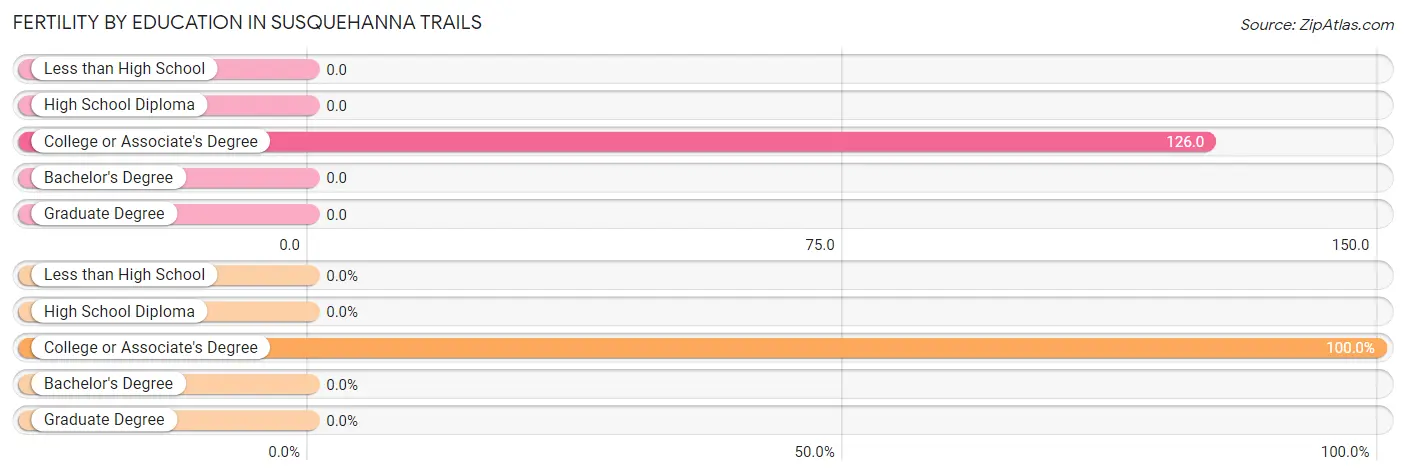
| Educational Attainment | Women with Births | Births / 1,000 Women |
| Less than High School | 0 (0.0%) | 0.0 |
| High School Diploma | 0 (0.0%) | 0.0 |
| College or Associate's Degree | 19 (100.0%) | 126.0 |
| Bachelor's Degree | 0 (0.0%) | 0.0 |
| Graduate Degree | 0 (0.0%) | 0.0 |
| Total | 19 (100.0%) | 39.0 |
Fertility by Education by Marriage Status in Susquehanna Trails
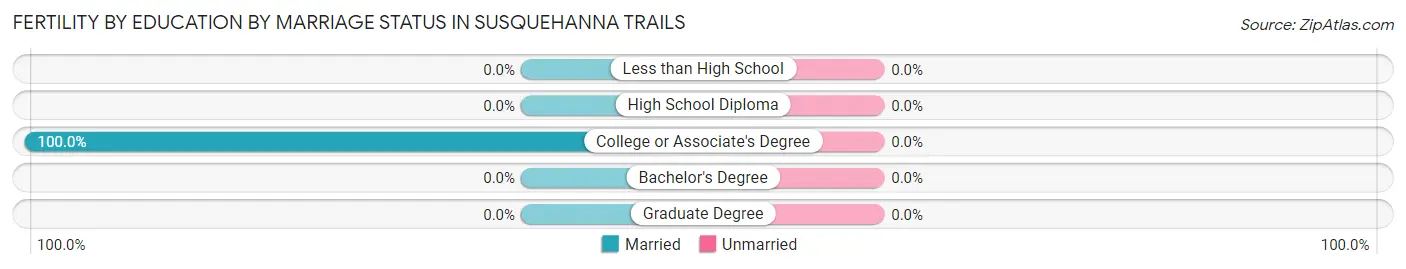
| Educational Attainment | Married | Unmarried |
| Less than High School | 0 (0.0%) | 0 (0.0%) |
| High School Diploma | 0 (0.0%) | 0 (0.0%) |
| College or Associate's Degree | 19 (100.0%) | 0 (0.0%) |
| Bachelor's Degree | 0 (0.0%) | 0 (0.0%) |
| Graduate Degree | 0 (0.0%) | 0 (0.0%) |
| Total | 19 (100.0%) | 0 (0.0%) |
Employment Characteristics in Susquehanna Trails
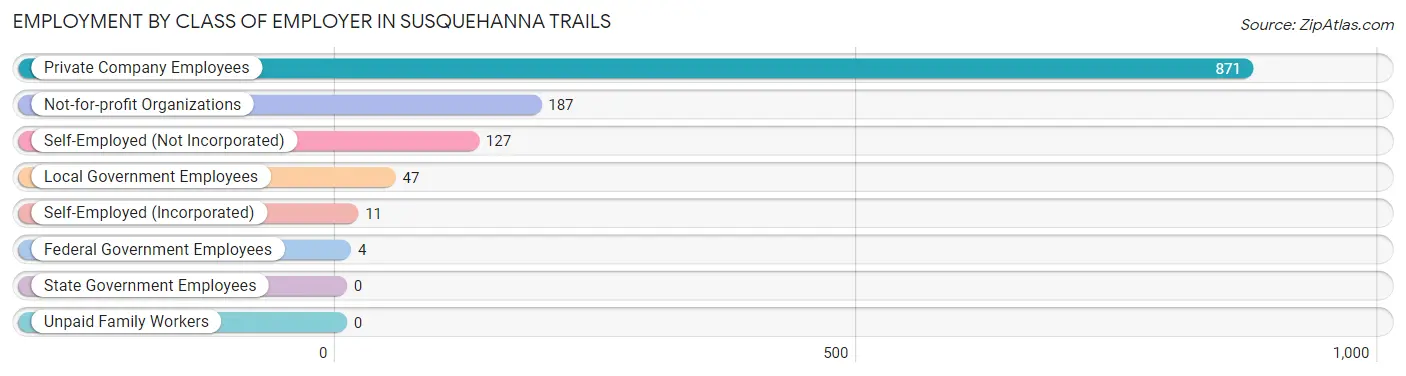
Employment by Class of Employer in Susquehanna Trails
Among the 1,247 employed individuals in Susquehanna Trails, private company employees (871 | 69.9%), not-for-profit organizations (187 | 15.0%), and self-employed (not incorporated) (127 | 10.2%) make up the most common classes of employment.
| Employer Class | # Employees | % Employees |
| Private Company Employees | 871 | 69.9% |
| Self-Employed (Incorporated) | 11 | 0.9% |
| Self-Employed (Not Incorporated) | 127 | 10.2% |
| Not-for-profit Organizations | 187 | 15.0% |
| Local Government Employees | 47 | 3.8% |
| State Government Employees | 0 | 0.0% |
| Federal Government Employees | 4 | 0.3% |
| Unpaid Family Workers | 0 | 0.0% |
| Total | 1,247 | 100.0% |
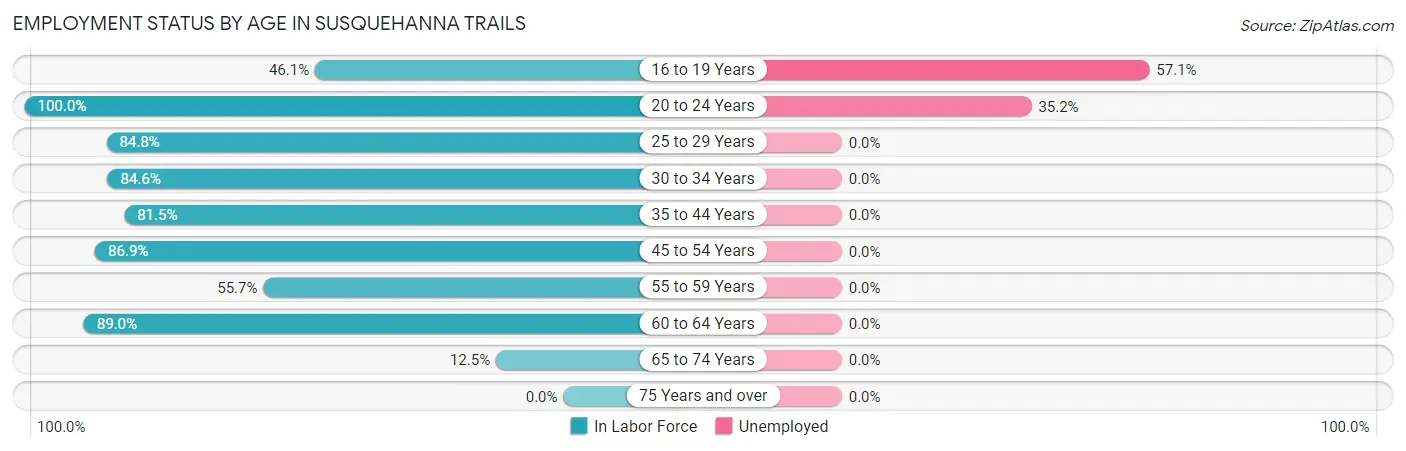
Employment Status by Age in Susquehanna Trails
According to the labor force statistics for Susquehanna Trails, out of the total population over 16 years of age (1,791), 72.1% or 1,291 individuals are in the labor force, with 3.0% or 39 of them unemployed. The age group with the highest labor force participation rate is 20 to 24 years, with 100.0% or 54 individuals in the labor force. Within the labor force, the 16 to 19 years age range has the highest percentage of unemployed individuals, with 57.1% or 20 of them being unemployed.
| Age Bracket | In Labor Force | Unemployed |
| 16 to 19 Years | 35 (46.1%) | 20 (57.1%) |
| 20 to 24 Years | 54 (100.0%) | 19 (35.2%) |
| 25 to 29 Years | 345 (84.8%) | 0 (0.0%) |
| 30 to 34 Years | 170 (84.6%) | 0 (0.0%) |
| 35 to 44 Years | 167 (81.5%) | 0 (0.0%) |
| 45 to 54 Years | 199 (86.9%) | 0 (0.0%) |
| 55 to 59 Years | 88 (55.7%) | 0 (0.0%) |
| 60 to 64 Years | 219 (89.0%) | 0 (0.0%) |
| 65 to 74 Years | 15 (12.5%) | 0 (0.0%) |
| 75 Years and over | 0 (0.0%) | 0 (0.0%) |
| Total | 1,291 (72.1%) | 39 (3.0%) |
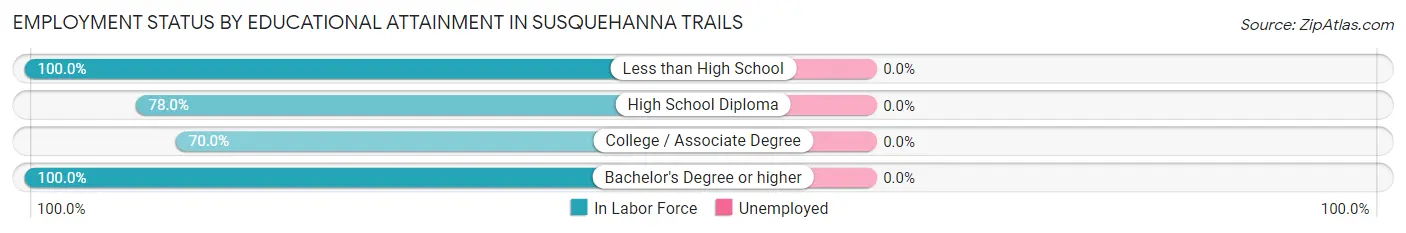
Employment Status by Educational Attainment in Susquehanna Trails
| Educational Attainment | In Labor Force | Unemployed |
| Less than High School | 101 (100.0%) | 0 (0.0%) |
| High School Diploma | 486 (78.0%) | 0 (0.0%) |
| College / Associate Degree | 282 (70.0%) | 0 (0.0%) |
| Bachelor's Degree or higher | 319 (100.0%) | 0 (0.0%) |
| Total | 1,189 (82.2%) | 0 (0.0%) |
Employment Occupations by Sex in Susquehanna Trails
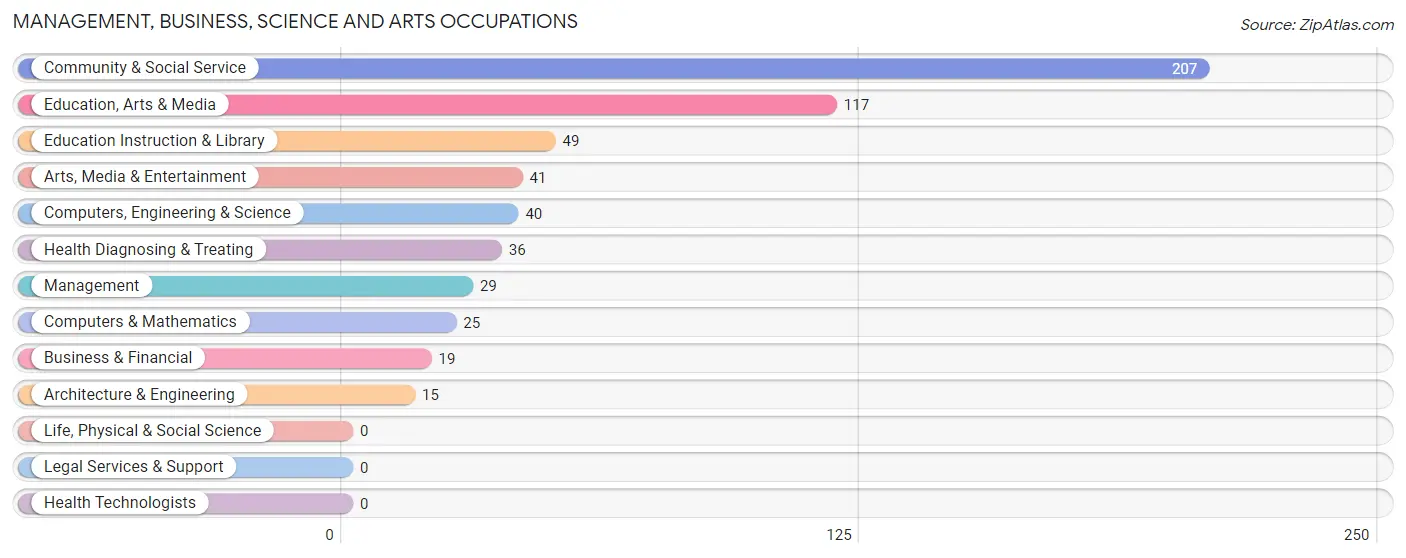
Management, Business, Science and Arts Occupations
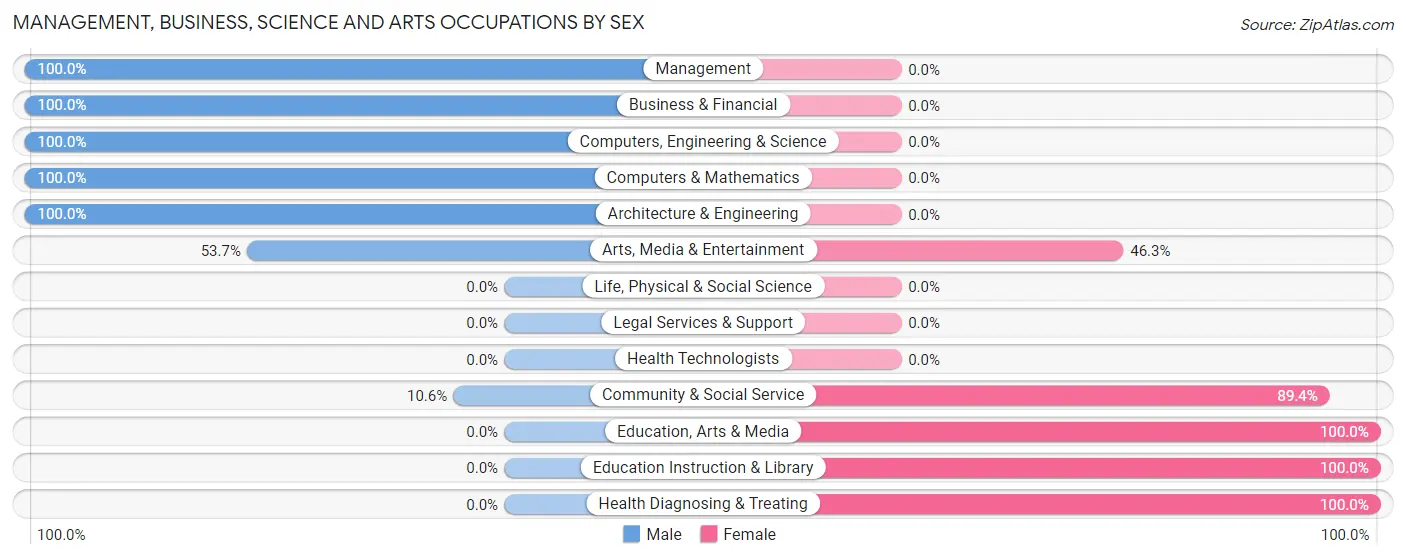
The most common Management, Business, Science and Arts occupations in Susquehanna Trails are Community & Social Service (207 | 16.6%), Education, Arts & Media (117 | 9.4%), Education Instruction & Library (49 | 3.9%), Arts, Media & Entertainment (41 | 3.3%), and Computers, Engineering & Science (40 | 3.2%).
Management, Business, Science and Arts Occupations by Sex
Within the Management, Business, Science and Arts occupations in Susquehanna Trails, the most male-oriented occupations are Management (100.0%), Business & Financial (100.0%), and Computers, Engineering & Science (100.0%), while the most female-oriented occupations are Education, Arts & Media (100.0%), Education Instruction & Library (100.0%), and Health Diagnosing & Treating (100.0%).
| Occupation | Male | Female |
| Management | 29 (100.0%) | 0 (0.0%) |
| Business & Financial | 19 (100.0%) | 0 (0.0%) |
| Computers, Engineering & Science | 40 (100.0%) | 0 (0.0%) |
| Computers & Mathematics | 25 (100.0%) | 0 (0.0%) |
| Architecture & Engineering | 15 (100.0%) | 0 (0.0%) |
| Life, Physical & Social Science | 0 (0.0%) | 0 (0.0%) |
| Community & Social Service | 22 (10.6%) | 185 (89.4%) |
| Education, Arts & Media | 0 (0.0%) | 117 (100.0%) |
| Legal Services & Support | 0 (0.0%) | 0 (0.0%) |
| Education Instruction & Library | 0 (0.0%) | 49 (100.0%) |
| Arts, Media & Entertainment | 22 (53.7%) | 19 (46.3%) |
| Health Diagnosing & Treating | 0 (0.0%) | 36 (100.0%) |
| Health Technologists | 0 (0.0%) | 0 (0.0%) |
| Total (Category) | 110 (33.2%) | 221 (66.8%) |
| Total (Overall) | 679 (54.4%) | 570 (45.6%) |
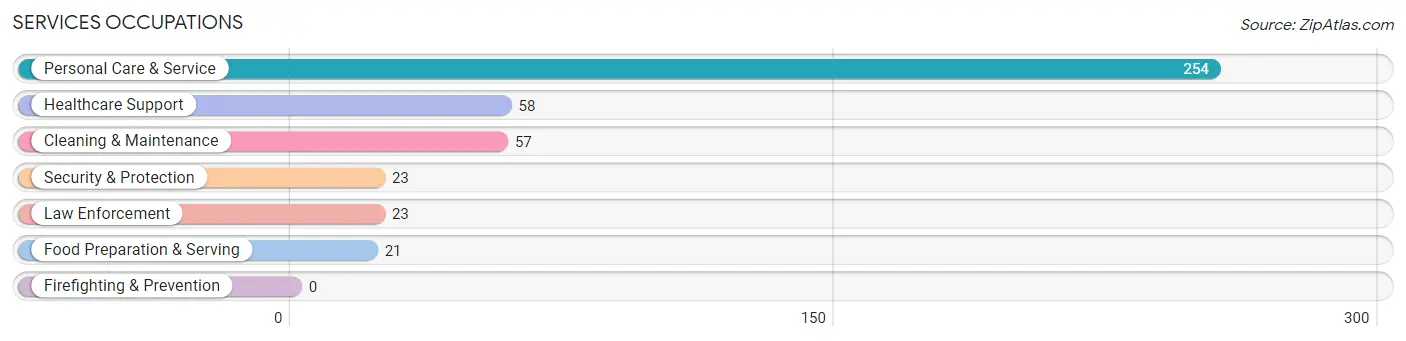
Services Occupations
The most common Services occupations in Susquehanna Trails are Personal Care & Service (254 | 20.3%), Healthcare Support (58 | 4.6%), Cleaning & Maintenance (57 | 4.6%), Security & Protection (23 | 1.8%), and Law Enforcement (23 | 1.8%).
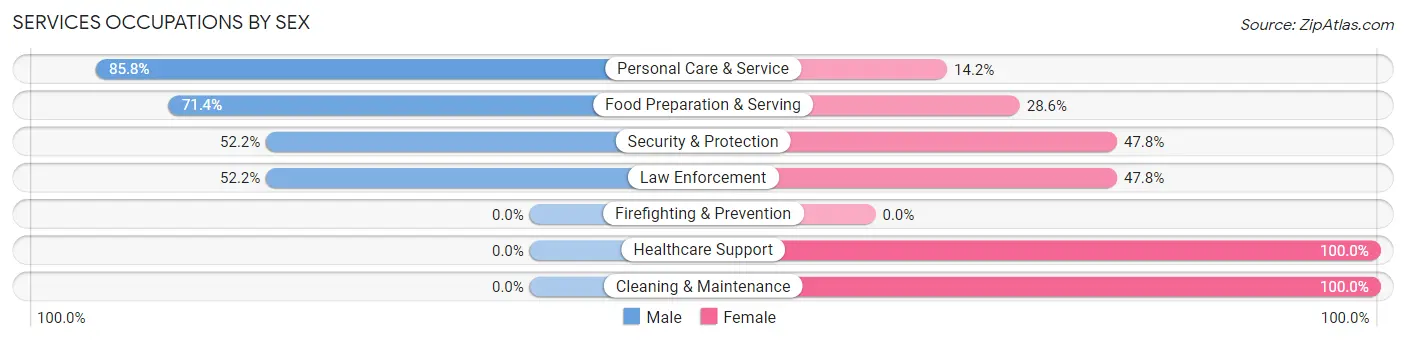
Services Occupations by Sex
Within the Services occupations in Susquehanna Trails, the most male-oriented occupations are Personal Care & Service (85.8%), Food Preparation & Serving (71.4%), and Security & Protection (52.2%), while the most female-oriented occupations are Healthcare Support (100.0%), Cleaning & Maintenance (100.0%), and Security & Protection (47.8%).
| Occupation | Male | Female |
| Healthcare Support | 0 (0.0%) | 58 (100.0%) |
| Security & Protection | 12 (52.2%) | 11 (47.8%) |
| Firefighting & Prevention | 0 (0.0%) | 0 (0.0%) |
| Law Enforcement | 12 (52.2%) | 11 (47.8%) |
| Food Preparation & Serving | 15 (71.4%) | 6 (28.6%) |
| Cleaning & Maintenance | 0 (0.0%) | 57 (100.0%) |
| Personal Care & Service | 218 (85.8%) | 36 (14.2%) |
| Total (Category) | 245 (59.3%) | 168 (40.7%) |
| Total (Overall) | 679 (54.4%) | 570 (45.6%) |
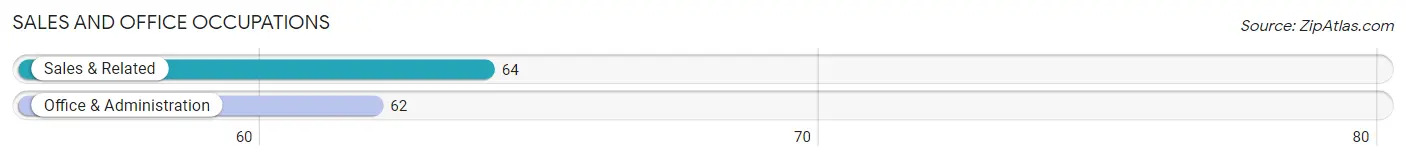
Sales and Office Occupations
The most common Sales and Office occupations in Susquehanna Trails are Sales & Related (64 | 5.1%), and Office & Administration (62 | 5.0%).
Sales and Office Occupations by Sex
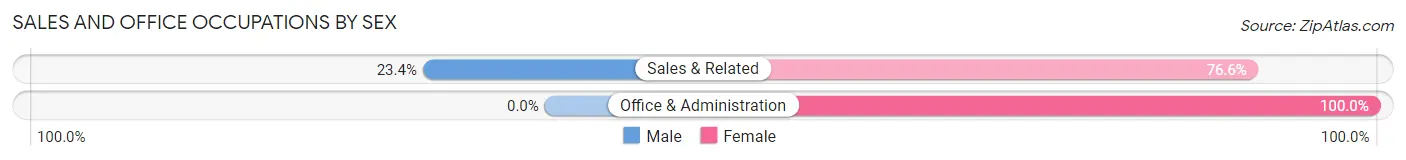
| Occupation | Male | Female |
| Sales & Related | 15 (23.4%) | 49 (76.6%) |
| Office & Administration | 0 (0.0%) | 62 (100.0%) |
| Total (Category) | 15 (11.9%) | 111 (88.1%) |
| Total (Overall) | 679 (54.4%) | 570 (45.6%) |
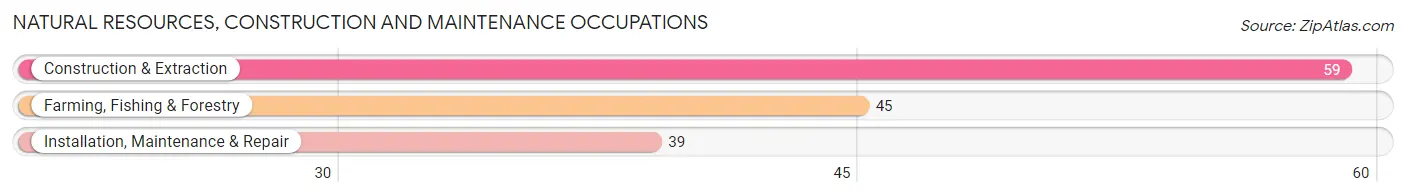
Natural Resources, Construction and Maintenance Occupations
The most common Natural Resources, Construction and Maintenance occupations in Susquehanna Trails are Construction & Extraction (59 | 4.7%), Farming, Fishing & Forestry (45 | 3.6%), and Installation, Maintenance & Repair (39 | 3.1%).
Natural Resources, Construction and Maintenance Occupations by Sex
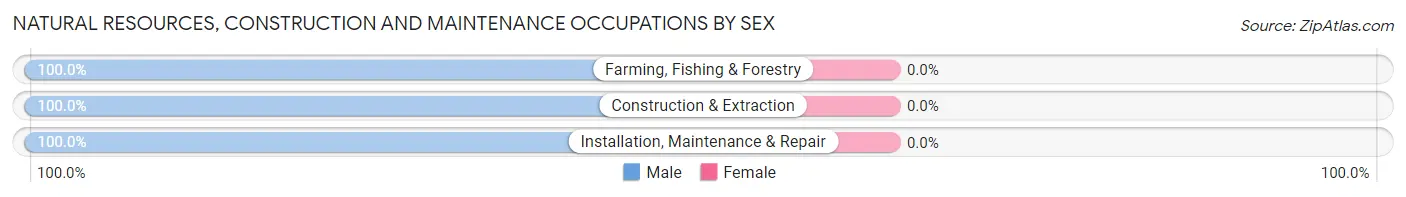
| Occupation | Male | Female |
| Farming, Fishing & Forestry | 45 (100.0%) | 0 (0.0%) |
| Construction & Extraction | 59 (100.0%) | 0 (0.0%) |
| Installation, Maintenance & Repair | 39 (100.0%) | 0 (0.0%) |
| Total (Category) | 143 (100.0%) | 0 (0.0%) |
| Total (Overall) | 679 (54.4%) | 570 (45.6%) |
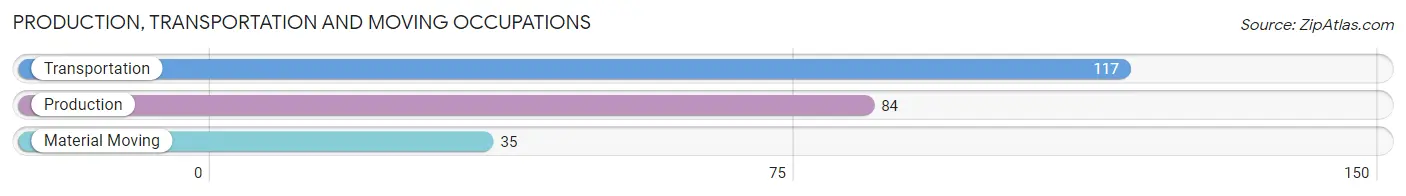
Production, Transportation and Moving Occupations
The most common Production, Transportation and Moving occupations in Susquehanna Trails are Transportation (117 | 9.4%), Production (84 | 6.7%), and Material Moving (35 | 2.8%).
Production, Transportation and Moving Occupations by Sex
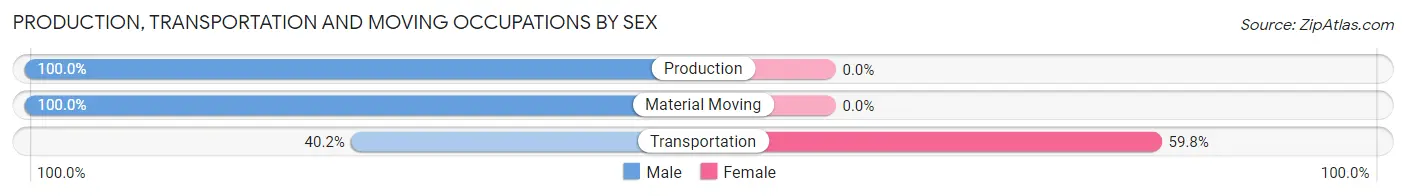
| Occupation | Male | Female |
| Production | 84 (100.0%) | 0 (0.0%) |
| Transportation | 47 (40.2%) | 70 (59.8%) |
| Material Moving | 35 (100.0%) | 0 (0.0%) |
| Total (Category) | 166 (70.3%) | 70 (29.7%) |
| Total (Overall) | 679 (54.4%) | 570 (45.6%) |
Employment Industries by Sex in Susquehanna Trails
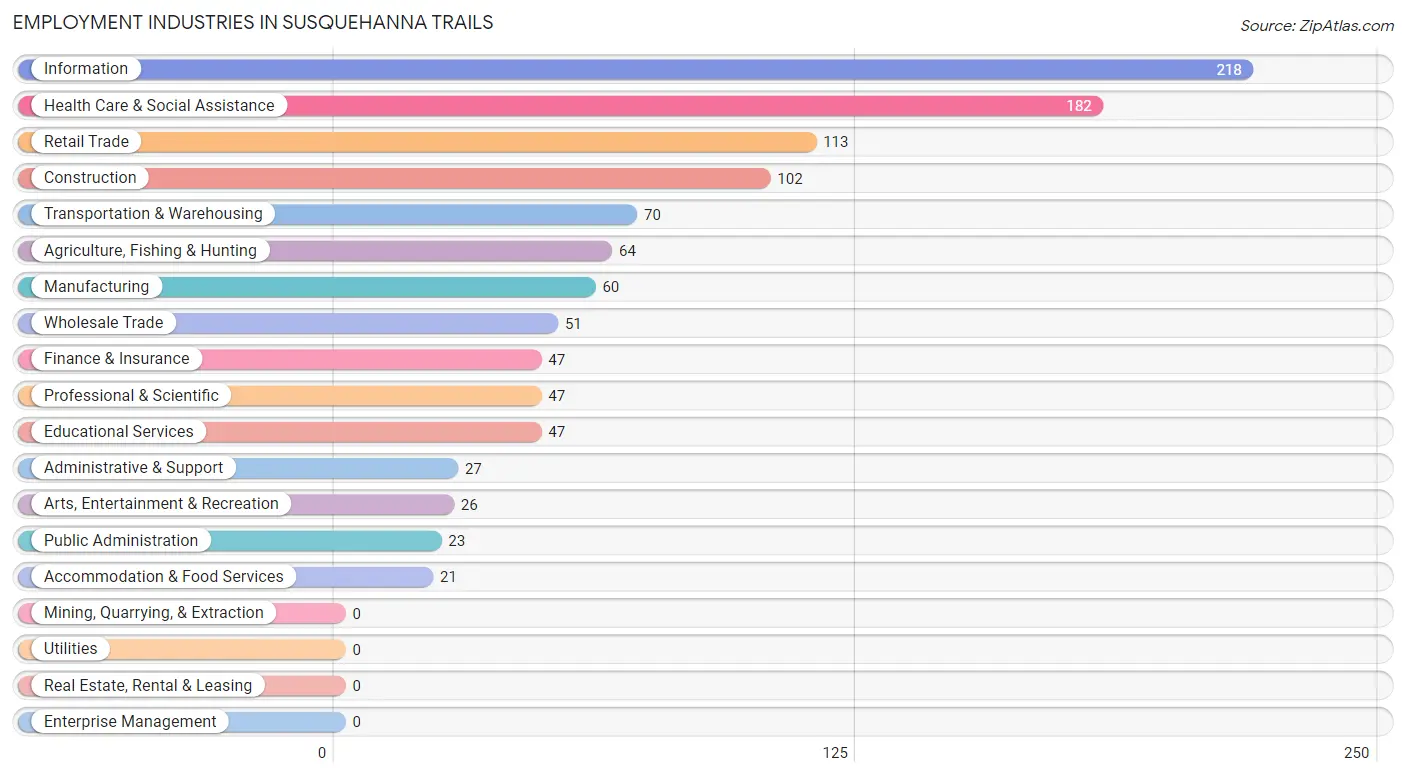
Employment Industries in Susquehanna Trails
The major employment industries in Susquehanna Trails include Information (218 | 17.4%), Health Care & Social Assistance (182 | 14.6%), Retail Trade (113 | 9.0%), Construction (102 | 8.2%), and Transportation & Warehousing (70 | 5.6%).
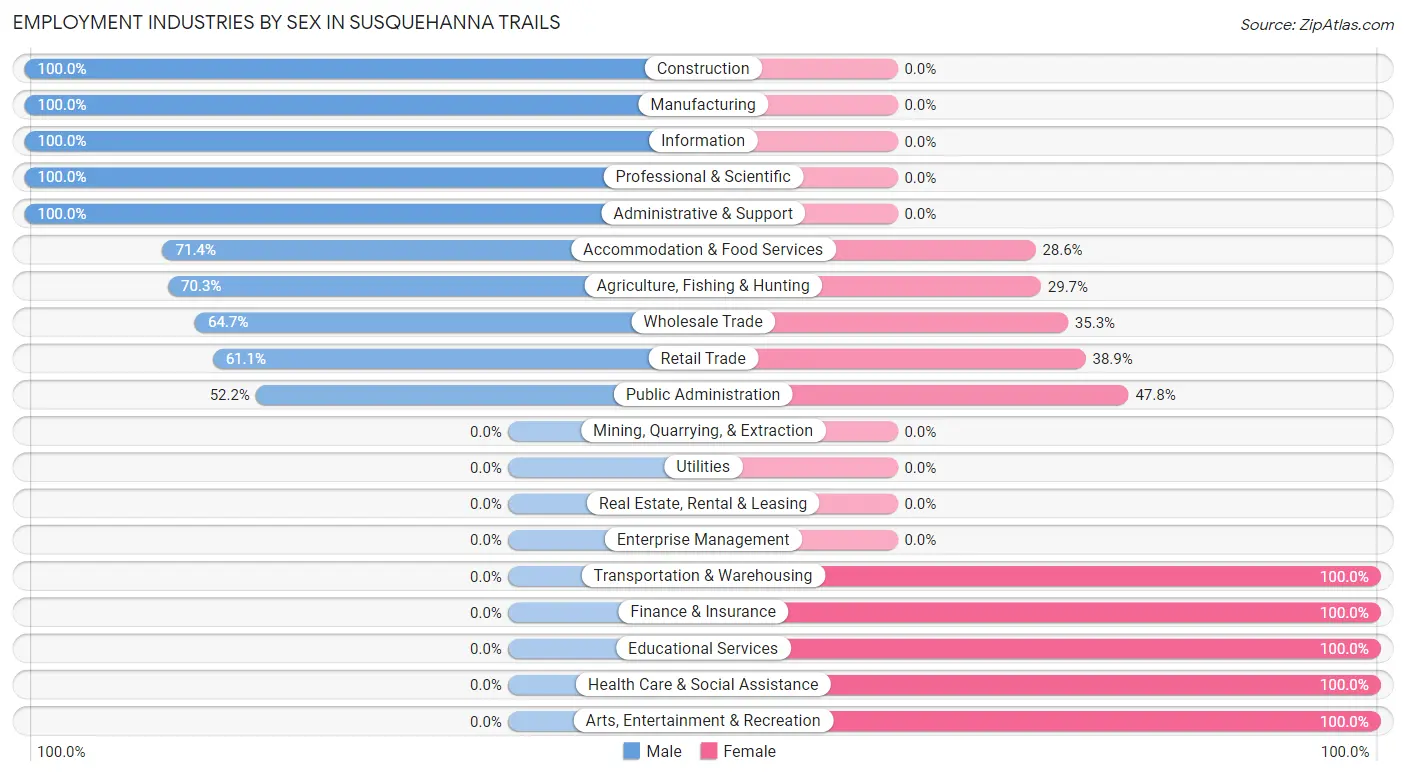
Employment Industries by Sex in Susquehanna Trails
The Susquehanna Trails industries that see more men than women are Construction (100.0%), Manufacturing (100.0%), and Information (100.0%), whereas the industries that tend to have a higher number of women are Transportation & Warehousing (100.0%), Finance & Insurance (100.0%), and Educational Services (100.0%).
| Industry | Male | Female |
| Agriculture, Fishing & Hunting | 45 (70.3%) | 19 (29.7%) |
| Mining, Quarrying, & Extraction | 0 (0.0%) | 0 (0.0%) |
| Construction | 102 (100.0%) | 0 (0.0%) |
| Manufacturing | 60 (100.0%) | 0 (0.0%) |
| Wholesale Trade | 33 (64.7%) | 18 (35.3%) |
| Retail Trade | 69 (61.1%) | 44 (38.9%) |
| Transportation & Warehousing | 0 (0.0%) | 70 (100.0%) |
| Utilities | 0 (0.0%) | 0 (0.0%) |
| Information | 218 (100.0%) | 0 (0.0%) |
| Finance & Insurance | 0 (0.0%) | 47 (100.0%) |
| Real Estate, Rental & Leasing | 0 (0.0%) | 0 (0.0%) |
| Professional & Scientific | 47 (100.0%) | 0 (0.0%) |
| Enterprise Management | 0 (0.0%) | 0 (0.0%) |
| Administrative & Support | 27 (100.0%) | 0 (0.0%) |
| Educational Services | 0 (0.0%) | 47 (100.0%) |
| Health Care & Social Assistance | 0 (0.0%) | 182 (100.0%) |
| Arts, Entertainment & Recreation | 0 (0.0%) | 26 (100.0%) |
| Accommodation & Food Services | 15 (71.4%) | 6 (28.6%) |
| Public Administration | 12 (52.2%) | 11 (47.8%) |
| Total | 679 (54.4%) | 570 (45.6%) |
Education in Susquehanna Trails
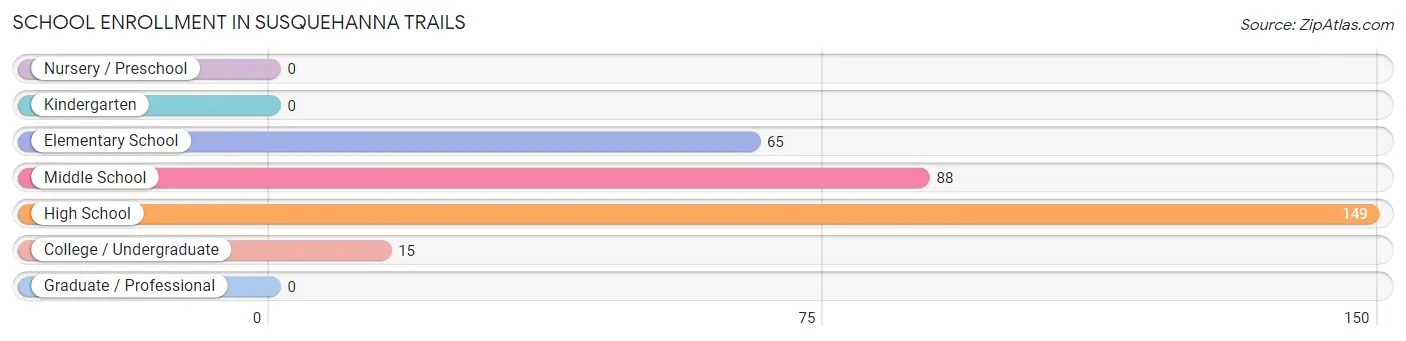
School Enrollment in Susquehanna Trails
The most common levels of schooling among the 317 students in Susquehanna Trails are high school (149 | 47.0%), middle school (88 | 27.8%), and elementary school (65 | 20.5%).
| School Level | # Students | % Students |
| Nursery / Preschool | 0 | 0.0% |
| Kindergarten | 0 | 0.0% |
| Elementary School | 65 | 20.5% |
| Middle School | 88 | 27.8% |
| High School | 149 | 47.0% |
| College / Undergraduate | 15 | 4.7% |
| Graduate / Professional | 0 | 0.0% |
| Total | 317 | 100.0% |
School Enrollment by Age by Funding Source in Susquehanna Trails
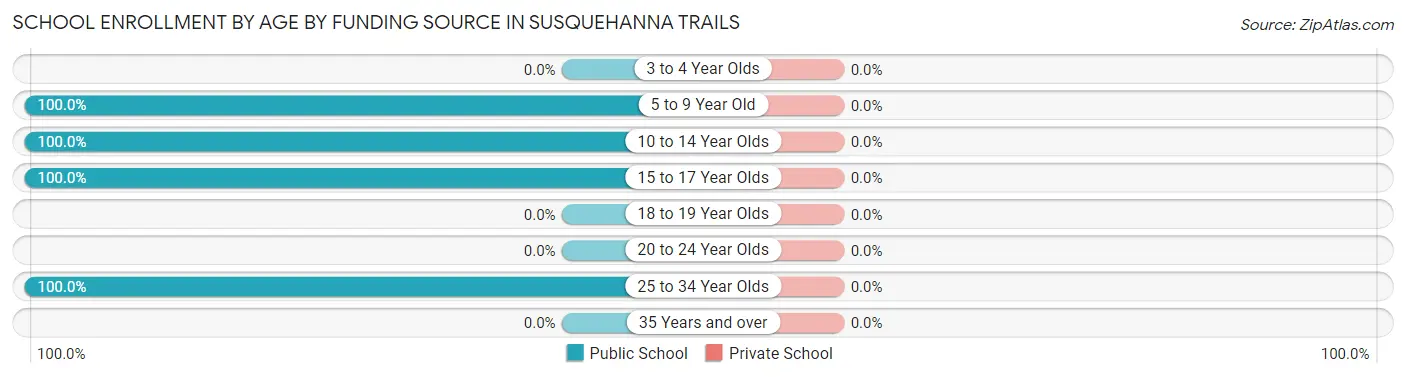
| Age Bracket | Public School | Private School |
| 3 to 4 Year Olds | 0 (0.0%) | 0 (0.0%) |
| 5 to 9 Year Old | 65 (100.0%) | 0 (0.0%) |
| 10 to 14 Year Olds | 123 (100.0%) | 0 (0.0%) |
| 15 to 17 Year Olds | 114 (100.0%) | 0 (0.0%) |
| 18 to 19 Year Olds | 0 (0.0%) | 0 (0.0%) |
| 20 to 24 Year Olds | 0 (0.0%) | 0 (0.0%) |
| 25 to 34 Year Olds | 15 (100.0%) | 0 (0.0%) |
| 35 Years and over | 0 (0.0%) | 0 (0.0%) |
| Total | 317 (100.0%) | 0 (0.0%) |
Educational Attainment by Field of Study in Susquehanna Trails
Computers & mathematics (218 | 38.3%), visual & performing arts (218 | 38.3%), education (70 | 12.3%), psychology (27 | 4.7%), and social sciences (19 | 3.3%) are the most common fields of study among 570 individuals in Susquehanna Trails who have obtained a bachelor's degree or higher.
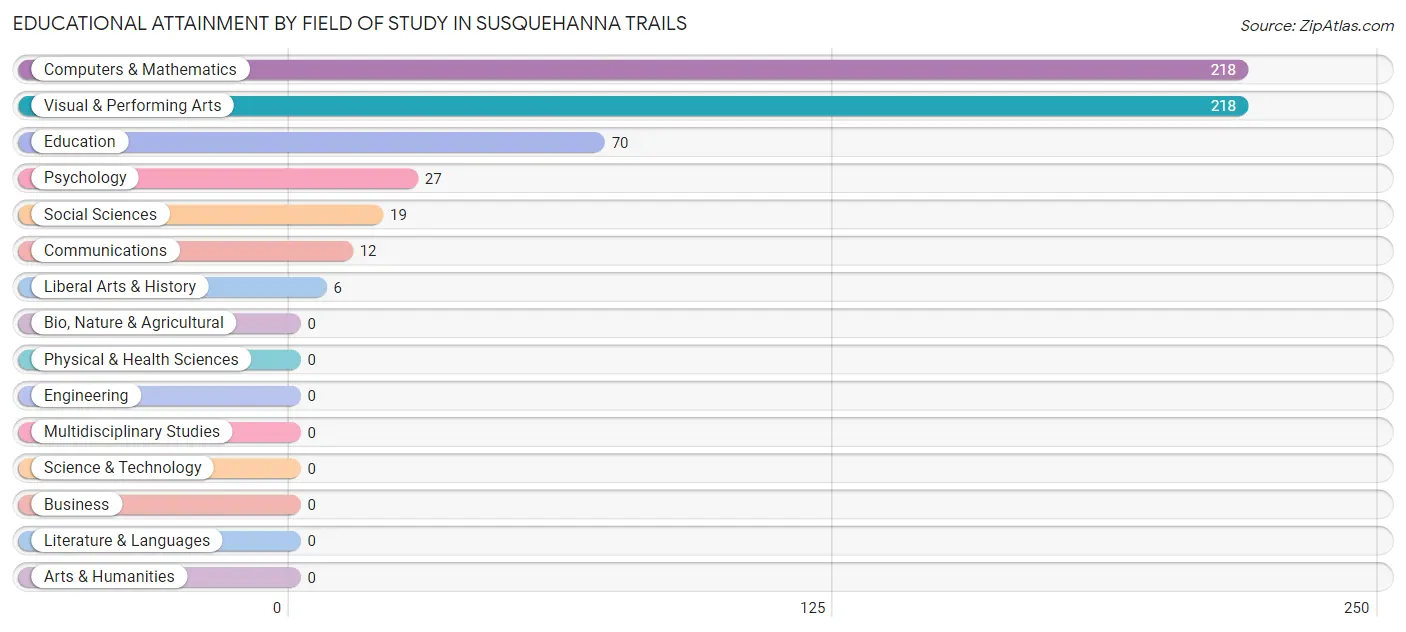
| Field of Study | # Graduates | % Graduates |
| Computers & Mathematics | 218 | 38.3% |
| Bio, Nature & Agricultural | 0 | 0.0% |
| Physical & Health Sciences | 0 | 0.0% |
| Psychology | 27 | 4.7% |
| Social Sciences | 19 | 3.3% |
| Engineering | 0 | 0.0% |
| Multidisciplinary Studies | 0 | 0.0% |
| Science & Technology | 0 | 0.0% |
| Business | 0 | 0.0% |
| Education | 70 | 12.3% |
| Literature & Languages | 0 | 0.0% |
| Liberal Arts & History | 6 | 1.1% |
| Visual & Performing Arts | 218 | 38.3% |
| Communications | 12 | 2.1% |
| Arts & Humanities | 0 | 0.0% |
| Total | 570 | 100.0% |
Transportation & Commute in Susquehanna Trails
Vehicle Availability by Sex in Susquehanna Trails
The most prevalent vehicle ownership categories in Susquehanna Trails are males with 2 vehicles (388, accounting for 56.8%) and females with 2 vehicles (307, making up 68.8%).
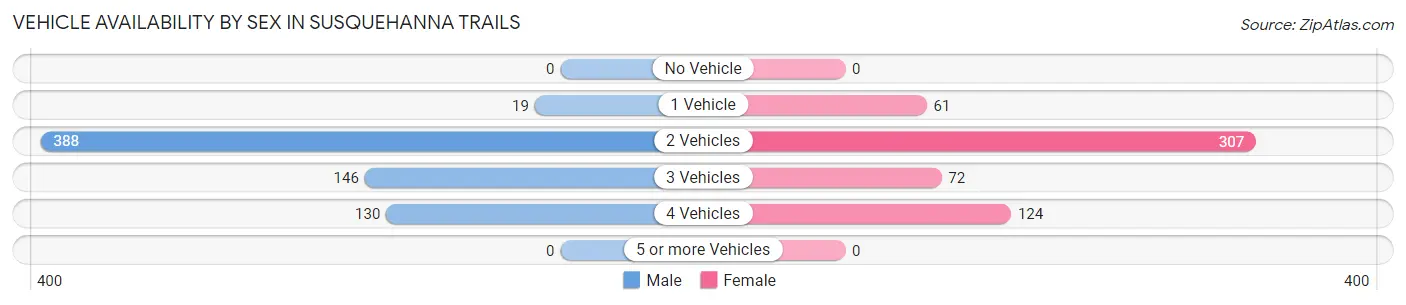
| Vehicles Available | Male | Female |
| No Vehicle | 0 (0.0%) | 0 (0.0%) |
| 1 Vehicle | 19 (2.8%) | 61 (10.8%) |
| 2 Vehicles | 388 (56.8%) | 307 (54.4%) |
| 3 Vehicles | 146 (21.4%) | 72 (12.8%) |
| 4 Vehicles | 130 (19.0%) | 124 (22.0%) |
| 5 or more Vehicles | 0 (0.0%) | 0 (0.0%) |
| Total | 683 (100.0%) | 564 (100.0%) |
Commute Time in Susquehanna Trails
The most frequently occuring commute durations in Susquehanna Trails are 60 to 89 minutes (277 commuters, 23.0%), 30 to 34 minutes (238 commuters, 19.8%), and 45 to 59 minutes (198 commuters, 16.4%).
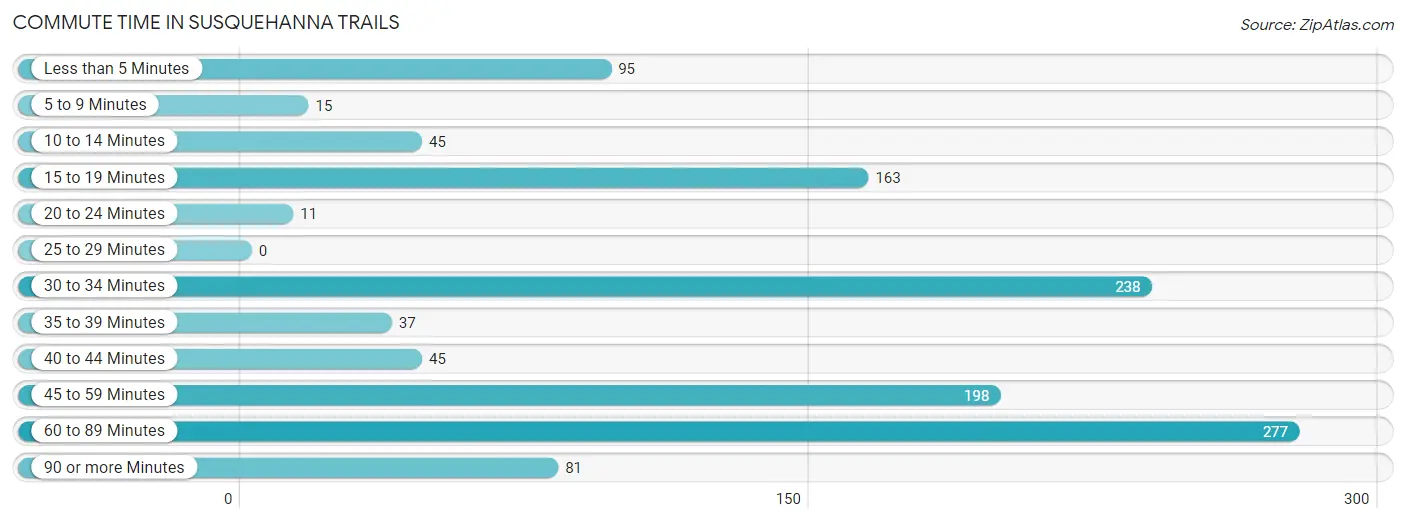
| Commute Time | # Commuters | % Commuters |
| Less than 5 Minutes | 95 | 7.9% |
| 5 to 9 Minutes | 15 | 1.2% |
| 10 to 14 Minutes | 45 | 3.7% |
| 15 to 19 Minutes | 163 | 13.5% |
| 20 to 24 Minutes | 11 | 0.9% |
| 25 to 29 Minutes | 0 | 0.0% |
| 30 to 34 Minutes | 238 | 19.8% |
| 35 to 39 Minutes | 37 | 3.1% |
| 40 to 44 Minutes | 45 | 3.7% |
| 45 to 59 Minutes | 198 | 16.4% |
| 60 to 89 Minutes | 277 | 23.0% |
| 90 or more Minutes | 81 | 6.7% |
Commute Time by Sex in Susquehanna Trails
The most common commute times in Susquehanna Trails are 60 to 89 minutes (233 commuters, 34.1%) for males and 30 to 34 minutes (169 commuters, 32.4%) for females.
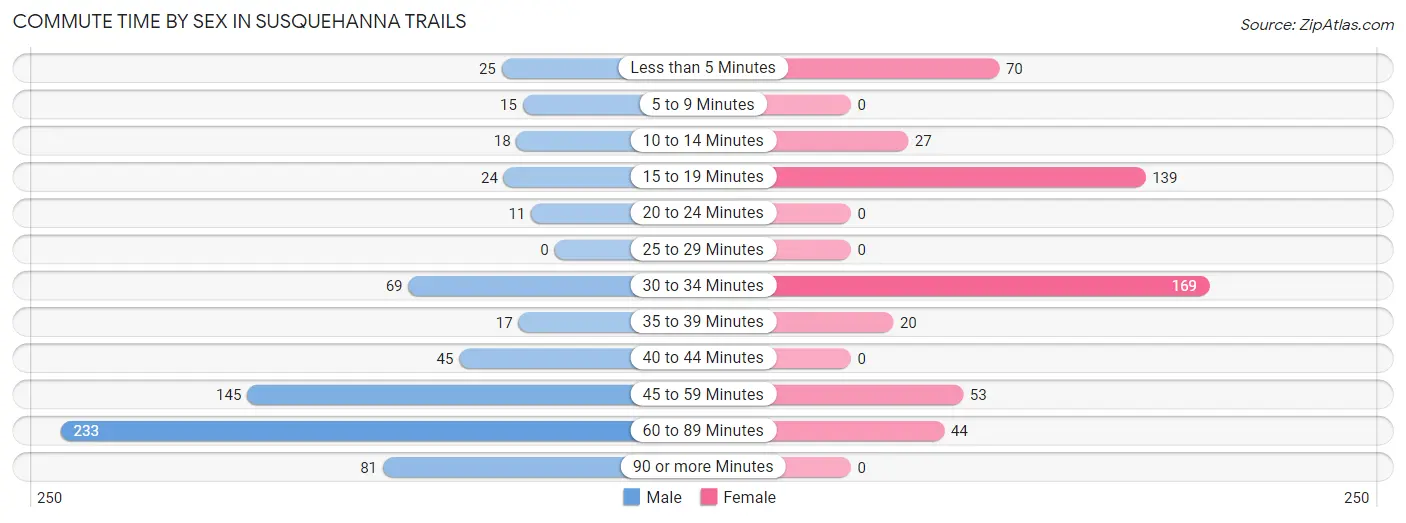
| Commute Time | Male | Female |
| Less than 5 Minutes | 25 (3.7%) | 70 (13.4%) |
| 5 to 9 Minutes | 15 (2.2%) | 0 (0.0%) |
| 10 to 14 Minutes | 18 (2.6%) | 27 (5.2%) |
| 15 to 19 Minutes | 24 (3.5%) | 139 (26.6%) |
| 20 to 24 Minutes | 11 (1.6%) | 0 (0.0%) |
| 25 to 29 Minutes | 0 (0.0%) | 0 (0.0%) |
| 30 to 34 Minutes | 69 (10.1%) | 169 (32.4%) |
| 35 to 39 Minutes | 17 (2.5%) | 20 (3.8%) |
| 40 to 44 Minutes | 45 (6.6%) | 0 (0.0%) |
| 45 to 59 Minutes | 145 (21.2%) | 53 (10.2%) |
| 60 to 89 Minutes | 233 (34.1%) | 44 (8.4%) |
| 90 or more Minutes | 81 (11.9%) | 0 (0.0%) |
Time of Departure to Work by Sex in Susquehanna Trails
The most frequent times of departure to work in Susquehanna Trails are 7:00 AM to 7:29 AM (242, 35.4%) for males and 7:00 AM to 7:29 AM (139, 26.6%) for females.
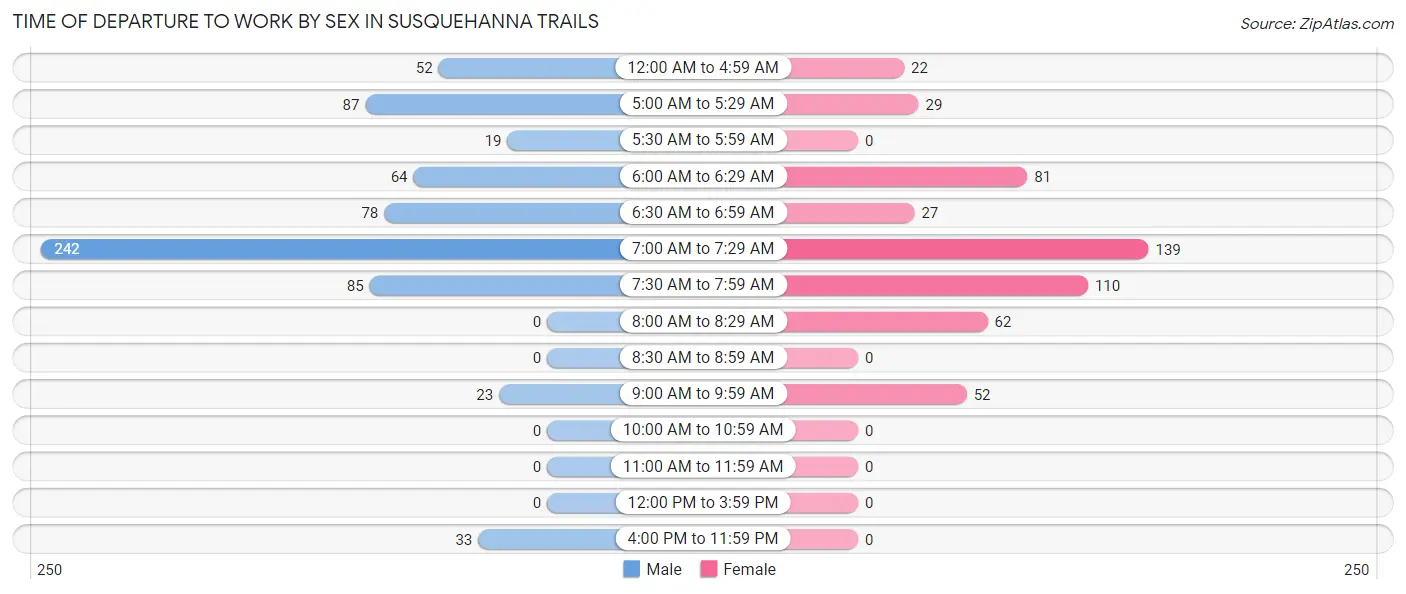
| Time of Departure | Male | Female |
| 12:00 AM to 4:59 AM | 52 (7.6%) | 22 (4.2%) |
| 5:00 AM to 5:29 AM | 87 (12.7%) | 29 (5.6%) |
| 5:30 AM to 5:59 AM | 19 (2.8%) | 0 (0.0%) |
| 6:00 AM to 6:29 AM | 64 (9.4%) | 81 (15.5%) |
| 6:30 AM to 6:59 AM | 78 (11.4%) | 27 (5.2%) |
| 7:00 AM to 7:29 AM | 242 (35.4%) | 139 (26.6%) |
| 7:30 AM to 7:59 AM | 85 (12.4%) | 110 (21.1%) |
| 8:00 AM to 8:29 AM | 0 (0.0%) | 62 (11.9%) |
| 8:30 AM to 8:59 AM | 0 (0.0%) | 0 (0.0%) |
| 9:00 AM to 9:59 AM | 23 (3.4%) | 52 (10.0%) |
| 10:00 AM to 10:59 AM | 0 (0.0%) | 0 (0.0%) |
| 11:00 AM to 11:59 AM | 0 (0.0%) | 0 (0.0%) |
| 12:00 PM to 3:59 PM | 0 (0.0%) | 0 (0.0%) |
| 4:00 PM to 11:59 PM | 33 (4.8%) | 0 (0.0%) |
| Total | 683 (100.0%) | 522 (100.0%) |
Housing Occupancy in Susquehanna Trails
Occupancy by Ownership in Susquehanna Trails
Of the total 808 dwellings in Susquehanna Trails, owner-occupied units account for 656 (81.2%), while renter-occupied units make up 152 (18.8%).
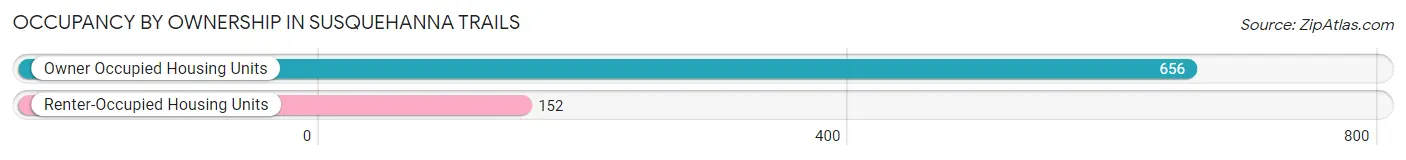
| Occupancy | # Housing Units | % Housing Units |
| Owner Occupied Housing Units | 656 | 81.2% |
| Renter-Occupied Housing Units | 152 | 18.8% |
| Total Occupied Housing Units | 808 | 100.0% |
Occupancy by Household Size in Susquehanna Trails
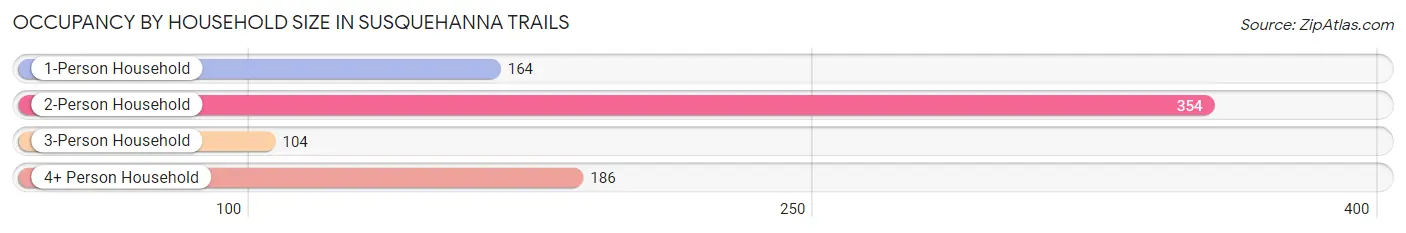
| Household Size | # Housing Units | % Housing Units |
| 1-Person Household | 164 | 20.3% |
| 2-Person Household | 354 | 43.8% |
| 3-Person Household | 104 | 12.9% |
| 4+ Person Household | 186 | 23.0% |
| Total Housing Units | 808 | 100.0% |
Occupancy by Ownership by Household Size in Susquehanna Trails
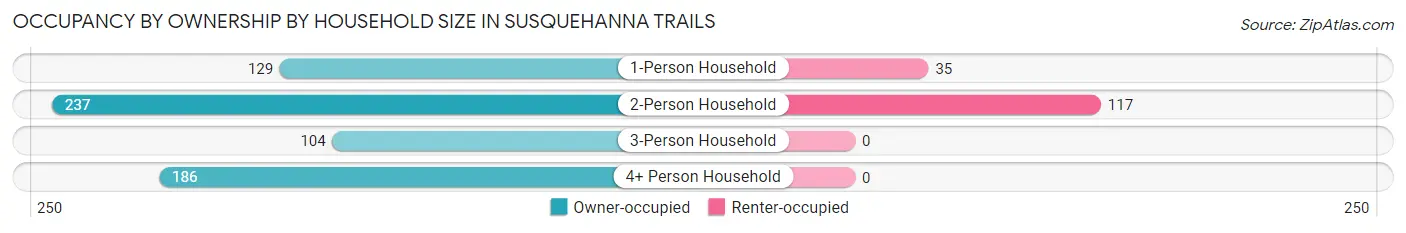
| Household Size | Owner-occupied | Renter-occupied |
| 1-Person Household | 129 (78.7%) | 35 (21.3%) |
| 2-Person Household | 237 (66.9%) | 117 (33.1%) |
| 3-Person Household | 104 (100.0%) | 0 (0.0%) |
| 4+ Person Household | 186 (100.0%) | 0 (0.0%) |
| Total Housing Units | 656 (81.2%) | 152 (18.8%) |
Occupancy by Educational Attainment in Susquehanna Trails
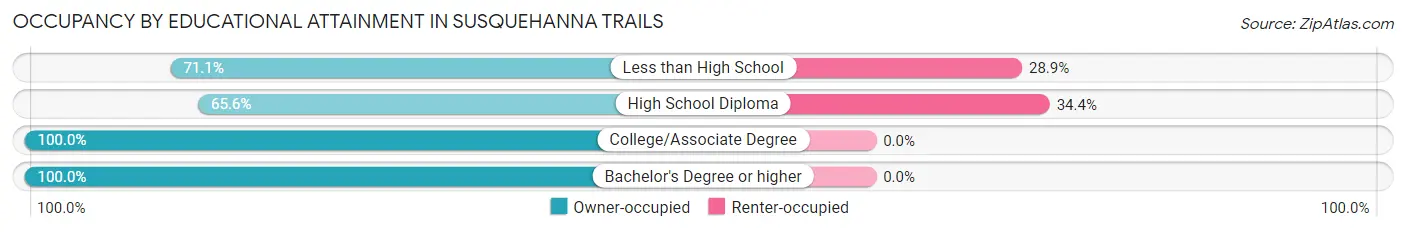
| Household Size | Owner-occupied | Renter-occupied |
| Less than High School | 86 (71.1%) | 35 (28.9%) |
| High School Diploma | 223 (65.6%) | 117 (34.4%) |
| College/Associate Degree | 242 (100.0%) | 0 (0.0%) |
| Bachelor's Degree or higher | 105 (100.0%) | 0 (0.0%) |
Occupancy by Age of Householder in Susquehanna Trails
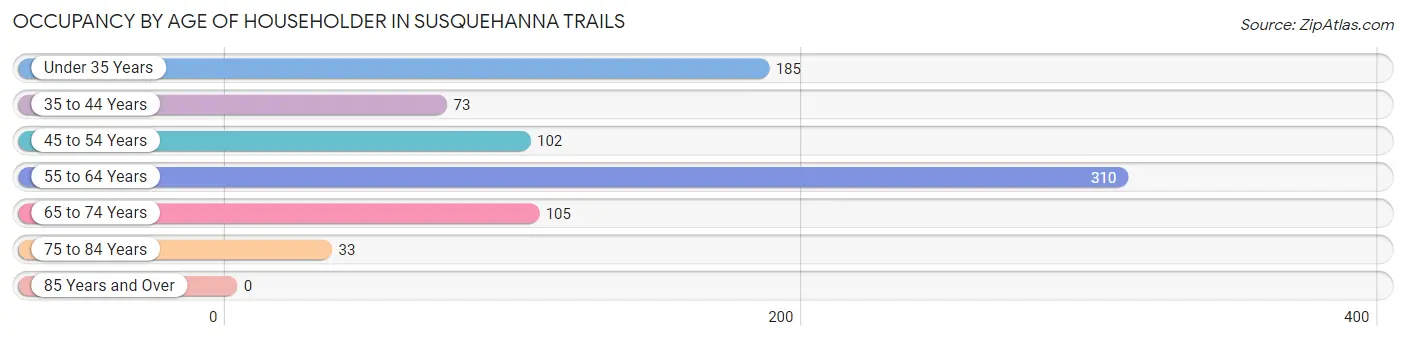
| Age Bracket | # Households | % Households |
| Under 35 Years | 185 | 22.9% |
| 35 to 44 Years | 73 | 9.0% |
| 45 to 54 Years | 102 | 12.6% |
| 55 to 64 Years | 310 | 38.4% |
| 65 to 74 Years | 105 | 13.0% |
| 75 to 84 Years | 33 | 4.1% |
| 85 Years and Over | 0 | 0.0% |
| Total | 808 | 100.0% |
Housing Finances in Susquehanna Trails
Median Income by Occupancy in Susquehanna Trails
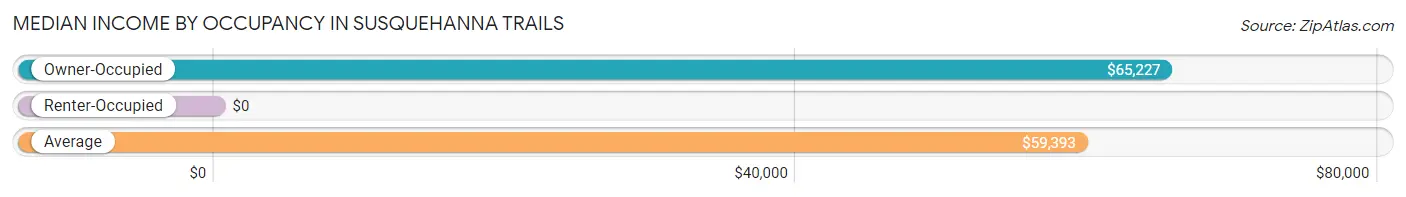
| Occupancy Type | # Households | Median Income |
| Owner-Occupied | 656 (81.2%) | $65,227 |
| Renter-Occupied | 152 (18.8%) | $0 |
| Average | 808 (100.0%) | $59,393 |
Occupancy by Householder Income Bracket in Susquehanna Trails
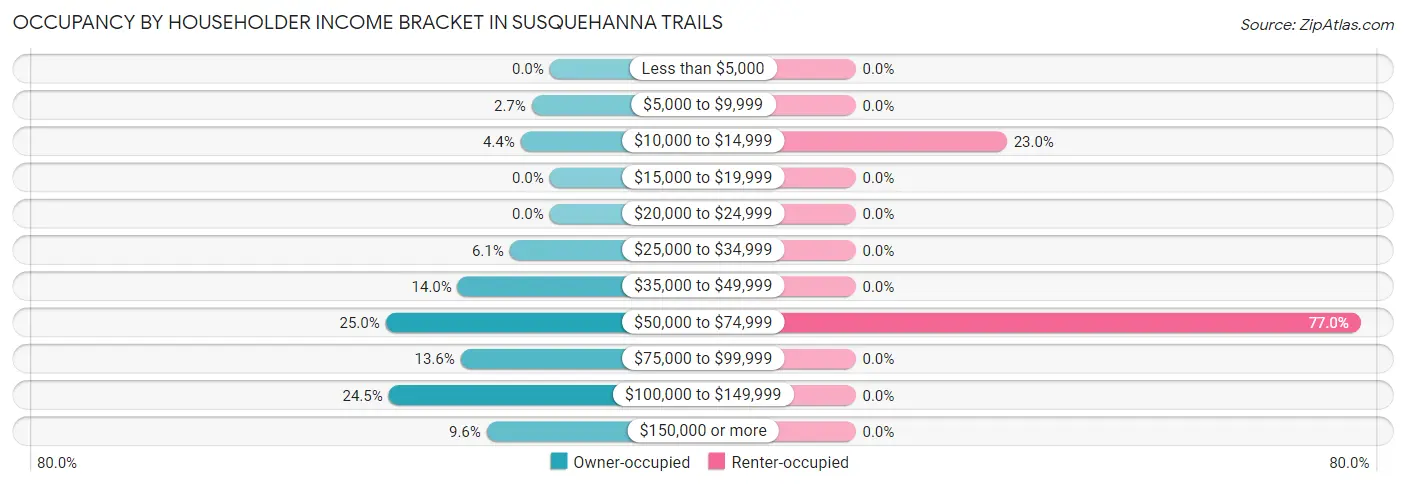
| Income Bracket | Owner-occupied | Renter-occupied |
| Less than $5,000 | 0 (0.0%) | 0 (0.0%) |
| $5,000 to $9,999 | 18 (2.7%) | 0 (0.0%) |
| $10,000 to $14,999 | 29 (4.4%) | 35 (23.0%) |
| $15,000 to $19,999 | 0 (0.0%) | 0 (0.0%) |
| $20,000 to $24,999 | 0 (0.0%) | 0 (0.0%) |
| $25,000 to $34,999 | 40 (6.1%) | 0 (0.0%) |
| $35,000 to $49,999 | 92 (14.0%) | 0 (0.0%) |
| $50,000 to $74,999 | 164 (25.0%) | 117 (77.0%) |
| $75,000 to $99,999 | 89 (13.6%) | 0 (0.0%) |
| $100,000 to $149,999 | 161 (24.5%) | 0 (0.0%) |
| $150,000 or more | 63 (9.6%) | 0 (0.0%) |
| Total | 656 (100.0%) | 152 (100.0%) |
Monthly Housing Cost Tiers in Susquehanna Trails
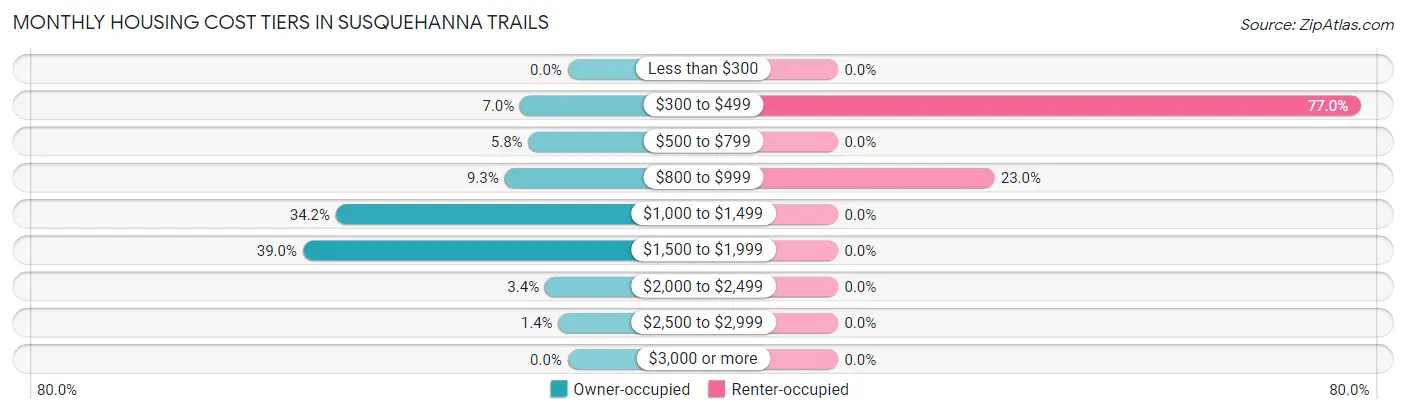
| Monthly Cost | Owner-occupied | Renter-occupied |
| Less than $300 | 0 (0.0%) | 0 (0.0%) |
| $300 to $499 | 46 (7.0%) | 117 (77.0%) |
| $500 to $799 | 38 (5.8%) | 0 (0.0%) |
| $800 to $999 | 61 (9.3%) | 35 (23.0%) |
| $1,000 to $1,499 | 224 (34.2%) | 0 (0.0%) |
| $1,500 to $1,999 | 256 (39.0%) | 0 (0.0%) |
| $2,000 to $2,499 | 22 (3.4%) | 0 (0.0%) |
| $2,500 to $2,999 | 9 (1.4%) | 0 (0.0%) |
| $3,000 or more | 0 (0.0%) | 0 (0.0%) |
| Total | 656 (100.0%) | 152 (100.0%) |
Physical Housing Characteristics in Susquehanna Trails
Housing Structures in Susquehanna Trails
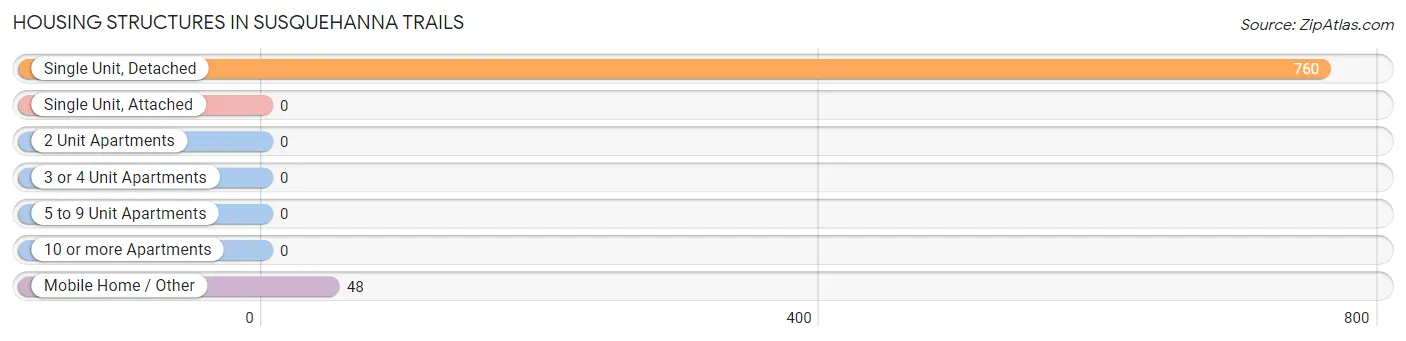
| Structure Type | # Housing Units | % Housing Units |
| Single Unit, Detached | 760 | 94.1% |
| Single Unit, Attached | 0 | 0.0% |
| 2 Unit Apartments | 0 | 0.0% |
| 3 or 4 Unit Apartments | 0 | 0.0% |
| 5 to 9 Unit Apartments | 0 | 0.0% |
| 10 or more Apartments | 0 | 0.0% |
| Mobile Home / Other | 48 | 5.9% |
| Total | 808 | 100.0% |
Housing Structures by Occupancy in Susquehanna Trails
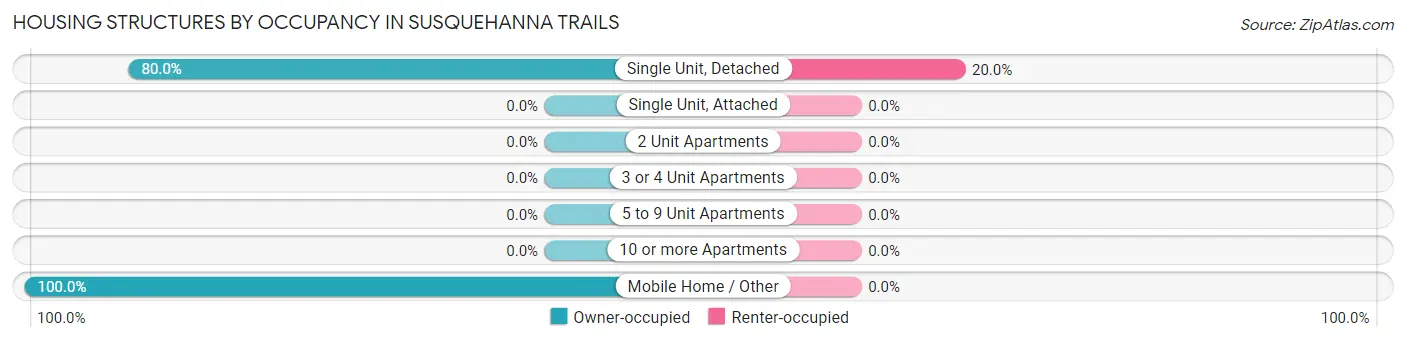
| Structure Type | Owner-occupied | Renter-occupied |
| Single Unit, Detached | 608 (80.0%) | 152 (20.0%) |
| Single Unit, Attached | 0 (0.0%) | 0 (0.0%) |
| 2 Unit Apartments | 0 (0.0%) | 0 (0.0%) |
| 3 or 4 Unit Apartments | 0 (0.0%) | 0 (0.0%) |
| 5 to 9 Unit Apartments | 0 (0.0%) | 0 (0.0%) |
| 10 or more Apartments | 0 (0.0%) | 0 (0.0%) |
| Mobile Home / Other | 48 (100.0%) | 0 (0.0%) |
| Total | 656 (81.2%) | 152 (18.8%) |
Housing Structures by Number of Rooms in Susquehanna Trails
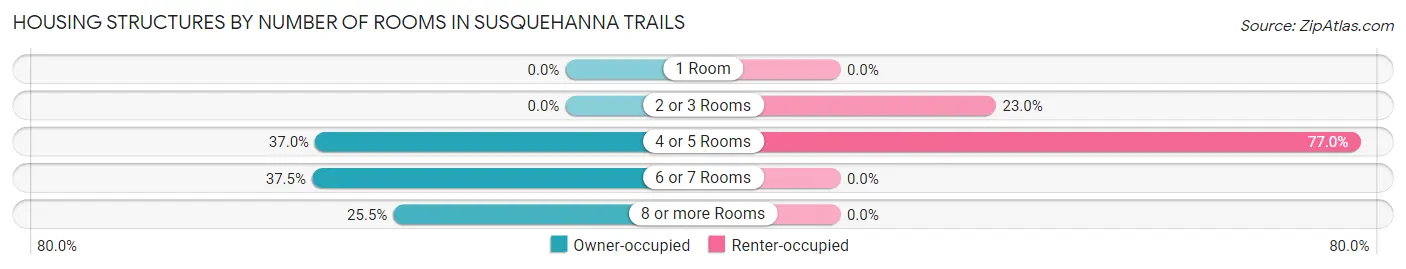
| Number of Rooms | Owner-occupied | Renter-occupied |
| 1 Room | 0 (0.0%) | 0 (0.0%) |
| 2 or 3 Rooms | 0 (0.0%) | 35 (23.0%) |
| 4 or 5 Rooms | 243 (37.0%) | 117 (77.0%) |
| 6 or 7 Rooms | 246 (37.5%) | 0 (0.0%) |
| 8 or more Rooms | 167 (25.5%) | 0 (0.0%) |
| Total | 656 (100.0%) | 152 (100.0%) |
Housing Structure by Heating Type in Susquehanna Trails
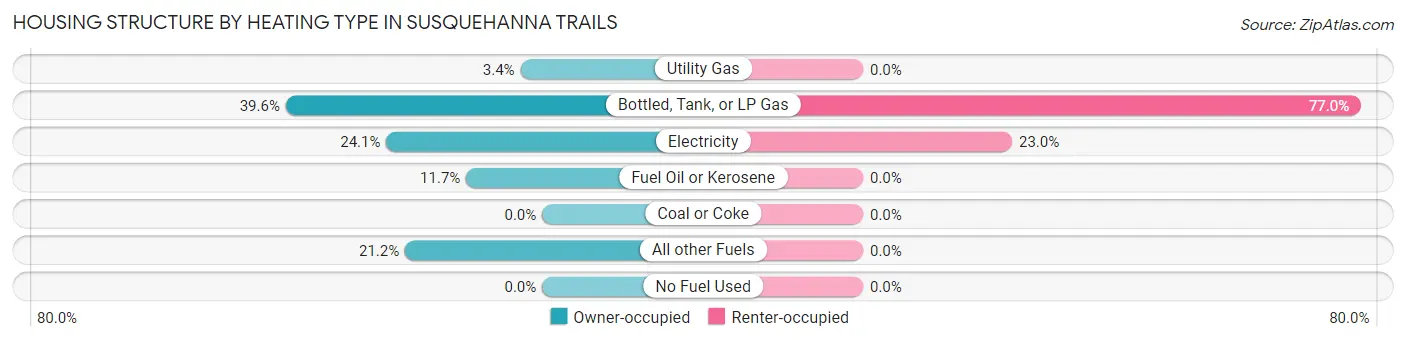
| Heating Type | Owner-occupied | Renter-occupied |
| Utility Gas | 22 (3.4%) | 0 (0.0%) |
| Bottled, Tank, or LP Gas | 260 (39.6%) | 117 (77.0%) |
| Electricity | 158 (24.1%) | 35 (23.0%) |
| Fuel Oil or Kerosene | 77 (11.7%) | 0 (0.0%) |
| Coal or Coke | 0 (0.0%) | 0 (0.0%) |
| All other Fuels | 139 (21.2%) | 0 (0.0%) |
| No Fuel Used | 0 (0.0%) | 0 (0.0%) |
| Total | 656 (100.0%) | 152 (100.0%) |
Household Vehicle Usage in Susquehanna Trails
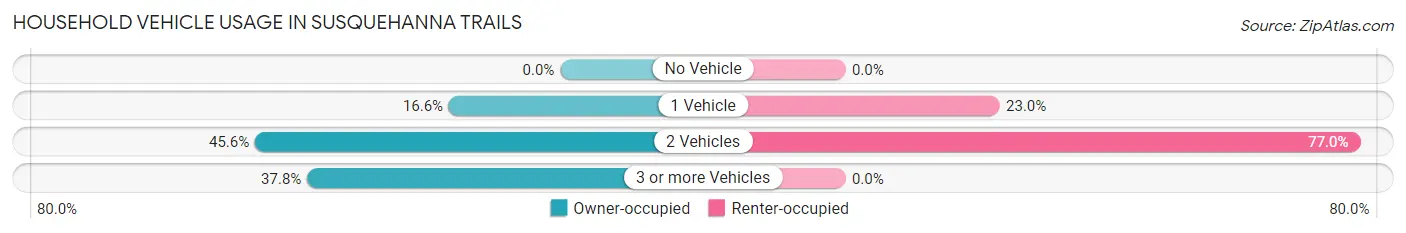
| Vehicles per Household | Owner-occupied | Renter-occupied |
| No Vehicle | 0 (0.0%) | 0 (0.0%) |
| 1 Vehicle | 109 (16.6%) | 35 (23.0%) |
| 2 Vehicles | 299 (45.6%) | 117 (77.0%) |
| 3 or more Vehicles | 248 (37.8%) | 0 (0.0%) |
| Total | 656 (100.0%) | 152 (100.0%) |
Real Estate & Mortgages in Susquehanna Trails
Real Estate and Mortgage Overview in Susquehanna Trails
| Characteristic | Without Mortgage | With Mortgage |
| Housing Units | 139 | 517 |
| Median Property Value | $234,600 | $177,600 |
| Median Household Income | $60,625 | $48 |
| Monthly Housing Costs | $910 | $0 |
| Real Estate Taxes | $4,447 | $27 |
Property Value by Mortgage Status in Susquehanna Trails
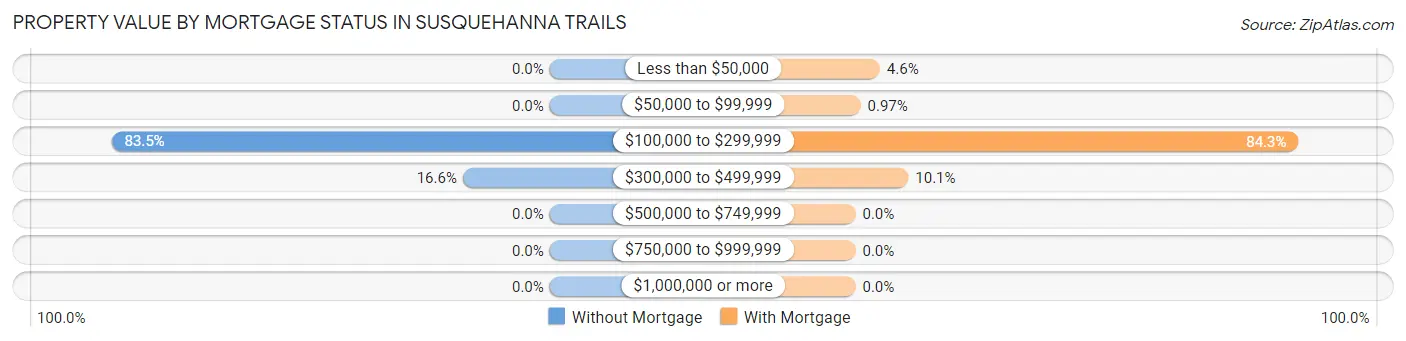
| Property Value | Without Mortgage | With Mortgage |
| Less than $50,000 | 0 (0.0%) | 24 (4.6%) |
| $50,000 to $99,999 | 0 (0.0%) | 5 (1.0%) |
| $100,000 to $299,999 | 116 (83.5%) | 436 (84.3%) |
| $300,000 to $499,999 | 23 (16.6%) | 52 (10.1%) |
| $500,000 to $749,999 | 0 (0.0%) | 0 (0.0%) |
| $750,000 to $999,999 | 0 (0.0%) | 0 (0.0%) |
| $1,000,000 or more | 0 (0.0%) | 0 (0.0%) |
| Total | 139 (100.0%) | 517 (100.0%) |
Household Income by Mortgage Status in Susquehanna Trails
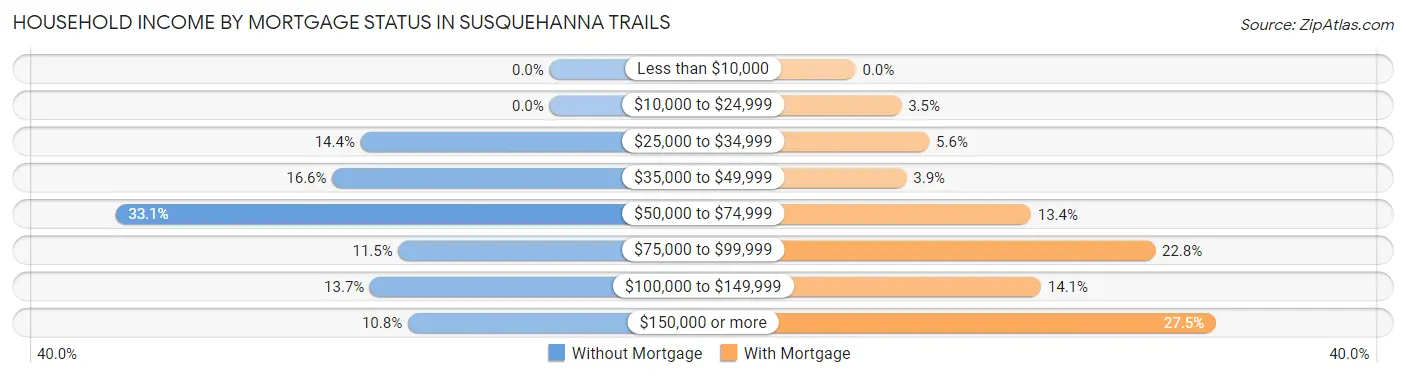
| Household Income | Without Mortgage | With Mortgage |
| Less than $10,000 | 0 (0.0%) | 0 (0.0%) |
| $10,000 to $24,999 | 0 (0.0%) | 18 (3.5%) |
| $25,000 to $34,999 | 20 (14.4%) | 29 (5.6%) |
| $35,000 to $49,999 | 23 (16.6%) | 20 (3.9%) |
| $50,000 to $74,999 | 46 (33.1%) | 69 (13.4%) |
| $75,000 to $99,999 | 16 (11.5%) | 118 (22.8%) |
| $100,000 to $149,999 | 19 (13.7%) | 73 (14.1%) |
| $150,000 or more | 15 (10.8%) | 142 (27.5%) |
| Total | 139 (100.0%) | 517 (100.0%) |
Property Value to Household Income Ratio in Susquehanna Trails
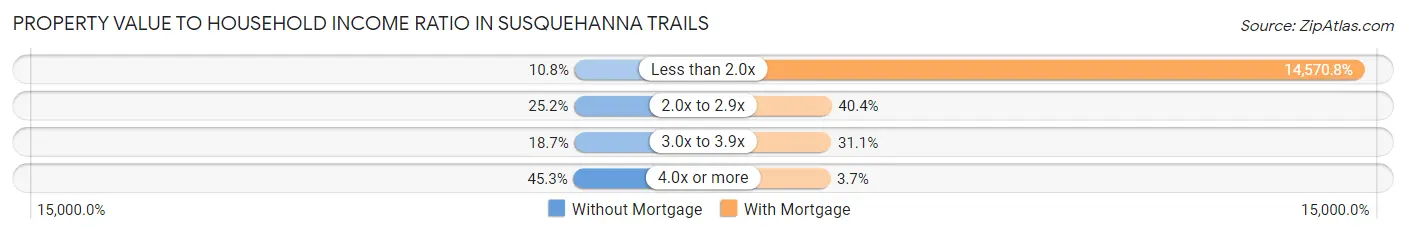
| Value-to-Income Ratio | Without Mortgage | With Mortgage |
| Less than 2.0x | 15 (10.8%) | 75,331 (14,570.8%) |
| 2.0x to 2.9x | 35 (25.2%) | 209 (40.4%) |
| 3.0x to 3.9x | 26 (18.7%) | 161 (31.1%) |
| 4.0x or more | 63 (45.3%) | 19 (3.7%) |
| Total | 139 (100.0%) | 517 (100.0%) |
Real Estate Taxes by Mortgage Status in Susquehanna Trails
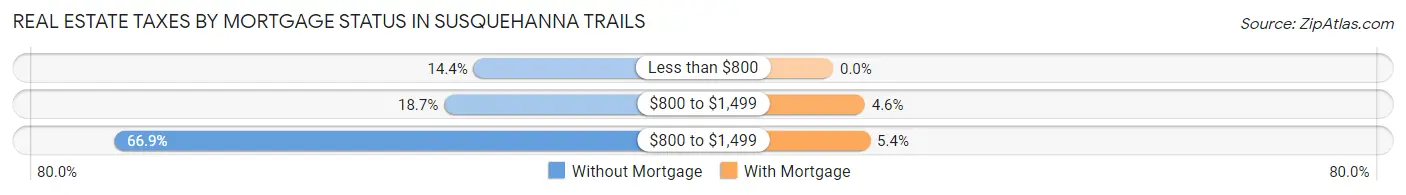
| Property Taxes | Without Mortgage | With Mortgage |
| Less than $800 | 20 (14.4%) | 0 (0.0%) |
| $800 to $1,499 | 26 (18.7%) | 24 (4.6%) |
| $800 to $1,499 | 93 (66.9%) | 28 (5.4%) |
| Total | 139 (100.0%) | 517 (100.0%) |
Health & Disability in Susquehanna Trails
Health Insurance Coverage by Age in Susquehanna Trails
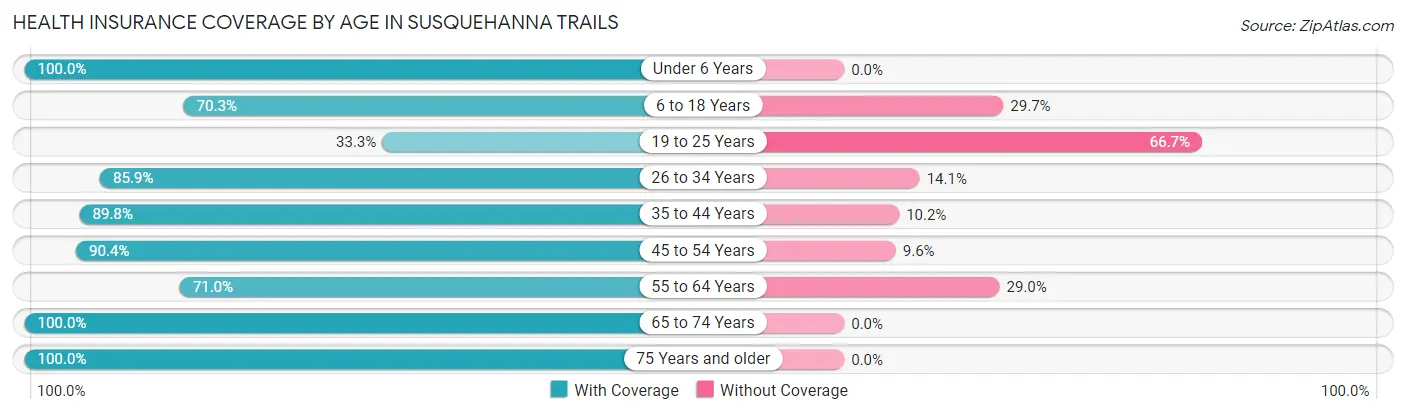
| Age Bracket | With Coverage | Without Coverage |
| Under 6 Years | 45 (100.0%) | 0 (0.0%) |
| 6 to 18 Years | 237 (70.3%) | 100 (29.7%) |
| 19 to 25 Years | 18 (33.3%) | 36 (66.7%) |
| 26 to 34 Years | 519 (85.9%) | 85 (14.1%) |
| 35 to 44 Years | 184 (89.8%) | 21 (10.2%) |
| 45 to 54 Years | 207 (90.4%) | 22 (9.6%) |
| 55 to 64 Years | 287 (71.0%) | 117 (29.0%) |
| 65 to 74 Years | 120 (100.0%) | 0 (0.0%) |
| 75 Years and older | 95 (100.0%) | 0 (0.0%) |
| Total | 1,712 (81.8%) | 381 (18.2%) |
Health Insurance Coverage by Citizenship Status in Susquehanna Trails
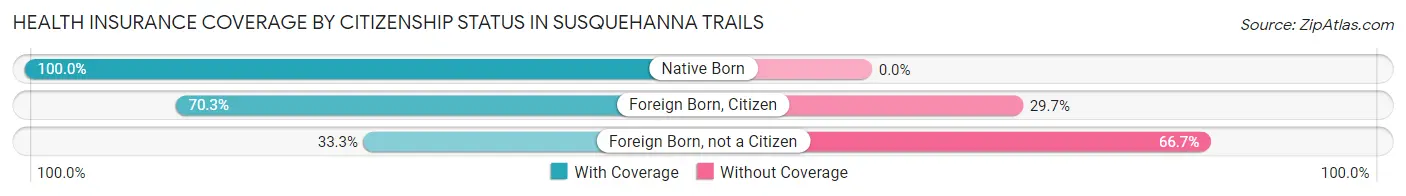
| Citizenship Status | With Coverage | Without Coverage |
| Native Born | 45 (100.0%) | 0 (0.0%) |
| Foreign Born, Citizen | 237 (70.3%) | 100 (29.7%) |
| Foreign Born, not a Citizen | 18 (33.3%) | 36 (66.7%) |
Health Insurance Coverage by Household Income in Susquehanna Trails
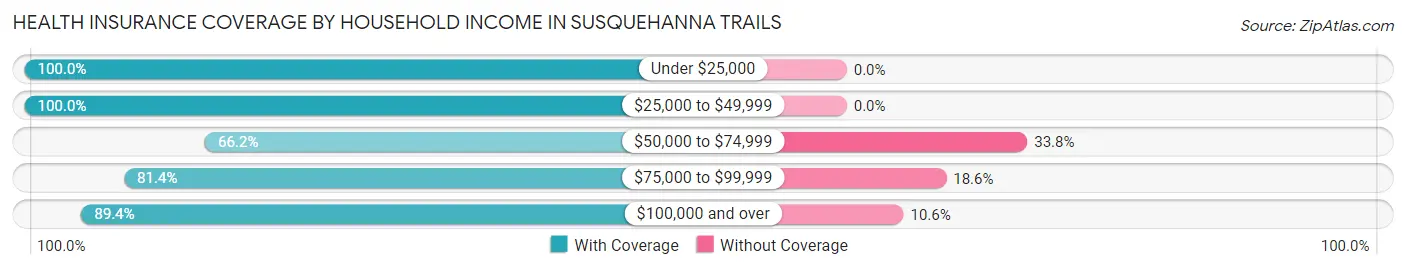
| Household Income | With Coverage | Without Coverage |
| Under $25,000 | 115 (100.0%) | 0 (0.0%) |
| $25,000 to $49,999 | 205 (100.0%) | 0 (0.0%) |
| $50,000 to $74,999 | 499 (66.2%) | 255 (33.8%) |
| $75,000 to $99,999 | 179 (81.4%) | 41 (18.6%) |
| $100,000 and over | 714 (89.4%) | 85 (10.6%) |
Public vs Private Health Insurance Coverage by Age in Susquehanna Trails
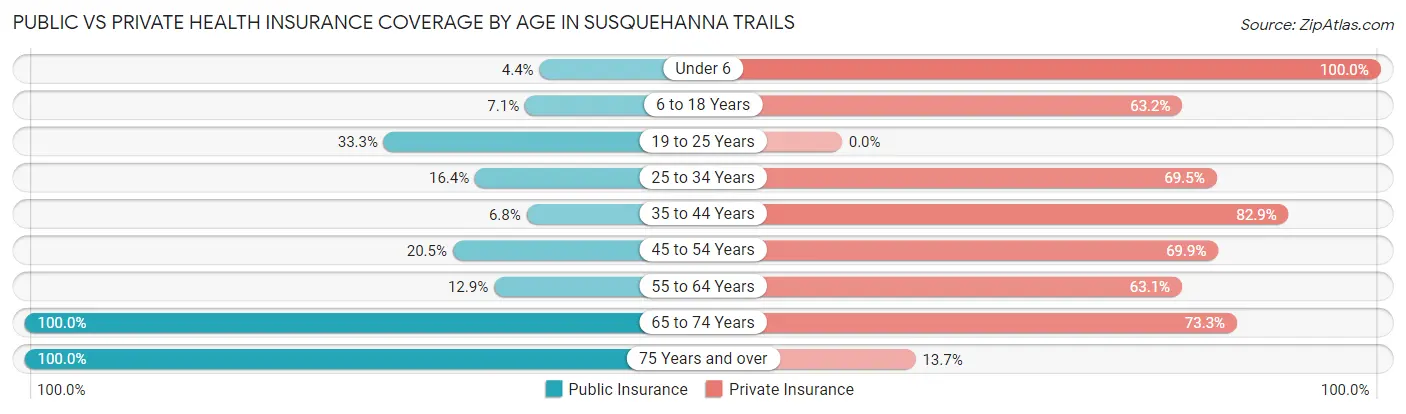
| Age Bracket | Public Insurance | Private Insurance |
| Under 6 | 2 (4.4%) | 45 (100.0%) |
| 6 to 18 Years | 24 (7.1%) | 213 (63.2%) |
| 19 to 25 Years | 18 (33.3%) | 0 (0.0%) |
| 25 to 34 Years | 99 (16.4%) | 420 (69.5%) |
| 35 to 44 Years | 14 (6.8%) | 170 (82.9%) |
| 45 to 54 Years | 47 (20.5%) | 160 (69.9%) |
| 55 to 64 Years | 52 (12.9%) | 255 (63.1%) |
| 65 to 74 Years | 120 (100.0%) | 88 (73.3%) |
| 75 Years and over | 95 (100.0%) | 13 (13.7%) |
| Total | 471 (22.5%) | 1,364 (65.2%) |
Disability Status by Sex by Age in Susquehanna Trails
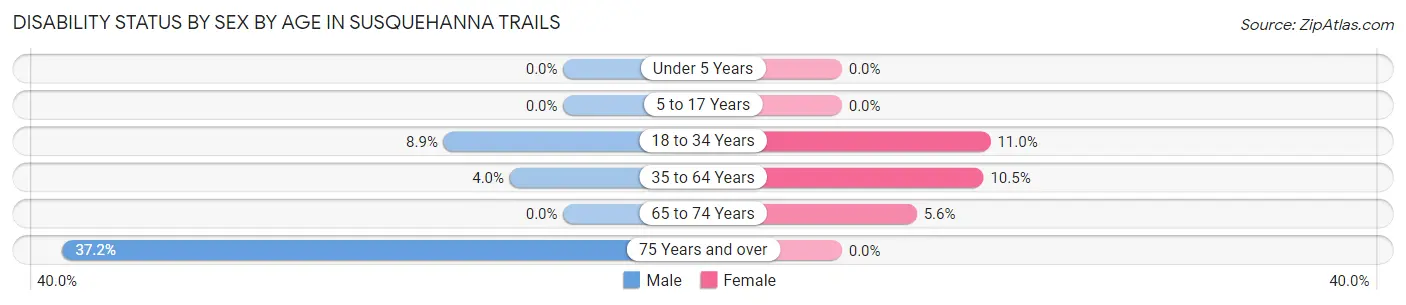
| Age Bracket | Male | Female |
| Under 5 Years | 0 (0.0%) | 0 (0.0%) |
| 5 to 17 Years | 0 (0.0%) | 0 (0.0%) |
| 18 to 34 Years | 35 (8.9%) | 33 (11.0%) |
| 35 to 64 Years | 14 (4.0%) | 51 (10.5%) |
| 65 to 74 Years | 0 (0.0%) | 5 (5.6%) |
| 75 Years and over | 29 (37.2%) | 0 (0.0%) |
Disability Class by Sex by Age in Susquehanna Trails
Disability Class: Hearing Difficulty
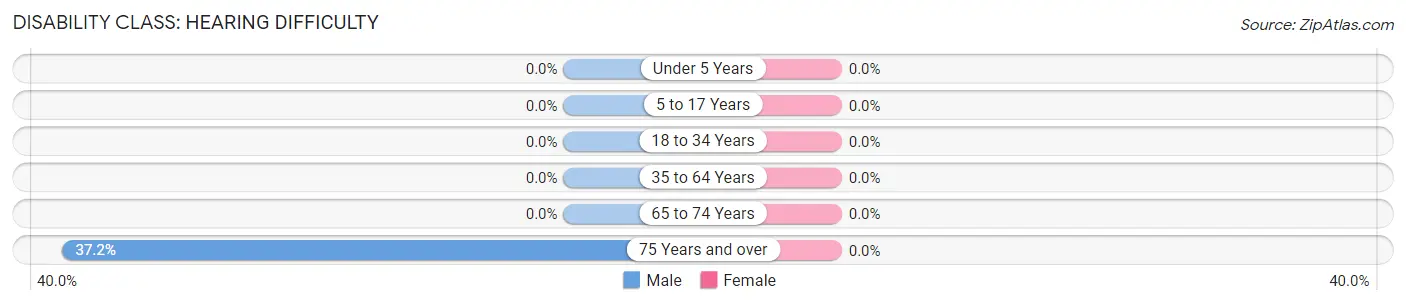
| Age Bracket | Male | Female |
| Under 5 Years | 0 (0.0%) | 0 (0.0%) |
| 5 to 17 Years | 0 (0.0%) | 0 (0.0%) |
| 18 to 34 Years | 0 (0.0%) | 0 (0.0%) |
| 35 to 64 Years | 0 (0.0%) | 0 (0.0%) |
| 65 to 74 Years | 0 (0.0%) | 0 (0.0%) |
| 75 Years and over | 29 (37.2%) | 0 (0.0%) |
Disability Class: Vision Difficulty
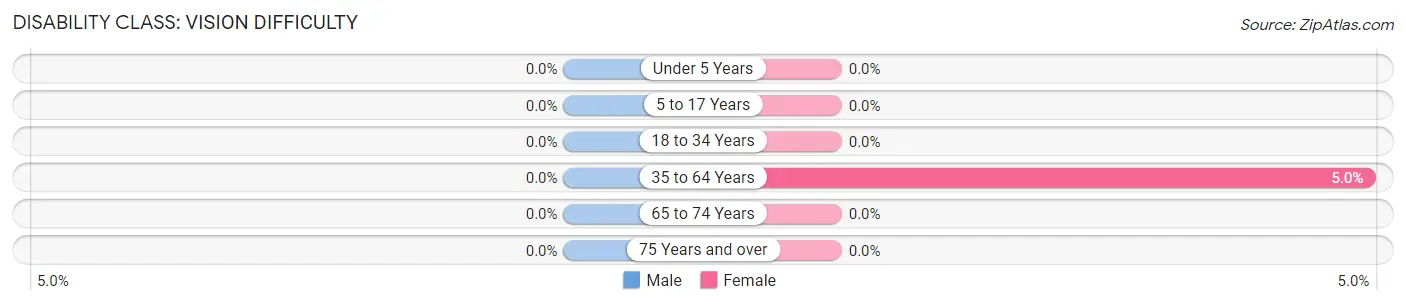
| Age Bracket | Male | Female |
| Under 5 Years | 0 (0.0%) | 0 (0.0%) |
| 5 to 17 Years | 0 (0.0%) | 0 (0.0%) |
| 18 to 34 Years | 0 (0.0%) | 0 (0.0%) |
| 35 to 64 Years | 0 (0.0%) | 24 (5.0%) |
| 65 to 74 Years | 0 (0.0%) | 0 (0.0%) |
| 75 Years and over | 0 (0.0%) | 0 (0.0%) |
Disability Class: Cognitive Difficulty
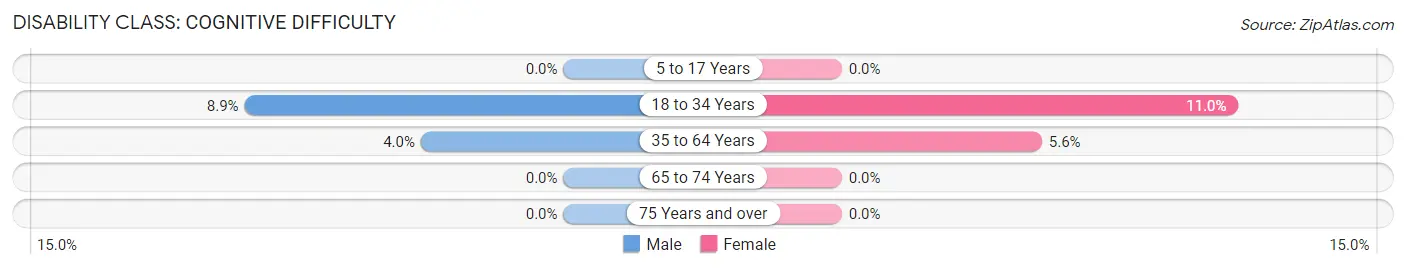
| Age Bracket | Male | Female |
| 5 to 17 Years | 0 (0.0%) | 0 (0.0%) |
| 18 to 34 Years | 35 (8.9%) | 33 (11.0%) |
| 35 to 64 Years | 14 (4.0%) | 27 (5.6%) |
| 65 to 74 Years | 0 (0.0%) | 0 (0.0%) |
| 75 Years and over | 0 (0.0%) | 0 (0.0%) |
Disability Class: Ambulatory Difficulty
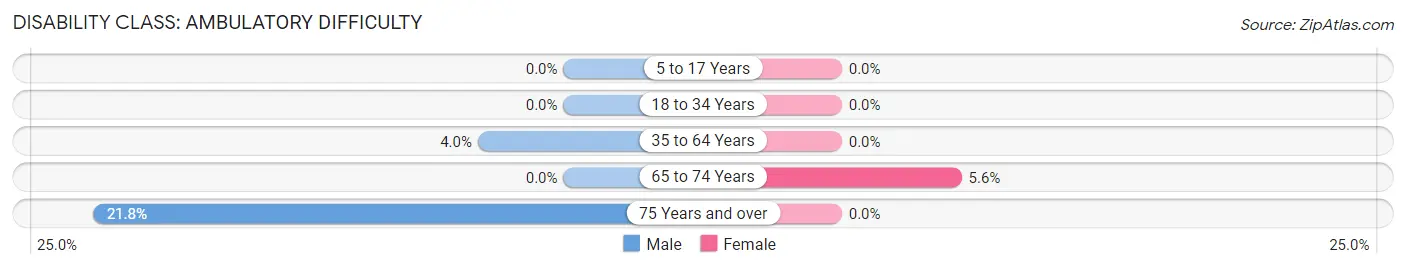
| Age Bracket | Male | Female |
| 5 to 17 Years | 0 (0.0%) | 0 (0.0%) |
| 18 to 34 Years | 0 (0.0%) | 0 (0.0%) |
| 35 to 64 Years | 14 (4.0%) | 0 (0.0%) |
| 65 to 74 Years | 0 (0.0%) | 5 (5.6%) |
| 75 Years and over | 17 (21.8%) | 0 (0.0%) |
Disability Class: Self-Care Difficulty
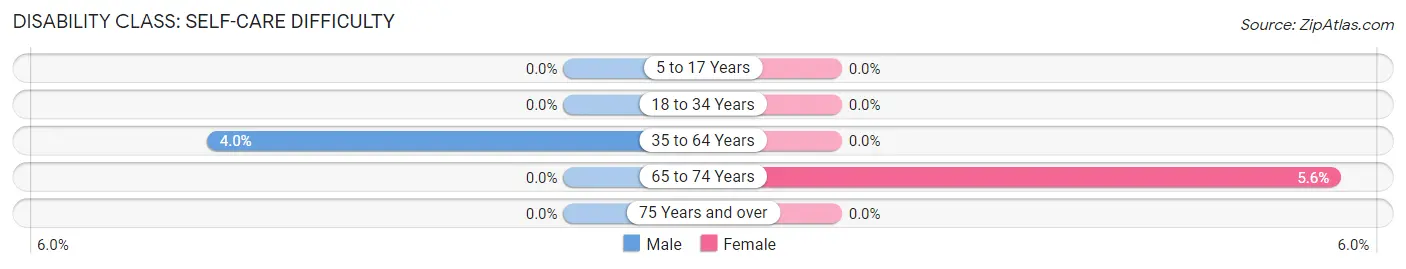
| Age Bracket | Male | Female |
| 5 to 17 Years | 0 (0.0%) | 0 (0.0%) |
| 18 to 34 Years | 0 (0.0%) | 0 (0.0%) |
| 35 to 64 Years | 14 (4.0%) | 0 (0.0%) |
| 65 to 74 Years | 0 (0.0%) | 5 (5.6%) |
| 75 Years and over | 0 (0.0%) | 0 (0.0%) |
Technology Access in Susquehanna Trails
Computing Device Access in Susquehanna Trails
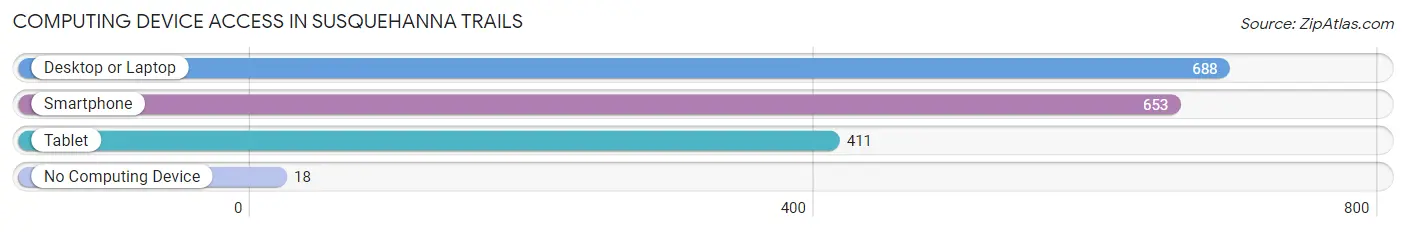
| Device Type | # Households | % Households |
| Desktop or Laptop | 688 | 85.2% |
| Smartphone | 653 | 80.8% |
| Tablet | 411 | 50.9% |
| No Computing Device | 18 | 2.2% |
| Total | 808 | 100.0% |
Internet Access in Susquehanna Trails
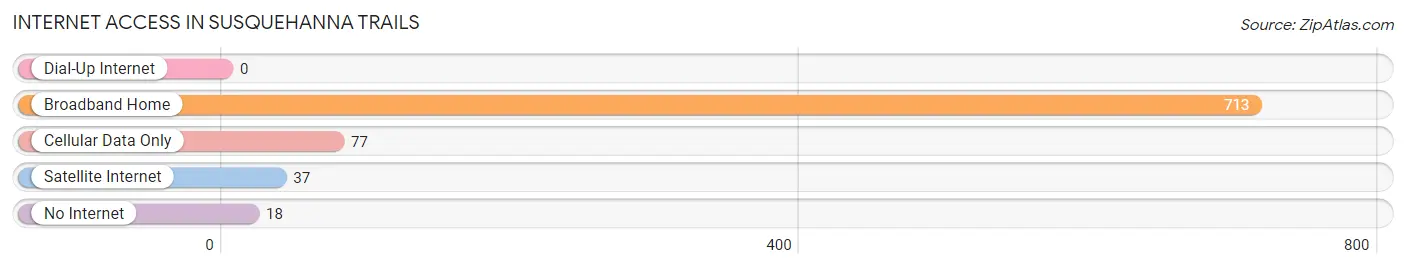
| Internet Type | # Households | % Households |
| Dial-Up Internet | 0 | 0.0% |
| Broadband Home | 713 | 88.2% |
| Cellular Data Only | 77 | 9.5% |
| Satellite Internet | 37 | 4.6% |
| No Internet | 18 | 2.2% |
| Total | 808 | 100.0% |
Susquehanna Trails Summary
Susquehanna Trails is a region located in central Pennsylvania, United States. It is bordered by the Susquehanna River to the east, the Allegheny Mountains to the west, and the Susquehanna Valley to the south. The region is home to a variety of cities, towns, and villages, and is known for its rich history, diverse geography, and vibrant economy.
History
The Susquehanna Trails region has a long and varied history. The area was first inhabited by Native American tribes, including the Susquehannock, Iroquois, and Lenape. These tribes were known for their hunting and fishing skills, and their presence in the region dates back thousands of years.
In the 17th century, the Susquehanna Trails region was explored by European settlers. The first permanent settlement was established in 1729, and the region quickly became a hub for trade and commerce. The Susquehanna River was an important transportation route, and the region was home to a variety of industries, including lumber, coal, and iron.
In the 19th century, the Susquehanna Trails region experienced a period of rapid growth and development. Railroads were built, and the region became a major center for manufacturing and industry. The region was also home to a variety of cultural and educational institutions, including the University of Pennsylvania and Dickinson College.
Geography
The Susquehanna Trails region is located in central Pennsylvania, and is bordered by the Susquehanna River to the east, the Allegheny Mountains to the west, and the Susquehanna Valley to the south. The region is home to a variety of cities, towns, and villages, including Harrisburg, York, Lancaster, and Reading.
The region is known for its diverse geography, which includes rolling hills, lush forests, and winding rivers. The Susquehanna River is the longest river in the region, and is an important source of water for the area. The region is also home to a variety of wildlife, including deer, bear, and bald eagles.
Economy
The Susquehanna Trails region is home to a vibrant and diverse economy. The region is known for its manufacturing and industrial sectors, which include steel, paper, and chemical production. The region is also home to a variety of agricultural products, including dairy, poultry, and grains.
The region is also home to a variety of service industries, including healthcare, education, and tourism. The region is home to a number of major employers, including Hershey Foods, PPL Corporation, and Highmark Health.
Demographics
As of the 2010 census, the Susquehanna Trails region had a population of 2,717,624. The region is home to a variety of ethnic and racial groups, including White (77.3%), African American (14.2%), Hispanic or Latino (5.2%), and Asian (2.3%).
The region is also home to a variety of religious groups, including Protestant (45.2%), Catholic (25.2%), and Jewish (2.2%). The median household income in the region is $50,936, and the median home value is $164,400.
Conclusion
The Susquehanna Trails region is a vibrant and diverse region located in central Pennsylvania. The region is known for its rich history, diverse geography, and vibrant economy. The region is home to a variety of cities, towns, and villages, and is home to a variety of ethnic and racial groups. The region is also home to a variety of industries, including manufacturing, agriculture, and services. The region is an important part of the state of Pennsylvania, and is an important contributor to the state’s economy.
Common Questions
What is Per Capita Income in Susquehanna Trails?
Per Capita income in Susquehanna Trails is $30,102.
What is the Median Family Income in Susquehanna Trails?
Median Family Income in Susquehanna Trails is $64,615.
What is the Median Household income in Susquehanna Trails?
Median Household Income in Susquehanna Trails is $59,393.
What is Inequality or Gini Index in Susquehanna Trails?
Inequality or Gini Index in Susquehanna Trails is 0.34.
What is the Total Population of Susquehanna Trails?
Total Population of Susquehanna Trails is 2,097.
What is the Total Male Population of Susquehanna Trails?
Total Male Population of Susquehanna Trails is 1,031.
What is the Total Female Population of Susquehanna Trails?
Total Female Population of Susquehanna Trails is 1,066.
What is the Ratio of Males per 100 Females in Susquehanna Trails?
There are 96.72 Males per 100 Females in Susquehanna Trails.
What is the Ratio of Females per 100 Males in Susquehanna Trails?
There are 103.39 Females per 100 Males in Susquehanna Trails.
What is the Median Population Age in Susquehanna Trails?
Median Population Age in Susquehanna Trails is 36.2 Years.
What is the Average Family Size in Susquehanna Trails
Average Family Size in Susquehanna Trails is 2.9 People.
What is the Average Household Size in Susquehanna Trails
Average Household Size in Susquehanna Trails is 2.6 People.
How Large is the Labor Force in Susquehanna Trails?
There are 1,291 People in the Labor Forcein in Susquehanna Trails.
What is the Percentage of People in the Labor Force in Susquehanna Trails?
72.1% of People are in the Labor Force in Susquehanna Trails.
What is the Unemployment Rate in Susquehanna Trails?
Unemployment Rate in Susquehanna Trails is 3.0%.