Pleasant View, PA Map & Demographics
Pleasant View Map
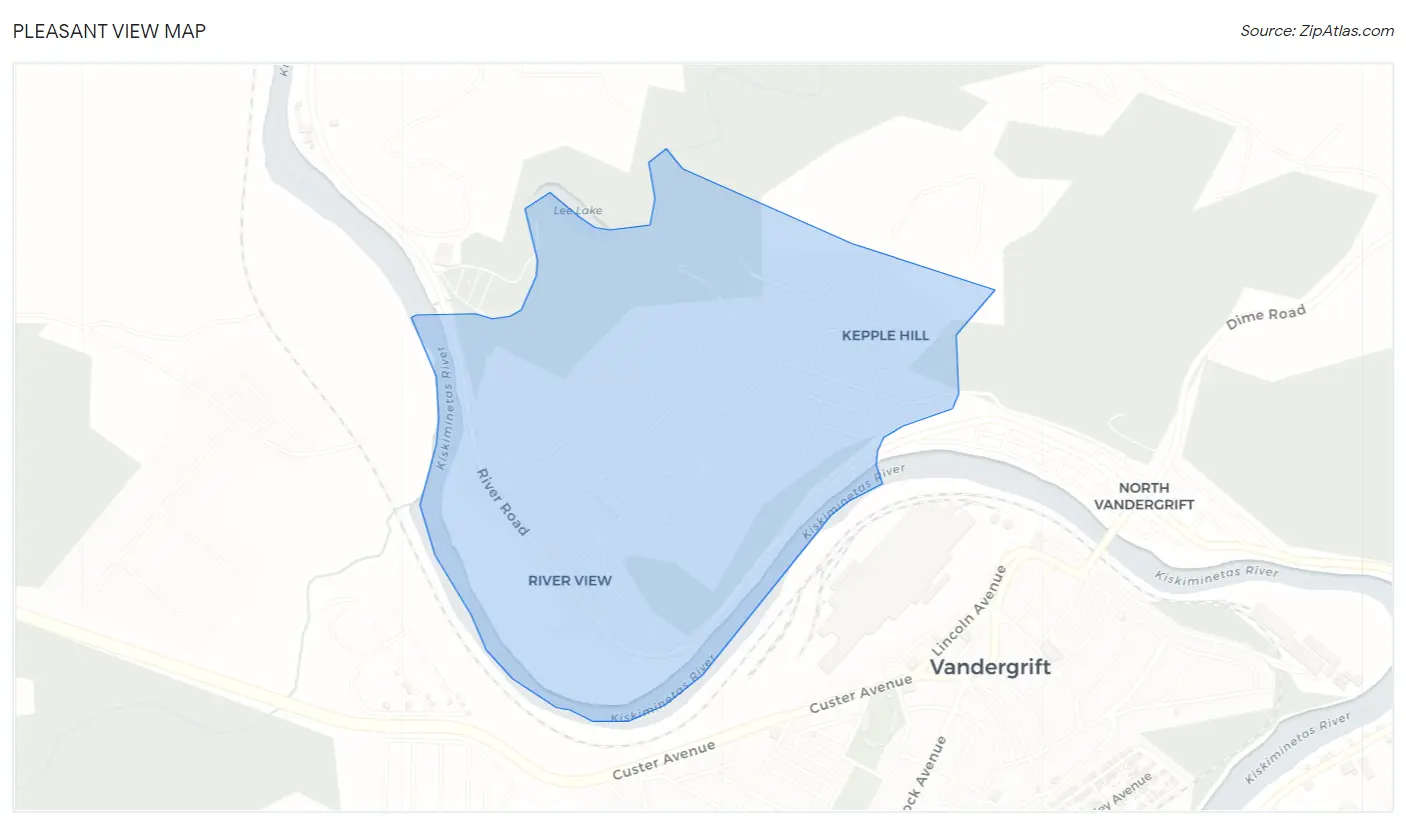
Pleasant View Overview
$27,532
PER CAPITA INCOME
$77,917
AVG FAMILY INCOME
$69,844
AVG HOUSEHOLD INCOME
44.3%
WAGE / INCOME GAP [ % ]
55.7¢/ $1
WAGE / INCOME GAP [ $ ]
0.25
INEQUALITY / GINI INDEX
733
TOTAL POPULATION
424
MALE POPULATION
309
FEMALE POPULATION
137.22
MALES / 100 FEMALES
72.88
FEMALES / 100 MALES
42.4
MEDIAN AGE
3.2
AVG FAMILY SIZE
2.4
AVG HOUSEHOLD SIZE
379
LABOR FORCE [ PEOPLE ]
62.0%
PERCENT IN LABOR FORCE
2.6%
UNEMPLOYMENT RATE
Income in Pleasant View
Income Overview in Pleasant View
Per Capita Income in Pleasant View is $27,532, while median incomes of families and households are $77,917 and $69,844 respectively.
| Characteristic | Number | Measure |
| Per Capita Income | 733 | $27,532 |
| Median Family Income | 191 | $77,917 |
| Mean Family Income | 191 | $77,908 |
| Median Household Income | 309 | $69,844 |
| Mean Household Income | 309 | $66,484 |
| Income Deficit | 191 | $0 |
| Wage / Income Gap (%) | 733 | 44.33% |
| Wage / Income Gap ($) | 733 | 55.67¢ per $1 |
| Gini / Inequality Index | 733 | 0.25 |
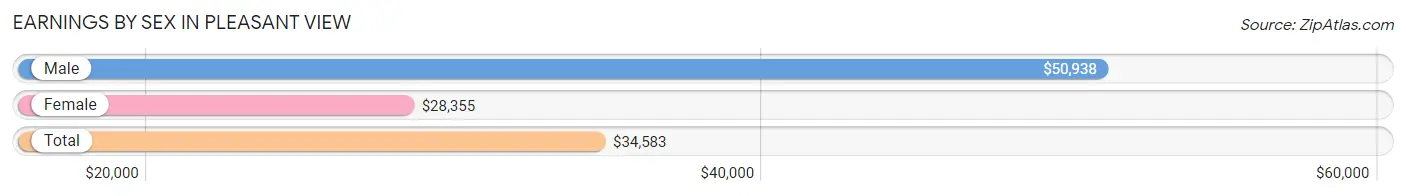
Earnings by Sex in Pleasant View
Average Earnings in Pleasant View are $34,583, $50,938 for men and $28,355 for women, a difference of 44.3%.
| Sex | Number | Average Earnings |
| Male | 254 (65.6%) | $50,938 |
| Female | 133 (34.4%) | $28,355 |
| Total | 387 (100.0%) | $34,583 |
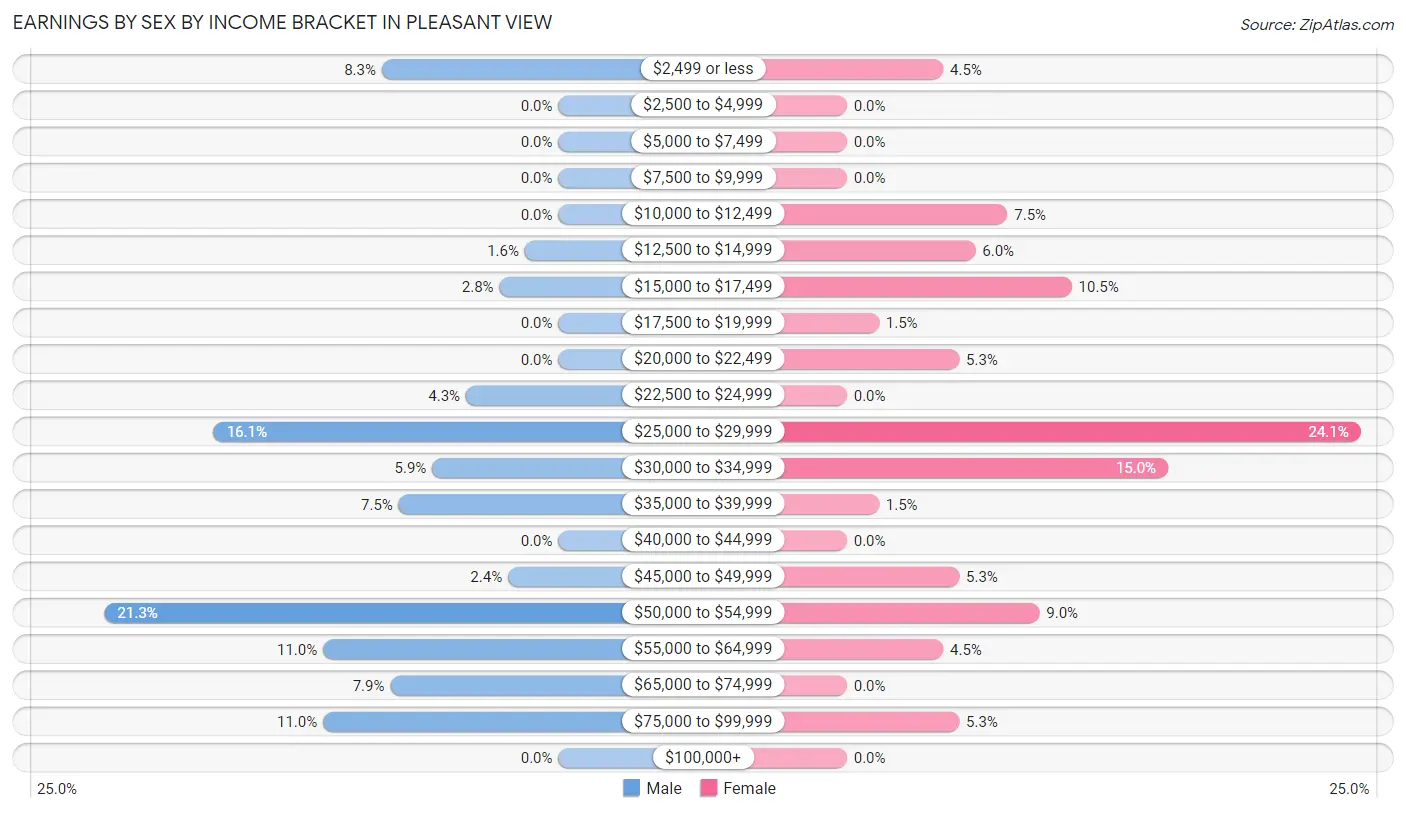
Earnings by Sex by Income Bracket in Pleasant View
The most common earnings brackets in Pleasant View are $50,000 to $54,999 for men (54 | 21.3%) and $25,000 to $29,999 for women (32 | 24.1%).
| Income | Male | Female |
| $2,499 or less | 21 (8.3%) | 6 (4.5%) |
| $2,500 to $4,999 | 0 (0.0%) | 0 (0.0%) |
| $5,000 to $7,499 | 0 (0.0%) | 0 (0.0%) |
| $7,500 to $9,999 | 0 (0.0%) | 0 (0.0%) |
| $10,000 to $12,499 | 0 (0.0%) | 10 (7.5%) |
| $12,500 to $14,999 | 4 (1.6%) | 8 (6.0%) |
| $15,000 to $17,499 | 7 (2.8%) | 14 (10.5%) |
| $17,500 to $19,999 | 0 (0.0%) | 2 (1.5%) |
| $20,000 to $22,499 | 0 (0.0%) | 7 (5.3%) |
| $22,500 to $24,999 | 11 (4.3%) | 0 (0.0%) |
| $25,000 to $29,999 | 41 (16.1%) | 32 (24.1%) |
| $30,000 to $34,999 | 15 (5.9%) | 20 (15.0%) |
| $35,000 to $39,999 | 19 (7.5%) | 2 (1.5%) |
| $40,000 to $44,999 | 0 (0.0%) | 0 (0.0%) |
| $45,000 to $49,999 | 6 (2.4%) | 7 (5.3%) |
| $50,000 to $54,999 | 54 (21.3%) | 12 (9.0%) |
| $55,000 to $64,999 | 28 (11.0%) | 6 (4.5%) |
| $65,000 to $74,999 | 20 (7.9%) | 0 (0.0%) |
| $75,000 to $99,999 | 28 (11.0%) | 7 (5.3%) |
| $100,000+ | 0 (0.0%) | 0 (0.0%) |
| Total | 254 (100.0%) | 133 (100.0%) |
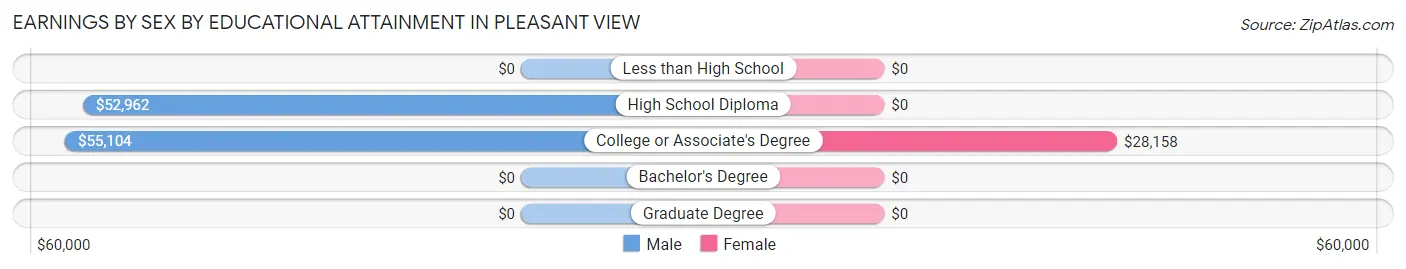
Earnings by Sex by Educational Attainment in Pleasant View
Average earnings in Pleasant View are $52,663 for men and $28,750 for women, a difference of 45.4%. Men with an educational attainment of college or associate's degree enjoy the highest average annual earnings of $55,104, while those with high school diploma education earn the least with $52,962. Women with an educational attainment of college or associate's degree earn the most with the average annual earnings of $28,158, while those with college or associate's degree education have the smallest earnings of $28,158.
| Educational Attainment | Male Income | Female Income |
| Less than High School | - | - |
| High School Diploma | $52,962 | $0 |
| College or Associate's Degree | $55,104 | $28,158 |
| Bachelor's Degree | - | - |
| Graduate Degree | - | - |
| Total | $52,663 | $28,750 |
Family Income in Pleasant View
Family Income Brackets in Pleasant View
According to the Pleasant View family income data, there are 64 families falling into the $75,000 to $99,999 income range, which is the most common income bracket and makes up 33.5% of all families.
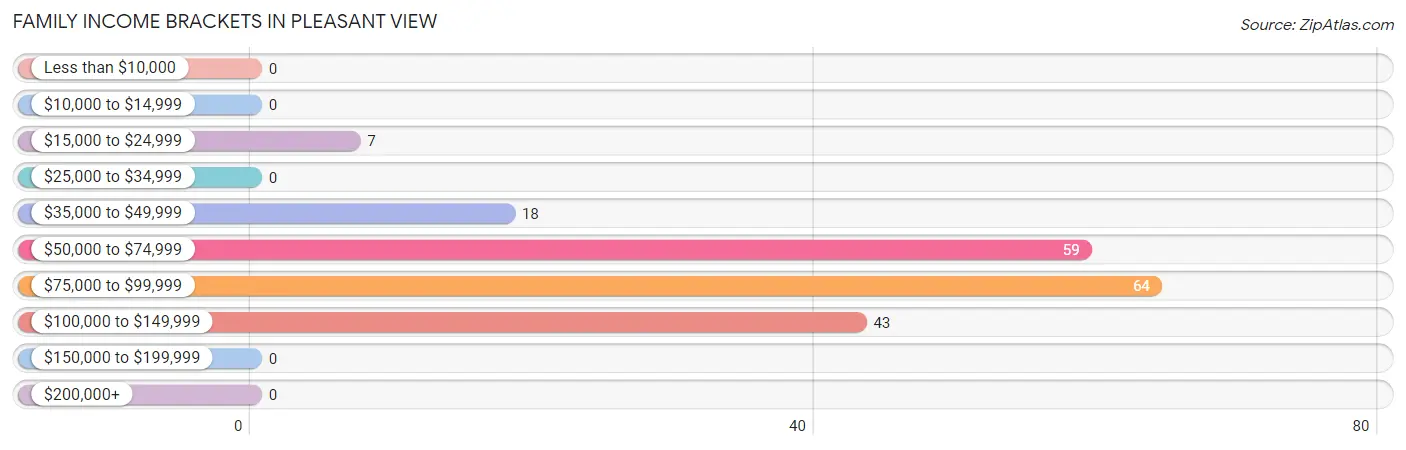
| Income Bracket | # Families | % Families |
| Less than $10,000 | 0 | 0.0% |
| $10,000 to $14,999 | 0 | 0.0% |
| $15,000 to $24,999 | 7 | 3.7% |
| $25,000 to $34,999 | 0 | 0.0% |
| $35,000 to $49,999 | 18 | 9.4% |
| $50,000 to $74,999 | 59 | 30.9% |
| $75,000 to $99,999 | 64 | 33.5% |
| $100,000 to $149,999 | 43 | 22.5% |
| $150,000 to $199,999 | 0 | 0.0% |
| $200,000+ | 0 | 0.0% |
Family Income by Famaliy Size in Pleasant View
4-person families (54 | 28.3%) account for the highest median family income in Pleasant View with $77,963 per family, while 2-person families (87 | 45.6%) have the highest median income of $37,266 per family member.
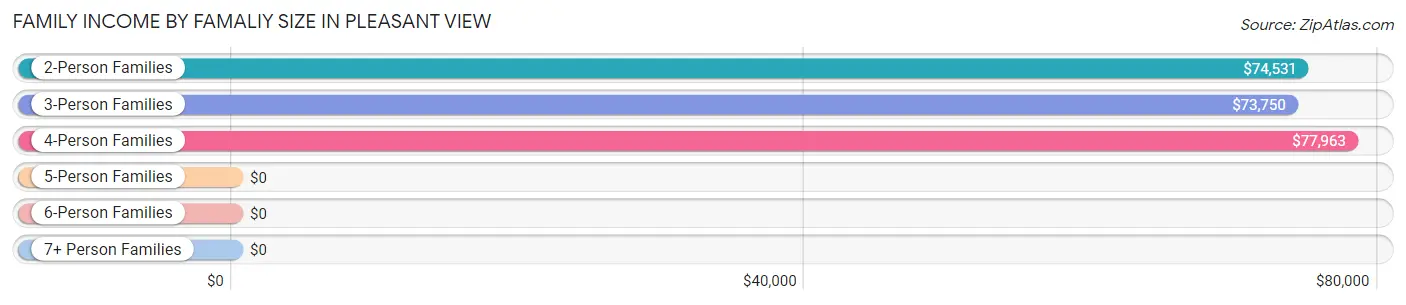
| Income Bracket | # Families | Median Income |
| 2-Person Families | 87 (45.6%) | $74,531 |
| 3-Person Families | 24 (12.6%) | $73,750 |
| 4-Person Families | 54 (28.3%) | $77,963 |
| 5-Person Families | 26 (13.6%) | $0 |
| 6-Person Families | 0 (0.0%) | $0 |
| 7+ Person Families | 0 (0.0%) | $0 |
| Total | 191 (100.0%) | $77,917 |
Family Income by Number of Earners in Pleasant View
The median family income in Pleasant View is $77,917, with families comprising 3+ earners (33) having the highest median family income of $105,329, while families with no earners (35) have the lowest median family income of $47,083, accounting for 17.3% and 18.3% of families, respectively.
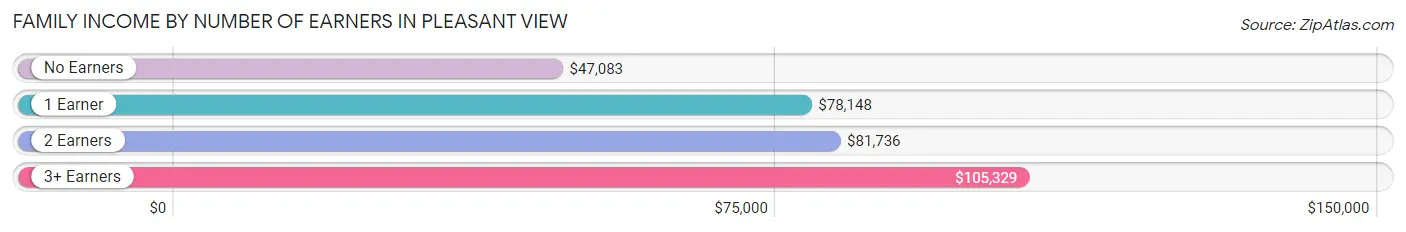
| Number of Earners | # Families | Median Income |
| No Earners | 35 (18.3%) | $47,083 |
| 1 Earner | 58 (30.4%) | $78,148 |
| 2 Earners | 65 (34.0%) | $81,736 |
| 3+ Earners | 33 (17.3%) | $105,329 |
| Total | 191 (100.0%) | $77,917 |
Household Income in Pleasant View
Household Income Brackets in Pleasant View
With 112 households falling in the category, the $50,000 to $74,999 income range is the most frequent in Pleasant View, accounting for 36.2% of all households.
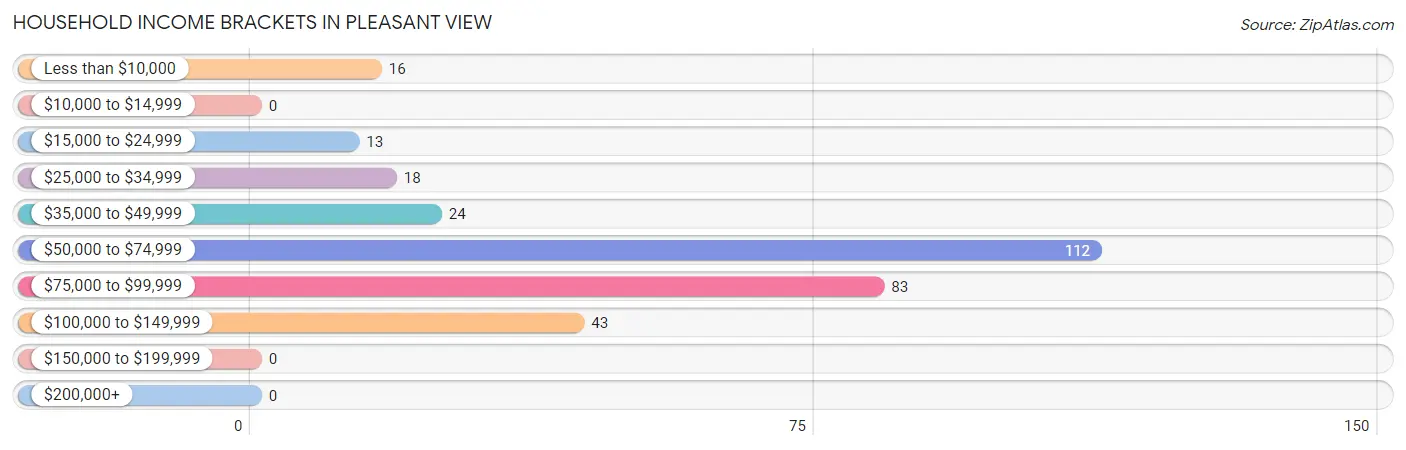
| Income Bracket | # Households | % Households |
| Less than $10,000 | 16 | 5.2% |
| $10,000 to $14,999 | 0 | 0.0% |
| $15,000 to $24,999 | 13 | 4.2% |
| $25,000 to $34,999 | 18 | 5.8% |
| $35,000 to $49,999 | 24 | 7.8% |
| $50,000 to $74,999 | 112 | 36.2% |
| $75,000 to $99,999 | 83 | 26.9% |
| $100,000 to $149,999 | 43 | 13.9% |
| $150,000 to $199,999 | 0 | 0.0% |
| $200,000+ | 0 | 0.0% |
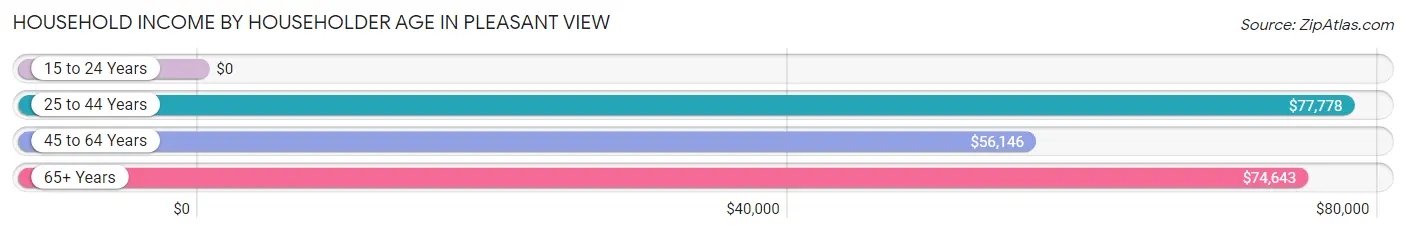
Household Income by Householder Age in Pleasant View
The median household income in Pleasant View is $69,844, with the highest median household income of $77,778 found in the 25 to 44 years age bracket for the primary householder. A total of 96 households (31.1%) fall into this category.
| Income Bracket | # Households | Median Income |
| 15 to 24 Years | 0 (0.0%) | $0 |
| 25 to 44 Years | 96 (31.1%) | $77,778 |
| 45 to 64 Years | 133 (43.0%) | $56,146 |
| 65+ Years | 80 (25.9%) | $74,643 |
| Total | 309 (100.0%) | $69,844 |
Poverty in Pleasant View
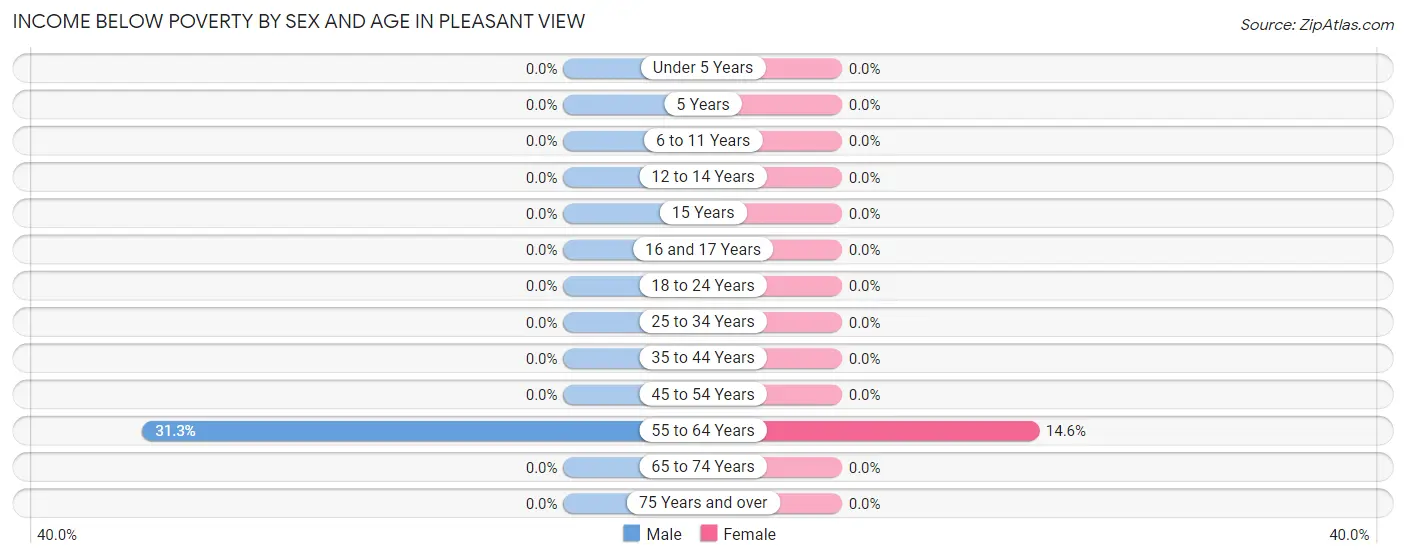
Income Below Poverty by Sex and Age in Pleasant View
With 4.7% poverty level for males and 1.9% for females among the residents of Pleasant View, 55 to 64 year old males and 55 to 64 year old females are the most vulnerable to poverty, with 20 males (31.2%) and 6 females (14.6%) in their respective age groups living below the poverty level.
| Age Bracket | Male | Female |
| Under 5 Years | 0 (0.0%) | 0 (0.0%) |
| 5 Years | 0 (0.0%) | 0 (0.0%) |
| 6 to 11 Years | 0 (0.0%) | 0 (0.0%) |
| 12 to 14 Years | 0 (0.0%) | 0 (0.0%) |
| 15 Years | 0 (0.0%) | 0 (0.0%) |
| 16 and 17 Years | 0 (0.0%) | 0 (0.0%) |
| 18 to 24 Years | 0 (0.0%) | 0 (0.0%) |
| 25 to 34 Years | 0 (0.0%) | 0 (0.0%) |
| 35 to 44 Years | 0 (0.0%) | 0 (0.0%) |
| 45 to 54 Years | 0 (0.0%) | 0 (0.0%) |
| 55 to 64 Years | 20 (31.2%) | 6 (14.6%) |
| 65 to 74 Years | 0 (0.0%) | 0 (0.0%) |
| 75 Years and over | 0 (0.0%) | 0 (0.0%) |
| Total | 20 (4.7%) | 6 (1.9%) |
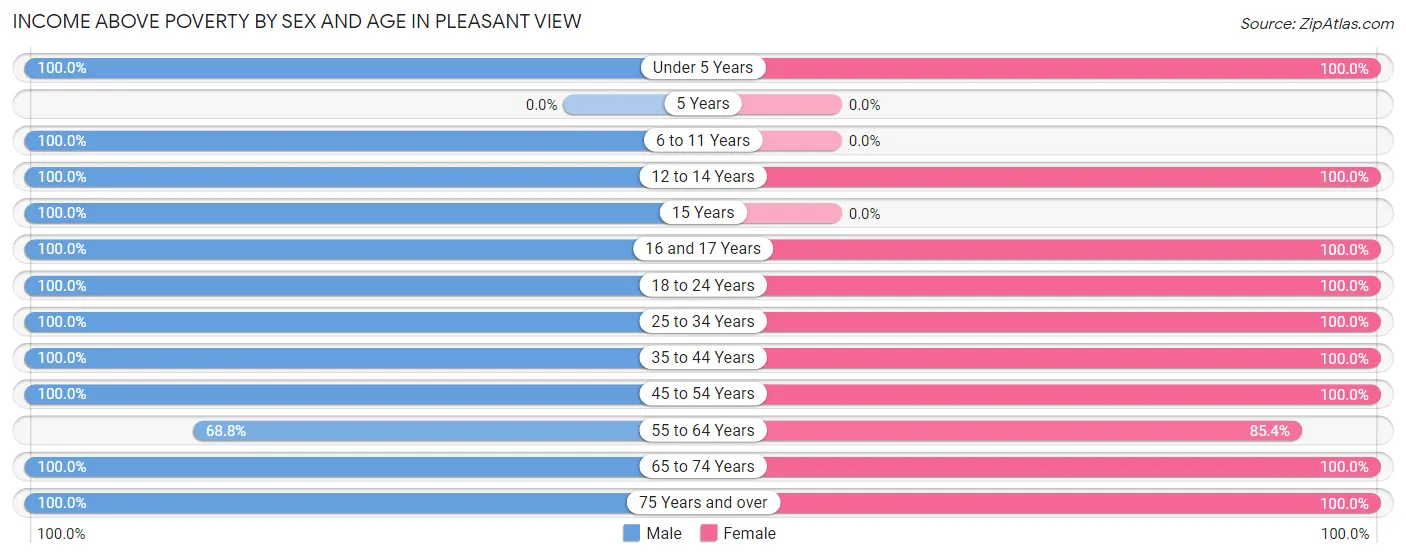
Income Above Poverty by Sex and Age in Pleasant View
According to the poverty statistics in Pleasant View, males aged under 5 years and females aged under 5 years are the age groups that are most secure financially, with 100.0% of males and 100.0% of females in these age groups living above the poverty line.
| Age Bracket | Male | Female |
| Under 5 Years | 13 (100.0%) | 3 (100.0%) |
| 5 Years | 0 (0.0%) | 0 (0.0%) |
| 6 to 11 Years | 21 (100.0%) | 0 (0.0%) |
| 12 to 14 Years | 36 (100.0%) | 40 (100.0%) |
| 15 Years | 9 (100.0%) | 0 (0.0%) |
| 16 and 17 Years | 23 (100.0%) | 36 (100.0%) |
| 18 to 24 Years | 16 (100.0%) | 10 (100.0%) |
| 25 to 34 Years | 76 (100.0%) | 33 (100.0%) |
| 35 to 44 Years | 41 (100.0%) | 44 (100.0%) |
| 45 to 54 Years | 52 (100.0%) | 38 (100.0%) |
| 55 to 64 Years | 44 (68.8%) | 35 (85.4%) |
| 65 to 74 Years | 56 (100.0%) | 41 (100.0%) |
| 75 Years and over | 17 (100.0%) | 23 (100.0%) |
| Total | 404 (95.3%) | 303 (98.1%) |
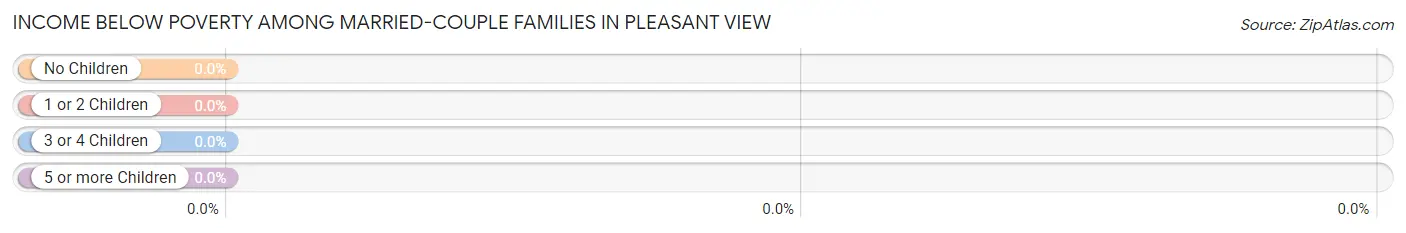
Income Below Poverty Among Married-Couple Families in Pleasant View
| Children | Above Poverty | Below Poverty |
| No Children | 77 (100.0%) | 0 (0.0%) |
| 1 or 2 Children | 97 (100.0%) | 0 (0.0%) |
| 3 or 4 Children | 7 (100.0%) | 0 (0.0%) |
| 5 or more Children | 0 (0.0%) | 0 (0.0%) |
| Total | 181 (100.0%) | 0 (0.0%) |
Income Below Poverty Among Single-Parent Households in Pleasant View
| Children | Single Father | Single Mother |
| No Children | 0 (0.0%) | 0 (0.0%) |
| 1 or 2 Children | 0 (0.0%) | 0 (0.0%) |
| 3 or 4 Children | 0 (0.0%) | 0 (0.0%) |
| 5 or more Children | 0 (0.0%) | 0 (0.0%) |
| Total | 0 (0.0%) | 0 (0.0%) |
Income Below Poverty Among Married-Couple vs Single-Parent Households in Pleasant View
| Children | Married-Couple Families | Single-Parent Households |
| No Children | 0 (0.0%) | 0 (0.0%) |
| 1 or 2 Children | 0 (0.0%) | 0 (0.0%) |
| 3 or 4 Children | 0 (0.0%) | 0 (0.0%) |
| 5 or more Children | 0 (0.0%) | 0 (0.0%) |
| Total | 0 (0.0%) | 0 (0.0%) |
Race in Pleasant View
The most populous races in Pleasant View are White / Caucasian (730 | 99.6%), Hispanic or Latino (25 | 3.4%), and Two or more Races (3 | 0.4%).
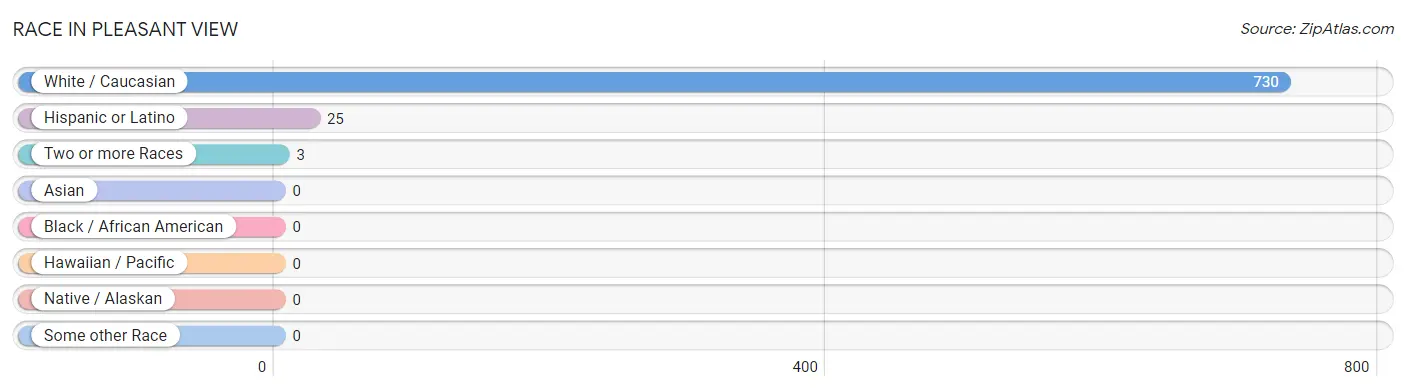
| Race | # Population | % Population |
| Asian | 0 | 0.0% |
| Black / African American | 0 | 0.0% |
| Hawaiian / Pacific | 0 | 0.0% |
| Hispanic or Latino | 25 | 3.4% |
| Native / Alaskan | 0 | 0.0% |
| White / Caucasian | 730 | 99.6% |
| Two or more Races | 3 | 0.4% |
| Some other Race | 0 | 0.0% |
| Total | 733 | 100.0% |
Ancestry in Pleasant View
The most populous ancestries reported in Pleasant View are German (365 | 49.8%), Irish (130 | 17.7%), Italian (121 | 16.5%), English (89 | 12.1%), and Polish (70 | 9.6%), together accounting for 105.7% of all Pleasant View residents.
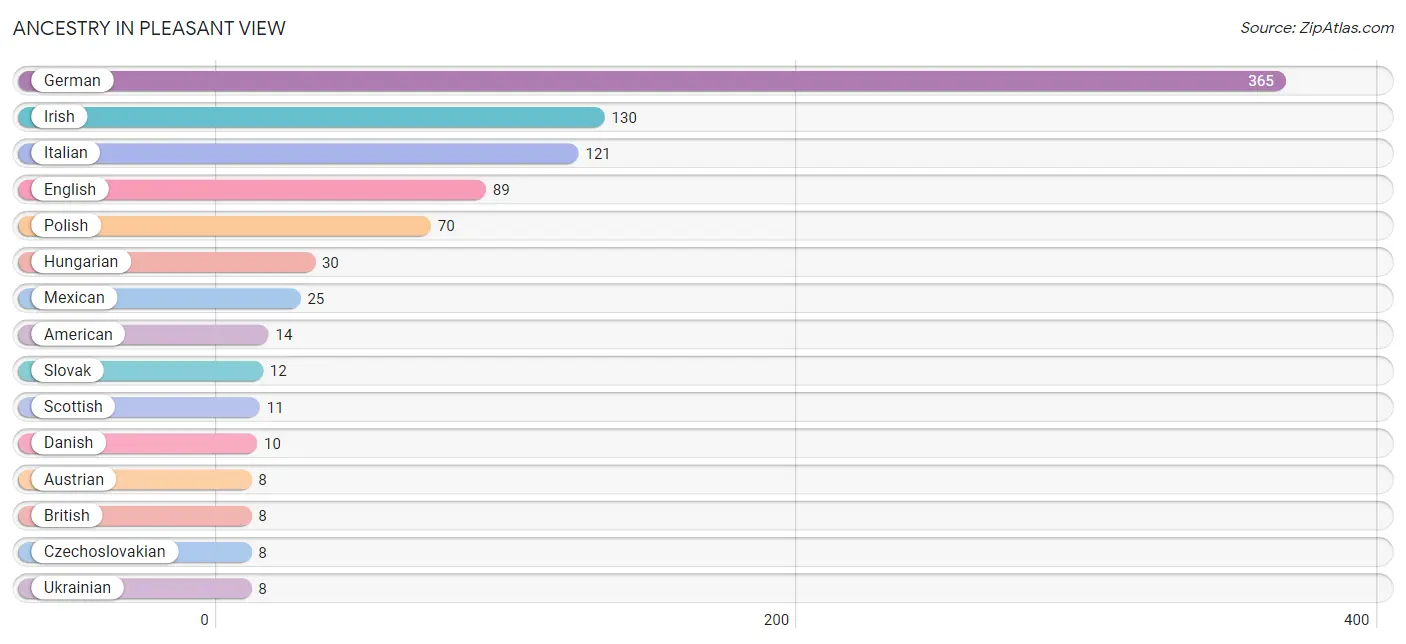
| Ancestry | # Population | % Population |
| American | 14 | 1.9% |
| Austrian | 8 | 1.1% |
| British | 8 | 1.1% |
| Croatian | 4 | 0.5% |
| Czechoslovakian | 8 | 1.1% |
| Danish | 10 | 1.4% |
| English | 89 | 12.1% |
| German | 365 | 49.8% |
| Hungarian | 30 | 4.1% |
| Irish | 130 | 17.7% |
| Italian | 121 | 16.5% |
| Mexican | 25 | 3.4% |
| Pennsylvania German | 4 | 0.5% |
| Polish | 70 | 9.6% |
| Russian | 3 | 0.4% |
| Scottish | 11 | 1.5% |
| Slovak | 12 | 1.6% |
| Ukrainian | 8 | 1.1% |
| Welsh | 8 | 1.1% | View All 19 Rows |
Immigrants in Pleasant View

| Immigration Origin | # Population | % Population | View All 0 Rows |
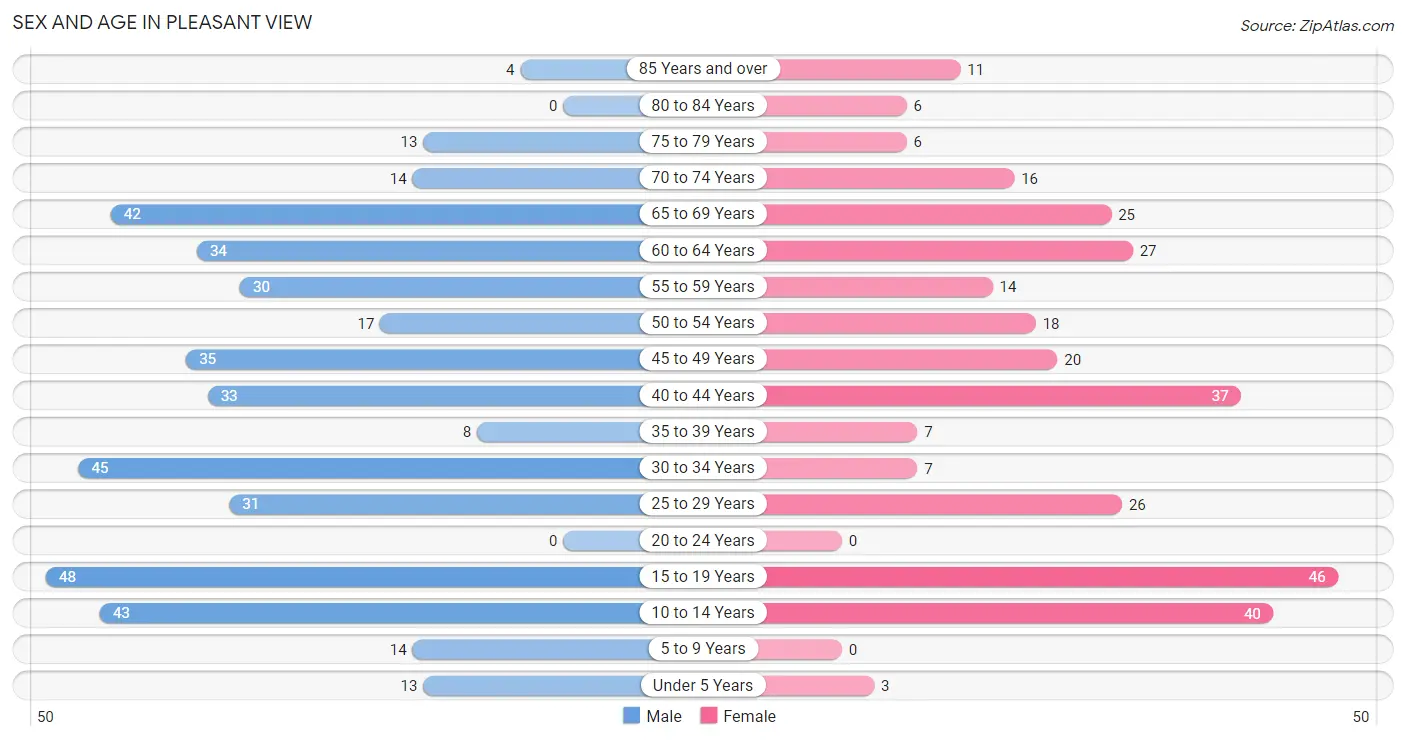
Sex and Age in Pleasant View
Sex and Age in Pleasant View
The most populous age groups in Pleasant View are 15 to 19 Years (48 | 11.3%) for men and 15 to 19 Years (46 | 14.9%) for women.
| Age Bracket | Male | Female |
| Under 5 Years | 13 (3.1%) | 3 (1.0%) |
| 5 to 9 Years | 14 (3.3%) | 0 (0.0%) |
| 10 to 14 Years | 43 (10.1%) | 40 (12.9%) |
| 15 to 19 Years | 48 (11.3%) | 46 (14.9%) |
| 20 to 24 Years | 0 (0.0%) | 0 (0.0%) |
| 25 to 29 Years | 31 (7.3%) | 26 (8.4%) |
| 30 to 34 Years | 45 (10.6%) | 7 (2.3%) |
| 35 to 39 Years | 8 (1.9%) | 7 (2.3%) |
| 40 to 44 Years | 33 (7.8%) | 37 (12.0%) |
| 45 to 49 Years | 35 (8.3%) | 20 (6.5%) |
| 50 to 54 Years | 17 (4.0%) | 18 (5.8%) |
| 55 to 59 Years | 30 (7.1%) | 14 (4.5%) |
| 60 to 64 Years | 34 (8.0%) | 27 (8.7%) |
| 65 to 69 Years | 42 (9.9%) | 25 (8.1%) |
| 70 to 74 Years | 14 (3.3%) | 16 (5.2%) |
| 75 to 79 Years | 13 (3.1%) | 6 (1.9%) |
| 80 to 84 Years | 0 (0.0%) | 6 (1.9%) |
| 85 Years and over | 4 (0.9%) | 11 (3.6%) |
| Total | 424 (100.0%) | 309 (100.0%) |
Families and Households in Pleasant View
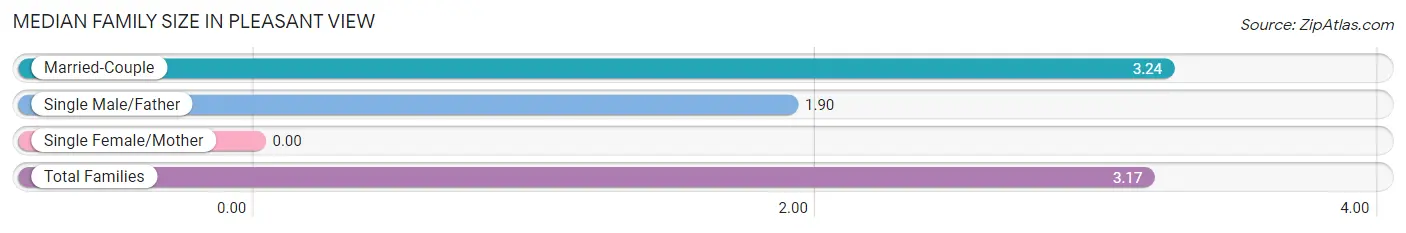
Median Family Size in Pleasant View
| Family Type | # Families | Family Size |
| Married-Couple | 181 (94.8%) | 3.24 |
| Single Male/Father | 10 (5.2%) | 1.90 |
| Single Female/Mother | 0 (0.0%) | - |
| Total Families | 191 (100.0%) | 3.17 |
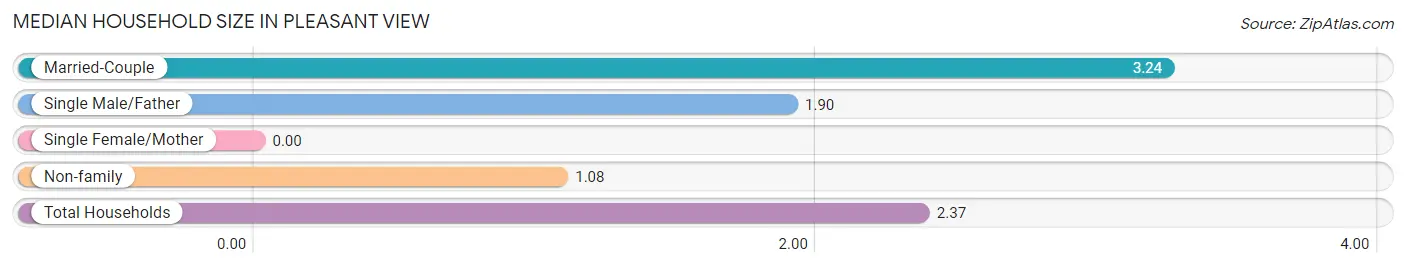
Median Household Size in Pleasant View
| Household Type | # Households | Household Size |
| Married-Couple | 181 (58.6%) | 3.24 |
| Single Male/Father | 10 (3.2%) | 1.90 |
| Single Female/Mother | 0 (0.0%) | - |
| Non-family | 118 (38.2%) | 1.08 |
| Total Households | 309 (100.0%) | 2.37 |
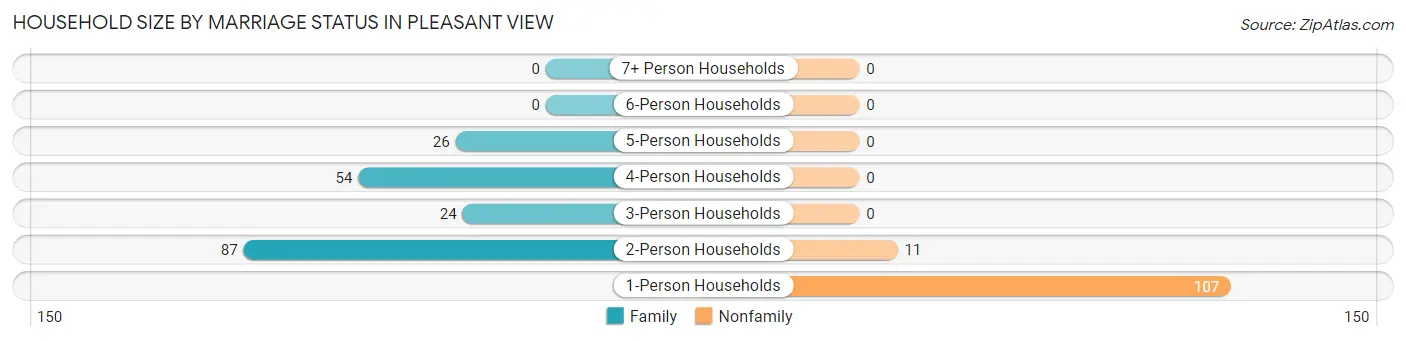
Household Size by Marriage Status in Pleasant View
Out of a total of 309 households in Pleasant View, 191 (61.8%) are family households, while 118 (38.2%) are nonfamily households. The most numerous type of family households are 2-person households, comprising 87, and the most common type of nonfamily households are 1-person households, comprising 107.
| Household Size | Family Households | Nonfamily Households |
| 1-Person Households | - | 107 (34.6%) |
| 2-Person Households | 87 (28.2%) | 11 (3.6%) |
| 3-Person Households | 24 (7.8%) | 0 (0.0%) |
| 4-Person Households | 54 (17.5%) | 0 (0.0%) |
| 5-Person Households | 26 (8.4%) | 0 (0.0%) |
| 6-Person Households | 0 (0.0%) | 0 (0.0%) |
| 7+ Person Households | 0 (0.0%) | 0 (0.0%) |
| Total | 191 (61.8%) | 118 (38.2%) |
Female Fertility in Pleasant View
Fertility by Age in Pleasant View
| Age Bracket | Women with Births | Births / 1,000 Women |
| 15 to 19 years | 0 (0.0%) | 0.0 |
| 20 to 34 years | 0 (0.0%) | 0.0 |
| 35 to 50 years | 0 (0.0%) | 0.0 |
| Total | 0 (0.0%) | 0.0 |
Fertility by Age by Marriage Status in Pleasant View
| Age Bracket | Married | Unmarried |
| 15 to 19 years | 0 (0.0%) | 0 (0.0%) |
| 20 to 34 years | 0 (0.0%) | 0 (0.0%) |
| 35 to 50 years | 0 (0.0%) | 0 (0.0%) |
| Total | 0 (0.0%) | 0 (0.0%) |
Fertility by Education in Pleasant View
| Educational Attainment | Women with Births | Births / 1,000 Women |
| Less than High School | 0 (0.0%) | 0.0 |
| High School Diploma | 0 (0.0%) | 0.0 |
| College or Associate's Degree | 0 (0.0%) | 0.0 |
| Bachelor's Degree | 0 (0.0%) | 0.0 |
| Graduate Degree | 0 (0.0%) | 0.0 |
| Total | 0 (0.0%) | 0.0 |
Fertility by Education by Marriage Status in Pleasant View
| Educational Attainment | Married | Unmarried |
| Less than High School | 0 (0.0%) | 0 (0.0%) |
| High School Diploma | 0 (0.0%) | 0 (0.0%) |
| College or Associate's Degree | 0 (0.0%) | 0 (0.0%) |
| Bachelor's Degree | 0 (0.0%) | 0 (0.0%) |
| Graduate Degree | 0 (0.0%) | 0 (0.0%) |
| Total | 0 (0.0%) | 0 (0.0%) |
Employment Characteristics in Pleasant View
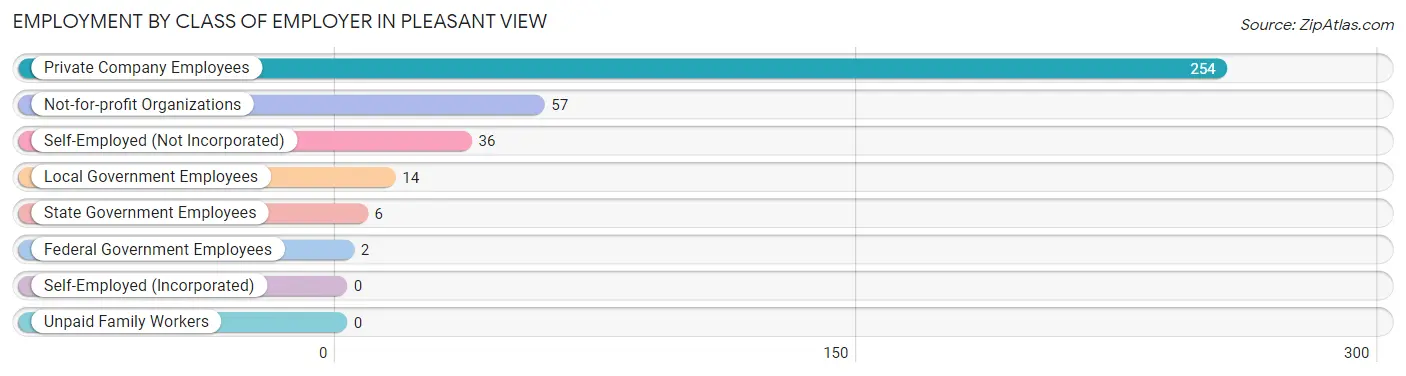
Employment by Class of Employer in Pleasant View
Among the 369 employed individuals in Pleasant View, private company employees (254 | 68.8%), not-for-profit organizations (57 | 15.4%), and self-employed (not incorporated) (36 | 9.8%) make up the most common classes of employment.
| Employer Class | # Employees | % Employees |
| Private Company Employees | 254 | 68.8% |
| Self-Employed (Incorporated) | 0 | 0.0% |
| Self-Employed (Not Incorporated) | 36 | 9.8% |
| Not-for-profit Organizations | 57 | 15.4% |
| Local Government Employees | 14 | 3.8% |
| State Government Employees | 6 | 1.6% |
| Federal Government Employees | 2 | 0.5% |
| Unpaid Family Workers | 0 | 0.0% |
| Total | 369 | 100.0% |
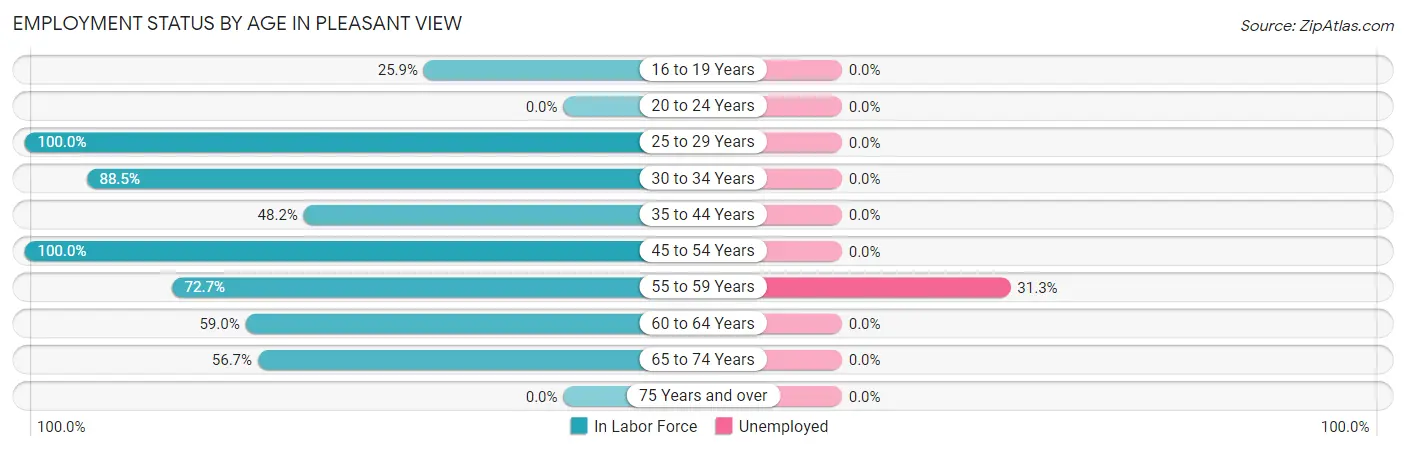
Employment Status by Age in Pleasant View
According to the labor force statistics for Pleasant View, out of the total population over 16 years of age (611), 62.0% or 379 individuals are in the labor force, with 2.6% or 10 of them unemployed. The age group with the highest labor force participation rate is 25 to 29 years, with 100.0% or 57 individuals in the labor force. Within the labor force, the 55 to 59 years age range has the highest percentage of unemployed individuals, with 31.3% or 10 of them being unemployed.
| Age Bracket | In Labor Force | Unemployed |
| 16 to 19 Years | 22 (25.9%) | 0 (0.0%) |
| 20 to 24 Years | 0 (0.0%) | 0 (0.0%) |
| 25 to 29 Years | 57 (100.0%) | 0 (0.0%) |
| 30 to 34 Years | 46 (88.5%) | 0 (0.0%) |
| 35 to 44 Years | 41 (48.2%) | 0 (0.0%) |
| 45 to 54 Years | 90 (100.0%) | 0 (0.0%) |
| 55 to 59 Years | 32 (72.7%) | 10 (31.3%) |
| 60 to 64 Years | 36 (59.0%) | 0 (0.0%) |
| 65 to 74 Years | 55 (56.7%) | 0 (0.0%) |
| 75 Years and over | 0 (0.0%) | 0 (0.0%) |
| Total | 379 (62.0%) | 10 (2.6%) |
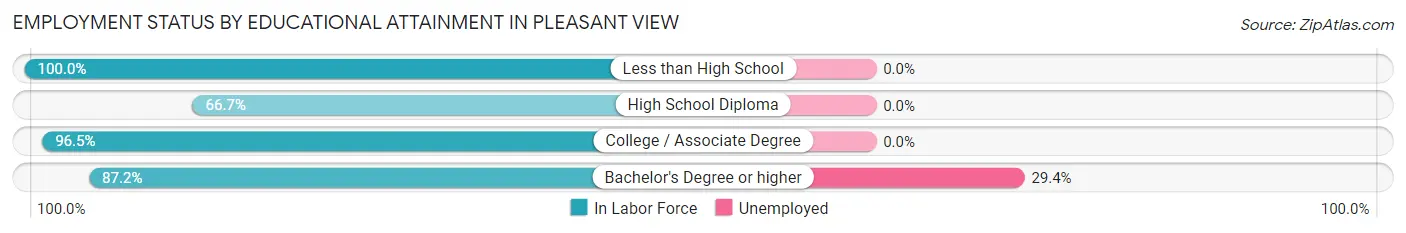
Employment Status by Educational Attainment in Pleasant View
According to labor force statistics for Pleasant View, 77.6% of individuals (302) out of the total population between 25 and 64 years of age (389) are in the labor force, with 3.3% or 10 of them being unemployed. The group with the highest labor force participation rate are those with the educational attainment of less than high school, with 100.0% or 2 individuals in the labor force. Within the labor force, individuals with bachelor's degree or higher education have the highest percentage of unemployment, with 29.4% or 10 of them being unemployed.
| Educational Attainment | In Labor Force | Unemployed |
| Less than High School | 2 (100.0%) | 0 (0.0%) |
| High School Diploma | 156 (66.7%) | 0 (0.0%) |
| College / Associate Degree | 110 (96.5%) | 0 (0.0%) |
| Bachelor's Degree or higher | 34 (87.2%) | 11 (29.4%) |
| Total | 302 (77.6%) | 13 (3.3%) |
Employment Occupations by Sex in Pleasant View
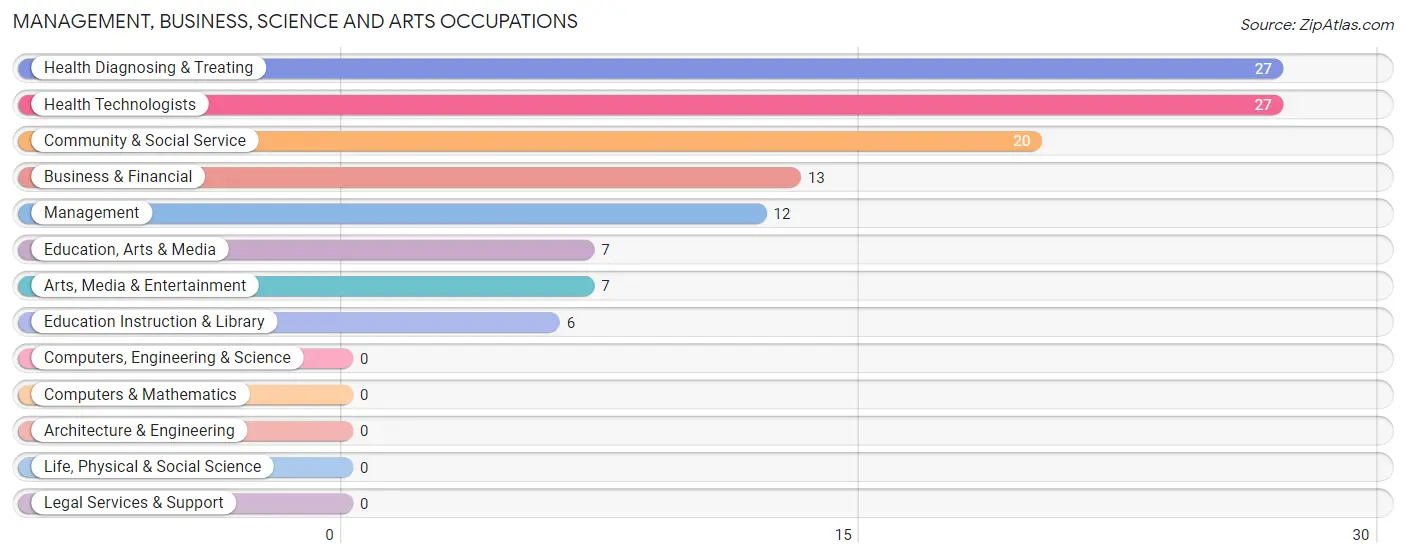
Management, Business, Science and Arts Occupations
The most common Management, Business, Science and Arts occupations in Pleasant View are Health Diagnosing & Treating (27 | 7.3%), Health Technologists (27 | 7.3%), Community & Social Service (20 | 5.4%), Business & Financial (13 | 3.5%), and Management (12 | 3.3%).
Management, Business, Science and Arts Occupations by Sex
Within the Management, Business, Science and Arts occupations in Pleasant View, the most male-oriented occupations are Management (100.0%), Education, Arts & Media (100.0%), and Education Instruction & Library (100.0%), while the most female-oriented occupations are Arts, Media & Entertainment (100.0%), Health Diagnosing & Treating (100.0%), and Health Technologists (100.0%).
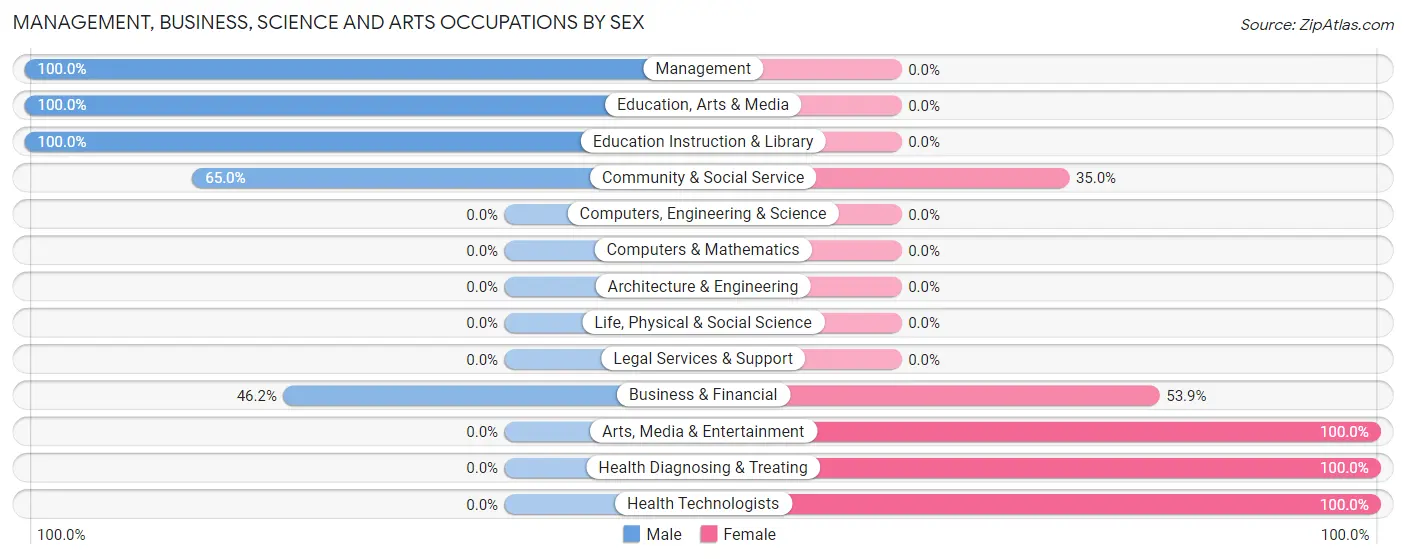
| Occupation | Male | Female |
| Management | 12 (100.0%) | 0 (0.0%) |
| Business & Financial | 6 (46.2%) | 7 (53.8%) |
| Computers, Engineering & Science | 0 (0.0%) | 0 (0.0%) |
| Computers & Mathematics | 0 (0.0%) | 0 (0.0%) |
| Architecture & Engineering | 0 (0.0%) | 0 (0.0%) |
| Life, Physical & Social Science | 0 (0.0%) | 0 (0.0%) |
| Community & Social Service | 13 (65.0%) | 7 (35.0%) |
| Education, Arts & Media | 7 (100.0%) | 0 (0.0%) |
| Legal Services & Support | 0 (0.0%) | 0 (0.0%) |
| Education Instruction & Library | 6 (100.0%) | 0 (0.0%) |
| Arts, Media & Entertainment | 0 (0.0%) | 7 (100.0%) |
| Health Diagnosing & Treating | 0 (0.0%) | 27 (100.0%) |
| Health Technologists | 0 (0.0%) | 27 (100.0%) |
| Total (Category) | 31 (43.1%) | 41 (56.9%) |
| Total (Overall) | 236 (64.0%) | 133 (36.0%) |
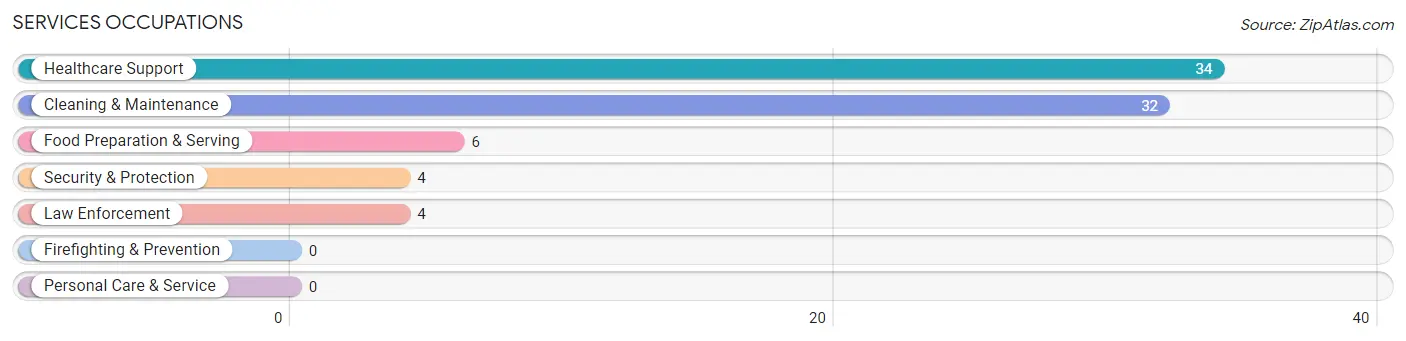
Services Occupations
The most common Services occupations in Pleasant View are Healthcare Support (34 | 9.2%), Cleaning & Maintenance (32 | 8.7%), Food Preparation & Serving (6 | 1.6%), Security & Protection (4 | 1.1%), and Law Enforcement (4 | 1.1%).
Services Occupations by Sex
Within the Services occupations in Pleasant View, the most male-oriented occupations are Security & Protection (100.0%), Law Enforcement (100.0%), and Healthcare Support (79.4%), while the most female-oriented occupations are Food Preparation & Serving (100.0%), Cleaning & Maintenance (25.0%), and Healthcare Support (20.6%).
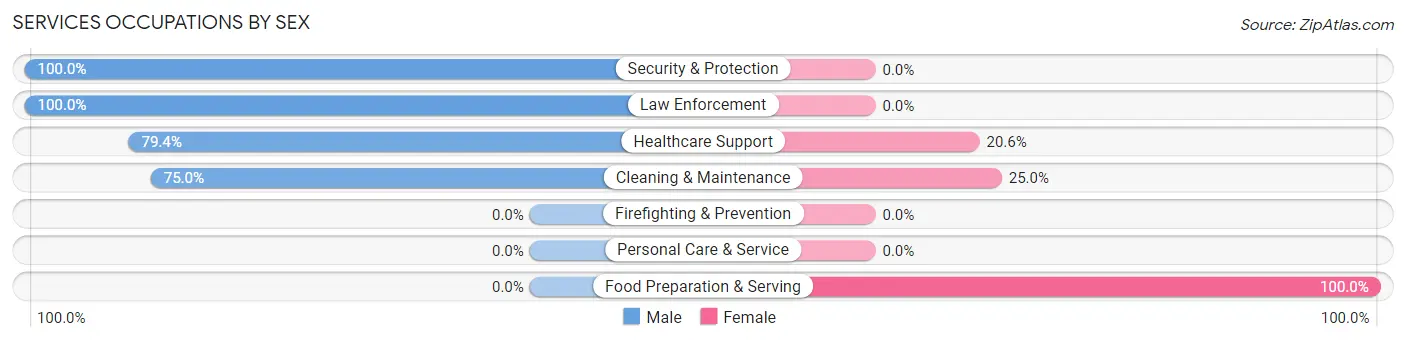
| Occupation | Male | Female |
| Healthcare Support | 27 (79.4%) | 7 (20.6%) |
| Security & Protection | 4 (100.0%) | 0 (0.0%) |
| Firefighting & Prevention | 0 (0.0%) | 0 (0.0%) |
| Law Enforcement | 4 (100.0%) | 0 (0.0%) |
| Food Preparation & Serving | 0 (0.0%) | 6 (100.0%) |
| Cleaning & Maintenance | 24 (75.0%) | 8 (25.0%) |
| Personal Care & Service | 0 (0.0%) | 0 (0.0%) |
| Total (Category) | 55 (72.4%) | 21 (27.6%) |
| Total (Overall) | 236 (64.0%) | 133 (36.0%) |
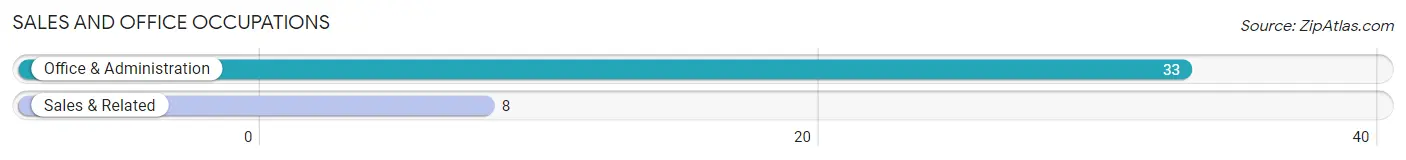
Sales and Office Occupations
The most common Sales and Office occupations in Pleasant View are Office & Administration (33 | 8.9%), and Sales & Related (8 | 2.2%).
Sales and Office Occupations by Sex

| Occupation | Male | Female |
| Sales & Related | 8 (100.0%) | 0 (0.0%) |
| Office & Administration | 0 (0.0%) | 33 (100.0%) |
| Total (Category) | 8 (19.5%) | 33 (80.5%) |
| Total (Overall) | 236 (64.0%) | 133 (36.0%) |
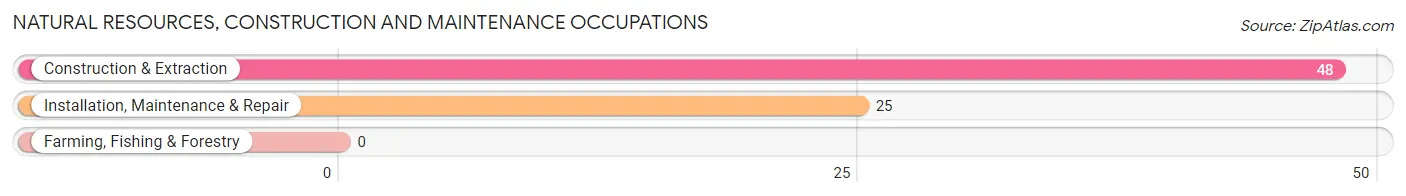
Natural Resources, Construction and Maintenance Occupations
The most common Natural Resources, Construction and Maintenance occupations in Pleasant View are Construction & Extraction (48 | 13.0%), and Installation, Maintenance & Repair (25 | 6.8%).
Natural Resources, Construction and Maintenance Occupations by Sex
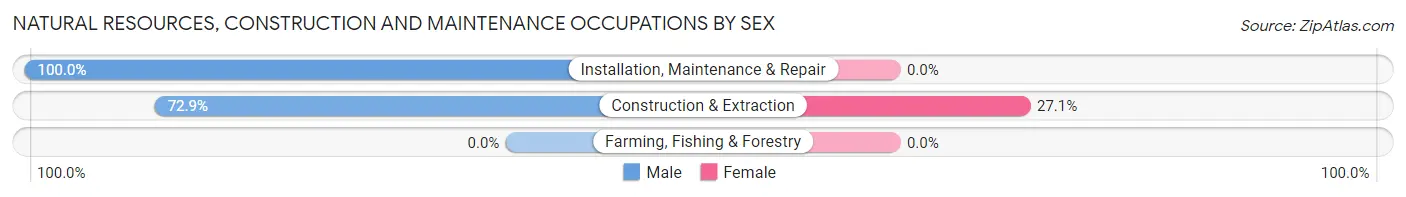
| Occupation | Male | Female |
| Farming, Fishing & Forestry | 0 (0.0%) | 0 (0.0%) |
| Construction & Extraction | 35 (72.9%) | 13 (27.1%) |
| Installation, Maintenance & Repair | 25 (100.0%) | 0 (0.0%) |
| Total (Category) | 60 (82.2%) | 13 (17.8%) |
| Total (Overall) | 236 (64.0%) | 133 (36.0%) |
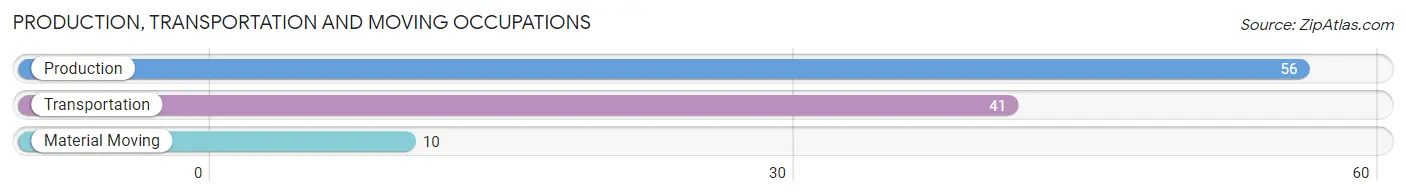
Production, Transportation and Moving Occupations
The most common Production, Transportation and Moving occupations in Pleasant View are Production (56 | 15.2%), Transportation (41 | 11.1%), and Material Moving (10 | 2.7%).
Production, Transportation and Moving Occupations by Sex
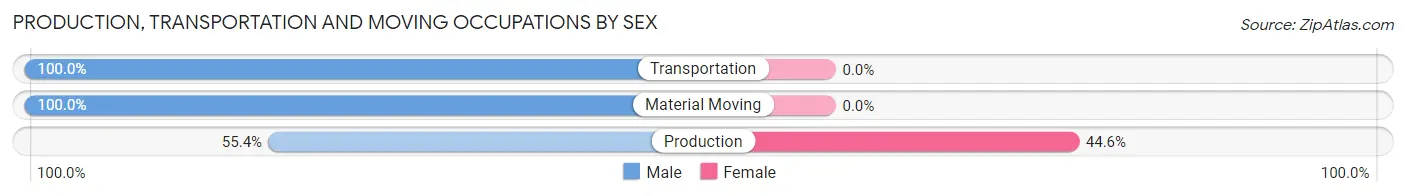
| Occupation | Male | Female |
| Production | 31 (55.4%) | 25 (44.6%) |
| Transportation | 41 (100.0%) | 0 (0.0%) |
| Material Moving | 10 (100.0%) | 0 (0.0%) |
| Total (Category) | 82 (76.6%) | 25 (23.4%) |
| Total (Overall) | 236 (64.0%) | 133 (36.0%) |
Employment Industries by Sex in Pleasant View
Employment Industries in Pleasant View
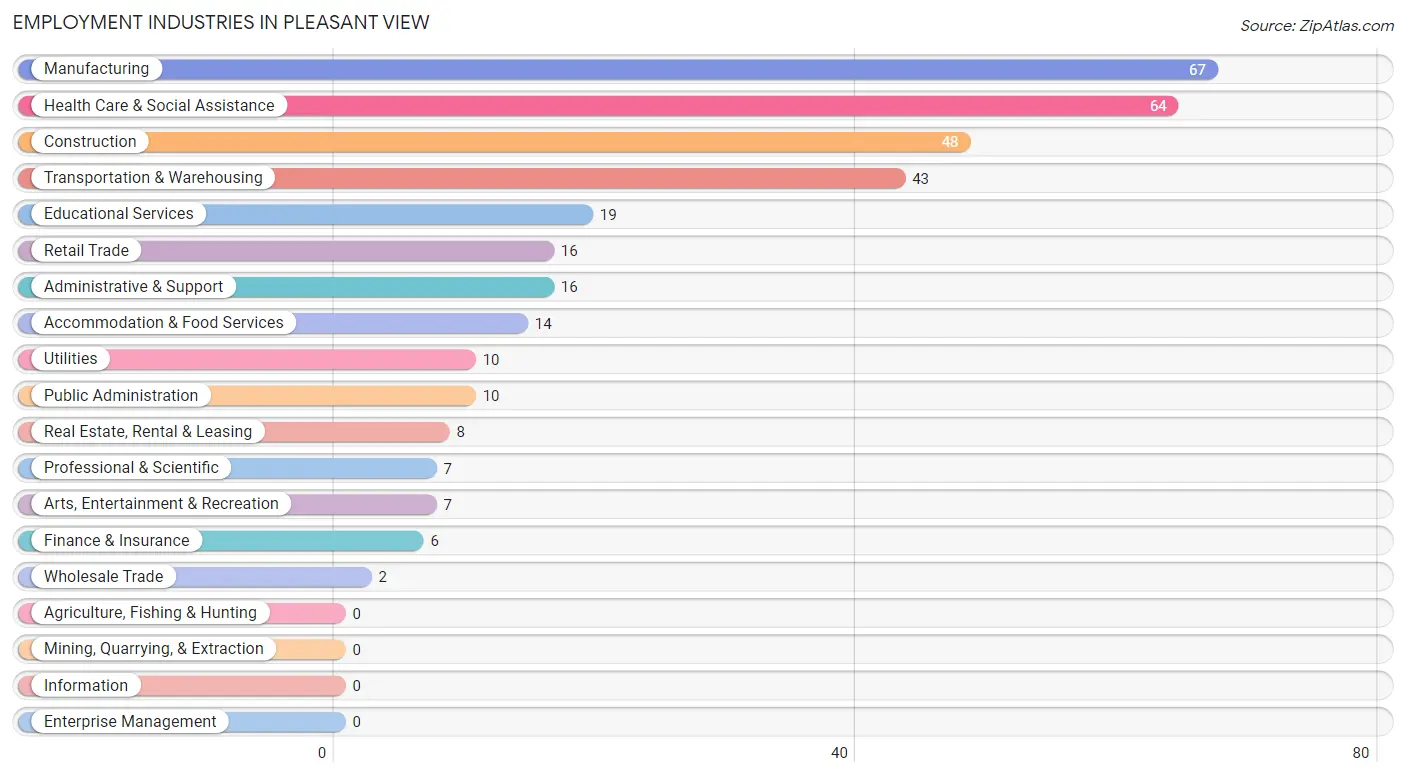
The major employment industries in Pleasant View include Manufacturing (67 | 18.2%), Health Care & Social Assistance (64 | 17.3%), Construction (48 | 13.0%), Transportation & Warehousing (43 | 11.7%), and Educational Services (19 | 5.1%).
Employment Industries by Sex in Pleasant View
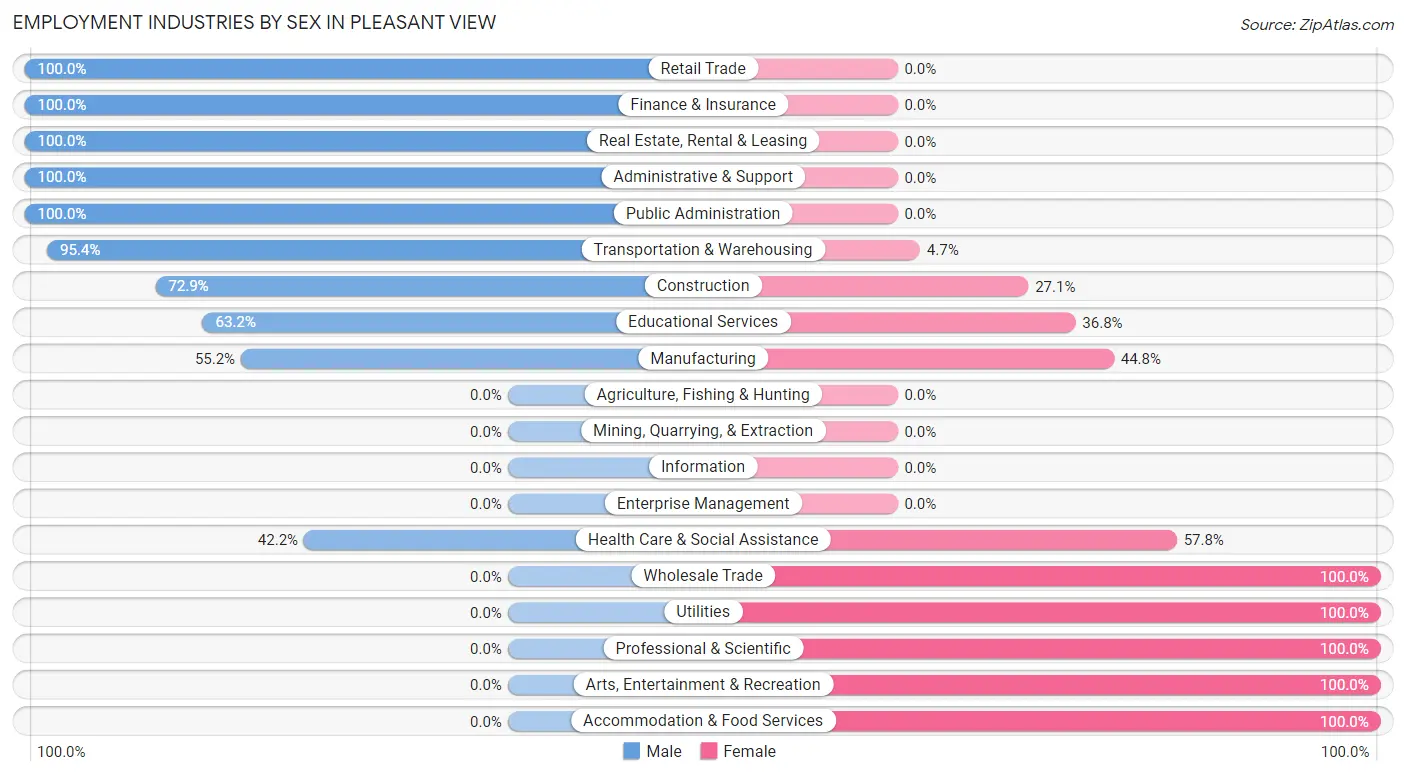
The Pleasant View industries that see more men than women are Retail Trade (100.0%), Finance & Insurance (100.0%), and Real Estate, Rental & Leasing (100.0%), whereas the industries that tend to have a higher number of women are Wholesale Trade (100.0%), Utilities (100.0%), and Professional & Scientific (100.0%).
| Industry | Male | Female |
| Agriculture, Fishing & Hunting | 0 (0.0%) | 0 (0.0%) |
| Mining, Quarrying, & Extraction | 0 (0.0%) | 0 (0.0%) |
| Construction | 35 (72.9%) | 13 (27.1%) |
| Manufacturing | 37 (55.2%) | 30 (44.8%) |
| Wholesale Trade | 0 (0.0%) | 2 (100.0%) |
| Retail Trade | 16 (100.0%) | 0 (0.0%) |
| Transportation & Warehousing | 41 (95.4%) | 2 (4.6%) |
| Utilities | 0 (0.0%) | 10 (100.0%) |
| Information | 0 (0.0%) | 0 (0.0%) |
| Finance & Insurance | 6 (100.0%) | 0 (0.0%) |
| Real Estate, Rental & Leasing | 8 (100.0%) | 0 (0.0%) |
| Professional & Scientific | 0 (0.0%) | 7 (100.0%) |
| Enterprise Management | 0 (0.0%) | 0 (0.0%) |
| Administrative & Support | 16 (100.0%) | 0 (0.0%) |
| Educational Services | 12 (63.2%) | 7 (36.8%) |
| Health Care & Social Assistance | 27 (42.2%) | 37 (57.8%) |
| Arts, Entertainment & Recreation | 0 (0.0%) | 7 (100.0%) |
| Accommodation & Food Services | 0 (0.0%) | 14 (100.0%) |
| Public Administration | 10 (100.0%) | 0 (0.0%) |
| Total | 236 (64.0%) | 133 (36.0%) |
Education in Pleasant View
School Enrollment in Pleasant View
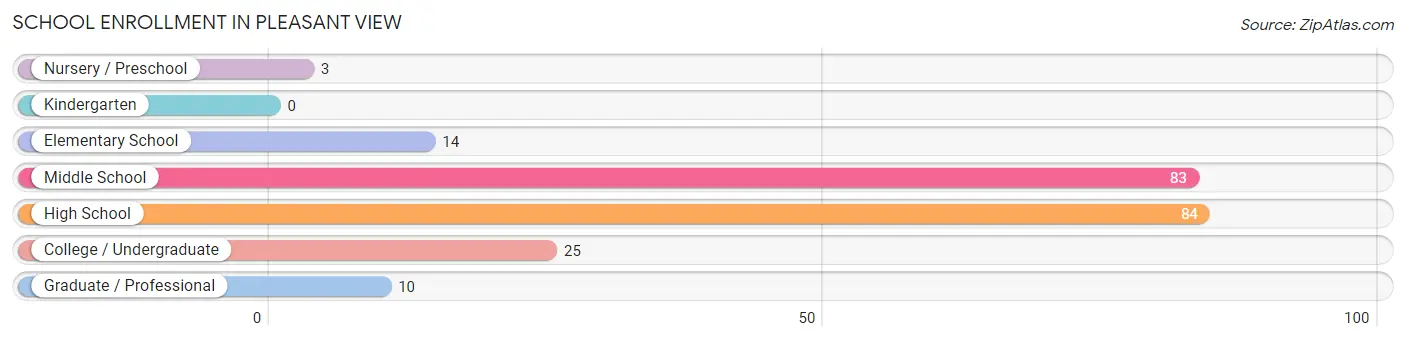
The most common levels of schooling among the 219 students in Pleasant View are high school (84 | 38.4%), middle school (83 | 37.9%), and college / undergraduate (25 | 11.4%).
| School Level | # Students | % Students |
| Nursery / Preschool | 3 | 1.4% |
| Kindergarten | 0 | 0.0% |
| Elementary School | 14 | 6.4% |
| Middle School | 83 | 37.9% |
| High School | 84 | 38.4% |
| College / Undergraduate | 25 | 11.4% |
| Graduate / Professional | 10 | 4.6% |
| Total | 219 | 100.0% |
School Enrollment by Age by Funding Source in Pleasant View
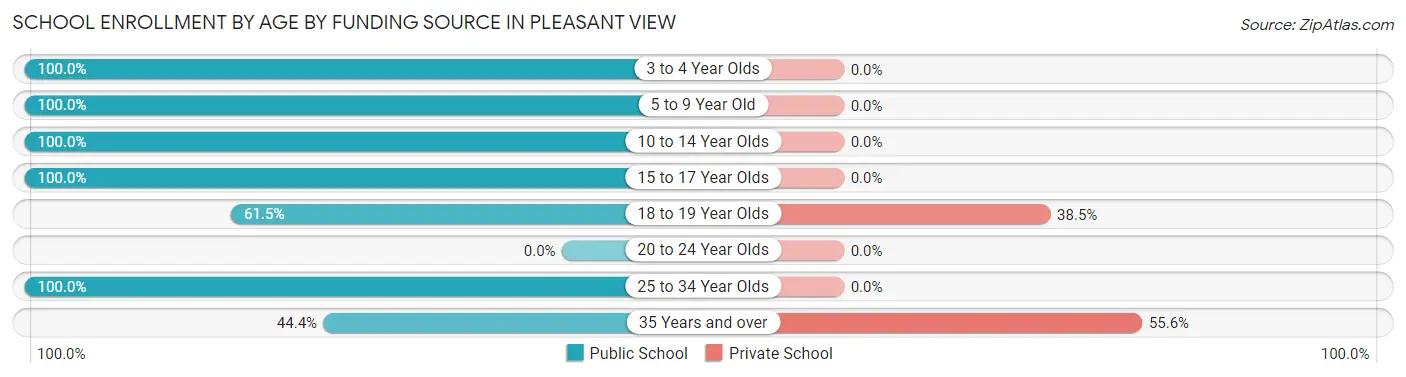
Out of a total of 219 students who are enrolled in schools in Pleasant View, 20 (9.1%) attend a private institution, while the remaining 199 (90.9%) are enrolled in public schools. The age group of 35 years and over has the highest likelihood of being enrolled in private schools, with 10 (55.6% in the age bracket) enrolled. Conversely, the age group of 3 to 4 year olds has the lowest likelihood of being enrolled in a private school, with 3 (100.0% in the age bracket) attending a public institution.
| Age Bracket | Public School | Private School |
| 3 to 4 Year Olds | 3 (100.0%) | 0 (0.0%) |
| 5 to 9 Year Old | 14 (100.0%) | 0 (0.0%) |
| 10 to 14 Year Olds | 83 (100.0%) | 0 (0.0%) |
| 15 to 17 Year Olds | 68 (100.0%) | 0 (0.0%) |
| 18 to 19 Year Olds | 16 (61.5%) | 10 (38.5%) |
| 20 to 24 Year Olds | 0 (0.0%) | 0 (0.0%) |
| 25 to 34 Year Olds | 7 (100.0%) | 0 (0.0%) |
| 35 Years and over | 8 (44.4%) | 10 (55.6%) |
| Total | 199 (90.9%) | 20 (9.1%) |
Educational Attainment by Field of Study in Pleasant View
Education (11 | 22.0%), computers & mathematics (10 | 20.0%), bio, nature & agricultural (8 | 16.0%), business (7 | 14.0%), and literature & languages (7 | 14.0%) are the most common fields of study among 50 individuals in Pleasant View who have obtained a bachelor's degree or higher.
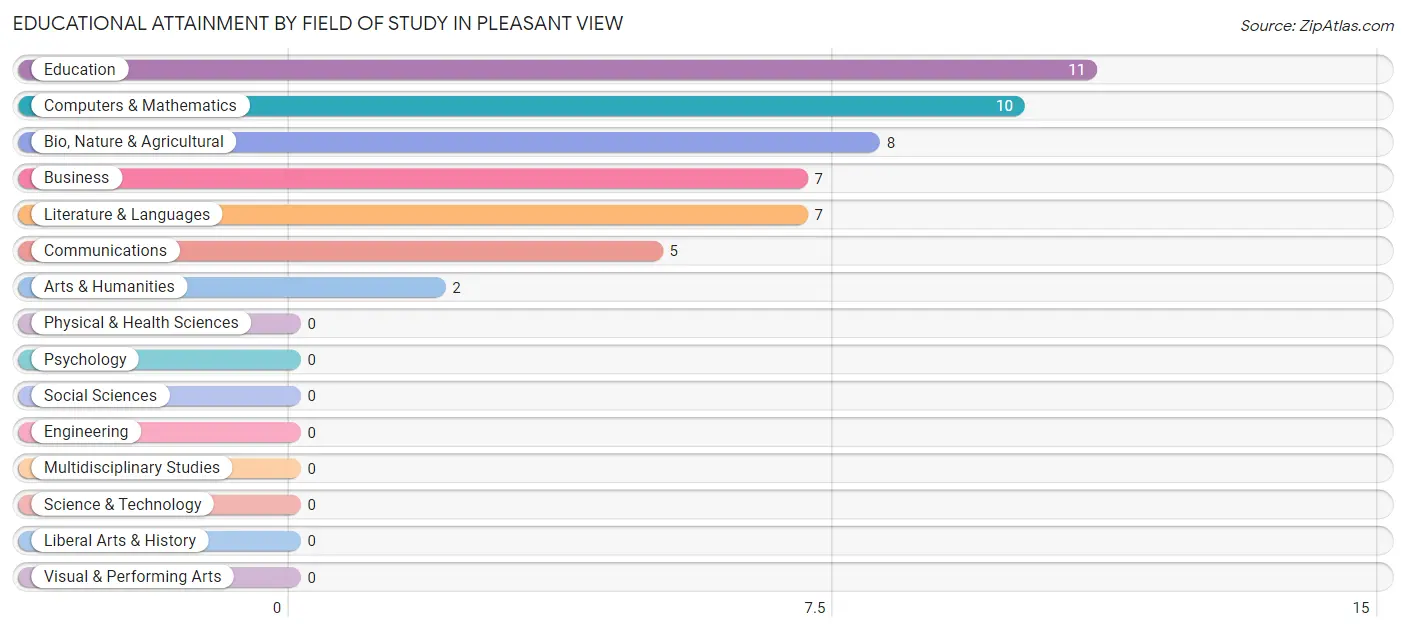
| Field of Study | # Graduates | % Graduates |
| Computers & Mathematics | 10 | 20.0% |
| Bio, Nature & Agricultural | 8 | 16.0% |
| Physical & Health Sciences | 0 | 0.0% |
| Psychology | 0 | 0.0% |
| Social Sciences | 0 | 0.0% |
| Engineering | 0 | 0.0% |
| Multidisciplinary Studies | 0 | 0.0% |
| Science & Technology | 0 | 0.0% |
| Business | 7 | 14.0% |
| Education | 11 | 22.0% |
| Literature & Languages | 7 | 14.0% |
| Liberal Arts & History | 0 | 0.0% |
| Visual & Performing Arts | 0 | 0.0% |
| Communications | 5 | 10.0% |
| Arts & Humanities | 2 | 4.0% |
| Total | 50 | 100.0% |
Transportation & Commute in Pleasant View
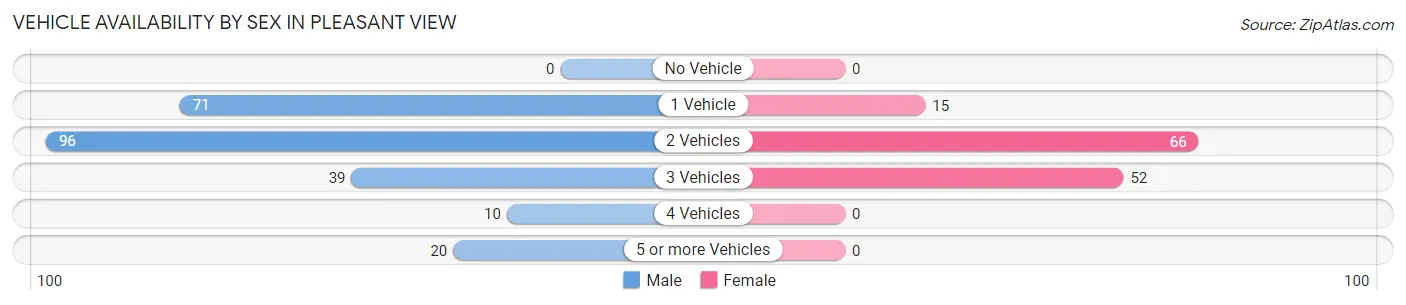
Vehicle Availability by Sex in Pleasant View
The most prevalent vehicle ownership categories in Pleasant View are males with 2 vehicles (96, accounting for 40.7%) and females with 2 vehicles (66, making up 72.2%).
| Vehicles Available | Male | Female |
| No Vehicle | 0 (0.0%) | 0 (0.0%) |
| 1 Vehicle | 71 (30.1%) | 15 (11.3%) |
| 2 Vehicles | 96 (40.7%) | 66 (49.6%) |
| 3 Vehicles | 39 (16.5%) | 52 (39.1%) |
| 4 Vehicles | 10 (4.2%) | 0 (0.0%) |
| 5 or more Vehicles | 20 (8.5%) | 0 (0.0%) |
| Total | 236 (100.0%) | 133 (100.0%) |
Commute Time in Pleasant View
The most frequently occuring commute durations in Pleasant View are 15 to 19 minutes (91 commuters, 25.3%), 10 to 14 minutes (54 commuters, 15.0%), and 60 to 89 minutes (40 commuters, 11.1%).
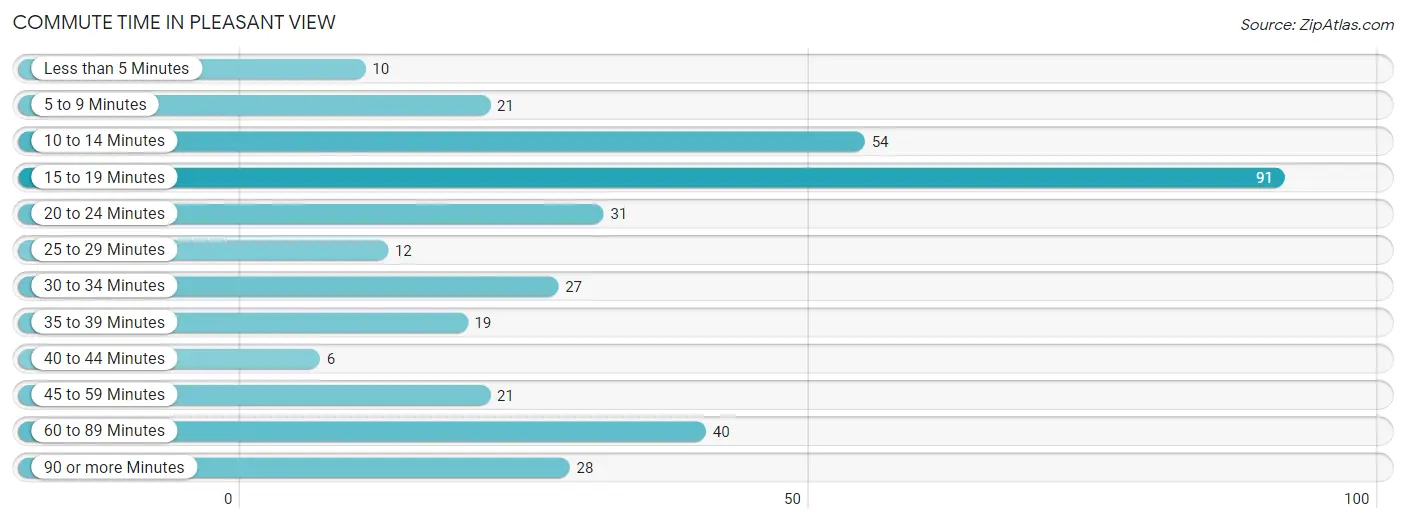
| Commute Time | # Commuters | % Commuters |
| Less than 5 Minutes | 10 | 2.8% |
| 5 to 9 Minutes | 21 | 5.8% |
| 10 to 14 Minutes | 54 | 15.0% |
| 15 to 19 Minutes | 91 | 25.3% |
| 20 to 24 Minutes | 31 | 8.6% |
| 25 to 29 Minutes | 12 | 3.3% |
| 30 to 34 Minutes | 27 | 7.5% |
| 35 to 39 Minutes | 19 | 5.3% |
| 40 to 44 Minutes | 6 | 1.7% |
| 45 to 59 Minutes | 21 | 5.8% |
| 60 to 89 Minutes | 40 | 11.1% |
| 90 or more Minutes | 28 | 7.8% |
Commute Time by Sex in Pleasant View
The most common commute times in Pleasant View are 15 to 19 minutes (53 commuters, 23.1%) for males and 15 to 19 minutes (38 commuters, 29.0%) for females.
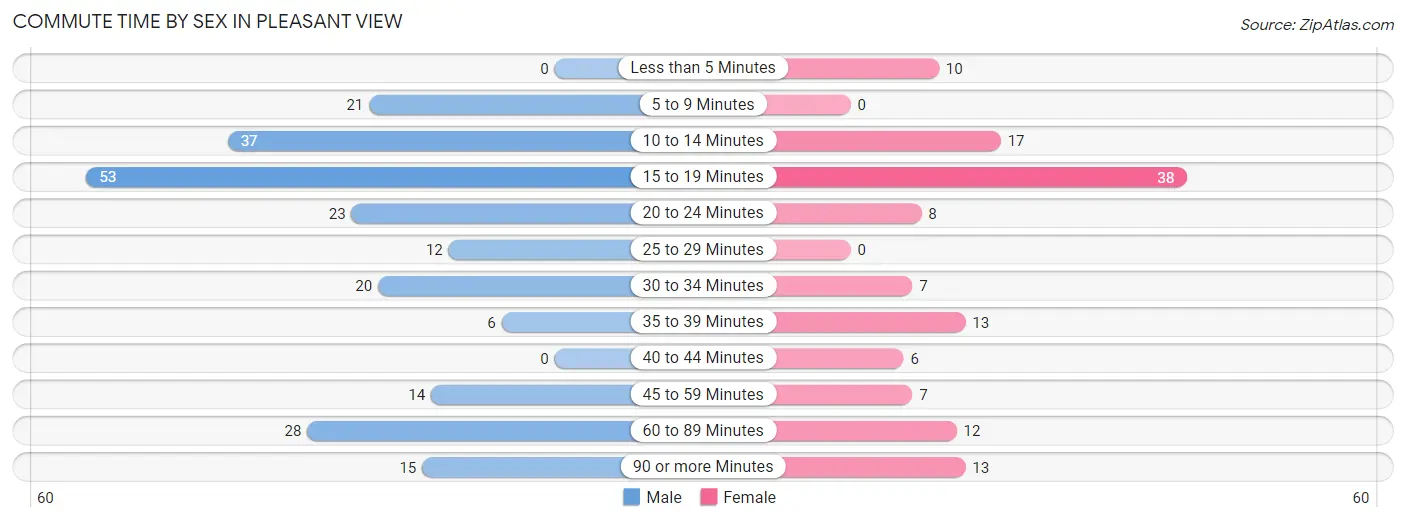
| Commute Time | Male | Female |
| Less than 5 Minutes | 0 (0.0%) | 10 (7.6%) |
| 5 to 9 Minutes | 21 (9.2%) | 0 (0.0%) |
| 10 to 14 Minutes | 37 (16.2%) | 17 (13.0%) |
| 15 to 19 Minutes | 53 (23.1%) | 38 (29.0%) |
| 20 to 24 Minutes | 23 (10.0%) | 8 (6.1%) |
| 25 to 29 Minutes | 12 (5.2%) | 0 (0.0%) |
| 30 to 34 Minutes | 20 (8.7%) | 7 (5.3%) |
| 35 to 39 Minutes | 6 (2.6%) | 13 (9.9%) |
| 40 to 44 Minutes | 0 (0.0%) | 6 (4.6%) |
| 45 to 59 Minutes | 14 (6.1%) | 7 (5.3%) |
| 60 to 89 Minutes | 28 (12.2%) | 12 (9.2%) |
| 90 or more Minutes | 15 (6.6%) | 13 (9.9%) |
Time of Departure to Work by Sex in Pleasant View
The most frequent times of departure to work in Pleasant View are 5:00 AM to 5:29 AM (58, 25.3%) for males and 7:30 AM to 7:59 AM (24, 18.3%) for females.
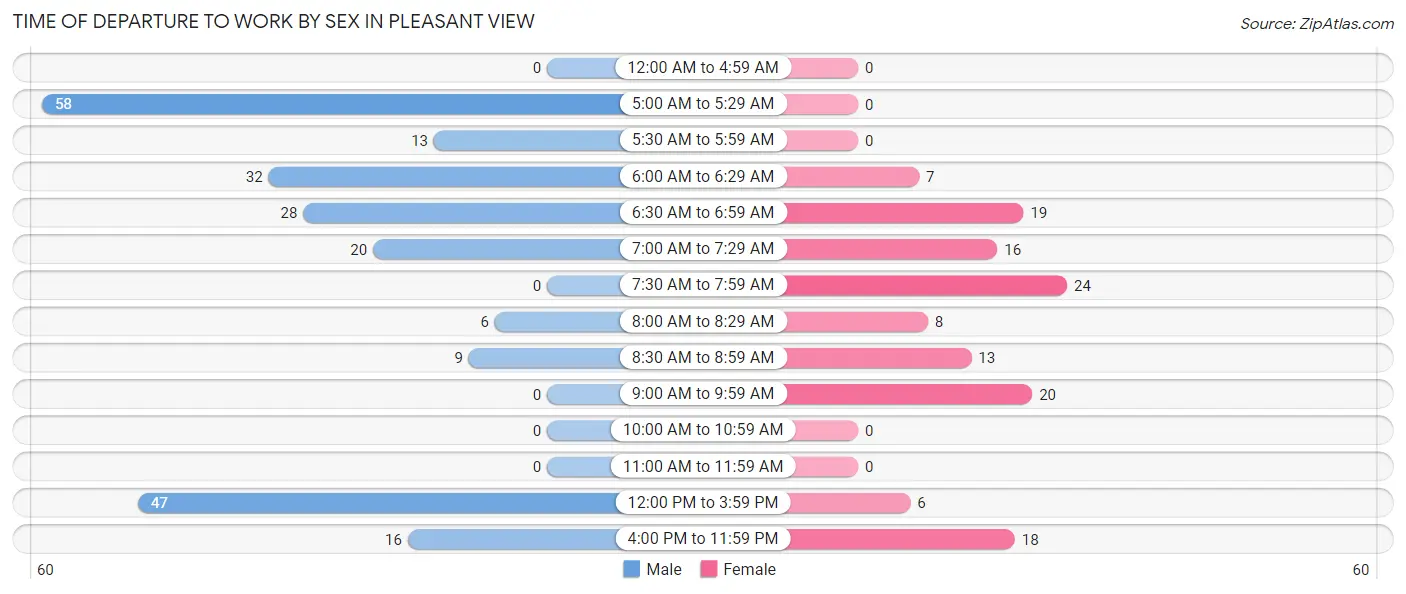
| Time of Departure | Male | Female |
| 12:00 AM to 4:59 AM | 0 (0.0%) | 0 (0.0%) |
| 5:00 AM to 5:29 AM | 58 (25.3%) | 0 (0.0%) |
| 5:30 AM to 5:59 AM | 13 (5.7%) | 0 (0.0%) |
| 6:00 AM to 6:29 AM | 32 (14.0%) | 7 (5.3%) |
| 6:30 AM to 6:59 AM | 28 (12.2%) | 19 (14.5%) |
| 7:00 AM to 7:29 AM | 20 (8.7%) | 16 (12.2%) |
| 7:30 AM to 7:59 AM | 0 (0.0%) | 24 (18.3%) |
| 8:00 AM to 8:29 AM | 6 (2.6%) | 8 (6.1%) |
| 8:30 AM to 8:59 AM | 9 (3.9%) | 13 (9.9%) |
| 9:00 AM to 9:59 AM | 0 (0.0%) | 20 (15.3%) |
| 10:00 AM to 10:59 AM | 0 (0.0%) | 0 (0.0%) |
| 11:00 AM to 11:59 AM | 0 (0.0%) | 0 (0.0%) |
| 12:00 PM to 3:59 PM | 47 (20.5%) | 6 (4.6%) |
| 4:00 PM to 11:59 PM | 16 (7.0%) | 18 (13.7%) |
| Total | 229 (100.0%) | 131 (100.0%) |
Housing Occupancy in Pleasant View
Occupancy by Ownership in Pleasant View
Of the total 309 dwellings in Pleasant View, owner-occupied units account for 273 (88.3%), while renter-occupied units make up 36 (11.7%).
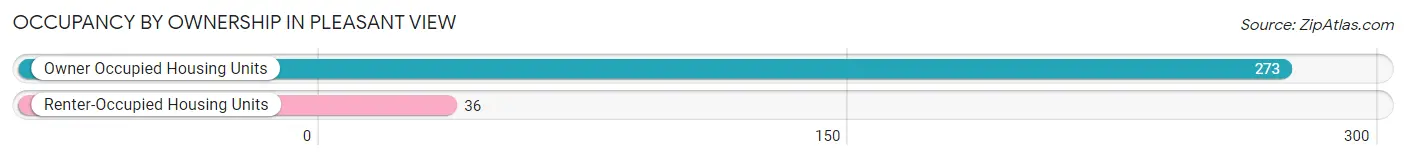
| Occupancy | # Housing Units | % Housing Units |
| Owner Occupied Housing Units | 273 | 88.3% |
| Renter-Occupied Housing Units | 36 | 11.7% |
| Total Occupied Housing Units | 309 | 100.0% |
Occupancy by Household Size in Pleasant View
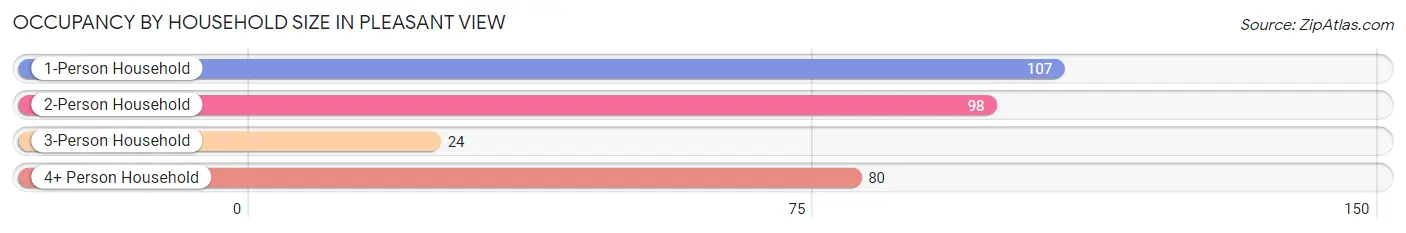
| Household Size | # Housing Units | % Housing Units |
| 1-Person Household | 107 | 34.6% |
| 2-Person Household | 98 | 31.7% |
| 3-Person Household | 24 | 7.8% |
| 4+ Person Household | 80 | 25.9% |
| Total Housing Units | 309 | 100.0% |
Occupancy by Ownership by Household Size in Pleasant View
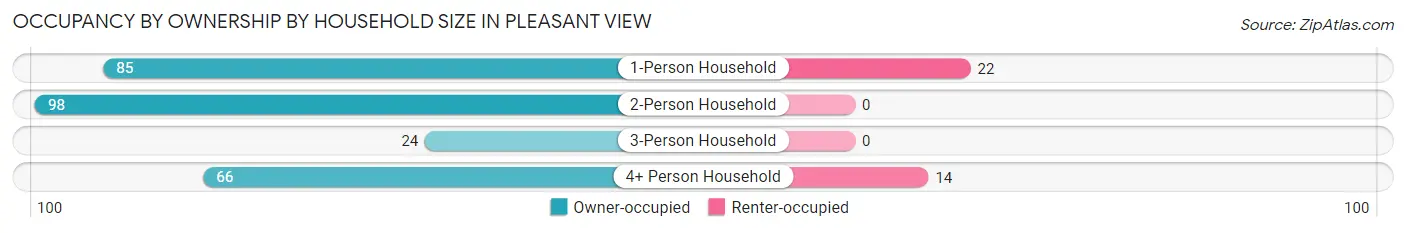
| Household Size | Owner-occupied | Renter-occupied |
| 1-Person Household | 85 (79.4%) | 22 (20.6%) |
| 2-Person Household | 98 (100.0%) | 0 (0.0%) |
| 3-Person Household | 24 (100.0%) | 0 (0.0%) |
| 4+ Person Household | 66 (82.5%) | 14 (17.5%) |
| Total Housing Units | 273 (88.3%) | 36 (11.7%) |
Occupancy by Educational Attainment in Pleasant View
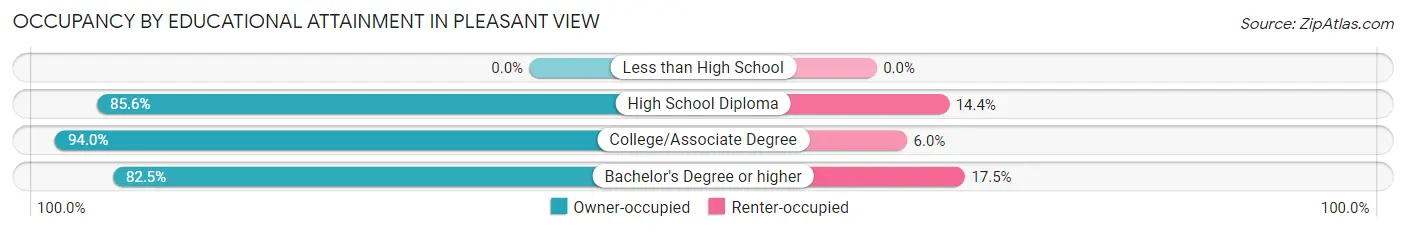
| Household Size | Owner-occupied | Renter-occupied |
| Less than High School | 0 (0.0%) | 0 (0.0%) |
| High School Diploma | 131 (85.6%) | 22 (14.4%) |
| College/Associate Degree | 109 (94.0%) | 7 (6.0%) |
| Bachelor's Degree or higher | 33 (82.5%) | 7 (17.5%) |
Occupancy by Age of Householder in Pleasant View
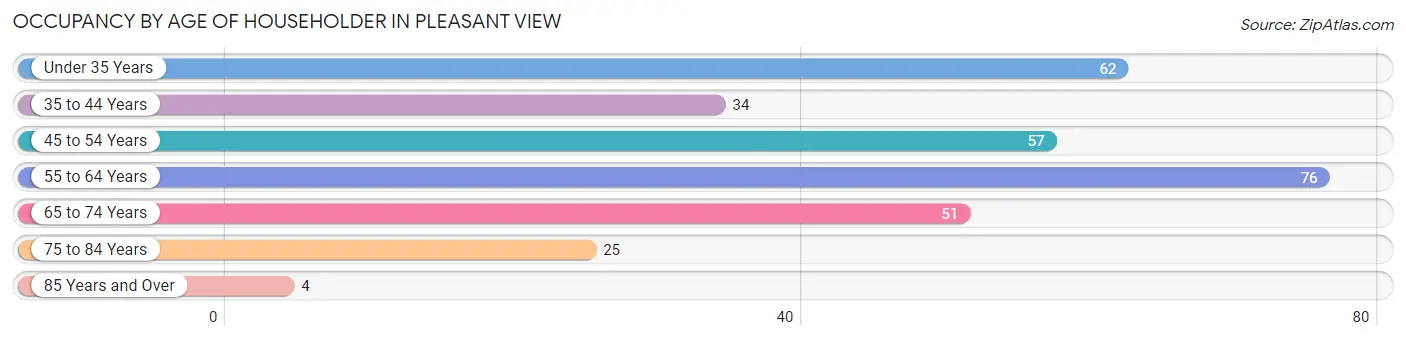
| Age Bracket | # Households | % Households |
| Under 35 Years | 62 | 20.1% |
| 35 to 44 Years | 34 | 11.0% |
| 45 to 54 Years | 57 | 18.4% |
| 55 to 64 Years | 76 | 24.6% |
| 65 to 74 Years | 51 | 16.5% |
| 75 to 84 Years | 25 | 8.1% |
| 85 Years and Over | 4 | 1.3% |
| Total | 309 | 100.0% |
Housing Finances in Pleasant View
Median Income by Occupancy in Pleasant View
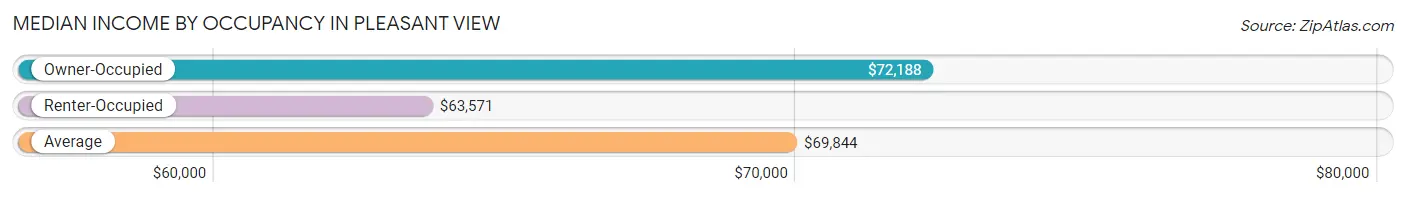
| Occupancy Type | # Households | Median Income |
| Owner-Occupied | 273 (88.3%) | $72,188 |
| Renter-Occupied | 36 (11.7%) | $63,571 |
| Average | 309 (100.0%) | $69,844 |
Occupancy by Householder Income Bracket in Pleasant View
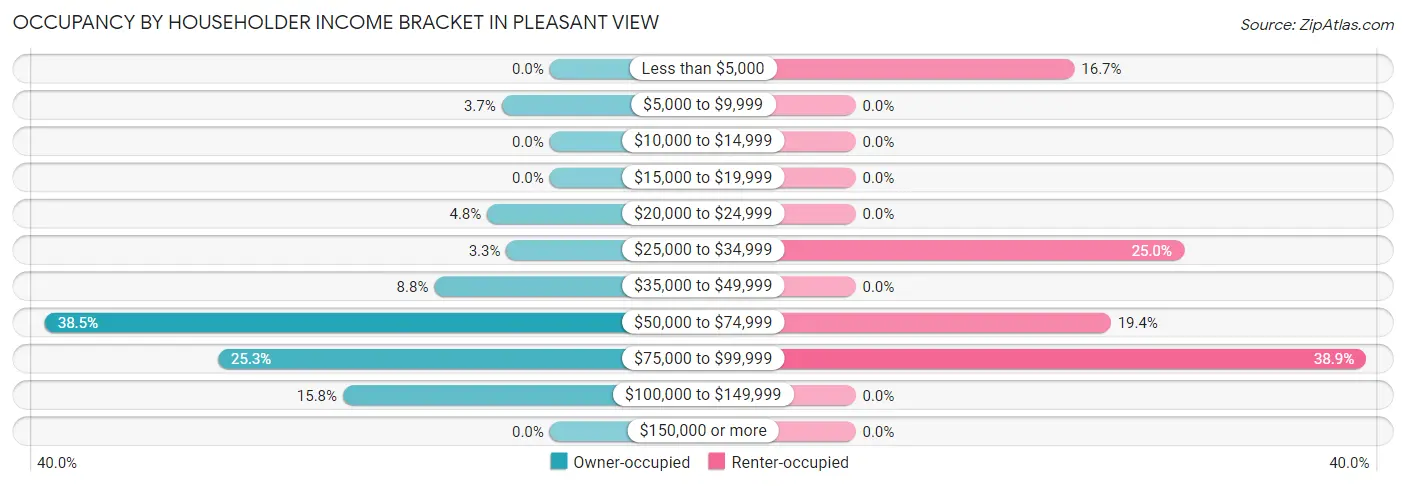
| Income Bracket | Owner-occupied | Renter-occupied |
| Less than $5,000 | 0 (0.0%) | 6 (16.7%) |
| $5,000 to $9,999 | 10 (3.7%) | 0 (0.0%) |
| $10,000 to $14,999 | 0 (0.0%) | 0 (0.0%) |
| $15,000 to $19,999 | 0 (0.0%) | 0 (0.0%) |
| $20,000 to $24,999 | 13 (4.8%) | 0 (0.0%) |
| $25,000 to $34,999 | 9 (3.3%) | 9 (25.0%) |
| $35,000 to $49,999 | 24 (8.8%) | 0 (0.0%) |
| $50,000 to $74,999 | 105 (38.5%) | 7 (19.4%) |
| $75,000 to $99,999 | 69 (25.3%) | 14 (38.9%) |
| $100,000 to $149,999 | 43 (15.8%) | 0 (0.0%) |
| $150,000 or more | 0 (0.0%) | 0 (0.0%) |
| Total | 273 (100.0%) | 36 (100.0%) |
Monthly Housing Cost Tiers in Pleasant View
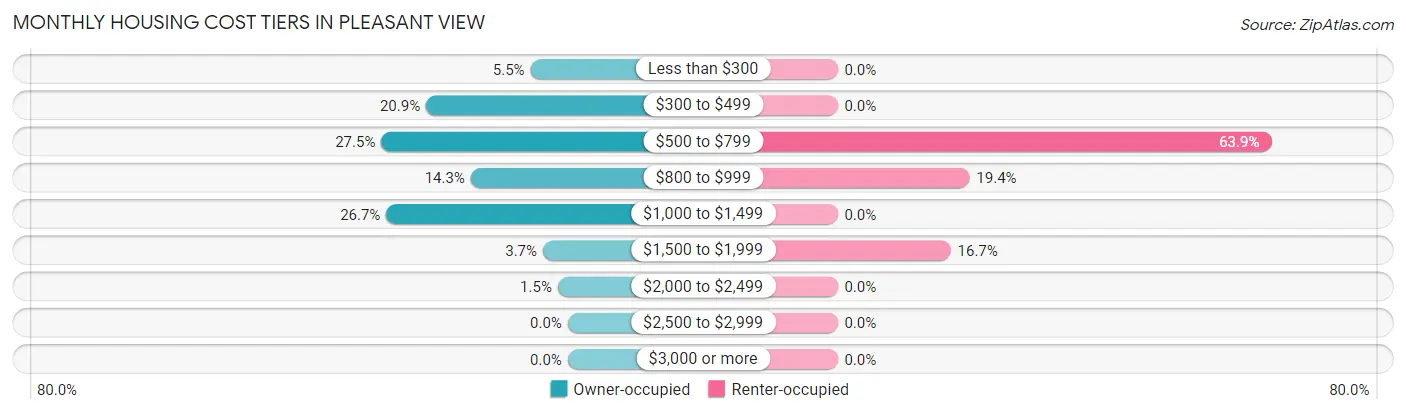
| Monthly Cost | Owner-occupied | Renter-occupied |
| Less than $300 | 15 (5.5%) | 0 (0.0%) |
| $300 to $499 | 57 (20.9%) | 0 (0.0%) |
| $500 to $799 | 75 (27.5%) | 23 (63.9%) |
| $800 to $999 | 39 (14.3%) | 7 (19.4%) |
| $1,000 to $1,499 | 73 (26.7%) | 0 (0.0%) |
| $1,500 to $1,999 | 10 (3.7%) | 6 (16.7%) |
| $2,000 to $2,499 | 4 (1.5%) | 0 (0.0%) |
| $2,500 to $2,999 | 0 (0.0%) | 0 (0.0%) |
| $3,000 or more | 0 (0.0%) | 0 (0.0%) |
| Total | 273 (100.0%) | 36 (100.0%) |
Physical Housing Characteristics in Pleasant View
Housing Structures in Pleasant View
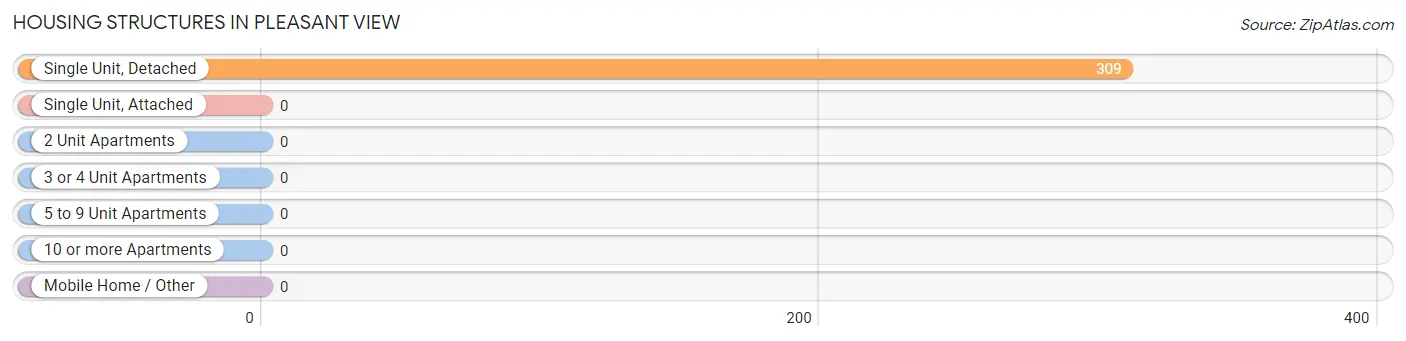
| Structure Type | # Housing Units | % Housing Units |
| Single Unit, Detached | 309 | 100.0% |
| Single Unit, Attached | 0 | 0.0% |
| 2 Unit Apartments | 0 | 0.0% |
| 3 or 4 Unit Apartments | 0 | 0.0% |
| 5 to 9 Unit Apartments | 0 | 0.0% |
| 10 or more Apartments | 0 | 0.0% |
| Mobile Home / Other | 0 | 0.0% |
| Total | 309 | 100.0% |
Housing Structures by Occupancy in Pleasant View
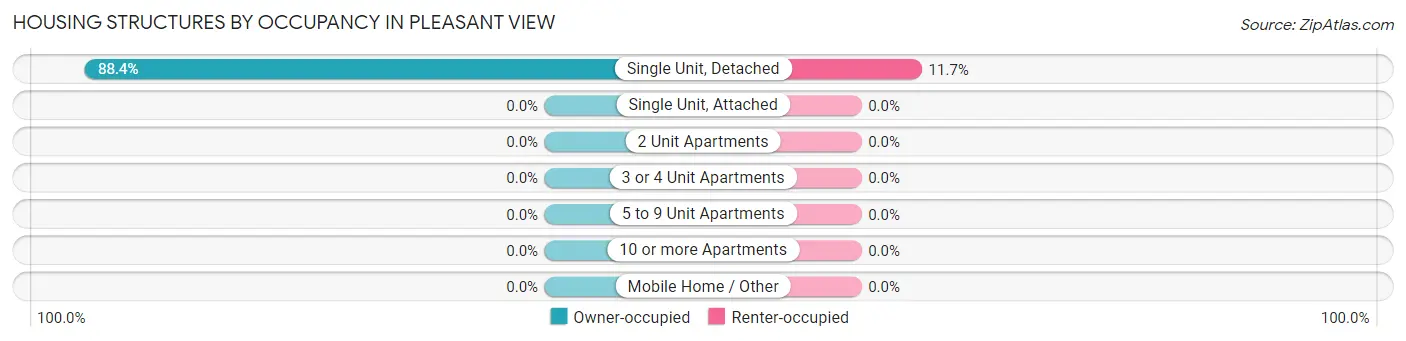
| Structure Type | Owner-occupied | Renter-occupied |
| Single Unit, Detached | 273 (88.3%) | 36 (11.7%) |
| Single Unit, Attached | 0 (0.0%) | 0 (0.0%) |
| 2 Unit Apartments | 0 (0.0%) | 0 (0.0%) |
| 3 or 4 Unit Apartments | 0 (0.0%) | 0 (0.0%) |
| 5 to 9 Unit Apartments | 0 (0.0%) | 0 (0.0%) |
| 10 or more Apartments | 0 (0.0%) | 0 (0.0%) |
| Mobile Home / Other | 0 (0.0%) | 0 (0.0%) |
| Total | 273 (88.3%) | 36 (11.7%) |
Housing Structures by Number of Rooms in Pleasant View
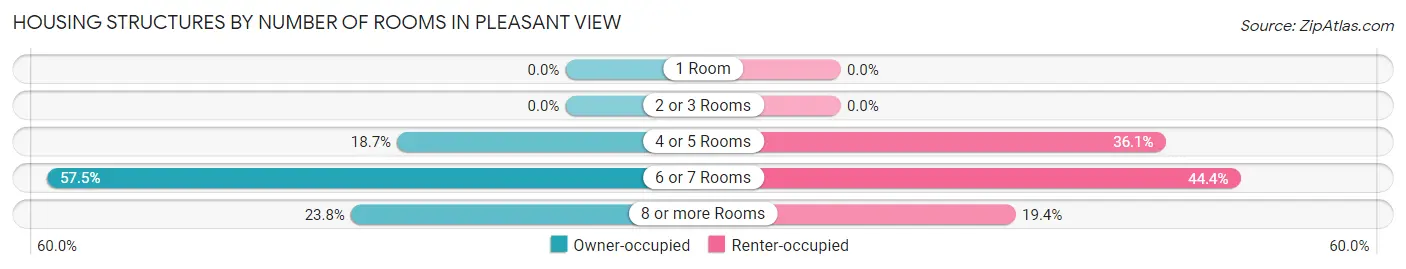
| Number of Rooms | Owner-occupied | Renter-occupied |
| 1 Room | 0 (0.0%) | 0 (0.0%) |
| 2 or 3 Rooms | 0 (0.0%) | 0 (0.0%) |
| 4 or 5 Rooms | 51 (18.7%) | 13 (36.1%) |
| 6 or 7 Rooms | 157 (57.5%) | 16 (44.4%) |
| 8 or more Rooms | 65 (23.8%) | 7 (19.4%) |
| Total | 273 (100.0%) | 36 (100.0%) |
Housing Structure by Heating Type in Pleasant View
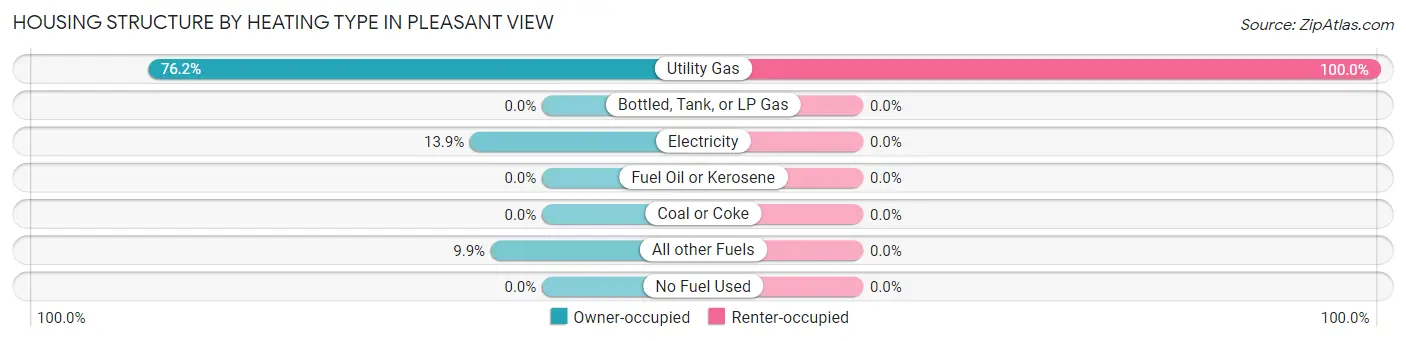
| Heating Type | Owner-occupied | Renter-occupied |
| Utility Gas | 208 (76.2%) | 36 (100.0%) |
| Bottled, Tank, or LP Gas | 0 (0.0%) | 0 (0.0%) |
| Electricity | 38 (13.9%) | 0 (0.0%) |
| Fuel Oil or Kerosene | 0 (0.0%) | 0 (0.0%) |
| Coal or Coke | 0 (0.0%) | 0 (0.0%) |
| All other Fuels | 27 (9.9%) | 0 (0.0%) |
| No Fuel Used | 0 (0.0%) | 0 (0.0%) |
| Total | 273 (100.0%) | 36 (100.0%) |
Household Vehicle Usage in Pleasant View
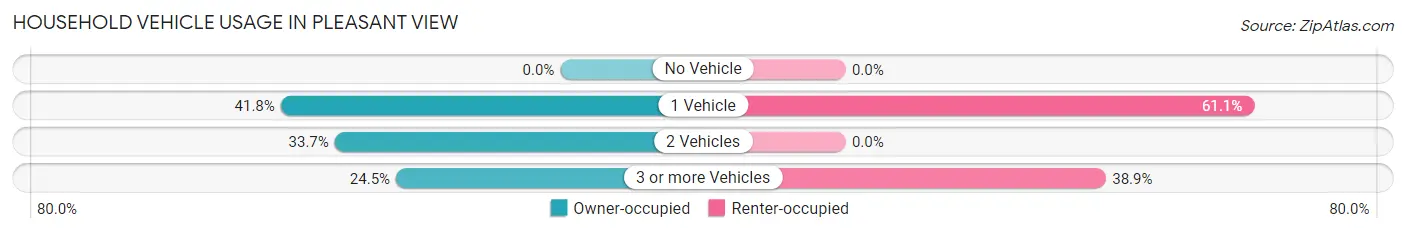
| Vehicles per Household | Owner-occupied | Renter-occupied |
| No Vehicle | 0 (0.0%) | 0 (0.0%) |
| 1 Vehicle | 114 (41.8%) | 22 (61.1%) |
| 2 Vehicles | 92 (33.7%) | 0 (0.0%) |
| 3 or more Vehicles | 67 (24.5%) | 14 (38.9%) |
| Total | 273 (100.0%) | 36 (100.0%) |
Real Estate & Mortgages in Pleasant View
Real Estate and Mortgage Overview in Pleasant View
| Characteristic | Without Mortgage | With Mortgage |
| Housing Units | 104 | 169 |
| Median Property Value | $99,300 | $114,300 |
| Median Household Income | $73,333 | $0 |
| Monthly Housing Costs | $450 | $0 |
| Real Estate Taxes | $2,155 | $0 |
Property Value by Mortgage Status in Pleasant View
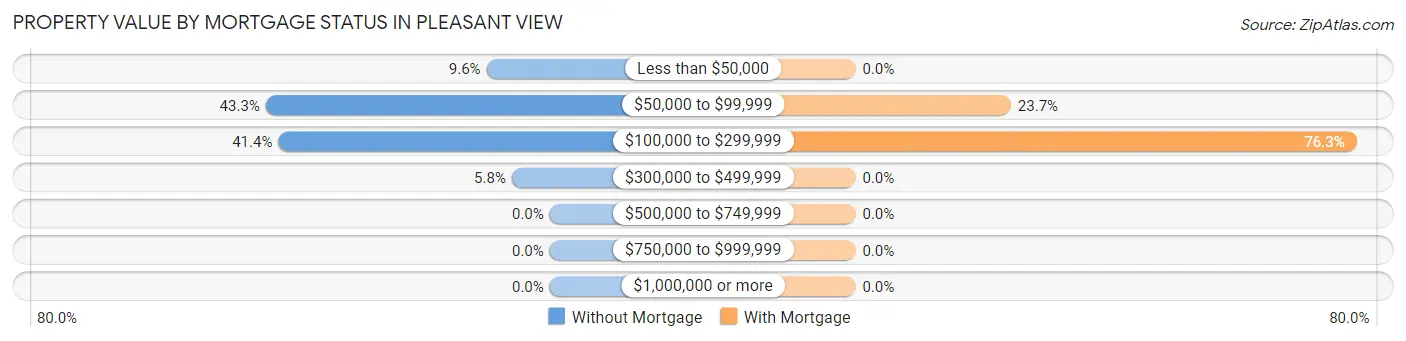
| Property Value | Without Mortgage | With Mortgage |
| Less than $50,000 | 10 (9.6%) | 0 (0.0%) |
| $50,000 to $99,999 | 45 (43.3%) | 40 (23.7%) |
| $100,000 to $299,999 | 43 (41.3%) | 129 (76.3%) |
| $300,000 to $499,999 | 6 (5.8%) | 0 (0.0%) |
| $500,000 to $749,999 | 0 (0.0%) | 0 (0.0%) |
| $750,000 to $999,999 | 0 (0.0%) | 0 (0.0%) |
| $1,000,000 or more | 0 (0.0%) | 0 (0.0%) |
| Total | 104 (100.0%) | 169 (100.0%) |
Household Income by Mortgage Status in Pleasant View
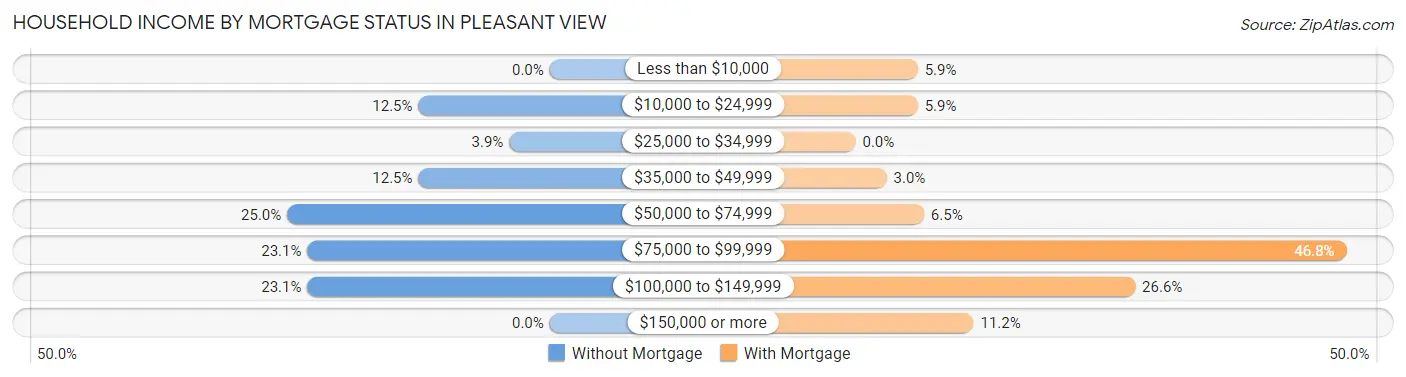
| Household Income | Without Mortgage | With Mortgage |
| Less than $10,000 | 0 (0.0%) | 10 (5.9%) |
| $10,000 to $24,999 | 13 (12.5%) | 10 (5.9%) |
| $25,000 to $34,999 | 4 (3.8%) | 0 (0.0%) |
| $35,000 to $49,999 | 13 (12.5%) | 5 (3.0%) |
| $50,000 to $74,999 | 26 (25.0%) | 11 (6.5%) |
| $75,000 to $99,999 | 24 (23.1%) | 79 (46.8%) |
| $100,000 to $149,999 | 24 (23.1%) | 45 (26.6%) |
| $150,000 or more | 0 (0.0%) | 19 (11.2%) |
| Total | 104 (100.0%) | 169 (100.0%) |
Property Value to Household Income Ratio in Pleasant View
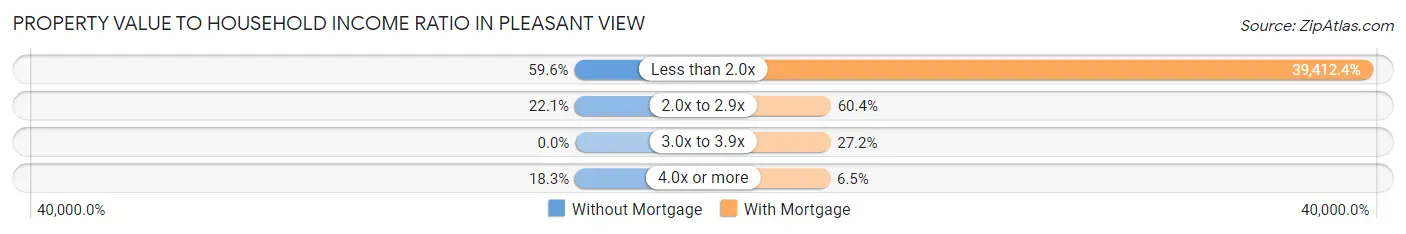
| Value-to-Income Ratio | Without Mortgage | With Mortgage |
| Less than 2.0x | 62 (59.6%) | 66,607 (39,412.4%) |
| 2.0x to 2.9x | 23 (22.1%) | 102 (60.4%) |
| 3.0x to 3.9x | 0 (0.0%) | 46 (27.2%) |
| 4.0x or more | 19 (18.3%) | 11 (6.5%) |
| Total | 104 (100.0%) | 169 (100.0%) |
Real Estate Taxes by Mortgage Status in Pleasant View
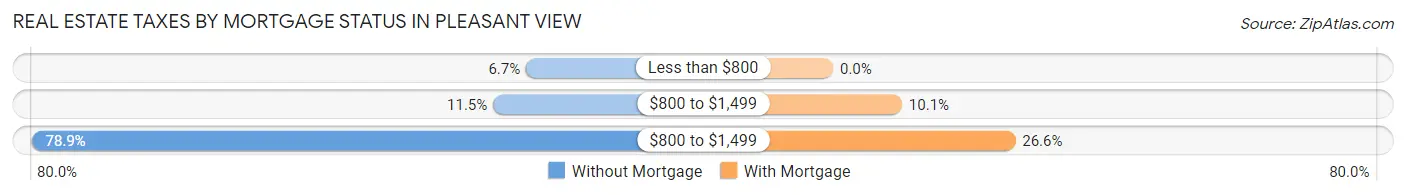
| Property Taxes | Without Mortgage | With Mortgage |
| Less than $800 | 7 (6.7%) | 0 (0.0%) |
| $800 to $1,499 | 12 (11.5%) | 17 (10.1%) |
| $800 to $1,499 | 82 (78.8%) | 45 (26.6%) |
| Total | 104 (100.0%) | 169 (100.0%) |
Health & Disability in Pleasant View
Health Insurance Coverage by Age in Pleasant View
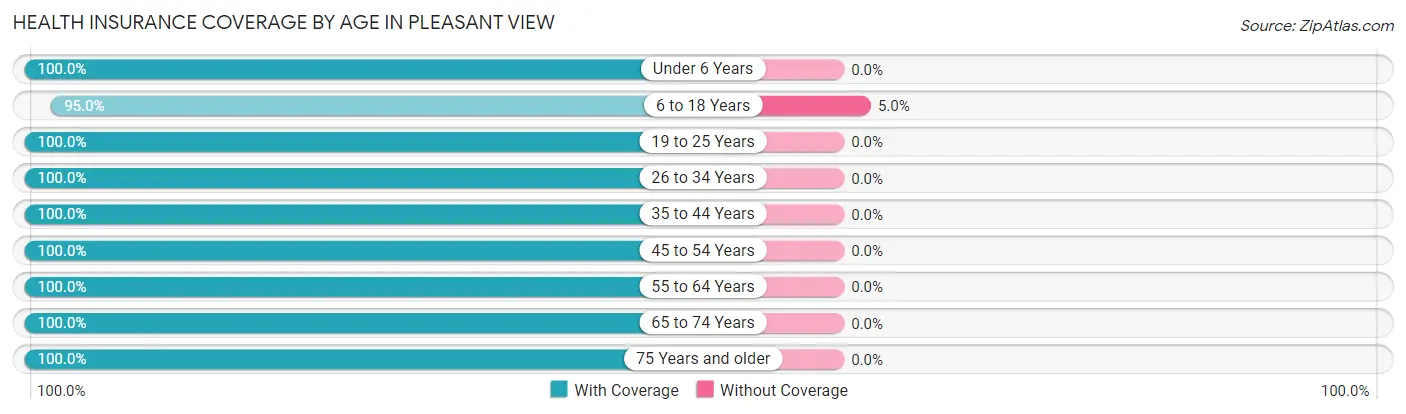
| Age Bracket | With Coverage | Without Coverage |
| Under 6 Years | 16 (100.0%) | 0 (0.0%) |
| 6 to 18 Years | 172 (95.0%) | 9 (5.0%) |
| 19 to 25 Years | 41 (100.0%) | 0 (0.0%) |
| 26 to 34 Years | 78 (100.0%) | 0 (0.0%) |
| 35 to 44 Years | 85 (100.0%) | 0 (0.0%) |
| 45 to 54 Years | 90 (100.0%) | 0 (0.0%) |
| 55 to 64 Years | 105 (100.0%) | 0 (0.0%) |
| 65 to 74 Years | 97 (100.0%) | 0 (0.0%) |
| 75 Years and older | 40 (100.0%) | 0 (0.0%) |
| Total | 724 (98.8%) | 9 (1.2%) |
Health Insurance Coverage by Citizenship Status in Pleasant View
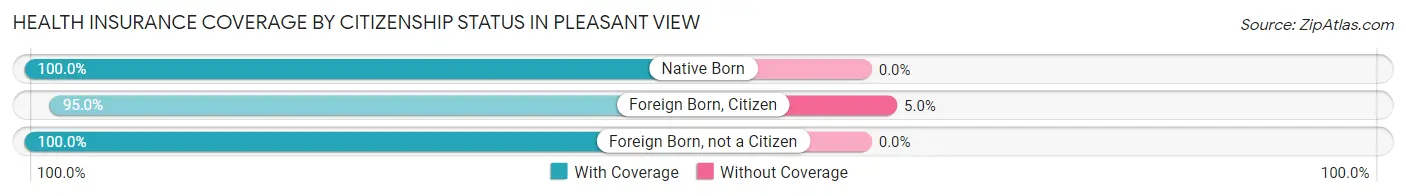
| Citizenship Status | With Coverage | Without Coverage |
| Native Born | 16 (100.0%) | 0 (0.0%) |
| Foreign Born, Citizen | 172 (95.0%) | 9 (5.0%) |
| Foreign Born, not a Citizen | 41 (100.0%) | 0 (0.0%) |
Health Insurance Coverage by Household Income in Pleasant View
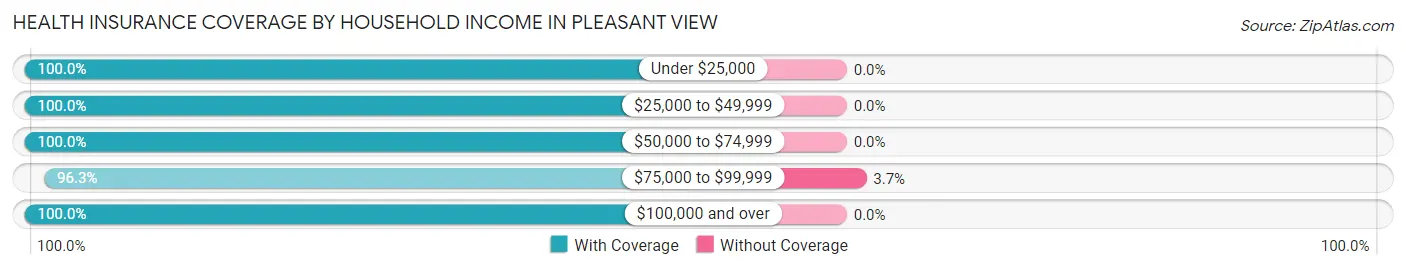
| Household Income | With Coverage | Without Coverage |
| Under $25,000 | 36 (100.0%) | 0 (0.0%) |
| $25,000 to $49,999 | 64 (100.0%) | 0 (0.0%) |
| $50,000 to $74,999 | 230 (100.0%) | 0 (0.0%) |
| $75,000 to $99,999 | 236 (96.3%) | 9 (3.7%) |
| $100,000 and over | 158 (100.0%) | 0 (0.0%) |
Public vs Private Health Insurance Coverage by Age in Pleasant View
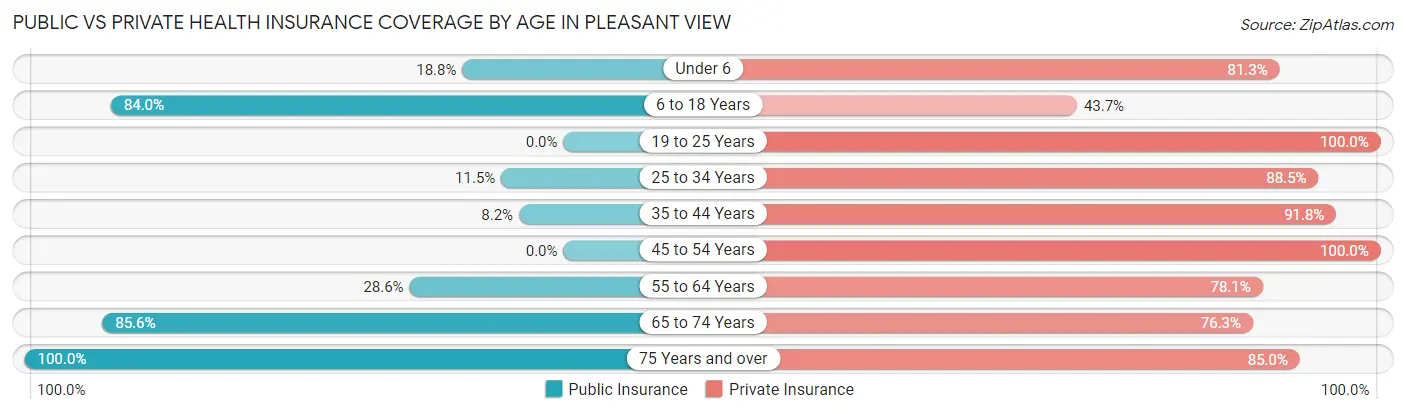
| Age Bracket | Public Insurance | Private Insurance |
| Under 6 | 3 (18.8%) | 13 (81.2%) |
| 6 to 18 Years | 152 (84.0%) | 79 (43.6%) |
| 19 to 25 Years | 0 (0.0%) | 41 (100.0%) |
| 25 to 34 Years | 9 (11.5%) | 69 (88.5%) |
| 35 to 44 Years | 7 (8.2%) | 78 (91.8%) |
| 45 to 54 Years | 0 (0.0%) | 90 (100.0%) |
| 55 to 64 Years | 30 (28.6%) | 82 (78.1%) |
| 65 to 74 Years | 83 (85.6%) | 74 (76.3%) |
| 75 Years and over | 40 (100.0%) | 34 (85.0%) |
| Total | 324 (44.2%) | 560 (76.4%) |
Disability Status by Sex by Age in Pleasant View
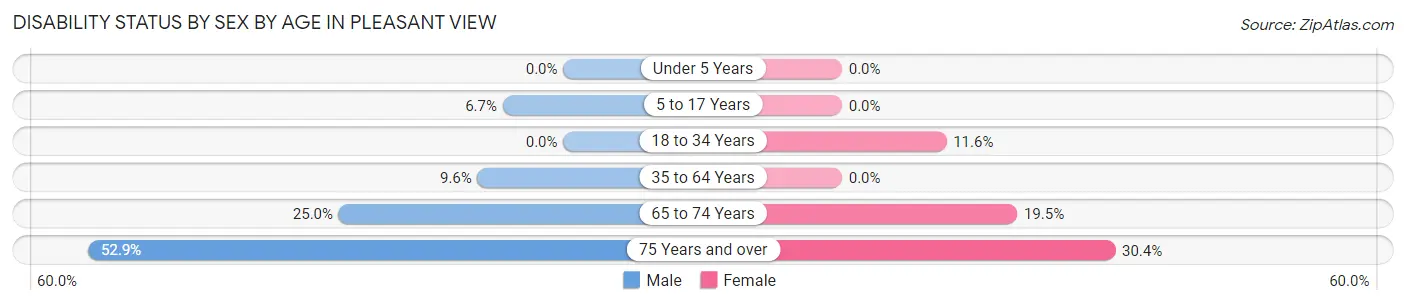
| Age Bracket | Male | Female |
| Under 5 Years | 0 (0.0%) | 0 (0.0%) |
| 5 to 17 Years | 6 (6.7%) | 0 (0.0%) |
| 18 to 34 Years | 0 (0.0%) | 5 (11.6%) |
| 35 to 64 Years | 15 (9.6%) | 0 (0.0%) |
| 65 to 74 Years | 14 (25.0%) | 8 (19.5%) |
| 75 Years and over | 9 (52.9%) | 7 (30.4%) |
Disability Class by Sex by Age in Pleasant View
Disability Class: Hearing Difficulty
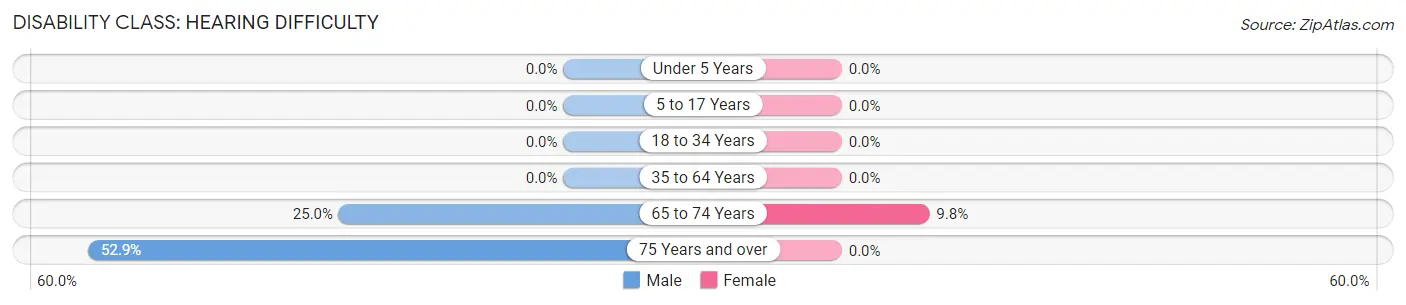
| Age Bracket | Male | Female |
| Under 5 Years | 0 (0.0%) | 0 (0.0%) |
| 5 to 17 Years | 0 (0.0%) | 0 (0.0%) |
| 18 to 34 Years | 0 (0.0%) | 0 (0.0%) |
| 35 to 64 Years | 0 (0.0%) | 0 (0.0%) |
| 65 to 74 Years | 14 (25.0%) | 4 (9.8%) |
| 75 Years and over | 9 (52.9%) | 0 (0.0%) |
Disability Class: Vision Difficulty
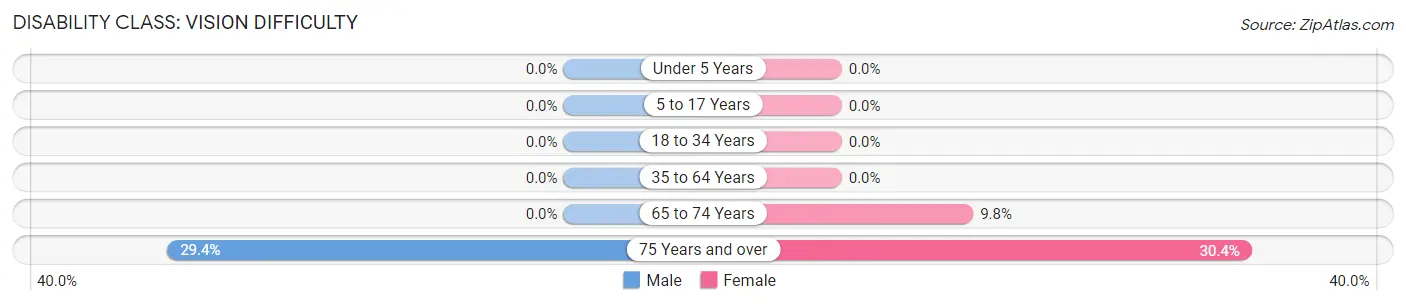
| Age Bracket | Male | Female |
| Under 5 Years | 0 (0.0%) | 0 (0.0%) |
| 5 to 17 Years | 0 (0.0%) | 0 (0.0%) |
| 18 to 34 Years | 0 (0.0%) | 0 (0.0%) |
| 35 to 64 Years | 0 (0.0%) | 0 (0.0%) |
| 65 to 74 Years | 0 (0.0%) | 4 (9.8%) |
| 75 Years and over | 5 (29.4%) | 7 (30.4%) |
Disability Class: Cognitive Difficulty
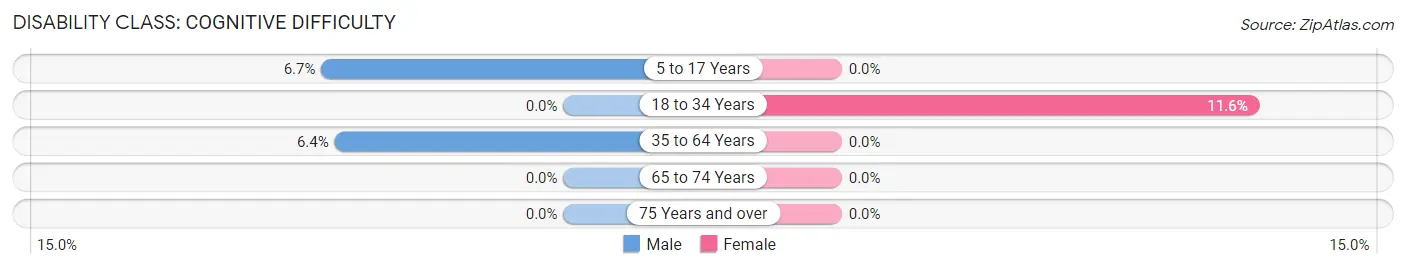
| Age Bracket | Male | Female |
| 5 to 17 Years | 6 (6.7%) | 0 (0.0%) |
| 18 to 34 Years | 0 (0.0%) | 5 (11.6%) |
| 35 to 64 Years | 10 (6.4%) | 0 (0.0%) |
| 65 to 74 Years | 0 (0.0%) | 0 (0.0%) |
| 75 Years and over | 0 (0.0%) | 0 (0.0%) |
Disability Class: Ambulatory Difficulty
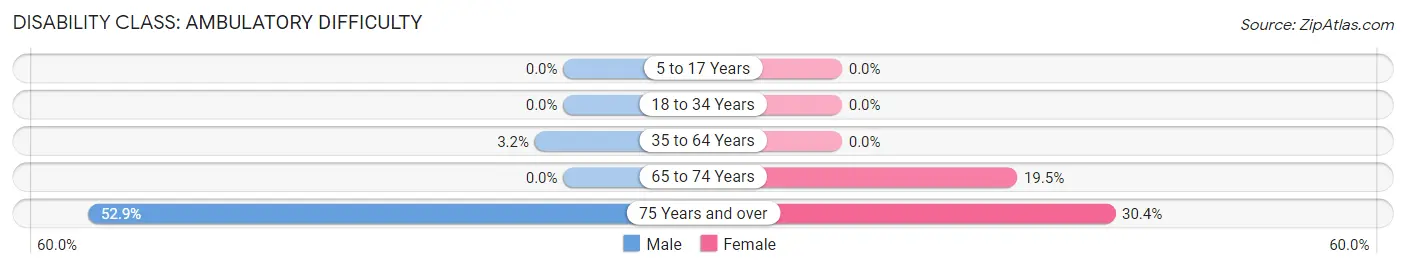
| Age Bracket | Male | Female |
| 5 to 17 Years | 0 (0.0%) | 0 (0.0%) |
| 18 to 34 Years | 0 (0.0%) | 0 (0.0%) |
| 35 to 64 Years | 5 (3.2%) | 0 (0.0%) |
| 65 to 74 Years | 0 (0.0%) | 8 (19.5%) |
| 75 Years and over | 9 (52.9%) | 7 (30.4%) |
Disability Class: Self-Care Difficulty
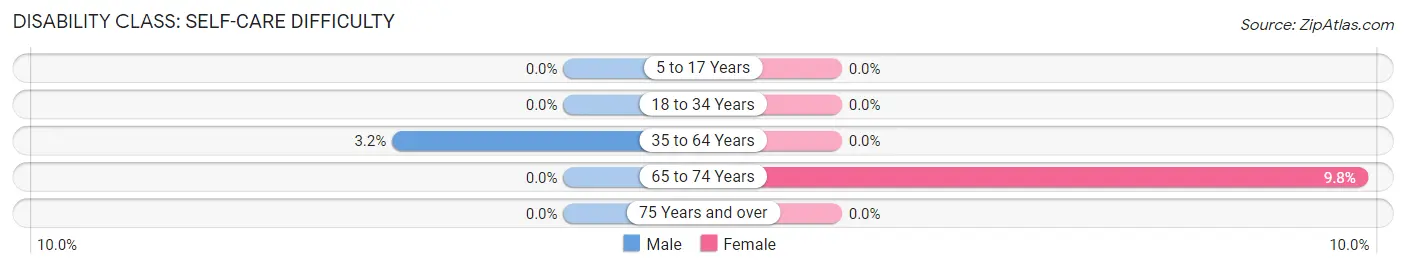
| Age Bracket | Male | Female |
| 5 to 17 Years | 0 (0.0%) | 0 (0.0%) |
| 18 to 34 Years | 0 (0.0%) | 0 (0.0%) |
| 35 to 64 Years | 5 (3.2%) | 0 (0.0%) |
| 65 to 74 Years | 0 (0.0%) | 4 (9.8%) |
| 75 Years and over | 0 (0.0%) | 0 (0.0%) |
Technology Access in Pleasant View
Computing Device Access in Pleasant View
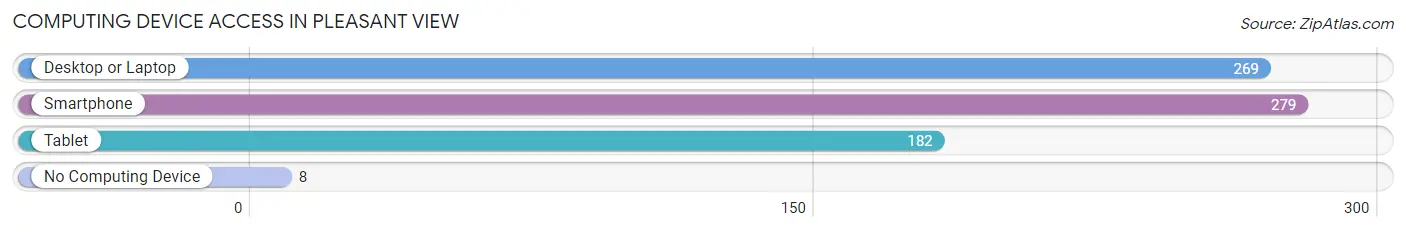
| Device Type | # Households | % Households |
| Desktop or Laptop | 269 | 87.1% |
| Smartphone | 279 | 90.3% |
| Tablet | 182 | 58.9% |
| No Computing Device | 8 | 2.6% |
| Total | 309 | 100.0% |
Internet Access in Pleasant View
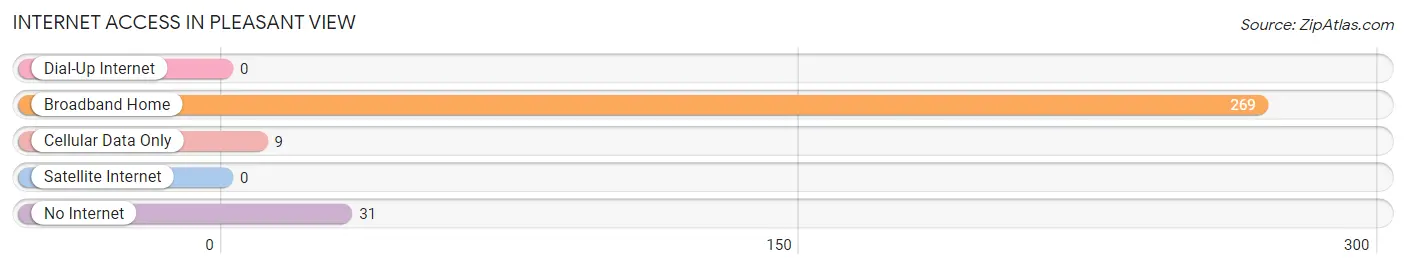
| Internet Type | # Households | % Households |
| Dial-Up Internet | 0 | 0.0% |
| Broadband Home | 269 | 87.1% |
| Cellular Data Only | 9 | 2.9% |
| Satellite Internet | 0 | 0.0% |
| No Internet | 31 | 10.0% |
| Total | 309 | 100.0% |
Pleasant View Summary
Pleasant View is a small borough located in the state of Pennsylvania. It is situated in the south-central part of the state, in the county of York. The borough is located approximately 20 miles south of the state capital, Harrisburg. According to the 2010 census, the population of Pleasant View was 1,845.
History
Pleasant View was first settled in the late 1700s by German immigrants. The area was originally known as “Germantown” and was part of the larger township of York. In 1845, the area was officially incorporated as the borough of Pleasant View. The name was chosen to reflect the pleasant views of the surrounding countryside.
In the late 1800s, Pleasant View was a thriving agricultural community. The area was known for its production of apples, peaches, and other fruits. The borough also had a number of small businesses, including a blacksmith, a general store, and a post office.
In the early 1900s, the borough began to experience a period of growth and development. The population increased, and new businesses and industries began to move into the area. The borough was also home to a number of churches, schools, and other civic organizations.
Geography
Pleasant View is located in the south-central part of Pennsylvania. The borough is situated in the county of York, approximately 20 miles south of the state capital, Harrisburg. The borough is bordered by the boroughs of York Haven to the north, Manchester to the east, and Dover to the south.
The terrain of Pleasant View is mostly flat, with some rolling hills. The borough is located in the Appalachian Mountains, and the area is known for its scenic views. The borough is also home to a number of creeks and streams, including the Codorus Creek and the Conewago Creek.
Economy
The economy of Pleasant View is largely based on agriculture and manufacturing. The borough is home to a number of farms, which produce a variety of crops, including apples, peaches, and other fruits. The area is also home to a number of small businesses, including restaurants, retail stores, and service providers.
The borough is also home to a number of manufacturing companies, including a plastics manufacturer and a metal fabrication company. The borough is also home to a number of distribution centers, which provide jobs to local residents.
Demographics
According to the 2010 census, the population of Pleasant View was 1,845. The population is largely white (94.3%), with small percentages of African American (2.2%), Asian (1.2%), and Hispanic (1.2%) residents. The median household income in the borough is $45,945, and the median age is 43.
Conclusion
Pleasant View is a small borough located in the south-central part of Pennsylvania. The borough is known for its pleasant views of the surrounding countryside, and its economy is largely based on agriculture and manufacturing. The population of Pleasant View is largely white, with small percentages of African American, Asian, and Hispanic residents. The median household income in the borough is $45,945, and the median age is 43.
Common Questions
What is Per Capita Income in Pleasant View?
Per Capita income in Pleasant View is $27,532.
What is the Median Family Income in Pleasant View?
Median Family Income in Pleasant View is $77,917.
What is the Median Household income in Pleasant View?
Median Household Income in Pleasant View is $69,844.
What is Income or Wage Gap in Pleasant View?
Income or Wage Gap in Pleasant View is 44.3%.
Women in Pleasant View earn 55.7 cents for every dollar earned by a man.
What is Inequality or Gini Index in Pleasant View?
Inequality or Gini Index in Pleasant View is 0.25.
What is the Total Population of Pleasant View?
Total Population of Pleasant View is 733.
What is the Total Male Population of Pleasant View?
Total Male Population of Pleasant View is 424.
What is the Total Female Population of Pleasant View?
Total Female Population of Pleasant View is 309.
What is the Ratio of Males per 100 Females in Pleasant View?
There are 137.22 Males per 100 Females in Pleasant View.
What is the Ratio of Females per 100 Males in Pleasant View?
There are 72.88 Females per 100 Males in Pleasant View.
What is the Median Population Age in Pleasant View?
Median Population Age in Pleasant View is 42.4 Years.
What is the Average Family Size in Pleasant View
Average Family Size in Pleasant View is 3.2 People.
What is the Average Household Size in Pleasant View
Average Household Size in Pleasant View is 2.4 People.
How Large is the Labor Force in Pleasant View?
There are 379 People in the Labor Forcein in Pleasant View.
What is the Percentage of People in the Labor Force in Pleasant View?
62.0% of People are in the Labor Force in Pleasant View.
What is the Unemployment Rate in Pleasant View?
Unemployment Rate in Pleasant View is 2.6%.