Lykens borough, PA Map & Demographics
Lykens borough Overview
$32,607
PER CAPITA INCOME
$78,021
AVG FAMILY INCOME
$67,768
AVG HOUSEHOLD INCOME
42.5%
WAGE / INCOME GAP [ % ]
57.5¢/ $1
WAGE / INCOME GAP [ $ ]
0.37
INEQUALITY / GINI INDEX
1,631
TOTAL POPULATION
887
MALE POPULATION
744
FEMALE POPULATION
119.22
MALES / 100 FEMALES
83.88
FEMALES / 100 MALES
43.4
MEDIAN AGE
3.0
AVG FAMILY SIZE
2.2
AVG HOUSEHOLD SIZE
839
LABOR FORCE [ PEOPLE ]
62.8%
PERCENT IN LABOR FORCE
5.2%
UNEMPLOYMENT RATE
Income in Lykens borough
Income Overview in Lykens borough
Per Capita Income in Lykens borough is $32,607, while median incomes of families and households are $78,021 and $67,768 respectively.
| Characteristic | Number | Measure |
| Per Capita Income | 1,631 | $32,607 |
| Median Family Income | 389 | $78,021 |
| Mean Family Income | 389 | $82,090 |
| Median Household Income | 755 | $67,768 |
| Mean Household Income | 755 | $69,770 |
| Income Deficit | 389 | $0 |
| Wage / Income Gap (%) | 1,631 | 42.50% |
| Wage / Income Gap ($) | 1,631 | 57.50¢ per $1 |
| Gini / Inequality Index | 1,631 | 0.37 |
Earnings by Sex in Lykens borough
Average Earnings in Lykens borough are $41,154, $50,313 for men and $28,929 for women, a difference of 42.5%.
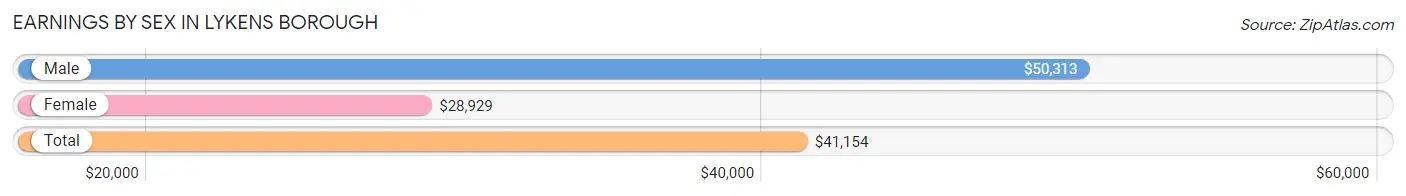
| Sex | Number | Average Earnings |
| Male | 506 (55.4%) | $50,313 |
| Female | 408 (44.6%) | $28,929 |
| Total | 914 (100.0%) | $41,154 |
Earnings by Sex by Income Bracket in Lykens borough
The most common earnings brackets in Lykens borough are $50,000 to $54,999 for men (100 | 19.8%) and $22,500 to $24,999 for women (46 | 11.3%).
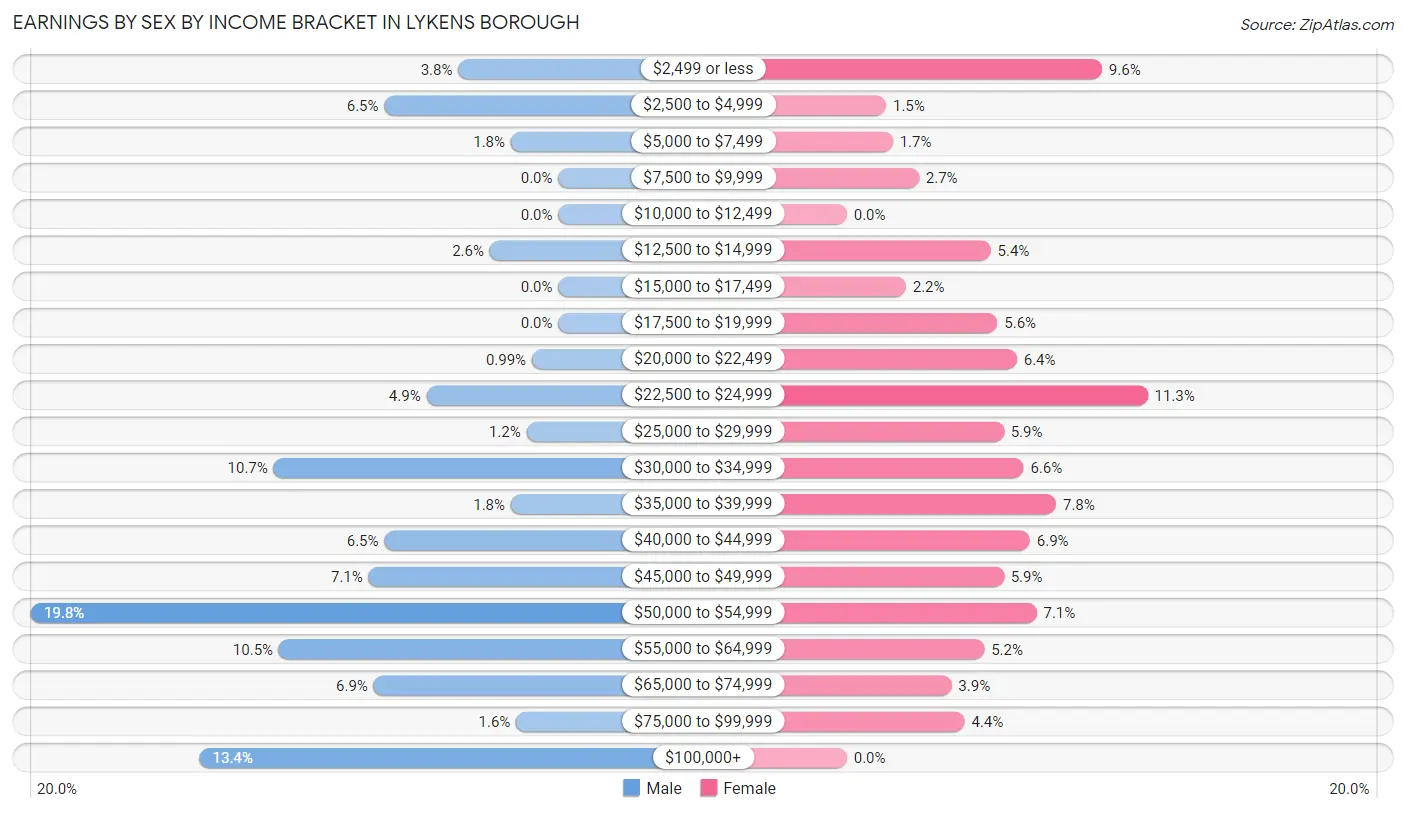
| Income | Male | Female |
| $2,499 or less | 19 (3.7%) | 39 (9.6%) |
| $2,500 to $4,999 | 33 (6.5%) | 6 (1.5%) |
| $5,000 to $7,499 | 9 (1.8%) | 7 (1.7%) |
| $7,500 to $9,999 | 0 (0.0%) | 11 (2.7%) |
| $10,000 to $12,499 | 0 (0.0%) | 0 (0.0%) |
| $12,500 to $14,999 | 13 (2.6%) | 22 (5.4%) |
| $15,000 to $17,499 | 0 (0.0%) | 9 (2.2%) |
| $17,500 to $19,999 | 0 (0.0%) | 23 (5.6%) |
| $20,000 to $22,499 | 5 (1.0%) | 26 (6.4%) |
| $22,500 to $24,999 | 25 (4.9%) | 46 (11.3%) |
| $25,000 to $29,999 | 6 (1.2%) | 24 (5.9%) |
| $30,000 to $34,999 | 54 (10.7%) | 27 (6.6%) |
| $35,000 to $39,999 | 9 (1.8%) | 32 (7.8%) |
| $40,000 to $44,999 | 33 (6.5%) | 28 (6.9%) |
| $45,000 to $49,999 | 36 (7.1%) | 24 (5.9%) |
| $50,000 to $54,999 | 100 (19.8%) | 29 (7.1%) |
| $55,000 to $64,999 | 53 (10.5%) | 21 (5.1%) |
| $65,000 to $74,999 | 35 (6.9%) | 16 (3.9%) |
| $75,000 to $99,999 | 8 (1.6%) | 18 (4.4%) |
| $100,000+ | 68 (13.4%) | 0 (0.0%) |
| Total | 506 (100.0%) | 408 (100.0%) |
Earnings by Sex by Educational Attainment in Lykens borough
Average earnings in Lykens borough are $51,023 for men and $30,694 for women, a difference of 39.8%. Men with an educational attainment of high school diploma enjoy the highest average annual earnings of $51,296, while those with college or associate's degree education earn the least with $46,397. Women with an educational attainment of college or associate's degree earn the most with the average annual earnings of $34,583, while those with less than high school education have the smallest earnings of $14,013.
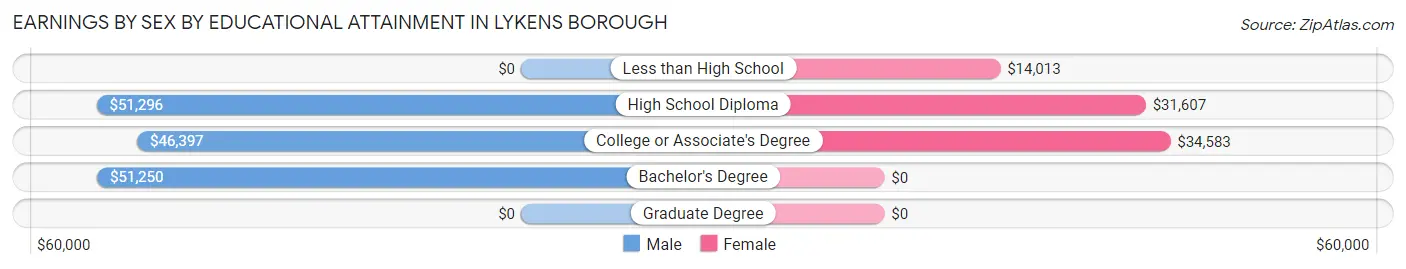
| Educational Attainment | Male Income | Female Income |
| Less than High School | - | - |
| High School Diploma | $51,296 | $31,607 |
| College or Associate's Degree | $46,397 | $34,583 |
| Bachelor's Degree | $51,250 | $0 |
| Graduate Degree | - | - |
| Total | $51,023 | $30,694 |
Family Income in Lykens borough
Family Income Brackets in Lykens borough
According to the Lykens borough family income data, there are 97 families falling into the $50,000 to $74,999 income range, which is the most common income bracket and makes up 24.9% of all families.
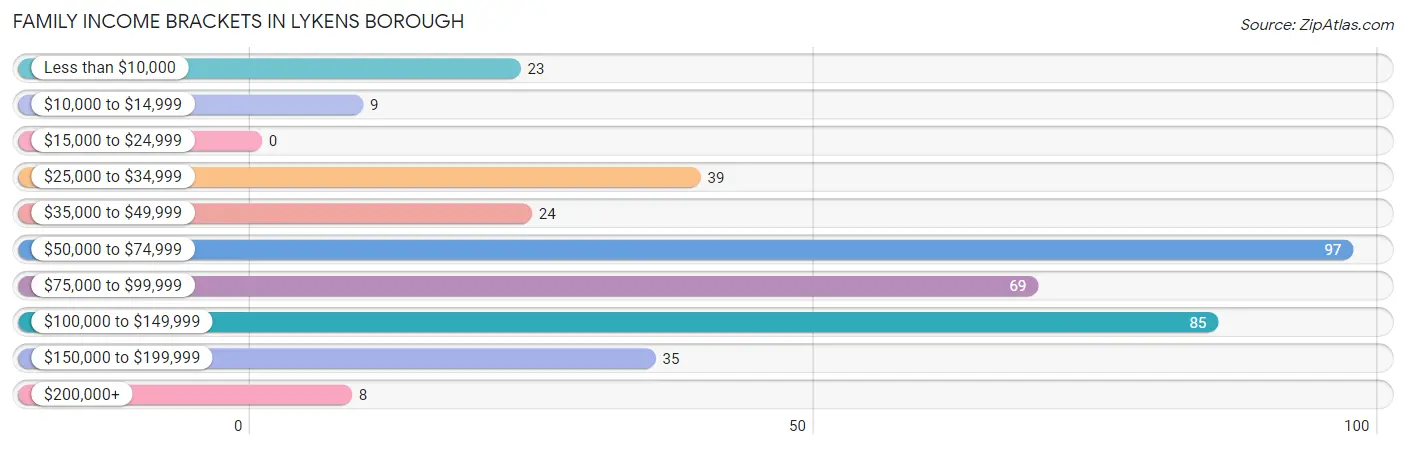
| Income Bracket | # Families | % Families |
| Less than $10,000 | 23 | 5.9% |
| $10,000 to $14,999 | 9 | 2.3% |
| $15,000 to $24,999 | 0 | 0.0% |
| $25,000 to $34,999 | 39 | 10.0% |
| $35,000 to $49,999 | 24 | 6.2% |
| $50,000 to $74,999 | 97 | 24.9% |
| $75,000 to $99,999 | 69 | 17.7% |
| $100,000 to $149,999 | 85 | 21.9% |
| $150,000 to $199,999 | 35 | 9.0% |
| $200,000+ | 8 | 2.1% |
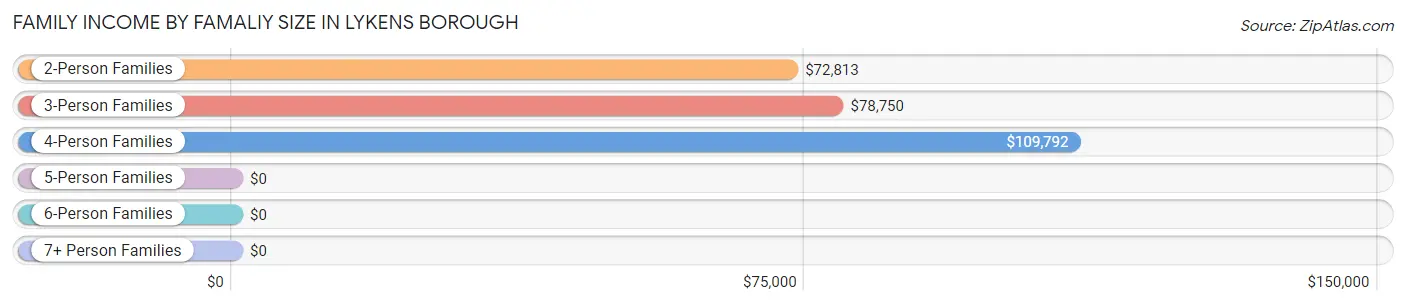
Family Income by Famaliy Size in Lykens borough
4-person families (39 | 10.0%) account for the highest median family income in Lykens borough with $109,792 per family, while 2-person families (202 | 51.9%) have the highest median income of $36,406 per family member.
| Income Bracket | # Families | Median Income |
| 2-Person Families | 202 (51.9%) | $72,813 |
| 3-Person Families | 111 (28.5%) | $78,750 |
| 4-Person Families | 39 (10.0%) | $109,792 |
| 5-Person Families | 37 (9.5%) | $0 |
| 6-Person Families | 0 (0.0%) | $0 |
| 7+ Person Families | 0 (0.0%) | $0 |
| Total | 389 (100.0%) | $78,021 |
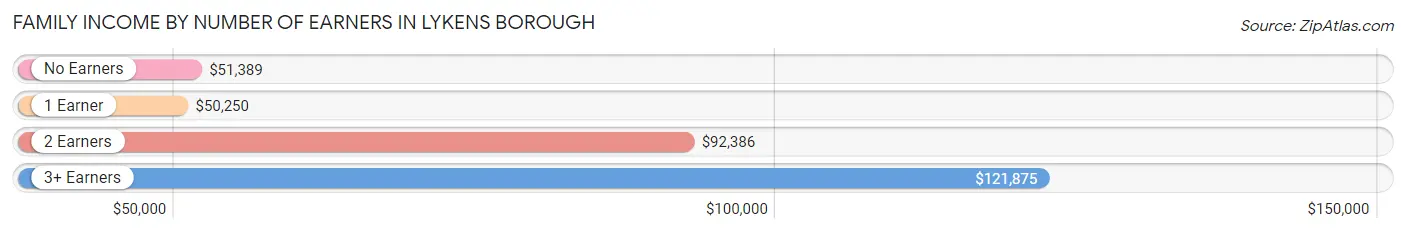
Family Income by Number of Earners in Lykens borough
The median family income in Lykens borough is $78,021, with families comprising 3+ earners (50) having the highest median family income of $121,875, while families with 1 earner (110) have the lowest median family income of $50,250, accounting for 12.9% and 28.3% of families, respectively.
| Number of Earners | # Families | Median Income |
| No Earners | 60 (15.4%) | $51,389 |
| 1 Earner | 110 (28.3%) | $50,250 |
| 2 Earners | 169 (43.4%) | $92,386 |
| 3+ Earners | 50 (12.9%) | $121,875 |
| Total | 389 (100.0%) | $78,021 |
Household Income in Lykens borough
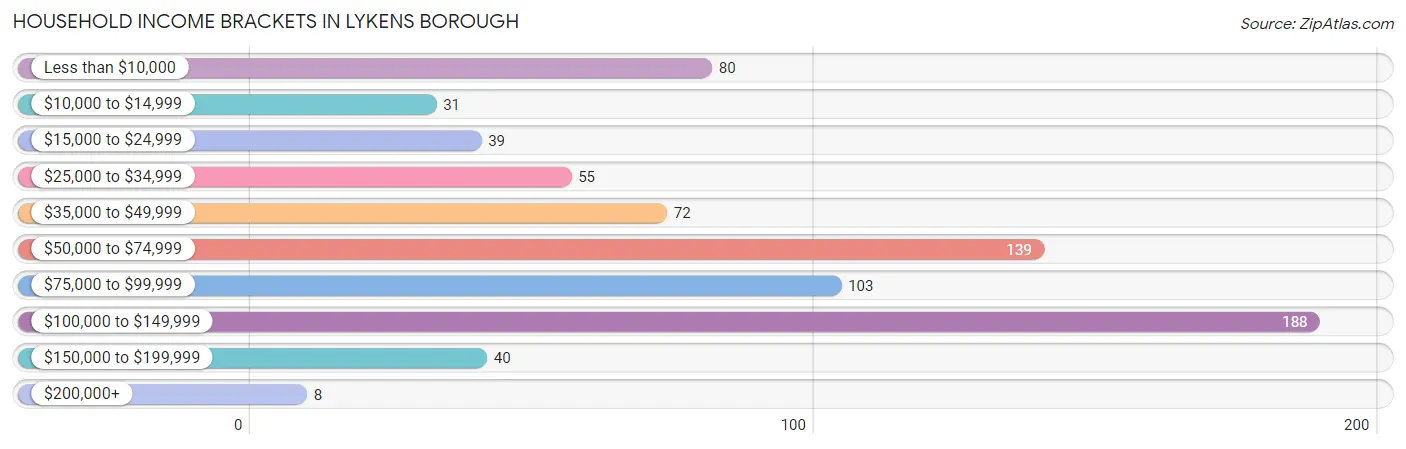
Household Income Brackets in Lykens borough
With 188 households falling in the category, the $100,000 to $149,999 income range is the most frequent in Lykens borough, accounting for 24.9% of all households. In contrast, only 8 households (1.1%) fall into the $200,000+ income bracket, making it the least populous group.
| Income Bracket | # Households | % Households |
| Less than $10,000 | 80 | 10.6% |
| $10,000 to $14,999 | 31 | 4.1% |
| $15,000 to $24,999 | 39 | 5.2% |
| $25,000 to $34,999 | 55 | 7.3% |
| $35,000 to $49,999 | 72 | 9.5% |
| $50,000 to $74,999 | 139 | 18.4% |
| $75,000 to $99,999 | 103 | 13.6% |
| $100,000 to $149,999 | 188 | 24.9% |
| $150,000 to $199,999 | 40 | 5.3% |
| $200,000+ | 8 | 1.1% |
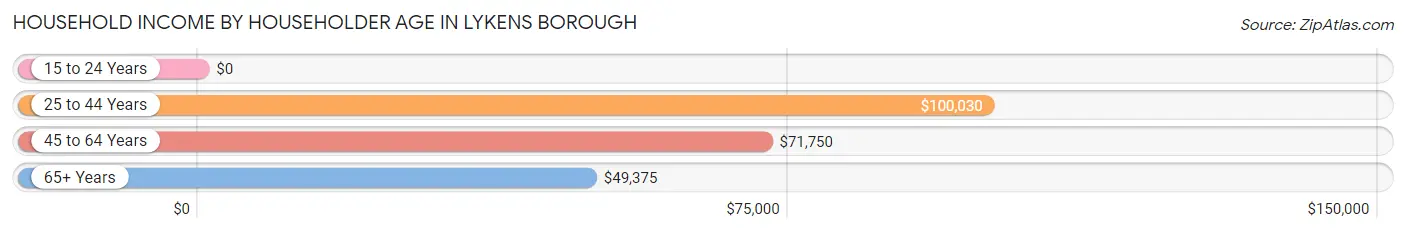
Household Income by Householder Age in Lykens borough
The median household income in Lykens borough is $67,768, with the highest median household income of $100,030 found in the 25 to 44 years age bracket for the primary householder. A total of 262 households (34.7%) fall into this category. Meanwhile, the 15 to 24 years age bracket for the primary householder has the lowest median household income of $0, with 46 households (6.1%) in this group.
| Income Bracket | # Households | Median Income |
| 15 to 24 Years | 46 (6.1%) | $0 |
| 25 to 44 Years | 262 (34.7%) | $100,030 |
| 45 to 64 Years | 255 (33.8%) | $71,750 |
| 65+ Years | 192 (25.4%) | $49,375 |
| Total | 755 (100.0%) | $67,768 |
Poverty in Lykens borough
Income Below Poverty by Sex and Age in Lykens borough
With 21.1% poverty level for males and 20.3% for females among the residents of Lykens borough, 12 to 14 year old males and under 5 year old females are the most vulnerable to poverty, with 10 males (100.0%) and 14 females (100.0%) in their respective age groups living below the poverty level.
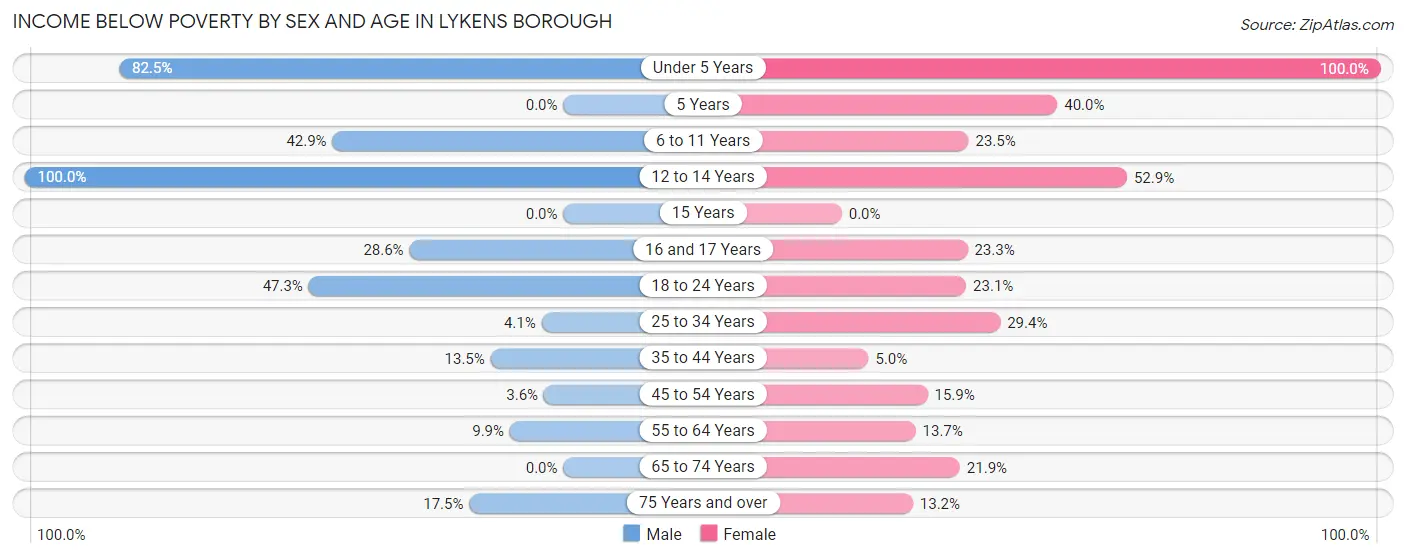
| Age Bracket | Male | Female |
| Under 5 Years | 47 (82.5%) | 14 (100.0%) |
| 5 Years | 0 (0.0%) | 6 (40.0%) |
| 6 to 11 Years | 36 (42.9%) | 12 (23.5%) |
| 12 to 14 Years | 10 (100.0%) | 18 (52.9%) |
| 15 Years | 0 (0.0%) | 0 (0.0%) |
| 16 and 17 Years | 4 (28.6%) | 7 (23.3%) |
| 18 to 24 Years | 26 (47.3%) | 12 (23.1%) |
| 25 to 34 Years | 3 (4.1%) | 20 (29.4%) |
| 35 to 44 Years | 32 (13.5%) | 6 (5.0%) |
| 45 to 54 Years | 3 (3.6%) | 7 (15.9%) |
| 55 to 64 Years | 14 (9.9%) | 20 (13.7%) |
| 65 to 74 Years | 0 (0.0%) | 16 (21.9%) |
| 75 Years and over | 11 (17.5%) | 12 (13.2%) |
| Total | 186 (21.1%) | 150 (20.3%) |
Income Above Poverty by Sex and Age in Lykens borough
According to the poverty statistics in Lykens borough, males aged 5 years and females aged 35 to 44 years are the age groups that are most secure financially, with 100.0% of males and 95.0% of females in these age groups living above the poverty line.
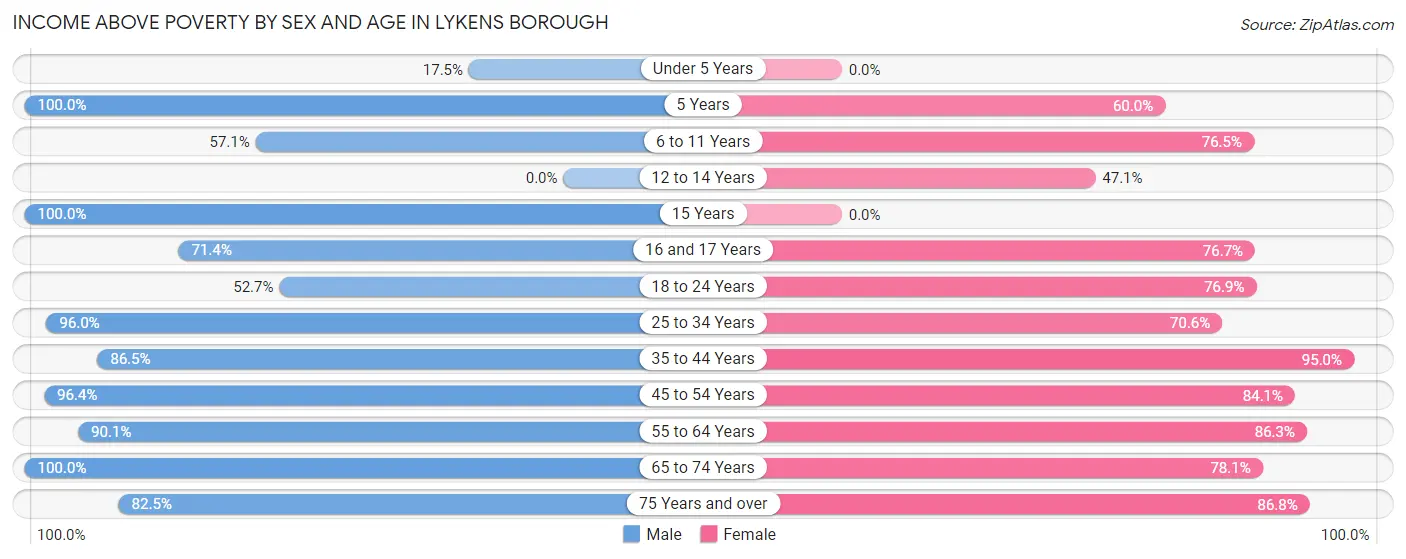
| Age Bracket | Male | Female |
| Under 5 Years | 10 (17.5%) | 0 (0.0%) |
| 5 Years | 5 (100.0%) | 9 (60.0%) |
| 6 to 11 Years | 48 (57.1%) | 39 (76.5%) |
| 12 to 14 Years | 0 (0.0%) | 16 (47.1%) |
| 15 Years | 15 (100.0%) | 0 (0.0%) |
| 16 and 17 Years | 10 (71.4%) | 23 (76.7%) |
| 18 to 24 Years | 29 (52.7%) | 40 (76.9%) |
| 25 to 34 Years | 71 (96.0%) | 48 (70.6%) |
| 35 to 44 Years | 205 (86.5%) | 115 (95.0%) |
| 45 to 54 Years | 80 (96.4%) | 37 (84.1%) |
| 55 to 64 Years | 127 (90.1%) | 126 (86.3%) |
| 65 to 74 Years | 44 (100.0%) | 57 (78.1%) |
| 75 Years and over | 52 (82.5%) | 79 (86.8%) |
| Total | 696 (78.9%) | 589 (79.7%) |
Income Below Poverty Among Married-Couple Families in Lykens borough
The poverty statistics for married-couple families in Lykens borough show that 7.3% or 20 of the total 274 families live below the poverty line. Families with 3 or 4 children have the highest poverty rate of 46.7%, comprising of 14 families. On the other hand, families with 1 or 2 children have the lowest poverty rate of 0.0%, which includes 0 families.
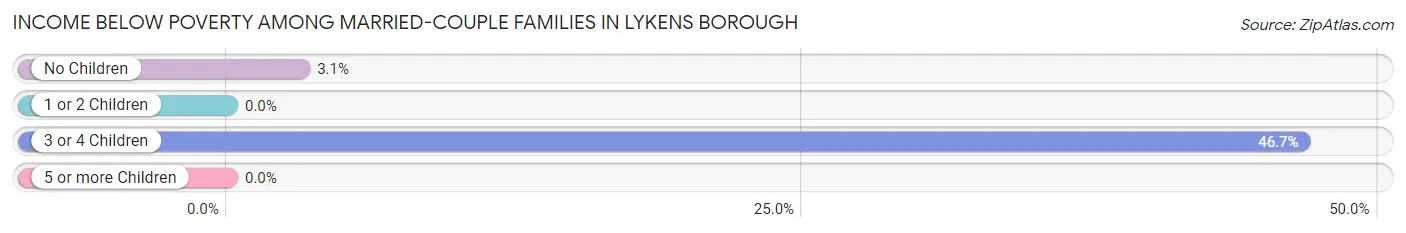
| Children | Above Poverty | Below Poverty |
| No Children | 185 (96.9%) | 6 (3.1%) |
| 1 or 2 Children | 53 (100.0%) | 0 (0.0%) |
| 3 or 4 Children | 16 (53.3%) | 14 (46.7%) |
| 5 or more Children | 0 (0.0%) | 0 (0.0%) |
| Total | 254 (92.7%) | 20 (7.3%) |
Income Below Poverty Among Single-Parent Households in Lykens borough
According to the poverty data in Lykens borough, 6.4% or 4 single-father households and 42.3% or 22 single-mother households are living below the poverty line. Among single-father households, those with 1 or 2 children have the highest poverty rate, with 4 households (11.8%) experiencing poverty. Likewise, among single-mother households, those with 3 or 4 children have the highest poverty rate, with 7 households (100.0%) falling below the poverty line.
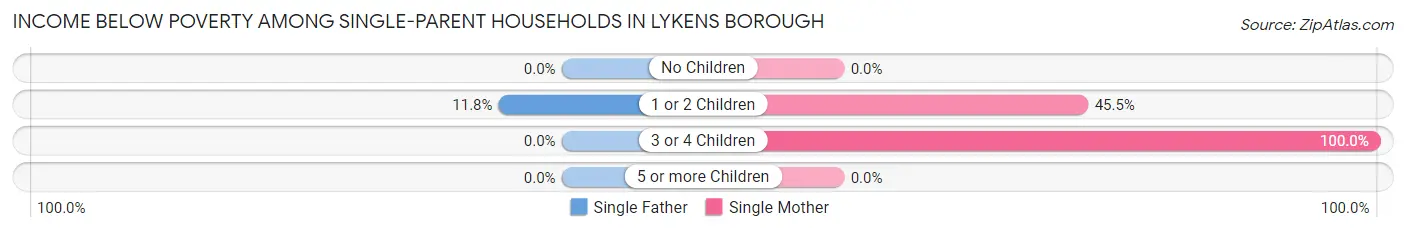
| Children | Single Father | Single Mother |
| No Children | 0 (0.0%) | 0 (0.0%) |
| 1 or 2 Children | 4 (11.8%) | 15 (45.5%) |
| 3 or 4 Children | 0 (0.0%) | 7 (100.0%) |
| 5 or more Children | 0 (0.0%) | 0 (0.0%) |
| Total | 4 (6.4%) | 22 (42.3%) |
Income Below Poverty Among Married-Couple vs Single-Parent Households in Lykens borough
The poverty data for Lykens borough shows that 20 of the married-couple family households (7.3%) and 26 of the single-parent households (22.6%) are living below the poverty level. Within the married-couple family households, those with 3 or 4 children have the highest poverty rate, with 14 households (46.7%) falling below the poverty line. Among the single-parent households, those with 3 or 4 children have the highest poverty rate, with 7 household (100.0%) living below poverty.
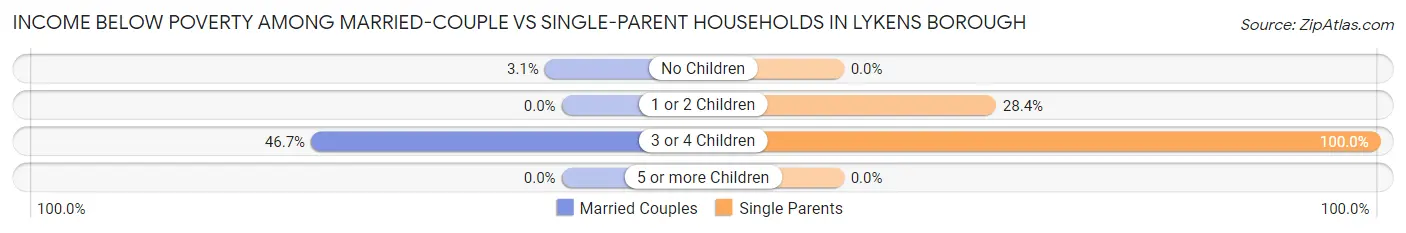
| Children | Married-Couple Families | Single-Parent Households |
| No Children | 6 (3.1%) | 0 (0.0%) |
| 1 or 2 Children | 0 (0.0%) | 19 (28.4%) |
| 3 or 4 Children | 14 (46.7%) | 7 (100.0%) |
| 5 or more Children | 0 (0.0%) | 0 (0.0%) |
| Total | 20 (7.3%) | 26 (22.6%) |
Race in Lykens borough
The most populous races in Lykens borough are White / Caucasian (1,351 | 82.8%), Two or more Races (204 | 12.5%), and Asian (56 | 3.4%).
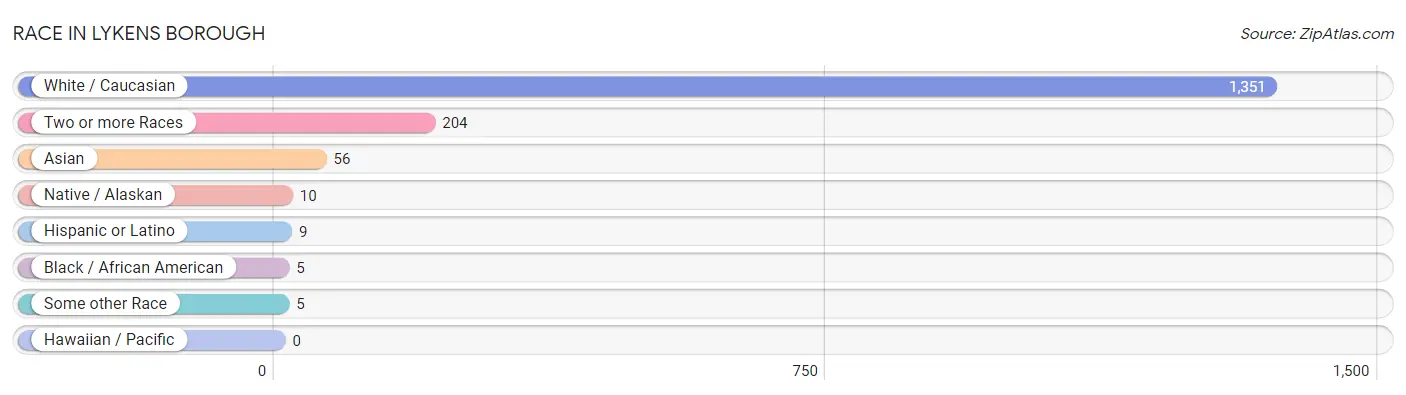
| Race | # Population | % Population |
| Asian | 56 | 3.4% |
| Black / African American | 5 | 0.3% |
| Hawaiian / Pacific | 0 | 0.0% |
| Hispanic or Latino | 9 | 0.5% |
| Native / Alaskan | 10 | 0.6% |
| White / Caucasian | 1,351 | 82.8% |
| Two or more Races | 204 | 12.5% |
| Some other Race | 5 | 0.3% |
| Total | 1,631 | 100.0% |
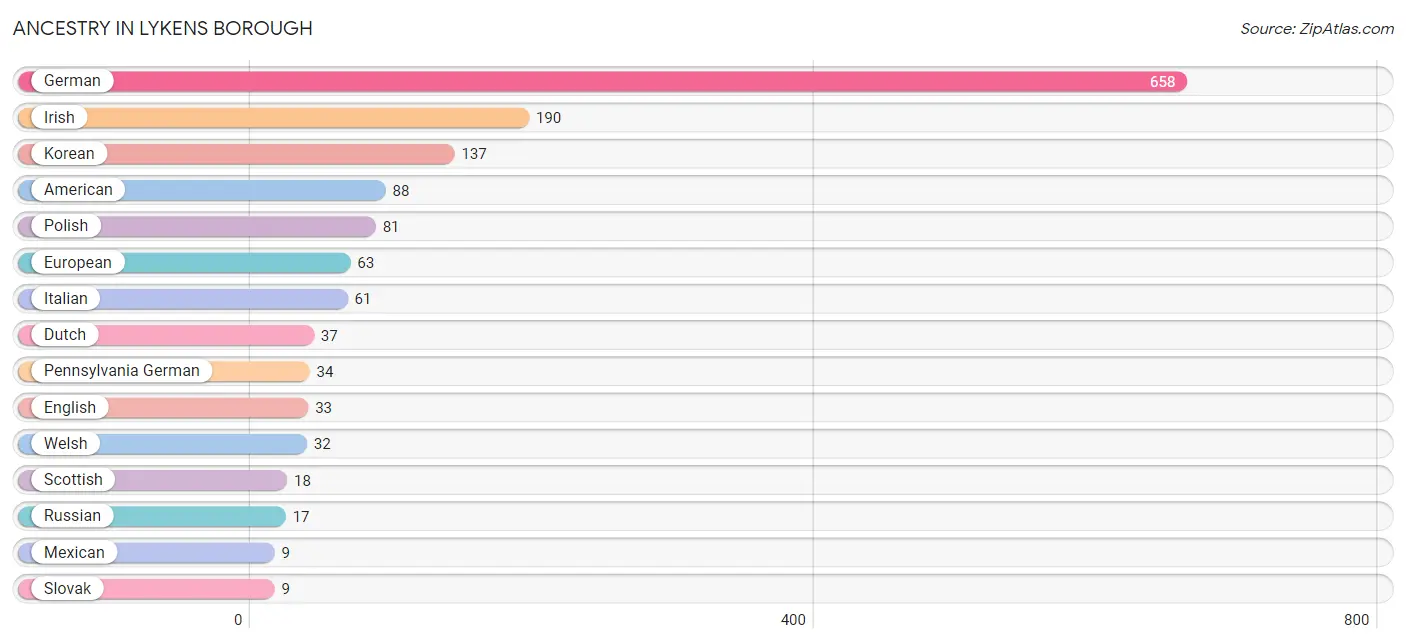
Ancestry in Lykens borough
The most populous ancestries reported in Lykens borough are German (658 | 40.3%), Irish (190 | 11.7%), Korean (137 | 8.4%), American (88 | 5.4%), and Polish (81 | 5.0%), together accounting for 70.8% of all Lykens borough residents.
| Ancestry | # Population | % Population |
| American | 88 | 5.4% |
| British | 3 | 0.2% |
| Czech | 6 | 0.4% |
| Dutch | 37 | 2.3% |
| Eastern European | 7 | 0.4% |
| English | 33 | 2.0% |
| European | 63 | 3.9% |
| German | 658 | 40.3% |
| Irish | 190 | 11.7% |
| Italian | 61 | 3.7% |
| Korean | 137 | 8.4% |
| Latvian | 4 | 0.3% |
| Lithuanian | 4 | 0.3% |
| Mexican | 9 | 0.5% |
| Northern European | 4 | 0.3% |
| Pennsylvania German | 34 | 2.1% |
| Polish | 81 | 5.0% |
| Russian | 17 | 1.0% |
| Scottish | 18 | 1.1% |
| Slovak | 9 | 0.5% |
| Swiss | 6 | 0.4% |
| Ukrainian | 3 | 0.2% |
| Welsh | 32 | 2.0% | View All 23 Rows |
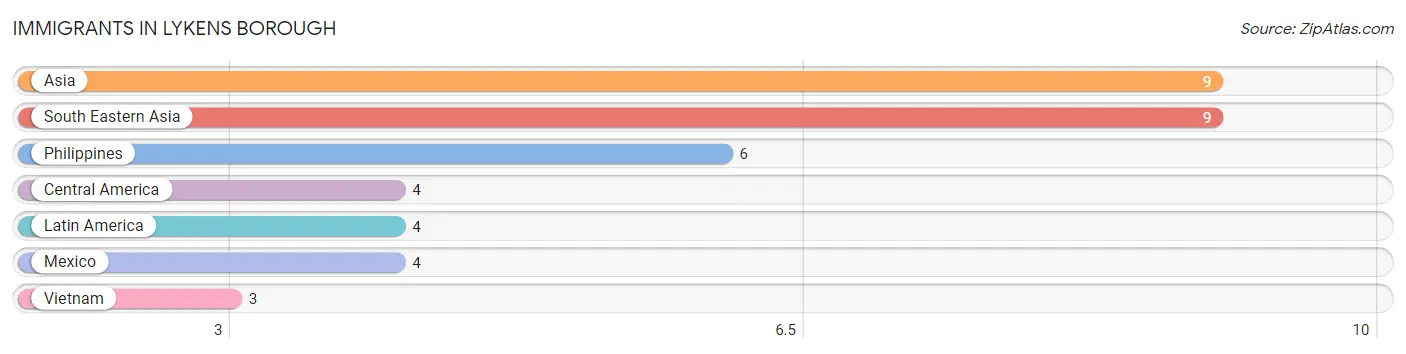
Immigrants in Lykens borough
The most numerous immigrant groups reported in Lykens borough came from Asia (9 | 0.5%), South Eastern Asia (9 | 0.5%), Philippines (6 | 0.4%), Central America (4 | 0.3%), and Latin America (4 | 0.3%), together accounting for 2.0% of all Lykens borough residents.
| Immigration Origin | # Population | % Population |
| Asia | 9 | 0.5% |
| Central America | 4 | 0.3% |
| Latin America | 4 | 0.3% |
| Mexico | 4 | 0.3% |
| Philippines | 6 | 0.4% |
| South Eastern Asia | 9 | 0.5% |
| Vietnam | 3 | 0.2% | View All 7 Rows |
Sex and Age in Lykens borough
Sex and Age in Lykens borough
The most populous age groups in Lykens borough are 40 to 44 Years (150 | 16.9%) for men and 60 to 64 Years (103 | 13.8%) for women.
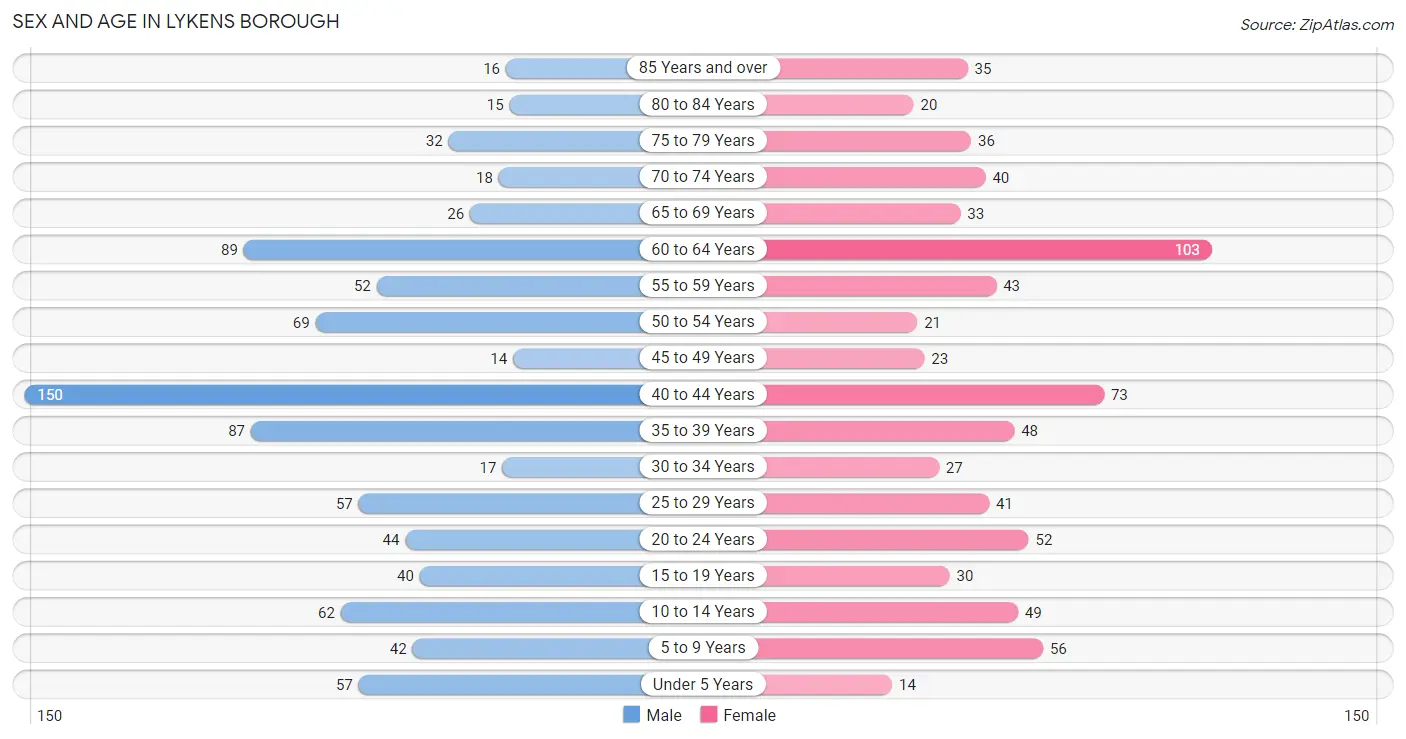
| Age Bracket | Male | Female |
| Under 5 Years | 57 (6.4%) | 14 (1.9%) |
| 5 to 9 Years | 42 (4.7%) | 56 (7.5%) |
| 10 to 14 Years | 62 (7.0%) | 49 (6.6%) |
| 15 to 19 Years | 40 (4.5%) | 30 (4.0%) |
| 20 to 24 Years | 44 (5.0%) | 52 (7.0%) |
| 25 to 29 Years | 57 (6.4%) | 41 (5.5%) |
| 30 to 34 Years | 17 (1.9%) | 27 (3.6%) |
| 35 to 39 Years | 87 (9.8%) | 48 (6.5%) |
| 40 to 44 Years | 150 (16.9%) | 73 (9.8%) |
| 45 to 49 Years | 14 (1.6%) | 23 (3.1%) |
| 50 to 54 Years | 69 (7.8%) | 21 (2.8%) |
| 55 to 59 Years | 52 (5.9%) | 43 (5.8%) |
| 60 to 64 Years | 89 (10.0%) | 103 (13.8%) |
| 65 to 69 Years | 26 (2.9%) | 33 (4.4%) |
| 70 to 74 Years | 18 (2.0%) | 40 (5.4%) |
| 75 to 79 Years | 32 (3.6%) | 36 (4.8%) |
| 80 to 84 Years | 15 (1.7%) | 20 (2.7%) |
| 85 Years and over | 16 (1.8%) | 35 (4.7%) |
| Total | 887 (100.0%) | 744 (100.0%) |
Families and Households in Lykens borough
Median Family Size in Lykens borough
The median family size in Lykens borough is 2.99 persons per family, with single female/mother families (52 | 13.4%) accounting for the largest median family size of 3.65 persons per family. On the other hand, single male/father families (63 | 16.2%) represent the smallest median family size with 2.29 persons per family.
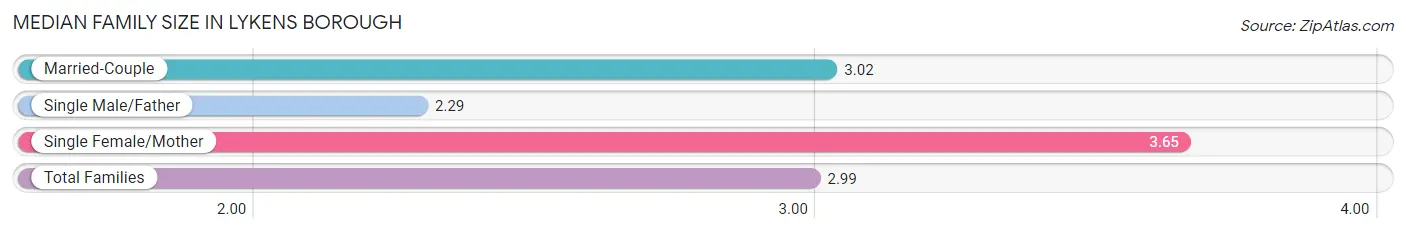
| Family Type | # Families | Family Size |
| Married-Couple | 274 (70.4%) | 3.02 |
| Single Male/Father | 63 (16.2%) | 2.29 |
| Single Female/Mother | 52 (13.4%) | 3.65 |
| Total Families | 389 (100.0%) | 2.99 |
Median Household Size in Lykens borough
The median household size in Lykens borough is 2.16 persons per household, with single female/mother households (52 | 6.9%) accounting for the largest median household size of 4.08 persons per household. non-family households (366 | 48.5%) represent the smallest median household size with 1.21 persons per household.
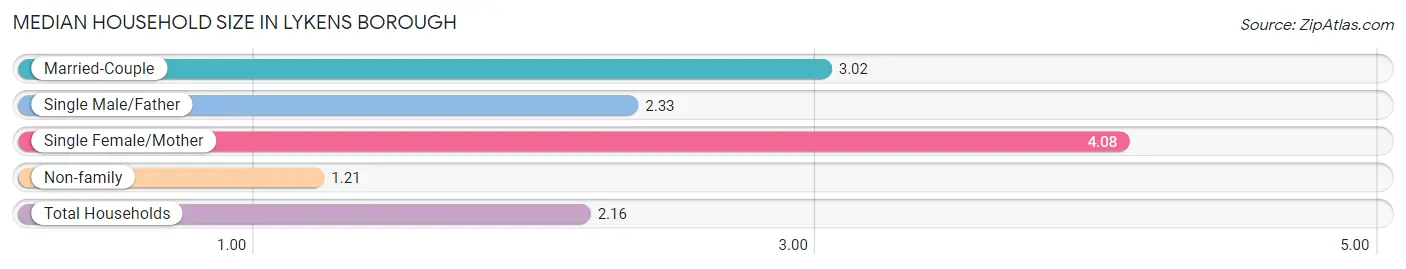
| Household Type | # Households | Household Size |
| Married-Couple | 274 (36.3%) | 3.02 |
| Single Male/Father | 63 (8.3%) | 2.33 |
| Single Female/Mother | 52 (6.9%) | 4.08 |
| Non-family | 366 (48.5%) | 1.21 |
| Total Households | 755 (100.0%) | 2.16 |
Household Size by Marriage Status in Lykens borough
Out of a total of 755 households in Lykens borough, 389 (51.5%) are family households, while 366 (48.5%) are nonfamily households. The most numerous type of family households are 2-person households, comprising 193, and the most common type of nonfamily households are 1-person households, comprising 254.
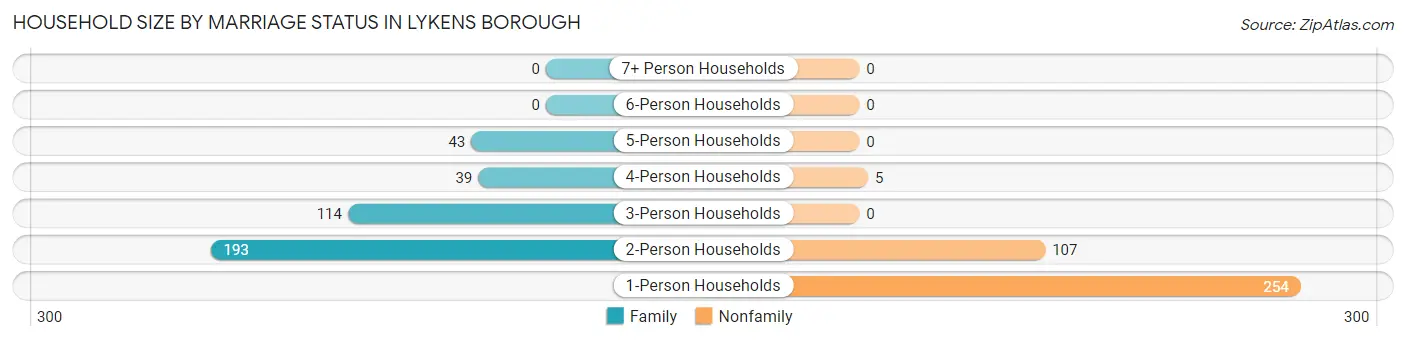
| Household Size | Family Households | Nonfamily Households |
| 1-Person Households | - | 254 (33.6%) |
| 2-Person Households | 193 (25.6%) | 107 (14.2%) |
| 3-Person Households | 114 (15.1%) | 0 (0.0%) |
| 4-Person Households | 39 (5.2%) | 5 (0.7%) |
| 5-Person Households | 43 (5.7%) | 0 (0.0%) |
| 6-Person Households | 0 (0.0%) | 0 (0.0%) |
| 7+ Person Households | 0 (0.0%) | 0 (0.0%) |
| Total | 389 (51.5%) | 366 (48.5%) |
Female Fertility in Lykens borough
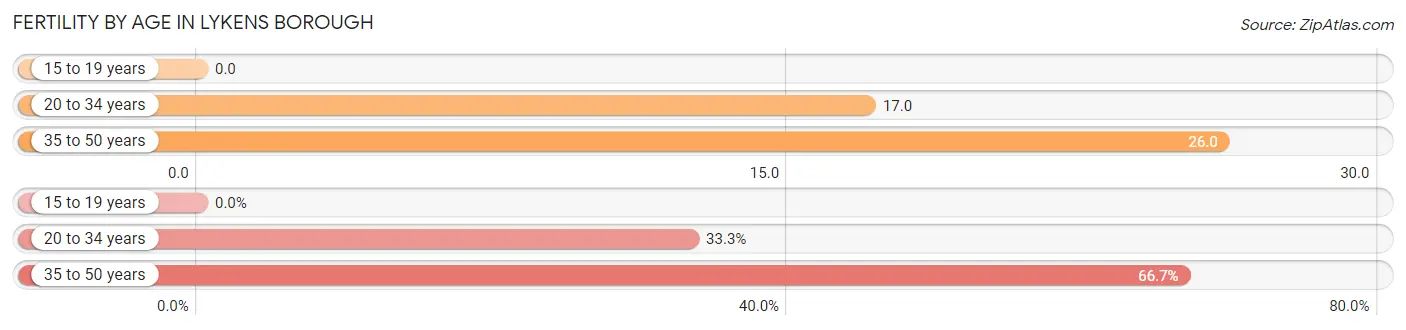
Fertility by Age in Lykens borough
Average fertility rate in Lykens borough is 20.0 births per 1,000 women. Women in the age bracket of 35 to 50 years have the highest fertility rate with 26.0 births per 1,000 women. Women in the age bracket of 35 to 50 years acount for 66.7% of all women with births.
| Age Bracket | Women with Births | Births / 1,000 Women |
| 15 to 19 years | 0 (0.0%) | 0.0 |
| 20 to 34 years | 2 (33.3%) | 17.0 |
| 35 to 50 years | 4 (66.7%) | 26.0 |
| Total | 6 (100.0%) | 20.0 |
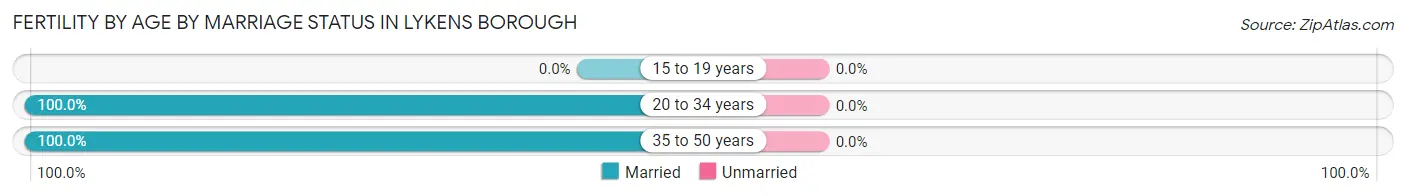
Fertility by Age by Marriage Status in Lykens borough
| Age Bracket | Married | Unmarried |
| 15 to 19 years | 0 (0.0%) | 0 (0.0%) |
| 20 to 34 years | 2 (100.0%) | 0 (0.0%) |
| 35 to 50 years | 4 (100.0%) | 0 (0.0%) |
| Total | 6 (100.0%) | 0 (0.0%) |
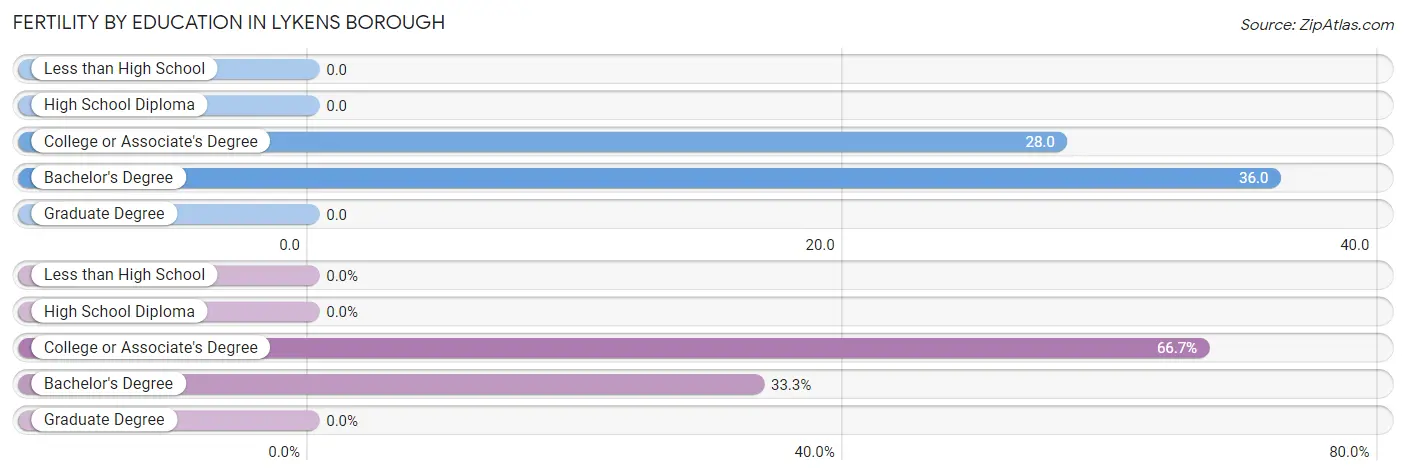
Fertility by Education in Lykens borough
| Educational Attainment | Women with Births | Births / 1,000 Women |
| Less than High School | 0 (0.0%) | 0.0 |
| High School Diploma | 0 (0.0%) | 0.0 |
| College or Associate's Degree | 4 (66.7%) | 28.0 |
| Bachelor's Degree | 2 (33.3%) | 36.0 |
| Graduate Degree | 0 (0.0%) | 0.0 |
| Total | 6 (100.0%) | 20.0 |
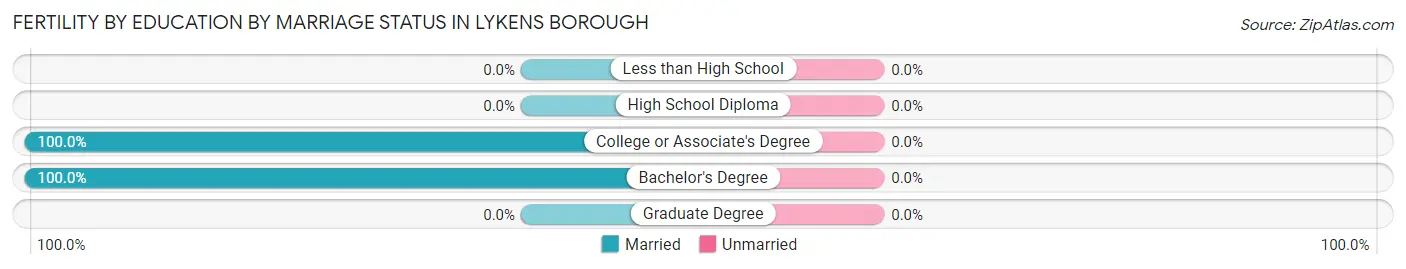
Fertility by Education by Marriage Status in Lykens borough
| Educational Attainment | Married | Unmarried |
| Less than High School | 0 (0.0%) | 0 (0.0%) |
| High School Diploma | 0 (0.0%) | 0 (0.0%) |
| College or Associate's Degree | 4 (100.0%) | 0 (0.0%) |
| Bachelor's Degree | 2 (100.0%) | 0 (0.0%) |
| Graduate Degree | 0 (0.0%) | 0 (0.0%) |
| Total | 6 (100.0%) | 0 (0.0%) |
Employment Characteristics in Lykens borough
Employment by Class of Employer in Lykens borough
Among the 786 employed individuals in Lykens borough, private company employees (504 | 64.1%), not-for-profit organizations (66 | 8.4%), and federal government employees (58 | 7.4%) make up the most common classes of employment.
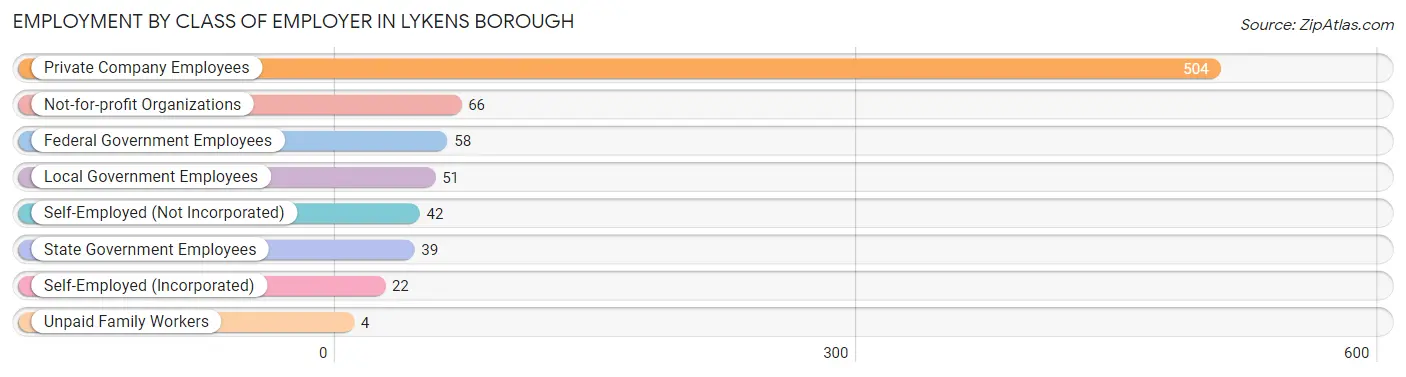
| Employer Class | # Employees | % Employees |
| Private Company Employees | 504 | 64.1% |
| Self-Employed (Incorporated) | 22 | 2.8% |
| Self-Employed (Not Incorporated) | 42 | 5.3% |
| Not-for-profit Organizations | 66 | 8.4% |
| Local Government Employees | 51 | 6.5% |
| State Government Employees | 39 | 5.0% |
| Federal Government Employees | 58 | 7.4% |
| Unpaid Family Workers | 4 | 0.5% |
| Total | 786 | 100.0% |
Employment Status by Age in Lykens borough
According to the labor force statistics for Lykens borough, out of the total population over 16 years of age (1,336), 62.8% or 839 individuals are in the labor force, with 5.2% or 44 of them unemployed. The age group with the highest labor force participation rate is 25 to 29 years, with 100.0% or 98 individuals in the labor force. Within the labor force, the 20 to 24 years age range has the highest percentage of unemployed individuals, with 35.2% or 31 of them being unemployed.
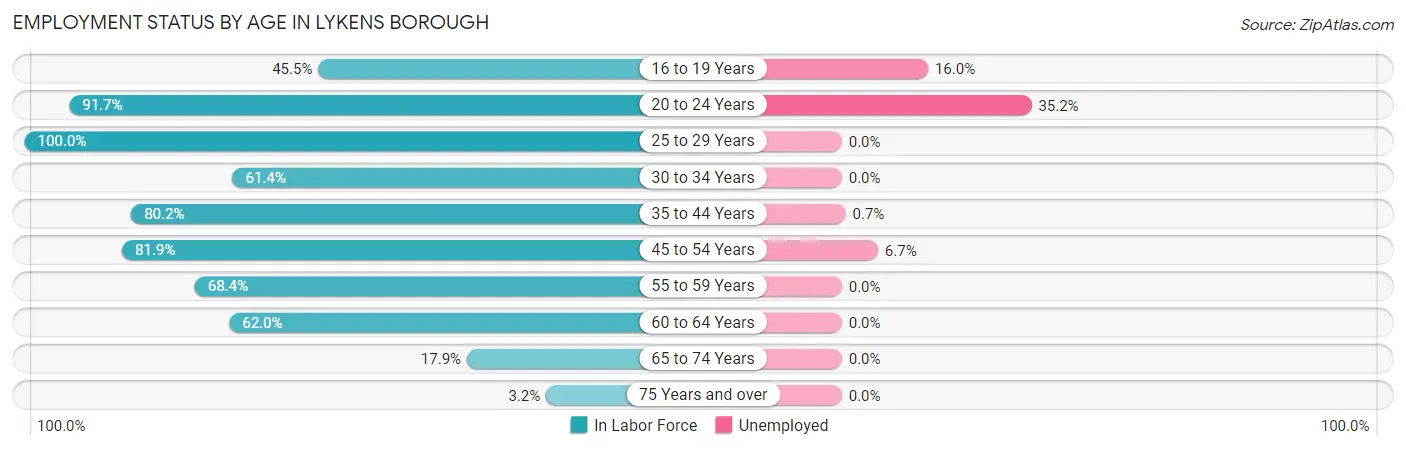
| Age Bracket | In Labor Force | Unemployed |
| 16 to 19 Years | 25 (45.5%) | 4 (16.0%) |
| 20 to 24 Years | 88 (91.7%) | 31 (35.2%) |
| 25 to 29 Years | 98 (100.0%) | 0 (0.0%) |
| 30 to 34 Years | 27 (61.4%) | 0 (0.0%) |
| 35 to 44 Years | 287 (80.2%) | 2 (0.7%) |
| 45 to 54 Years | 104 (81.9%) | 7 (6.7%) |
| 55 to 59 Years | 65 (68.4%) | 0 (0.0%) |
| 60 to 64 Years | 119 (62.0%) | 0 (0.0%) |
| 65 to 74 Years | 21 (17.9%) | 0 (0.0%) |
| 75 Years and over | 5 (3.2%) | 0 (0.0%) |
| Total | 839 (62.8%) | 44 (5.2%) |
Employment Status by Educational Attainment in Lykens borough
According to labor force statistics for Lykens borough, 76.6% of individuals (700) out of the total population between 25 and 64 years of age (914) are in the labor force, with 1.3% or 9 of them being unemployed. The group with the highest labor force participation rate are those with the educational attainment of bachelor's degree or higher, with 95.8% or 113 individuals in the labor force. Within the labor force, individuals with less than high school education have the highest percentage of unemployment, with 11.1% or 7 of them being unemployed.
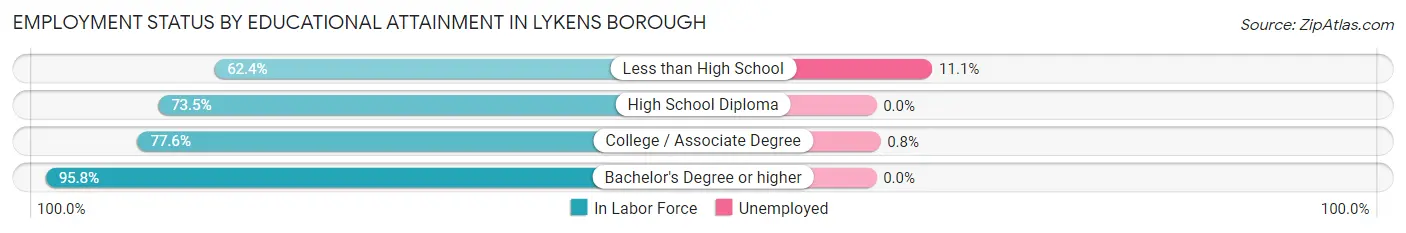
| Educational Attainment | In Labor Force | Unemployed |
| Less than High School | 63 (62.4%) | 11 (11.1%) |
| High School Diploma | 278 (73.5%) | 0 (0.0%) |
| College / Associate Degree | 246 (77.6%) | 3 (0.8%) |
| Bachelor's Degree or higher | 113 (95.8%) | 0 (0.0%) |
| Total | 700 (76.6%) | 12 (1.3%) |
Employment Occupations by Sex in Lykens borough
Management, Business, Science and Arts Occupations
The most common Management, Business, Science and Arts occupations in Lykens borough are Computers, Engineering & Science (72 | 9.1%), Computers & Mathematics (59 | 7.4%), Health Diagnosing & Treating (53 | 6.7%), Community & Social Service (41 | 5.2%), and Business & Financial (32 | 4.0%).
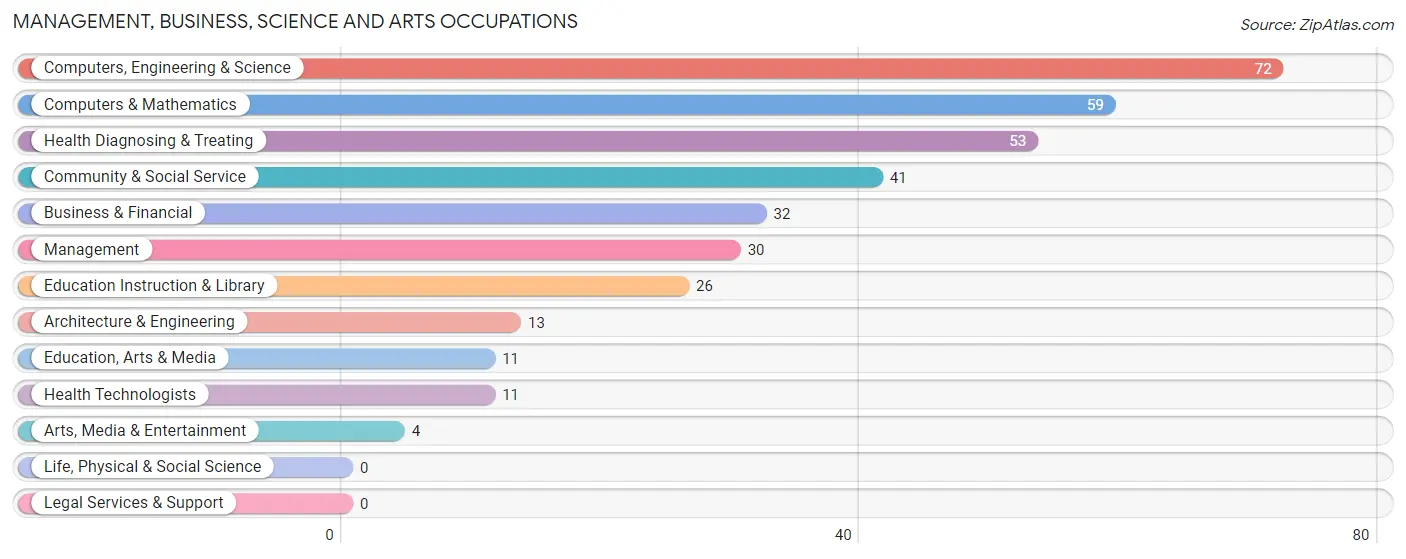
Management, Business, Science and Arts Occupations by Sex
Within the Management, Business, Science and Arts occupations in Lykens borough, the most male-oriented occupations are Arts, Media & Entertainment (100.0%), Computers & Mathematics (88.1%), and Computers, Engineering & Science (81.9%), while the most female-oriented occupations are Education, Arts & Media (100.0%), Education Instruction & Library (100.0%), and Health Technologists (100.0%).
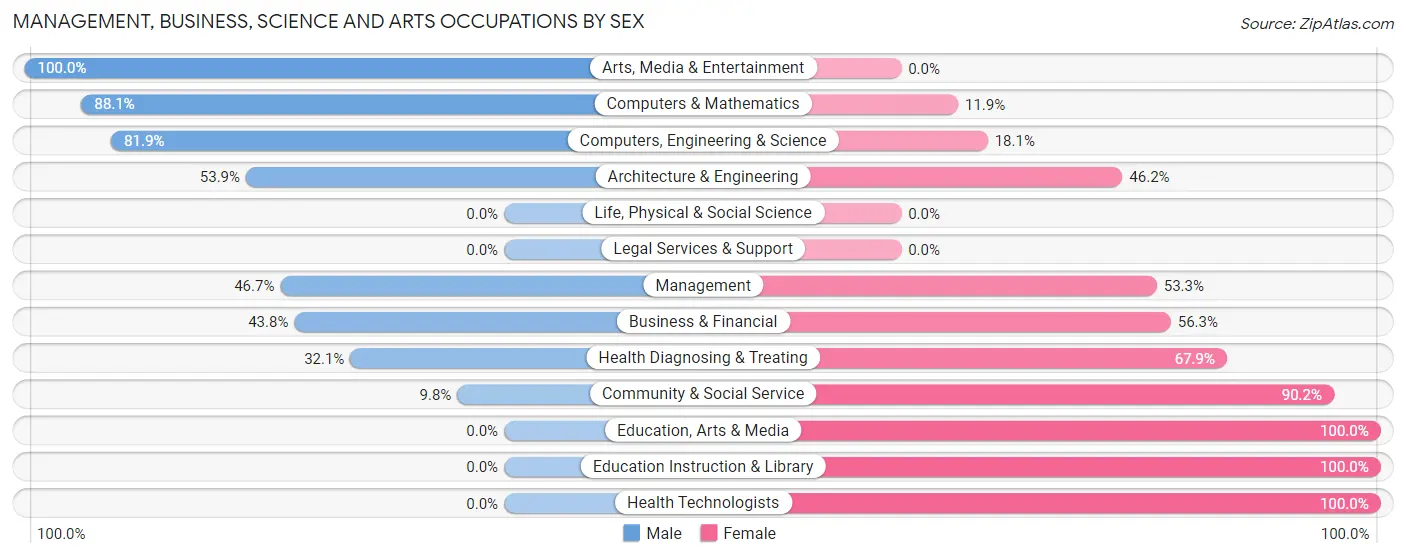
| Occupation | Male | Female |
| Management | 14 (46.7%) | 16 (53.3%) |
| Business & Financial | 14 (43.8%) | 18 (56.2%) |
| Computers, Engineering & Science | 59 (81.9%) | 13 (18.1%) |
| Computers & Mathematics | 52 (88.1%) | 7 (11.9%) |
| Architecture & Engineering | 7 (53.8%) | 6 (46.2%) |
| Life, Physical & Social Science | 0 (0.0%) | 0 (0.0%) |
| Community & Social Service | 4 (9.8%) | 37 (90.2%) |
| Education, Arts & Media | 0 (0.0%) | 11 (100.0%) |
| Legal Services & Support | 0 (0.0%) | 0 (0.0%) |
| Education Instruction & Library | 0 (0.0%) | 26 (100.0%) |
| Arts, Media & Entertainment | 4 (100.0%) | 0 (0.0%) |
| Health Diagnosing & Treating | 17 (32.1%) | 36 (67.9%) |
| Health Technologists | 0 (0.0%) | 11 (100.0%) |
| Total (Category) | 108 (47.4%) | 120 (52.6%) |
| Total (Overall) | 454 (57.1%) | 341 (42.9%) |
Services Occupations
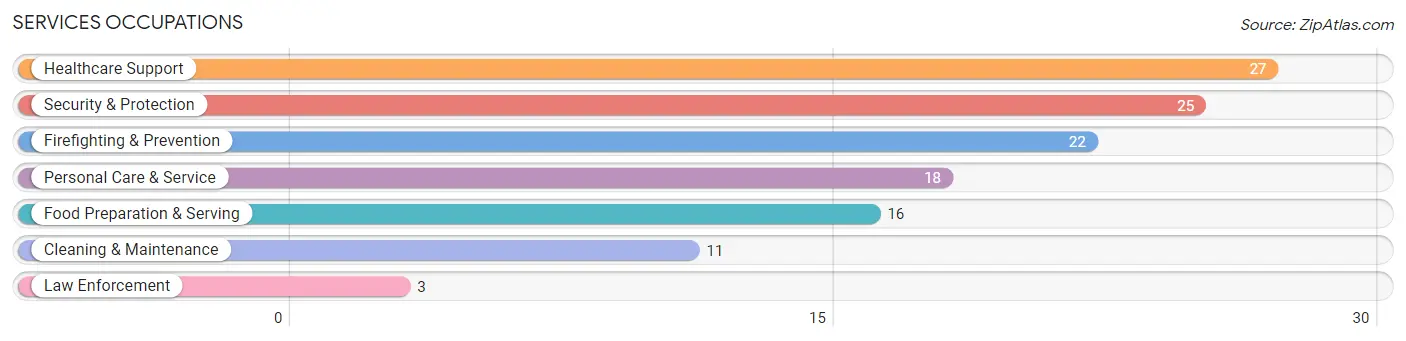
The most common Services occupations in Lykens borough are Healthcare Support (27 | 3.4%), Security & Protection (25 | 3.1%), Firefighting & Prevention (22 | 2.8%), Personal Care & Service (18 | 2.3%), and Food Preparation & Serving (16 | 2.0%).
Services Occupations by Sex
Within the Services occupations in Lykens borough, the most male-oriented occupations are Food Preparation & Serving (56.2%), Cleaning & Maintenance (54.5%), and Healthcare Support (18.5%), while the most female-oriented occupations are Security & Protection (100.0%), Firefighting & Prevention (100.0%), and Law Enforcement (100.0%).
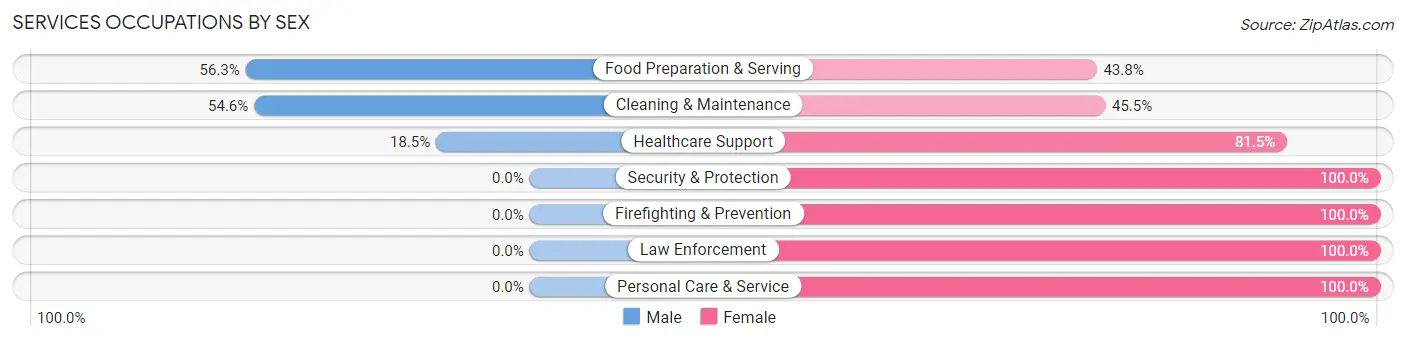
| Occupation | Male | Female |
| Healthcare Support | 5 (18.5%) | 22 (81.5%) |
| Security & Protection | 0 (0.0%) | 25 (100.0%) |
| Firefighting & Prevention | 0 (0.0%) | 22 (100.0%) |
| Law Enforcement | 0 (0.0%) | 3 (100.0%) |
| Food Preparation & Serving | 9 (56.2%) | 7 (43.8%) |
| Cleaning & Maintenance | 6 (54.5%) | 5 (45.5%) |
| Personal Care & Service | 0 (0.0%) | 18 (100.0%) |
| Total (Category) | 20 (20.6%) | 77 (79.4%) |
| Total (Overall) | 454 (57.1%) | 341 (42.9%) |
Sales and Office Occupations
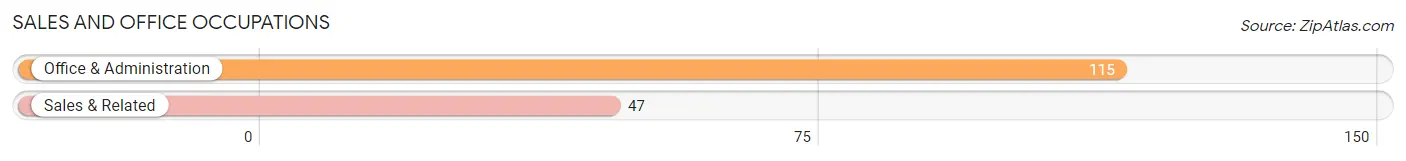
The most common Sales and Office occupations in Lykens borough are Office & Administration (115 | 14.5%), and Sales & Related (47 | 5.9%).
Sales and Office Occupations by Sex
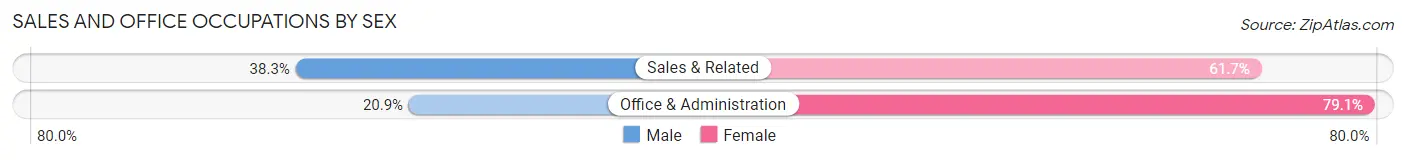
| Occupation | Male | Female |
| Sales & Related | 18 (38.3%) | 29 (61.7%) |
| Office & Administration | 24 (20.9%) | 91 (79.1%) |
| Total (Category) | 42 (25.9%) | 120 (74.1%) |
| Total (Overall) | 454 (57.1%) | 341 (42.9%) |
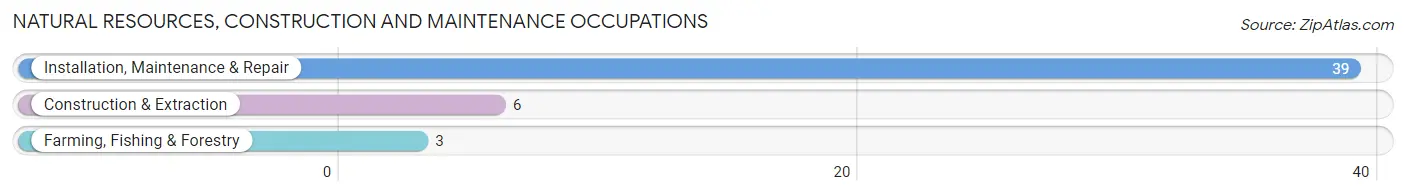
Natural Resources, Construction and Maintenance Occupations
The most common Natural Resources, Construction and Maintenance occupations in Lykens borough are Installation, Maintenance & Repair (39 | 4.9%), Construction & Extraction (6 | 0.7%), and Farming, Fishing & Forestry (3 | 0.4%).
Natural Resources, Construction and Maintenance Occupations by Sex
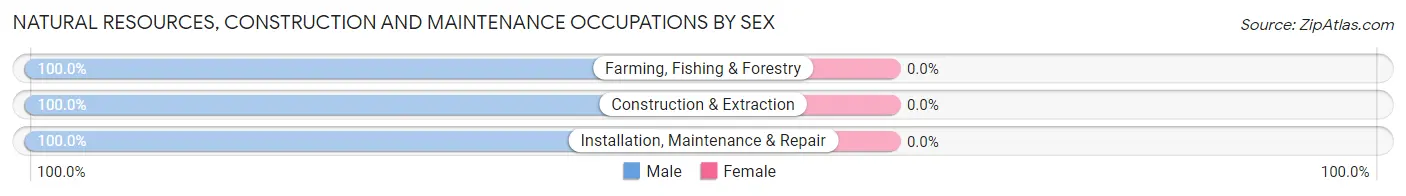
| Occupation | Male | Female |
| Farming, Fishing & Forestry | 3 (100.0%) | 0 (0.0%) |
| Construction & Extraction | 6 (100.0%) | 0 (0.0%) |
| Installation, Maintenance & Repair | 39 (100.0%) | 0 (0.0%) |
| Total (Category) | 48 (100.0%) | 0 (0.0%) |
| Total (Overall) | 454 (57.1%) | 341 (42.9%) |
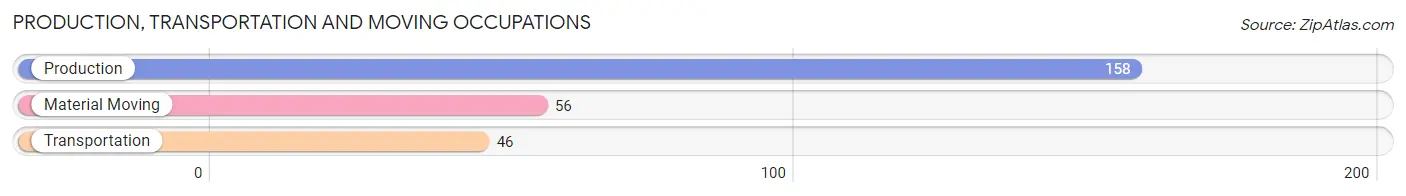
Production, Transportation and Moving Occupations
The most common Production, Transportation and Moving occupations in Lykens borough are Production (158 | 19.9%), Material Moving (56 | 7.0%), and Transportation (46 | 5.8%).
Production, Transportation and Moving Occupations by Sex
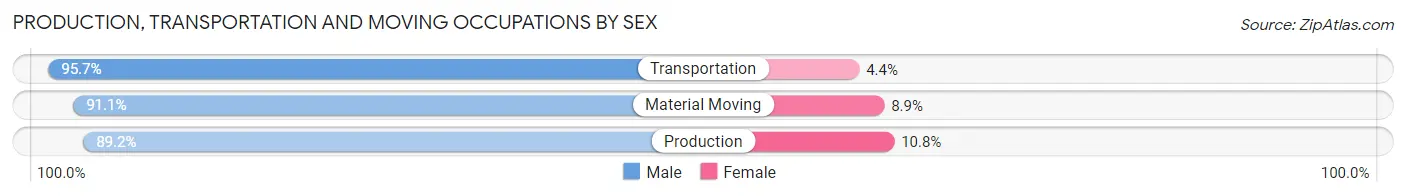
| Occupation | Male | Female |
| Production | 141 (89.2%) | 17 (10.8%) |
| Transportation | 44 (95.7%) | 2 (4.3%) |
| Material Moving | 51 (91.1%) | 5 (8.9%) |
| Total (Category) | 236 (90.8%) | 24 (9.2%) |
| Total (Overall) | 454 (57.1%) | 341 (42.9%) |
Employment Industries by Sex in Lykens borough
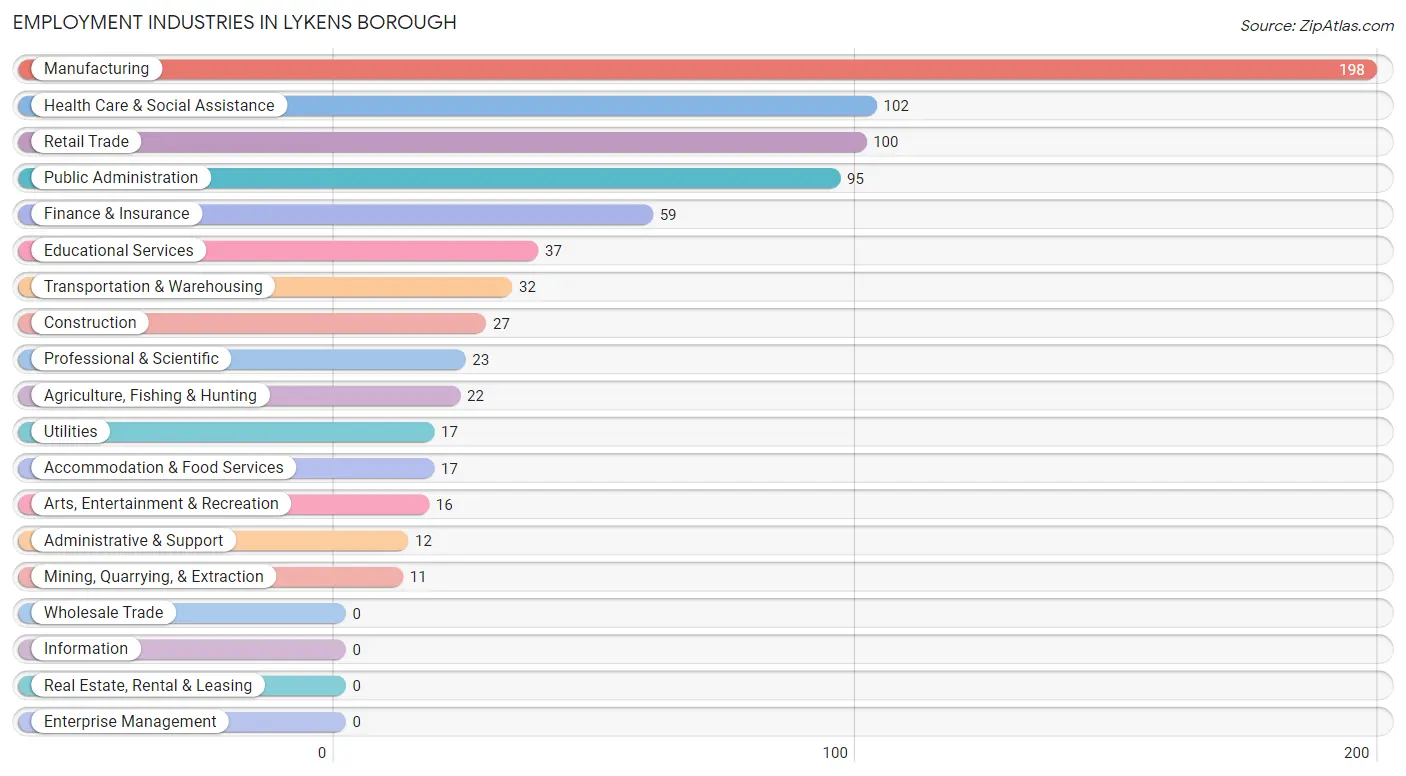
Employment Industries in Lykens borough
The major employment industries in Lykens borough include Manufacturing (198 | 24.9%), Health Care & Social Assistance (102 | 12.8%), Retail Trade (100 | 12.6%), Public Administration (95 | 11.9%), and Finance & Insurance (59 | 7.4%).
Employment Industries by Sex in Lykens borough
The Lykens borough industries that see more men than women are Mining, Quarrying, & Extraction (100.0%), Construction (100.0%), and Utilities (100.0%), whereas the industries that tend to have a higher number of women are Administrative & Support (100.0%), Health Care & Social Assistance (95.1%), and Educational Services (83.8%).

| Industry | Male | Female |
| Agriculture, Fishing & Hunting | 16 (72.7%) | 6 (27.3%) |
| Mining, Quarrying, & Extraction | 11 (100.0%) | 0 (0.0%) |
| Construction | 27 (100.0%) | 0 (0.0%) |
| Manufacturing | 165 (83.3%) | 33 (16.7%) |
| Wholesale Trade | 0 (0.0%) | 0 (0.0%) |
| Retail Trade | 49 (49.0%) | 51 (51.0%) |
| Transportation & Warehousing | 30 (93.8%) | 2 (6.2%) |
| Utilities | 17 (100.0%) | 0 (0.0%) |
| Information | 0 (0.0%) | 0 (0.0%) |
| Finance & Insurance | 28 (47.5%) | 31 (52.5%) |
| Real Estate, Rental & Leasing | 0 (0.0%) | 0 (0.0%) |
| Professional & Scientific | 16 (69.6%) | 7 (30.4%) |
| Enterprise Management | 0 (0.0%) | 0 (0.0%) |
| Administrative & Support | 0 (0.0%) | 12 (100.0%) |
| Educational Services | 6 (16.2%) | 31 (83.8%) |
| Health Care & Social Assistance | 5 (4.9%) | 97 (95.1%) |
| Arts, Entertainment & Recreation | 6 (37.5%) | 10 (62.5%) |
| Accommodation & Food Services | 4 (23.5%) | 13 (76.5%) |
| Public Administration | 70 (73.7%) | 25 (26.3%) |
| Total | 454 (57.1%) | 341 (42.9%) |
Education in Lykens borough
School Enrollment in Lykens borough
The most common levels of schooling among the 280 students in Lykens borough are middle school (97 | 34.6%), elementary school (76 | 27.1%), and high school (42 | 15.0%).
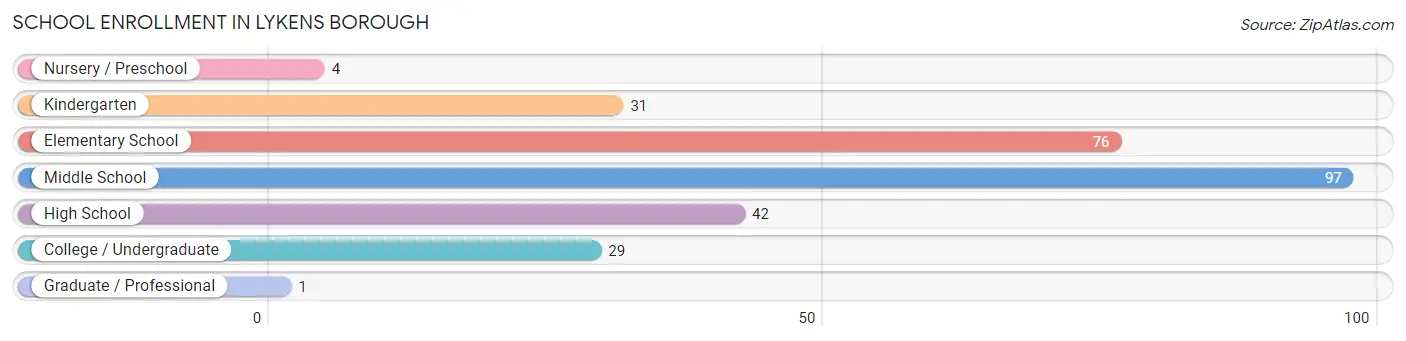
| School Level | # Students | % Students |
| Nursery / Preschool | 4 | 1.4% |
| Kindergarten | 31 | 11.1% |
| Elementary School | 76 | 27.1% |
| Middle School | 97 | 34.6% |
| High School | 42 | 15.0% |
| College / Undergraduate | 29 | 10.4% |
| Graduate / Professional | 1 | 0.4% |
| Total | 280 | 100.0% |
School Enrollment by Age by Funding Source in Lykens borough
Out of a total of 280 students who are enrolled in schools in Lykens borough, 19 (6.8%) attend a private institution, while the remaining 261 (93.2%) are enrolled in public schools. The age group of 5 to 9 year old has the highest likelihood of being enrolled in private schools, with 19 (21.1% in the age bracket) enrolled. Conversely, the age group of 10 to 14 year olds has the lowest likelihood of being enrolled in a private school, with 108 (100.0% in the age bracket) attending a public institution.
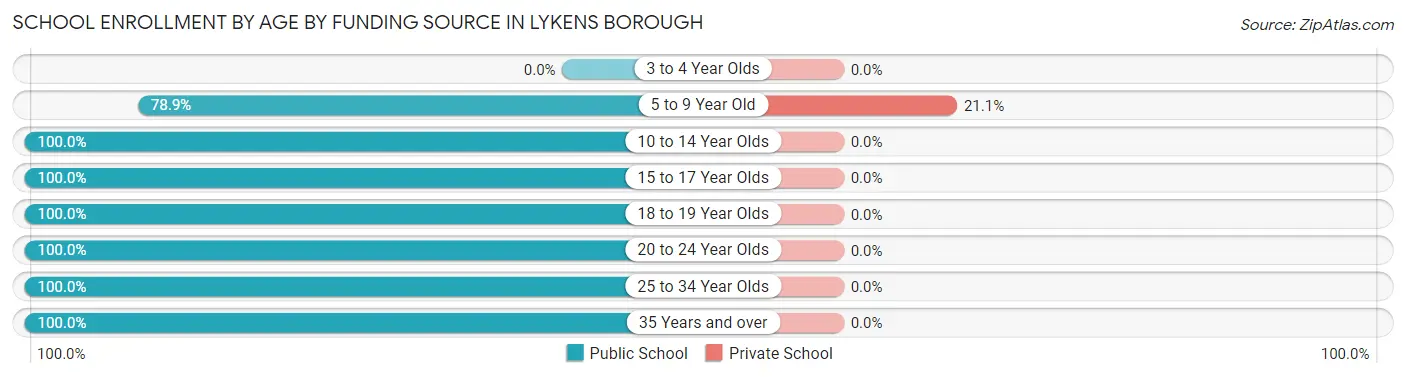
| Age Bracket | Public School | Private School |
| 3 to 4 Year Olds | 0 (0.0%) | 0 (0.0%) |
| 5 to 9 Year Old | 71 (78.9%) | 19 (21.1%) |
| 10 to 14 Year Olds | 108 (100.0%) | 0 (0.0%) |
| 15 to 17 Year Olds | 52 (100.0%) | 0 (0.0%) |
| 18 to 19 Year Olds | 7 (100.0%) | 0 (0.0%) |
| 20 to 24 Year Olds | 18 (100.0%) | 0 (0.0%) |
| 25 to 34 Year Olds | 1 (100.0%) | 0 (0.0%) |
| 35 Years and over | 4 (100.0%) | 0 (0.0%) |
| Total | 261 (93.2%) | 19 (6.8%) |
Educational Attainment by Field of Study in Lykens borough
Computers & mathematics (38 | 28.8%), arts & humanities (23 | 17.4%), liberal arts & history (21 | 15.9%), business (13 | 9.9%), and education (13 | 9.9%) are the most common fields of study among 132 individuals in Lykens borough who have obtained a bachelor's degree or higher.
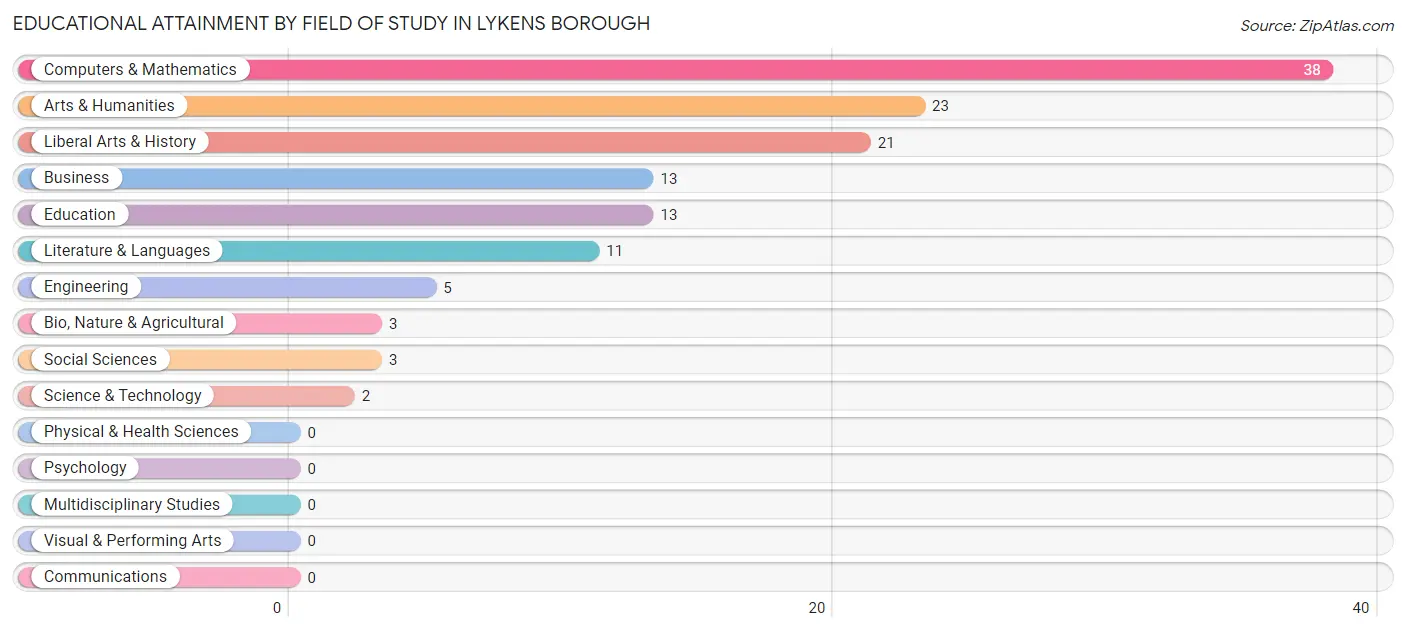
| Field of Study | # Graduates | % Graduates |
| Computers & Mathematics | 38 | 28.8% |
| Bio, Nature & Agricultural | 3 | 2.3% |
| Physical & Health Sciences | 0 | 0.0% |
| Psychology | 0 | 0.0% |
| Social Sciences | 3 | 2.3% |
| Engineering | 5 | 3.8% |
| Multidisciplinary Studies | 0 | 0.0% |
| Science & Technology | 2 | 1.5% |
| Business | 13 | 9.9% |
| Education | 13 | 9.9% |
| Literature & Languages | 11 | 8.3% |
| Liberal Arts & History | 21 | 15.9% |
| Visual & Performing Arts | 0 | 0.0% |
| Communications | 0 | 0.0% |
| Arts & Humanities | 23 | 17.4% |
| Total | 132 | 100.0% |
Transportation & Commute in Lykens borough
Vehicle Availability by Sex in Lykens borough
The most prevalent vehicle ownership categories in Lykens borough are males with 2 vehicles (144, accounting for 32.4%) and females with 2 vehicles (112, making up 42.2%).
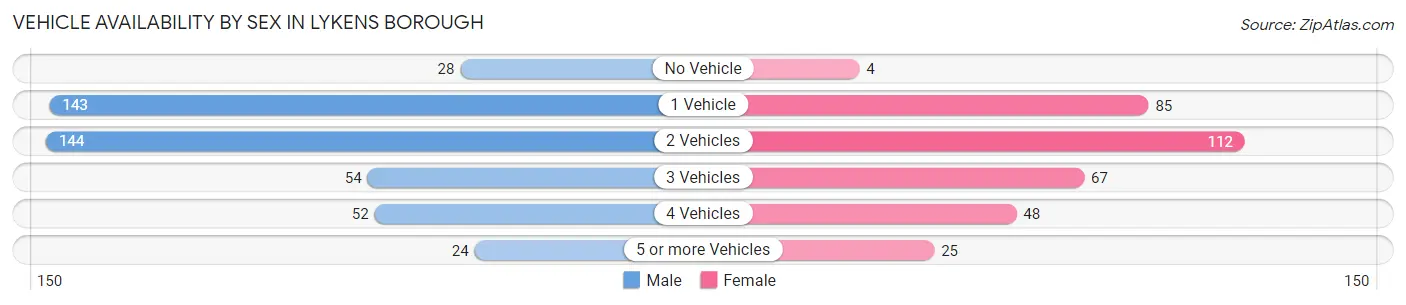
| Vehicles Available | Male | Female |
| No Vehicle | 28 (6.3%) | 4 (1.2%) |
| 1 Vehicle | 143 (32.1%) | 85 (24.9%) |
| 2 Vehicles | 144 (32.4%) | 112 (32.8%) |
| 3 Vehicles | 54 (12.1%) | 67 (19.7%) |
| 4 Vehicles | 52 (11.7%) | 48 (14.1%) |
| 5 or more Vehicles | 24 (5.4%) | 25 (7.3%) |
| Total | 445 (100.0%) | 341 (100.0%) |
Commute Time in Lykens borough
The most frequently occuring commute durations in Lykens borough are 15 to 19 minutes (208 commuters, 31.8%), 60 to 89 minutes (123 commuters, 18.8%), and 45 to 59 minutes (109 commuters, 16.6%).
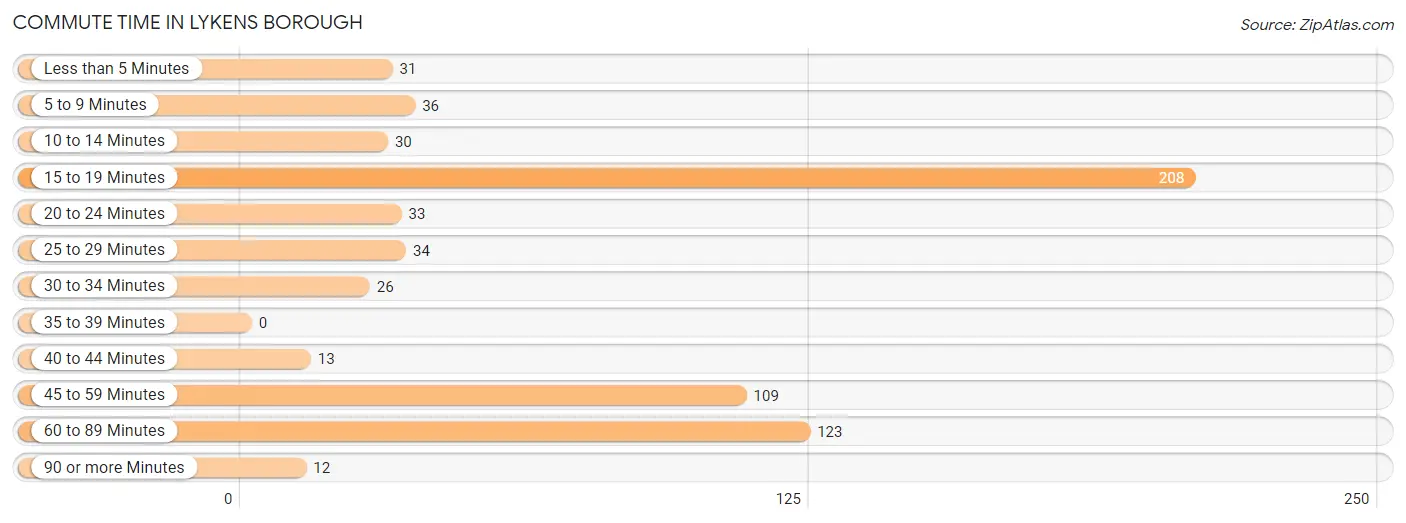
| Commute Time | # Commuters | % Commuters |
| Less than 5 Minutes | 31 | 4.7% |
| 5 to 9 Minutes | 36 | 5.5% |
| 10 to 14 Minutes | 30 | 4.6% |
| 15 to 19 Minutes | 208 | 31.8% |
| 20 to 24 Minutes | 33 | 5.0% |
| 25 to 29 Minutes | 34 | 5.2% |
| 30 to 34 Minutes | 26 | 4.0% |
| 35 to 39 Minutes | 0 | 0.0% |
| 40 to 44 Minutes | 13 | 2.0% |
| 45 to 59 Minutes | 109 | 16.6% |
| 60 to 89 Minutes | 123 | 18.8% |
| 90 or more Minutes | 12 | 1.8% |
Commute Time by Sex in Lykens borough
The most common commute times in Lykens borough are 15 to 19 minutes (162 commuters, 44.0%) for males and 60 to 89 minutes (54 commuters, 18.8%) for females.
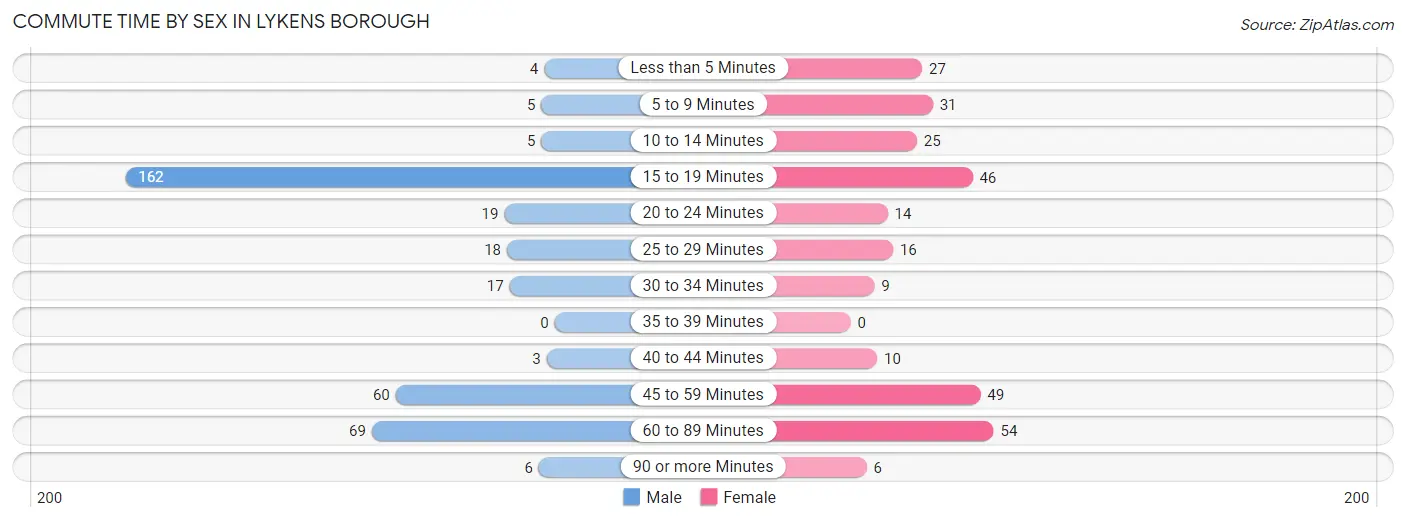
| Commute Time | Male | Female |
| Less than 5 Minutes | 4 (1.1%) | 27 (9.4%) |
| 5 to 9 Minutes | 5 (1.4%) | 31 (10.8%) |
| 10 to 14 Minutes | 5 (1.4%) | 25 (8.7%) |
| 15 to 19 Minutes | 162 (44.0%) | 46 (16.0%) |
| 20 to 24 Minutes | 19 (5.2%) | 14 (4.9%) |
| 25 to 29 Minutes | 18 (4.9%) | 16 (5.6%) |
| 30 to 34 Minutes | 17 (4.6%) | 9 (3.1%) |
| 35 to 39 Minutes | 0 (0.0%) | 0 (0.0%) |
| 40 to 44 Minutes | 3 (0.8%) | 10 (3.5%) |
| 45 to 59 Minutes | 60 (16.3%) | 49 (17.1%) |
| 60 to 89 Minutes | 69 (18.8%) | 54 (18.8%) |
| 90 or more Minutes | 6 (1.6%) | 6 (2.1%) |
Time of Departure to Work by Sex in Lykens borough
The most frequent times of departure to work in Lykens borough are 6:30 AM to 6:59 AM (124, 33.7%) for males and 7:00 AM to 7:29 AM (62, 21.6%) for females.
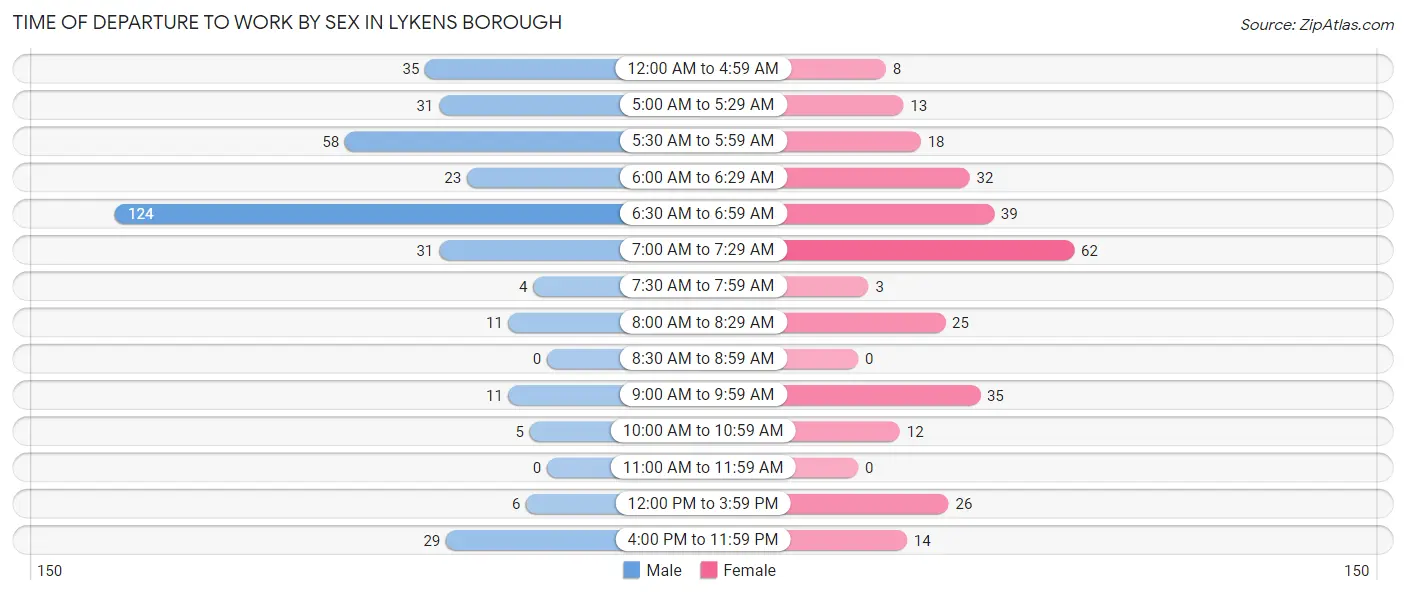
| Time of Departure | Male | Female |
| 12:00 AM to 4:59 AM | 35 (9.5%) | 8 (2.8%) |
| 5:00 AM to 5:29 AM | 31 (8.4%) | 13 (4.5%) |
| 5:30 AM to 5:59 AM | 58 (15.8%) | 18 (6.3%) |
| 6:00 AM to 6:29 AM | 23 (6.2%) | 32 (11.2%) |
| 6:30 AM to 6:59 AM | 124 (33.7%) | 39 (13.6%) |
| 7:00 AM to 7:29 AM | 31 (8.4%) | 62 (21.6%) |
| 7:30 AM to 7:59 AM | 4 (1.1%) | 3 (1.1%) |
| 8:00 AM to 8:29 AM | 11 (3.0%) | 25 (8.7%) |
| 8:30 AM to 8:59 AM | 0 (0.0%) | 0 (0.0%) |
| 9:00 AM to 9:59 AM | 11 (3.0%) | 35 (12.2%) |
| 10:00 AM to 10:59 AM | 5 (1.4%) | 12 (4.2%) |
| 11:00 AM to 11:59 AM | 0 (0.0%) | 0 (0.0%) |
| 12:00 PM to 3:59 PM | 6 (1.6%) | 26 (9.1%) |
| 4:00 PM to 11:59 PM | 29 (7.9%) | 14 (4.9%) |
| Total | 368 (100.0%) | 287 (100.0%) |
Housing Occupancy in Lykens borough
Occupancy by Ownership in Lykens borough
Of the total 755 dwellings in Lykens borough, owner-occupied units account for 466 (61.7%), while renter-occupied units make up 289 (38.3%).
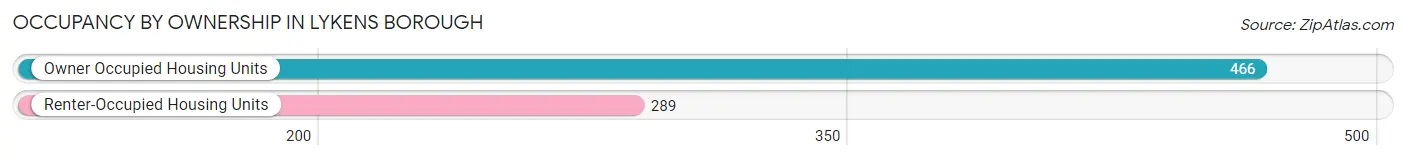
| Occupancy | # Housing Units | % Housing Units |
| Owner Occupied Housing Units | 466 | 61.7% |
| Renter-Occupied Housing Units | 289 | 38.3% |
| Total Occupied Housing Units | 755 | 100.0% |
Occupancy by Household Size in Lykens borough
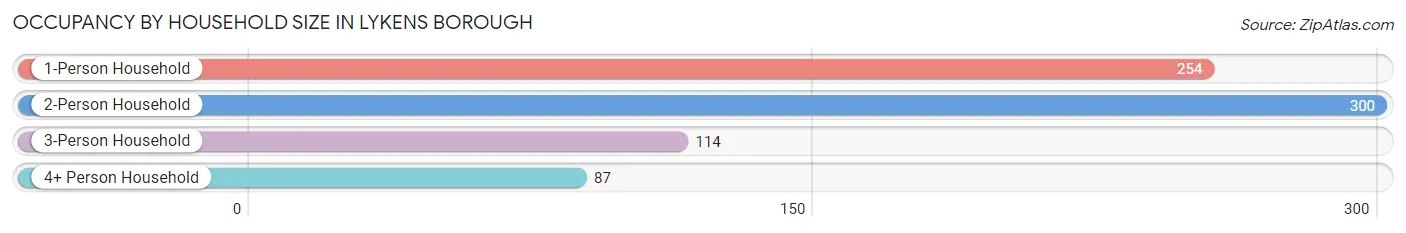
| Household Size | # Housing Units | % Housing Units |
| 1-Person Household | 254 | 33.6% |
| 2-Person Household | 300 | 39.7% |
| 3-Person Household | 114 | 15.1% |
| 4+ Person Household | 87 | 11.5% |
| Total Housing Units | 755 | 100.0% |
Occupancy by Ownership by Household Size in Lykens borough
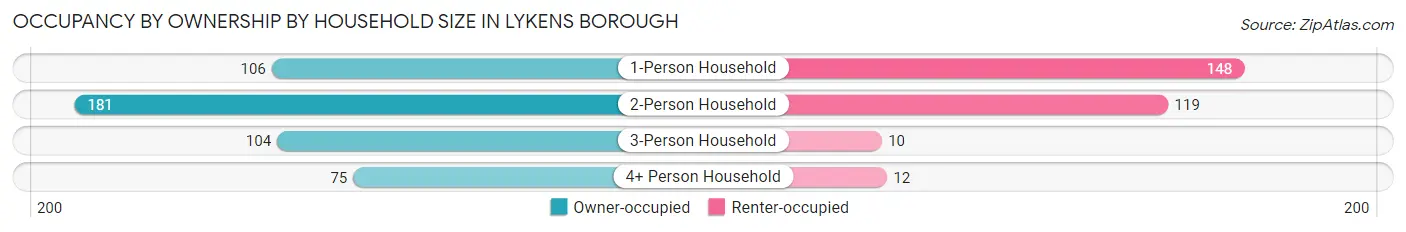
| Household Size | Owner-occupied | Renter-occupied |
| 1-Person Household | 106 (41.7%) | 148 (58.3%) |
| 2-Person Household | 181 (60.3%) | 119 (39.7%) |
| 3-Person Household | 104 (91.2%) | 10 (8.8%) |
| 4+ Person Household | 75 (86.2%) | 12 (13.8%) |
| Total Housing Units | 466 (61.7%) | 289 (38.3%) |
Occupancy by Educational Attainment in Lykens borough
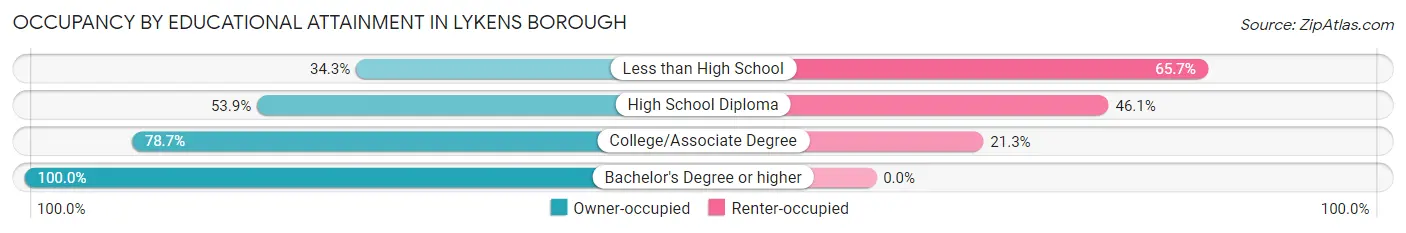
| Household Size | Owner-occupied | Renter-occupied |
| Less than High School | 36 (34.3%) | 69 (65.7%) |
| High School Diploma | 206 (53.9%) | 176 (46.1%) |
| College/Associate Degree | 163 (78.7%) | 44 (21.3%) |
| Bachelor's Degree or higher | 61 (100.0%) | 0 (0.0%) |
Occupancy by Age of Householder in Lykens borough
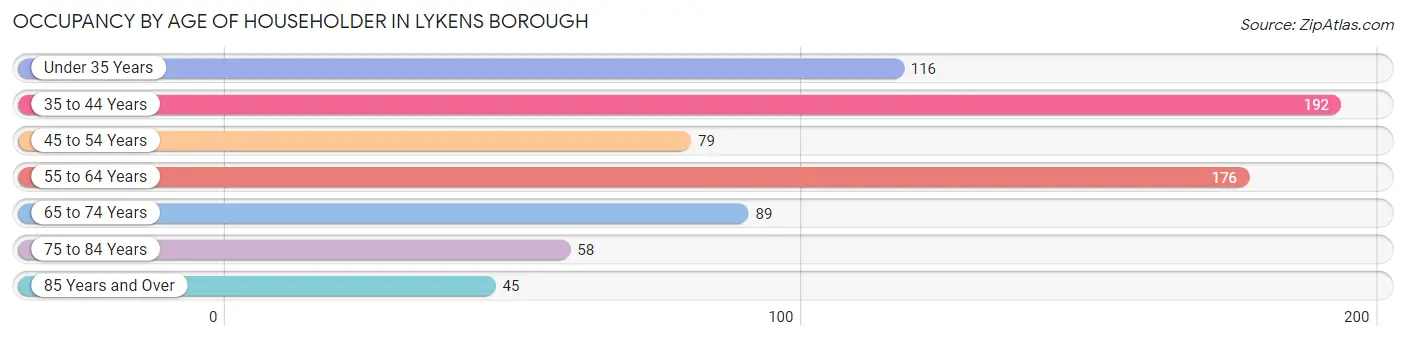
| Age Bracket | # Households | % Households |
| Under 35 Years | 116 | 15.4% |
| 35 to 44 Years | 192 | 25.4% |
| 45 to 54 Years | 79 | 10.5% |
| 55 to 64 Years | 176 | 23.3% |
| 65 to 74 Years | 89 | 11.8% |
| 75 to 84 Years | 58 | 7.7% |
| 85 Years and Over | 45 | 6.0% |
| Total | 755 | 100.0% |
Housing Finances in Lykens borough
Median Income by Occupancy in Lykens borough

| Occupancy Type | # Households | Median Income |
| Owner-Occupied | 466 (61.7%) | $72,692 |
| Renter-Occupied | 289 (38.3%) | $0 |
| Average | 755 (100.0%) | $67,768 |
Occupancy by Householder Income Bracket in Lykens borough
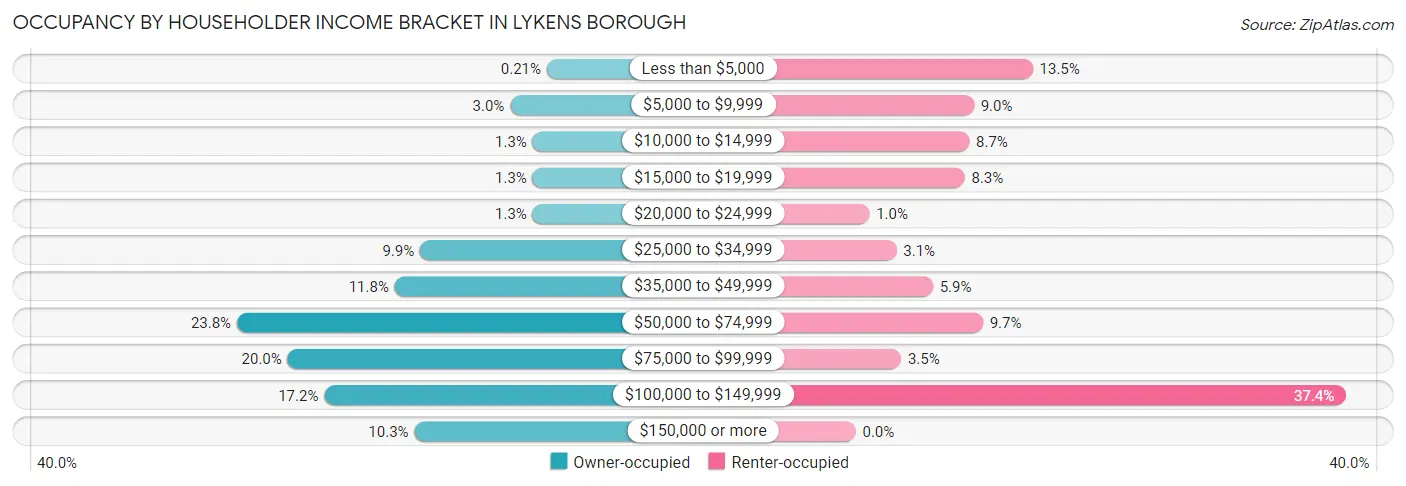
| Income Bracket | Owner-occupied | Renter-occupied |
| Less than $5,000 | 1 (0.2%) | 39 (13.5%) |
| $5,000 to $9,999 | 14 (3.0%) | 26 (9.0%) |
| $10,000 to $14,999 | 6 (1.3%) | 25 (8.6%) |
| $15,000 to $19,999 | 6 (1.3%) | 24 (8.3%) |
| $20,000 to $24,999 | 6 (1.3%) | 3 (1.0%) |
| $25,000 to $34,999 | 46 (9.9%) | 9 (3.1%) |
| $35,000 to $49,999 | 55 (11.8%) | 17 (5.9%) |
| $50,000 to $74,999 | 111 (23.8%) | 28 (9.7%) |
| $75,000 to $99,999 | 93 (20.0%) | 10 (3.5%) |
| $100,000 to $149,999 | 80 (17.2%) | 108 (37.4%) |
| $150,000 or more | 48 (10.3%) | 0 (0.0%) |
| Total | 466 (100.0%) | 289 (100.0%) |
Monthly Housing Cost Tiers in Lykens borough
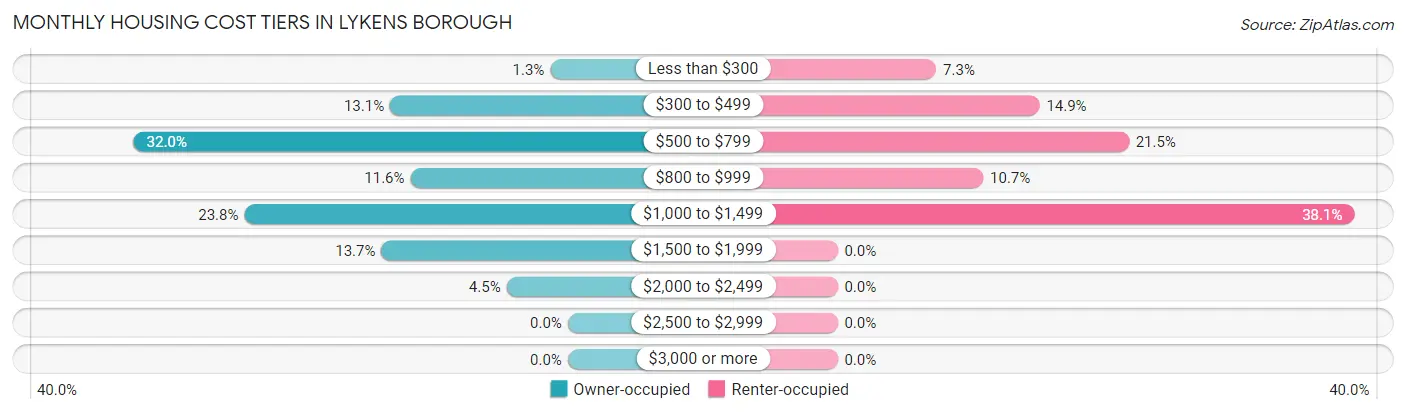
| Monthly Cost | Owner-occupied | Renter-occupied |
| Less than $300 | 6 (1.3%) | 21 (7.3%) |
| $300 to $499 | 61 (13.1%) | 43 (14.9%) |
| $500 to $799 | 149 (32.0%) | 62 (21.4%) |
| $800 to $999 | 54 (11.6%) | 31 (10.7%) |
| $1,000 to $1,499 | 111 (23.8%) | 110 (38.1%) |
| $1,500 to $1,999 | 64 (13.7%) | 0 (0.0%) |
| $2,000 to $2,499 | 21 (4.5%) | 0 (0.0%) |
| $2,500 to $2,999 | 0 (0.0%) | 0 (0.0%) |
| $3,000 or more | 0 (0.0%) | 0 (0.0%) |
| Total | 466 (100.0%) | 289 (100.0%) |
Physical Housing Characteristics in Lykens borough
Housing Structures in Lykens borough
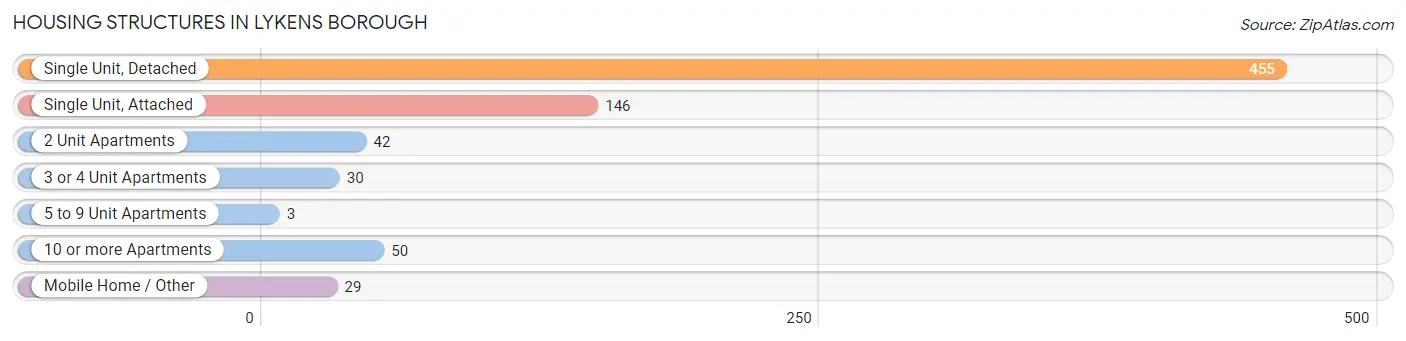
| Structure Type | # Housing Units | % Housing Units |
| Single Unit, Detached | 455 | 60.3% |
| Single Unit, Attached | 146 | 19.3% |
| 2 Unit Apartments | 42 | 5.6% |
| 3 or 4 Unit Apartments | 30 | 4.0% |
| 5 to 9 Unit Apartments | 3 | 0.4% |
| 10 or more Apartments | 50 | 6.6% |
| Mobile Home / Other | 29 | 3.8% |
| Total | 755 | 100.0% |
Housing Structures by Occupancy in Lykens borough
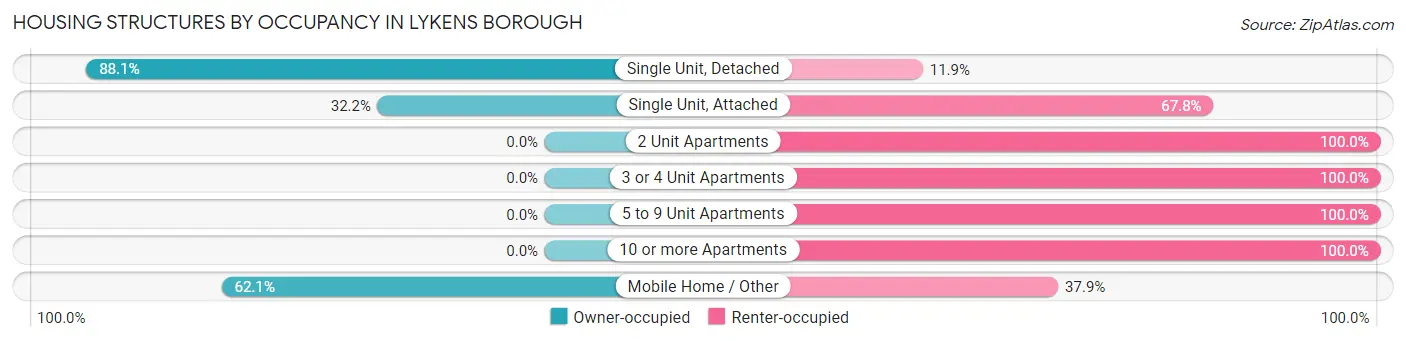
| Structure Type | Owner-occupied | Renter-occupied |
| Single Unit, Detached | 401 (88.1%) | 54 (11.9%) |
| Single Unit, Attached | 47 (32.2%) | 99 (67.8%) |
| 2 Unit Apartments | 0 (0.0%) | 42 (100.0%) |
| 3 or 4 Unit Apartments | 0 (0.0%) | 30 (100.0%) |
| 5 to 9 Unit Apartments | 0 (0.0%) | 3 (100.0%) |
| 10 or more Apartments | 0 (0.0%) | 50 (100.0%) |
| Mobile Home / Other | 18 (62.1%) | 11 (37.9%) |
| Total | 466 (61.7%) | 289 (38.3%) |
Housing Structures by Number of Rooms in Lykens borough
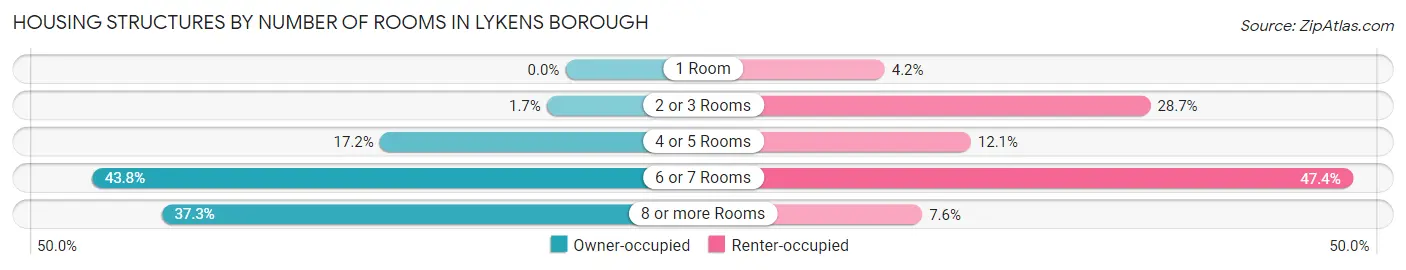
| Number of Rooms | Owner-occupied | Renter-occupied |
| 1 Room | 0 (0.0%) | 12 (4.2%) |
| 2 or 3 Rooms | 8 (1.7%) | 83 (28.7%) |
| 4 or 5 Rooms | 80 (17.2%) | 35 (12.1%) |
| 6 or 7 Rooms | 204 (43.8%) | 137 (47.4%) |
| 8 or more Rooms | 174 (37.3%) | 22 (7.6%) |
| Total | 466 (100.0%) | 289 (100.0%) |
Housing Structure by Heating Type in Lykens borough
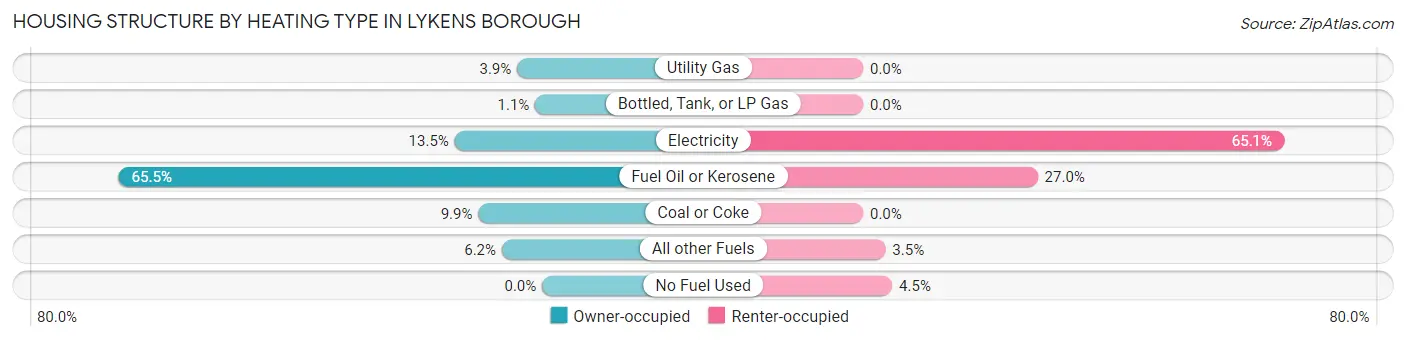
| Heating Type | Owner-occupied | Renter-occupied |
| Utility Gas | 18 (3.9%) | 0 (0.0%) |
| Bottled, Tank, or LP Gas | 5 (1.1%) | 0 (0.0%) |
| Electricity | 63 (13.5%) | 188 (65.0%) |
| Fuel Oil or Kerosene | 305 (65.4%) | 78 (27.0%) |
| Coal or Coke | 46 (9.9%) | 0 (0.0%) |
| All other Fuels | 29 (6.2%) | 10 (3.5%) |
| No Fuel Used | 0 (0.0%) | 13 (4.5%) |
| Total | 466 (100.0%) | 289 (100.0%) |
Household Vehicle Usage in Lykens borough
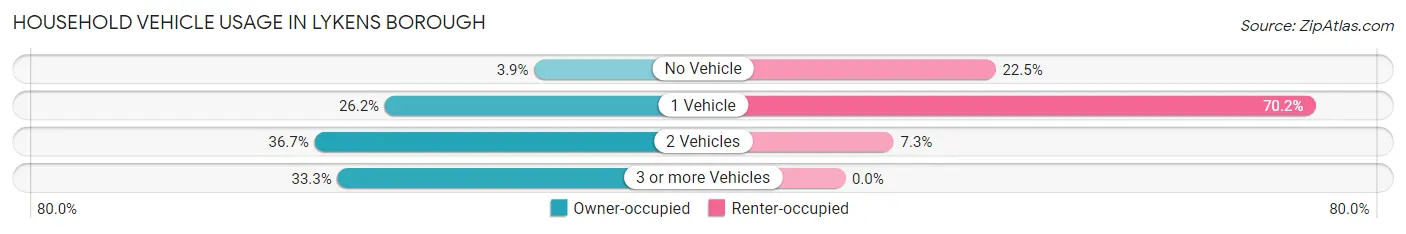
| Vehicles per Household | Owner-occupied | Renter-occupied |
| No Vehicle | 18 (3.9%) | 65 (22.5%) |
| 1 Vehicle | 122 (26.2%) | 203 (70.2%) |
| 2 Vehicles | 171 (36.7%) | 21 (7.3%) |
| 3 or more Vehicles | 155 (33.3%) | 0 (0.0%) |
| Total | 466 (100.0%) | 289 (100.0%) |
Real Estate & Mortgages in Lykens borough
Real Estate and Mortgage Overview in Lykens borough
| Characteristic | Without Mortgage | With Mortgage |
| Housing Units | 193 | 273 |
| Median Property Value | $101,100 | $124,600 |
| Median Household Income | $55,972 | $32 |
| Monthly Housing Costs | $562 | $0 |
| Real Estate Taxes | $1,443 | $0 |
Property Value by Mortgage Status in Lykens borough
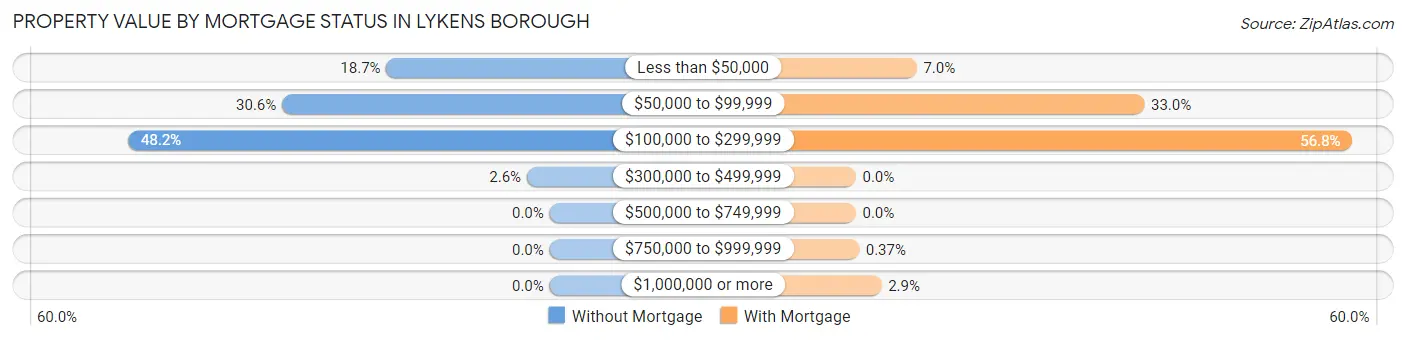
| Property Value | Without Mortgage | With Mortgage |
| Less than $50,000 | 36 (18.6%) | 19 (7.0%) |
| $50,000 to $99,999 | 59 (30.6%) | 90 (33.0%) |
| $100,000 to $299,999 | 93 (48.2%) | 155 (56.8%) |
| $300,000 to $499,999 | 5 (2.6%) | 0 (0.0%) |
| $500,000 to $749,999 | 0 (0.0%) | 0 (0.0%) |
| $750,000 to $999,999 | 0 (0.0%) | 1 (0.4%) |
| $1,000,000 or more | 0 (0.0%) | 8 (2.9%) |
| Total | 193 (100.0%) | 273 (100.0%) |
Household Income by Mortgage Status in Lykens borough
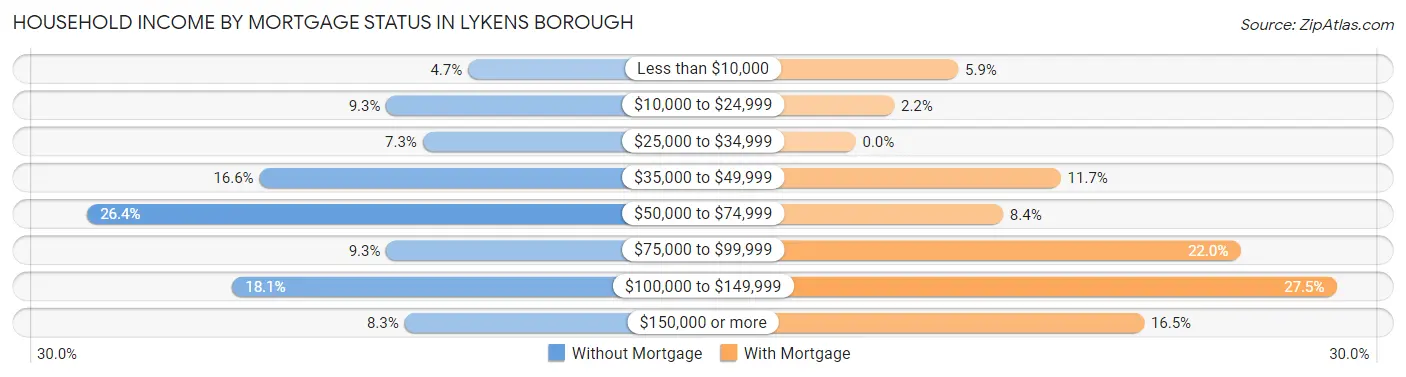
| Household Income | Without Mortgage | With Mortgage |
| Less than $10,000 | 9 (4.7%) | 16 (5.9%) |
| $10,000 to $24,999 | 18 (9.3%) | 6 (2.2%) |
| $25,000 to $34,999 | 14 (7.2%) | 0 (0.0%) |
| $35,000 to $49,999 | 32 (16.6%) | 32 (11.7%) |
| $50,000 to $74,999 | 51 (26.4%) | 23 (8.4%) |
| $75,000 to $99,999 | 18 (9.3%) | 60 (22.0%) |
| $100,000 to $149,999 | 35 (18.1%) | 75 (27.5%) |
| $150,000 or more | 16 (8.3%) | 45 (16.5%) |
| Total | 193 (100.0%) | 273 (100.0%) |
Property Value to Household Income Ratio in Lykens borough
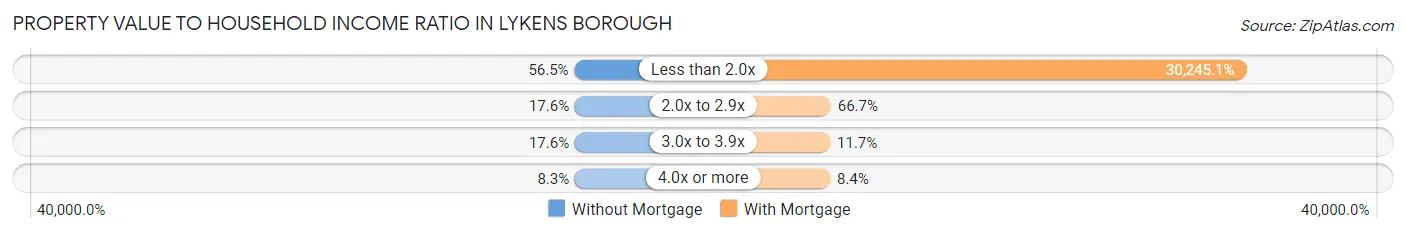
| Value-to-Income Ratio | Without Mortgage | With Mortgage |
| Less than 2.0x | 109 (56.5%) | 82,569 (30,245.0%) |
| 2.0x to 2.9x | 34 (17.6%) | 182 (66.7%) |
| 3.0x to 3.9x | 34 (17.6%) | 32 (11.7%) |
| 4.0x or more | 16 (8.3%) | 23 (8.4%) |
| Total | 193 (100.0%) | 273 (100.0%) |
Real Estate Taxes by Mortgage Status in Lykens borough
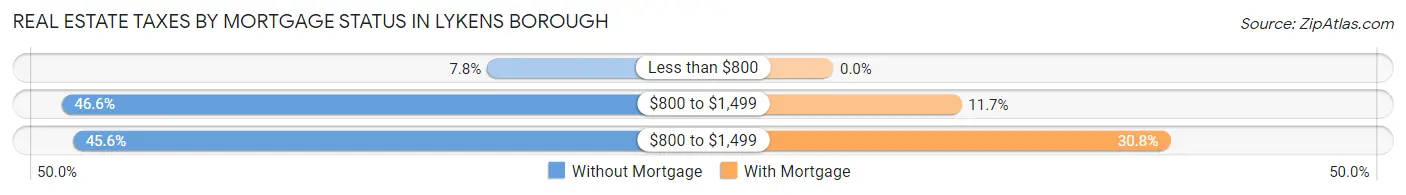
| Property Taxes | Without Mortgage | With Mortgage |
| Less than $800 | 15 (7.8%) | 0 (0.0%) |
| $800 to $1,499 | 90 (46.6%) | 32 (11.7%) |
| $800 to $1,499 | 88 (45.6%) | 84 (30.8%) |
| Total | 193 (100.0%) | 273 (100.0%) |
Health & Disability in Lykens borough
Health Insurance Coverage by Age in Lykens borough
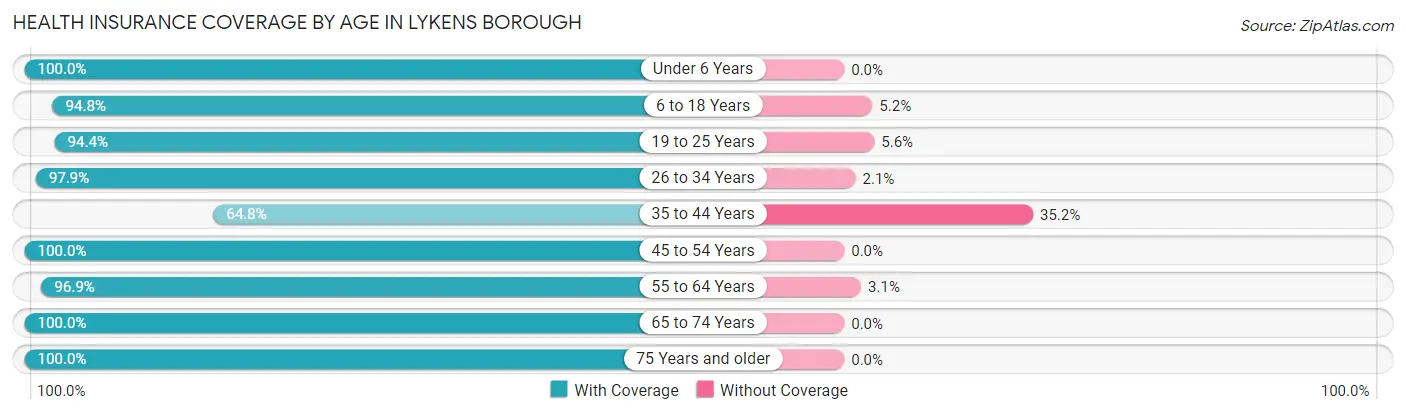
| Age Bracket | With Coverage | Without Coverage |
| Under 6 Years | 91 (100.0%) | 0 (0.0%) |
| 6 to 18 Years | 235 (94.8%) | 13 (5.2%) |
| 19 to 25 Years | 101 (94.4%) | 6 (5.6%) |
| 26 to 34 Years | 139 (97.9%) | 3 (2.1%) |
| 35 to 44 Years | 232 (64.8%) | 126 (35.2%) |
| 45 to 54 Years | 127 (100.0%) | 0 (0.0%) |
| 55 to 64 Years | 278 (96.9%) | 9 (3.1%) |
| 65 to 74 Years | 117 (100.0%) | 0 (0.0%) |
| 75 Years and older | 154 (100.0%) | 0 (0.0%) |
| Total | 1,474 (90.4%) | 157 (9.6%) |
Health Insurance Coverage by Citizenship Status in Lykens borough
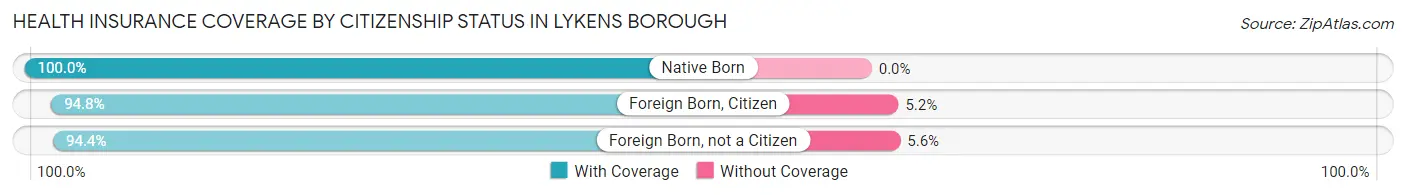
| Citizenship Status | With Coverage | Without Coverage |
| Native Born | 91 (100.0%) | 0 (0.0%) |
| Foreign Born, Citizen | 235 (94.8%) | 13 (5.2%) |
| Foreign Born, not a Citizen | 101 (94.4%) | 6 (5.6%) |
Health Insurance Coverage by Household Income in Lykens borough
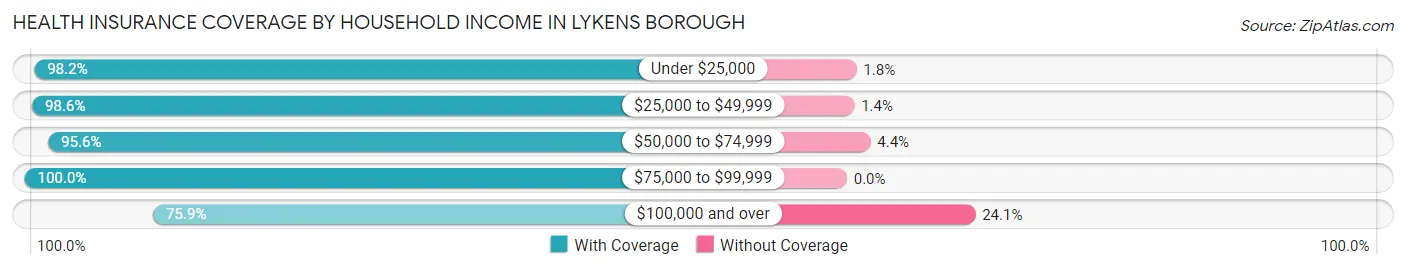
| Household Income | With Coverage | Without Coverage |
| Under $25,000 | 271 (98.2%) | 5 (1.8%) |
| $25,000 to $49,999 | 284 (98.6%) | 4 (1.4%) |
| $50,000 to $74,999 | 282 (95.6%) | 13 (4.4%) |
| $75,000 to $99,999 | 211 (100.0%) | 0 (0.0%) |
| $100,000 and over | 426 (75.9%) | 135 (24.1%) |
Public vs Private Health Insurance Coverage by Age in Lykens borough
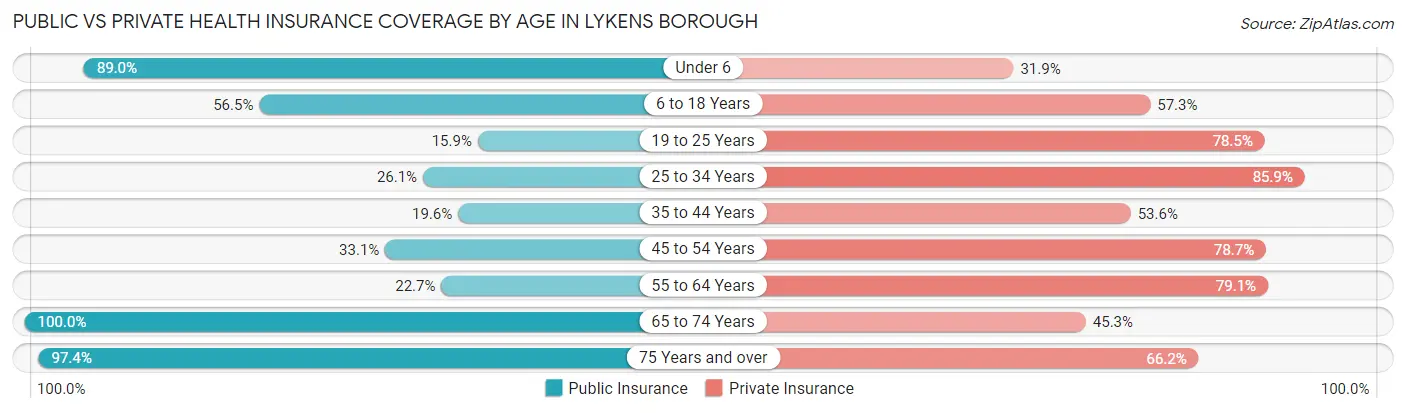
| Age Bracket | Public Insurance | Private Insurance |
| Under 6 | 81 (89.0%) | 29 (31.9%) |
| 6 to 18 Years | 140 (56.5%) | 142 (57.3%) |
| 19 to 25 Years | 17 (15.9%) | 84 (78.5%) |
| 25 to 34 Years | 37 (26.1%) | 122 (85.9%) |
| 35 to 44 Years | 70 (19.6%) | 192 (53.6%) |
| 45 to 54 Years | 42 (33.1%) | 100 (78.7%) |
| 55 to 64 Years | 65 (22.7%) | 227 (79.1%) |
| 65 to 74 Years | 117 (100.0%) | 53 (45.3%) |
| 75 Years and over | 150 (97.4%) | 102 (66.2%) |
| Total | 719 (44.1%) | 1,051 (64.4%) |
Disability Status by Sex by Age in Lykens borough
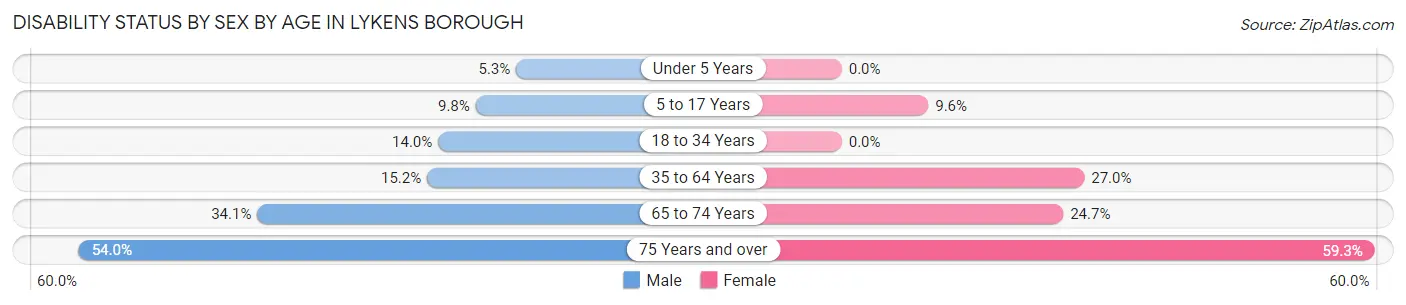
| Age Bracket | Male | Female |
| Under 5 Years | 3 (5.3%) | 0 (0.0%) |
| 5 to 17 Years | 13 (9.8%) | 13 (9.6%) |
| 18 to 34 Years | 18 (14.0%) | 0 (0.0%) |
| 35 to 64 Years | 70 (15.2%) | 84 (27.0%) |
| 65 to 74 Years | 15 (34.1%) | 18 (24.7%) |
| 75 Years and over | 34 (54.0%) | 54 (59.3%) |
Disability Class by Sex by Age in Lykens borough
Disability Class: Hearing Difficulty
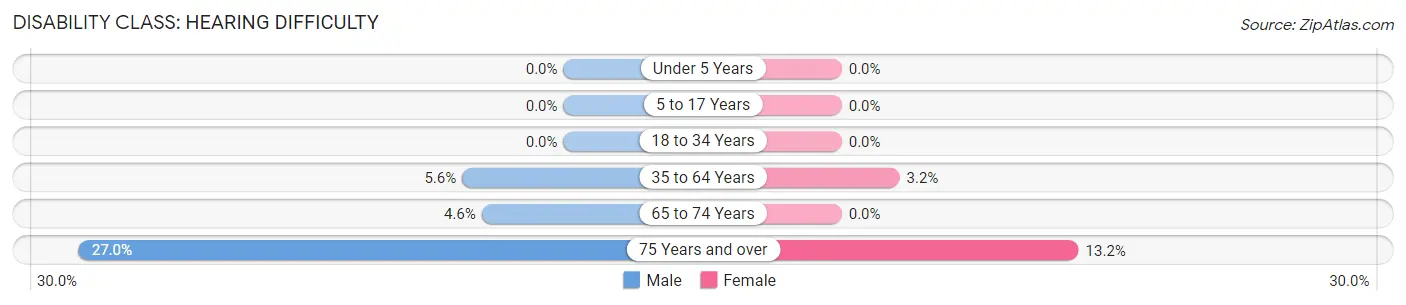
| Age Bracket | Male | Female |
| Under 5 Years | 0 (0.0%) | 0 (0.0%) |
| 5 to 17 Years | 0 (0.0%) | 0 (0.0%) |
| 18 to 34 Years | 0 (0.0%) | 0 (0.0%) |
| 35 to 64 Years | 26 (5.6%) | 10 (3.2%) |
| 65 to 74 Years | 2 (4.5%) | 0 (0.0%) |
| 75 Years and over | 17 (27.0%) | 12 (13.2%) |
Disability Class: Vision Difficulty
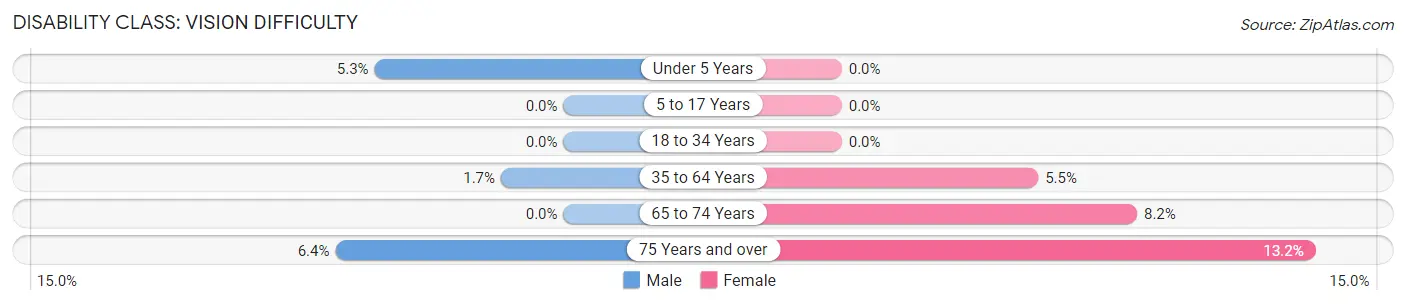
| Age Bracket | Male | Female |
| Under 5 Years | 3 (5.3%) | 0 (0.0%) |
| 5 to 17 Years | 0 (0.0%) | 0 (0.0%) |
| 18 to 34 Years | 0 (0.0%) | 0 (0.0%) |
| 35 to 64 Years | 8 (1.7%) | 17 (5.5%) |
| 65 to 74 Years | 0 (0.0%) | 6 (8.2%) |
| 75 Years and over | 4 (6.4%) | 12 (13.2%) |
Disability Class: Cognitive Difficulty
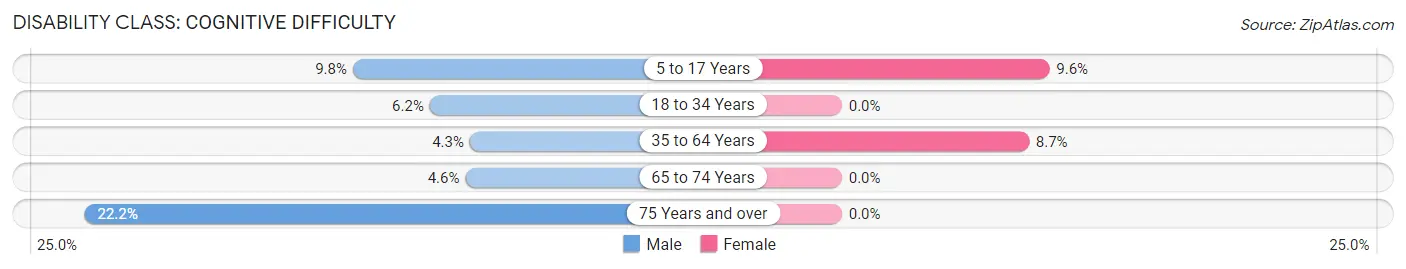
| Age Bracket | Male | Female |
| 5 to 17 Years | 13 (9.8%) | 13 (9.6%) |
| 18 to 34 Years | 8 (6.2%) | 0 (0.0%) |
| 35 to 64 Years | 20 (4.3%) | 27 (8.7%) |
| 65 to 74 Years | 2 (4.5%) | 0 (0.0%) |
| 75 Years and over | 14 (22.2%) | 0 (0.0%) |
Disability Class: Ambulatory Difficulty
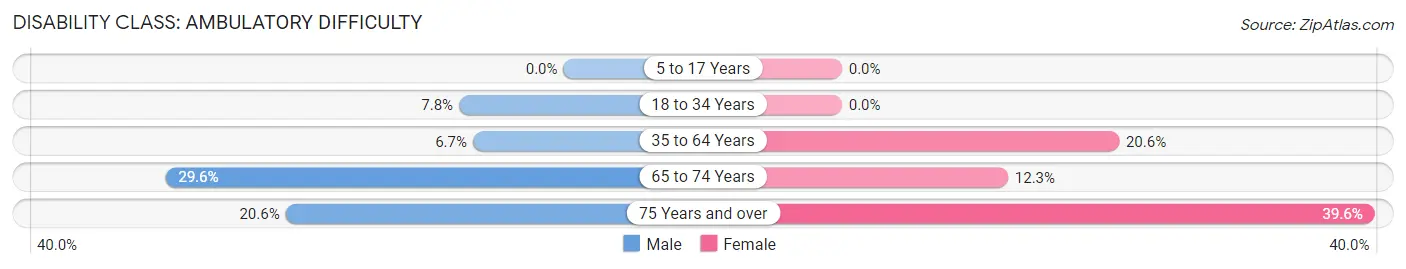
| Age Bracket | Male | Female |
| 5 to 17 Years | 0 (0.0%) | 0 (0.0%) |
| 18 to 34 Years | 10 (7.7%) | 0 (0.0%) |
| 35 to 64 Years | 31 (6.7%) | 64 (20.6%) |
| 65 to 74 Years | 13 (29.5%) | 9 (12.3%) |
| 75 Years and over | 13 (20.6%) | 36 (39.6%) |
Disability Class: Self-Care Difficulty
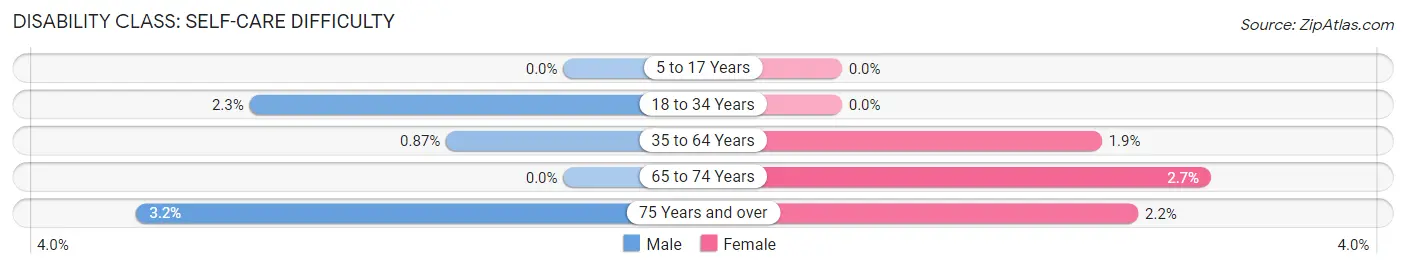
| Age Bracket | Male | Female |
| 5 to 17 Years | 0 (0.0%) | 0 (0.0%) |
| 18 to 34 Years | 3 (2.3%) | 0 (0.0%) |
| 35 to 64 Years | 4 (0.9%) | 6 (1.9%) |
| 65 to 74 Years | 0 (0.0%) | 2 (2.7%) |
| 75 Years and over | 2 (3.2%) | 2 (2.2%) |
Technology Access in Lykens borough
Computing Device Access in Lykens borough
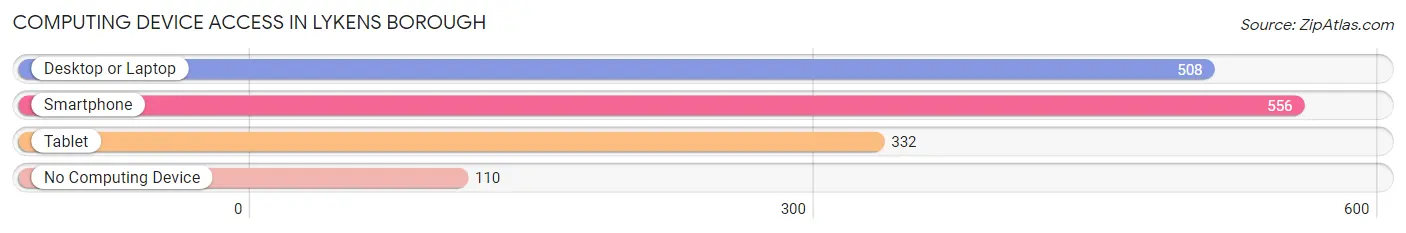
| Device Type | # Households | % Households |
| Desktop or Laptop | 508 | 67.3% |
| Smartphone | 556 | 73.6% |
| Tablet | 332 | 44.0% |
| No Computing Device | 110 | 14.6% |
| Total | 755 | 100.0% |
Internet Access in Lykens borough
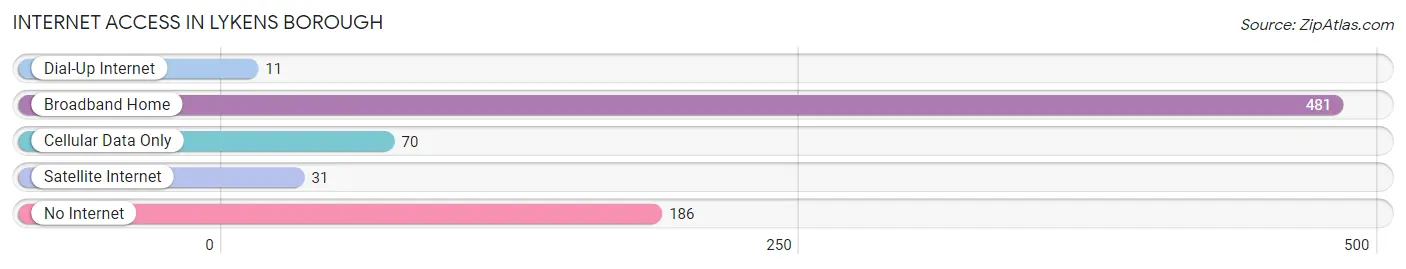
| Internet Type | # Households | % Households |
| Dial-Up Internet | 11 | 1.5% |
| Broadband Home | 481 | 63.7% |
| Cellular Data Only | 70 | 9.3% |
| Satellite Internet | 31 | 4.1% |
| No Internet | 186 | 24.6% |
| Total | 755 | 100.0% |
Lykens borough Summary
Lykens Borough is a small borough located in Dauphin County, Pennsylvania. It is situated in the Susquehanna Valley, approximately 10 miles northwest of Harrisburg, the state capital. The borough is home to a population of 1,845 people, according to the 2010 census.
History
Lykens Borough was founded in 1851 by a group of German immigrants who had settled in the area. The town was named after the Lykens Valley, which was named after the Lykens Creek, which was named after the Lenape Indian tribe that once lived in the area. The town was originally a farming community, but it soon developed into a small industrial center. The first industry in the area was a sawmill, which was built in 1854. This was followed by a gristmill, a tannery, and a woolen mill.
The town grew rapidly in the late 19th century, and by the turn of the century, it had become a bustling industrial center. The town was home to several factories, including a cigar factory, a shoe factory, and a shirt factory. The town also had several stores, a bank, a post office, and a hotel.
The town continued to grow in the early 20th century, and by the 1950s, it had become a thriving community. The town was home to several churches, a library, a movie theater, and a hospital. The town also had several parks, including a swimming pool, a baseball field, and a playground.
Geography
Lykens Borough is located in the Susquehanna Valley, approximately 10 miles northwest of Harrisburg, the state capital. The borough is situated in the Appalachian Mountains, and is surrounded by rolling hills and valleys. The borough is located in the Appalachian Plateau, and is part of the Ridge and Valley physiographic province.
The borough is located in the humid continental climate zone, and has four distinct seasons. Summers are hot and humid, with temperatures reaching into the 90s. Winters are cold and snowy, with temperatures dropping into the teens.
Economy
The economy of Lykens Borough is largely based on manufacturing and services. The town is home to several factories, including a cigar factory, a shoe factory, and a shirt factory. The town also has several stores, a bank, a post office, and a hotel.
The town is also home to several small businesses, including restaurants, bars, and shops. The town is also home to several medical facilities, including a hospital and several doctors’ offices.
Demographics
According to the 2010 census, the population of Lykens Borough was 1,845 people. The population is largely white, with a small percentage of African Americans and Hispanics. The median household income is $37,000, and the median home value is $90,000.
The town is home to several churches, including the First United Methodist Church, the First Presbyterian Church, and the St. Paul’s Lutheran Church. The town also has several schools, including the Lykens Elementary School, the Lykens Middle School, and the Lykens High School.
Conclusion
Lykens Borough is a small borough located in Dauphin County, Pennsylvania. It is situated in the Susquehanna Valley, approximately 10 miles northwest of Harrisburg, the state capital. The borough is home to a population of 1,845 people, according to the 2010 census. The economy of Lykens Borough is largely based on manufacturing and services, and the town is home to several factories, stores, banks, post offices, and hotels. The population is largely white, with a small percentage of African Americans and Hispanics. The town is home to several churches, schools, and medical facilities.
Common Questions
What is Per Capita Income in Lykens borough?
Per Capita income in Lykens borough is $32,607.
What is the Median Family Income in Lykens borough?
Median Family Income in Lykens borough is $78,021.
What is the Median Household income in Lykens borough?
Median Household Income in Lykens borough is $67,768.
What is Income or Wage Gap in Lykens borough?
Income or Wage Gap in Lykens borough is 42.5%.
Women in Lykens borough earn 57.5 cents for every dollar earned by a man.
What is Inequality or Gini Index in Lykens borough?
Inequality or Gini Index in Lykens borough is 0.37.
What is the Total Population of Lykens borough?
Total Population of Lykens borough is 1,631.
What is the Total Male Population of Lykens borough?
Total Male Population of Lykens borough is 887.
What is the Total Female Population of Lykens borough?
Total Female Population of Lykens borough is 744.
What is the Ratio of Males per 100 Females in Lykens borough?
There are 119.22 Males per 100 Females in Lykens borough.
What is the Ratio of Females per 100 Males in Lykens borough?
There are 83.88 Females per 100 Males in Lykens borough.
What is the Median Population Age in Lykens borough?
Median Population Age in Lykens borough is 43.4 Years.
What is the Average Family Size in Lykens borough
Average Family Size in Lykens borough is 3.0 People.
What is the Average Household Size in Lykens borough
Average Household Size in Lykens borough is 2.2 People.
How Large is the Labor Force in Lykens borough?
There are 839 People in the Labor Forcein in Lykens borough.
What is the Percentage of People in the Labor Force in Lykens borough?
62.8% of People are in the Labor Force in Lykens borough.
What is the Unemployment Rate in Lykens borough?
Unemployment Rate in Lykens borough is 5.2%.