Taylorstown, PA Map & Demographics
Taylorstown Map
Taylorstown Overview
$26,018
PER CAPITA INCOME
$74,375
AVG FAMILY INCOME
$73,281
AVG HOUSEHOLD INCOME
8.4%
WAGE / INCOME GAP [ % ]
91.6¢/ $1
WAGE / INCOME GAP [ $ ]
0.28
INEQUALITY / GINI INDEX
262
TOTAL POPULATION
125
MALE POPULATION
137
FEMALE POPULATION
91.24
MALES / 100 FEMALES
109.60
FEMALES / 100 MALES
27.9
MEDIAN AGE
3.4
AVG FAMILY SIZE
3.3
AVG HOUSEHOLD SIZE
129
LABOR FORCE [ PEOPLE ]
74.6%
PERCENT IN LABOR FORCE
6.2%
UNEMPLOYMENT RATE
Taylorstown Zip Codes
Taylorstown Area Codes
Income in Taylorstown
Income Overview in Taylorstown
Per Capita Income in Taylorstown is $26,018, while median incomes of families and households are $74,375 and $73,281 respectively.
| Characteristic | Number | Measure |
| Per Capita Income | 262 | $26,018 |
| Median Family Income | 72 | $74,375 |
| Mean Family Income | 72 | $84,865 |
| Median Household Income | 79 | $73,281 |
| Mean Household Income | 79 | $81,919 |
| Income Deficit | 72 | $0 |
| Wage / Income Gap (%) | 262 | 8.42% |
| Wage / Income Gap ($) | 262 | 91.58¢ per $1 |
| Gini / Inequality Index | 262 | 0.28 |
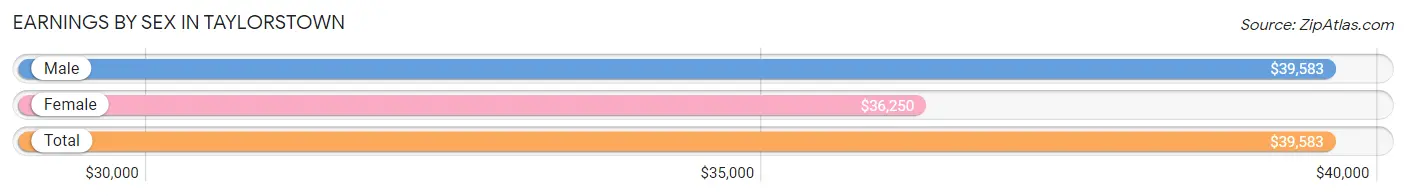
Earnings by Sex in Taylorstown
Average Earnings in Taylorstown are $39,583, $39,583 for men and $36,250 for women, a difference of 8.4%.
| Sex | Number | Average Earnings |
| Male | 57 (44.2%) | $39,583 |
| Female | 72 (55.8%) | $36,250 |
| Total | 129 (100.0%) | $39,583 |
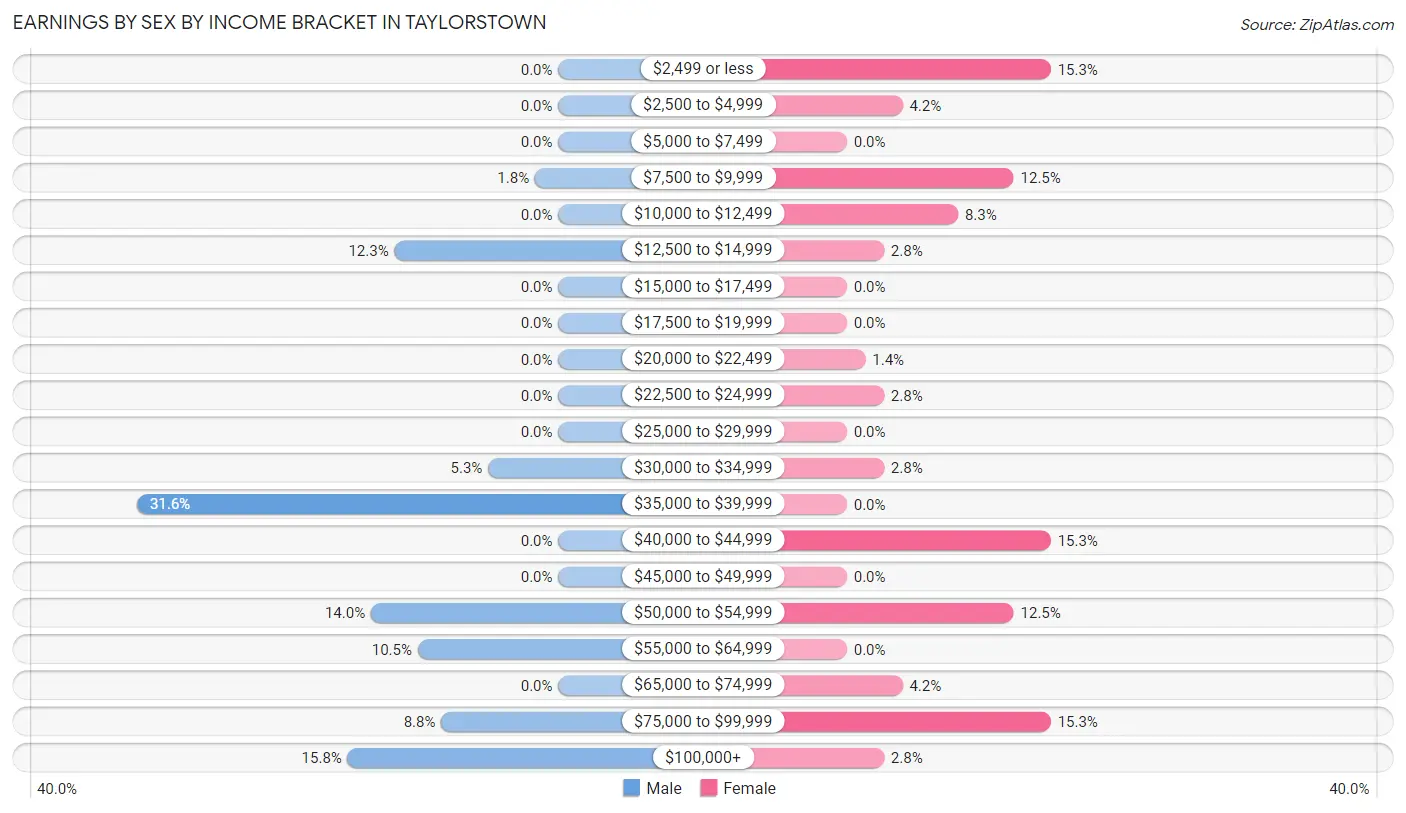
Earnings by Sex by Income Bracket in Taylorstown
The most common earnings brackets in Taylorstown are $35,000 to $39,999 for men (18 | 31.6%) and $2,499 or less for women (11 | 15.3%).
| Income | Male | Female |
| $2,499 or less | 0 (0.0%) | 11 (15.3%) |
| $2,500 to $4,999 | 0 (0.0%) | 3 (4.2%) |
| $5,000 to $7,499 | 0 (0.0%) | 0 (0.0%) |
| $7,500 to $9,999 | 1 (1.8%) | 9 (12.5%) |
| $10,000 to $12,499 | 0 (0.0%) | 6 (8.3%) |
| $12,500 to $14,999 | 7 (12.3%) | 2 (2.8%) |
| $15,000 to $17,499 | 0 (0.0%) | 0 (0.0%) |
| $17,500 to $19,999 | 0 (0.0%) | 0 (0.0%) |
| $20,000 to $22,499 | 0 (0.0%) | 1 (1.4%) |
| $22,500 to $24,999 | 0 (0.0%) | 2 (2.8%) |
| $25,000 to $29,999 | 0 (0.0%) | 0 (0.0%) |
| $30,000 to $34,999 | 3 (5.3%) | 2 (2.8%) |
| $35,000 to $39,999 | 18 (31.6%) | 0 (0.0%) |
| $40,000 to $44,999 | 0 (0.0%) | 11 (15.3%) |
| $45,000 to $49,999 | 0 (0.0%) | 0 (0.0%) |
| $50,000 to $54,999 | 8 (14.0%) | 9 (12.5%) |
| $55,000 to $64,999 | 6 (10.5%) | 0 (0.0%) |
| $65,000 to $74,999 | 0 (0.0%) | 3 (4.2%) |
| $75,000 to $99,999 | 5 (8.8%) | 11 (15.3%) |
| $100,000+ | 9 (15.8%) | 2 (2.8%) |
| Total | 57 (100.0%) | 72 (100.0%) |
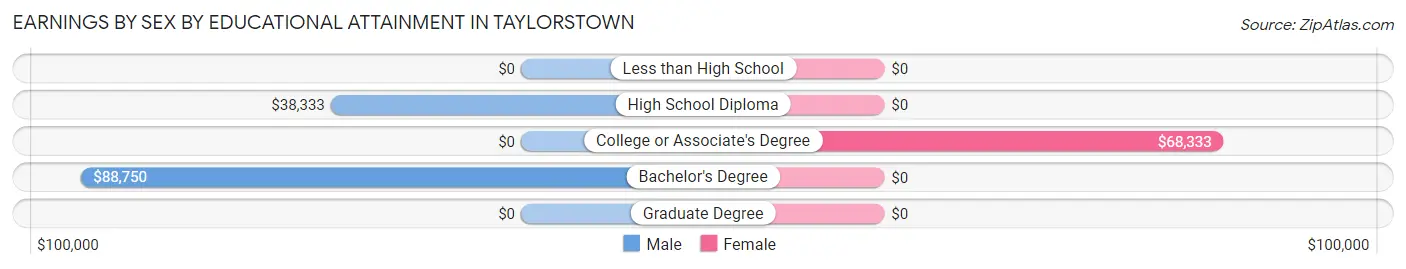
Earnings by Sex by Educational Attainment in Taylorstown
Average earnings in Taylorstown are $37,250 for men and $41,250 for women, a difference of 9.7%. Men with an educational attainment of bachelor's degree enjoy the highest average annual earnings of $88,750, while those with high school diploma education earn the least with $38,333. Women with an educational attainment of college or associate's degree earn the most with the average annual earnings of $68,333, while those with college or associate's degree education have the smallest earnings of $68,333.
| Educational Attainment | Male Income | Female Income |
| Less than High School | - | - |
| High School Diploma | $38,333 | $0 |
| College or Associate's Degree | - | - |
| Bachelor's Degree | $88,750 | $0 |
| Graduate Degree | - | - |
| Total | $37,250 | $41,250 |
Family Income in Taylorstown
Family Income Brackets in Taylorstown
According to the Taylorstown family income data, there are 27 families falling into the $50,000 to $74,999 income range, which is the most common income bracket and makes up 37.5% of all families.
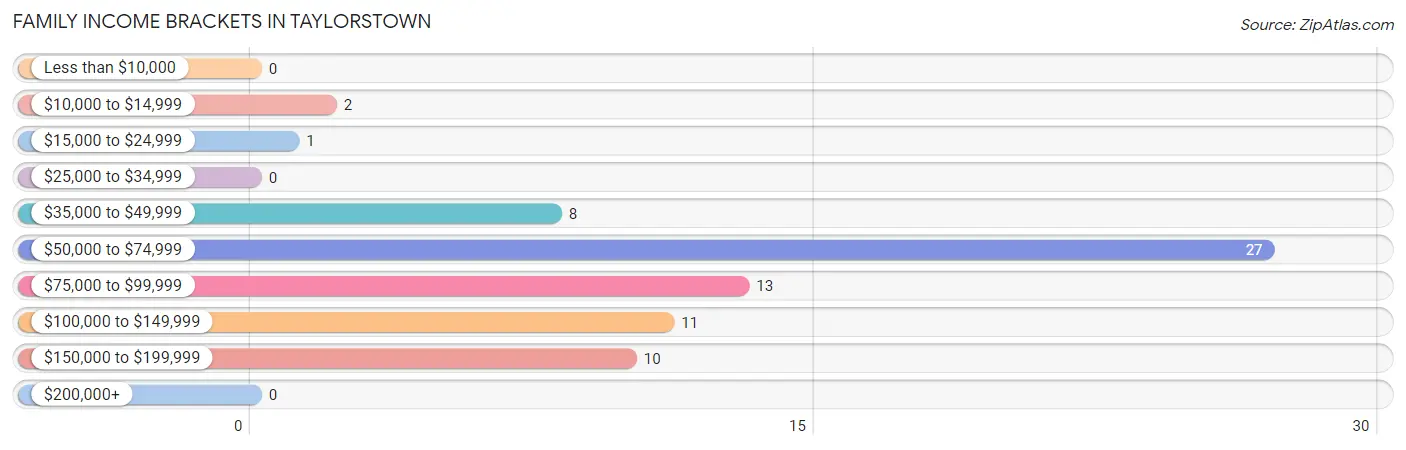
| Income Bracket | # Families | % Families |
| Less than $10,000 | 0 | 0.0% |
| $10,000 to $14,999 | 2 | 2.8% |
| $15,000 to $24,999 | 1 | 1.4% |
| $25,000 to $34,999 | 0 | 0.0% |
| $35,000 to $49,999 | 8 | 11.1% |
| $50,000 to $74,999 | 27 | 37.5% |
| $75,000 to $99,999 | 13 | 18.1% |
| $100,000 to $149,999 | 11 | 15.3% |
| $150,000 to $199,999 | 10 | 13.9% |
| $200,000+ | 0 | 0.0% |
Family Income by Famaliy Size in Taylorstown
3-person families (19 | 26.4%) account for the highest median family income in Taylorstown with $82,750 per family, while 2-person families (30 | 41.7%) have the highest median income of $28,594 per family member.
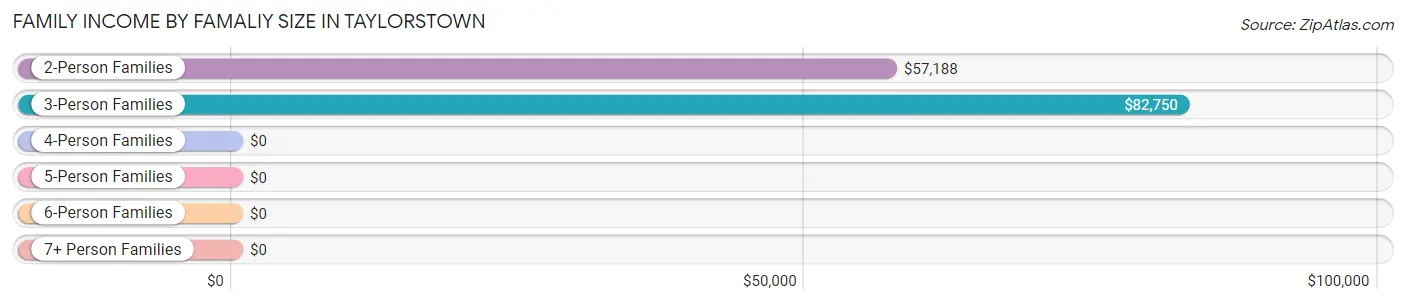
| Income Bracket | # Families | Median Income |
| 2-Person Families | 30 (41.7%) | $57,188 |
| 3-Person Families | 19 (26.4%) | $82,750 |
| 4-Person Families | 18 (25.0%) | $0 |
| 5-Person Families | 0 (0.0%) | $0 |
| 6-Person Families | 0 (0.0%) | $0 |
| 7+ Person Families | 5 (6.9%) | $0 |
| Total | 72 (100.0%) | $74,375 |
Family Income by Number of Earners in Taylorstown
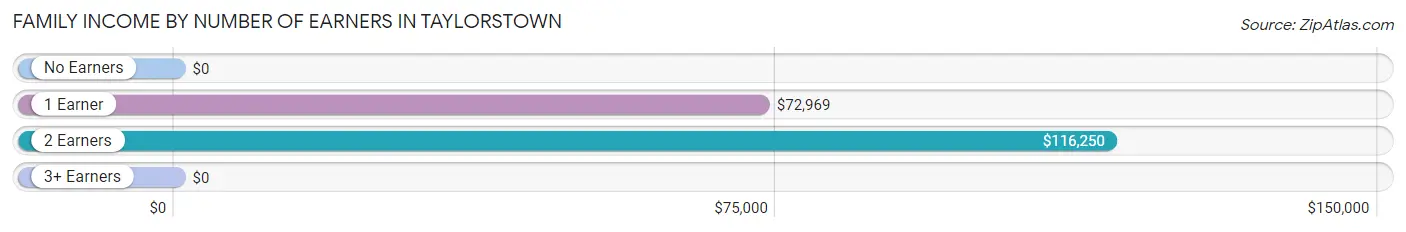
| Number of Earners | # Families | Median Income |
| No Earners | 4 (5.6%) | $0 |
| 1 Earner | 33 (45.8%) | $72,969 |
| 2 Earners | 30 (41.7%) | $116,250 |
| 3+ Earners | 5 (6.9%) | $0 |
| Total | 72 (100.0%) | $74,375 |
Household Income in Taylorstown
Household Income Brackets in Taylorstown
With 29 households falling in the category, the $50,000 to $74,999 income range is the most frequent in Taylorstown, accounting for 36.7% of all households.
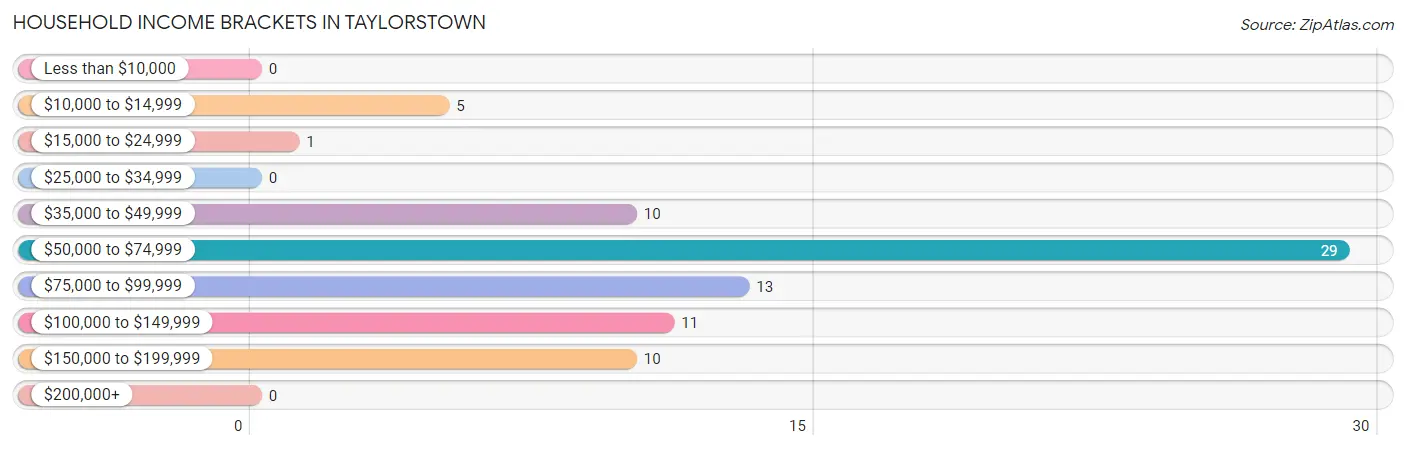
| Income Bracket | # Households | % Households |
| Less than $10,000 | 0 | 0.0% |
| $10,000 to $14,999 | 5 | 6.3% |
| $15,000 to $24,999 | 1 | 1.3% |
| $25,000 to $34,999 | 0 | 0.0% |
| $35,000 to $49,999 | 10 | 12.7% |
| $50,000 to $74,999 | 29 | 36.7% |
| $75,000 to $99,999 | 13 | 16.5% |
| $100,000 to $149,999 | 11 | 13.9% |
| $150,000 to $199,999 | 10 | 12.7% |
| $200,000+ | 0 | 0.0% |
Household Income by Householder Age in Taylorstown
The median household income in Taylorstown is $73,281, with the highest median household income of $99,500 found in the 25 to 44 years age bracket for the primary householder. A total of 30 households (38.0%) fall into this category. Meanwhile, the 15 to 24 years age bracket for the primary householder has the lowest median household income of $0, with 8 households (10.1%) in this group.
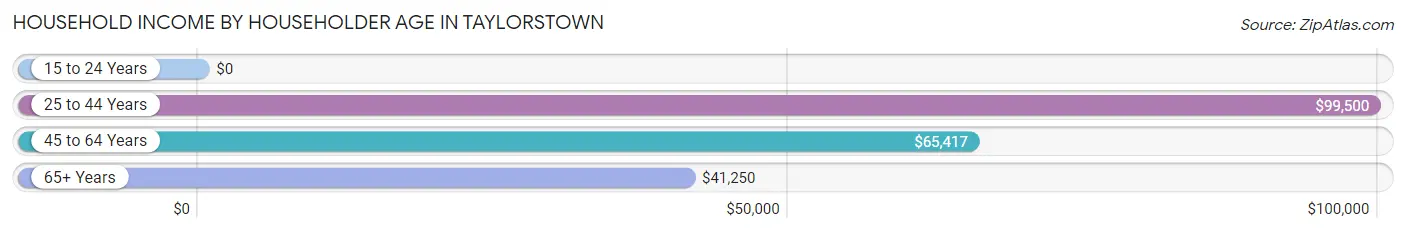
| Income Bracket | # Households | Median Income |
| 15 to 24 Years | 8 (10.1%) | $0 |
| 25 to 44 Years | 30 (38.0%) | $99,500 |
| 45 to 64 Years | 23 (29.1%) | $65,417 |
| 65+ Years | 18 (22.8%) | $41,250 |
| Total | 79 (100.0%) | $73,281 |
Poverty in Taylorstown
Income Below Poverty by Sex and Age in Taylorstown
With 9.6% poverty level for males and 1.5% for females among the residents of Taylorstown, 25 to 34 year old males and 75 year old and over females are the most vulnerable to poverty, with 7 males (70.0%) and 2 females (22.2%) in their respective age groups living below the poverty level.
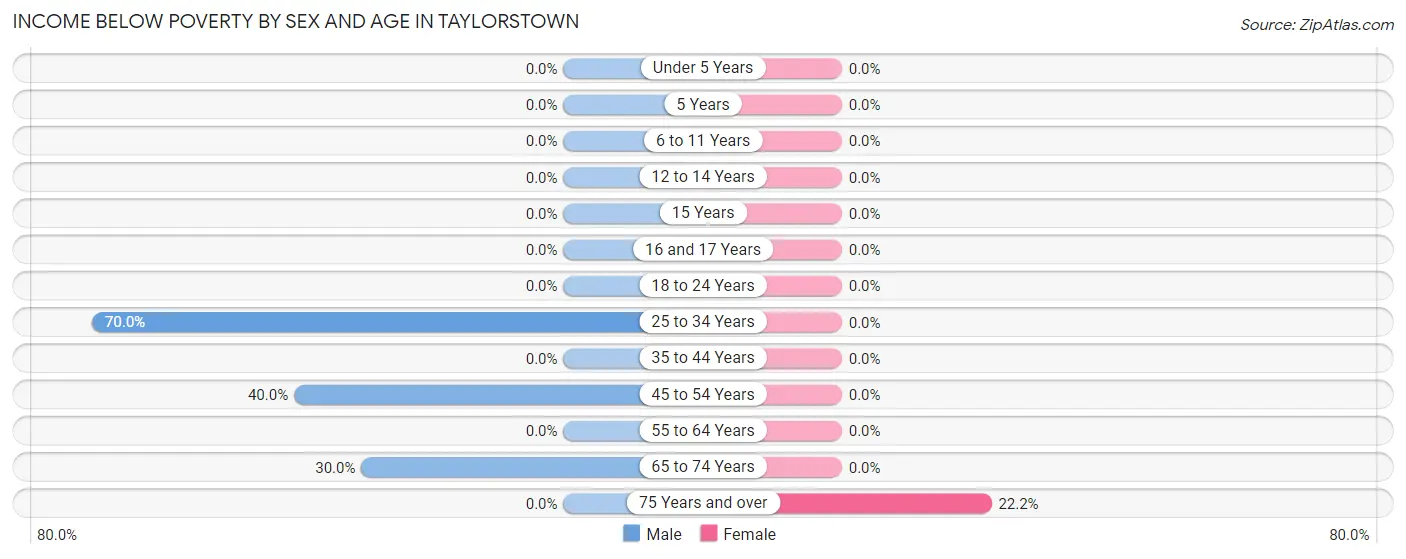
| Age Bracket | Male | Female |
| Under 5 Years | 0 (0.0%) | 0 (0.0%) |
| 5 Years | 0 (0.0%) | 0 (0.0%) |
| 6 to 11 Years | 0 (0.0%) | 0 (0.0%) |
| 12 to 14 Years | 0 (0.0%) | 0 (0.0%) |
| 15 Years | 0 (0.0%) | 0 (0.0%) |
| 16 and 17 Years | 0 (0.0%) | 0 (0.0%) |
| 18 to 24 Years | 0 (0.0%) | 0 (0.0%) |
| 25 to 34 Years | 7 (70.0%) | 0 (0.0%) |
| 35 to 44 Years | 0 (0.0%) | 0 (0.0%) |
| 45 to 54 Years | 2 (40.0%) | 0 (0.0%) |
| 55 to 64 Years | 0 (0.0%) | 0 (0.0%) |
| 65 to 74 Years | 3 (30.0%) | 0 (0.0%) |
| 75 Years and over | 0 (0.0%) | 2 (22.2%) |
| Total | 12 (9.6%) | 2 (1.5%) |
Income Above Poverty by Sex and Age in Taylorstown
According to the poverty statistics in Taylorstown, males aged under 5 years and females aged under 5 years are the age groups that are most secure financially, with 100.0% of males and 100.0% of females in these age groups living above the poverty line.
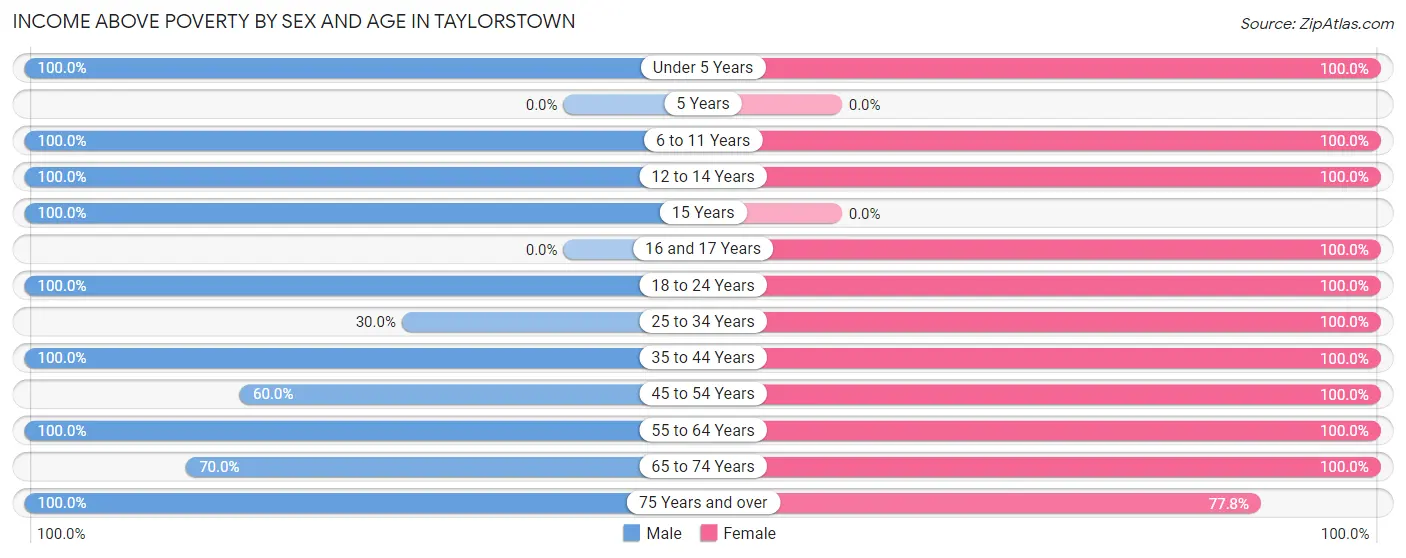
| Age Bracket | Male | Female |
| Under 5 Years | 20 (100.0%) | 19 (100.0%) |
| 5 Years | 0 (0.0%) | 0 (0.0%) |
| 6 to 11 Years | 22 (100.0%) | 12 (100.0%) |
| 12 to 14 Years | 6 (100.0%) | 7 (100.0%) |
| 15 Years | 3 (100.0%) | 0 (0.0%) |
| 16 and 17 Years | 0 (0.0%) | 11 (100.0%) |
| 18 to 24 Years | 8 (100.0%) | 8 (100.0%) |
| 25 to 34 Years | 3 (30.0%) | 21 (100.0%) |
| 35 to 44 Years | 23 (100.0%) | 13 (100.0%) |
| 45 to 54 Years | 3 (60.0%) | 19 (100.0%) |
| 55 to 64 Years | 14 (100.0%) | 13 (100.0%) |
| 65 to 74 Years | 7 (70.0%) | 5 (100.0%) |
| 75 Years and over | 4 (100.0%) | 7 (77.8%) |
| Total | 113 (90.4%) | 135 (98.5%) |
Income Below Poverty Among Married-Couple Families in Taylorstown
The poverty statistics for married-couple families in Taylorstown show that 3.5% or 2 of the total 57 families live below the poverty line. Families with no children have the highest poverty rate of 9.1%, comprising of 2 families. On the other hand, families with 1 or 2 children have the lowest poverty rate of 0.0%, which includes 0 families.
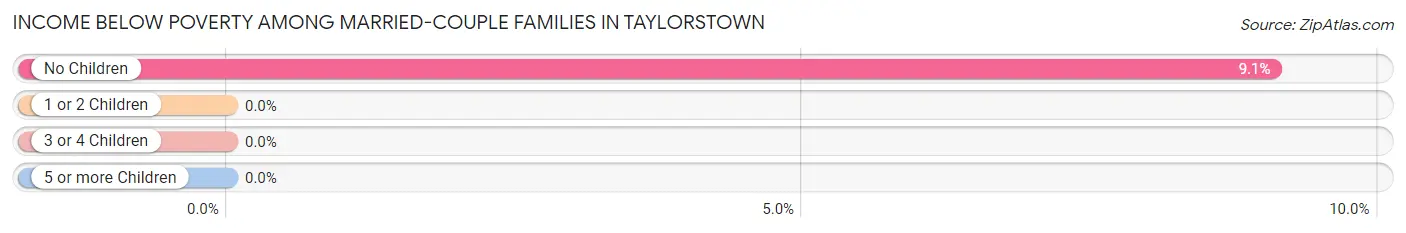
| Children | Above Poverty | Below Poverty |
| No Children | 20 (90.9%) | 2 (9.1%) |
| 1 or 2 Children | 30 (100.0%) | 0 (0.0%) |
| 3 or 4 Children | 0 (0.0%) | 0 (0.0%) |
| 5 or more Children | 5 (100.0%) | 0 (0.0%) |
| Total | 55 (96.5%) | 2 (3.5%) |
Income Below Poverty Among Single-Parent Households in Taylorstown
| Children | Single Father | Single Mother |
| No Children | 0 (0.0%) | 0 (0.0%) |
| 1 or 2 Children | 0 (0.0%) | 0 (0.0%) |
| 3 or 4 Children | 0 (0.0%) | 0 (0.0%) |
| 5 or more Children | 0 (0.0%) | 0 (0.0%) |
| Total | 0 (0.0%) | 0 (0.0%) |
Income Below Poverty Among Married-Couple vs Single-Parent Households in Taylorstown
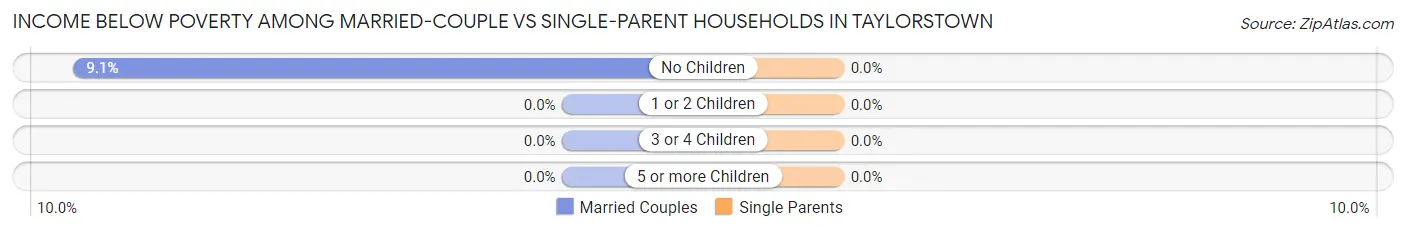
| Children | Married-Couple Families | Single-Parent Households |
| No Children | 2 (9.1%) | 0 (0.0%) |
| 1 or 2 Children | 0 (0.0%) | 0 (0.0%) |
| 3 or 4 Children | 0 (0.0%) | 0 (0.0%) |
| 5 or more Children | 0 (0.0%) | 0 (0.0%) |
| Total | 2 (3.5%) | 0 (0.0%) |
Race in Taylorstown
The most populous races in Taylorstown are White / Caucasian (223 | 85.1%), and Two or more Races (39 | 14.9%).
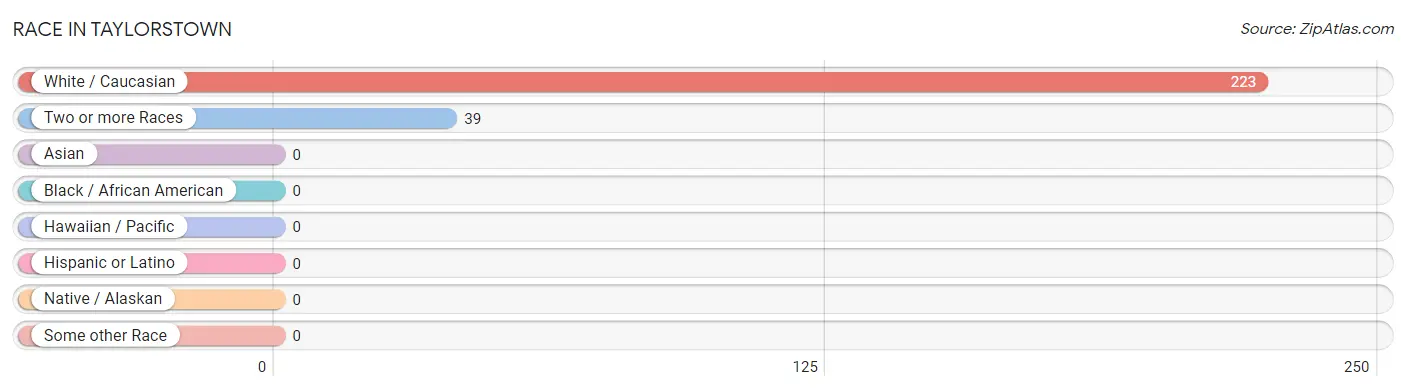
| Race | # Population | % Population |
| Asian | 0 | 0.0% |
| Black / African American | 0 | 0.0% |
| Hawaiian / Pacific | 0 | 0.0% |
| Hispanic or Latino | 0 | 0.0% |
| Native / Alaskan | 0 | 0.0% |
| White / Caucasian | 223 | 85.1% |
| Two or more Races | 39 | 14.9% |
| Some other Race | 0 | 0.0% |
| Total | 262 | 100.0% |
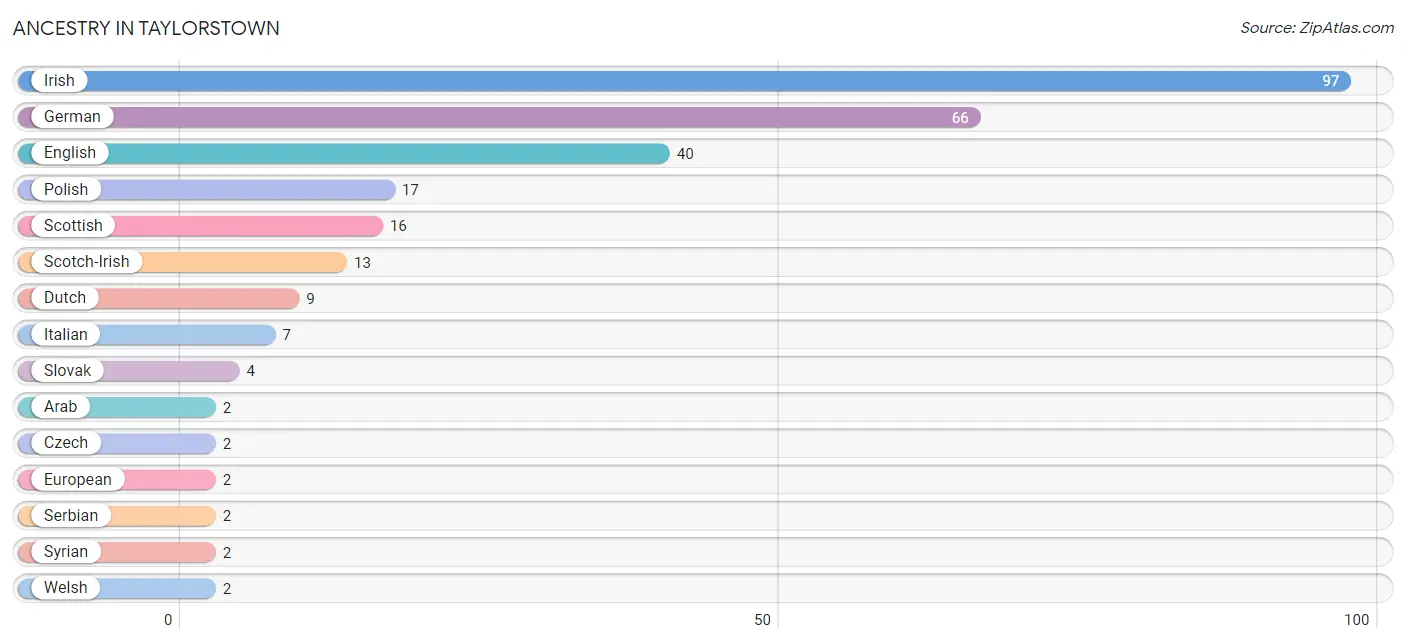
Ancestry in Taylorstown
The most populous ancestries reported in Taylorstown are Irish (97 | 37.0%), German (66 | 25.2%), English (40 | 15.3%), Polish (17 | 6.5%), and Scottish (16 | 6.1%), together accounting for 90.1% of all Taylorstown residents.
| Ancestry | # Population | % Population |
| Arab | 2 | 0.8% |
| Czech | 2 | 0.8% |
| Dutch | 9 | 3.4% |
| English | 40 | 15.3% |
| European | 2 | 0.8% |
| German | 66 | 25.2% |
| Irish | 97 | 37.0% |
| Italian | 7 | 2.7% |
| Polish | 17 | 6.5% |
| Scotch-Irish | 13 | 5.0% |
| Scottish | 16 | 6.1% |
| Serbian | 2 | 0.8% |
| Slovak | 4 | 1.5% |
| Syrian | 2 | 0.8% |
| Welsh | 2 | 0.8% | View All 15 Rows |
Immigrants in Taylorstown

| Immigration Origin | # Population | % Population | View All 0 Rows |
Sex and Age in Taylorstown
Sex and Age in Taylorstown
The most populous age groups in Taylorstown are Under 5 Years (20 | 16.0%) for men and Under 5 Years (19 | 13.9%) for women.
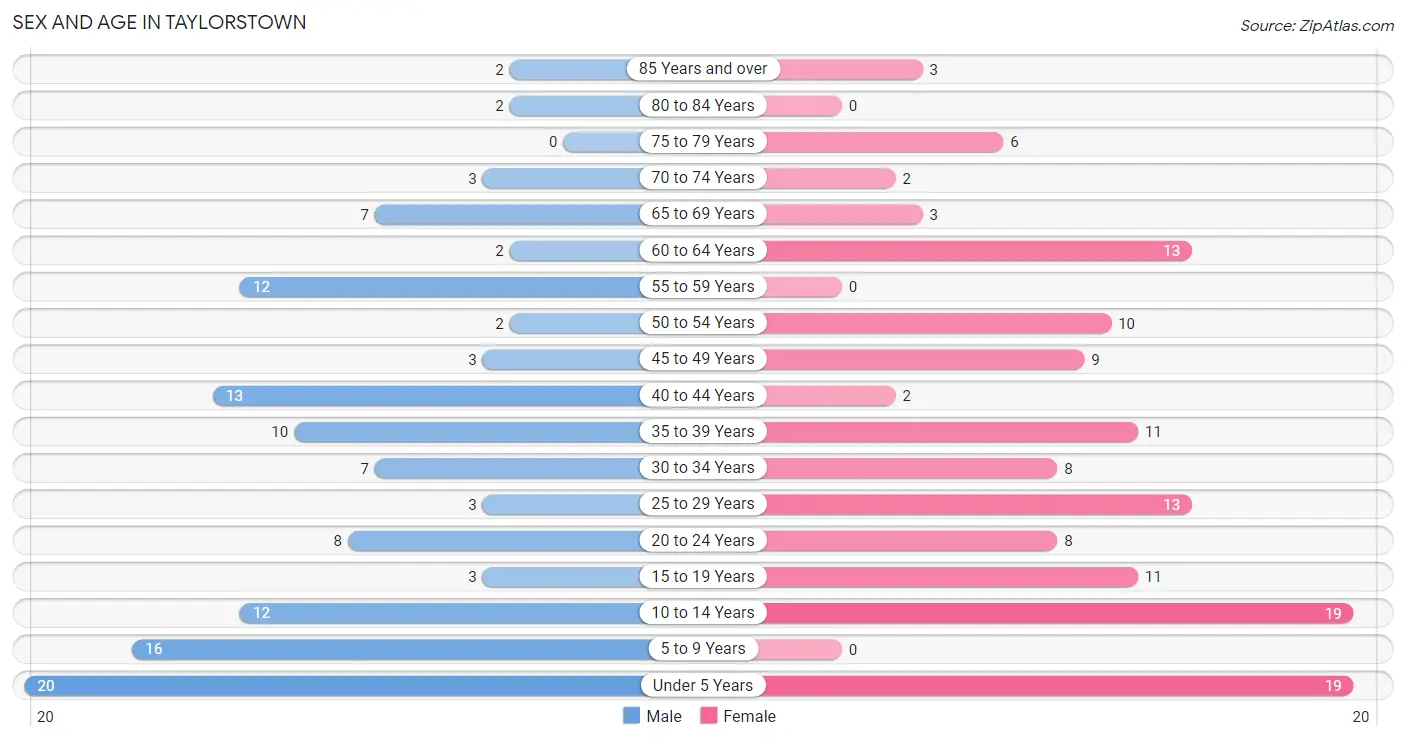
| Age Bracket | Male | Female |
| Under 5 Years | 20 (16.0%) | 19 (13.9%) |
| 5 to 9 Years | 16 (12.8%) | 0 (0.0%) |
| 10 to 14 Years | 12 (9.6%) | 19 (13.9%) |
| 15 to 19 Years | 3 (2.4%) | 11 (8.0%) |
| 20 to 24 Years | 8 (6.4%) | 8 (5.8%) |
| 25 to 29 Years | 3 (2.4%) | 13 (9.5%) |
| 30 to 34 Years | 7 (5.6%) | 8 (5.8%) |
| 35 to 39 Years | 10 (8.0%) | 11 (8.0%) |
| 40 to 44 Years | 13 (10.4%) | 2 (1.5%) |
| 45 to 49 Years | 3 (2.4%) | 9 (6.6%) |
| 50 to 54 Years | 2 (1.6%) | 10 (7.3%) |
| 55 to 59 Years | 12 (9.6%) | 0 (0.0%) |
| 60 to 64 Years | 2 (1.6%) | 13 (9.5%) |
| 65 to 69 Years | 7 (5.6%) | 3 (2.2%) |
| 70 to 74 Years | 3 (2.4%) | 2 (1.5%) |
| 75 to 79 Years | 0 (0.0%) | 6 (4.4%) |
| 80 to 84 Years | 2 (1.6%) | 0 (0.0%) |
| 85 Years and over | 2 (1.6%) | 3 (2.2%) |
| Total | 125 (100.0%) | 137 (100.0%) |
Families and Households in Taylorstown
Median Family Size in Taylorstown
The median family size in Taylorstown is 3.39 persons per family, with married-couple families (57 | 79.2%) accounting for the largest median family size of 3.58 persons per family. On the other hand, single female/mother families (13 | 18.1%) represent the smallest median family size with 2.54 persons per family.
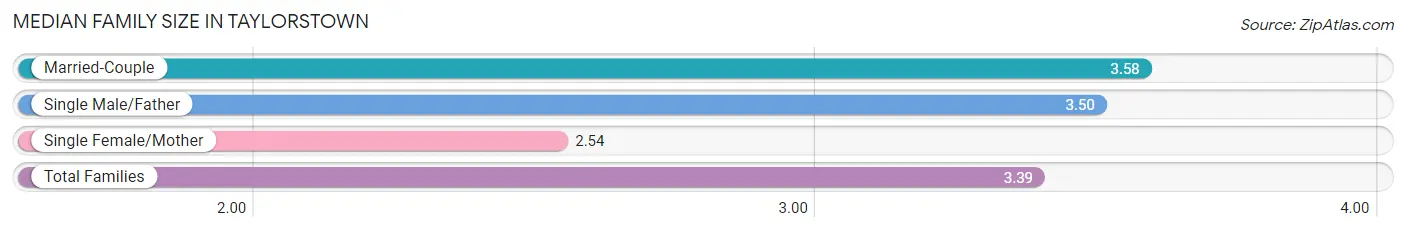
| Family Type | # Families | Family Size |
| Married-Couple | 57 (79.2%) | 3.58 |
| Single Male/Father | 2 (2.8%) | 3.50 |
| Single Female/Mother | 13 (18.1%) | 2.54 |
| Total Families | 72 (100.0%) | 3.39 |
Median Household Size in Taylorstown
The median household size in Taylorstown is 3.32 persons per household, with single male/father households (2 | 2.5%) accounting for the largest median household size of 4.5 persons per household. non-family households (7 | 8.9%) represent the smallest median household size with 1.29 persons per household.
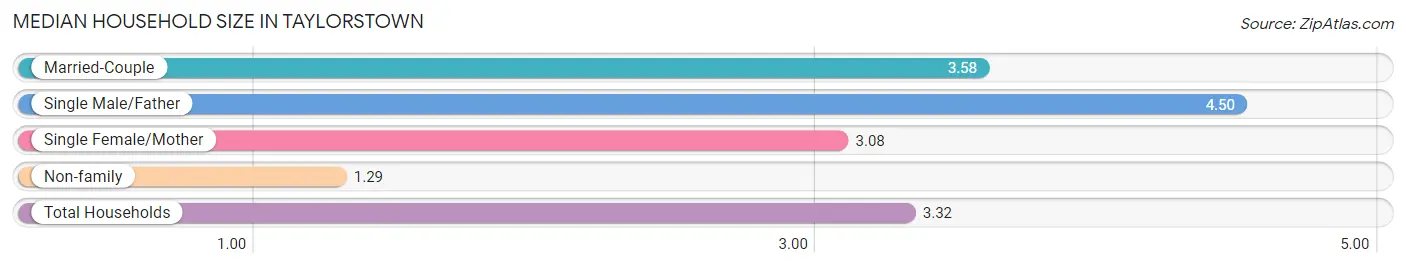
| Household Type | # Households | Household Size |
| Married-Couple | 57 (72.2%) | 3.58 |
| Single Male/Father | 2 (2.5%) | 4.50 |
| Single Female/Mother | 13 (16.5%) | 3.08 |
| Non-family | 7 (8.9%) | 1.29 |
| Total Households | 79 (100.0%) | 3.32 |
Household Size by Marriage Status in Taylorstown
Out of a total of 79 households in Taylorstown, 72 (91.1%) are family households, while 7 (8.9%) are nonfamily households. The most numerous type of family households are 2-person households, comprising 30, and the most common type of nonfamily households are 1-person households, comprising 5.
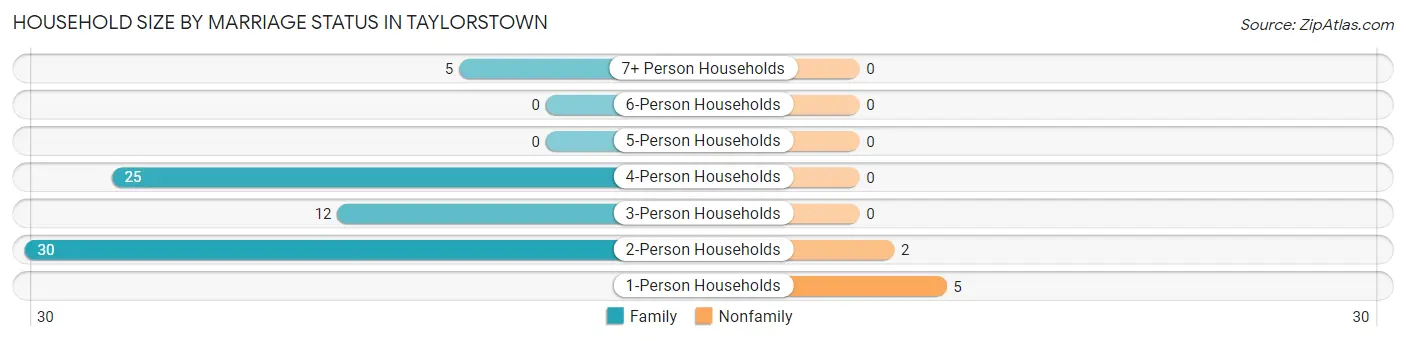
| Household Size | Family Households | Nonfamily Households |
| 1-Person Households | - | 5 (6.3%) |
| 2-Person Households | 30 (38.0%) | 2 (2.5%) |
| 3-Person Households | 12 (15.2%) | 0 (0.0%) |
| 4-Person Households | 25 (31.7%) | 0 (0.0%) |
| 5-Person Households | 0 (0.0%) | 0 (0.0%) |
| 6-Person Households | 0 (0.0%) | 0 (0.0%) |
| 7+ Person Households | 5 (6.3%) | 0 (0.0%) |
| Total | 72 (91.1%) | 7 (8.9%) |
Female Fertility in Taylorstown
Fertility by Age in Taylorstown
| Age Bracket | Women with Births | Births / 1,000 Women |
| 15 to 19 years | 0 (0.0%) | 0.0 |
| 20 to 34 years | 0 (0.0%) | 0.0 |
| 35 to 50 years | 0 (0.0%) | 0.0 |
| Total | 0 (0.0%) | 0.0 |
Fertility by Age by Marriage Status in Taylorstown
| Age Bracket | Married | Unmarried |
| 15 to 19 years | 0 (0.0%) | 0 (0.0%) |
| 20 to 34 years | 0 (0.0%) | 0 (0.0%) |
| 35 to 50 years | 0 (0.0%) | 0 (0.0%) |
| Total | 0 (0.0%) | 0 (0.0%) |
Fertility by Education in Taylorstown
| Educational Attainment | Women with Births | Births / 1,000 Women |
| Less than High School | 0 (0.0%) | 0.0 |
| High School Diploma | 0 (0.0%) | 0.0 |
| College or Associate's Degree | 0 (0.0%) | 0.0 |
| Bachelor's Degree | 0 (0.0%) | 0.0 |
| Graduate Degree | 0 (0.0%) | 0.0 |
| Total | 0 (0.0%) | 0.0 |
Fertility by Education by Marriage Status in Taylorstown
| Educational Attainment | Married | Unmarried |
| Less than High School | 0 (0.0%) | 0 (0.0%) |
| High School Diploma | 0 (0.0%) | 0 (0.0%) |
| College or Associate's Degree | 0 (0.0%) | 0 (0.0%) |
| Bachelor's Degree | 0 (0.0%) | 0 (0.0%) |
| Graduate Degree | 0 (0.0%) | 0 (0.0%) |
| Total | 0 (0.0%) | 0 (0.0%) |
Employment Characteristics in Taylorstown
Employment by Class of Employer in Taylorstown
Among the 121 employed individuals in Taylorstown, private company employees (85 | 70.3%), not-for-profit organizations (17 | 14.1%), and local government employees (17 | 14.1%) make up the most common classes of employment.
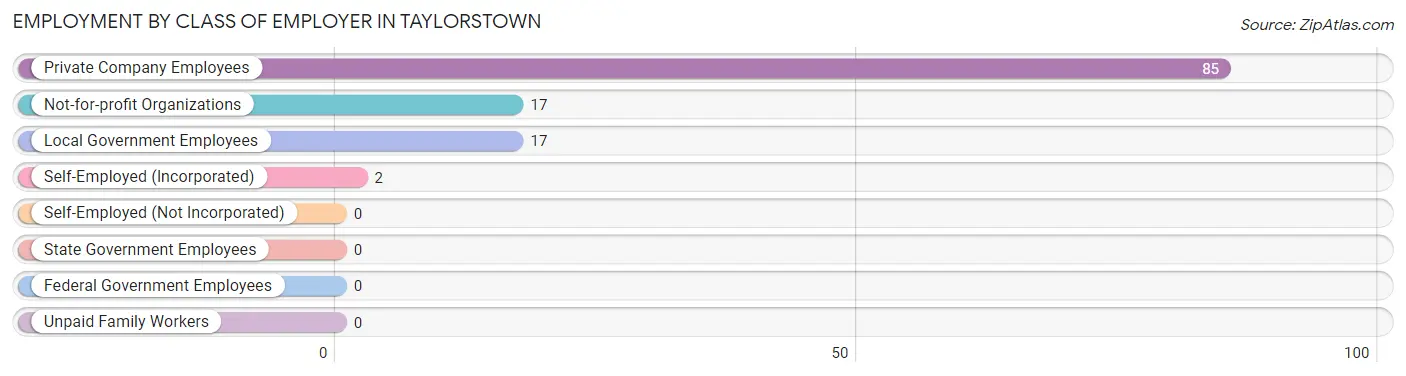
| Employer Class | # Employees | % Employees |
| Private Company Employees | 85 | 70.3% |
| Self-Employed (Incorporated) | 2 | 1.7% |
| Self-Employed (Not Incorporated) | 0 | 0.0% |
| Not-for-profit Organizations | 17 | 14.1% |
| Local Government Employees | 17 | 14.1% |
| State Government Employees | 0 | 0.0% |
| Federal Government Employees | 0 | 0.0% |
| Unpaid Family Workers | 0 | 0.0% |
| Total | 121 | 100.0% |
Employment Status by Age in Taylorstown
According to the labor force statistics for Taylorstown, out of the total population over 16 years of age (173), 74.6% or 129 individuals are in the labor force, with 6.2% or 8 of them unemployed. The age group with the highest labor force participation rate is 16 to 19 years, with 100.0% or 11 individuals in the labor force. Within the labor force, the 16 to 19 years age range has the highest percentage of unemployed individuals, with 72.7% or 8 of them being unemployed.
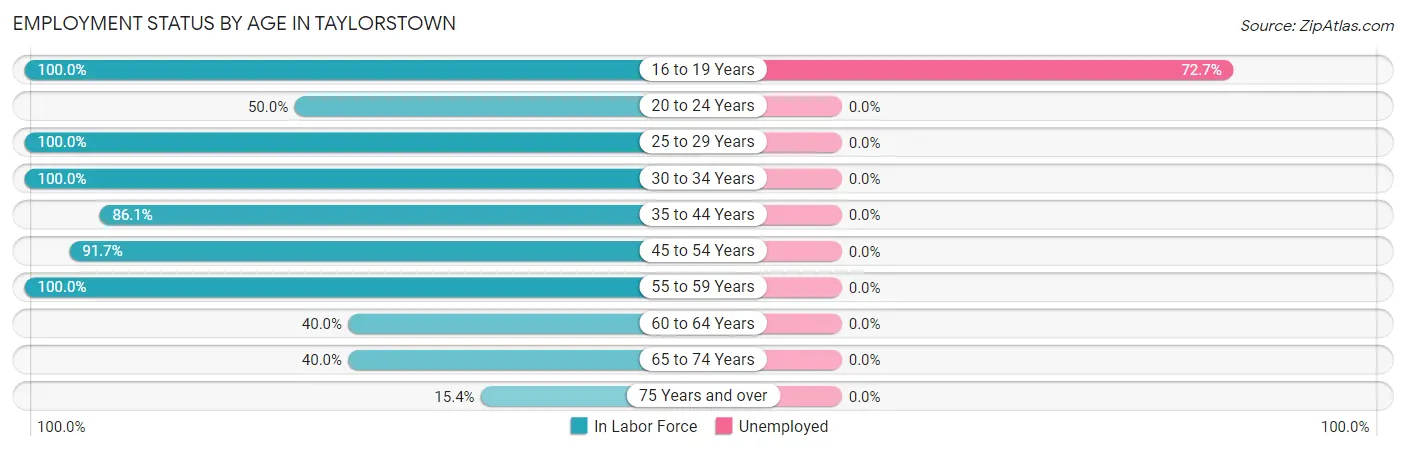
| Age Bracket | In Labor Force | Unemployed |
| 16 to 19 Years | 11 (100.0%) | 8 (72.7%) |
| 20 to 24 Years | 8 (50.0%) | 0 (0.0%) |
| 25 to 29 Years | 16 (100.0%) | 0 (0.0%) |
| 30 to 34 Years | 15 (100.0%) | 0 (0.0%) |
| 35 to 44 Years | 31 (86.1%) | 0 (0.0%) |
| 45 to 54 Years | 22 (91.7%) | 0 (0.0%) |
| 55 to 59 Years | 12 (100.0%) | 0 (0.0%) |
| 60 to 64 Years | 6 (40.0%) | 0 (0.0%) |
| 65 to 74 Years | 6 (40.0%) | 0 (0.0%) |
| 75 Years and over | 2 (15.4%) | 0 (0.0%) |
| Total | 129 (74.6%) | 8 (6.2%) |
Employment Status by Educational Attainment in Taylorstown
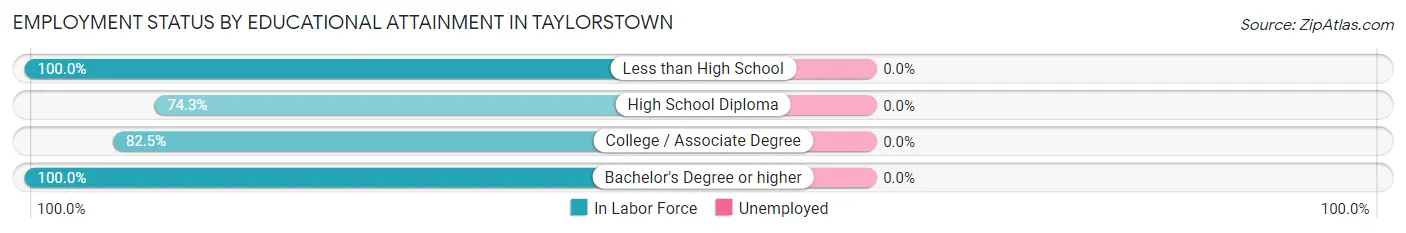
| Educational Attainment | In Labor Force | Unemployed |
| Less than High School | 12 (100.0%) | 0 (0.0%) |
| High School Diploma | 26 (74.3%) | 0 (0.0%) |
| College / Associate Degree | 33 (82.5%) | 0 (0.0%) |
| Bachelor's Degree or higher | 31 (100.0%) | 0 (0.0%) |
| Total | 102 (86.4%) | 0 (0.0%) |
Employment Occupations by Sex in Taylorstown
Management, Business, Science and Arts Occupations
The most common Management, Business, Science and Arts occupations in Taylorstown are Management (15 | 12.4%), Community & Social Service (10 | 8.3%), Education Instruction & Library (10 | 8.3%), Health Diagnosing & Treating (5 | 4.1%), and Business & Financial (2 | 1.7%).
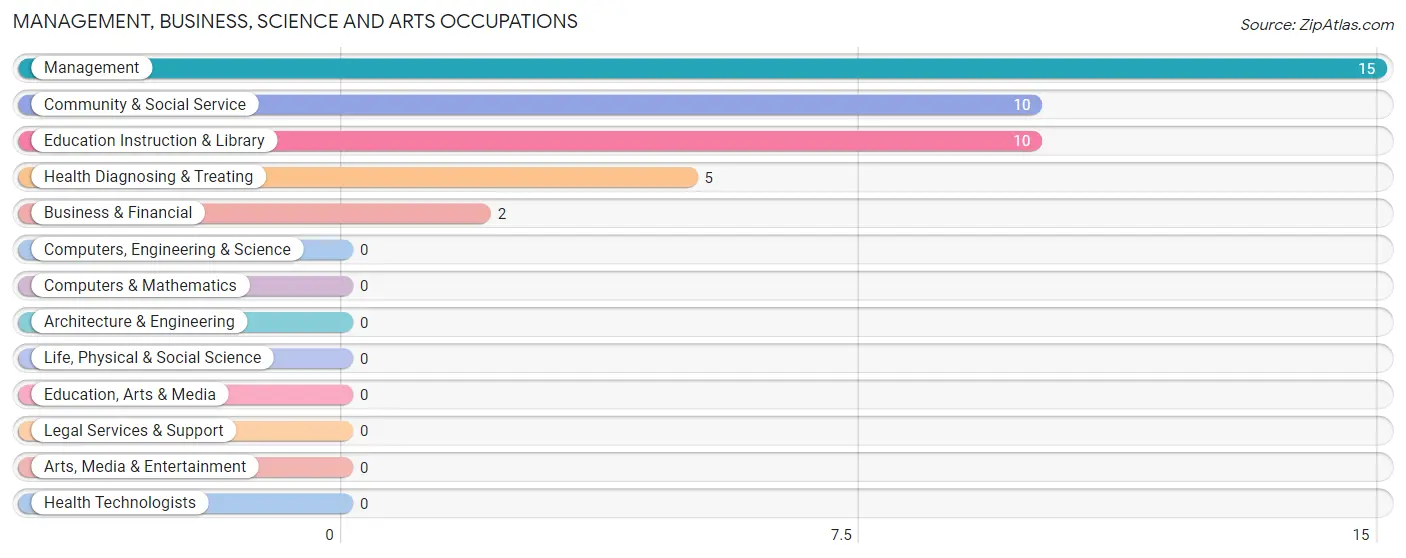
Management, Business, Science and Arts Occupations by Sex
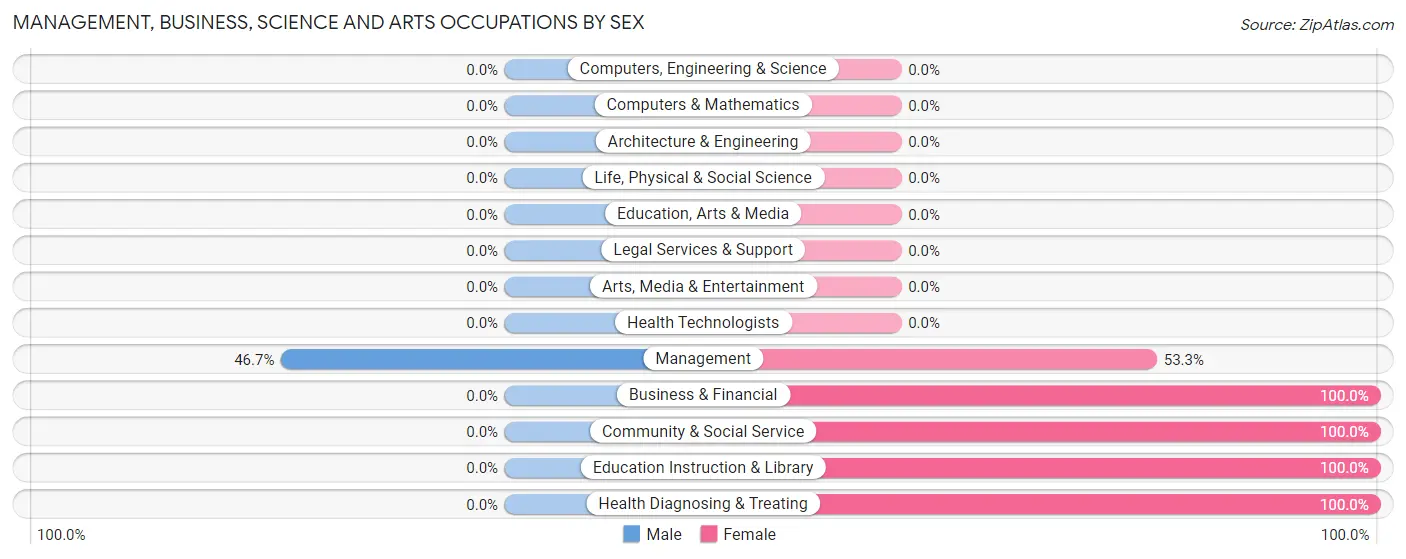
| Occupation | Male | Female |
| Management | 7 (46.7%) | 8 (53.3%) |
| Business & Financial | 0 (0.0%) | 2 (100.0%) |
| Computers, Engineering & Science | 0 (0.0%) | 0 (0.0%) |
| Computers & Mathematics | 0 (0.0%) | 0 (0.0%) |
| Architecture & Engineering | 0 (0.0%) | 0 (0.0%) |
| Life, Physical & Social Science | 0 (0.0%) | 0 (0.0%) |
| Community & Social Service | 0 (0.0%) | 10 (100.0%) |
| Education, Arts & Media | 0 (0.0%) | 0 (0.0%) |
| Legal Services & Support | 0 (0.0%) | 0 (0.0%) |
| Education Instruction & Library | 0 (0.0%) | 10 (100.0%) |
| Arts, Media & Entertainment | 0 (0.0%) | 0 (0.0%) |
| Health Diagnosing & Treating | 0 (0.0%) | 5 (100.0%) |
| Health Technologists | 0 (0.0%) | 0 (0.0%) |
| Total (Category) | 7 (21.9%) | 25 (78.1%) |
| Total (Overall) | 57 (47.1%) | 64 (52.9%) |
Services Occupations
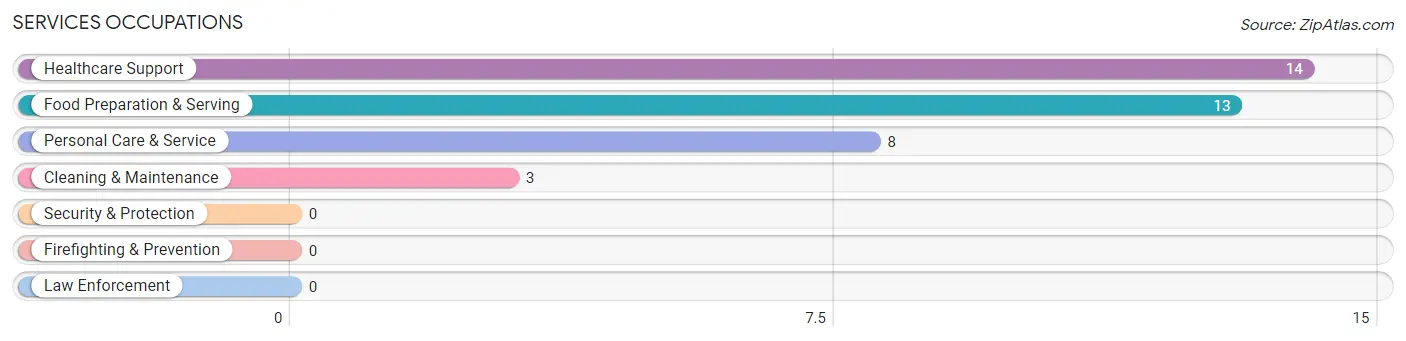
The most common Services occupations in Taylorstown are Healthcare Support (14 | 11.6%), Food Preparation & Serving (13 | 10.7%), Personal Care & Service (8 | 6.6%), and Cleaning & Maintenance (3 | 2.5%).
Services Occupations by Sex
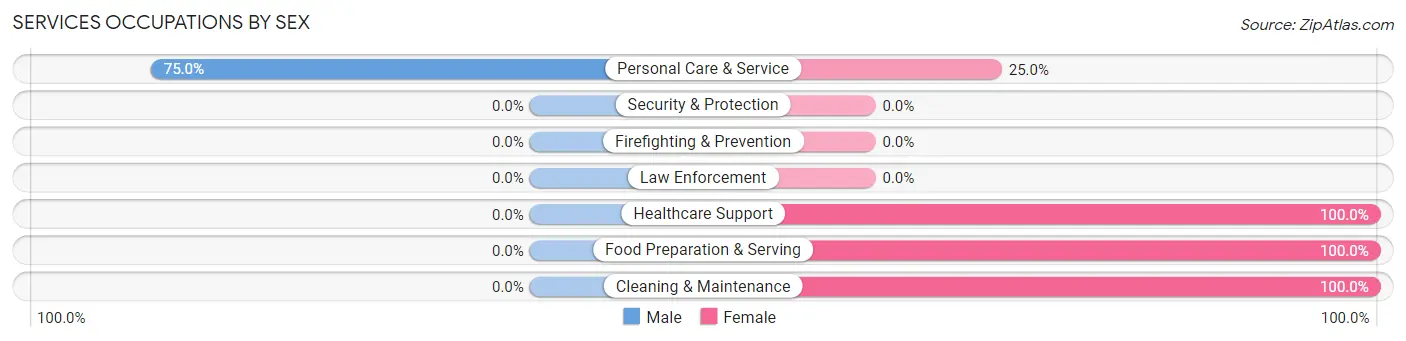
| Occupation | Male | Female |
| Healthcare Support | 0 (0.0%) | 14 (100.0%) |
| Security & Protection | 0 (0.0%) | 0 (0.0%) |
| Firefighting & Prevention | 0 (0.0%) | 0 (0.0%) |
| Law Enforcement | 0 (0.0%) | 0 (0.0%) |
| Food Preparation & Serving | 0 (0.0%) | 13 (100.0%) |
| Cleaning & Maintenance | 0 (0.0%) | 3 (100.0%) |
| Personal Care & Service | 6 (75.0%) | 2 (25.0%) |
| Total (Category) | 6 (15.8%) | 32 (84.2%) |
| Total (Overall) | 57 (47.1%) | 64 (52.9%) |
Sales and Office Occupations
The most common Sales and Office occupations in Taylorstown are Office & Administration (8 | 6.6%), and Sales & Related (4 | 3.3%).
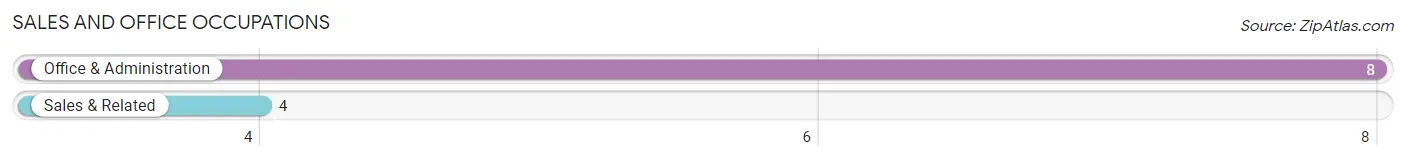
Sales and Office Occupations by Sex
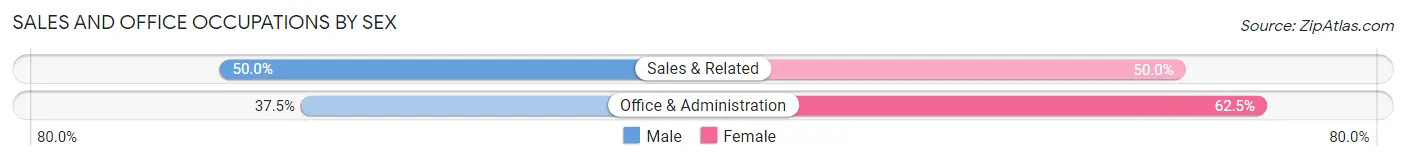
| Occupation | Male | Female |
| Sales & Related | 2 (50.0%) | 2 (50.0%) |
| Office & Administration | 3 (37.5%) | 5 (62.5%) |
| Total (Category) | 5 (41.7%) | 7 (58.3%) |
| Total (Overall) | 57 (47.1%) | 64 (52.9%) |
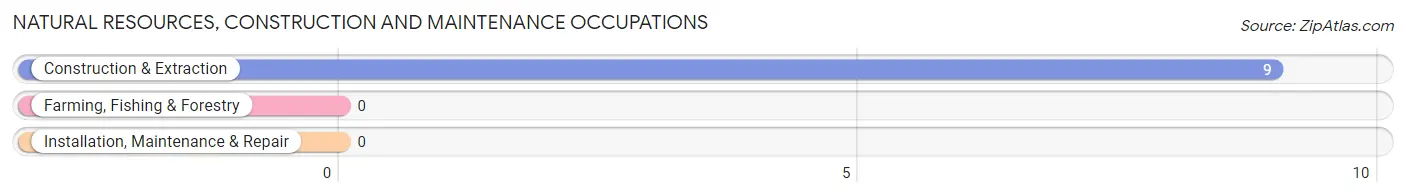
Natural Resources, Construction and Maintenance Occupations
The most common Natural Resources, Construction and Maintenance occupations in Taylorstown are , and Construction & Extraction (9 | 7.4%).
Natural Resources, Construction and Maintenance Occupations by Sex
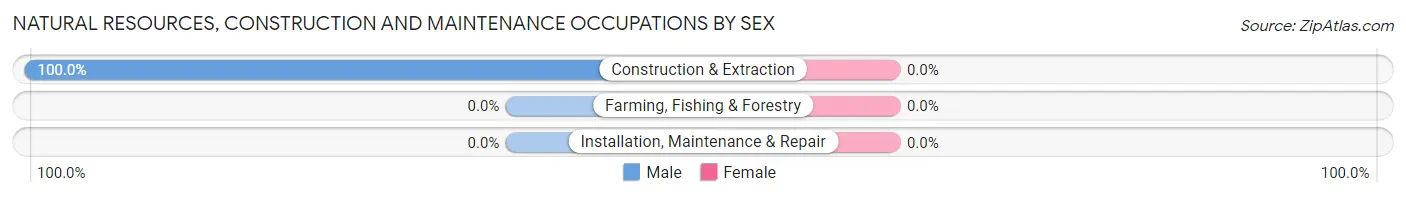
| Occupation | Male | Female |
| Farming, Fishing & Forestry | 0 (0.0%) | 0 (0.0%) |
| Construction & Extraction | 9 (100.0%) | 0 (0.0%) |
| Installation, Maintenance & Repair | 0 (0.0%) | 0 (0.0%) |
| Total (Category) | 9 (100.0%) | 0 (0.0%) |
| Total (Overall) | 57 (47.1%) | 64 (52.9%) |
Production, Transportation and Moving Occupations
The most common Production, Transportation and Moving occupations in Taylorstown are Production (15 | 12.4%), Material Moving (10 | 8.3%), and Transportation (5 | 4.1%).
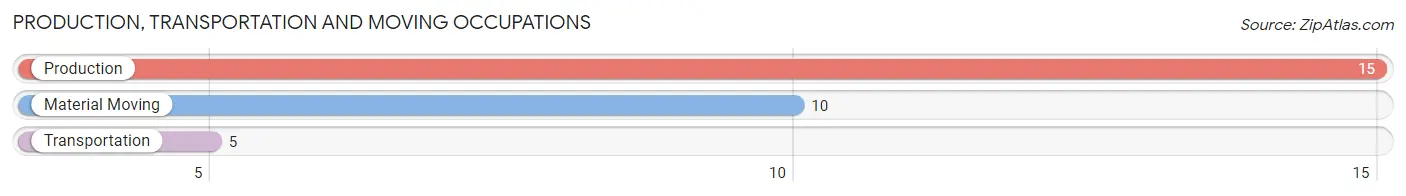
Production, Transportation and Moving Occupations by Sex
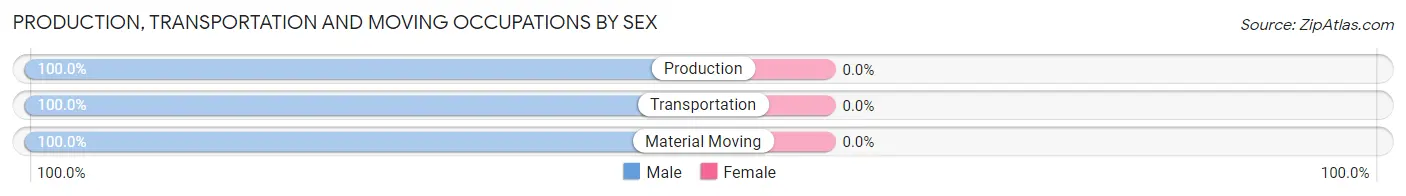
| Occupation | Male | Female |
| Production | 15 (100.0%) | 0 (0.0%) |
| Transportation | 5 (100.0%) | 0 (0.0%) |
| Material Moving | 10 (100.0%) | 0 (0.0%) |
| Total (Category) | 30 (100.0%) | 0 (0.0%) |
| Total (Overall) | 57 (47.1%) | 64 (52.9%) |
Employment Industries by Sex in Taylorstown
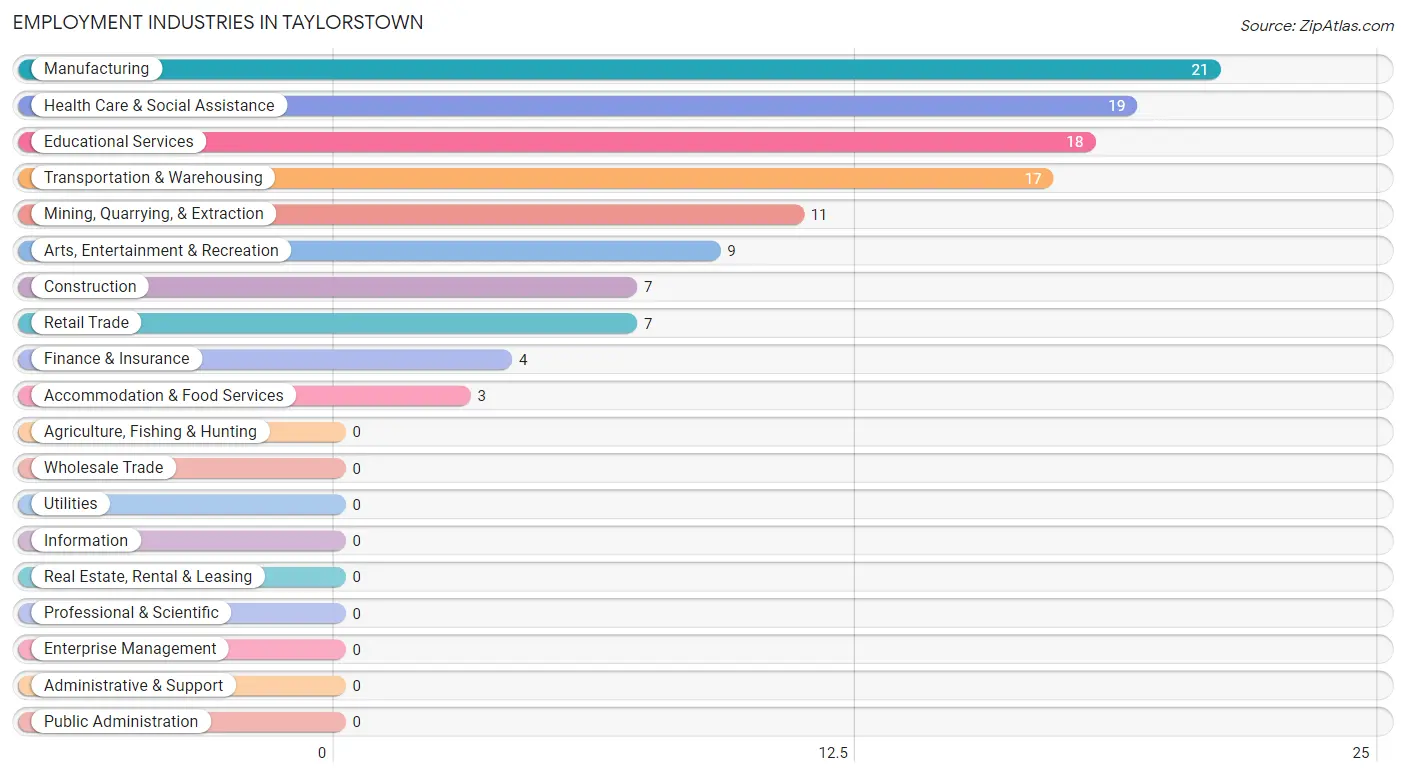
Employment Industries in Taylorstown
The major employment industries in Taylorstown include Manufacturing (21 | 17.4%), Health Care & Social Assistance (19 | 15.7%), Educational Services (18 | 14.9%), Transportation & Warehousing (17 | 14.1%), and Mining, Quarrying, & Extraction (11 | 9.1%).
Employment Industries by Sex in Taylorstown
The Taylorstown industries that see more men than women are Transportation & Warehousing (88.2%), Manufacturing (85.7%), and Mining, Quarrying, & Extraction (72.7%), whereas the industries that tend to have a higher number of women are Retail Trade (100.0%), Arts, Entertainment & Recreation (100.0%), and Accommodation & Food Services (100.0%).
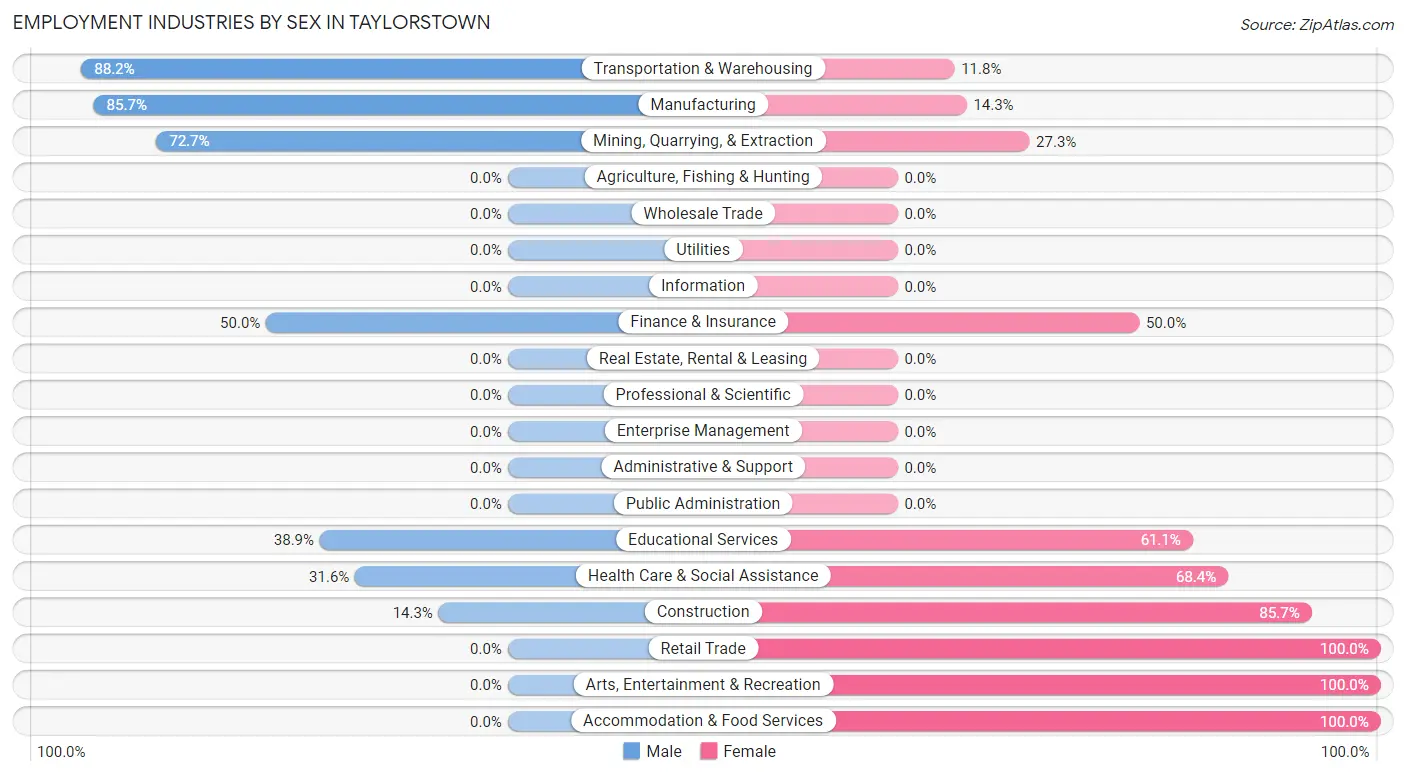
| Industry | Male | Female |
| Agriculture, Fishing & Hunting | 0 (0.0%) | 0 (0.0%) |
| Mining, Quarrying, & Extraction | 8 (72.7%) | 3 (27.3%) |
| Construction | 1 (14.3%) | 6 (85.7%) |
| Manufacturing | 18 (85.7%) | 3 (14.3%) |
| Wholesale Trade | 0 (0.0%) | 0 (0.0%) |
| Retail Trade | 0 (0.0%) | 7 (100.0%) |
| Transportation & Warehousing | 15 (88.2%) | 2 (11.8%) |
| Utilities | 0 (0.0%) | 0 (0.0%) |
| Information | 0 (0.0%) | 0 (0.0%) |
| Finance & Insurance | 2 (50.0%) | 2 (50.0%) |
| Real Estate, Rental & Leasing | 0 (0.0%) | 0 (0.0%) |
| Professional & Scientific | 0 (0.0%) | 0 (0.0%) |
| Enterprise Management | 0 (0.0%) | 0 (0.0%) |
| Administrative & Support | 0 (0.0%) | 0 (0.0%) |
| Educational Services | 7 (38.9%) | 11 (61.1%) |
| Health Care & Social Assistance | 6 (31.6%) | 13 (68.4%) |
| Arts, Entertainment & Recreation | 0 (0.0%) | 9 (100.0%) |
| Accommodation & Food Services | 0 (0.0%) | 3 (100.0%) |
| Public Administration | 0 (0.0%) | 0 (0.0%) |
| Total | 57 (47.1%) | 64 (52.9%) |
Education in Taylorstown
School Enrollment in Taylorstown
The most common levels of schooling among the 65 students in Taylorstown are elementary school (25 | 38.5%), middle school (14 | 21.5%), and nursery / preschool (12 | 18.5%).
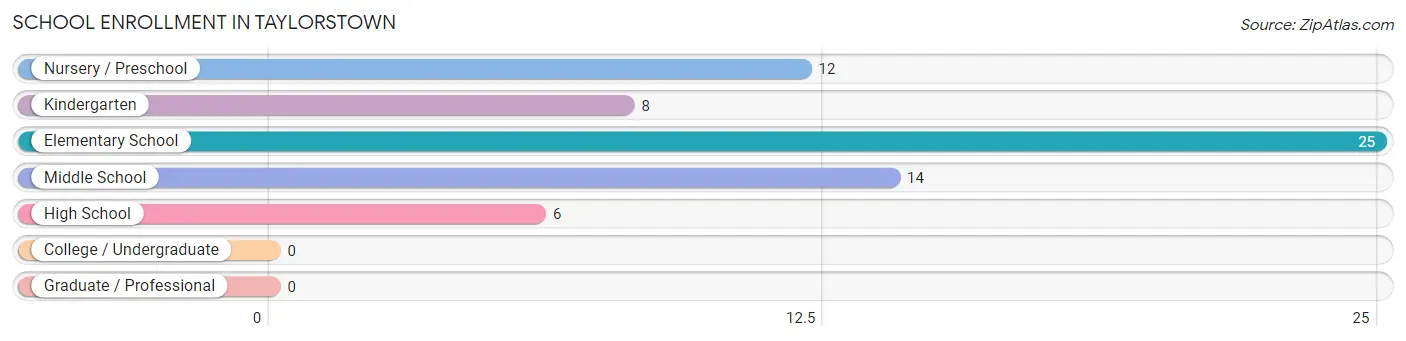
| School Level | # Students | % Students |
| Nursery / Preschool | 12 | 18.5% |
| Kindergarten | 8 | 12.3% |
| Elementary School | 25 | 38.5% |
| Middle School | 14 | 21.5% |
| High School | 6 | 9.2% |
| College / Undergraduate | 0 | 0.0% |
| Graduate / Professional | 0 | 0.0% |
| Total | 65 | 100.0% |
School Enrollment by Age by Funding Source in Taylorstown
Out of a total of 65 students who are enrolled in schools in Taylorstown, 8 (12.3%) attend a private institution, while the remaining 57 (87.7%) are enrolled in public schools. The age group of 5 to 9 year old has the highest likelihood of being enrolled in private schools, with 8 (50.0% in the age bracket) enrolled. Conversely, the age group of 3 to 4 year olds has the lowest likelihood of being enrolled in a private school, with 12 (100.0% in the age bracket) attending a public institution.
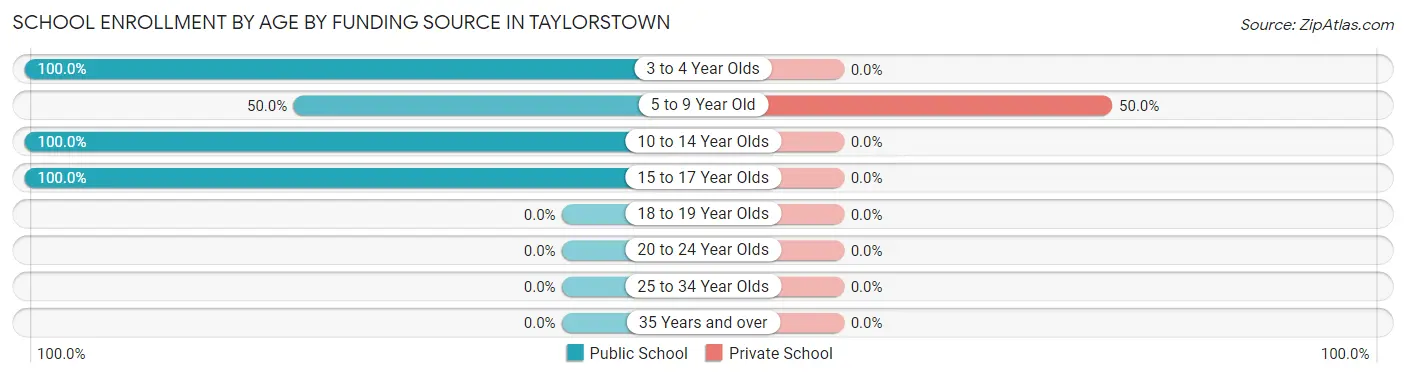
| Age Bracket | Public School | Private School |
| 3 to 4 Year Olds | 12 (100.0%) | 0 (0.0%) |
| 5 to 9 Year Old | 8 (50.0%) | 8 (50.0%) |
| 10 to 14 Year Olds | 31 (100.0%) | 0 (0.0%) |
| 15 to 17 Year Olds | 6 (100.0%) | 0 (0.0%) |
| 18 to 19 Year Olds | 0 (0.0%) | 0 (0.0%) |
| 20 to 24 Year Olds | 0 (0.0%) | 0 (0.0%) |
| 25 to 34 Year Olds | 0 (0.0%) | 0 (0.0%) |
| 35 Years and over | 0 (0.0%) | 0 (0.0%) |
| Total | 57 (87.7%) | 8 (12.3%) |
Educational Attainment by Field of Study in Taylorstown
Communications (12 | 36.4%), computers & mathematics (7 | 21.2%), education (7 | 21.2%), business (3 | 9.1%), and engineering (2 | 6.1%) are the most common fields of study among 33 individuals in Taylorstown who have obtained a bachelor's degree or higher.
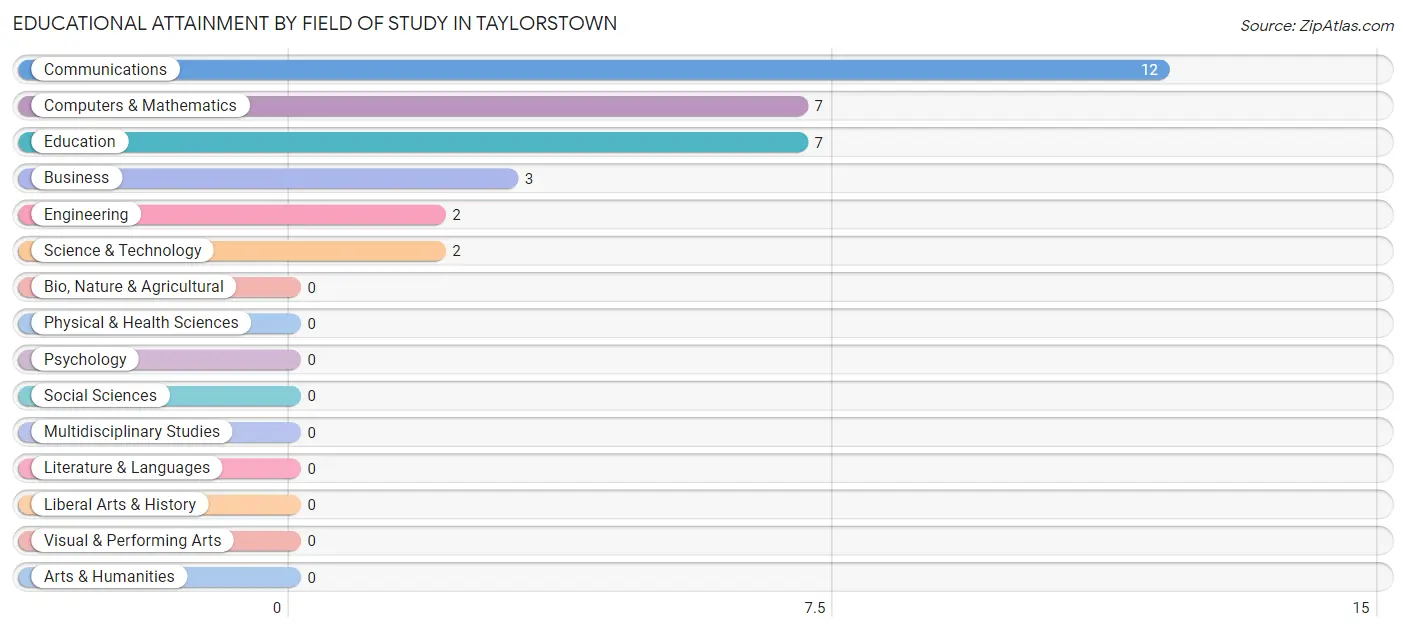
| Field of Study | # Graduates | % Graduates |
| Computers & Mathematics | 7 | 21.2% |
| Bio, Nature & Agricultural | 0 | 0.0% |
| Physical & Health Sciences | 0 | 0.0% |
| Psychology | 0 | 0.0% |
| Social Sciences | 0 | 0.0% |
| Engineering | 2 | 6.1% |
| Multidisciplinary Studies | 0 | 0.0% |
| Science & Technology | 2 | 6.1% |
| Business | 3 | 9.1% |
| Education | 7 | 21.2% |
| Literature & Languages | 0 | 0.0% |
| Liberal Arts & History | 0 | 0.0% |
| Visual & Performing Arts | 0 | 0.0% |
| Communications | 12 | 36.4% |
| Arts & Humanities | 0 | 0.0% |
| Total | 33 | 100.0% |
Transportation & Commute in Taylorstown
Vehicle Availability by Sex in Taylorstown
The most prevalent vehicle ownership categories in Taylorstown are males with 2 vehicles (46, accounting for 80.7%) and females with 2 vehicles (31, making up 71.9%).
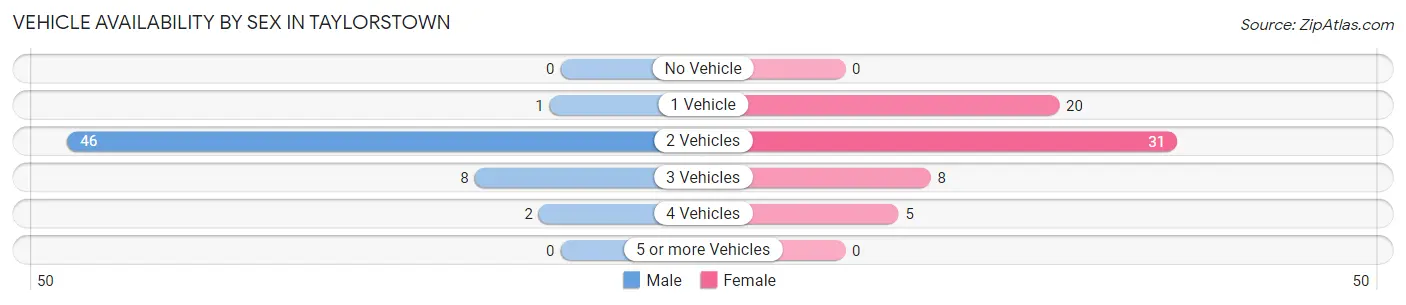
| Vehicles Available | Male | Female |
| No Vehicle | 0 (0.0%) | 0 (0.0%) |
| 1 Vehicle | 1 (1.8%) | 20 (31.2%) |
| 2 Vehicles | 46 (80.7%) | 31 (48.4%) |
| 3 Vehicles | 8 (14.0%) | 8 (12.5%) |
| 4 Vehicles | 2 (3.5%) | 5 (7.8%) |
| 5 or more Vehicles | 0 (0.0%) | 0 (0.0%) |
| Total | 57 (100.0%) | 64 (100.0%) |
Commute Time in Taylorstown
The most frequently occuring commute durations in Taylorstown are 15 to 19 minutes (36 commuters, 31.9%), 20 to 24 minutes (27 commuters, 23.9%), and 45 to 59 minutes (14 commuters, 12.4%).
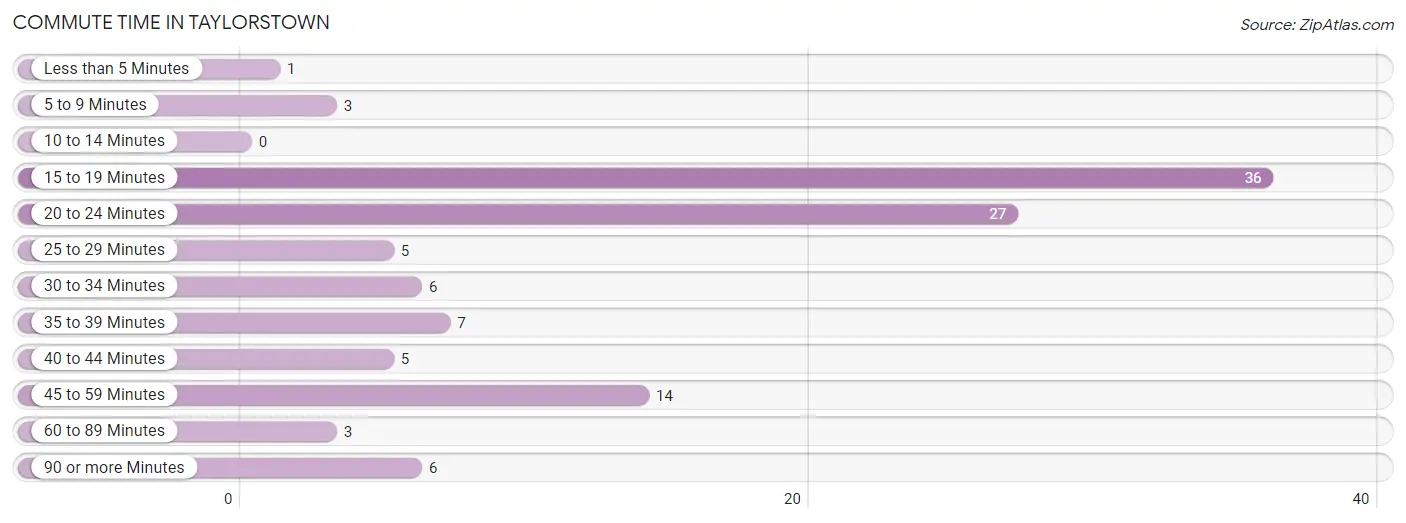
| Commute Time | # Commuters | % Commuters |
| Less than 5 Minutes | 1 | 0.9% |
| 5 to 9 Minutes | 3 | 2.6% |
| 10 to 14 Minutes | 0 | 0.0% |
| 15 to 19 Minutes | 36 | 31.9% |
| 20 to 24 Minutes | 27 | 23.9% |
| 25 to 29 Minutes | 5 | 4.4% |
| 30 to 34 Minutes | 6 | 5.3% |
| 35 to 39 Minutes | 7 | 6.2% |
| 40 to 44 Minutes | 5 | 4.4% |
| 45 to 59 Minutes | 14 | 12.4% |
| 60 to 89 Minutes | 3 | 2.6% |
| 90 or more Minutes | 6 | 5.3% |
Commute Time by Sex in Taylorstown
The most common commute times in Taylorstown are 20 to 24 minutes (15 commuters, 30.6%) for males and 15 to 19 minutes (27 commuters, 42.2%) for females.
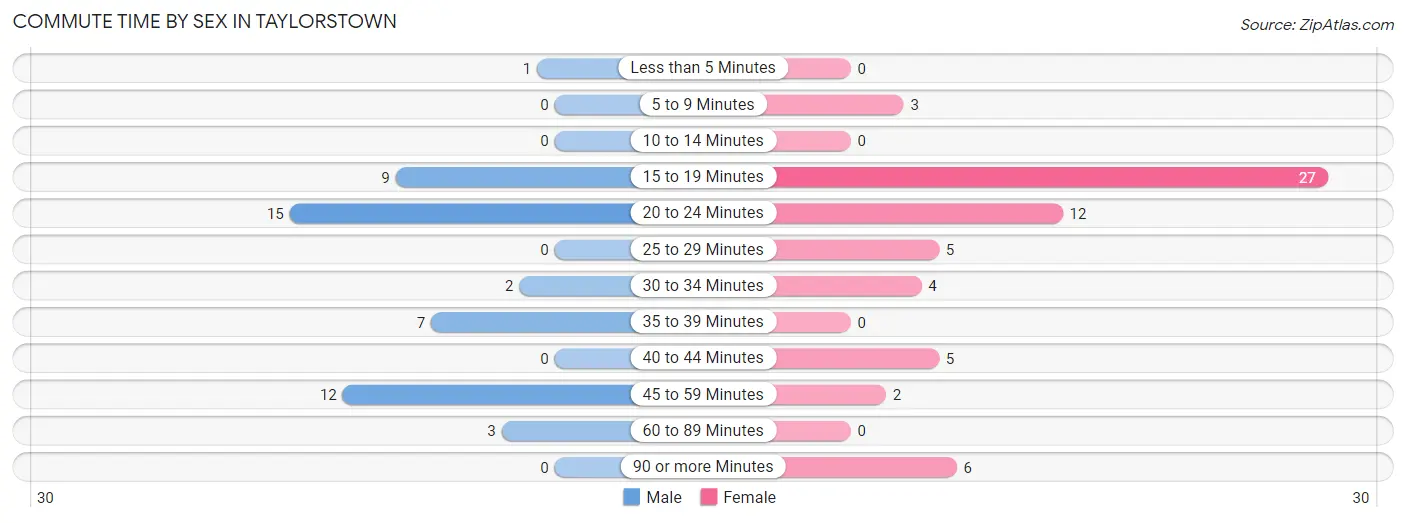
| Commute Time | Male | Female |
| Less than 5 Minutes | 1 (2.0%) | 0 (0.0%) |
| 5 to 9 Minutes | 0 (0.0%) | 3 (4.7%) |
| 10 to 14 Minutes | 0 (0.0%) | 0 (0.0%) |
| 15 to 19 Minutes | 9 (18.4%) | 27 (42.2%) |
| 20 to 24 Minutes | 15 (30.6%) | 12 (18.8%) |
| 25 to 29 Minutes | 0 (0.0%) | 5 (7.8%) |
| 30 to 34 Minutes | 2 (4.1%) | 4 (6.2%) |
| 35 to 39 Minutes | 7 (14.3%) | 0 (0.0%) |
| 40 to 44 Minutes | 0 (0.0%) | 5 (7.8%) |
| 45 to 59 Minutes | 12 (24.5%) | 2 (3.1%) |
| 60 to 89 Minutes | 3 (6.1%) | 0 (0.0%) |
| 90 or more Minutes | 0 (0.0%) | 6 (9.4%) |
Time of Departure to Work by Sex in Taylorstown
The most frequent times of departure to work in Taylorstown are 6:00 AM to 6:29 AM (26, 53.1%) for males and 7:00 AM to 7:29 AM (11, 17.2%) for females.
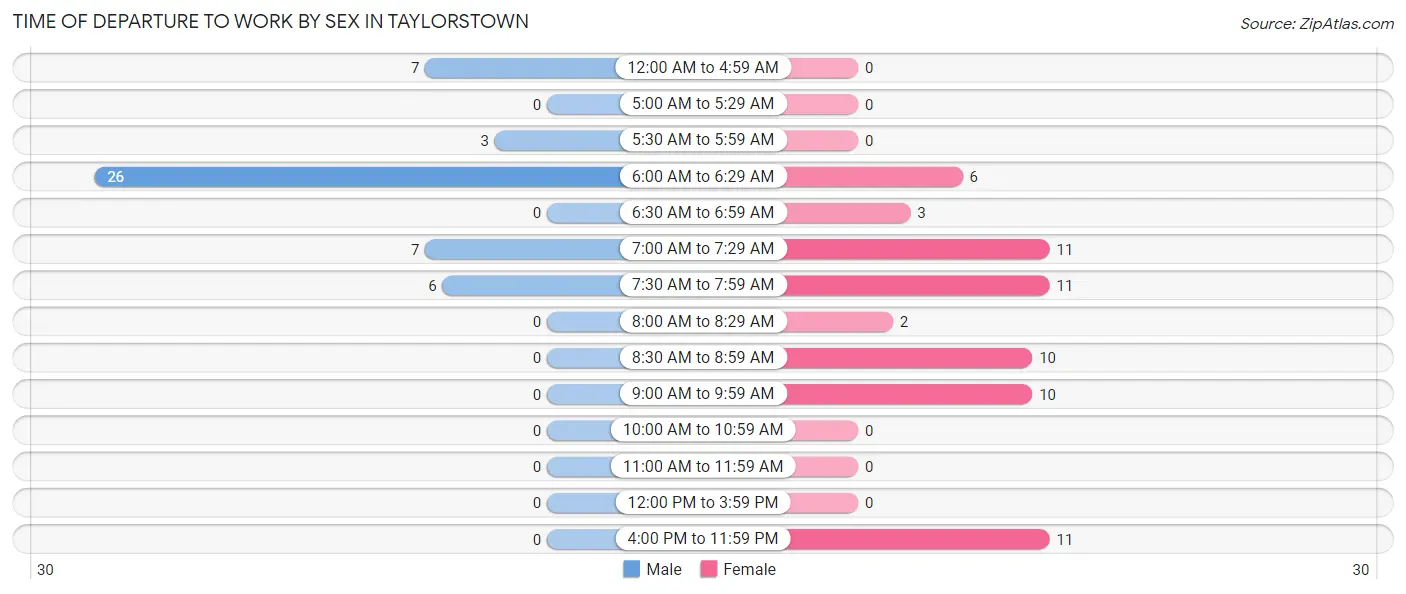
| Time of Departure | Male | Female |
| 12:00 AM to 4:59 AM | 7 (14.3%) | 0 (0.0%) |
| 5:00 AM to 5:29 AM | 0 (0.0%) | 0 (0.0%) |
| 5:30 AM to 5:59 AM | 3 (6.1%) | 0 (0.0%) |
| 6:00 AM to 6:29 AM | 26 (53.1%) | 6 (9.4%) |
| 6:30 AM to 6:59 AM | 0 (0.0%) | 3 (4.7%) |
| 7:00 AM to 7:29 AM | 7 (14.3%) | 11 (17.2%) |
| 7:30 AM to 7:59 AM | 6 (12.2%) | 11 (17.2%) |
| 8:00 AM to 8:29 AM | 0 (0.0%) | 2 (3.1%) |
| 8:30 AM to 8:59 AM | 0 (0.0%) | 10 (15.6%) |
| 9:00 AM to 9:59 AM | 0 (0.0%) | 10 (15.6%) |
| 10:00 AM to 10:59 AM | 0 (0.0%) | 0 (0.0%) |
| 11:00 AM to 11:59 AM | 0 (0.0%) | 0 (0.0%) |
| 12:00 PM to 3:59 PM | 0 (0.0%) | 0 (0.0%) |
| 4:00 PM to 11:59 PM | 0 (0.0%) | 11 (17.2%) |
| Total | 49 (100.0%) | 64 (100.0%) |
Housing Occupancy in Taylorstown
Occupancy by Ownership in Taylorstown
Of the total 79 dwellings in Taylorstown, owner-occupied units account for 69 (87.3%), while renter-occupied units make up 10 (12.7%).
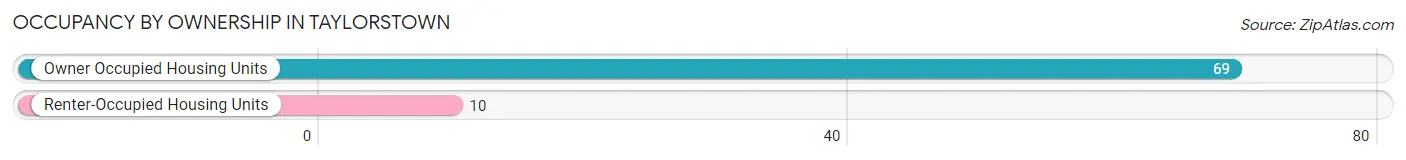
| Occupancy | # Housing Units | % Housing Units |
| Owner Occupied Housing Units | 69 | 87.3% |
| Renter-Occupied Housing Units | 10 | 12.7% |
| Total Occupied Housing Units | 79 | 100.0% |
Occupancy by Household Size in Taylorstown
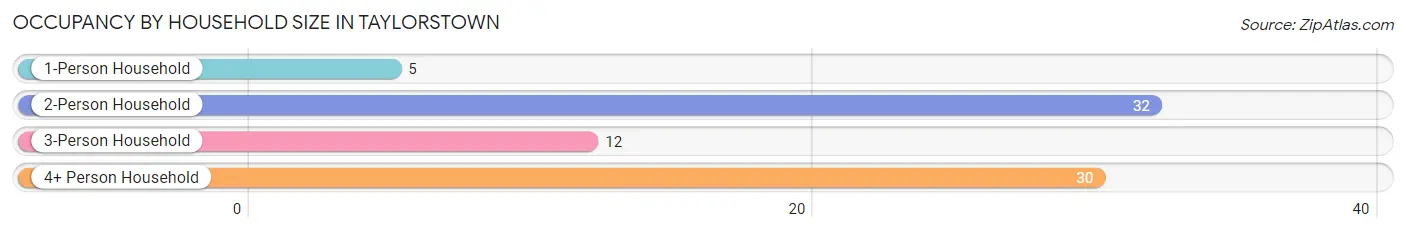
| Household Size | # Housing Units | % Housing Units |
| 1-Person Household | 5 | 6.3% |
| 2-Person Household | 32 | 40.5% |
| 3-Person Household | 12 | 15.2% |
| 4+ Person Household | 30 | 38.0% |
| Total Housing Units | 79 | 100.0% |
Occupancy by Ownership by Household Size in Taylorstown
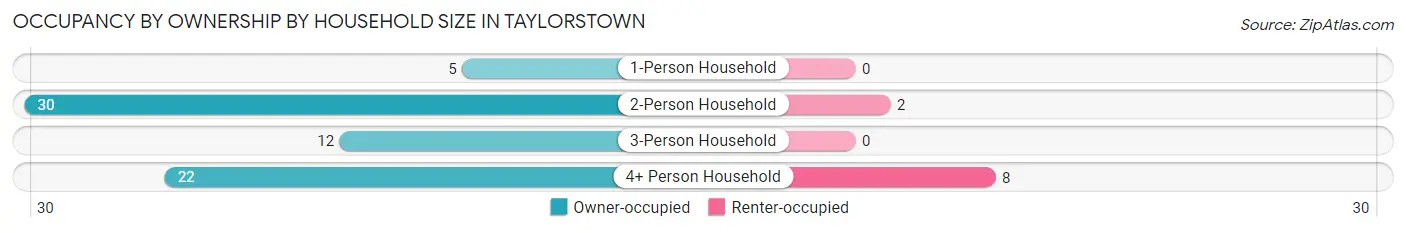
| Household Size | Owner-occupied | Renter-occupied |
| 1-Person Household | 5 (100.0%) | 0 (0.0%) |
| 2-Person Household | 30 (93.8%) | 2 (6.2%) |
| 3-Person Household | 12 (100.0%) | 0 (0.0%) |
| 4+ Person Household | 22 (73.3%) | 8 (26.7%) |
| Total Housing Units | 69 (87.3%) | 10 (12.7%) |
Occupancy by Educational Attainment in Taylorstown
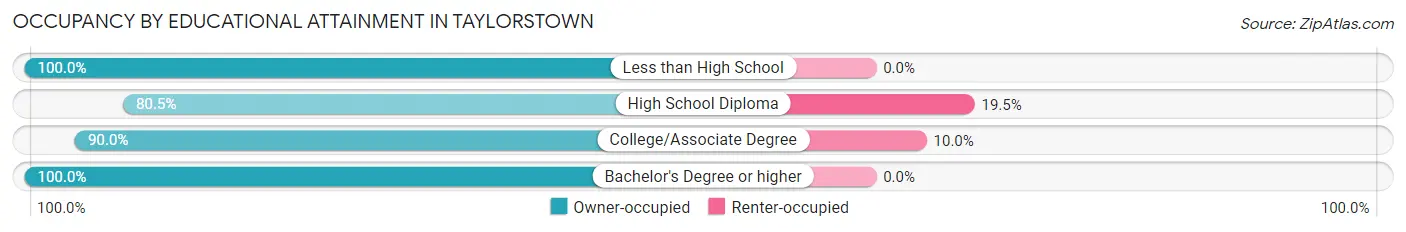
| Household Size | Owner-occupied | Renter-occupied |
| Less than High School | 3 (100.0%) | 0 (0.0%) |
| High School Diploma | 33 (80.5%) | 8 (19.5%) |
| College/Associate Degree | 18 (90.0%) | 2 (10.0%) |
| Bachelor's Degree or higher | 15 (100.0%) | 0 (0.0%) |
Occupancy by Age of Householder in Taylorstown
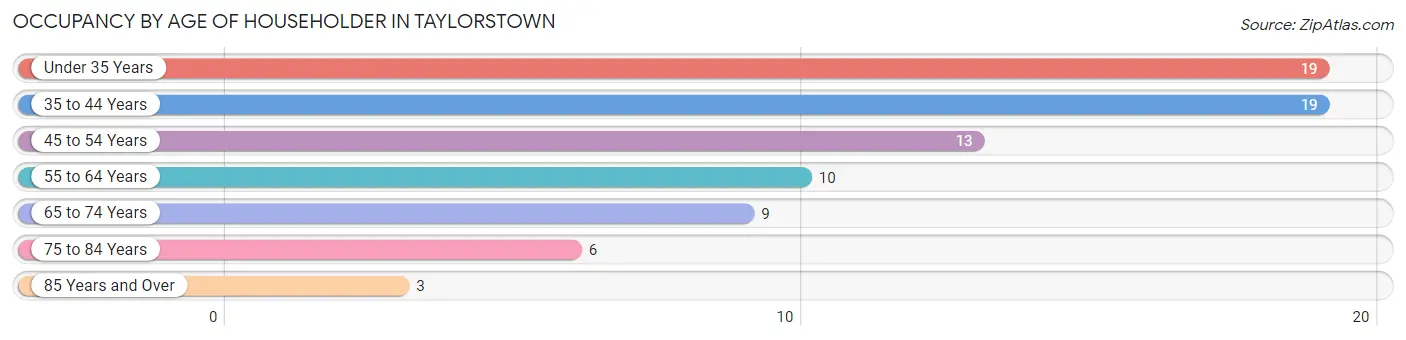
| Age Bracket | # Households | % Households |
| Under 35 Years | 19 | 24.0% |
| 35 to 44 Years | 19 | 24.0% |
| 45 to 54 Years | 13 | 16.5% |
| 55 to 64 Years | 10 | 12.7% |
| 65 to 74 Years | 9 | 11.4% |
| 75 to 84 Years | 6 | 7.6% |
| 85 Years and Over | 3 | 3.8% |
| Total | 79 | 100.0% |
Housing Finances in Taylorstown
Median Income by Occupancy in Taylorstown
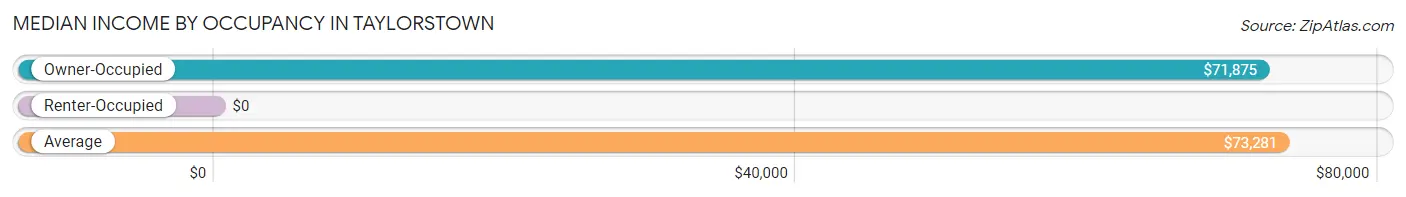
| Occupancy Type | # Households | Median Income |
| Owner-Occupied | 69 (87.3%) | $71,875 |
| Renter-Occupied | 10 (12.7%) | $0 |
| Average | 79 (100.0%) | $73,281 |
Occupancy by Householder Income Bracket in Taylorstown
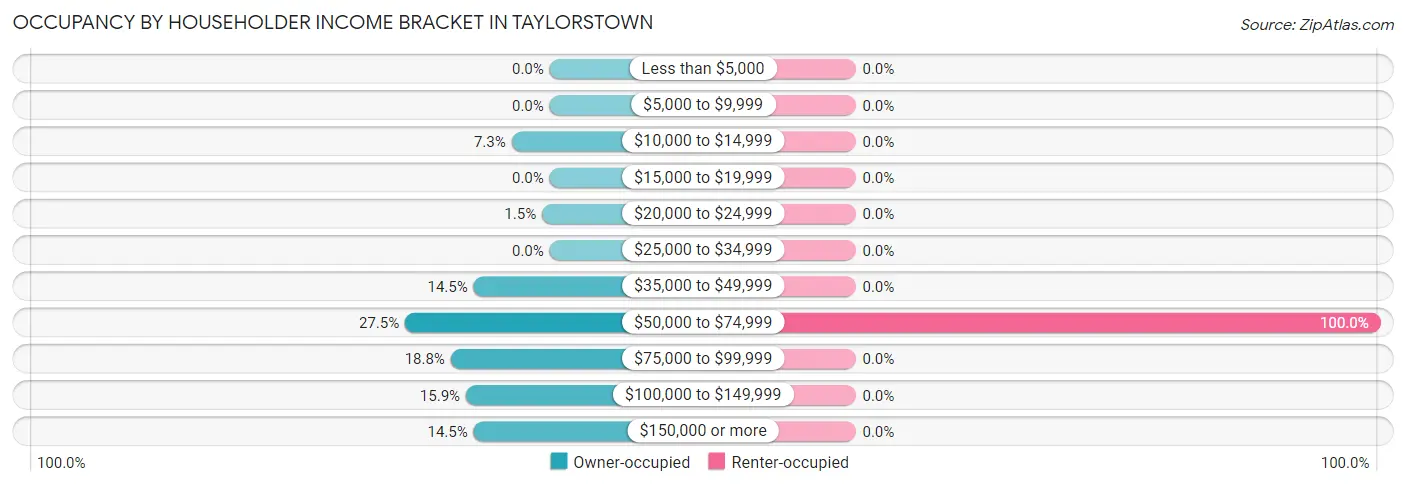
| Income Bracket | Owner-occupied | Renter-occupied |
| Less than $5,000 | 0 (0.0%) | 0 (0.0%) |
| $5,000 to $9,999 | 0 (0.0%) | 0 (0.0%) |
| $10,000 to $14,999 | 5 (7.2%) | 0 (0.0%) |
| $15,000 to $19,999 | 0 (0.0%) | 0 (0.0%) |
| $20,000 to $24,999 | 1 (1.5%) | 0 (0.0%) |
| $25,000 to $34,999 | 0 (0.0%) | 0 (0.0%) |
| $35,000 to $49,999 | 10 (14.5%) | 0 (0.0%) |
| $50,000 to $74,999 | 19 (27.5%) | 10 (100.0%) |
| $75,000 to $99,999 | 13 (18.8%) | 0 (0.0%) |
| $100,000 to $149,999 | 11 (15.9%) | 0 (0.0%) |
| $150,000 or more | 10 (14.5%) | 0 (0.0%) |
| Total | 69 (100.0%) | 10 (100.0%) |
Monthly Housing Cost Tiers in Taylorstown
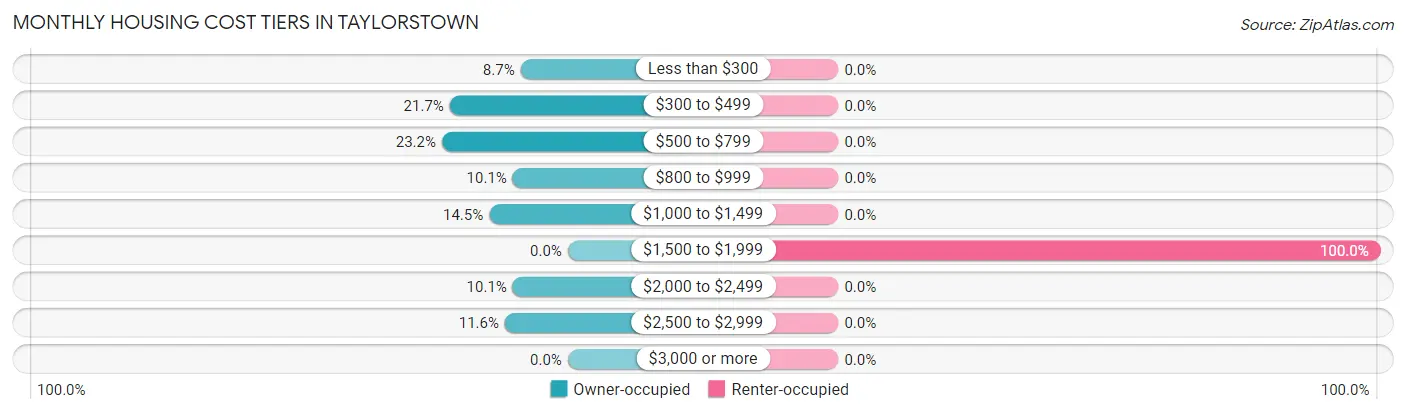
| Monthly Cost | Owner-occupied | Renter-occupied |
| Less than $300 | 6 (8.7%) | 0 (0.0%) |
| $300 to $499 | 15 (21.7%) | 0 (0.0%) |
| $500 to $799 | 16 (23.2%) | 0 (0.0%) |
| $800 to $999 | 7 (10.1%) | 0 (0.0%) |
| $1,000 to $1,499 | 10 (14.5%) | 0 (0.0%) |
| $1,500 to $1,999 | 0 (0.0%) | 10 (100.0%) |
| $2,000 to $2,499 | 7 (10.1%) | 0 (0.0%) |
| $2,500 to $2,999 | 8 (11.6%) | 0 (0.0%) |
| $3,000 or more | 0 (0.0%) | 0 (0.0%) |
| Total | 69 (100.0%) | 10 (100.0%) |
Physical Housing Characteristics in Taylorstown
Housing Structures in Taylorstown
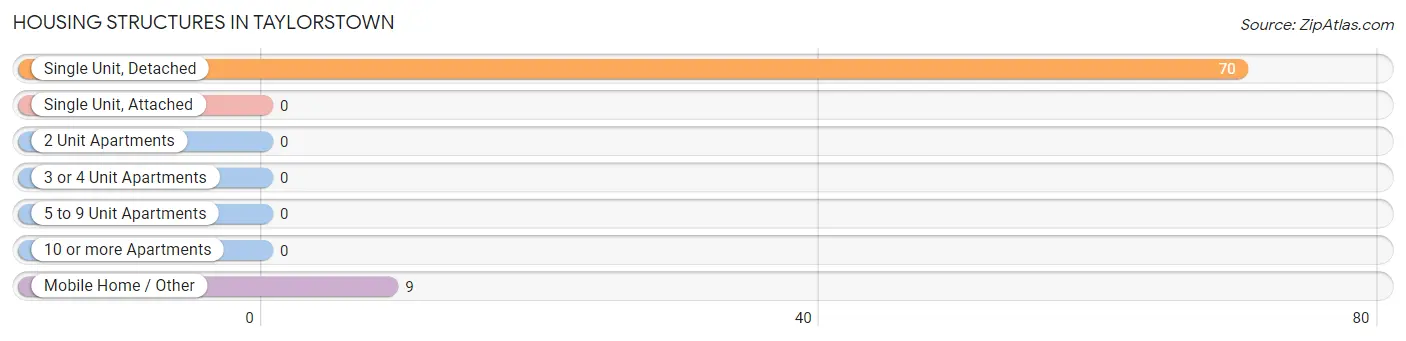
| Structure Type | # Housing Units | % Housing Units |
| Single Unit, Detached | 70 | 88.6% |
| Single Unit, Attached | 0 | 0.0% |
| 2 Unit Apartments | 0 | 0.0% |
| 3 or 4 Unit Apartments | 0 | 0.0% |
| 5 to 9 Unit Apartments | 0 | 0.0% |
| 10 or more Apartments | 0 | 0.0% |
| Mobile Home / Other | 9 | 11.4% |
| Total | 79 | 100.0% |
Housing Structures by Occupancy in Taylorstown
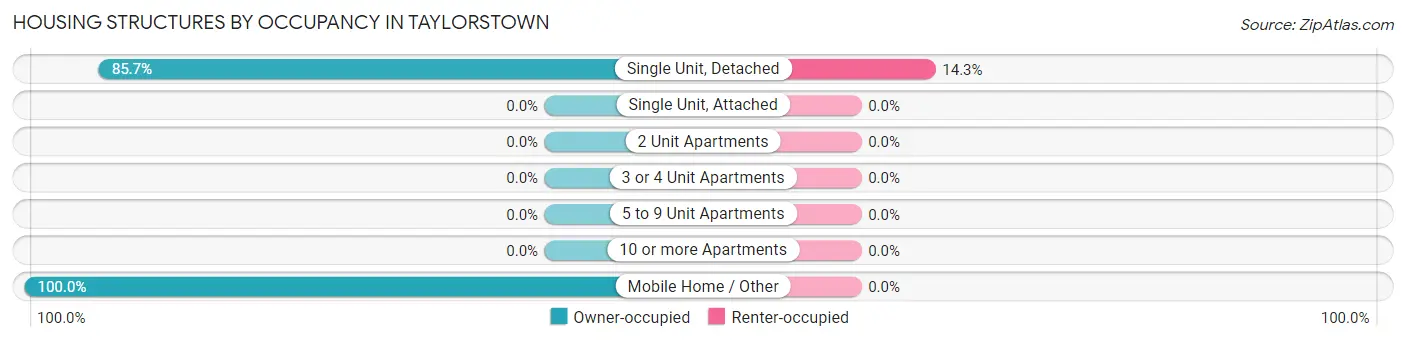
| Structure Type | Owner-occupied | Renter-occupied |
| Single Unit, Detached | 60 (85.7%) | 10 (14.3%) |
| Single Unit, Attached | 0 (0.0%) | 0 (0.0%) |
| 2 Unit Apartments | 0 (0.0%) | 0 (0.0%) |
| 3 or 4 Unit Apartments | 0 (0.0%) | 0 (0.0%) |
| 5 to 9 Unit Apartments | 0 (0.0%) | 0 (0.0%) |
| 10 or more Apartments | 0 (0.0%) | 0 (0.0%) |
| Mobile Home / Other | 9 (100.0%) | 0 (0.0%) |
| Total | 69 (87.3%) | 10 (12.7%) |
Housing Structures by Number of Rooms in Taylorstown
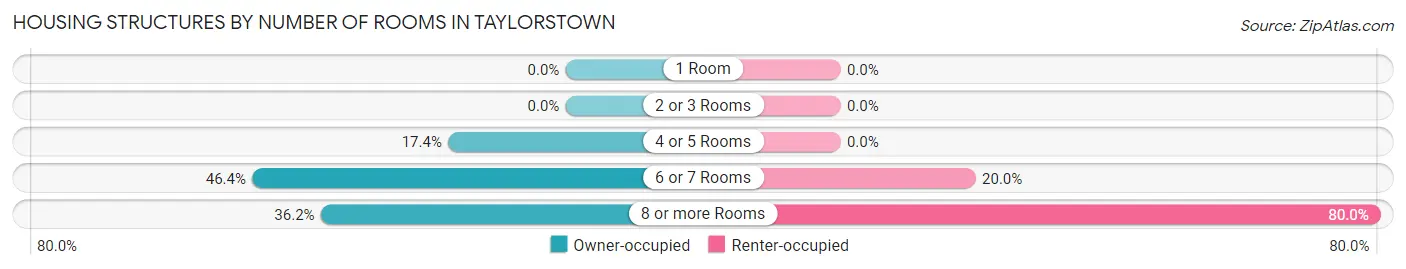
| Number of Rooms | Owner-occupied | Renter-occupied |
| 1 Room | 0 (0.0%) | 0 (0.0%) |
| 2 or 3 Rooms | 0 (0.0%) | 0 (0.0%) |
| 4 or 5 Rooms | 12 (17.4%) | 0 (0.0%) |
| 6 or 7 Rooms | 32 (46.4%) | 2 (20.0%) |
| 8 or more Rooms | 25 (36.2%) | 8 (80.0%) |
| Total | 69 (100.0%) | 10 (100.0%) |
Housing Structure by Heating Type in Taylorstown
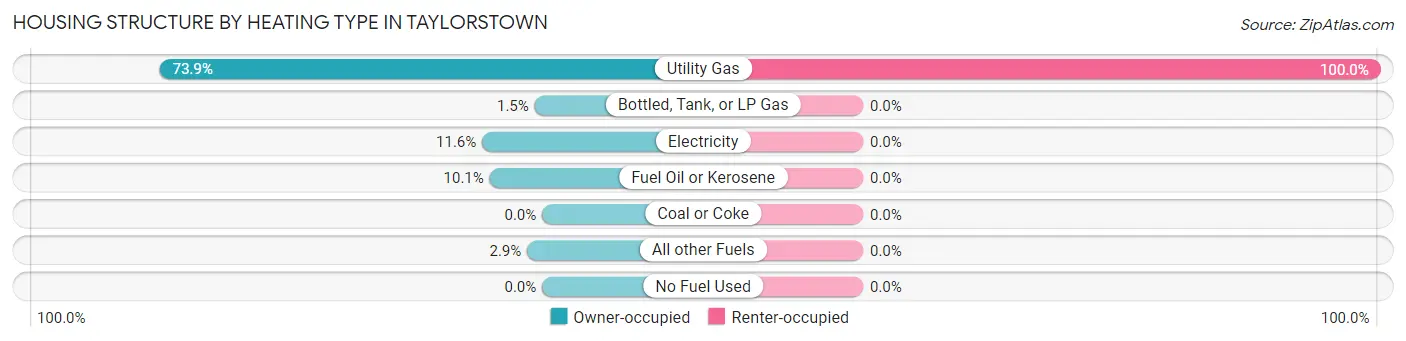
| Heating Type | Owner-occupied | Renter-occupied |
| Utility Gas | 51 (73.9%) | 10 (100.0%) |
| Bottled, Tank, or LP Gas | 1 (1.5%) | 0 (0.0%) |
| Electricity | 8 (11.6%) | 0 (0.0%) |
| Fuel Oil or Kerosene | 7 (10.1%) | 0 (0.0%) |
| Coal or Coke | 0 (0.0%) | 0 (0.0%) |
| All other Fuels | 2 (2.9%) | 0 (0.0%) |
| No Fuel Used | 0 (0.0%) | 0 (0.0%) |
| Total | 69 (100.0%) | 10 (100.0%) |
Household Vehicle Usage in Taylorstown
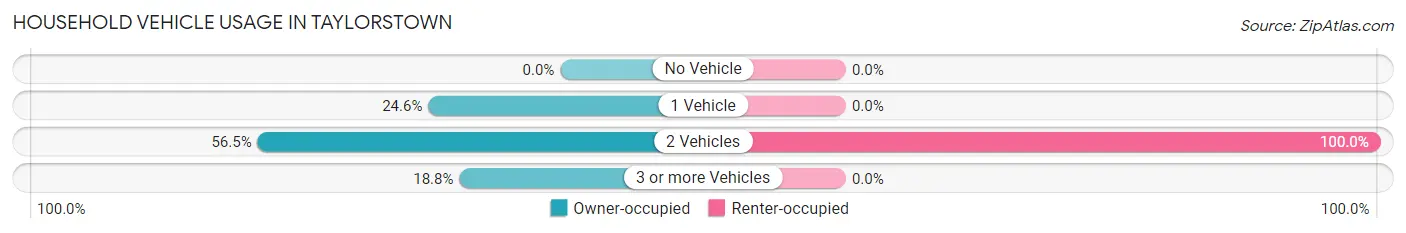
| Vehicles per Household | Owner-occupied | Renter-occupied |
| No Vehicle | 0 (0.0%) | 0 (0.0%) |
| 1 Vehicle | 17 (24.6%) | 0 (0.0%) |
| 2 Vehicles | 39 (56.5%) | 10 (100.0%) |
| 3 or more Vehicles | 13 (18.8%) | 0 (0.0%) |
| Total | 69 (100.0%) | 10 (100.0%) |
Real Estate & Mortgages in Taylorstown
Real Estate and Mortgage Overview in Taylorstown
| Characteristic | Without Mortgage | With Mortgage |
| Housing Units | 37 | 32 |
| Median Property Value | $119,800 | $212,500 |
| Median Household Income | $65,417 | $10 |
| Monthly Housing Costs | $482 | $0 |
| Real Estate Taxes | $1,769 | $0 |
Property Value by Mortgage Status in Taylorstown
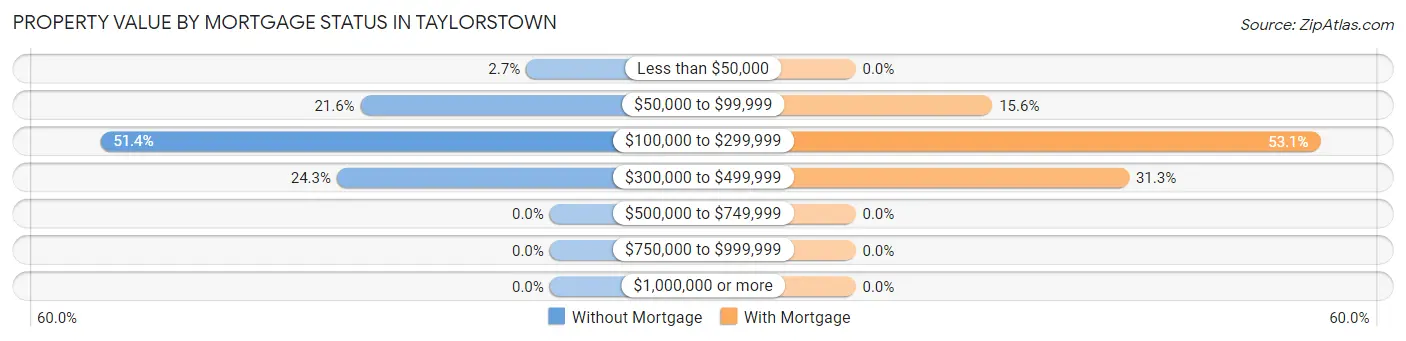
| Property Value | Without Mortgage | With Mortgage |
| Less than $50,000 | 1 (2.7%) | 0 (0.0%) |
| $50,000 to $99,999 | 8 (21.6%) | 5 (15.6%) |
| $100,000 to $299,999 | 19 (51.3%) | 17 (53.1%) |
| $300,000 to $499,999 | 9 (24.3%) | 10 (31.2%) |
| $500,000 to $749,999 | 0 (0.0%) | 0 (0.0%) |
| $750,000 to $999,999 | 0 (0.0%) | 0 (0.0%) |
| $1,000,000 or more | 0 (0.0%) | 0 (0.0%) |
| Total | 37 (100.0%) | 32 (100.0%) |
Household Income by Mortgage Status in Taylorstown
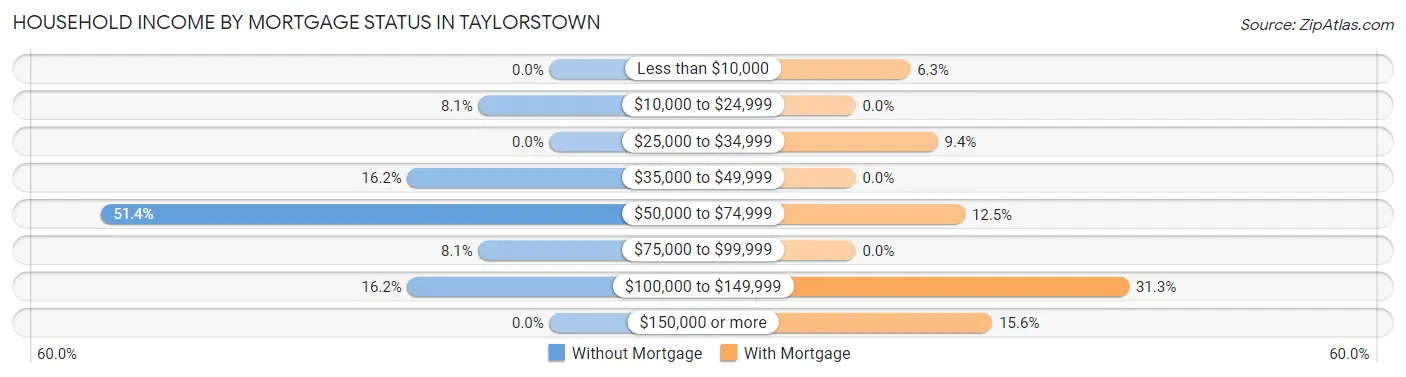
| Household Income | Without Mortgage | With Mortgage |
| Less than $10,000 | 0 (0.0%) | 2 (6.2%) |
| $10,000 to $24,999 | 3 (8.1%) | 0 (0.0%) |
| $25,000 to $34,999 | 0 (0.0%) | 3 (9.4%) |
| $35,000 to $49,999 | 6 (16.2%) | 0 (0.0%) |
| $50,000 to $74,999 | 19 (51.3%) | 4 (12.5%) |
| $75,000 to $99,999 | 3 (8.1%) | 0 (0.0%) |
| $100,000 to $149,999 | 6 (16.2%) | 10 (31.2%) |
| $150,000 or more | 0 (0.0%) | 5 (15.6%) |
| Total | 37 (100.0%) | 32 (100.0%) |
Property Value to Household Income Ratio in Taylorstown
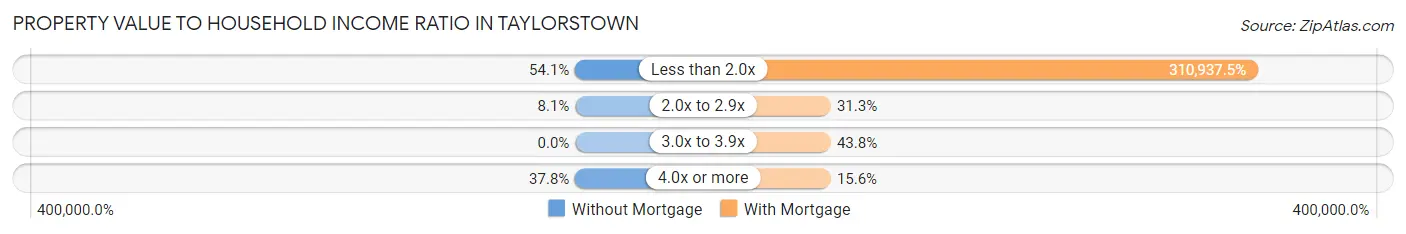
| Value-to-Income Ratio | Without Mortgage | With Mortgage |
| Less than 2.0x | 20 (54.0%) | 99,500 (310,937.5%) |
| 2.0x to 2.9x | 3 (8.1%) | 10 (31.2%) |
| 3.0x to 3.9x | 0 (0.0%) | 14 (43.8%) |
| 4.0x or more | 14 (37.8%) | 5 (15.6%) |
| Total | 37 (100.0%) | 32 (100.0%) |
Real Estate Taxes by Mortgage Status in Taylorstown
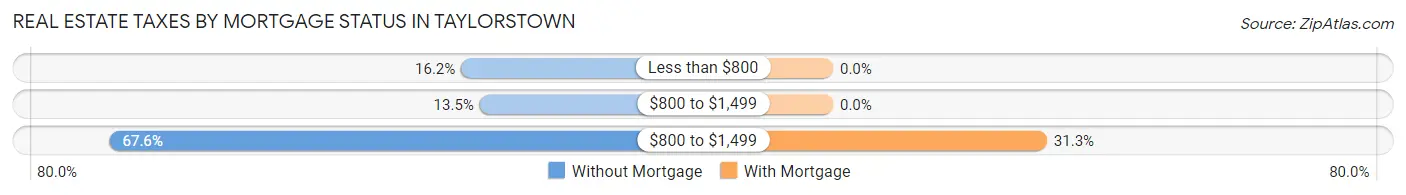
| Property Taxes | Without Mortgage | With Mortgage |
| Less than $800 | 6 (16.2%) | 0 (0.0%) |
| $800 to $1,499 | 5 (13.5%) | 0 (0.0%) |
| $800 to $1,499 | 25 (67.6%) | 10 (31.2%) |
| Total | 37 (100.0%) | 32 (100.0%) |
Health & Disability in Taylorstown
Health Insurance Coverage by Age in Taylorstown
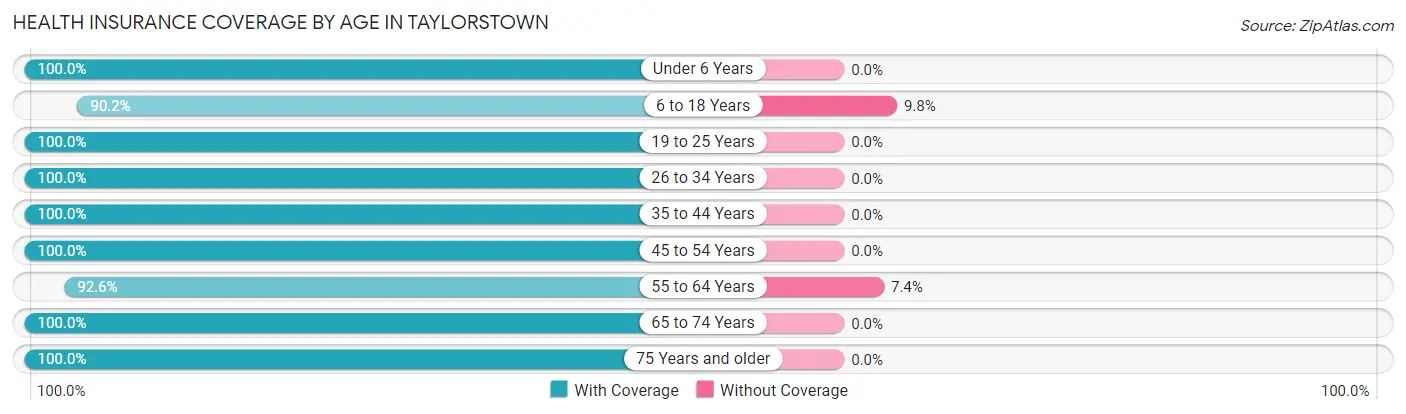
| Age Bracket | With Coverage | Without Coverage |
| Under 6 Years | 39 (100.0%) | 0 (0.0%) |
| 6 to 18 Years | 55 (90.2%) | 6 (9.8%) |
| 19 to 25 Years | 16 (100.0%) | 0 (0.0%) |
| 26 to 34 Years | 31 (100.0%) | 0 (0.0%) |
| 35 to 44 Years | 36 (100.0%) | 0 (0.0%) |
| 45 to 54 Years | 24 (100.0%) | 0 (0.0%) |
| 55 to 64 Years | 25 (92.6%) | 2 (7.4%) |
| 65 to 74 Years | 15 (100.0%) | 0 (0.0%) |
| 75 Years and older | 13 (100.0%) | 0 (0.0%) |
| Total | 254 (97.0%) | 8 (3.0%) |
Health Insurance Coverage by Citizenship Status in Taylorstown
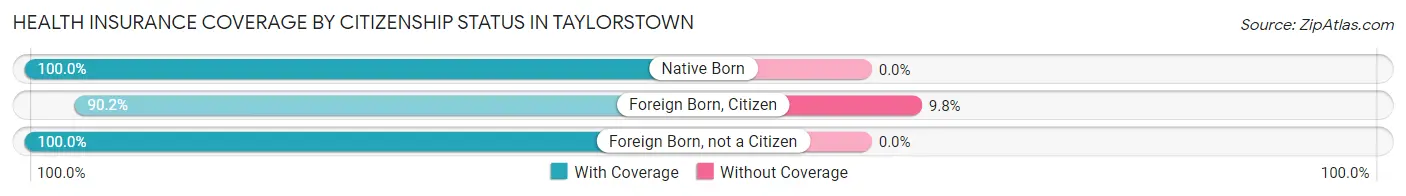
| Citizenship Status | With Coverage | Without Coverage |
| Native Born | 39 (100.0%) | 0 (0.0%) |
| Foreign Born, Citizen | 55 (90.2%) | 6 (9.8%) |
| Foreign Born, not a Citizen | 16 (100.0%) | 0 (0.0%) |
Health Insurance Coverage by Household Income in Taylorstown
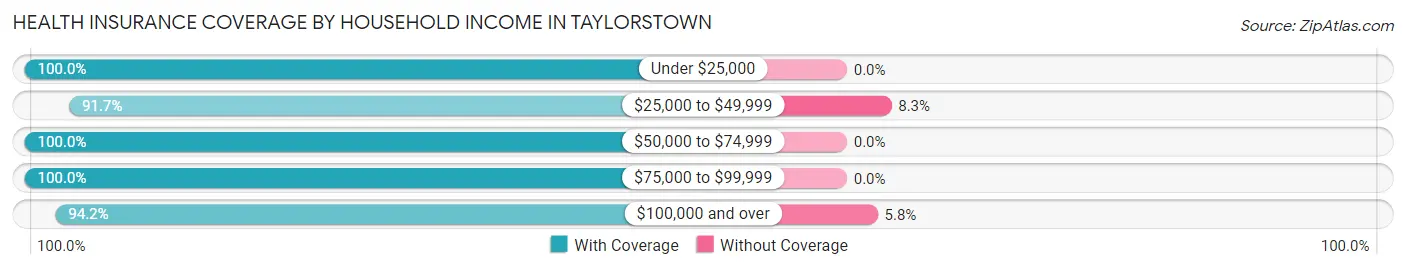
| Household Income | With Coverage | Without Coverage |
| Under $25,000 | 10 (100.0%) | 0 (0.0%) |
| $25,000 to $49,999 | 22 (91.7%) | 2 (8.3%) |
| $50,000 to $74,999 | 83 (100.0%) | 0 (0.0%) |
| $75,000 to $99,999 | 41 (100.0%) | 0 (0.0%) |
| $100,000 and over | 98 (94.2%) | 6 (5.8%) |
Public vs Private Health Insurance Coverage by Age in Taylorstown
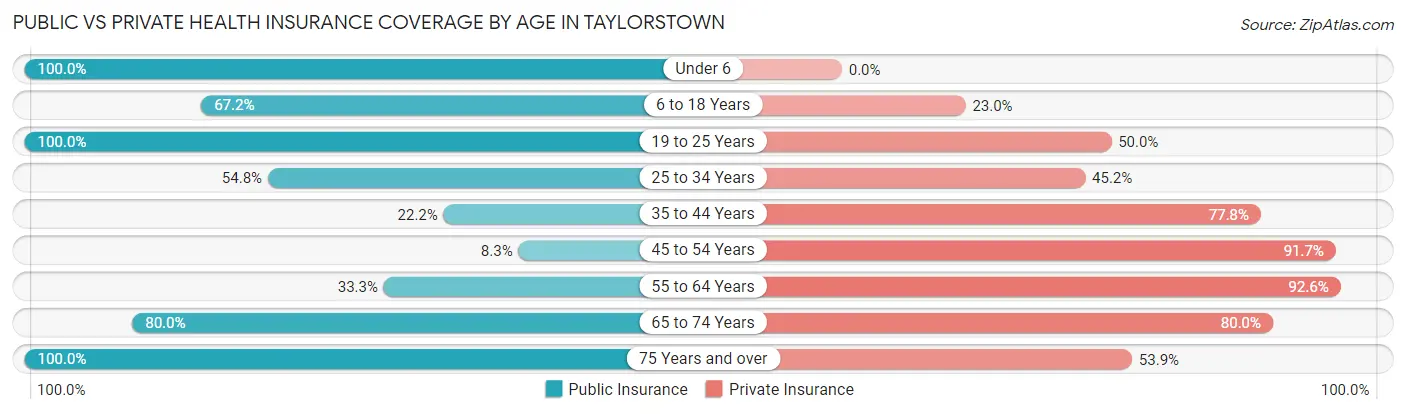
| Age Bracket | Public Insurance | Private Insurance |
| Under 6 | 39 (100.0%) | 0 (0.0%) |
| 6 to 18 Years | 41 (67.2%) | 14 (23.0%) |
| 19 to 25 Years | 16 (100.0%) | 8 (50.0%) |
| 25 to 34 Years | 17 (54.8%) | 14 (45.2%) |
| 35 to 44 Years | 8 (22.2%) | 28 (77.8%) |
| 45 to 54 Years | 2 (8.3%) | 22 (91.7%) |
| 55 to 64 Years | 9 (33.3%) | 25 (92.6%) |
| 65 to 74 Years | 12 (80.0%) | 12 (80.0%) |
| 75 Years and over | 13 (100.0%) | 7 (53.8%) |
| Total | 157 (59.9%) | 130 (49.6%) |
Disability Status by Sex by Age in Taylorstown
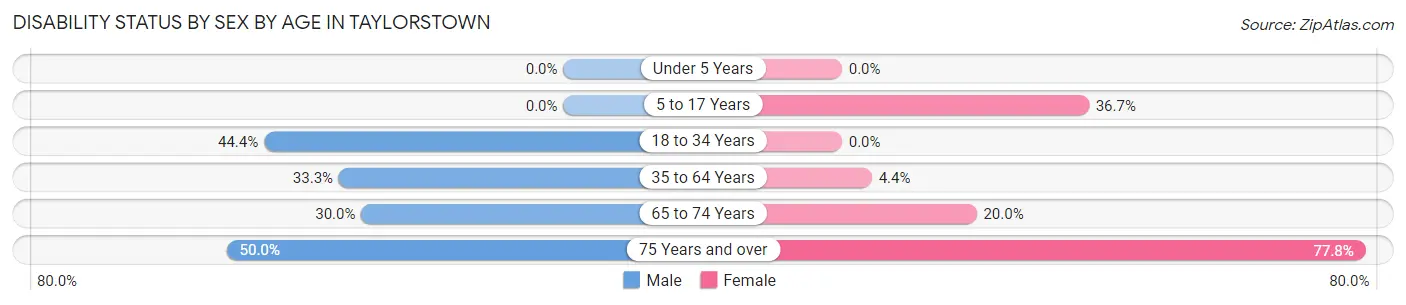
| Age Bracket | Male | Female |
| Under 5 Years | 0 (0.0%) | 0 (0.0%) |
| 5 to 17 Years | 0 (0.0%) | 11 (36.7%) |
| 18 to 34 Years | 8 (44.4%) | 0 (0.0%) |
| 35 to 64 Years | 14 (33.3%) | 2 (4.4%) |
| 65 to 74 Years | 3 (30.0%) | 1 (20.0%) |
| 75 Years and over | 2 (50.0%) | 7 (77.8%) |
Disability Class by Sex by Age in Taylorstown
Disability Class: Hearing Difficulty
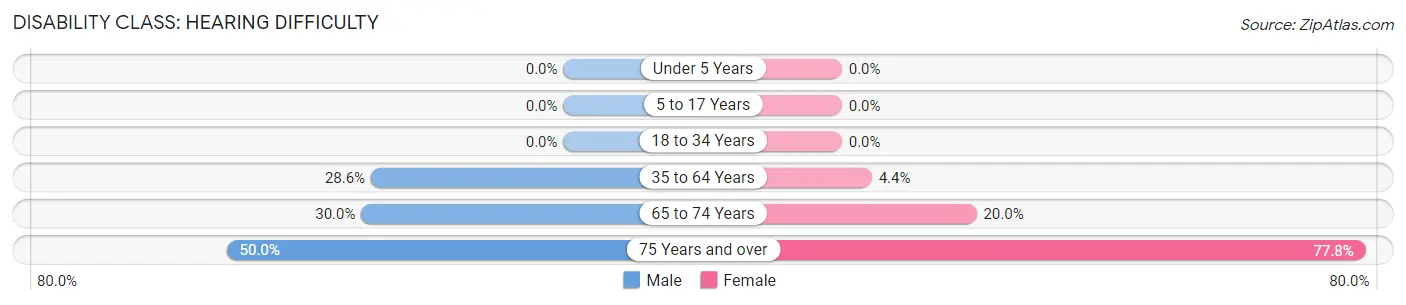
| Age Bracket | Male | Female |
| Under 5 Years | 0 (0.0%) | 0 (0.0%) |
| 5 to 17 Years | 0 (0.0%) | 0 (0.0%) |
| 18 to 34 Years | 0 (0.0%) | 0 (0.0%) |
| 35 to 64 Years | 12 (28.6%) | 2 (4.4%) |
| 65 to 74 Years | 3 (30.0%) | 1 (20.0%) |
| 75 Years and over | 2 (50.0%) | 7 (77.8%) |
Disability Class: Vision Difficulty
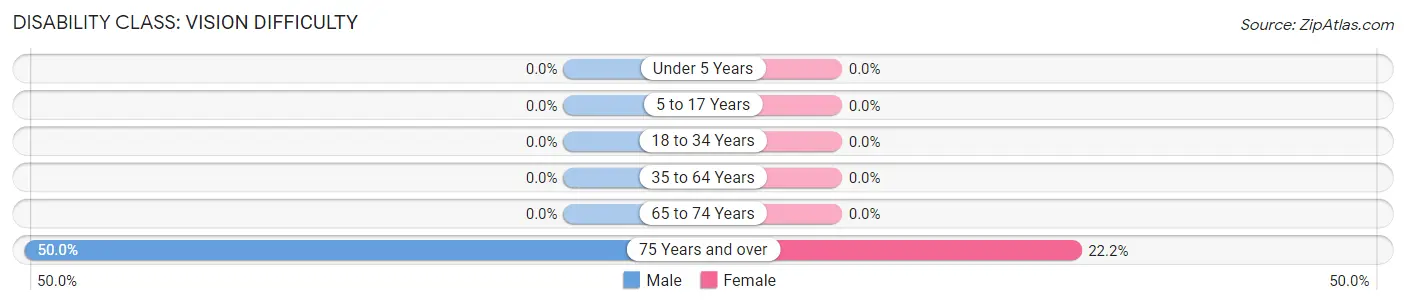
| Age Bracket | Male | Female |
| Under 5 Years | 0 (0.0%) | 0 (0.0%) |
| 5 to 17 Years | 0 (0.0%) | 0 (0.0%) |
| 18 to 34 Years | 0 (0.0%) | 0 (0.0%) |
| 35 to 64 Years | 0 (0.0%) | 0 (0.0%) |
| 65 to 74 Years | 0 (0.0%) | 0 (0.0%) |
| 75 Years and over | 2 (50.0%) | 2 (22.2%) |
Disability Class: Cognitive Difficulty
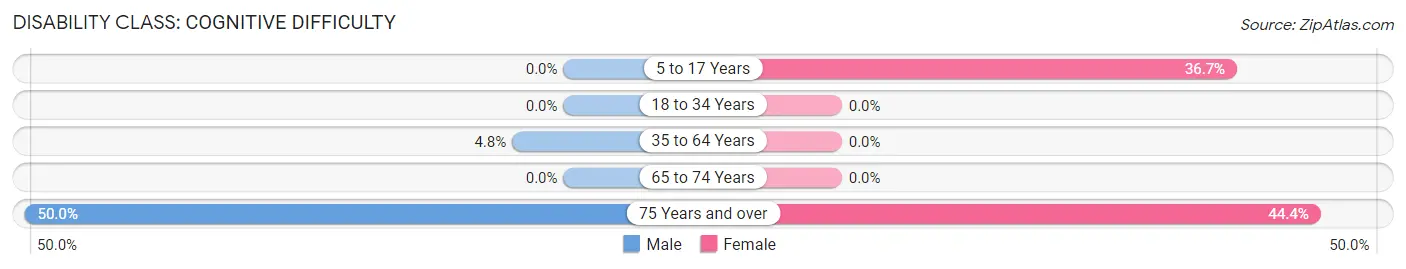
| Age Bracket | Male | Female |
| 5 to 17 Years | 0 (0.0%) | 11 (36.7%) |
| 18 to 34 Years | 0 (0.0%) | 0 (0.0%) |
| 35 to 64 Years | 2 (4.8%) | 0 (0.0%) |
| 65 to 74 Years | 0 (0.0%) | 0 (0.0%) |
| 75 Years and over | 2 (50.0%) | 4 (44.4%) |
Disability Class: Ambulatory Difficulty
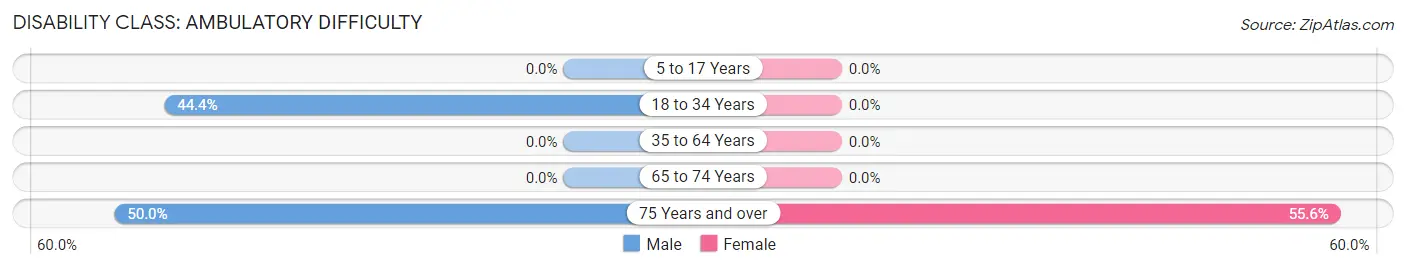
| Age Bracket | Male | Female |
| 5 to 17 Years | 0 (0.0%) | 0 (0.0%) |
| 18 to 34 Years | 8 (44.4%) | 0 (0.0%) |
| 35 to 64 Years | 0 (0.0%) | 0 (0.0%) |
| 65 to 74 Years | 0 (0.0%) | 0 (0.0%) |
| 75 Years and over | 2 (50.0%) | 5 (55.6%) |
Disability Class: Self-Care Difficulty
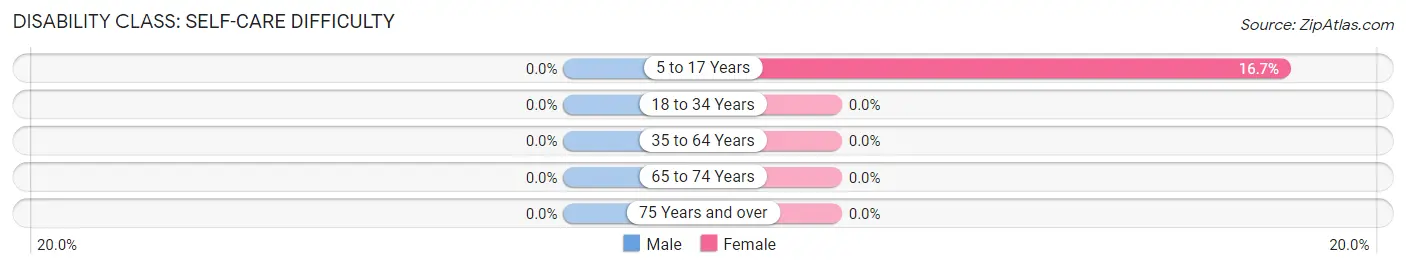
| Age Bracket | Male | Female |
| 5 to 17 Years | 0 (0.0%) | 5 (16.7%) |
| 18 to 34 Years | 0 (0.0%) | 0 (0.0%) |
| 35 to 64 Years | 0 (0.0%) | 0 (0.0%) |
| 65 to 74 Years | 0 (0.0%) | 0 (0.0%) |
| 75 Years and over | 0 (0.0%) | 0 (0.0%) |
Technology Access in Taylorstown
Computing Device Access in Taylorstown
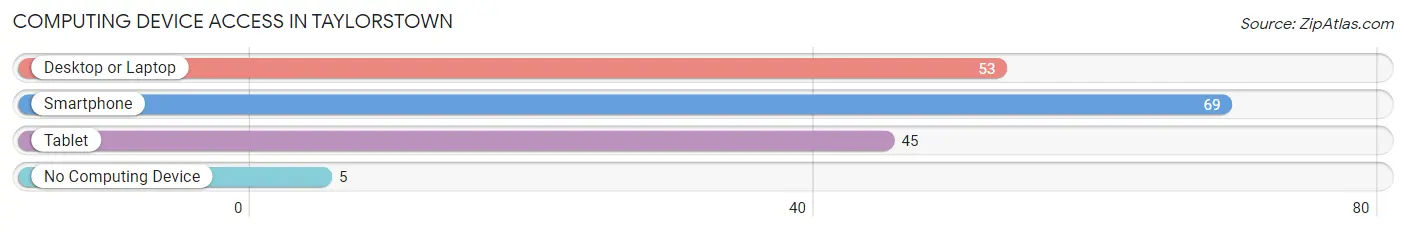
| Device Type | # Households | % Households |
| Desktop or Laptop | 53 | 67.1% |
| Smartphone | 69 | 87.3% |
| Tablet | 45 | 57.0% |
| No Computing Device | 5 | 6.3% |
| Total | 79 | 100.0% |
Internet Access in Taylorstown
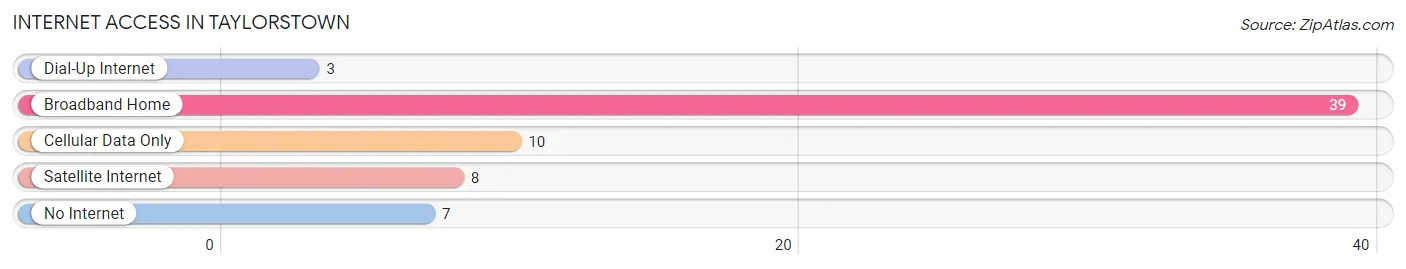
| Internet Type | # Households | % Households |
| Dial-Up Internet | 3 | 3.8% |
| Broadband Home | 39 | 49.4% |
| Cellular Data Only | 10 | 12.7% |
| Satellite Internet | 8 | 10.1% |
| No Internet | 7 | 8.9% |
| Total | 79 | 100.0% |
Taylorstown Summary
History
Taylorstown is a small unincorporated community located in Washington County, Pennsylvania. It is situated in the southwestern corner of the state, about 25 miles south of Pittsburgh. The area was first settled in the late 1700s by a group of Scots-Irish immigrants who had come to the area from the north of Ireland. The town was named after William Taylor, one of the first settlers.
The town grew slowly over the years, and by the mid-1800s it had become a thriving agricultural community. The town was home to several mills, including a grist mill, a saw mill, and a woolen mill. The town also had a blacksmith shop, a general store, and a post office.
In the late 1800s, the town began to experience a decline in population as many of the residents moved away to larger cities in search of better economic opportunities. By the early 1900s, the town had become a quiet, rural community.
Geography
Taylorstown is located in the southwestern corner of Washington County, Pennsylvania. It is situated in the foothills of the Allegheny Mountains, about 25 miles south of Pittsburgh. The town is bordered by the towns of Claysville to the north, West Finley to the east, and West Alexander to the south.
The town is situated on a plateau, with an elevation of about 1,000 feet above sea level. The terrain is mostly rolling hills, with some flat areas. The town is located in a temperate climate, with hot summers and cold winters.
Economy
The economy of Taylorstown is largely based on agriculture. The town is home to several farms, which produce a variety of crops, including corn, soybeans, wheat, and hay. The town also has several small businesses, including a general store, a post office, and a few restaurants.
The town is also home to a few small manufacturing companies, which produce a variety of products, including furniture, clothing, and automotive parts. The town is also home to a few small service businesses, such as auto repair shops and a gas station.
Demographics
As of the 2010 census, the population of Taylorstown was 1,093. The town is predominantly white, with about 95% of the population being of European descent. The town has a median household income of $45,000, and the median age is 44.
The town is home to a few churches, including a Presbyterian church, a Methodist church, and a Catholic church. The town also has a few schools, including a public elementary school and a private high school.
Conclusion
Taylorstown is a small, rural community located in Washington County, Pennsylvania. The town has a long history, dating back to the late 1700s, when it was first settled by a group of Scots-Irish immigrants. The town has a largely agricultural economy, with a few small businesses and manufacturing companies. The town is predominantly white, with a median household income of $45,000 and a median age of 44. Taylorstown is a quiet, peaceful community, with a few churches and schools.
Common Questions
What is Per Capita Income in Taylorstown?
Per Capita income in Taylorstown is $26,018.
What is the Median Family Income in Taylorstown?
Median Family Income in Taylorstown is $74,375.
What is the Median Household income in Taylorstown?
Median Household Income in Taylorstown is $73,281.
What is Income or Wage Gap in Taylorstown?
Income or Wage Gap in Taylorstown is 8.4%.
Women in Taylorstown earn 91.6 cents for every dollar earned by a man.
What is Inequality or Gini Index in Taylorstown?
Inequality or Gini Index in Taylorstown is 0.28.
What is the Total Population of Taylorstown?
Total Population of Taylorstown is 262.
What is the Total Male Population of Taylorstown?
Total Male Population of Taylorstown is 125.
What is the Total Female Population of Taylorstown?
Total Female Population of Taylorstown is 137.
What is the Ratio of Males per 100 Females in Taylorstown?
There are 91.24 Males per 100 Females in Taylorstown.
What is the Ratio of Females per 100 Males in Taylorstown?
There are 109.60 Females per 100 Males in Taylorstown.
What is the Median Population Age in Taylorstown?
Median Population Age in Taylorstown is 27.9 Years.
What is the Average Family Size in Taylorstown
Average Family Size in Taylorstown is 3.4 People.
What is the Average Household Size in Taylorstown
Average Household Size in Taylorstown is 3.3 People.
How Large is the Labor Force in Taylorstown?
There are 129 People in the Labor Forcein in Taylorstown.
What is the Percentage of People in the Labor Force in Taylorstown?
74.6% of People are in the Labor Force in Taylorstown.
What is the Unemployment Rate in Taylorstown?
Unemployment Rate in Taylorstown is 6.2%.