Cresson borough, PA Map & Demographics
Cresson borough Overview
$32,254
PER CAPITA INCOME
$81,989
AVG FAMILY INCOME
$58,929
AVG HOUSEHOLD INCOME
40.4%
WAGE / INCOME GAP [ % ]
59.6¢/ $1
WAGE / INCOME GAP [ $ ]
0.40
INEQUALITY / GINI INDEX
1,529
TOTAL POPULATION
736
MALE POPULATION
793
FEMALE POPULATION
92.81
MALES / 100 FEMALES
107.74
FEMALES / 100 MALES
42.7
MEDIAN AGE
3.1
AVG FAMILY SIZE
2.3
AVG HOUSEHOLD SIZE
855
LABOR FORCE [ PEOPLE ]
65.8%
PERCENT IN LABOR FORCE
4.4%
UNEMPLOYMENT RATE
Income in Cresson borough
Income Overview in Cresson borough
Per Capita Income in Cresson borough is $32,254, while median incomes of families and households are $81,989 and $58,929 respectively.
| Characteristic | Number | Measure |
| Per Capita Income | 1,529 | $32,254 |
| Median Family Income | 335 | $81,989 |
| Mean Family Income | 335 | $92,887 |
| Median Household Income | 656 | $58,929 |
| Mean Household Income | 656 | $71,391 |
| Income Deficit | 335 | $0 |
| Wage / Income Gap (%) | 1,529 | 40.45% |
| Wage / Income Gap ($) | 1,529 | 59.55¢ per $1 |
| Gini / Inequality Index | 1,529 | 0.40 |
Earnings by Sex in Cresson borough
Average Earnings in Cresson borough are $34,185, $45,580 for men and $27,143 for women, a difference of 40.5%.
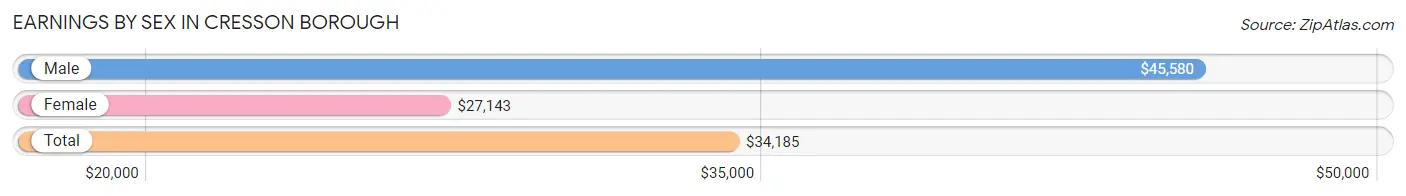
| Sex | Number | Average Earnings |
| Male | 415 (46.6%) | $45,580 |
| Female | 476 (53.4%) | $27,143 |
| Total | 891 (100.0%) | $34,185 |
Earnings by Sex by Income Bracket in Cresson borough
The most common earnings brackets in Cresson borough are $45,000 to $49,999 for men (46 | 11.1%) and $12,500 to $14,999 for women (55 | 11.6%).
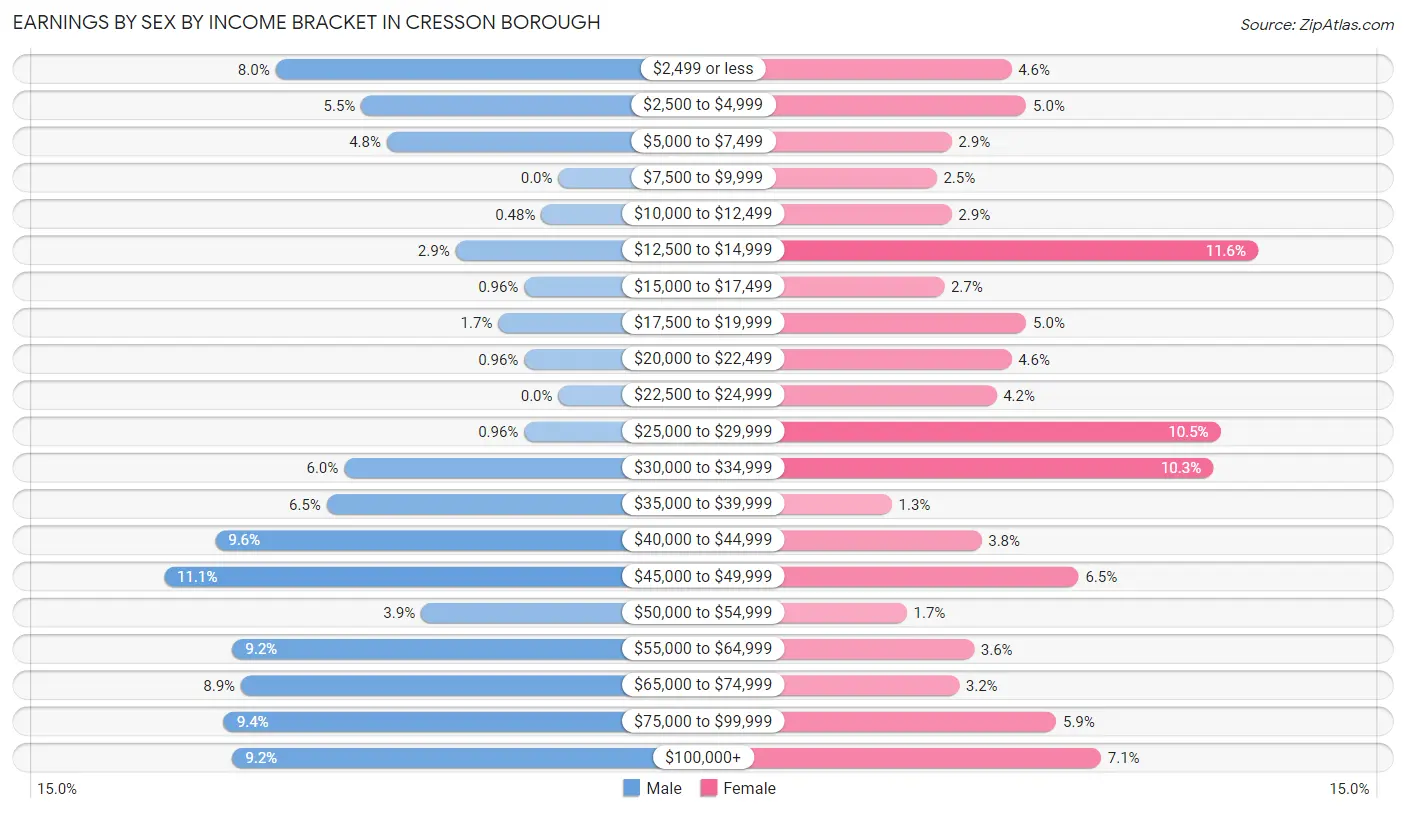
| Income | Male | Female |
| $2,499 or less | 33 (8.0%) | 22 (4.6%) |
| $2,500 to $4,999 | 23 (5.5%) | 24 (5.0%) |
| $5,000 to $7,499 | 20 (4.8%) | 14 (2.9%) |
| $7,500 to $9,999 | 0 (0.0%) | 12 (2.5%) |
| $10,000 to $12,499 | 2 (0.5%) | 14 (2.9%) |
| $12,500 to $14,999 | 12 (2.9%) | 55 (11.6%) |
| $15,000 to $17,499 | 4 (1.0%) | 13 (2.7%) |
| $17,500 to $19,999 | 7 (1.7%) | 24 (5.0%) |
| $20,000 to $22,499 | 4 (1.0%) | 22 (4.6%) |
| $22,500 to $24,999 | 0 (0.0%) | 20 (4.2%) |
| $25,000 to $29,999 | 4 (1.0%) | 50 (10.5%) |
| $30,000 to $34,999 | 25 (6.0%) | 49 (10.3%) |
| $35,000 to $39,999 | 27 (6.5%) | 6 (1.3%) |
| $40,000 to $44,999 | 40 (9.6%) | 18 (3.8%) |
| $45,000 to $49,999 | 46 (11.1%) | 31 (6.5%) |
| $50,000 to $54,999 | 16 (3.9%) | 8 (1.7%) |
| $55,000 to $64,999 | 38 (9.2%) | 17 (3.6%) |
| $65,000 to $74,999 | 37 (8.9%) | 15 (3.2%) |
| $75,000 to $99,999 | 39 (9.4%) | 28 (5.9%) |
| $100,000+ | 38 (9.2%) | 34 (7.1%) |
| Total | 415 (100.0%) | 476 (100.0%) |
Earnings by Sex by Educational Attainment in Cresson borough
Average earnings in Cresson borough are $47,847 for men and $30,030 for women, a difference of 37.2%. Men with an educational attainment of graduate degree enjoy the highest average annual earnings of $72,083, while those with college or associate's degree education earn the least with $46,923. Women with an educational attainment of graduate degree earn the most with the average annual earnings of $57,000, while those with high school diploma education have the smallest earnings of $18,611.
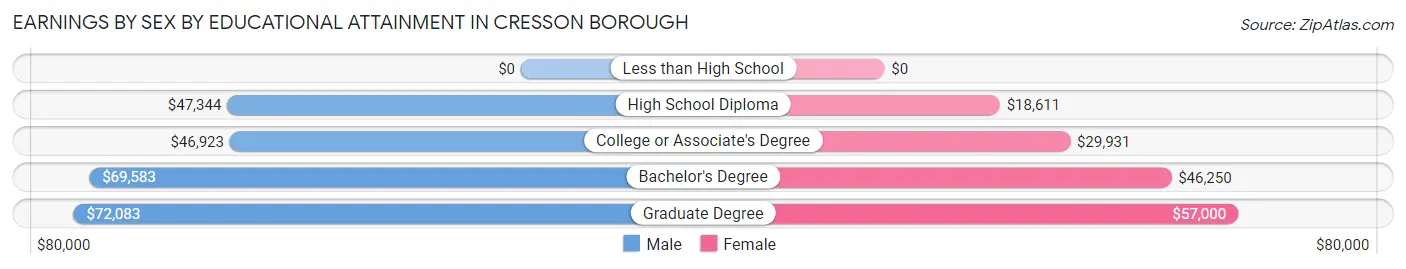
| Educational Attainment | Male Income | Female Income |
| Less than High School | - | - |
| High School Diploma | $47,344 | $18,611 |
| College or Associate's Degree | $46,923 | $29,931 |
| Bachelor's Degree | $69,583 | $46,250 |
| Graduate Degree | $72,083 | $57,000 |
| Total | $47,847 | $30,030 |
Family Income in Cresson borough
Family Income Brackets in Cresson borough
According to the Cresson borough family income data, there are 93 families falling into the $100,000 to $149,999 income range, which is the most common income bracket and makes up 27.8% of all families.
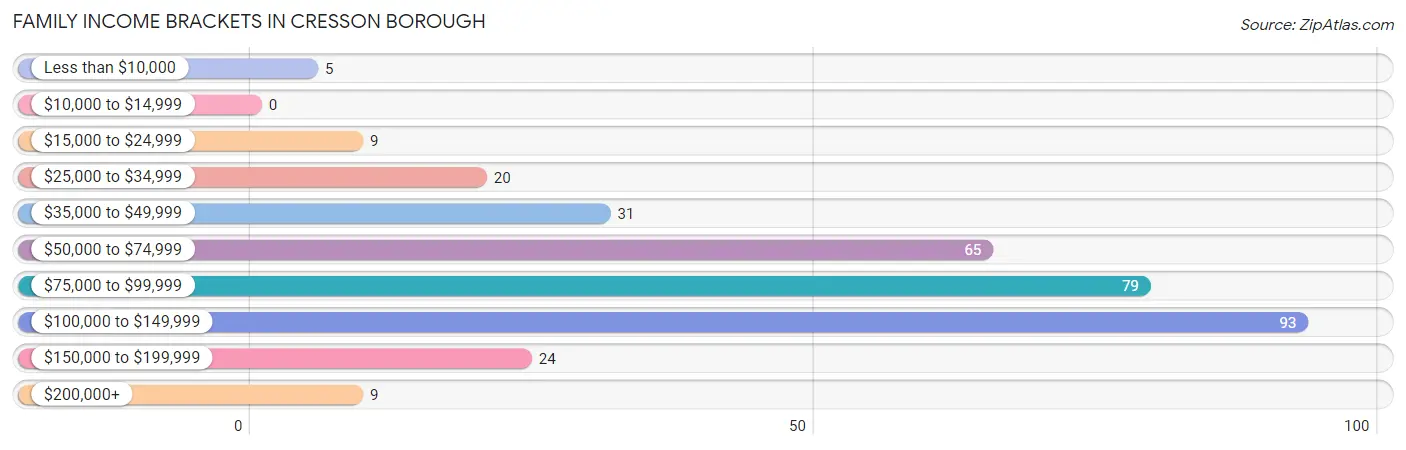
| Income Bracket | # Families | % Families |
| Less than $10,000 | 5 | 1.5% |
| $10,000 to $14,999 | 0 | 0.0% |
| $15,000 to $24,999 | 9 | 2.7% |
| $25,000 to $34,999 | 20 | 6.0% |
| $35,000 to $49,999 | 31 | 9.3% |
| $50,000 to $74,999 | 65 | 19.4% |
| $75,000 to $99,999 | 79 | 23.6% |
| $100,000 to $149,999 | 93 | 27.8% |
| $150,000 to $199,999 | 24 | 7.2% |
| $200,000+ | 9 | 2.7% |
Family Income by Famaliy Size in Cresson borough
4-person families (68 | 20.3%) account for the highest median family income in Cresson borough with $101,667 per family, while 2-person families (162 | 48.4%) have the highest median income of $41,072 per family member.
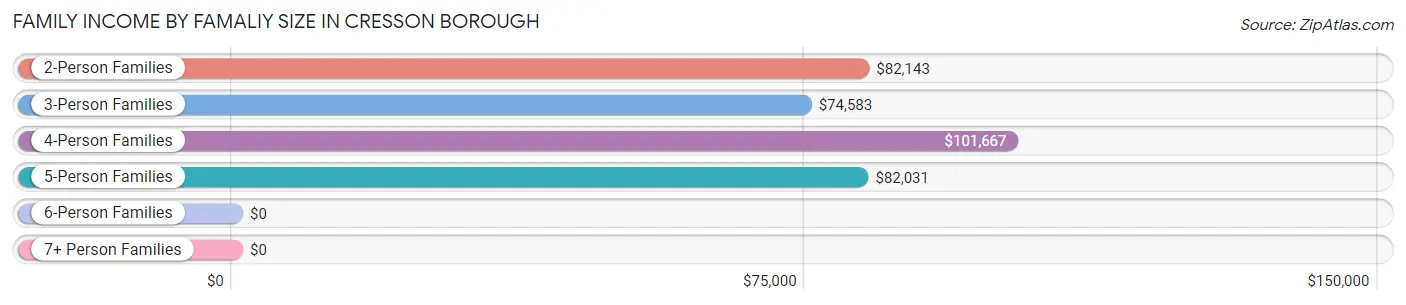
| Income Bracket | # Families | Median Income |
| 2-Person Families | 162 (48.4%) | $82,143 |
| 3-Person Families | 67 (20.0%) | $74,583 |
| 4-Person Families | 68 (20.3%) | $101,667 |
| 5-Person Families | 25 (7.5%) | $82,031 |
| 6-Person Families | 10 (3.0%) | $0 |
| 7+ Person Families | 3 (0.9%) | $0 |
| Total | 335 (100.0%) | $81,989 |
Family Income by Number of Earners in Cresson borough
The median family income in Cresson borough is $81,989, with families comprising 2 earners (168) having the highest median family income of $100,167, while families with no earners (43) have the lowest median family income of $52,917, accounting for 50.1% and 12.8% of families, respectively.
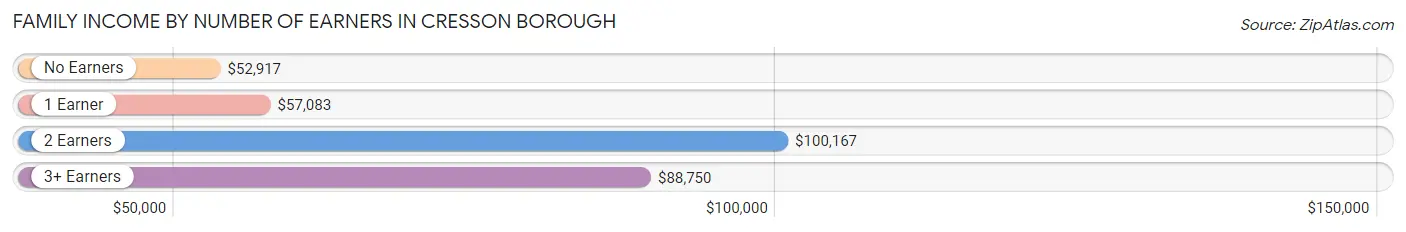
| Number of Earners | # Families | Median Income |
| No Earners | 43 (12.8%) | $52,917 |
| 1 Earner | 76 (22.7%) | $57,083 |
| 2 Earners | 168 (50.1%) | $100,167 |
| 3+ Earners | 48 (14.3%) | $88,750 |
| Total | 335 (100.0%) | $81,989 |
Household Income in Cresson borough
Household Income Brackets in Cresson borough
With 134 households falling in the category, the $100,000 to $149,999 income range is the most frequent in Cresson borough, accounting for 20.4% of all households. In contrast, only 16 households (2.4%) fall into the $200,000+ income bracket, making it the least populous group.
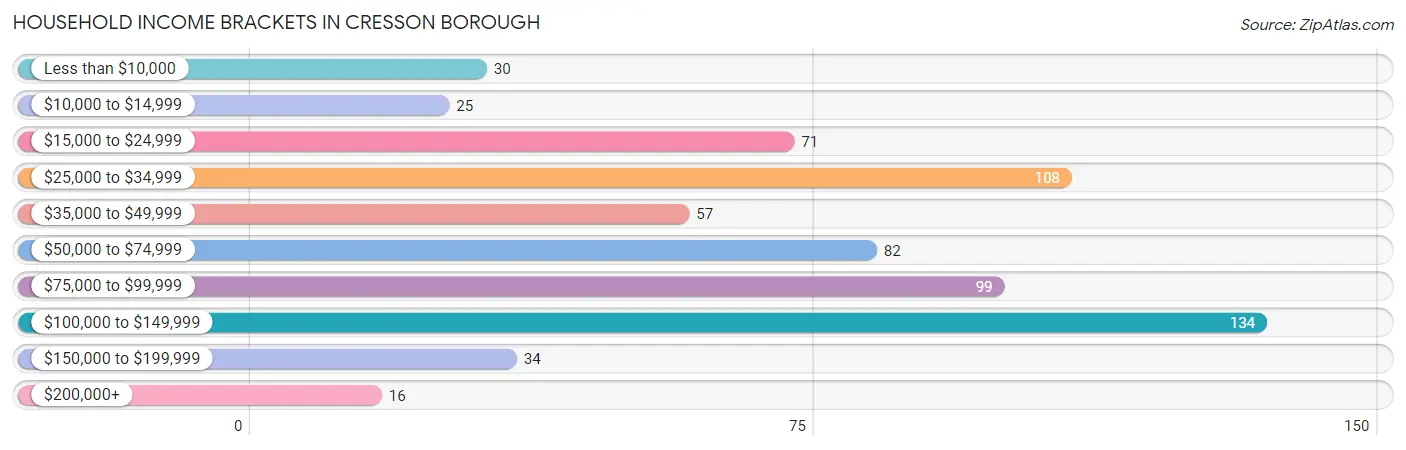
| Income Bracket | # Households | % Households |
| Less than $10,000 | 30 | 4.6% |
| $10,000 to $14,999 | 25 | 3.8% |
| $15,000 to $24,999 | 71 | 10.8% |
| $25,000 to $34,999 | 108 | 16.5% |
| $35,000 to $49,999 | 57 | 8.7% |
| $50,000 to $74,999 | 82 | 12.5% |
| $75,000 to $99,999 | 99 | 15.1% |
| $100,000 to $149,999 | 134 | 20.4% |
| $150,000 to $199,999 | 34 | 5.2% |
| $200,000+ | 16 | 2.4% |
Household Income by Householder Age in Cresson borough
The median household income in Cresson borough is $58,929, with the highest median household income of $78,750 found in the 45 to 64 years age bracket for the primary householder. A total of 274 households (41.8%) fall into this category. Meanwhile, the 15 to 24 years age bracket for the primary householder has the lowest median household income of $0, with 10 households (1.5%) in this group.
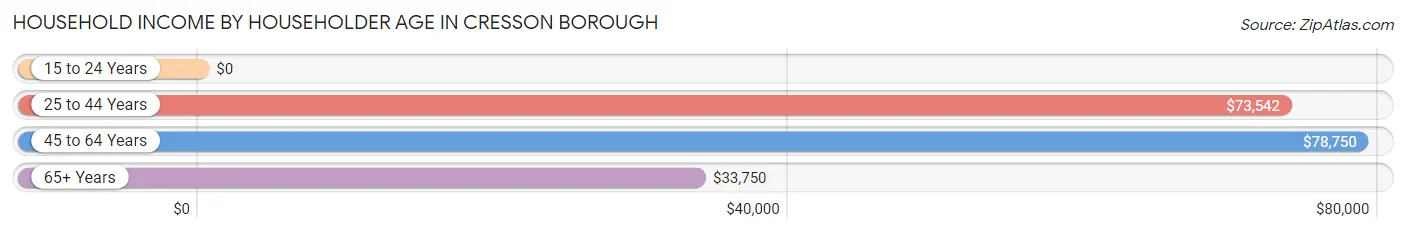
| Income Bracket | # Households | Median Income |
| 15 to 24 Years | 10 (1.5%) | $0 |
| 25 to 44 Years | 201 (30.6%) | $73,542 |
| 45 to 64 Years | 274 (41.8%) | $78,750 |
| 65+ Years | 171 (26.1%) | $33,750 |
| Total | 656 (100.0%) | $58,929 |
Poverty in Cresson borough
Income Below Poverty by Sex and Age in Cresson borough
With 10.2% poverty level for males and 8.3% for females among the residents of Cresson borough, 75 year old and over males and 18 to 24 year old females are the most vulnerable to poverty, with 13 males (26.5%) and 21 females (32.3%) in their respective age groups living below the poverty level.
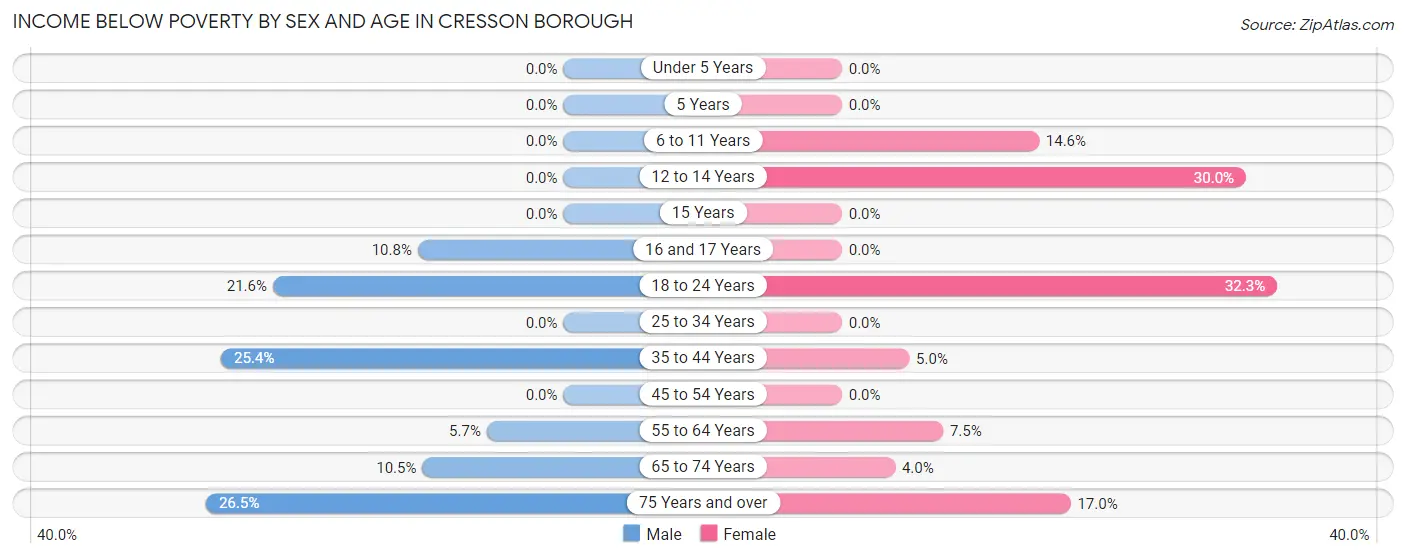
| Age Bracket | Male | Female |
| Under 5 Years | 0 (0.0%) | 0 (0.0%) |
| 5 Years | 0 (0.0%) | 0 (0.0%) |
| 6 to 11 Years | 0 (0.0%) | 6 (14.6%) |
| 12 to 14 Years | 0 (0.0%) | 6 (30.0%) |
| 15 Years | 0 (0.0%) | 0 (0.0%) |
| 16 and 17 Years | 4 (10.8%) | 0 (0.0%) |
| 18 to 24 Years | 11 (21.6%) | 21 (32.3%) |
| 25 to 34 Years | 0 (0.0%) | 0 (0.0%) |
| 35 to 44 Years | 31 (25.4%) | 7 (5.0%) |
| 45 to 54 Years | 0 (0.0%) | 0 (0.0%) |
| 55 to 64 Years | 7 (5.7%) | 13 (7.5%) |
| 65 to 74 Years | 9 (10.5%) | 3 (4.0%) |
| 75 Years and over | 13 (26.5%) | 9 (17.0%) |
| Total | 75 (10.2%) | 65 (8.3%) |
Income Above Poverty by Sex and Age in Cresson borough
According to the poverty statistics in Cresson borough, males aged under 5 years and females aged under 5 years are the age groups that are most secure financially, with 100.0% of males and 100.0% of females in these age groups living above the poverty line.
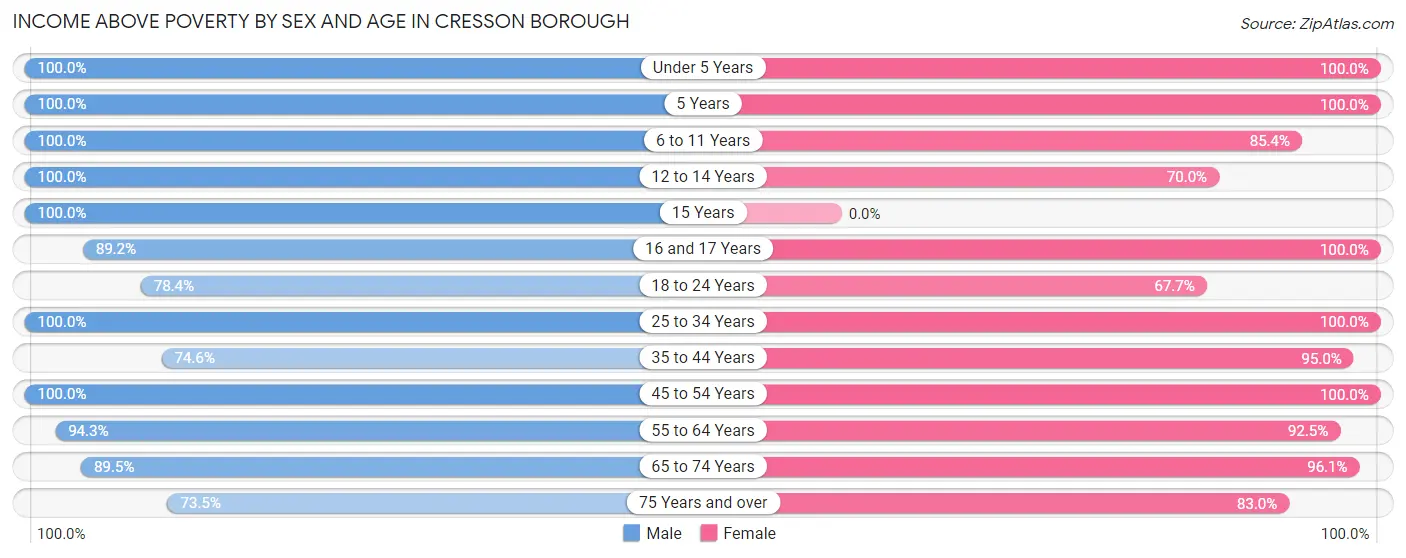
| Age Bracket | Male | Female |
| Under 5 Years | 28 (100.0%) | 24 (100.0%) |
| 5 Years | 7 (100.0%) | 18 (100.0%) |
| 6 to 11 Years | 63 (100.0%) | 35 (85.4%) |
| 12 to 14 Years | 11 (100.0%) | 14 (70.0%) |
| 15 Years | 4 (100.0%) | 0 (0.0%) |
| 16 and 17 Years | 33 (89.2%) | 28 (100.0%) |
| 18 to 24 Years | 40 (78.4%) | 44 (67.7%) |
| 25 to 34 Years | 84 (100.0%) | 63 (100.0%) |
| 35 to 44 Years | 91 (74.6%) | 133 (95.0%) |
| 45 to 54 Years | 68 (100.0%) | 82 (100.0%) |
| 55 to 64 Years | 116 (94.3%) | 160 (92.5%) |
| 65 to 74 Years | 77 (89.5%) | 73 (96.1%) |
| 75 Years and over | 36 (73.5%) | 44 (83.0%) |
| Total | 658 (89.8%) | 718 (91.7%) |
Income Below Poverty Among Married-Couple Families in Cresson borough
The poverty statistics for married-couple families in Cresson borough show that 0.8% or 2 of the total 238 families live below the poverty line. Families with no children have the highest poverty rate of 1.3%, comprising of 2 families. On the other hand, families with 1 or 2 children have the lowest poverty rate of 0.0%, which includes 0 families.
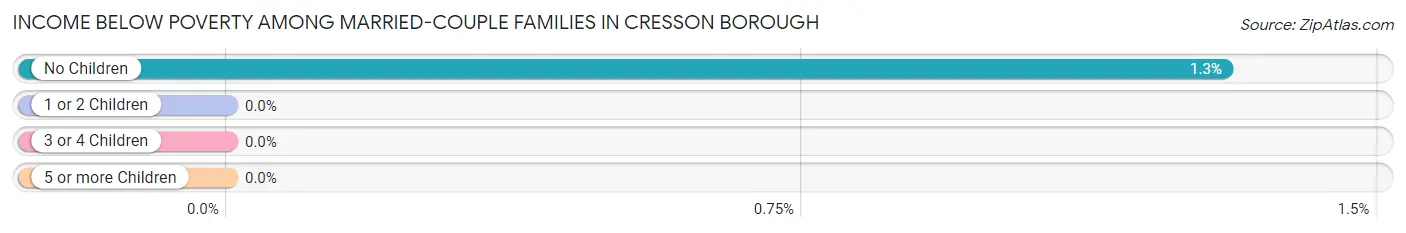
| Children | Above Poverty | Below Poverty |
| No Children | 152 (98.7%) | 2 (1.3%) |
| 1 or 2 Children | 61 (100.0%) | 0 (0.0%) |
| 3 or 4 Children | 23 (100.0%) | 0 (0.0%) |
| 5 or more Children | 0 (0.0%) | 0 (0.0%) |
| Total | 236 (99.2%) | 2 (0.8%) |
Income Below Poverty Among Single-Parent Households in Cresson borough
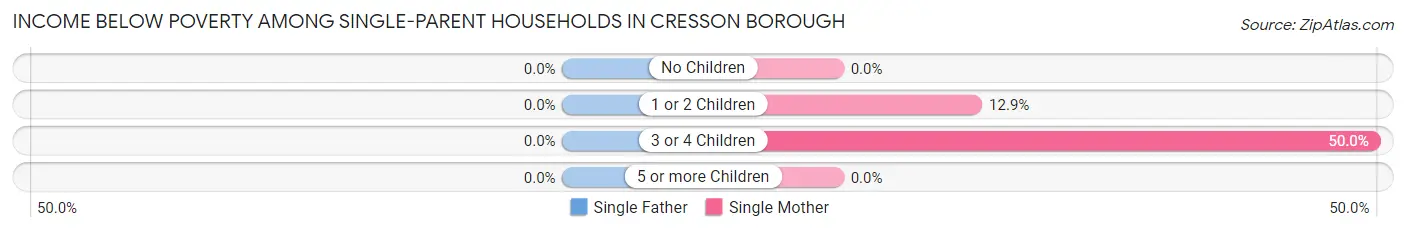
| Children | Single Father | Single Mother |
| No Children | 0 (0.0%) | 0 (0.0%) |
| 1 or 2 Children | 0 (0.0%) | 4 (12.9%) |
| 3 or 4 Children | 0 (0.0%) | 3 (50.0%) |
| 5 or more Children | 0 (0.0%) | 0 (0.0%) |
| Total | 0 (0.0%) | 7 (10.3%) |
Income Below Poverty Among Married-Couple vs Single-Parent Households in Cresson borough
The poverty data for Cresson borough shows that 2 of the married-couple family households (0.8%) and 7 of the single-parent households (7.2%) are living below the poverty level. Within the married-couple family households, those with no children have the highest poverty rate, with 2 households (1.3%) falling below the poverty line. Among the single-parent households, those with 3 or 4 children have the highest poverty rate, with 3 household (50.0%) living below poverty.
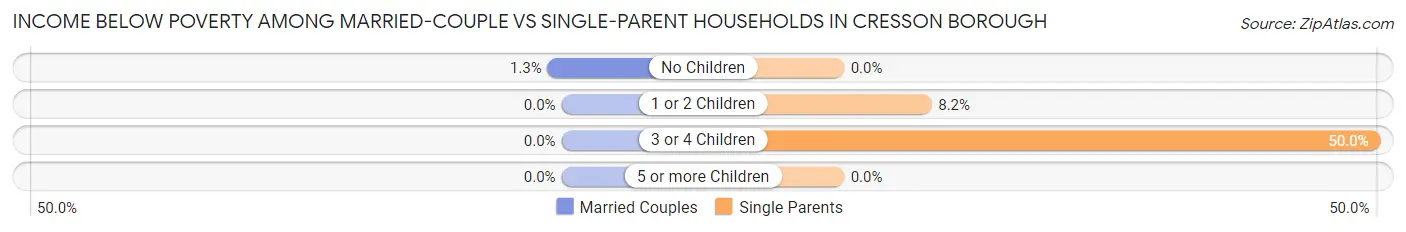
| Children | Married-Couple Families | Single-Parent Households |
| No Children | 2 (1.3%) | 0 (0.0%) |
| 1 or 2 Children | 0 (0.0%) | 4 (8.2%) |
| 3 or 4 Children | 0 (0.0%) | 3 (50.0%) |
| 5 or more Children | 0 (0.0%) | 0 (0.0%) |
| Total | 2 (0.8%) | 7 (7.2%) |
Race in Cresson borough
The most populous races in Cresson borough are White / Caucasian (1,464 | 95.8%), Two or more Races (57 | 3.7%), and Black / African American (8 | 0.5%).
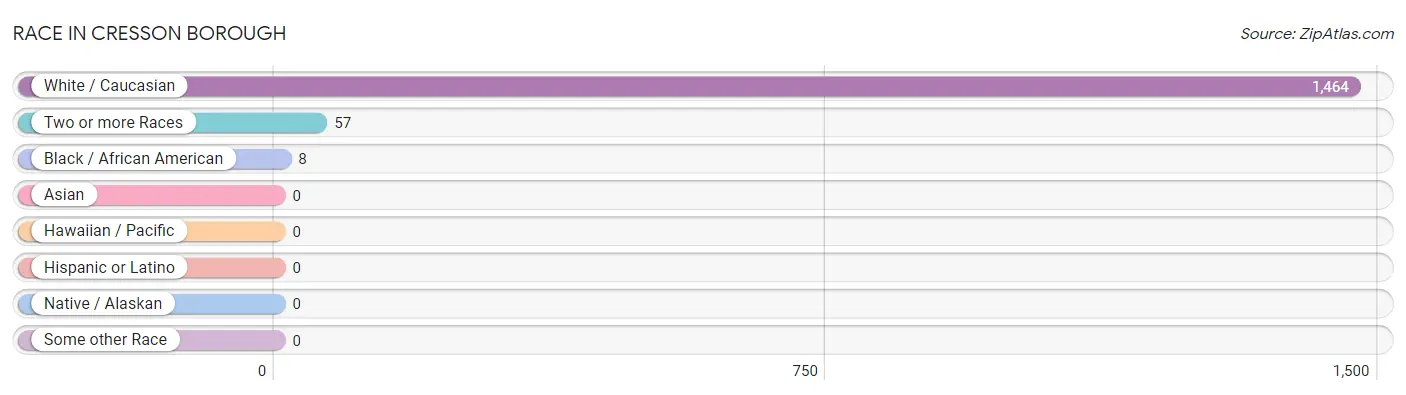
| Race | # Population | % Population |
| Asian | 0 | 0.0% |
| Black / African American | 8 | 0.5% |
| Hawaiian / Pacific | 0 | 0.0% |
| Hispanic or Latino | 0 | 0.0% |
| Native / Alaskan | 0 | 0.0% |
| White / Caucasian | 1,464 | 95.8% |
| Two or more Races | 57 | 3.7% |
| Some other Race | 0 | 0.0% |
| Total | 1,529 | 100.0% |
Ancestry in Cresson borough
The most populous ancestries reported in Cresson borough are German (532 | 34.8%), Irish (439 | 28.7%), Polish (204 | 13.3%), Italian (196 | 12.8%), and English (103 | 6.7%), together accounting for 96.4% of all Cresson borough residents.
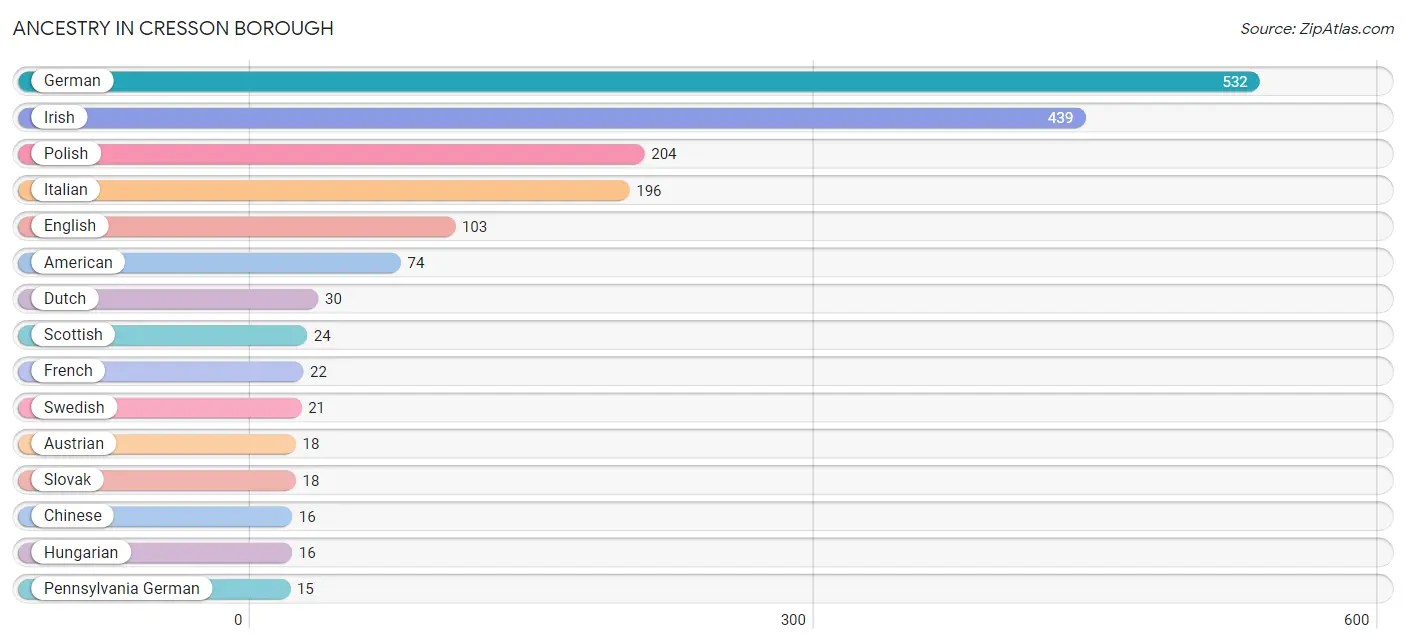
| Ancestry | # Population | % Population |
| American | 74 | 4.8% |
| Arab | 3 | 0.2% |
| Austrian | 18 | 1.2% |
| Bhutanese | 9 | 0.6% |
| British | 2 | 0.1% |
| Chinese | 16 | 1.1% |
| Czech | 3 | 0.2% |
| Dutch | 30 | 2.0% |
| Eastern European | 11 | 0.7% |
| English | 103 | 6.7% |
| European | 7 | 0.5% |
| French | 22 | 1.4% |
| French Canadian | 3 | 0.2% |
| German | 532 | 34.8% |
| Hungarian | 16 | 1.1% |
| Irish | 439 | 28.7% |
| Italian | 196 | 12.8% |
| Native Hawaiian | 3 | 0.2% |
| Pennsylvania German | 15 | 1.0% |
| Polish | 204 | 13.3% |
| Scotch-Irish | 6 | 0.4% |
| Scottish | 24 | 1.6% |
| Slavic | 4 | 0.3% |
| Slovak | 18 | 1.2% |
| Swedish | 21 | 1.4% |
| Ukrainian | 14 | 0.9% |
| Welsh | 3 | 0.2% | View All 27 Rows |
Immigrants in Cresson borough
The most numerous immigrant groups reported in Cresson borough came from Asia (3 | 0.2%), Saudi Arabia (3 | 0.2%), and Western Asia (3 | 0.2%), together accounting for 0.6% of all Cresson borough residents.
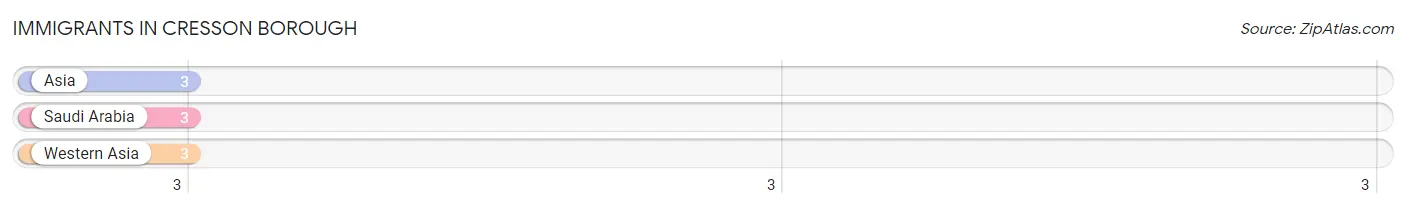
| Immigration Origin | # Population | % Population |
| Asia | 3 | 0.2% |
| Saudi Arabia | 3 | 0.2% |
| Western Asia | 3 | 0.2% | View All 3 Rows |
Sex and Age in Cresson borough
Sex and Age in Cresson borough
The most populous age groups in Cresson borough are 40 to 44 Years (74 | 10.1%) for men and 60 to 64 Years (110 | 13.9%) for women.
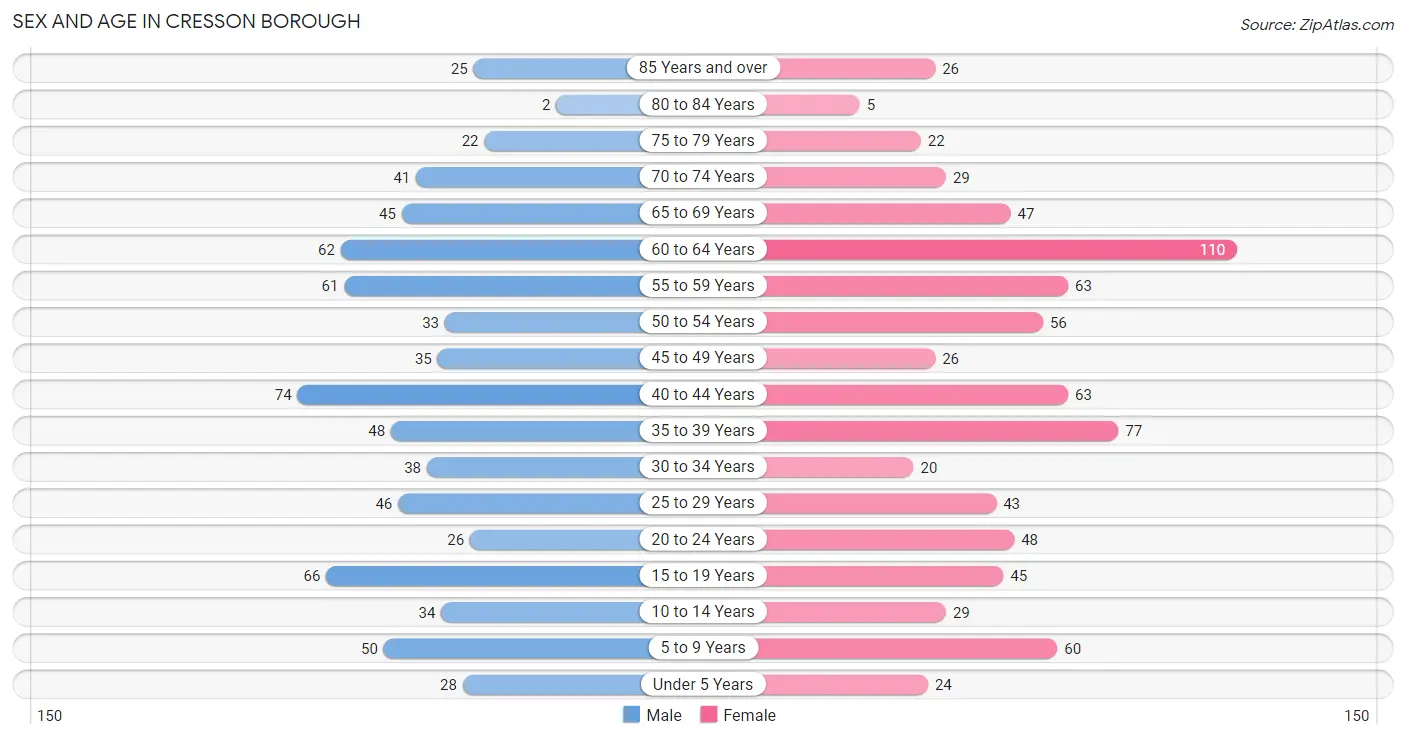
| Age Bracket | Male | Female |
| Under 5 Years | 28 (3.8%) | 24 (3.0%) |
| 5 to 9 Years | 50 (6.8%) | 60 (7.6%) |
| 10 to 14 Years | 34 (4.6%) | 29 (3.7%) |
| 15 to 19 Years | 66 (9.0%) | 45 (5.7%) |
| 20 to 24 Years | 26 (3.5%) | 48 (6.0%) |
| 25 to 29 Years | 46 (6.2%) | 43 (5.4%) |
| 30 to 34 Years | 38 (5.2%) | 20 (2.5%) |
| 35 to 39 Years | 48 (6.5%) | 77 (9.7%) |
| 40 to 44 Years | 74 (10.1%) | 63 (7.9%) |
| 45 to 49 Years | 35 (4.8%) | 26 (3.3%) |
| 50 to 54 Years | 33 (4.5%) | 56 (7.1%) |
| 55 to 59 Years | 61 (8.3%) | 63 (7.9%) |
| 60 to 64 Years | 62 (8.4%) | 110 (13.9%) |
| 65 to 69 Years | 45 (6.1%) | 47 (5.9%) |
| 70 to 74 Years | 41 (5.6%) | 29 (3.7%) |
| 75 to 79 Years | 22 (3.0%) | 22 (2.8%) |
| 80 to 84 Years | 2 (0.3%) | 5 (0.6%) |
| 85 Years and over | 25 (3.4%) | 26 (3.3%) |
| Total | 736 (100.0%) | 793 (100.0%) |
Families and Households in Cresson borough
Median Family Size in Cresson borough
The median family size in Cresson borough is 3.15 persons per family, with married-couple families (238 | 71.0%) accounting for the largest median family size of 3.25 persons per family. On the other hand, single male/father families (29 | 8.7%) represent the smallest median family size with 2.48 persons per family.
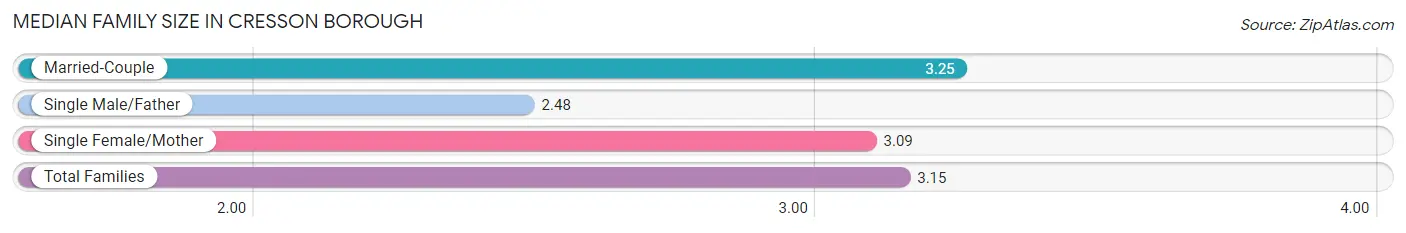
| Family Type | # Families | Family Size |
| Married-Couple | 238 (71.0%) | 3.25 |
| Single Male/Father | 29 (8.7%) | 2.48 |
| Single Female/Mother | 68 (20.3%) | 3.09 |
| Total Families | 335 (100.0%) | 3.15 |
Median Household Size in Cresson borough
The median household size in Cresson borough is 2.26 persons per household, with single male/father households (29 | 4.4%) accounting for the largest median household size of 3.52 persons per household. non-family households (321 | 48.9%) represent the smallest median household size with 1.16 persons per household.
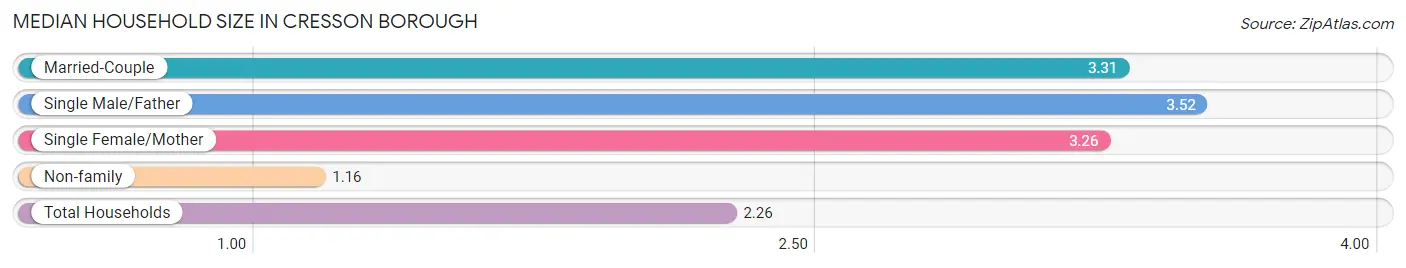
| Household Type | # Households | Household Size |
| Married-Couple | 238 (36.3%) | 3.31 |
| Single Male/Father | 29 (4.4%) | 3.52 |
| Single Female/Mother | 68 (10.4%) | 3.26 |
| Non-family | 321 (48.9%) | 1.16 |
| Total Households | 656 (100.0%) | 2.26 |
Household Size by Marriage Status in Cresson borough
Out of a total of 656 households in Cresson borough, 335 (51.1%) are family households, while 321 (48.9%) are nonfamily households. The most numerous type of family households are 2-person households, comprising 144, and the most common type of nonfamily households are 1-person households, comprising 277.
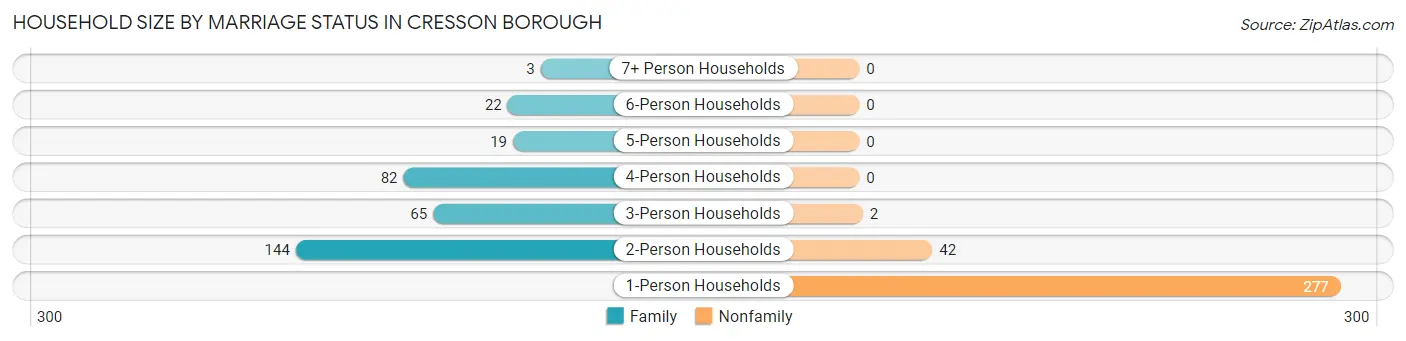
| Household Size | Family Households | Nonfamily Households |
| 1-Person Households | - | 277 (42.2%) |
| 2-Person Households | 144 (22.0%) | 42 (6.4%) |
| 3-Person Households | 65 (9.9%) | 2 (0.3%) |
| 4-Person Households | 82 (12.5%) | 0 (0.0%) |
| 5-Person Households | 19 (2.9%) | 0 (0.0%) |
| 6-Person Households | 22 (3.4%) | 0 (0.0%) |
| 7+ Person Households | 3 (0.5%) | 0 (0.0%) |
| Total | 335 (51.1%) | 321 (48.9%) |
Female Fertility in Cresson borough
Fertility by Age in Cresson borough
Average fertility rate in Cresson borough is 24.0 births per 1,000 women. Women in the age bracket of 20 to 34 years have the highest fertility rate with 45.0 births per 1,000 women. Women in the age bracket of 20 to 34 years acount for 62.5% of all women with births.
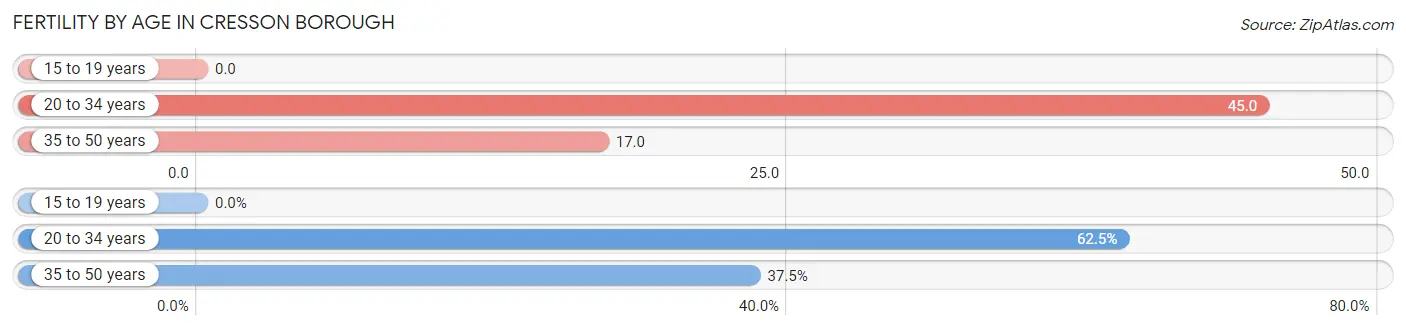
| Age Bracket | Women with Births | Births / 1,000 Women |
| 15 to 19 years | 0 (0.0%) | 0.0 |
| 20 to 34 years | 5 (62.5%) | 45.0 |
| 35 to 50 years | 3 (37.5%) | 17.0 |
| Total | 8 (100.0%) | 24.0 |
Fertility by Age by Marriage Status in Cresson borough
37.5% of women with births (8) in Cresson borough are married. The highest percentage of unmarried women with births falls into 20 to 34 years age bracket with 100.0% of them unmarried at the time of birth, while the lowest percentage of unmarried women with births belong to 35 to 50 years age bracket with 0.0% of them unmarried.
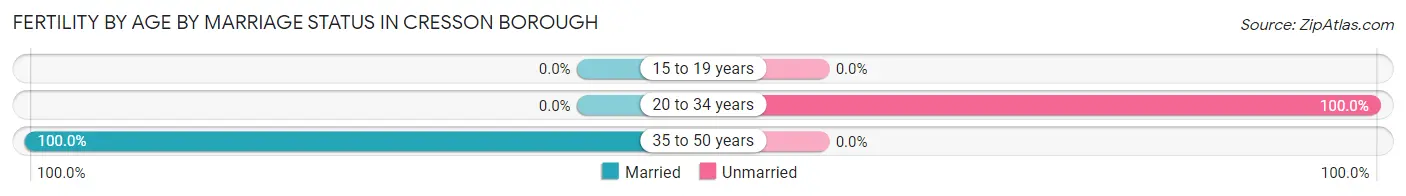
| Age Bracket | Married | Unmarried |
| 15 to 19 years | 0 (0.0%) | 0 (0.0%) |
| 20 to 34 years | 0 (0.0%) | 5 (100.0%) |
| 35 to 50 years | 3 (100.0%) | 0 (0.0%) |
| Total | 3 (37.5%) | 5 (62.5%) |
Fertility by Education in Cresson borough
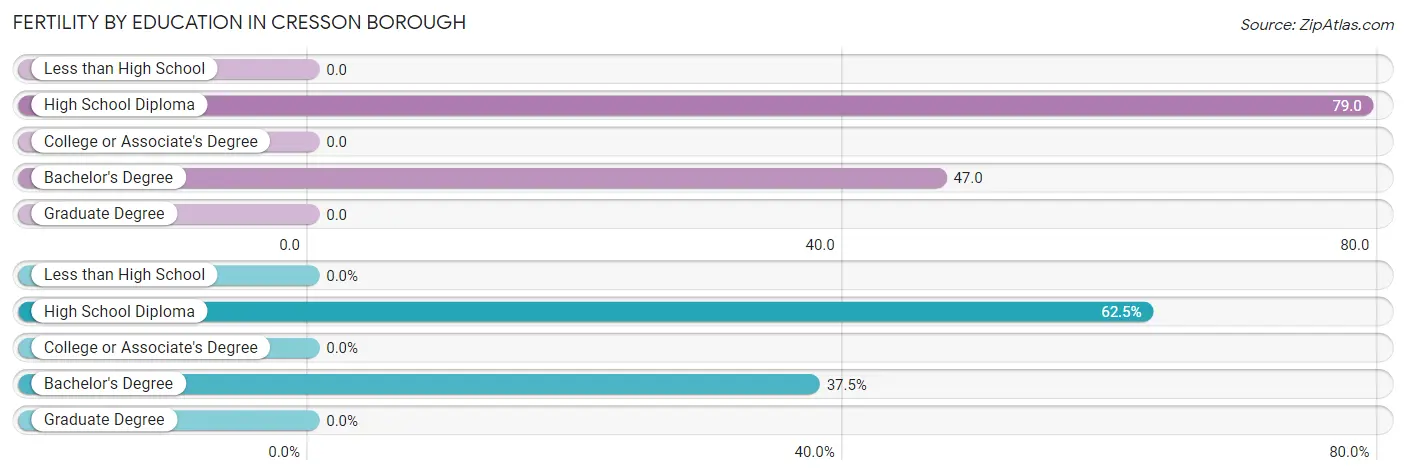
| Educational Attainment | Women with Births | Births / 1,000 Women |
| Less than High School | 0 (0.0%) | 0.0 |
| High School Diploma | 5 (62.5%) | 79.0 |
| College or Associate's Degree | 0 (0.0%) | 0.0 |
| Bachelor's Degree | 3 (37.5%) | 47.0 |
| Graduate Degree | 0 (0.0%) | 0.0 |
| Total | 8 (100.0%) | 24.0 |
Fertility by Education by Marriage Status in Cresson borough
62.5% of women with births in Cresson borough are unmarried. Women with the educational attainment of bachelor's degree are most likely to be married with 100.0% of them married at childbirth, while women with the educational attainment of high school diploma are least likely to be married with 100.0% of them unmarried at childbirth.
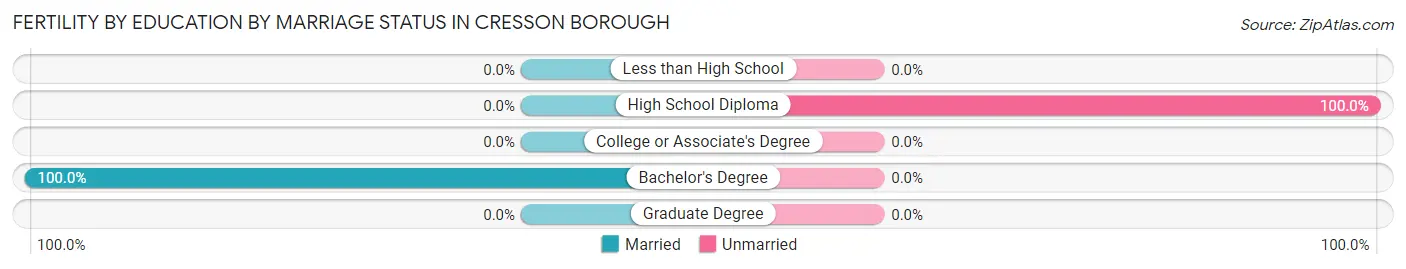
| Educational Attainment | Married | Unmarried |
| Less than High School | 0 (0.0%) | 0 (0.0%) |
| High School Diploma | 0 (0.0%) | 5 (100.0%) |
| College or Associate's Degree | 0 (0.0%) | 0 (0.0%) |
| Bachelor's Degree | 3 (100.0%) | 0 (0.0%) |
| Graduate Degree | 0 (0.0%) | 0 (0.0%) |
| Total | 3 (37.5%) | 5 (62.5%) |
Employment Characteristics in Cresson borough
Employment by Class of Employer in Cresson borough
Among the 805 employed individuals in Cresson borough, private company employees (537 | 66.7%), not-for-profit organizations (94 | 11.7%), and state government employees (65 | 8.1%) make up the most common classes of employment.
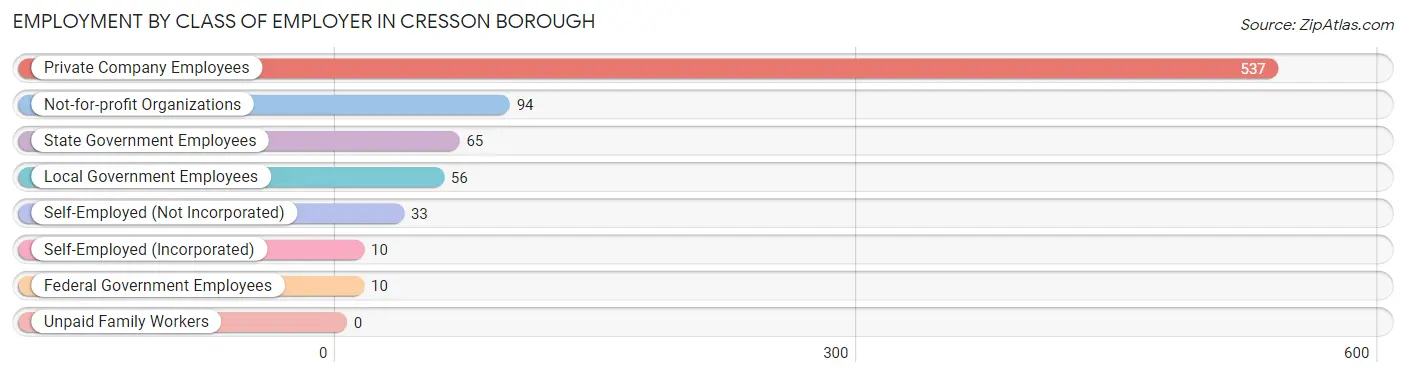
| Employer Class | # Employees | % Employees |
| Private Company Employees | 537 | 66.7% |
| Self-Employed (Incorporated) | 10 | 1.2% |
| Self-Employed (Not Incorporated) | 33 | 4.1% |
| Not-for-profit Organizations | 94 | 11.7% |
| Local Government Employees | 56 | 7.0% |
| State Government Employees | 65 | 8.1% |
| Federal Government Employees | 10 | 1.2% |
| Unpaid Family Workers | 0 | 0.0% |
| Total | 805 | 100.0% |
Employment Status by Age in Cresson borough
According to the labor force statistics for Cresson borough, out of the total population over 16 years of age (1,300), 65.8% or 855 individuals are in the labor force, with 4.4% or 38 of them unemployed. The age group with the highest labor force participation rate is 20 to 24 years, with 95.9% or 71 individuals in the labor force. Within the labor force, the 60 to 64 years age range has the highest percentage of unemployed individuals, with 12.1% or 14 of them being unemployed.
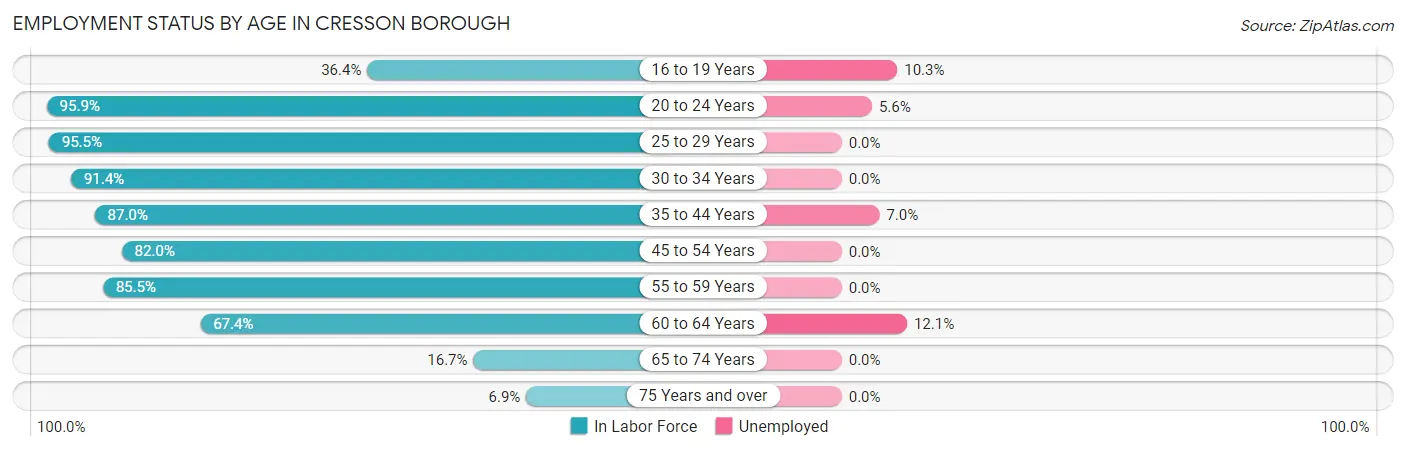
| Age Bracket | In Labor Force | Unemployed |
| 16 to 19 Years | 39 (36.4%) | 4 (10.3%) |
| 20 to 24 Years | 71 (95.9%) | 4 (5.6%) |
| 25 to 29 Years | 85 (95.5%) | 0 (0.0%) |
| 30 to 34 Years | 53 (91.4%) | 0 (0.0%) |
| 35 to 44 Years | 228 (87.0%) | 16 (7.0%) |
| 45 to 54 Years | 123 (82.0%) | 0 (0.0%) |
| 55 to 59 Years | 106 (85.5%) | 0 (0.0%) |
| 60 to 64 Years | 116 (67.4%) | 14 (12.1%) |
| 65 to 74 Years | 27 (16.7%) | 0 (0.0%) |
| 75 Years and over | 7 (6.9%) | 0 (0.0%) |
| Total | 855 (65.8%) | 38 (4.4%) |
Employment Status by Educational Attainment in Cresson borough
According to labor force statistics for Cresson borough, 83.2% of individuals (711) out of the total population between 25 and 64 years of age (855) are in the labor force, with 4.2% or 30 of them being unemployed. The group with the highest labor force participation rate are those with the educational attainment of bachelor's degree or higher, with 92.3% or 192 individuals in the labor force. Within the labor force, individuals with less than high school education have the highest percentage of unemployment, with 57.1% or 8 of them being unemployed.
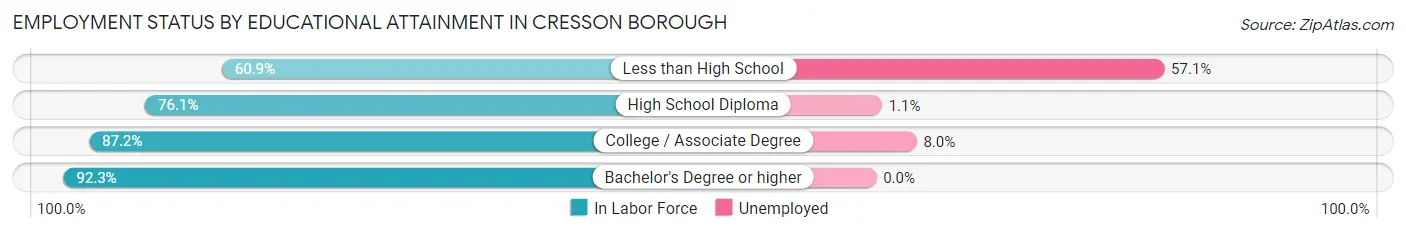
| Educational Attainment | In Labor Force | Unemployed |
| Less than High School | 14 (60.9%) | 13 (57.1%) |
| High School Diploma | 267 (76.1%) | 4 (1.1%) |
| College / Associate Degree | 238 (87.2%) | 22 (8.0%) |
| Bachelor's Degree or higher | 192 (92.3%) | 0 (0.0%) |
| Total | 711 (83.2%) | 36 (4.2%) |
Employment Occupations by Sex in Cresson borough
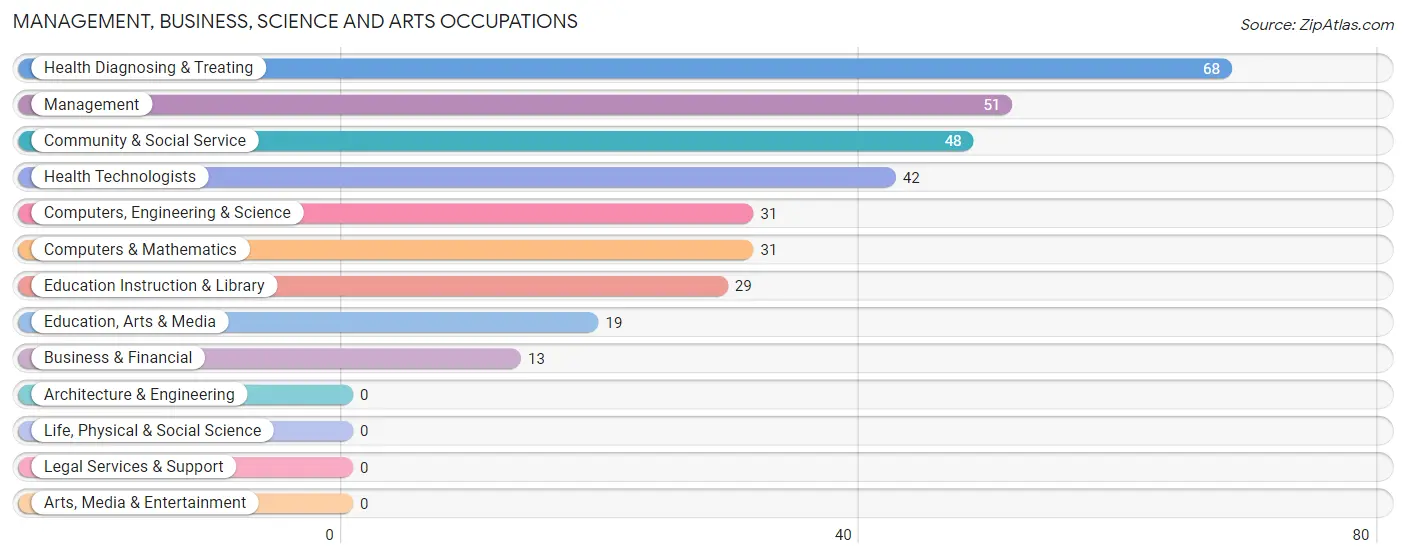
Management, Business, Science and Arts Occupations
The most common Management, Business, Science and Arts occupations in Cresson borough are Health Diagnosing & Treating (68 | 8.3%), Management (51 | 6.2%), Community & Social Service (48 | 5.9%), Health Technologists (42 | 5.1%), and Computers, Engineering & Science (31 | 3.8%).
Management, Business, Science and Arts Occupations by Sex
Within the Management, Business, Science and Arts occupations in Cresson borough, the most male-oriented occupations are Management (56.9%), Computers, Engineering & Science (51.6%), and Computers & Mathematics (51.6%), while the most female-oriented occupations are Education Instruction & Library (100.0%), Health Technologists (100.0%), and Community & Social Service (89.6%).
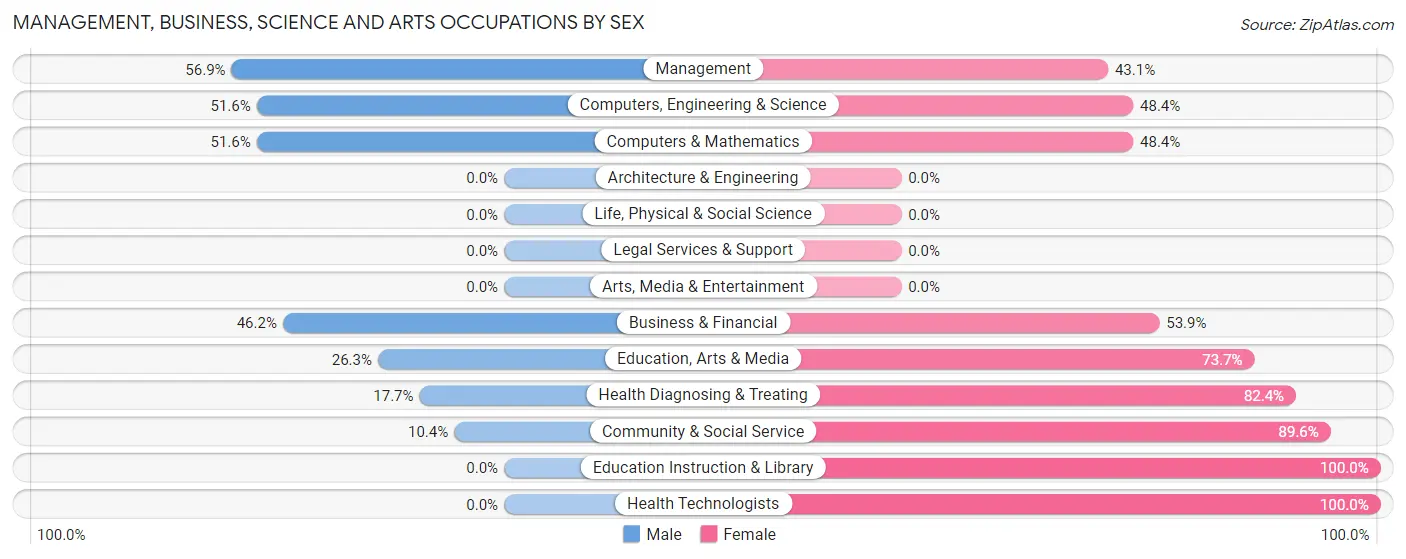
| Occupation | Male | Female |
| Management | 29 (56.9%) | 22 (43.1%) |
| Business & Financial | 6 (46.2%) | 7 (53.8%) |
| Computers, Engineering & Science | 16 (51.6%) | 15 (48.4%) |
| Computers & Mathematics | 16 (51.6%) | 15 (48.4%) |
| Architecture & Engineering | 0 (0.0%) | 0 (0.0%) |
| Life, Physical & Social Science | 0 (0.0%) | 0 (0.0%) |
| Community & Social Service | 5 (10.4%) | 43 (89.6%) |
| Education, Arts & Media | 5 (26.3%) | 14 (73.7%) |
| Legal Services & Support | 0 (0.0%) | 0 (0.0%) |
| Education Instruction & Library | 0 (0.0%) | 29 (100.0%) |
| Arts, Media & Entertainment | 0 (0.0%) | 0 (0.0%) |
| Health Diagnosing & Treating | 12 (17.6%) | 56 (82.4%) |
| Health Technologists | 0 (0.0%) | 42 (100.0%) |
| Total (Category) | 68 (32.2%) | 143 (67.8%) |
| Total (Overall) | 358 (43.8%) | 459 (56.2%) |
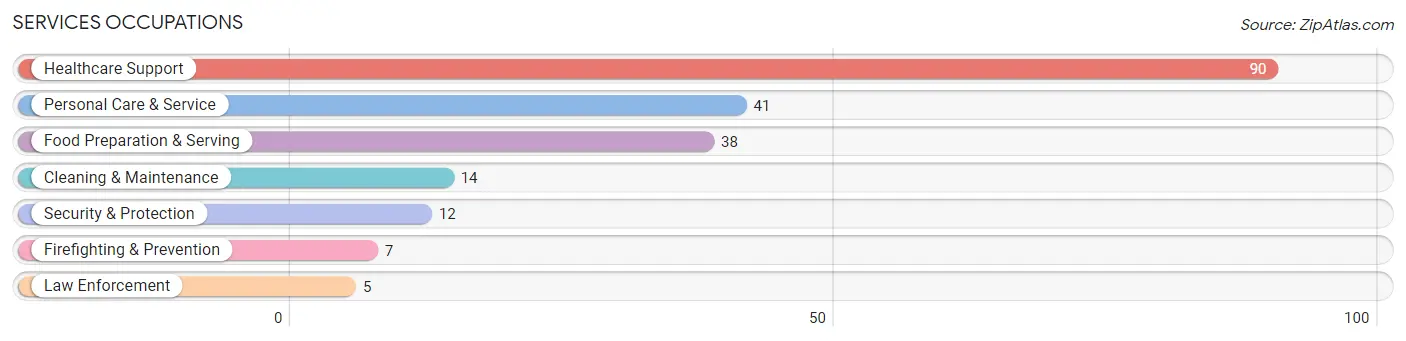
Services Occupations
The most common Services occupations in Cresson borough are Healthcare Support (90 | 11.0%), Personal Care & Service (41 | 5.0%), Food Preparation & Serving (38 | 4.6%), Cleaning & Maintenance (14 | 1.7%), and Security & Protection (12 | 1.5%).
Services Occupations by Sex
Within the Services occupations in Cresson borough, the most male-oriented occupations are Security & Protection (100.0%), Firefighting & Prevention (100.0%), and Law Enforcement (100.0%), while the most female-oriented occupations are Healthcare Support (96.7%), Personal Care & Service (80.5%), and Food Preparation & Serving (52.6%).
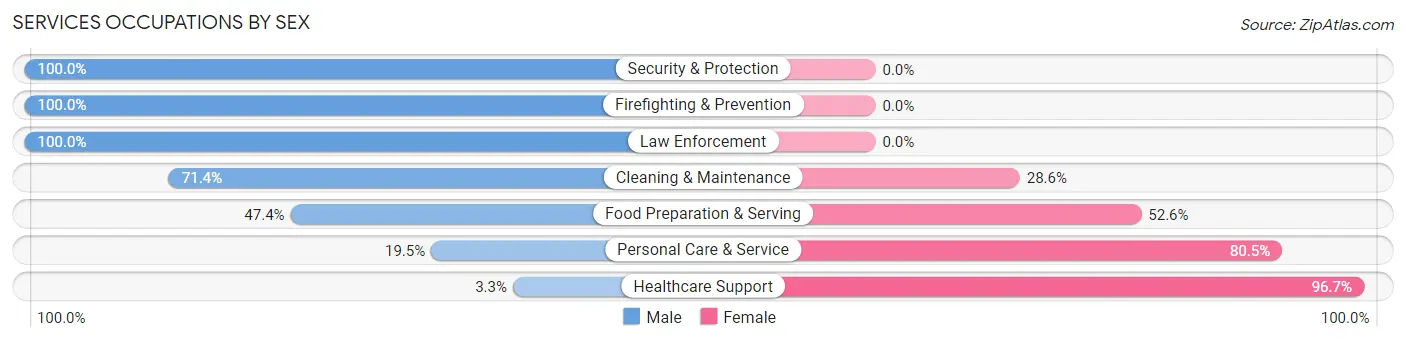
| Occupation | Male | Female |
| Healthcare Support | 3 (3.3%) | 87 (96.7%) |
| Security & Protection | 12 (100.0%) | 0 (0.0%) |
| Firefighting & Prevention | 7 (100.0%) | 0 (0.0%) |
| Law Enforcement | 5 (100.0%) | 0 (0.0%) |
| Food Preparation & Serving | 18 (47.4%) | 20 (52.6%) |
| Cleaning & Maintenance | 10 (71.4%) | 4 (28.6%) |
| Personal Care & Service | 8 (19.5%) | 33 (80.5%) |
| Total (Category) | 51 (26.2%) | 144 (73.9%) |
| Total (Overall) | 358 (43.8%) | 459 (56.2%) |
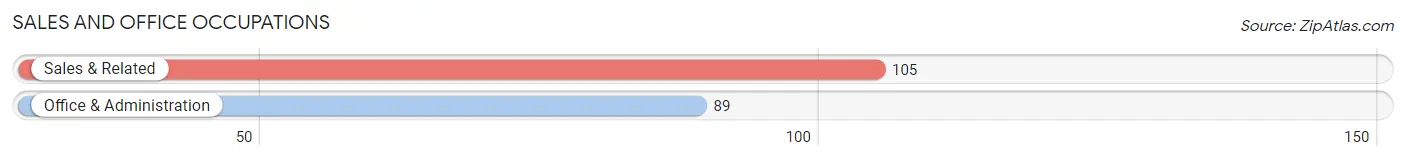
Sales and Office Occupations
The most common Sales and Office occupations in Cresson borough are Sales & Related (105 | 12.9%), and Office & Administration (89 | 10.9%).
Sales and Office Occupations by Sex
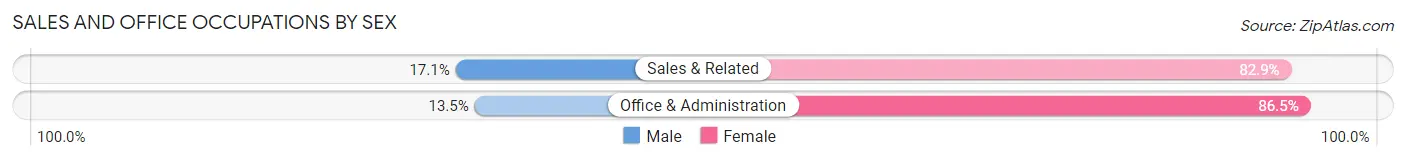
| Occupation | Male | Female |
| Sales & Related | 18 (17.1%) | 87 (82.9%) |
| Office & Administration | 12 (13.5%) | 77 (86.5%) |
| Total (Category) | 30 (15.5%) | 164 (84.5%) |
| Total (Overall) | 358 (43.8%) | 459 (56.2%) |
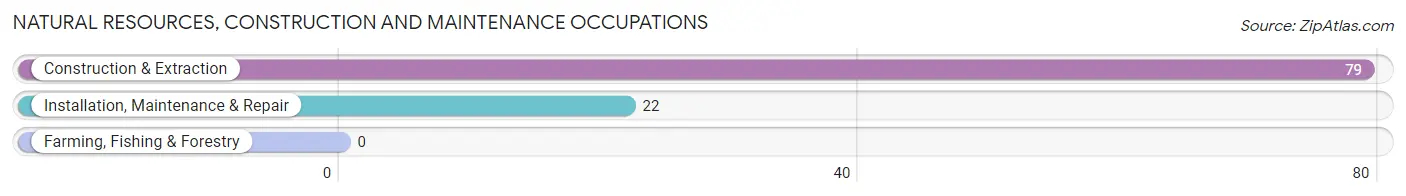
Natural Resources, Construction and Maintenance Occupations
The most common Natural Resources, Construction and Maintenance occupations in Cresson borough are Construction & Extraction (79 | 9.7%), and Installation, Maintenance & Repair (22 | 2.7%).
Natural Resources, Construction and Maintenance Occupations by Sex
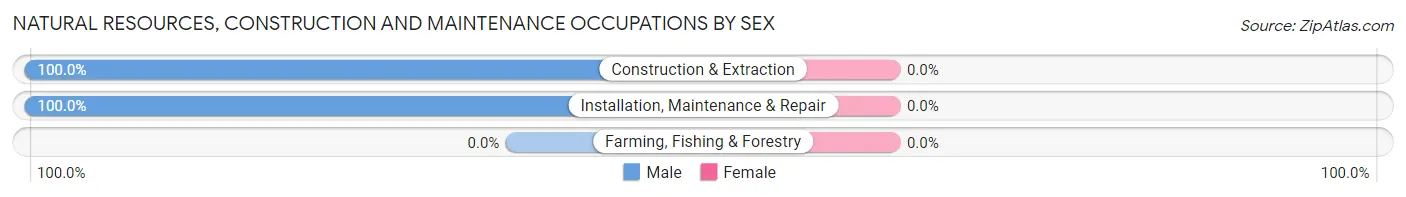
| Occupation | Male | Female |
| Farming, Fishing & Forestry | 0 (0.0%) | 0 (0.0%) |
| Construction & Extraction | 79 (100.0%) | 0 (0.0%) |
| Installation, Maintenance & Repair | 22 (100.0%) | 0 (0.0%) |
| Total (Category) | 101 (100.0%) | 0 (0.0%) |
| Total (Overall) | 358 (43.8%) | 459 (56.2%) |
Production, Transportation and Moving Occupations
The most common Production, Transportation and Moving occupations in Cresson borough are Material Moving (53 | 6.5%), Transportation (36 | 4.4%), and Production (27 | 3.3%).
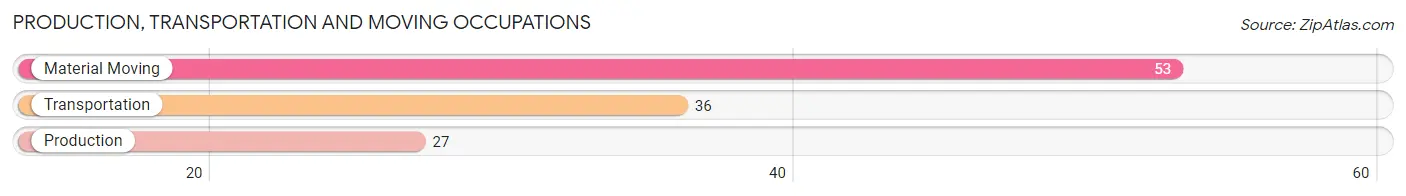
Production, Transportation and Moving Occupations by Sex
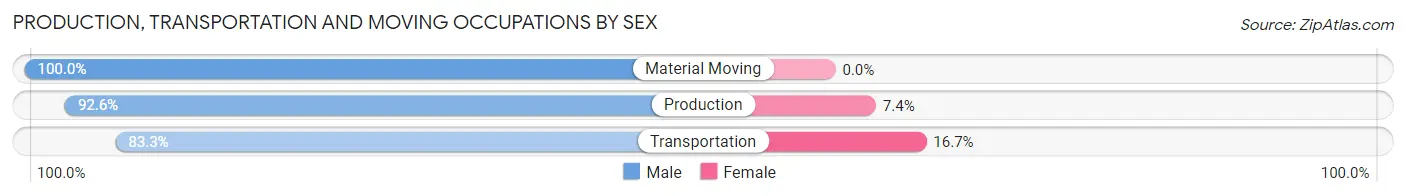
| Occupation | Male | Female |
| Production | 25 (92.6%) | 2 (7.4%) |
| Transportation | 30 (83.3%) | 6 (16.7%) |
| Material Moving | 53 (100.0%) | 0 (0.0%) |
| Total (Category) | 108 (93.1%) | 8 (6.9%) |
| Total (Overall) | 358 (43.8%) | 459 (56.2%) |
Employment Industries by Sex in Cresson borough
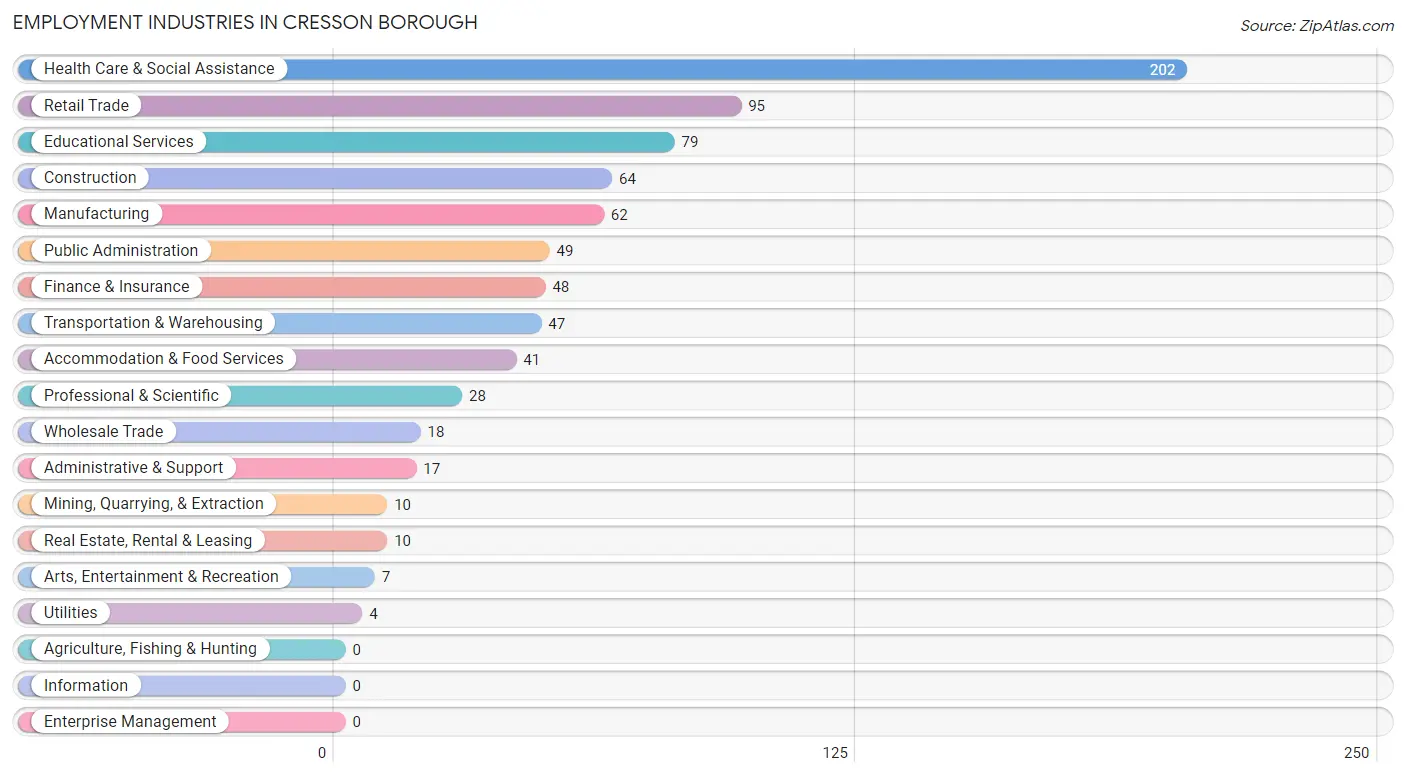
Employment Industries in Cresson borough
The major employment industries in Cresson borough include Health Care & Social Assistance (202 | 24.7%), Retail Trade (95 | 11.6%), Educational Services (79 | 9.7%), Construction (64 | 7.8%), and Manufacturing (62 | 7.6%).
Employment Industries by Sex in Cresson borough
The Cresson borough industries that see more men than women are Mining, Quarrying, & Extraction (100.0%), Manufacturing (95.2%), and Construction (90.6%), whereas the industries that tend to have a higher number of women are Utilities (100.0%), Arts, Entertainment & Recreation (100.0%), and Health Care & Social Assistance (84.7%).
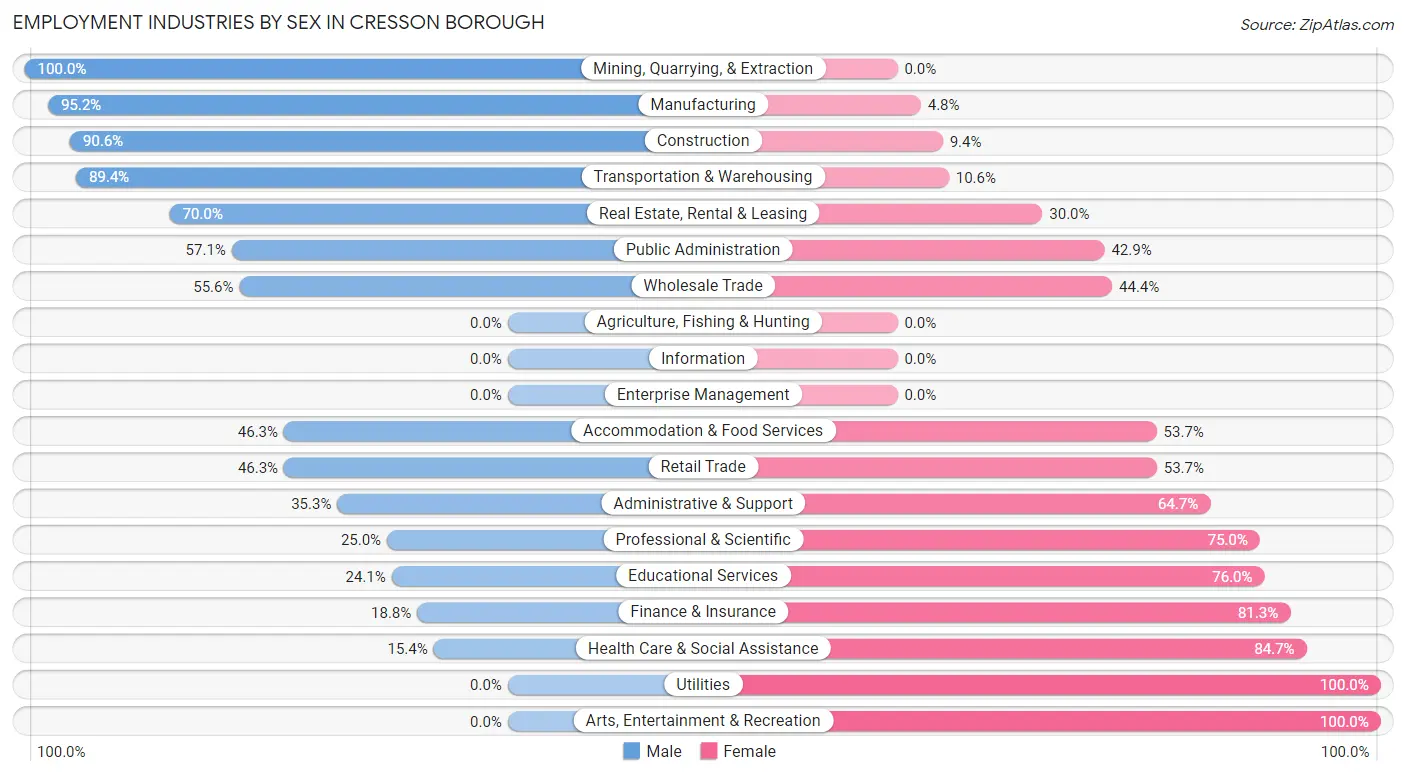
| Industry | Male | Female |
| Agriculture, Fishing & Hunting | 0 (0.0%) | 0 (0.0%) |
| Mining, Quarrying, & Extraction | 10 (100.0%) | 0 (0.0%) |
| Construction | 58 (90.6%) | 6 (9.4%) |
| Manufacturing | 59 (95.2%) | 3 (4.8%) |
| Wholesale Trade | 10 (55.6%) | 8 (44.4%) |
| Retail Trade | 44 (46.3%) | 51 (53.7%) |
| Transportation & Warehousing | 42 (89.4%) | 5 (10.6%) |
| Utilities | 0 (0.0%) | 4 (100.0%) |
| Information | 0 (0.0%) | 0 (0.0%) |
| Finance & Insurance | 9 (18.8%) | 39 (81.2%) |
| Real Estate, Rental & Leasing | 7 (70.0%) | 3 (30.0%) |
| Professional & Scientific | 7 (25.0%) | 21 (75.0%) |
| Enterprise Management | 0 (0.0%) | 0 (0.0%) |
| Administrative & Support | 6 (35.3%) | 11 (64.7%) |
| Educational Services | 19 (24.0%) | 60 (75.9%) |
| Health Care & Social Assistance | 31 (15.3%) | 171 (84.7%) |
| Arts, Entertainment & Recreation | 0 (0.0%) | 7 (100.0%) |
| Accommodation & Food Services | 19 (46.3%) | 22 (53.7%) |
| Public Administration | 28 (57.1%) | 21 (42.9%) |
| Total | 358 (43.8%) | 459 (56.2%) |
Education in Cresson borough
School Enrollment in Cresson borough
The most common levels of schooling among the 307 students in Cresson borough are high school (90 | 29.3%), elementary school (73 | 23.8%), and middle school (55 | 17.9%).
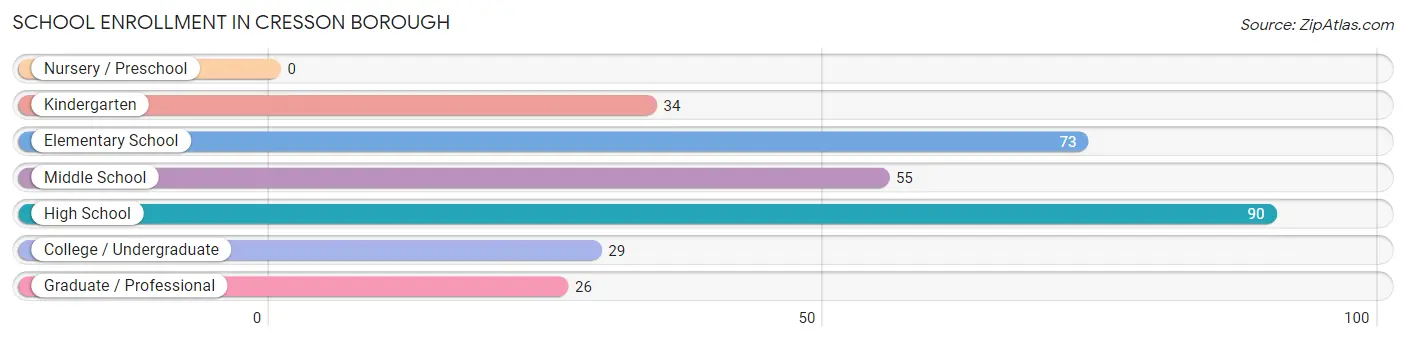
| School Level | # Students | % Students |
| Nursery / Preschool | 0 | 0.0% |
| Kindergarten | 34 | 11.1% |
| Elementary School | 73 | 23.8% |
| Middle School | 55 | 17.9% |
| High School | 90 | 29.3% |
| College / Undergraduate | 29 | 9.5% |
| Graduate / Professional | 26 | 8.5% |
| Total | 307 | 100.0% |
School Enrollment by Age by Funding Source in Cresson borough
Out of a total of 307 students who are enrolled in schools in Cresson borough, 61 (19.9%) attend a private institution, while the remaining 246 (80.1%) are enrolled in public schools. The age group of 20 to 24 year olds has the highest likelihood of being enrolled in private schools, with 18 (100.0% in the age bracket) enrolled. Conversely, the age group of 15 to 17 year olds has the lowest likelihood of being enrolled in a private school, with 69 (100.0% in the age bracket) attending a public institution.
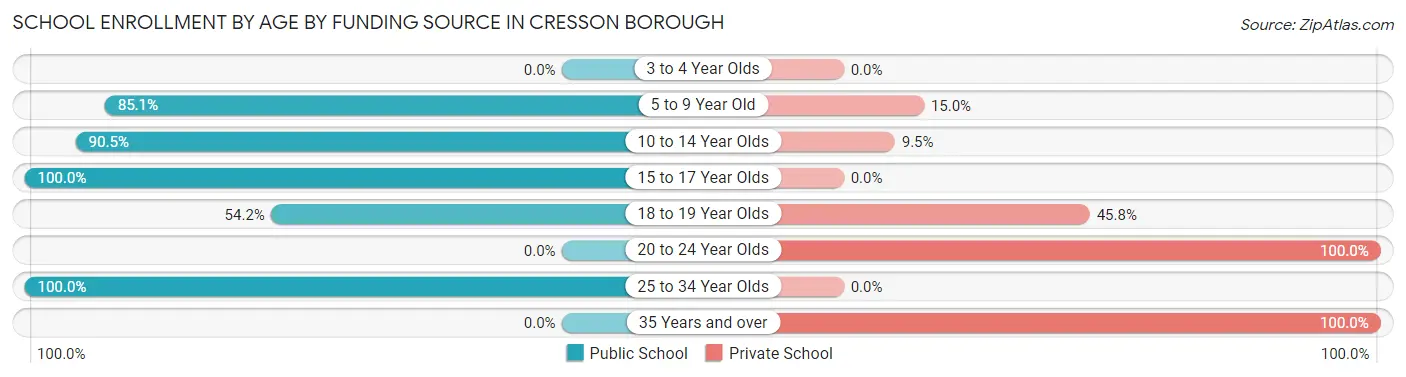
| Age Bracket | Public School | Private School |
| 3 to 4 Year Olds | 0 (0.0%) | 0 (0.0%) |
| 5 to 9 Year Old | 91 (85.1%) | 16 (14.9%) |
| 10 to 14 Year Olds | 57 (90.5%) | 6 (9.5%) |
| 15 to 17 Year Olds | 69 (100.0%) | 0 (0.0%) |
| 18 to 19 Year Olds | 13 (54.2%) | 11 (45.8%) |
| 20 to 24 Year Olds | 0 (0.0%) | 18 (100.0%) |
| 25 to 34 Year Olds | 16 (100.0%) | 0 (0.0%) |
| 35 Years and over | 0 (0.0%) | 10 (100.0%) |
| Total | 246 (80.1%) | 61 (19.9%) |
Educational Attainment by Field of Study in Cresson borough
Education (55 | 22.2%), science & technology (46 | 18.5%), computers & mathematics (33 | 13.3%), business (26 | 10.5%), and literature & languages (19 | 7.7%) are the most common fields of study among 248 individuals in Cresson borough who have obtained a bachelor's degree or higher.
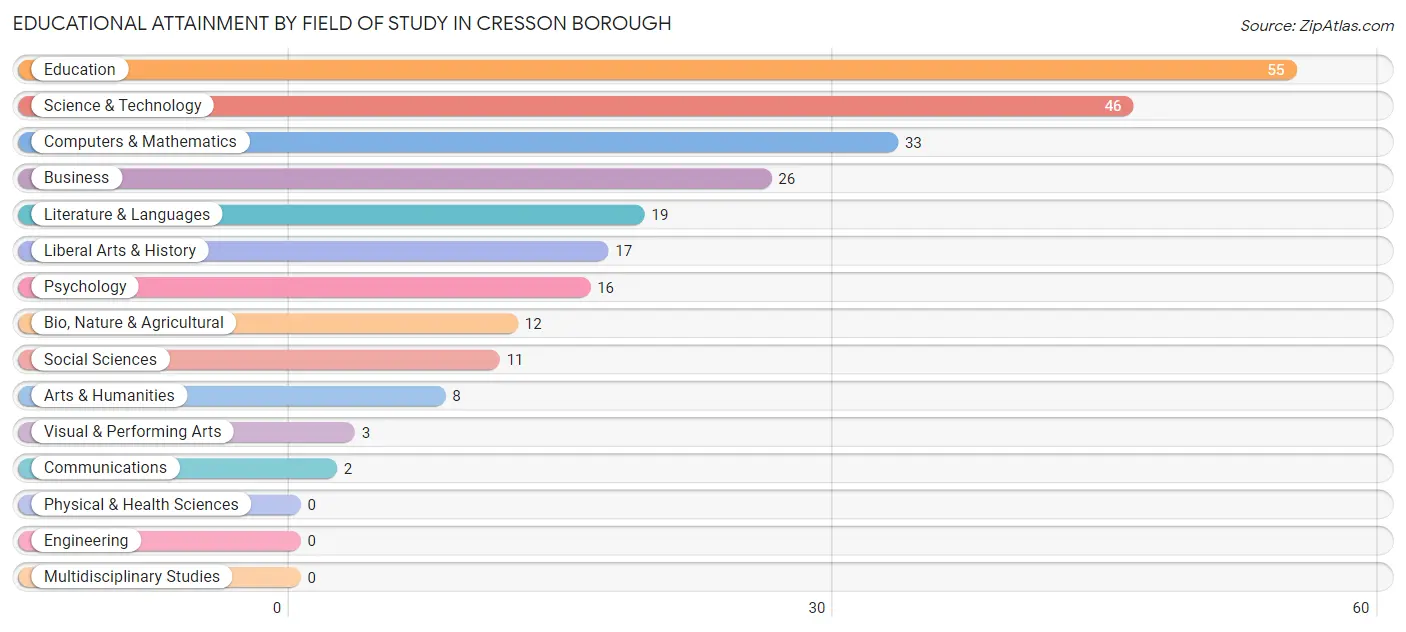
| Field of Study | # Graduates | % Graduates |
| Computers & Mathematics | 33 | 13.3% |
| Bio, Nature & Agricultural | 12 | 4.8% |
| Physical & Health Sciences | 0 | 0.0% |
| Psychology | 16 | 6.5% |
| Social Sciences | 11 | 4.4% |
| Engineering | 0 | 0.0% |
| Multidisciplinary Studies | 0 | 0.0% |
| Science & Technology | 46 | 18.5% |
| Business | 26 | 10.5% |
| Education | 55 | 22.2% |
| Literature & Languages | 19 | 7.7% |
| Liberal Arts & History | 17 | 6.9% |
| Visual & Performing Arts | 3 | 1.2% |
| Communications | 2 | 0.8% |
| Arts & Humanities | 8 | 3.2% |
| Total | 248 | 100.0% |
Transportation & Commute in Cresson borough
Vehicle Availability by Sex in Cresson borough
The most prevalent vehicle ownership categories in Cresson borough are males with 2 vehicles (140, accounting for 40.1%) and females with 2 vehicles (146, making up 30.7%).
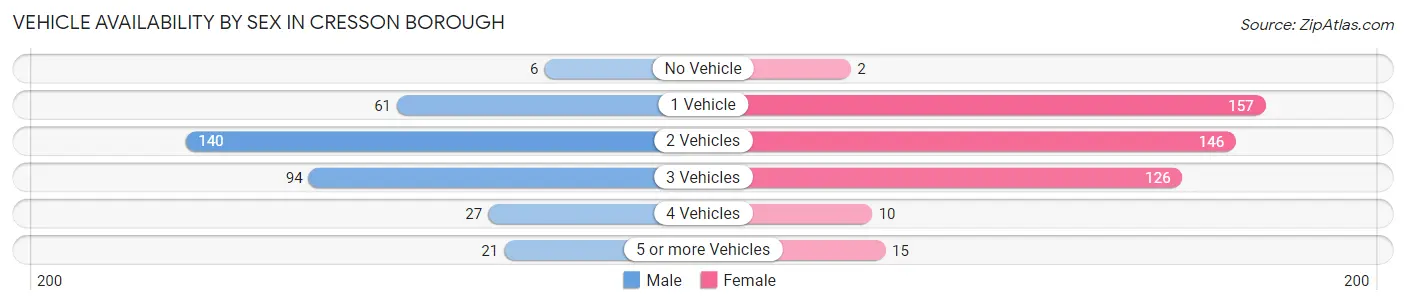
| Vehicles Available | Male | Female |
| No Vehicle | 6 (1.7%) | 2 (0.4%) |
| 1 Vehicle | 61 (17.5%) | 157 (34.4%) |
| 2 Vehicles | 140 (40.1%) | 146 (32.0%) |
| 3 Vehicles | 94 (26.9%) | 126 (27.6%) |
| 4 Vehicles | 27 (7.7%) | 10 (2.2%) |
| 5 or more Vehicles | 21 (6.0%) | 15 (3.3%) |
| Total | 349 (100.0%) | 456 (100.0%) |
Commute Time in Cresson borough
The most frequently occuring commute durations in Cresson borough are 5 to 9 minutes (159 commuters, 20.7%), 10 to 14 minutes (128 commuters, 16.7%), and 15 to 19 minutes (114 commuters, 14.8%).
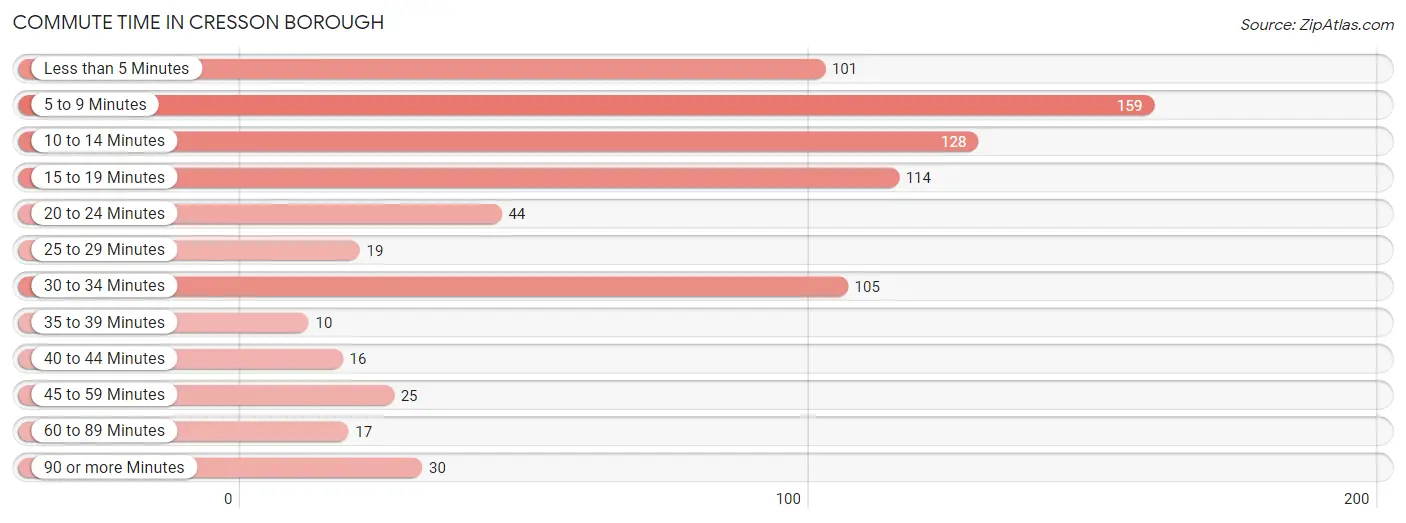
| Commute Time | # Commuters | % Commuters |
| Less than 5 Minutes | 101 | 13.2% |
| 5 to 9 Minutes | 159 | 20.7% |
| 10 to 14 Minutes | 128 | 16.7% |
| 15 to 19 Minutes | 114 | 14.8% |
| 20 to 24 Minutes | 44 | 5.7% |
| 25 to 29 Minutes | 19 | 2.5% |
| 30 to 34 Minutes | 105 | 13.7% |
| 35 to 39 Minutes | 10 | 1.3% |
| 40 to 44 Minutes | 16 | 2.1% |
| 45 to 59 Minutes | 25 | 3.3% |
| 60 to 89 Minutes | 17 | 2.2% |
| 90 or more Minutes | 30 | 3.9% |
Commute Time by Sex in Cresson borough
The most common commute times in Cresson borough are 30 to 34 minutes (78 commuters, 22.8%) for males and 5 to 9 minutes (128 commuters, 30.0%) for females.
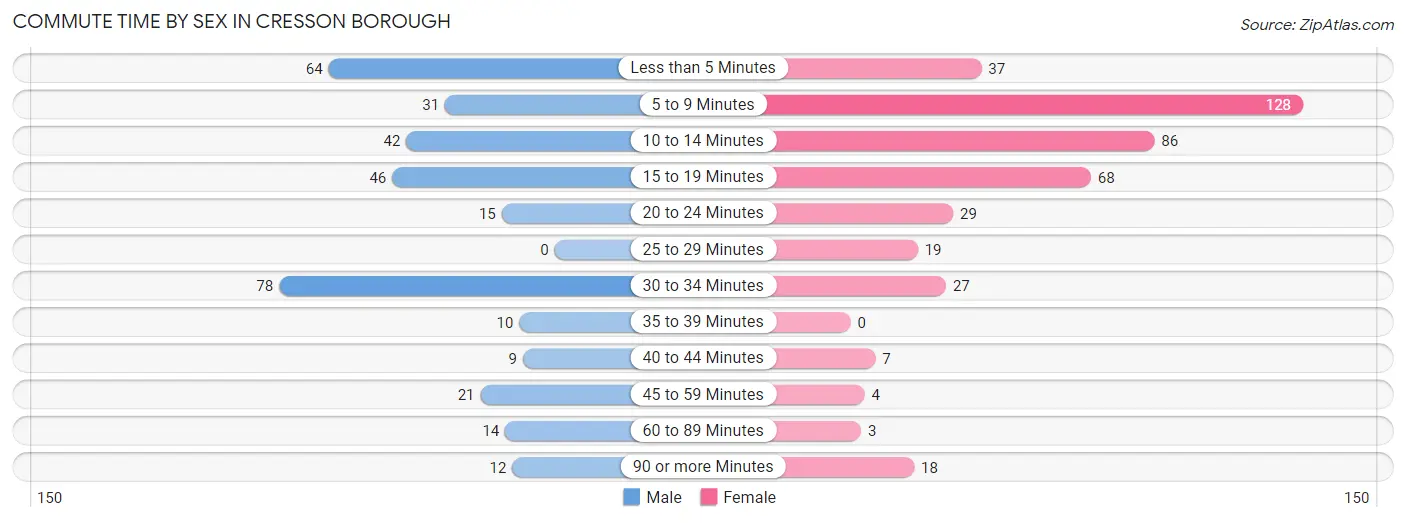
| Commute Time | Male | Female |
| Less than 5 Minutes | 64 (18.7%) | 37 (8.7%) |
| 5 to 9 Minutes | 31 (9.1%) | 128 (30.0%) |
| 10 to 14 Minutes | 42 (12.3%) | 86 (20.2%) |
| 15 to 19 Minutes | 46 (13.5%) | 68 (16.0%) |
| 20 to 24 Minutes | 15 (4.4%) | 29 (6.8%) |
| 25 to 29 Minutes | 0 (0.0%) | 19 (4.5%) |
| 30 to 34 Minutes | 78 (22.8%) | 27 (6.3%) |
| 35 to 39 Minutes | 10 (2.9%) | 0 (0.0%) |
| 40 to 44 Minutes | 9 (2.6%) | 7 (1.6%) |
| 45 to 59 Minutes | 21 (6.1%) | 4 (0.9%) |
| 60 to 89 Minutes | 14 (4.1%) | 3 (0.7%) |
| 90 or more Minutes | 12 (3.5%) | 18 (4.2%) |
Time of Departure to Work by Sex in Cresson borough
The most frequent times of departure to work in Cresson borough are 7:00 AM to 7:29 AM (45, 13.2%) for males and 7:30 AM to 7:59 AM (85, 20.0%) for females.
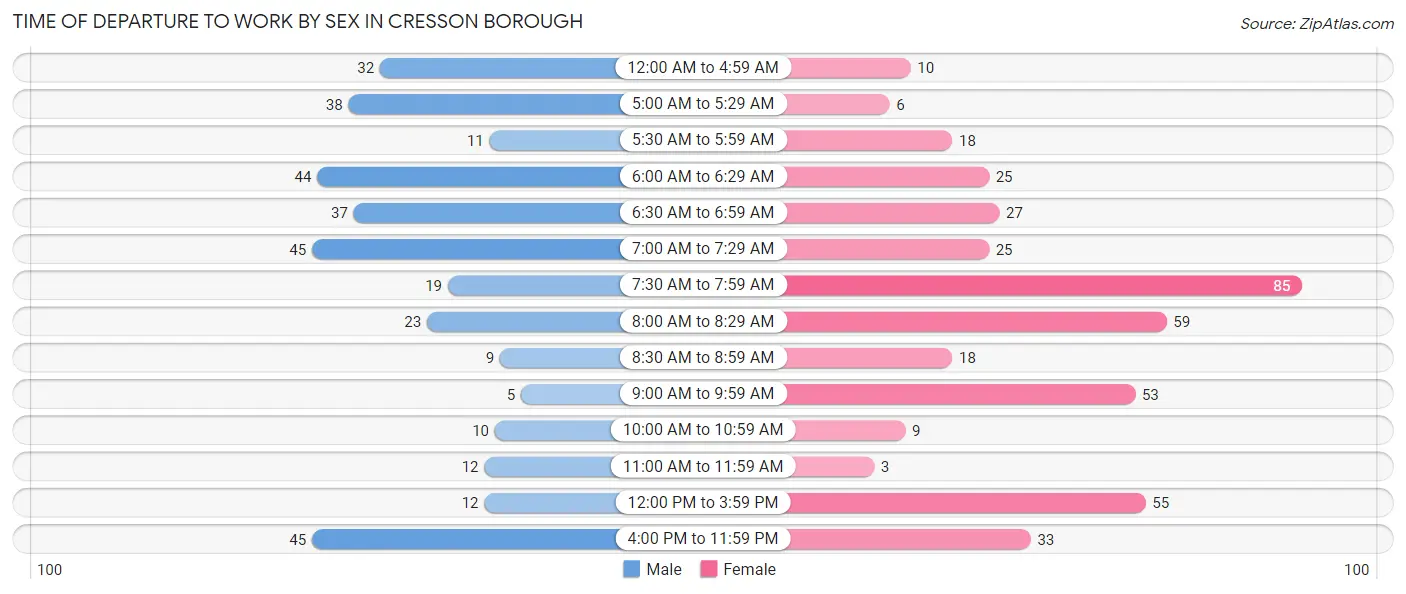
| Time of Departure | Male | Female |
| 12:00 AM to 4:59 AM | 32 (9.4%) | 10 (2.4%) |
| 5:00 AM to 5:29 AM | 38 (11.1%) | 6 (1.4%) |
| 5:30 AM to 5:59 AM | 11 (3.2%) | 18 (4.2%) |
| 6:00 AM to 6:29 AM | 44 (12.9%) | 25 (5.9%) |
| 6:30 AM to 6:59 AM | 37 (10.8%) | 27 (6.3%) |
| 7:00 AM to 7:29 AM | 45 (13.2%) | 25 (5.9%) |
| 7:30 AM to 7:59 AM | 19 (5.6%) | 85 (20.0%) |
| 8:00 AM to 8:29 AM | 23 (6.7%) | 59 (13.9%) |
| 8:30 AM to 8:59 AM | 9 (2.6%) | 18 (4.2%) |
| 9:00 AM to 9:59 AM | 5 (1.5%) | 53 (12.4%) |
| 10:00 AM to 10:59 AM | 10 (2.9%) | 9 (2.1%) |
| 11:00 AM to 11:59 AM | 12 (3.5%) | 3 (0.7%) |
| 12:00 PM to 3:59 PM | 12 (3.5%) | 55 (12.9%) |
| 4:00 PM to 11:59 PM | 45 (13.2%) | 33 (7.7%) |
| Total | 342 (100.0%) | 426 (100.0%) |
Housing Occupancy in Cresson borough
Occupancy by Ownership in Cresson borough
Of the total 656 dwellings in Cresson borough, owner-occupied units account for 462 (70.4%), while renter-occupied units make up 194 (29.6%).
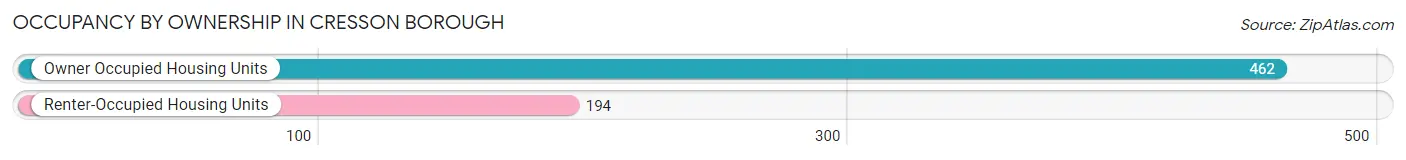
| Occupancy | # Housing Units | % Housing Units |
| Owner Occupied Housing Units | 462 | 70.4% |
| Renter-Occupied Housing Units | 194 | 29.6% |
| Total Occupied Housing Units | 656 | 100.0% |
Occupancy by Household Size in Cresson borough
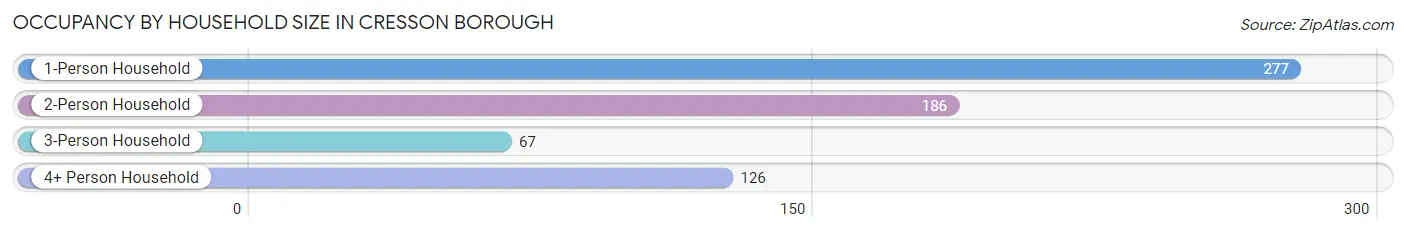
| Household Size | # Housing Units | % Housing Units |
| 1-Person Household | 277 | 42.2% |
| 2-Person Household | 186 | 28.3% |
| 3-Person Household | 67 | 10.2% |
| 4+ Person Household | 126 | 19.2% |
| Total Housing Units | 656 | 100.0% |
Occupancy by Ownership by Household Size in Cresson borough
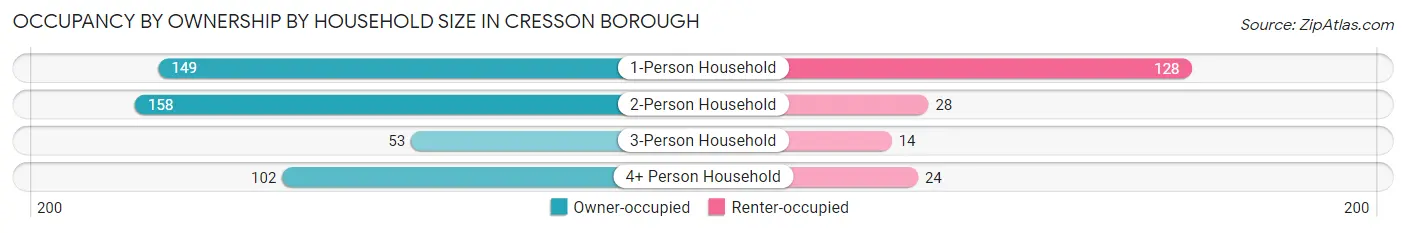
| Household Size | Owner-occupied | Renter-occupied |
| 1-Person Household | 149 (53.8%) | 128 (46.2%) |
| 2-Person Household | 158 (85.0%) | 28 (15.0%) |
| 3-Person Household | 53 (79.1%) | 14 (20.9%) |
| 4+ Person Household | 102 (80.9%) | 24 (19.1%) |
| Total Housing Units | 462 (70.4%) | 194 (29.6%) |
Occupancy by Educational Attainment in Cresson borough
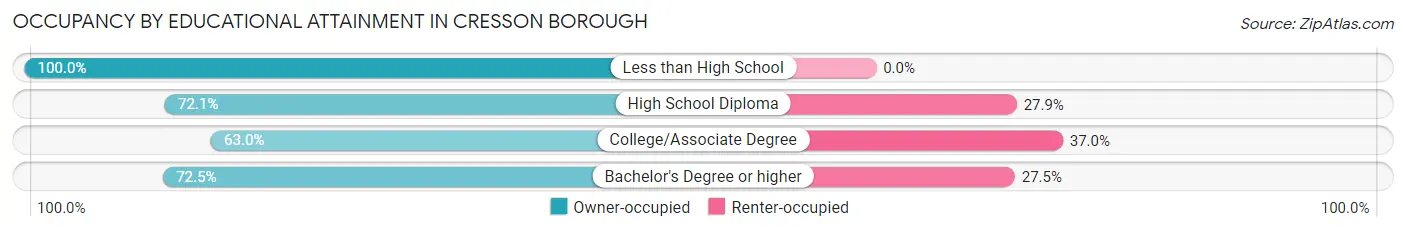
| Household Size | Owner-occupied | Renter-occupied |
| Less than High School | 23 (100.0%) | 0 (0.0%) |
| High School Diploma | 189 (72.1%) | 73 (27.9%) |
| College/Associate Degree | 126 (63.0%) | 74 (37.0%) |
| Bachelor's Degree or higher | 124 (72.5%) | 47 (27.5%) |
Occupancy by Age of Householder in Cresson borough
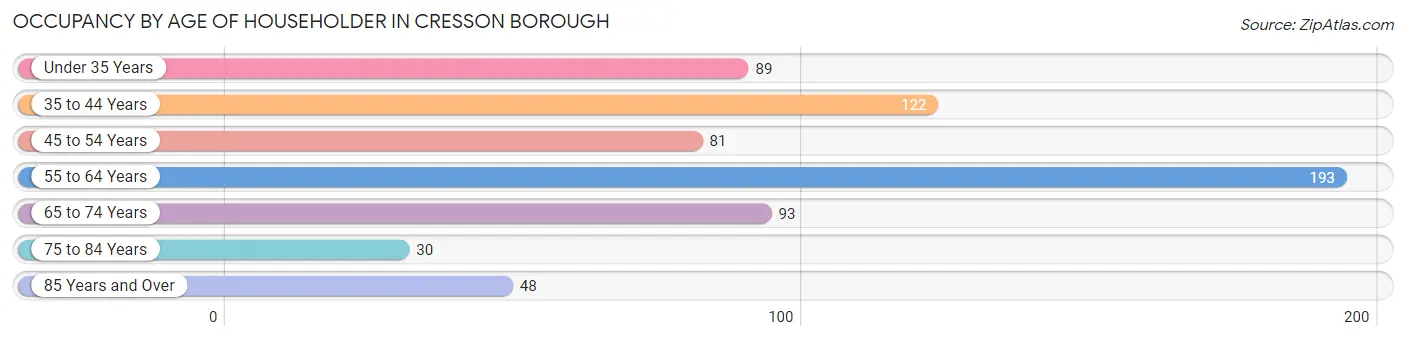
| Age Bracket | # Households | % Households |
| Under 35 Years | 89 | 13.6% |
| 35 to 44 Years | 122 | 18.6% |
| 45 to 54 Years | 81 | 12.3% |
| 55 to 64 Years | 193 | 29.4% |
| 65 to 74 Years | 93 | 14.2% |
| 75 to 84 Years | 30 | 4.6% |
| 85 Years and Over | 48 | 7.3% |
| Total | 656 | 100.0% |
Housing Finances in Cresson borough
Median Income by Occupancy in Cresson borough
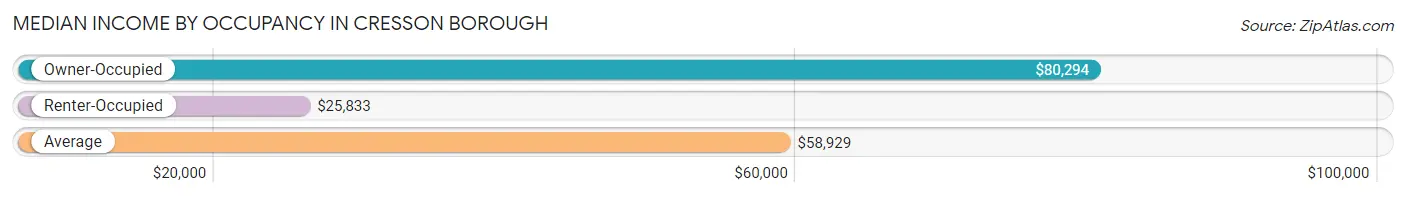
| Occupancy Type | # Households | Median Income |
| Owner-Occupied | 462 (70.4%) | $80,294 |
| Renter-Occupied | 194 (29.6%) | $25,833 |
| Average | 656 (100.0%) | $58,929 |
Occupancy by Householder Income Bracket in Cresson borough
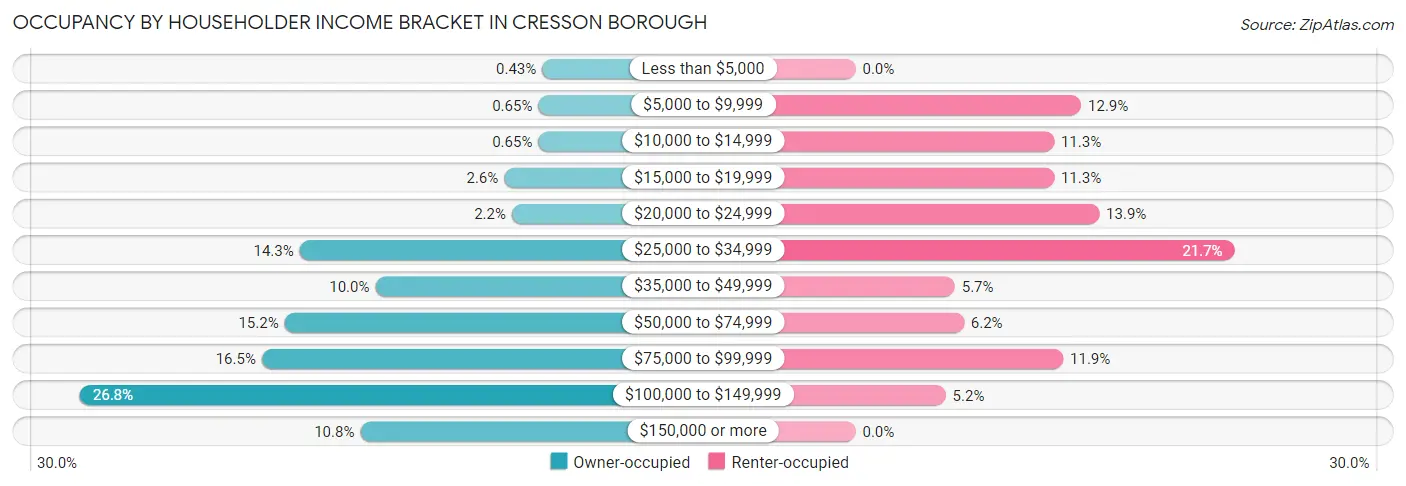
| Income Bracket | Owner-occupied | Renter-occupied |
| Less than $5,000 | 2 (0.4%) | 0 (0.0%) |
| $5,000 to $9,999 | 3 (0.6%) | 25 (12.9%) |
| $10,000 to $14,999 | 3 (0.6%) | 22 (11.3%) |
| $15,000 to $19,999 | 12 (2.6%) | 22 (11.3%) |
| $20,000 to $24,999 | 10 (2.2%) | 27 (13.9%) |
| $25,000 to $34,999 | 66 (14.3%) | 42 (21.6%) |
| $35,000 to $49,999 | 46 (10.0%) | 11 (5.7%) |
| $50,000 to $74,999 | 70 (15.1%) | 12 (6.2%) |
| $75,000 to $99,999 | 76 (16.5%) | 23 (11.9%) |
| $100,000 to $149,999 | 124 (26.8%) | 10 (5.1%) |
| $150,000 or more | 50 (10.8%) | 0 (0.0%) |
| Total | 462 (100.0%) | 194 (100.0%) |
Monthly Housing Cost Tiers in Cresson borough
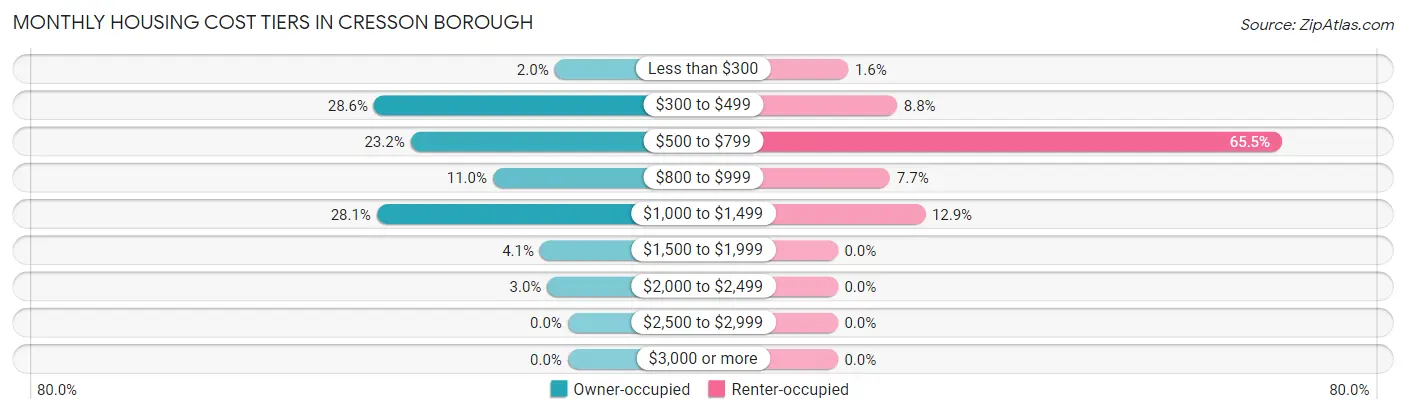
| Monthly Cost | Owner-occupied | Renter-occupied |
| Less than $300 | 9 (1.9%) | 3 (1.5%) |
| $300 to $499 | 132 (28.6%) | 17 (8.8%) |
| $500 to $799 | 107 (23.2%) | 127 (65.5%) |
| $800 to $999 | 51 (11.0%) | 15 (7.7%) |
| $1,000 to $1,499 | 130 (28.1%) | 25 (12.9%) |
| $1,500 to $1,999 | 19 (4.1%) | 0 (0.0%) |
| $2,000 to $2,499 | 14 (3.0%) | 0 (0.0%) |
| $2,500 to $2,999 | 0 (0.0%) | 0 (0.0%) |
| $3,000 or more | 0 (0.0%) | 0 (0.0%) |
| Total | 462 (100.0%) | 194 (100.0%) |
Physical Housing Characteristics in Cresson borough
Housing Structures in Cresson borough
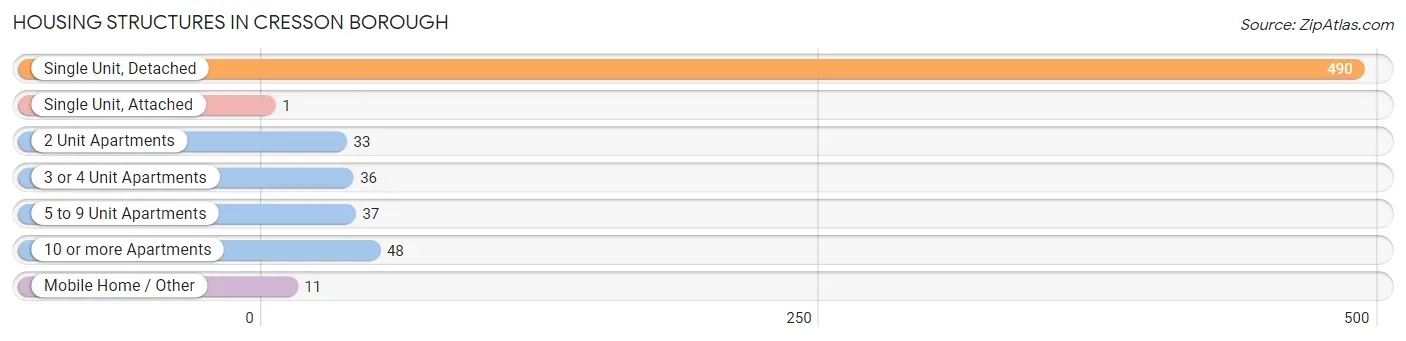
| Structure Type | # Housing Units | % Housing Units |
| Single Unit, Detached | 490 | 74.7% |
| Single Unit, Attached | 1 | 0.2% |
| 2 Unit Apartments | 33 | 5.0% |
| 3 or 4 Unit Apartments | 36 | 5.5% |
| 5 to 9 Unit Apartments | 37 | 5.6% |
| 10 or more Apartments | 48 | 7.3% |
| Mobile Home / Other | 11 | 1.7% |
| Total | 656 | 100.0% |
Housing Structures by Occupancy in Cresson borough
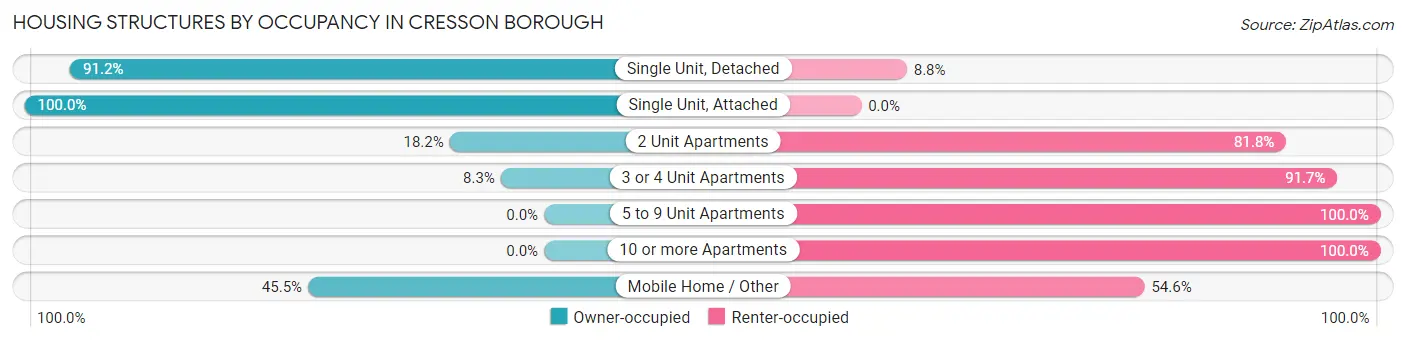
| Structure Type | Owner-occupied | Renter-occupied |
| Single Unit, Detached | 447 (91.2%) | 43 (8.8%) |
| Single Unit, Attached | 1 (100.0%) | 0 (0.0%) |
| 2 Unit Apartments | 6 (18.2%) | 27 (81.8%) |
| 3 or 4 Unit Apartments | 3 (8.3%) | 33 (91.7%) |
| 5 to 9 Unit Apartments | 0 (0.0%) | 37 (100.0%) |
| 10 or more Apartments | 0 (0.0%) | 48 (100.0%) |
| Mobile Home / Other | 5 (45.5%) | 6 (54.5%) |
| Total | 462 (70.4%) | 194 (29.6%) |
Housing Structures by Number of Rooms in Cresson borough
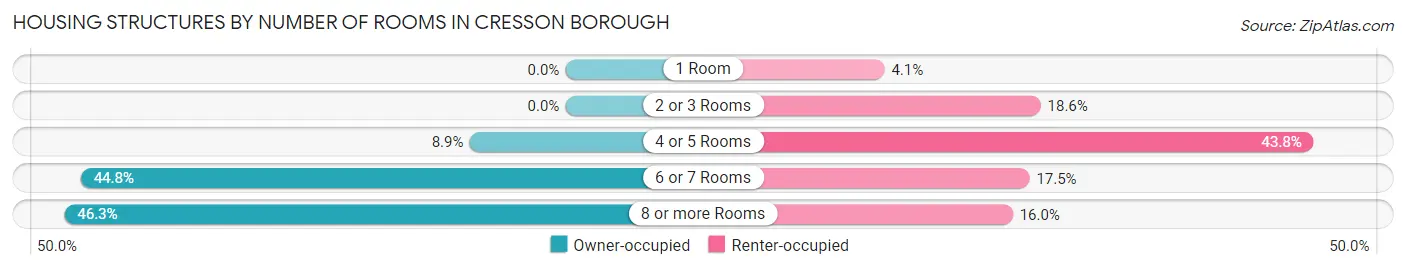
| Number of Rooms | Owner-occupied | Renter-occupied |
| 1 Room | 0 (0.0%) | 8 (4.1%) |
| 2 or 3 Rooms | 0 (0.0%) | 36 (18.6%) |
| 4 or 5 Rooms | 41 (8.9%) | 85 (43.8%) |
| 6 or 7 Rooms | 207 (44.8%) | 34 (17.5%) |
| 8 or more Rooms | 214 (46.3%) | 31 (16.0%) |
| Total | 462 (100.0%) | 194 (100.0%) |
Housing Structure by Heating Type in Cresson borough
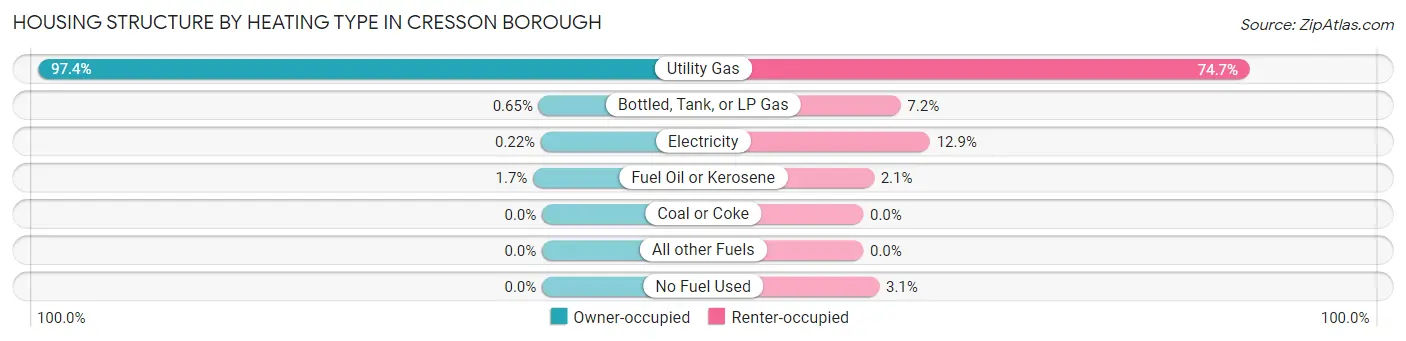
| Heating Type | Owner-occupied | Renter-occupied |
| Utility Gas | 450 (97.4%) | 145 (74.7%) |
| Bottled, Tank, or LP Gas | 3 (0.6%) | 14 (7.2%) |
| Electricity | 1 (0.2%) | 25 (12.9%) |
| Fuel Oil or Kerosene | 8 (1.7%) | 4 (2.1%) |
| Coal or Coke | 0 (0.0%) | 0 (0.0%) |
| All other Fuels | 0 (0.0%) | 0 (0.0%) |
| No Fuel Used | 0 (0.0%) | 6 (3.1%) |
| Total | 462 (100.0%) | 194 (100.0%) |
Household Vehicle Usage in Cresson borough
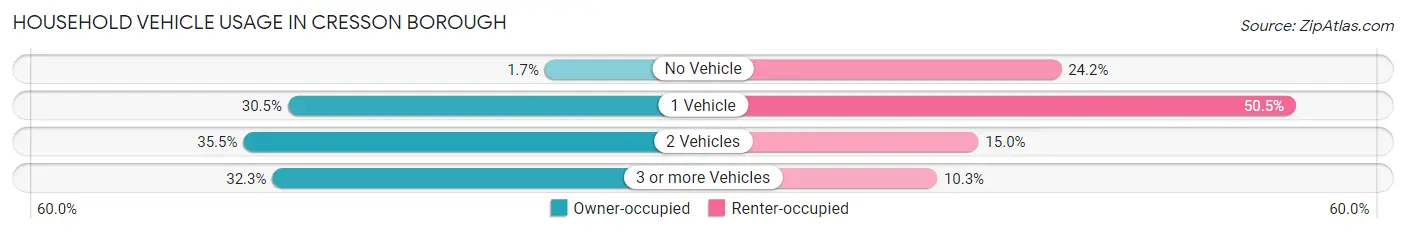
| Vehicles per Household | Owner-occupied | Renter-occupied |
| No Vehicle | 8 (1.7%) | 47 (24.2%) |
| 1 Vehicle | 141 (30.5%) | 98 (50.5%) |
| 2 Vehicles | 164 (35.5%) | 29 (14.9%) |
| 3 or more Vehicles | 149 (32.3%) | 20 (10.3%) |
| Total | 462 (100.0%) | 194 (100.0%) |
Real Estate & Mortgages in Cresson borough
Real Estate and Mortgage Overview in Cresson borough
| Characteristic | Without Mortgage | With Mortgage |
| Housing Units | 217 | 245 |
| Median Property Value | $98,200 | $128,400 |
| Median Household Income | $65,536 | $41 |
| Monthly Housing Costs | $461 | $0 |
| Real Estate Taxes | $1,245 | $3 |
Property Value by Mortgage Status in Cresson borough
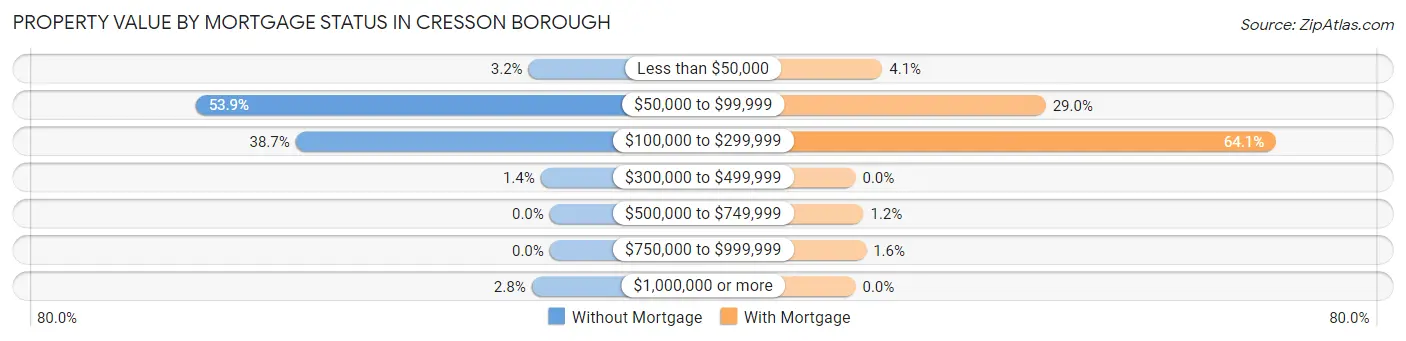
| Property Value | Without Mortgage | With Mortgage |
| Less than $50,000 | 7 (3.2%) | 10 (4.1%) |
| $50,000 to $99,999 | 117 (53.9%) | 71 (29.0%) |
| $100,000 to $299,999 | 84 (38.7%) | 157 (64.1%) |
| $300,000 to $499,999 | 3 (1.4%) | 0 (0.0%) |
| $500,000 to $749,999 | 0 (0.0%) | 3 (1.2%) |
| $750,000 to $999,999 | 0 (0.0%) | 4 (1.6%) |
| $1,000,000 or more | 6 (2.8%) | 0 (0.0%) |
| Total | 217 (100.0%) | 245 (100.0%) |
Household Income by Mortgage Status in Cresson borough
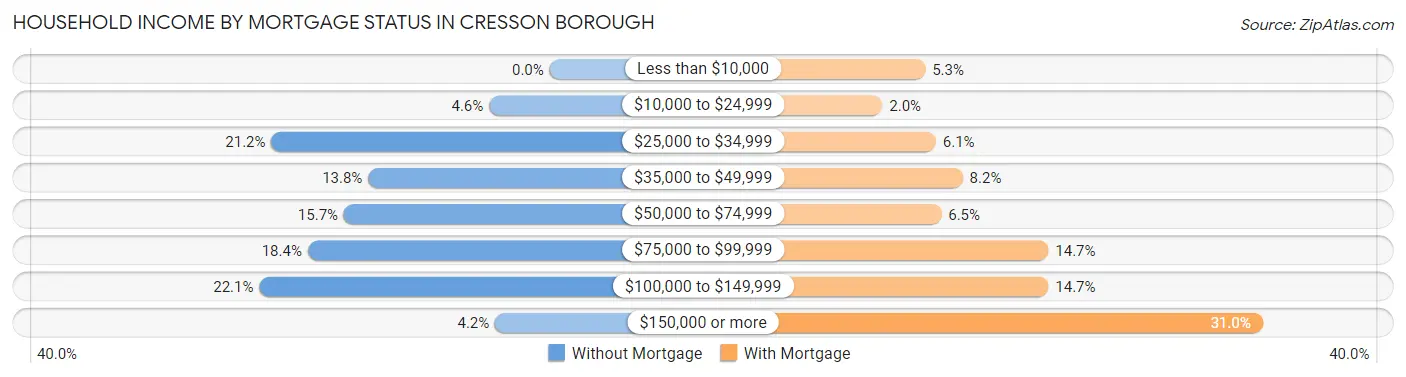
| Household Income | Without Mortgage | With Mortgage |
| Less than $10,000 | 0 (0.0%) | 13 (5.3%) |
| $10,000 to $24,999 | 10 (4.6%) | 5 (2.0%) |
| $25,000 to $34,999 | 46 (21.2%) | 15 (6.1%) |
| $35,000 to $49,999 | 30 (13.8%) | 20 (8.2%) |
| $50,000 to $74,999 | 34 (15.7%) | 16 (6.5%) |
| $75,000 to $99,999 | 40 (18.4%) | 36 (14.7%) |
| $100,000 to $149,999 | 48 (22.1%) | 36 (14.7%) |
| $150,000 or more | 9 (4.2%) | 76 (31.0%) |
| Total | 217 (100.0%) | 245 (100.0%) |
Property Value to Household Income Ratio in Cresson borough
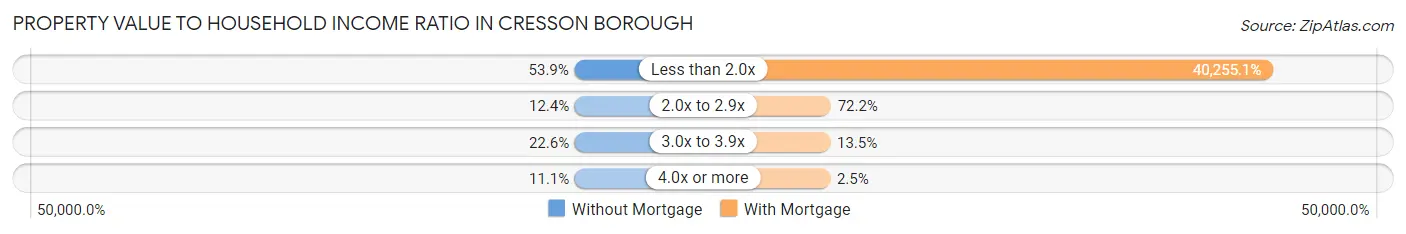
| Value-to-Income Ratio | Without Mortgage | With Mortgage |
| Less than 2.0x | 117 (53.9%) | 98,625 (40,255.1%) |
| 2.0x to 2.9x | 27 (12.4%) | 177 (72.2%) |
| 3.0x to 3.9x | 49 (22.6%) | 33 (13.5%) |
| 4.0x or more | 24 (11.1%) | 6 (2.5%) |
| Total | 217 (100.0%) | 245 (100.0%) |
Real Estate Taxes by Mortgage Status in Cresson borough
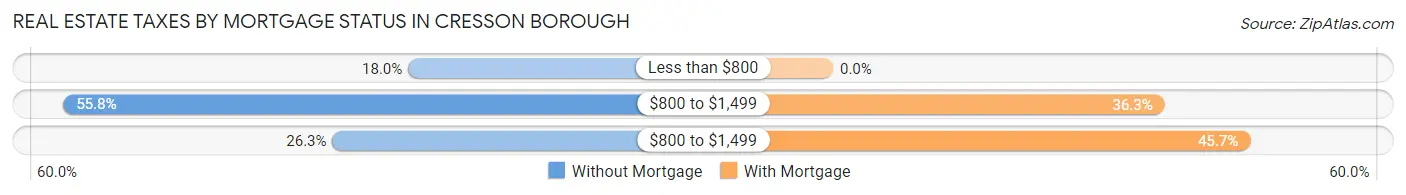
| Property Taxes | Without Mortgage | With Mortgage |
| Less than $800 | 39 (18.0%) | 0 (0.0%) |
| $800 to $1,499 | 121 (55.8%) | 89 (36.3%) |
| $800 to $1,499 | 57 (26.3%) | 112 (45.7%) |
| Total | 217 (100.0%) | 245 (100.0%) |
Health & Disability in Cresson borough
Health Insurance Coverage by Age in Cresson borough
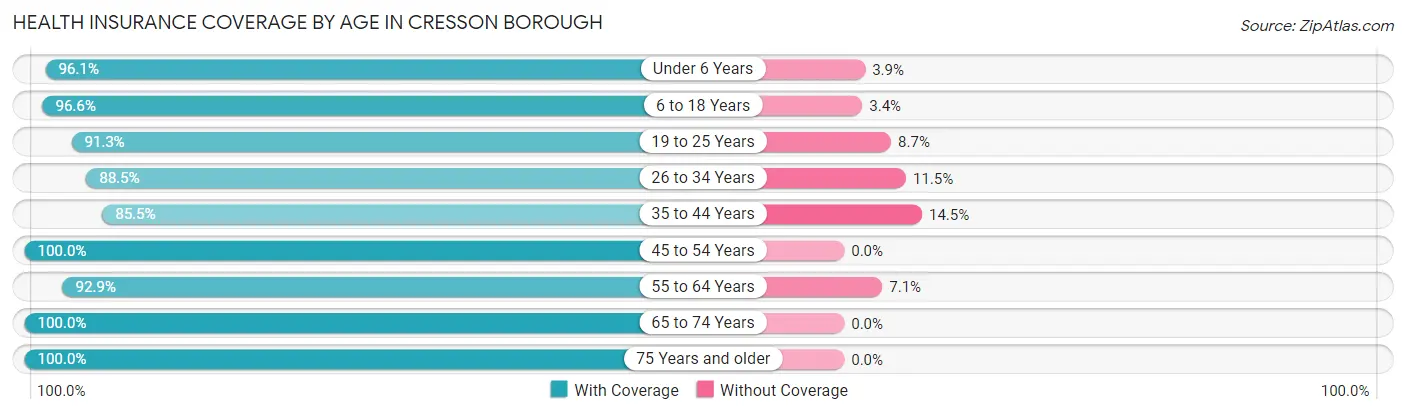
| Age Bracket | With Coverage | Without Coverage |
| Under 6 Years | 74 (96.1%) | 3 (3.9%) |
| 6 to 18 Years | 230 (96.6%) | 8 (3.4%) |
| 19 to 25 Years | 94 (91.3%) | 9 (8.7%) |
| 26 to 34 Years | 123 (88.5%) | 16 (11.5%) |
| 35 to 44 Years | 224 (85.5%) | 38 (14.5%) |
| 45 to 54 Years | 150 (100.0%) | 0 (0.0%) |
| 55 to 64 Years | 275 (92.9%) | 21 (7.1%) |
| 65 to 74 Years | 162 (100.0%) | 0 (0.0%) |
| 75 Years and older | 102 (100.0%) | 0 (0.0%) |
| Total | 1,434 (93.8%) | 95 (6.2%) |
Health Insurance Coverage by Citizenship Status in Cresson borough
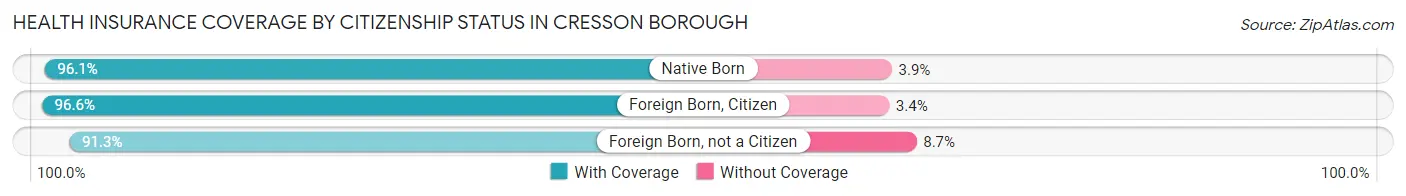
| Citizenship Status | With Coverage | Without Coverage |
| Native Born | 74 (96.1%) | 3 (3.9%) |
| Foreign Born, Citizen | 230 (96.6%) | 8 (3.4%) |
| Foreign Born, not a Citizen | 94 (91.3%) | 9 (8.7%) |
Health Insurance Coverage by Household Income in Cresson borough
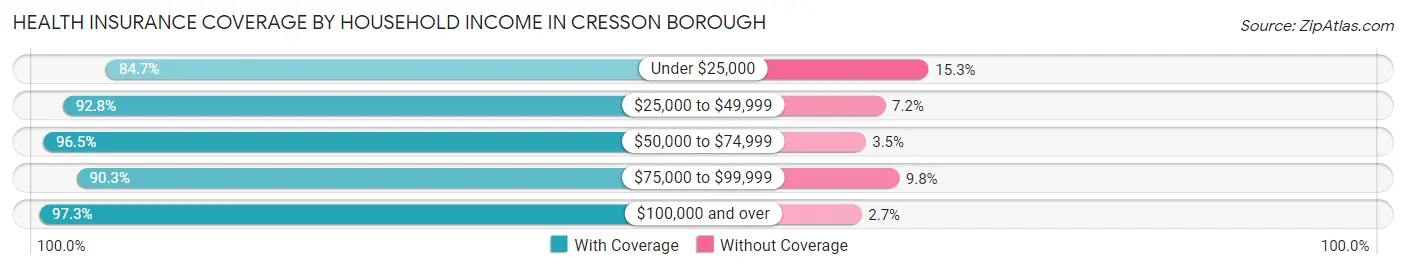
| Household Income | With Coverage | Without Coverage |
| Under $25,000 | 144 (84.7%) | 26 (15.3%) |
| $25,000 to $49,999 | 246 (92.8%) | 19 (7.2%) |
| $50,000 to $74,999 | 251 (96.5%) | 9 (3.5%) |
| $75,000 to $99,999 | 250 (90.2%) | 27 (9.8%) |
| $100,000 and over | 498 (97.3%) | 14 (2.7%) |
Public vs Private Health Insurance Coverage by Age in Cresson borough
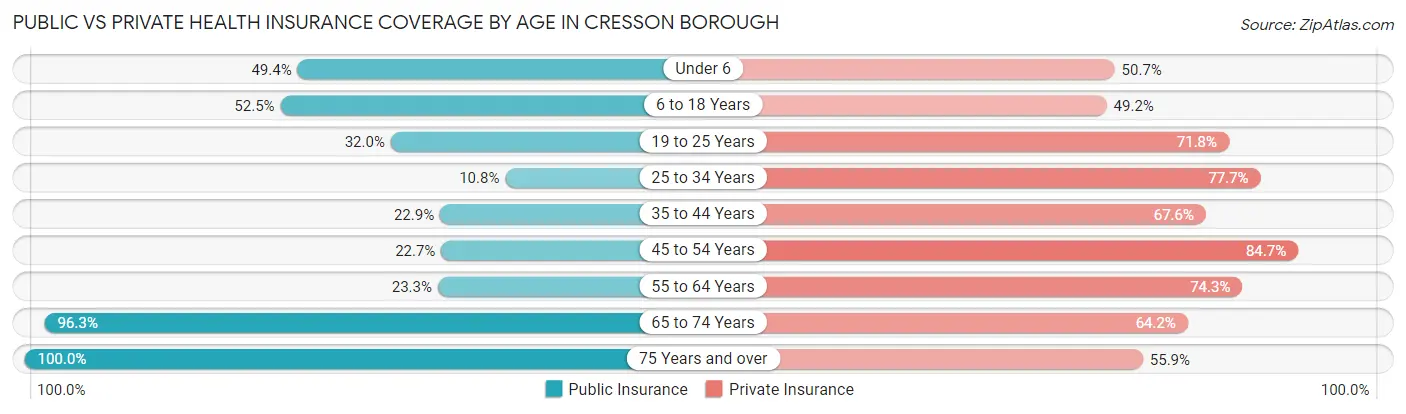
| Age Bracket | Public Insurance | Private Insurance |
| Under 6 | 38 (49.3%) | 39 (50.6%) |
| 6 to 18 Years | 125 (52.5%) | 117 (49.2%) |
| 19 to 25 Years | 33 (32.0%) | 74 (71.8%) |
| 25 to 34 Years | 15 (10.8%) | 108 (77.7%) |
| 35 to 44 Years | 60 (22.9%) | 177 (67.6%) |
| 45 to 54 Years | 34 (22.7%) | 127 (84.7%) |
| 55 to 64 Years | 69 (23.3%) | 220 (74.3%) |
| 65 to 74 Years | 156 (96.3%) | 104 (64.2%) |
| 75 Years and over | 102 (100.0%) | 57 (55.9%) |
| Total | 632 (41.3%) | 1,023 (66.9%) |
Disability Status by Sex by Age in Cresson borough
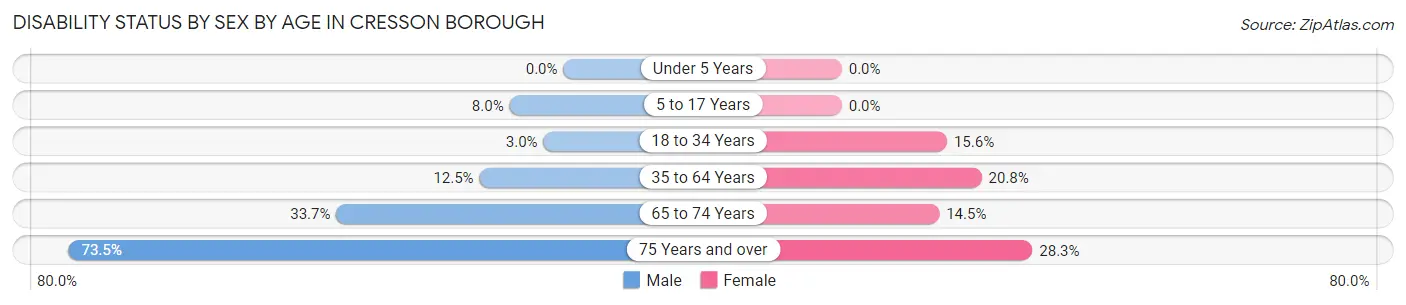
| Age Bracket | Male | Female |
| Under 5 Years | 0 (0.0%) | 0 (0.0%) |
| 5 to 17 Years | 10 (8.0%) | 0 (0.0%) |
| 18 to 34 Years | 4 (3.0%) | 20 (15.6%) |
| 35 to 64 Years | 39 (12.5%) | 82 (20.8%) |
| 65 to 74 Years | 29 (33.7%) | 11 (14.5%) |
| 75 Years and over | 36 (73.5%) | 15 (28.3%) |
Disability Class by Sex by Age in Cresson borough
Disability Class: Hearing Difficulty
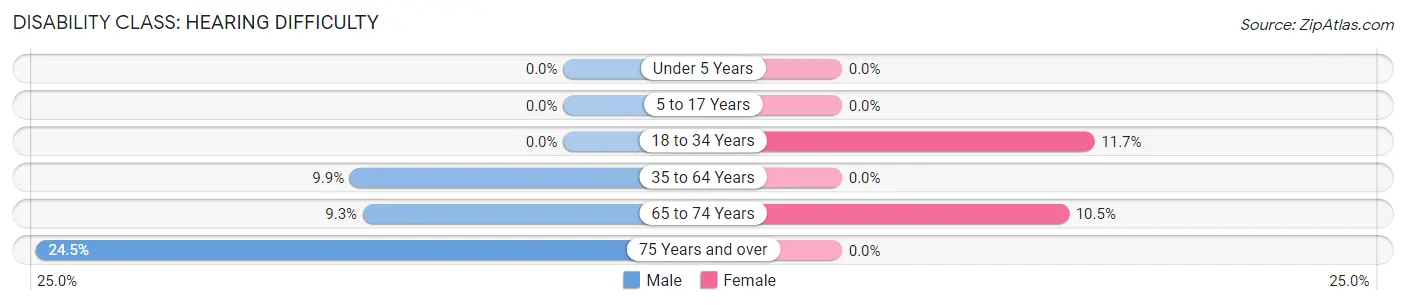
| Age Bracket | Male | Female |
| Under 5 Years | 0 (0.0%) | 0 (0.0%) |
| 5 to 17 Years | 0 (0.0%) | 0 (0.0%) |
| 18 to 34 Years | 0 (0.0%) | 15 (11.7%) |
| 35 to 64 Years | 31 (9.9%) | 0 (0.0%) |
| 65 to 74 Years | 8 (9.3%) | 8 (10.5%) |
| 75 Years and over | 12 (24.5%) | 0 (0.0%) |
Disability Class: Vision Difficulty
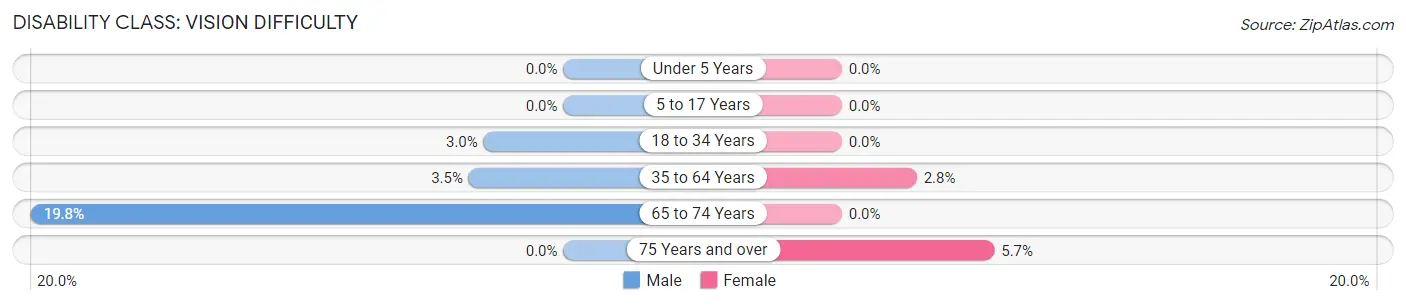
| Age Bracket | Male | Female |
| Under 5 Years | 0 (0.0%) | 0 (0.0%) |
| 5 to 17 Years | 0 (0.0%) | 0 (0.0%) |
| 18 to 34 Years | 4 (3.0%) | 0 (0.0%) |
| 35 to 64 Years | 11 (3.5%) | 11 (2.8%) |
| 65 to 74 Years | 17 (19.8%) | 0 (0.0%) |
| 75 Years and over | 0 (0.0%) | 3 (5.7%) |
Disability Class: Cognitive Difficulty
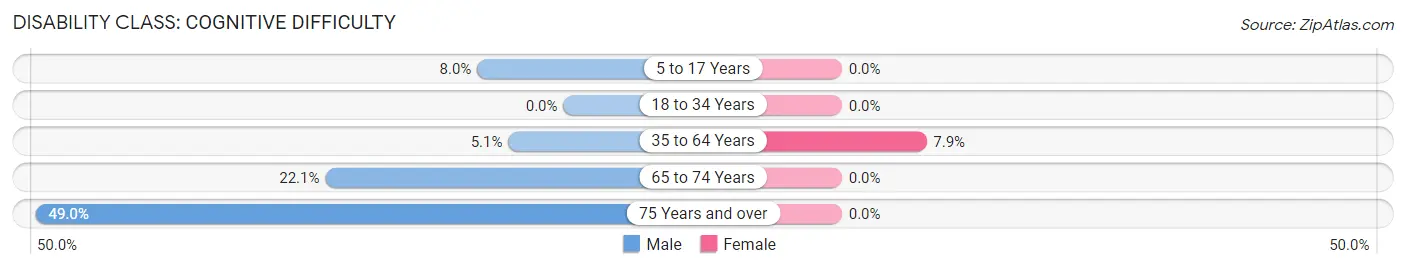
| Age Bracket | Male | Female |
| 5 to 17 Years | 10 (8.0%) | 0 (0.0%) |
| 18 to 34 Years | 0 (0.0%) | 0 (0.0%) |
| 35 to 64 Years | 16 (5.1%) | 31 (7.9%) |
| 65 to 74 Years | 19 (22.1%) | 0 (0.0%) |
| 75 Years and over | 24 (49.0%) | 0 (0.0%) |
Disability Class: Ambulatory Difficulty
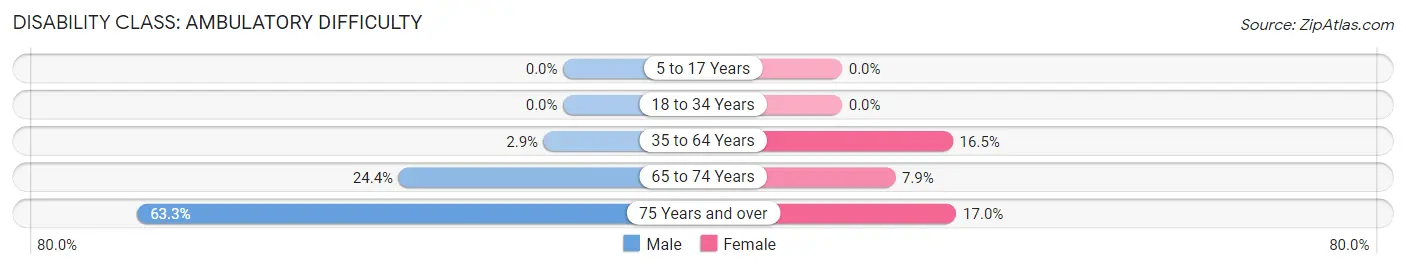
| Age Bracket | Male | Female |
| 5 to 17 Years | 0 (0.0%) | 0 (0.0%) |
| 18 to 34 Years | 0 (0.0%) | 0 (0.0%) |
| 35 to 64 Years | 9 (2.9%) | 65 (16.5%) |
| 65 to 74 Years | 21 (24.4%) | 6 (7.9%) |
| 75 Years and over | 31 (63.3%) | 9 (17.0%) |
Disability Class: Self-Care Difficulty
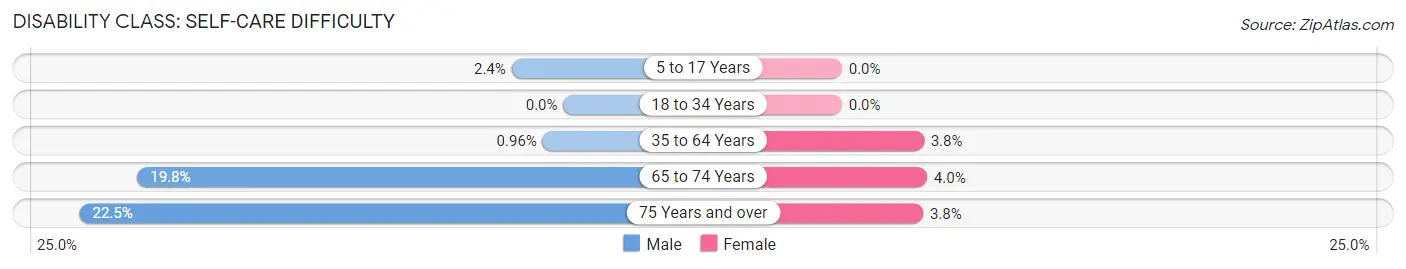
| Age Bracket | Male | Female |
| 5 to 17 Years | 3 (2.4%) | 0 (0.0%) |
| 18 to 34 Years | 0 (0.0%) | 0 (0.0%) |
| 35 to 64 Years | 3 (1.0%) | 15 (3.8%) |
| 65 to 74 Years | 17 (19.8%) | 3 (4.0%) |
| 75 Years and over | 11 (22.5%) | 2 (3.8%) |
Technology Access in Cresson borough
Computing Device Access in Cresson borough
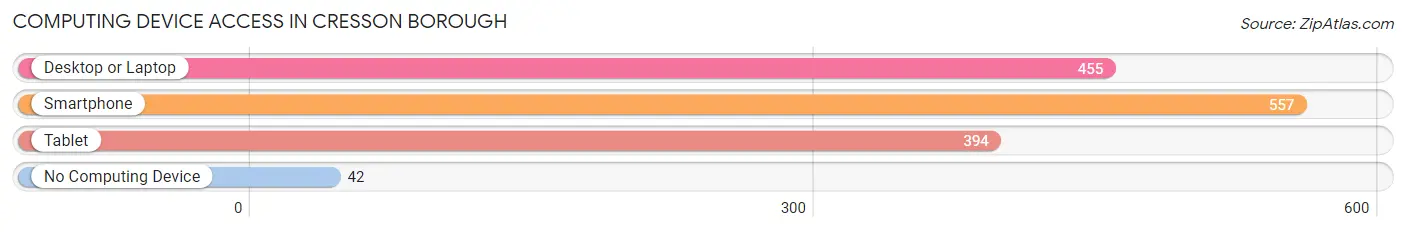
| Device Type | # Households | % Households |
| Desktop or Laptop | 455 | 69.4% |
| Smartphone | 557 | 84.9% |
| Tablet | 394 | 60.1% |
| No Computing Device | 42 | 6.4% |
| Total | 656 | 100.0% |
Internet Access in Cresson borough
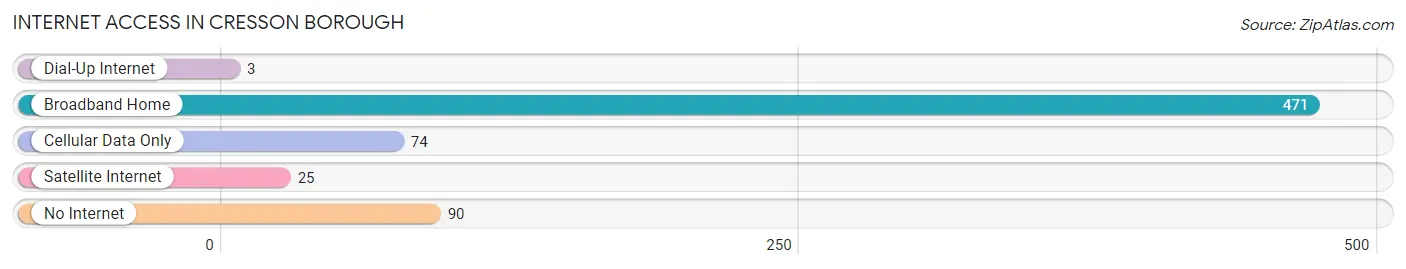
| Internet Type | # Households | % Households |
| Dial-Up Internet | 3 | 0.5% |
| Broadband Home | 471 | 71.8% |
| Cellular Data Only | 74 | 11.3% |
| Satellite Internet | 25 | 3.8% |
| No Internet | 90 | 13.7% |
| Total | 656 | 100.0% |
Cresson borough Summary
Cresson Borough is a small borough located in Cambria County, Pennsylvania. It is situated in the Allegheny Mountains, approximately 10 miles east of Johnstown. The borough was founded in 1891 and has a population of 1,717 as of the 2010 census.
History
Cresson Borough was founded in 1891 by the Pennsylvania Railroad. The railroad had been looking for a place to build a new station and chose the area due to its proximity to the Allegheny Mountains. The town was named after the nearby Cresson Springs, which had been a popular resort destination since the mid-1800s.
The town quickly grew and by the early 1900s, it had become a popular tourist destination. The town was home to several hotels, including the Cresson House, which was built in 1891 and is still standing today. The town also had a number of stores, restaurants, and other businesses.
In the early 1900s, the town was also home to a number of coal mines. The mines provided jobs for many of the town’s residents and helped to fuel the local economy. The mines were eventually closed in the 1950s, but the town still retains its mining heritage.
Geography
Cresson Borough is located in Cambria County, Pennsylvania. It is situated in the Allegheny Mountains, approximately 10 miles east of Johnstown. The borough is bordered by the boroughs of South Fork, Portage, and Summerhill.
The borough has a total area of 0.9 square miles, all of which is land. The borough is located at an elevation of 1,890 feet above sea level.
Economy
The economy of Cresson Borough is largely based on tourism. The town is home to several hotels, restaurants, and other businesses that cater to tourists. The town is also home to a number of antique stores, which attract visitors from all over the region.
The town is also home to a number of manufacturing businesses, including a paper mill and a metal fabrication plant. These businesses provide jobs for many of the town’s residents.
Demographics
As of the 2010 census, the population of Cresson Borough was 1,717. The racial makeup of the borough was 97.3% White, 0.9% African American, 0.2% Native American, 0.2% Asian, 0.1% from other races, and 1.3% from two or more races. Hispanic or Latino of any race were 0.7% of the population.
The median income for a household in the borough was $35,938, and the median income for a family was $41,250. The per capita income for the borough was $17,945. About 11.2% of families and 13.2% of the population were below the poverty line, including 18.2% of those under age 18 and 8.2% of those age 65 or over.
Conclusion
Cresson Borough is a small borough located in Cambria County, Pennsylvania. It was founded in 1891 by the Pennsylvania Railroad and has a population of 1,717 as of the 2010 census. The borough is situated in the Allegheny Mountains and is a popular tourist destination. The economy of the borough is largely based on tourism, but it is also home to a number of manufacturing businesses. The racial makeup of the borough is predominantly White, with a small percentage of African American, Native American, and Asian residents. The median income for a household in the borough is $35,938, and the per capita income is $17,945.
Common Questions
What is Per Capita Income in Cresson borough?
Per Capita income in Cresson borough is $32,254.
What is the Median Family Income in Cresson borough?
Median Family Income in Cresson borough is $81,989.
What is the Median Household income in Cresson borough?
Median Household Income in Cresson borough is $58,929.
What is Income or Wage Gap in Cresson borough?
Income or Wage Gap in Cresson borough is 40.4%.
Women in Cresson borough earn 59.6 cents for every dollar earned by a man.
What is Inequality or Gini Index in Cresson borough?
Inequality or Gini Index in Cresson borough is 0.40.
What is the Total Population of Cresson borough?
Total Population of Cresson borough is 1,529.
What is the Total Male Population of Cresson borough?
Total Male Population of Cresson borough is 736.
What is the Total Female Population of Cresson borough?
Total Female Population of Cresson borough is 793.
What is the Ratio of Males per 100 Females in Cresson borough?
There are 92.81 Males per 100 Females in Cresson borough.
What is the Ratio of Females per 100 Males in Cresson borough?
There are 107.74 Females per 100 Males in Cresson borough.
What is the Median Population Age in Cresson borough?
Median Population Age in Cresson borough is 42.7 Years.
What is the Average Family Size in Cresson borough
Average Family Size in Cresson borough is 3.1 People.
What is the Average Household Size in Cresson borough
Average Household Size in Cresson borough is 2.3 People.
How Large is the Labor Force in Cresson borough?
There are 855 People in the Labor Forcein in Cresson borough.
What is the Percentage of People in the Labor Force in Cresson borough?
65.8% of People are in the Labor Force in Cresson borough.
What is the Unemployment Rate in Cresson borough?
Unemployment Rate in Cresson borough is 4.4%.