Georgetown borough, PA Map & Demographics
Georgetown borough Overview
$33,674
PER CAPITA INCOME
$88,333
AVG FAMILY INCOME
$87,500
AVG HOUSEHOLD INCOME
25.6%
WAGE / INCOME GAP [ % ]
74.4¢/ $1
WAGE / INCOME GAP [ $ ]
0.38
INEQUALITY / GINI INDEX
211
TOTAL POPULATION
129
MALE POPULATION
82
FEMALE POPULATION
157.32
MALES / 100 FEMALES
63.57
FEMALES / 100 MALES
37.8
MEDIAN AGE
3.0
AVG FAMILY SIZE
3.0
AVG HOUSEHOLD SIZE
115
LABOR FORCE [ PEOPLE ]
71.4%
PERCENT IN LABOR FORCE
Income in Georgetown borough
Income Overview in Georgetown borough
Per Capita Income in Georgetown borough is $33,674, while median incomes of families and households are $88,333 and $87,500 respectively.
| Characteristic | Number | Measure |
| Per Capita Income | 211 | $33,674 |
| Median Family Income | 62 | $88,333 |
| Mean Family Income | 62 | $105,611 |
| Median Household Income | 70 | $87,500 |
| Mean Household Income | 70 | $102,159 |
| Income Deficit | 62 | $0 |
| Wage / Income Gap (%) | 211 | 25.64% |
| Wage / Income Gap ($) | 211 | 74.36¢ per $1 |
| Gini / Inequality Index | 211 | 0.38 |
Earnings by Sex in Georgetown borough
Average Earnings in Georgetown borough are $42,679, $36,250 for men and $48,750 for women, a difference of 25.6%.
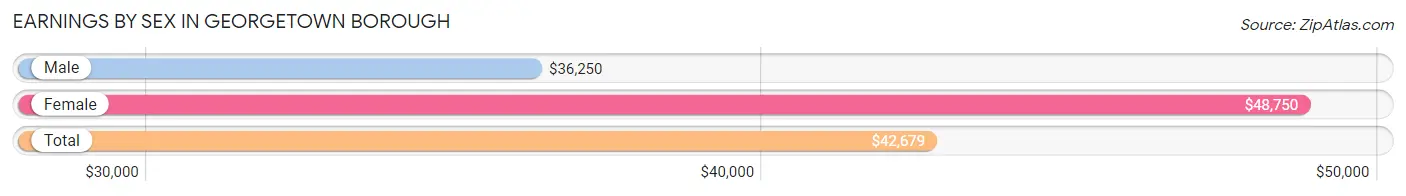
| Sex | Number | Average Earnings |
| Male | 71 (58.7%) | $36,250 |
| Female | 50 (41.3%) | $48,750 |
| Total | 121 (100.0%) | $42,679 |
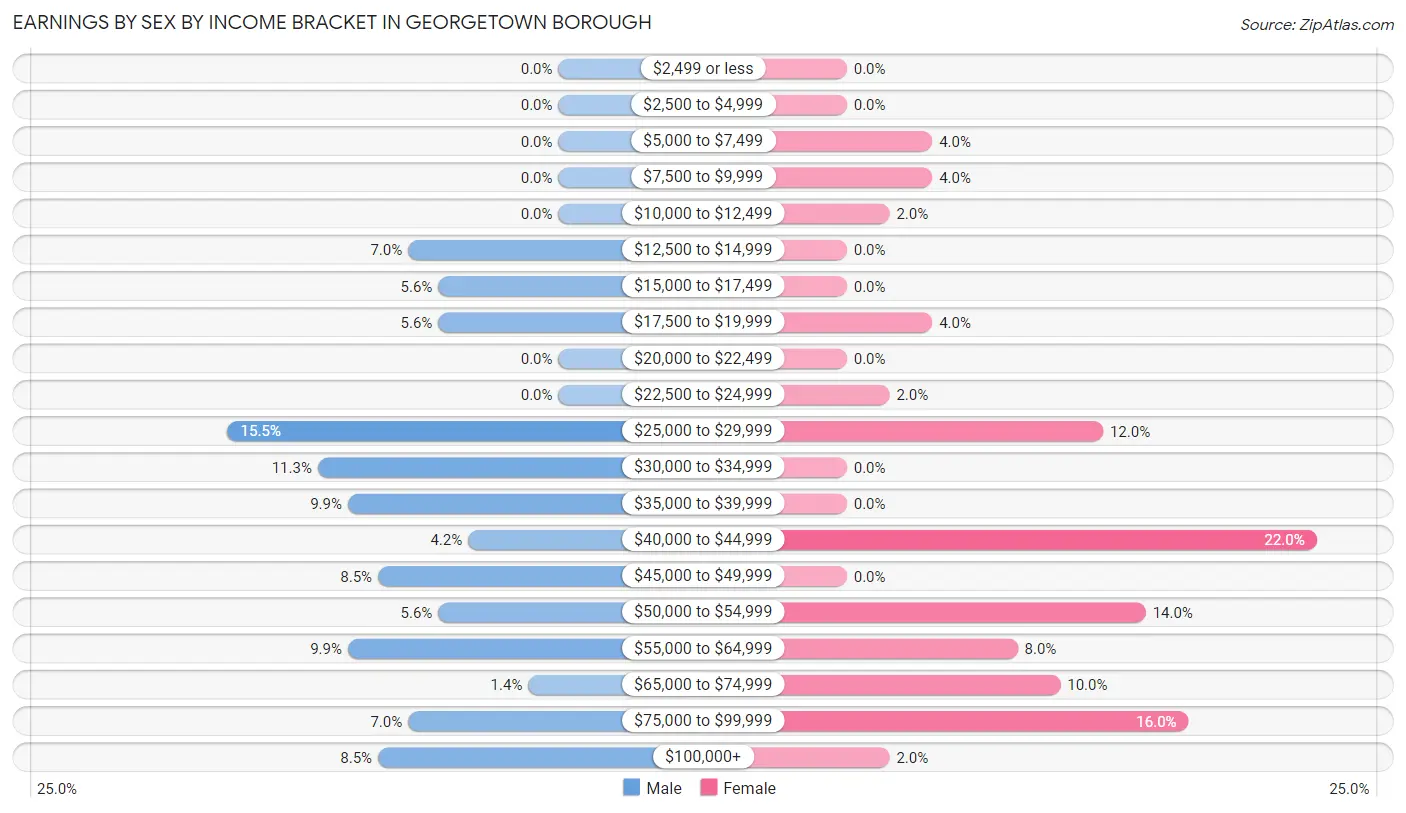
Earnings by Sex by Income Bracket in Georgetown borough
The most common earnings brackets in Georgetown borough are $25,000 to $29,999 for men (11 | 15.5%) and $40,000 to $44,999 for women (11 | 22.0%).
| Income | Male | Female |
| $2,499 or less | 0 (0.0%) | 0 (0.0%) |
| $2,500 to $4,999 | 0 (0.0%) | 0 (0.0%) |
| $5,000 to $7,499 | 0 (0.0%) | 2 (4.0%) |
| $7,500 to $9,999 | 0 (0.0%) | 2 (4.0%) |
| $10,000 to $12,499 | 0 (0.0%) | 1 (2.0%) |
| $12,500 to $14,999 | 5 (7.0%) | 0 (0.0%) |
| $15,000 to $17,499 | 4 (5.6%) | 0 (0.0%) |
| $17,500 to $19,999 | 4 (5.6%) | 2 (4.0%) |
| $20,000 to $22,499 | 0 (0.0%) | 0 (0.0%) |
| $22,500 to $24,999 | 0 (0.0%) | 1 (2.0%) |
| $25,000 to $29,999 | 11 (15.5%) | 6 (12.0%) |
| $30,000 to $34,999 | 8 (11.3%) | 0 (0.0%) |
| $35,000 to $39,999 | 7 (9.9%) | 0 (0.0%) |
| $40,000 to $44,999 | 3 (4.2%) | 11 (22.0%) |
| $45,000 to $49,999 | 6 (8.5%) | 0 (0.0%) |
| $50,000 to $54,999 | 4 (5.6%) | 7 (14.0%) |
| $55,000 to $64,999 | 7 (9.9%) | 4 (8.0%) |
| $65,000 to $74,999 | 1 (1.4%) | 5 (10.0%) |
| $75,000 to $99,999 | 5 (7.0%) | 8 (16.0%) |
| $100,000+ | 6 (8.5%) | 1 (2.0%) |
| Total | 71 (100.0%) | 50 (100.0%) |
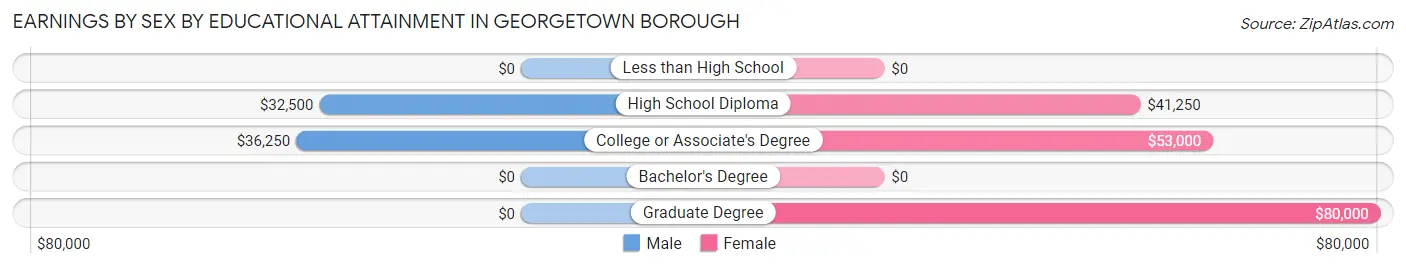
Earnings by Sex by Educational Attainment in Georgetown borough
Average earnings in Georgetown borough are $41,250 for men and $48,750 for women, a difference of 15.4%. Men with an educational attainment of college or associate's degree enjoy the highest average annual earnings of $36,250, while those with high school diploma education earn the least with $32,500. Women with an educational attainment of graduate degree earn the most with the average annual earnings of $80,000, while those with high school diploma education have the smallest earnings of $41,250.
| Educational Attainment | Male Income | Female Income |
| Less than High School | - | - |
| High School Diploma | $32,500 | $41,250 |
| College or Associate's Degree | $36,250 | $53,000 |
| Bachelor's Degree | - | - |
| Graduate Degree | - | - |
| Total | $41,250 | $48,750 |
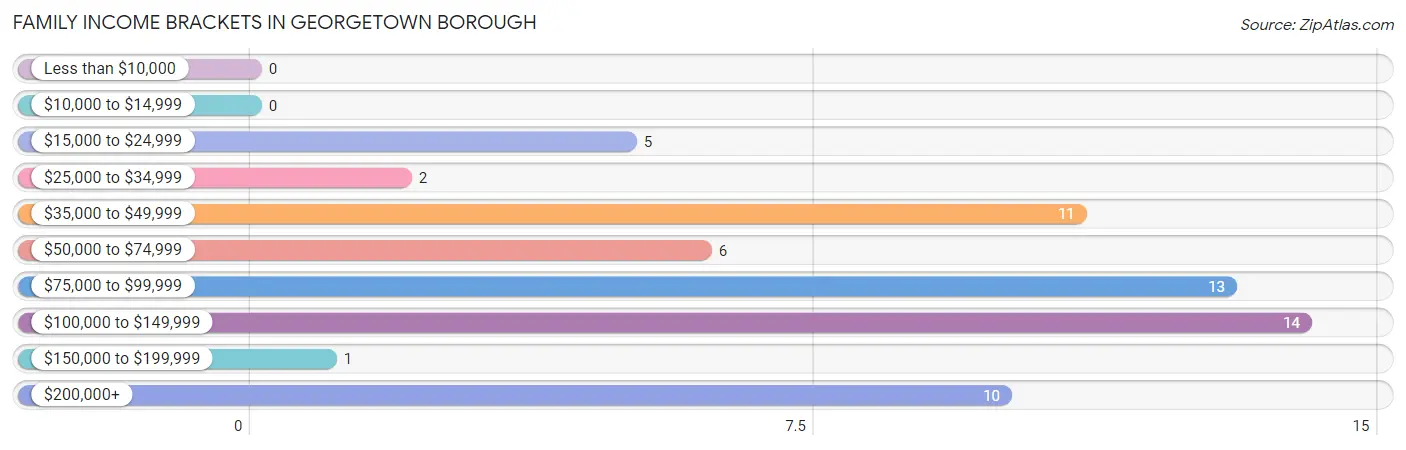
Family Income in Georgetown borough
Family Income Brackets in Georgetown borough
According to the Georgetown borough family income data, there are 14 families falling into the $100,000 to $149,999 income range, which is the most common income bracket and makes up 22.6% of all families.
| Income Bracket | # Families | % Families |
| Less than $10,000 | 0 | 0.0% |
| $10,000 to $14,999 | 0 | 0.0% |
| $15,000 to $24,999 | 5 | 8.1% |
| $25,000 to $34,999 | 2 | 3.2% |
| $35,000 to $49,999 | 11 | 17.7% |
| $50,000 to $74,999 | 6 | 9.7% |
| $75,000 to $99,999 | 13 | 21.0% |
| $100,000 to $149,999 | 14 | 22.6% |
| $150,000 to $199,999 | 1 | 1.6% |
| $200,000+ | 10 | 16.1% |
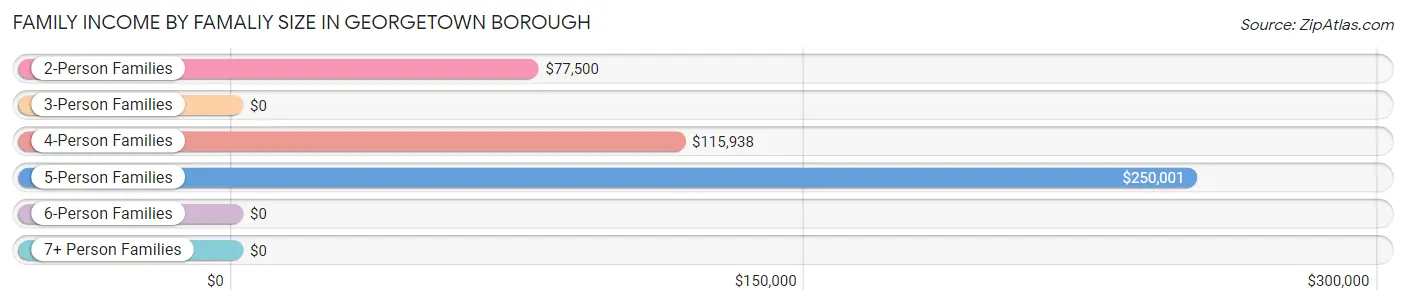
Family Income by Famaliy Size in Georgetown borough
5-person families (9 | 14.5%) account for the highest median family income in Georgetown borough with $250,001 per family, while 5-person families (9 | 14.5%) have the highest median income of $50,000 per family member.
| Income Bracket | # Families | Median Income |
| 2-Person Families | 34 (54.8%) | $77,500 |
| 3-Person Families | 3 (4.8%) | $0 |
| 4-Person Families | 16 (25.8%) | $115,938 |
| 5-Person Families | 9 (14.5%) | $250,001 |
| 6-Person Families | 0 (0.0%) | $0 |
| 7+ Person Families | 0 (0.0%) | $0 |
| Total | 62 (100.0%) | $88,333 |
Family Income by Number of Earners in Georgetown borough
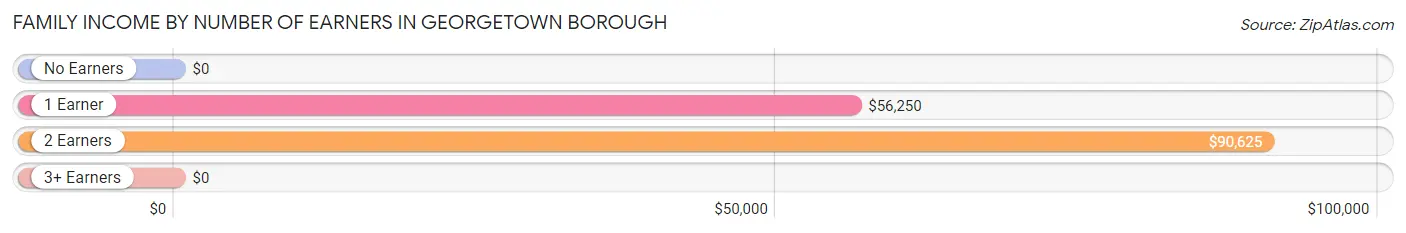
| Number of Earners | # Families | Median Income |
| No Earners | 7 (11.3%) | $0 |
| 1 Earner | 14 (22.6%) | $56,250 |
| 2 Earners | 33 (53.2%) | $90,625 |
| 3+ Earners | 8 (12.9%) | $0 |
| Total | 62 (100.0%) | $88,333 |
Household Income in Georgetown borough
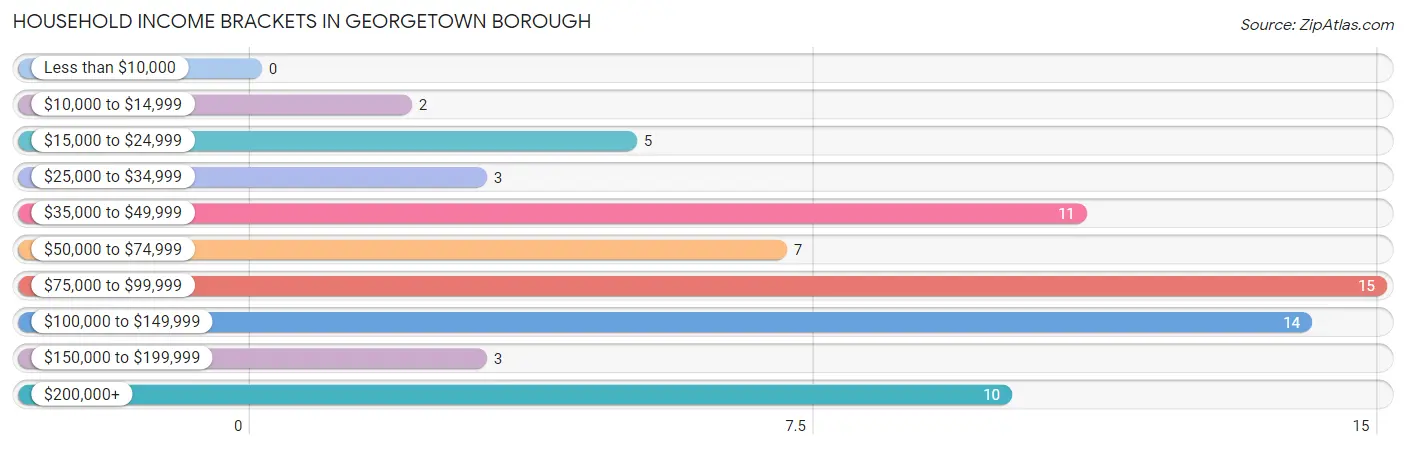
Household Income Brackets in Georgetown borough
With 15 households falling in the category, the $75,000 to $99,999 income range is the most frequent in Georgetown borough, accounting for 21.4% of all households.
| Income Bracket | # Households | % Households |
| Less than $10,000 | 0 | 0.0% |
| $10,000 to $14,999 | 2 | 2.9% |
| $15,000 to $24,999 | 5 | 7.1% |
| $25,000 to $34,999 | 3 | 4.3% |
| $35,000 to $49,999 | 11 | 15.7% |
| $50,000 to $74,999 | 7 | 10.0% |
| $75,000 to $99,999 | 15 | 21.4% |
| $100,000 to $149,999 | 14 | 20.0% |
| $150,000 to $199,999 | 3 | 4.3% |
| $200,000+ | 10 | 14.3% |
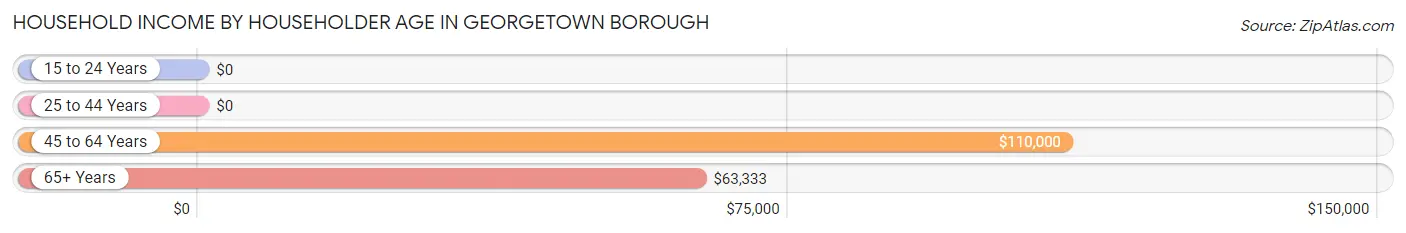
Household Income by Householder Age in Georgetown borough
The median household income in Georgetown borough is $87,500, with the highest median household income of $110,000 found in the 45 to 64 years age bracket for the primary householder. A total of 44 households (62.9%) fall into this category.
| Income Bracket | # Households | Median Income |
| 15 to 24 Years | 0 (0.0%) | $0 |
| 25 to 44 Years | 8 (11.4%) | $0 |
| 45 to 64 Years | 44 (62.9%) | $110,000 |
| 65+ Years | 18 (25.7%) | $63,333 |
| Total | 70 (100.0%) | $87,500 |
Poverty in Georgetown borough
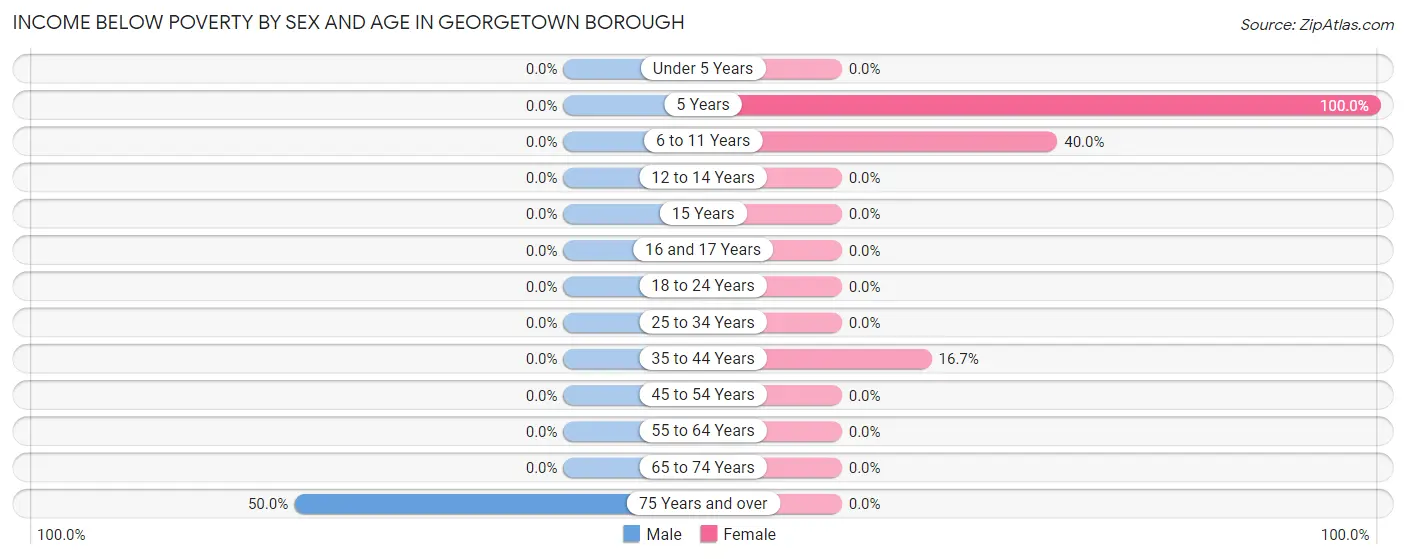
Income Below Poverty by Sex and Age in Georgetown borough
With 1.7% poverty level for males and 7.6% for females among the residents of Georgetown borough, 75 year old and over males and 5 year old females are the most vulnerable to poverty, with 2 males (50.0%) and 2 females (100.0%) in their respective age groups living below the poverty level.
| Age Bracket | Male | Female |
| Under 5 Years | 0 (0.0%) | 0 (0.0%) |
| 5 Years | 0 (0.0%) | 2 (100.0%) |
| 6 to 11 Years | 0 (0.0%) | 2 (40.0%) |
| 12 to 14 Years | 0 (0.0%) | 0 (0.0%) |
| 15 Years | 0 (0.0%) | 0 (0.0%) |
| 16 and 17 Years | 0 (0.0%) | 0 (0.0%) |
| 18 to 24 Years | 0 (0.0%) | 0 (0.0%) |
| 25 to 34 Years | 0 (0.0%) | 0 (0.0%) |
| 35 to 44 Years | 0 (0.0%) | 2 (16.7%) |
| 45 to 54 Years | 0 (0.0%) | 0 (0.0%) |
| 55 to 64 Years | 0 (0.0%) | 0 (0.0%) |
| 65 to 74 Years | 0 (0.0%) | 0 (0.0%) |
| 75 Years and over | 2 (50.0%) | 0 (0.0%) |
| Total | 2 (1.7%) | 6 (7.6%) |
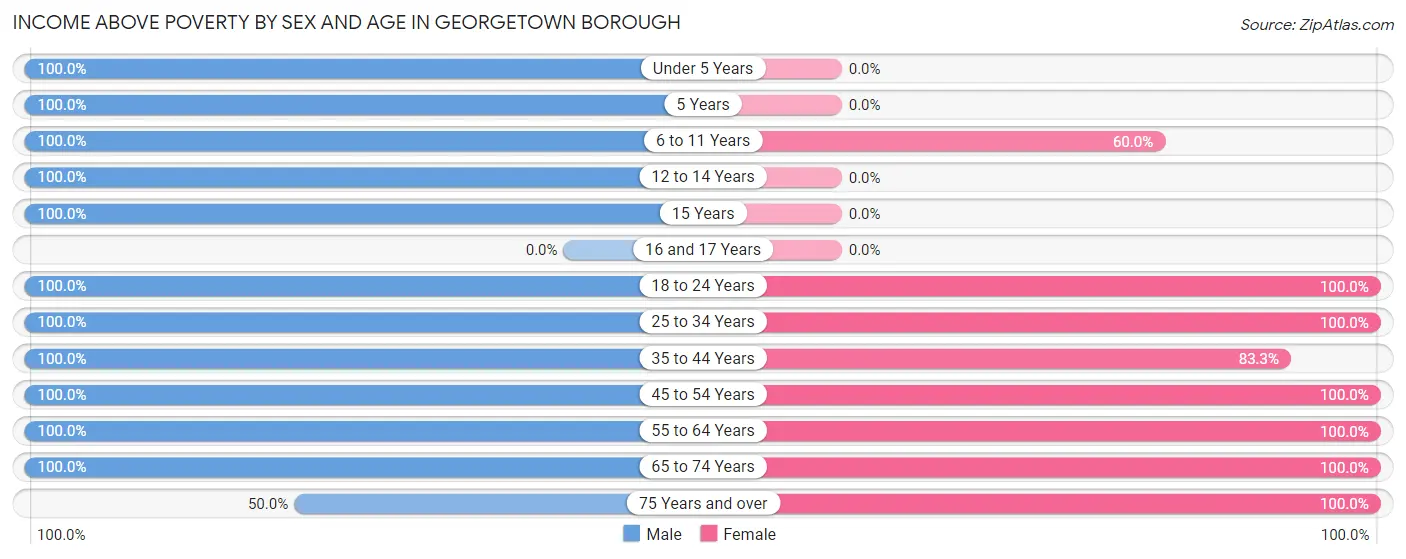
Income Above Poverty by Sex and Age in Georgetown borough
According to the poverty statistics in Georgetown borough, males aged under 5 years and females aged 18 to 24 years are the age groups that are most secure financially, with 100.0% of males and 100.0% of females in these age groups living above the poverty line.
| Age Bracket | Male | Female |
| Under 5 Years | 7 (100.0%) | 0 (0.0%) |
| 5 Years | 1 (100.0%) | 0 (0.0%) |
| 6 to 11 Years | 18 (100.0%) | 3 (60.0%) |
| 12 to 14 Years | 2 (100.0%) | 0 (0.0%) |
| 15 Years | 4 (100.0%) | 0 (0.0%) |
| 16 and 17 Years | 0 (0.0%) | 0 (0.0%) |
| 18 to 24 Years | 12 (100.0%) | 5 (100.0%) |
| 25 to 34 Years | 14 (100.0%) | 13 (100.0%) |
| 35 to 44 Years | 7 (100.0%) | 10 (83.3%) |
| 45 to 54 Years | 21 (100.0%) | 13 (100.0%) |
| 55 to 64 Years | 22 (100.0%) | 16 (100.0%) |
| 65 to 74 Years | 9 (100.0%) | 8 (100.0%) |
| 75 Years and over | 2 (50.0%) | 5 (100.0%) |
| Total | 119 (98.4%) | 73 (92.4%) |
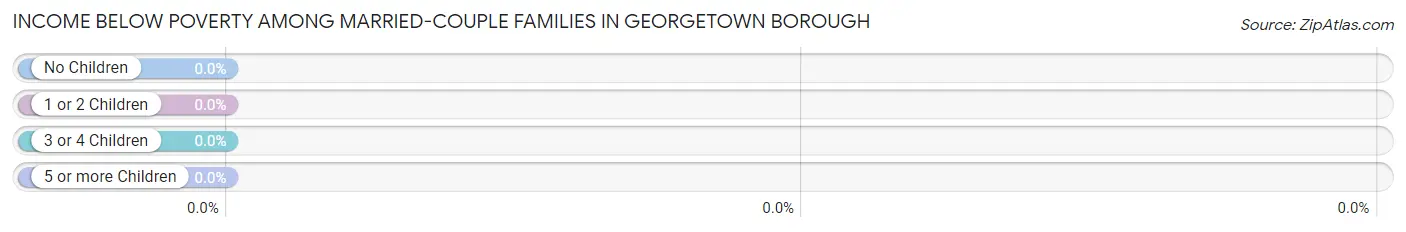
Income Below Poverty Among Married-Couple Families in Georgetown borough
| Children | Above Poverty | Below Poverty |
| No Children | 31 (100.0%) | 0 (0.0%) |
| 1 or 2 Children | 18 (100.0%) | 0 (0.0%) |
| 3 or 4 Children | 2 (100.0%) | 0 (0.0%) |
| 5 or more Children | 0 (0.0%) | 0 (0.0%) |
| Total | 51 (100.0%) | 0 (0.0%) |
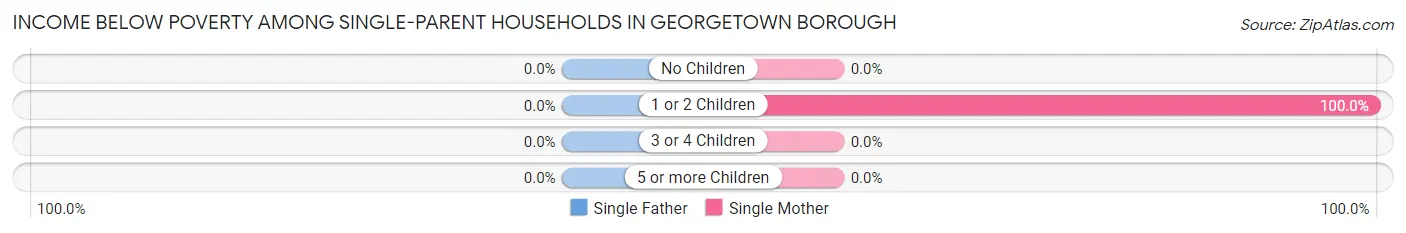
Income Below Poverty Among Single-Parent Households in Georgetown borough
| Children | Single Father | Single Mother |
| No Children | 0 (0.0%) | 0 (0.0%) |
| 1 or 2 Children | 0 (0.0%) | 2 (100.0%) |
| 3 or 4 Children | 0 (0.0%) | 0 (0.0%) |
| 5 or more Children | 0 (0.0%) | 0 (0.0%) |
| Total | 0 (0.0%) | 2 (33.3%) |
Income Below Poverty Among Married-Couple vs Single-Parent Households in Georgetown borough
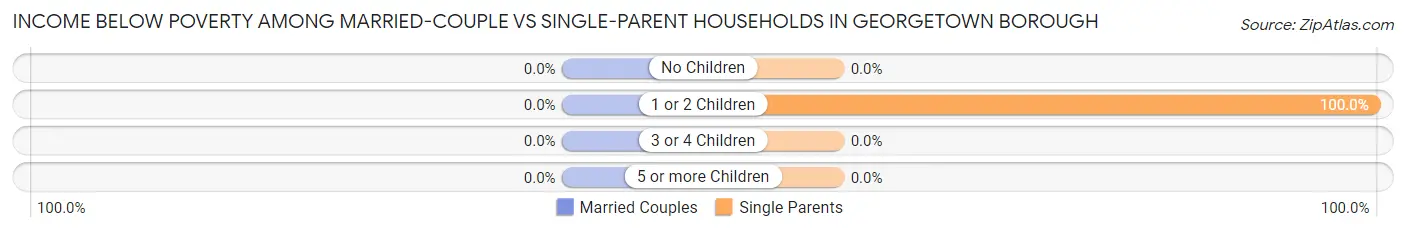
| Children | Married-Couple Families | Single-Parent Households |
| No Children | 0 (0.0%) | 0 (0.0%) |
| 1 or 2 Children | 0 (0.0%) | 2 (100.0%) |
| 3 or 4 Children | 0 (0.0%) | 0 (0.0%) |
| 5 or more Children | 0 (0.0%) | 0 (0.0%) |
| Total | 0 (0.0%) | 2 (18.2%) |
Race in Georgetown borough
The most populous races in Georgetown borough are White / Caucasian (179 | 84.8%), Some other Race (21 | 10.0%), and Two or more Races (11 | 5.2%).
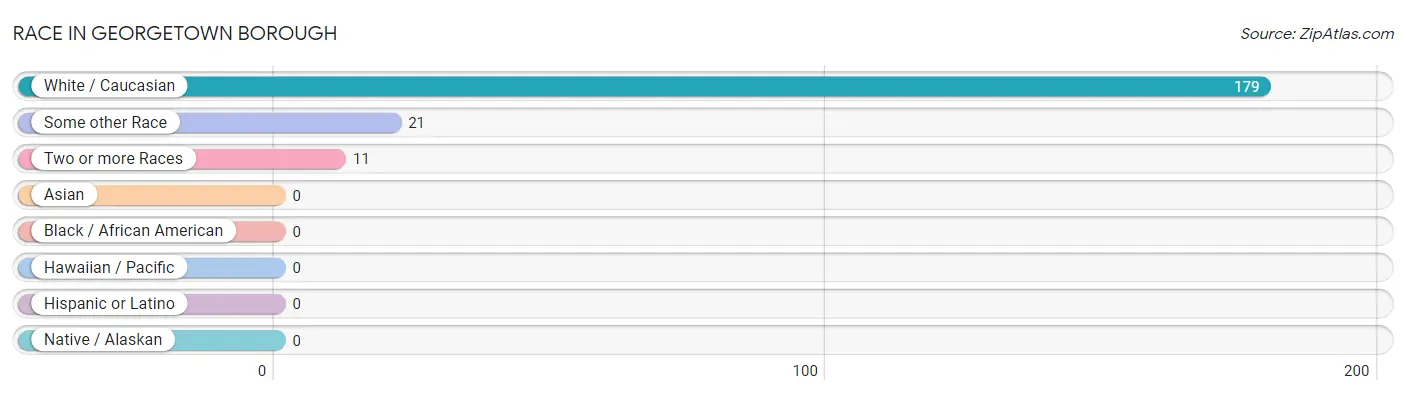
| Race | # Population | % Population |
| Asian | 0 | 0.0% |
| Black / African American | 0 | 0.0% |
| Hawaiian / Pacific | 0 | 0.0% |
| Hispanic or Latino | 0 | 0.0% |
| Native / Alaskan | 0 | 0.0% |
| White / Caucasian | 179 | 84.8% |
| Two or more Races | 11 | 5.2% |
| Some other Race | 21 | 10.0% |
| Total | 211 | 100.0% |
Ancestry in Georgetown borough
The most populous ancestries reported in Georgetown borough are Irish (47 | 22.3%), Italian (46 | 21.8%), German (44 | 20.8%), English (41 | 19.4%), and Polish (11 | 5.2%), together accounting for 89.6% of all Georgetown borough residents.
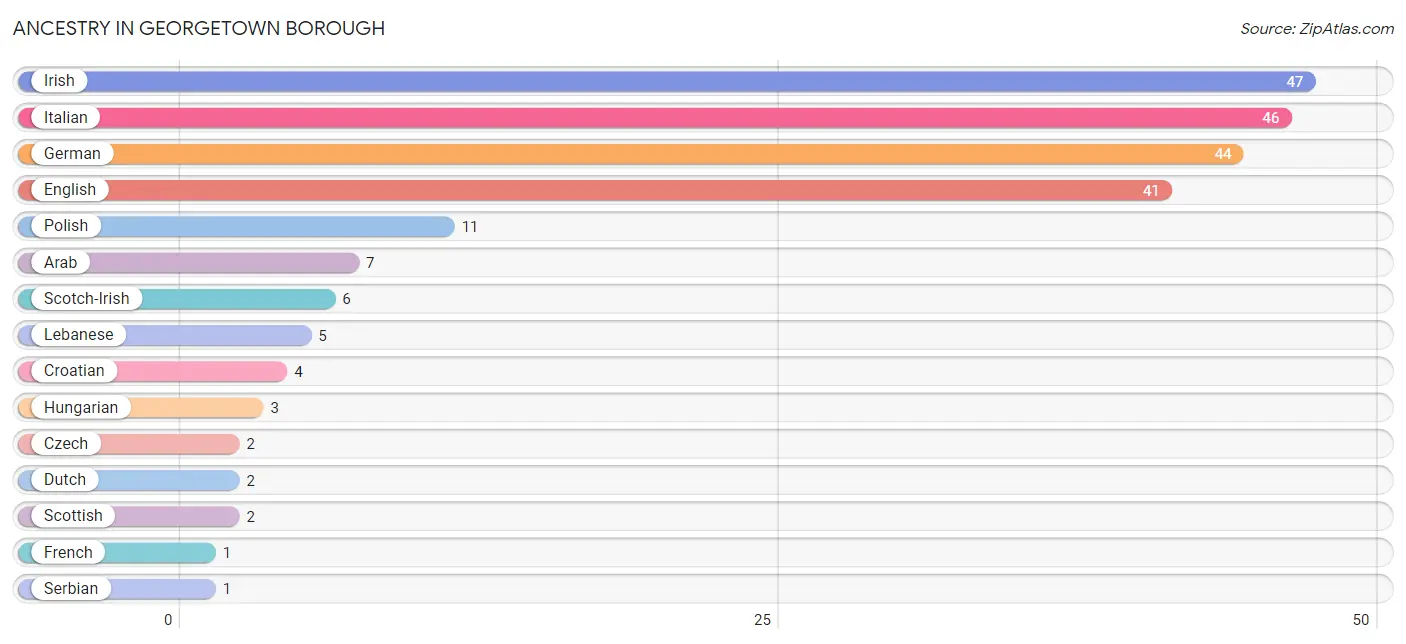
| Ancestry | # Population | % Population |
| Arab | 7 | 3.3% |
| Croatian | 4 | 1.9% |
| Czech | 2 | 0.9% |
| Dutch | 2 | 0.9% |
| English | 41 | 19.4% |
| French | 1 | 0.5% |
| German | 44 | 20.8% |
| Hungarian | 3 | 1.4% |
| Irish | 47 | 22.3% |
| Italian | 46 | 21.8% |
| Lebanese | 5 | 2.4% |
| Polish | 11 | 5.2% |
| Scotch-Irish | 6 | 2.8% |
| Scottish | 2 | 0.9% |
| Serbian | 1 | 0.5% |
| Welsh | 1 | 0.5% | View All 16 Rows |
Immigrants in Georgetown borough

| Immigration Origin | # Population | % Population | View All 0 Rows |
Sex and Age in Georgetown borough
Sex and Age in Georgetown borough
The most populous age groups in Georgetown borough are 5 to 9 Years (22 | 17.1%) for men and 35 to 39 Years (12 | 14.6%) for women.
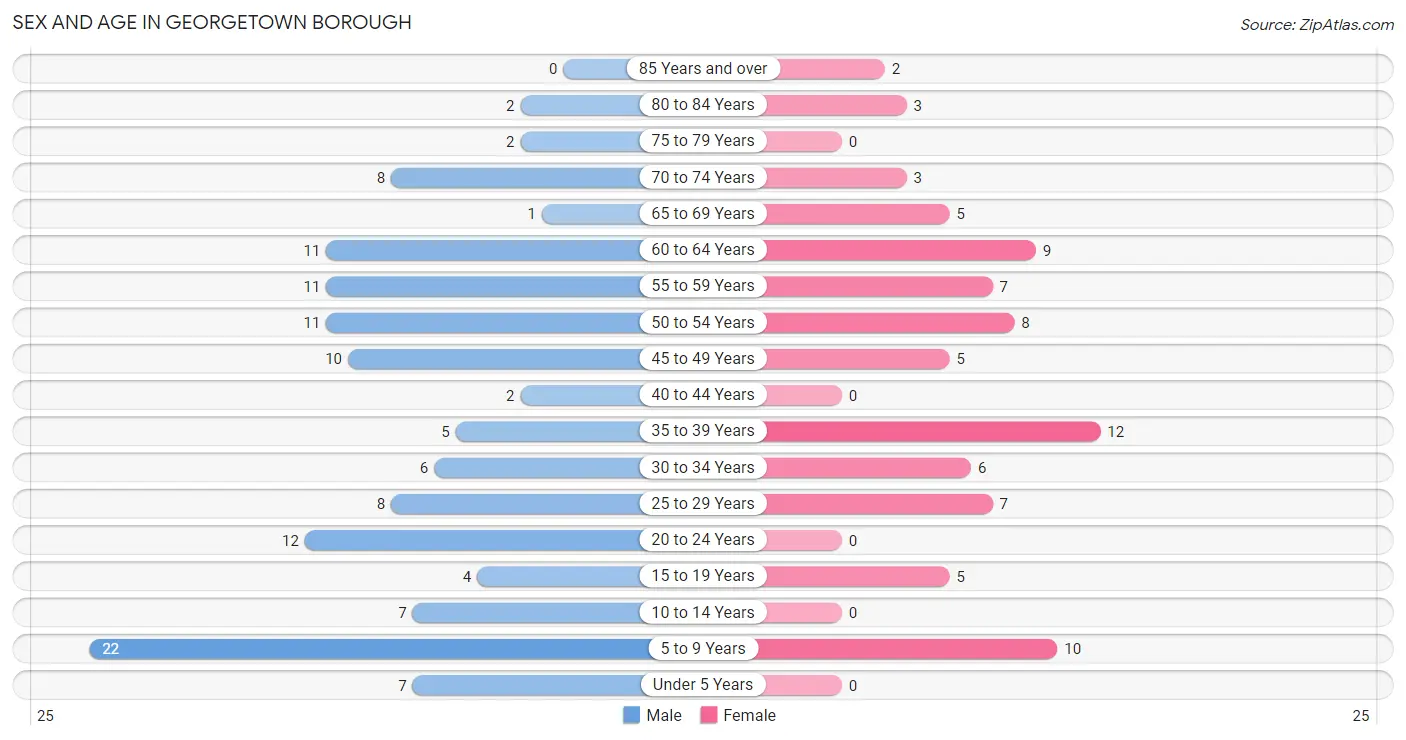
| Age Bracket | Male | Female |
| Under 5 Years | 7 (5.4%) | 0 (0.0%) |
| 5 to 9 Years | 22 (17.1%) | 10 (12.2%) |
| 10 to 14 Years | 7 (5.4%) | 0 (0.0%) |
| 15 to 19 Years | 4 (3.1%) | 5 (6.1%) |
| 20 to 24 Years | 12 (9.3%) | 0 (0.0%) |
| 25 to 29 Years | 8 (6.2%) | 7 (8.5%) |
| 30 to 34 Years | 6 (4.6%) | 6 (7.3%) |
| 35 to 39 Years | 5 (3.9%) | 12 (14.6%) |
| 40 to 44 Years | 2 (1.5%) | 0 (0.0%) |
| 45 to 49 Years | 10 (7.7%) | 5 (6.1%) |
| 50 to 54 Years | 11 (8.5%) | 8 (9.8%) |
| 55 to 59 Years | 11 (8.5%) | 7 (8.5%) |
| 60 to 64 Years | 11 (8.5%) | 9 (11.0%) |
| 65 to 69 Years | 1 (0.8%) | 5 (6.1%) |
| 70 to 74 Years | 8 (6.2%) | 3 (3.7%) |
| 75 to 79 Years | 2 (1.5%) | 0 (0.0%) |
| 80 to 84 Years | 2 (1.5%) | 3 (3.7%) |
| 85 Years and over | 0 (0.0%) | 2 (2.4%) |
| Total | 129 (100.0%) | 82 (100.0%) |
Families and Households in Georgetown borough
Median Family Size in Georgetown borough
The median family size in Georgetown borough is 3.03 persons per family, with married-couple families (51 | 82.3%) accounting for the largest median family size of 3.2 persons per family. On the other hand, single male/father families (5 | 8.1%) represent the smallest median family size with 2.00 persons per family.
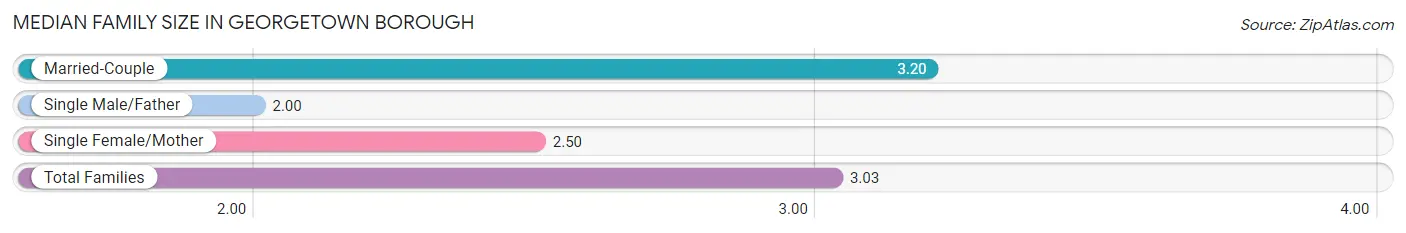
| Family Type | # Families | Family Size |
| Married-Couple | 51 (82.3%) | 3.20 |
| Single Male/Father | 5 (8.1%) | 2.00 |
| Single Female/Mother | 6 (9.7%) | 2.50 |
| Total Families | 62 (100.0%) | 3.03 |
Median Household Size in Georgetown borough
The median household size in Georgetown borough is 3.01 persons per household, with married-couple households (51 | 72.9%) accounting for the largest median household size of 3.41 persons per household. non-family households (8 | 11.4%) represent the smallest median household size with 1.25 persons per household.
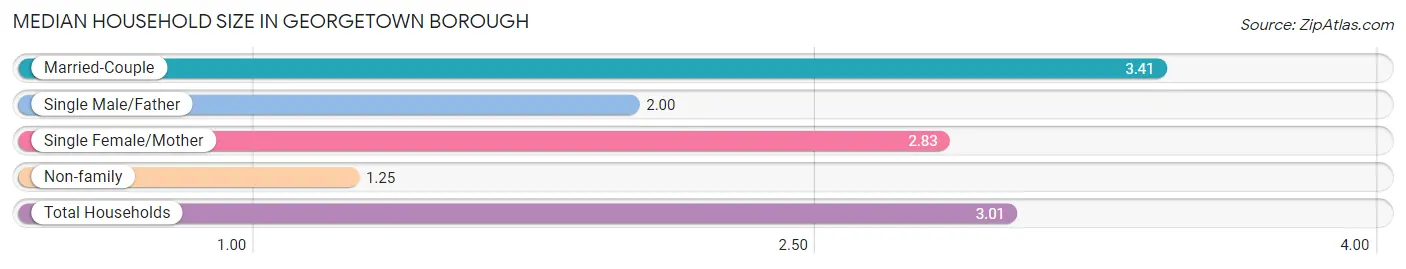
| Household Type | # Households | Household Size |
| Married-Couple | 51 (72.9%) | 3.41 |
| Single Male/Father | 5 (7.1%) | 2.00 |
| Single Female/Mother | 6 (8.6%) | 2.83 |
| Non-family | 8 (11.4%) | 1.25 |
| Total Households | 70 (100.0%) | 3.01 |
Household Size by Marriage Status in Georgetown borough
Out of a total of 70 households in Georgetown borough, 62 (88.6%) are family households, while 8 (11.4%) are nonfamily households. The most numerous type of family households are 2-person households, comprising 31, and the most common type of nonfamily households are 1-person households, comprising 6.
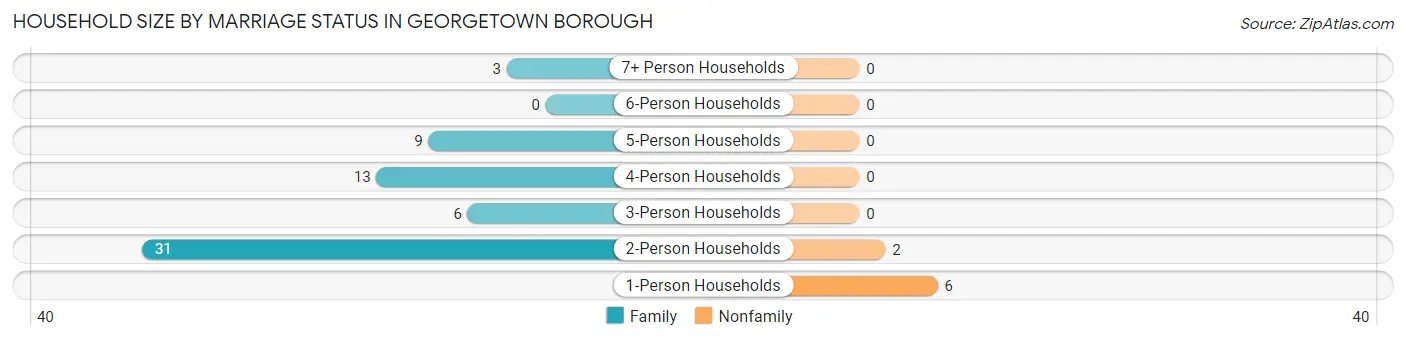
| Household Size | Family Households | Nonfamily Households |
| 1-Person Households | - | 6 (8.6%) |
| 2-Person Households | 31 (44.3%) | 2 (2.9%) |
| 3-Person Households | 6 (8.6%) | 0 (0.0%) |
| 4-Person Households | 13 (18.6%) | 0 (0.0%) |
| 5-Person Households | 9 (12.9%) | 0 (0.0%) |
| 6-Person Households | 0 (0.0%) | 0 (0.0%) |
| 7+ Person Households | 3 (4.3%) | 0 (0.0%) |
| Total | 62 (88.6%) | 8 (11.4%) |
Female Fertility in Georgetown borough
Fertility by Age in Georgetown borough
| Age Bracket | Women with Births | Births / 1,000 Women |
| 15 to 19 years | 0 (0.0%) | 0.0 |
| 20 to 34 years | 0 (0.0%) | 0.0 |
| 35 to 50 years | 0 (0.0%) | 0.0 |
| Total | 0 (0.0%) | 0.0 |
Fertility by Age by Marriage Status in Georgetown borough
| Age Bracket | Married | Unmarried |
| 15 to 19 years | 0 (0.0%) | 0 (0.0%) |
| 20 to 34 years | 0 (0.0%) | 0 (0.0%) |
| 35 to 50 years | 0 (0.0%) | 0 (0.0%) |
| Total | 0 (0.0%) | 0 (0.0%) |
Fertility by Education in Georgetown borough
| Educational Attainment | Women with Births | Births / 1,000 Women |
| Less than High School | 0 (0.0%) | 0.0 |
| High School Diploma | 0 (0.0%) | 0.0 |
| College or Associate's Degree | 0 (0.0%) | 0.0 |
| Bachelor's Degree | 0 (0.0%) | 0.0 |
| Graduate Degree | 0 (0.0%) | 0.0 |
| Total | 0 (0.0%) | 0.0 |
Fertility by Education by Marriage Status in Georgetown borough
| Educational Attainment | Married | Unmarried |
| Less than High School | 0 (0.0%) | 0 (0.0%) |
| High School Diploma | 0 (0.0%) | 0 (0.0%) |
| College or Associate's Degree | 0 (0.0%) | 0 (0.0%) |
| Bachelor's Degree | 0 (0.0%) | 0 (0.0%) |
| Graduate Degree | 0 (0.0%) | 0 (0.0%) |
| Total | 0 (0.0%) | 0 (0.0%) |
Employment Characteristics in Georgetown borough
Employment by Class of Employer in Georgetown borough
Among the 115 employed individuals in Georgetown borough, private company employees (80 | 69.6%), local government employees (15 | 13.0%), and not-for-profit organizations (13 | 11.3%) make up the most common classes of employment.
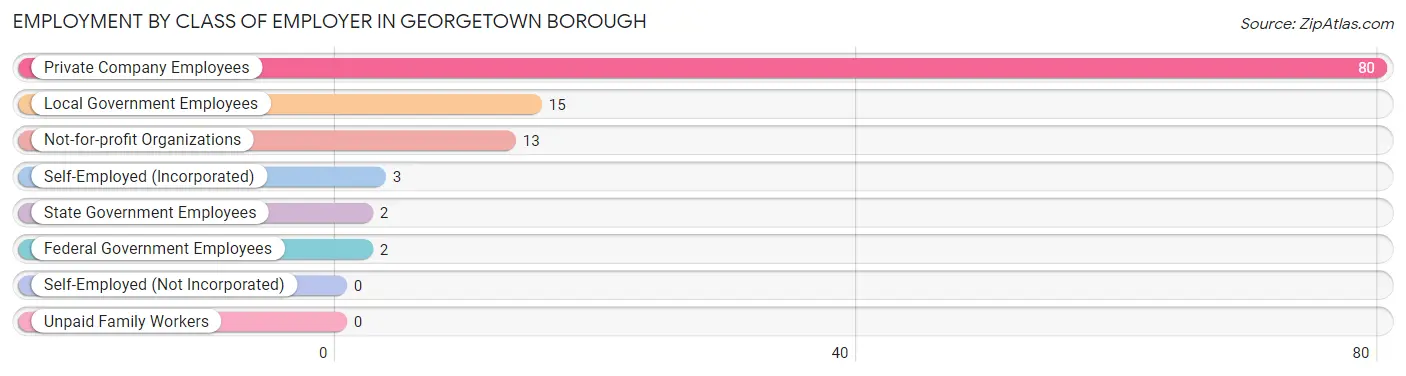
| Employer Class | # Employees | % Employees |
| Private Company Employees | 80 | 69.6% |
| Self-Employed (Incorporated) | 3 | 2.6% |
| Self-Employed (Not Incorporated) | 0 | 0.0% |
| Not-for-profit Organizations | 13 | 11.3% |
| Local Government Employees | 15 | 13.0% |
| State Government Employees | 2 | 1.7% |
| Federal Government Employees | 2 | 1.7% |
| Unpaid Family Workers | 0 | 0.0% |
| Total | 115 | 100.0% |
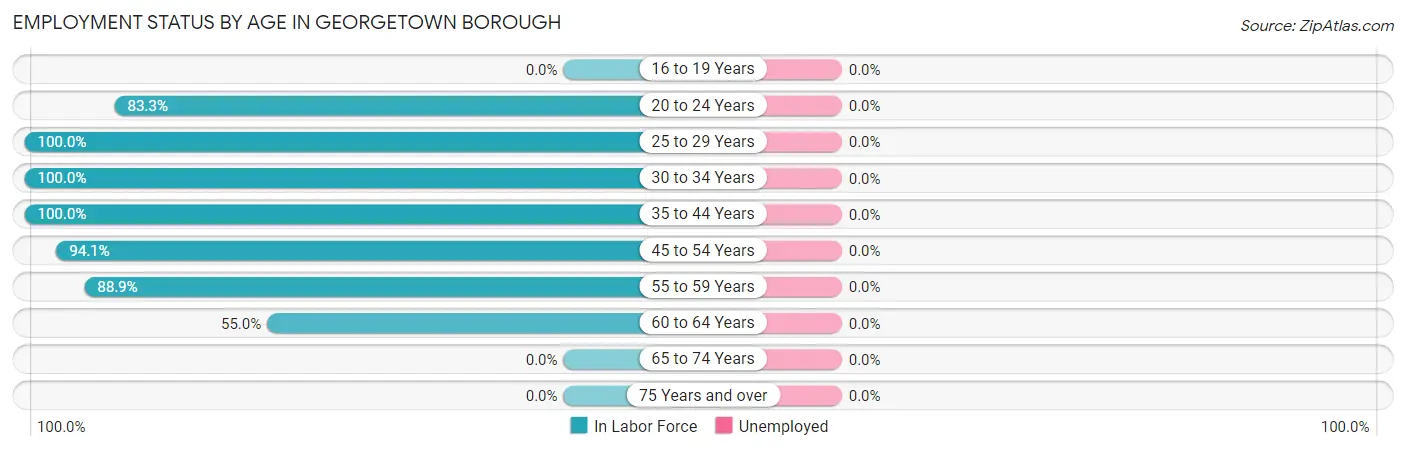
Employment Status by Age in Georgetown borough
| Age Bracket | In Labor Force | Unemployed |
| 16 to 19 Years | 0 (0.0%) | 0 (0.0%) |
| 20 to 24 Years | 10 (83.3%) | 0 (0.0%) |
| 25 to 29 Years | 15 (100.0%) | 0 (0.0%) |
| 30 to 34 Years | 12 (100.0%) | 0 (0.0%) |
| 35 to 44 Years | 19 (100.0%) | 0 (0.0%) |
| 45 to 54 Years | 32 (94.1%) | 0 (0.0%) |
| 55 to 59 Years | 16 (88.9%) | 0 (0.0%) |
| 60 to 64 Years | 11 (55.0%) | 0 (0.0%) |
| 65 to 74 Years | 0 (0.0%) | 0 (0.0%) |
| 75 Years and over | 0 (0.0%) | 0 (0.0%) |
| Total | 115 (71.4%) | 0 (0.0%) |
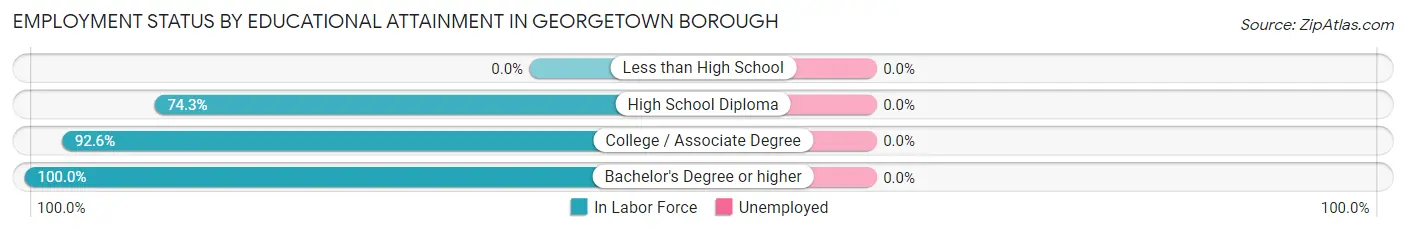
Employment Status by Educational Attainment in Georgetown borough
| Educational Attainment | In Labor Force | Unemployed |
| Less than High School | 0 (0.0%) | 0 (0.0%) |
| High School Diploma | 26 (74.3%) | 0 (0.0%) |
| College / Associate Degree | 50 (92.6%) | 0 (0.0%) |
| Bachelor's Degree or higher | 29 (100.0%) | 0 (0.0%) |
| Total | 105 (89.0%) | 0 (0.0%) |
Employment Occupations by Sex in Georgetown borough
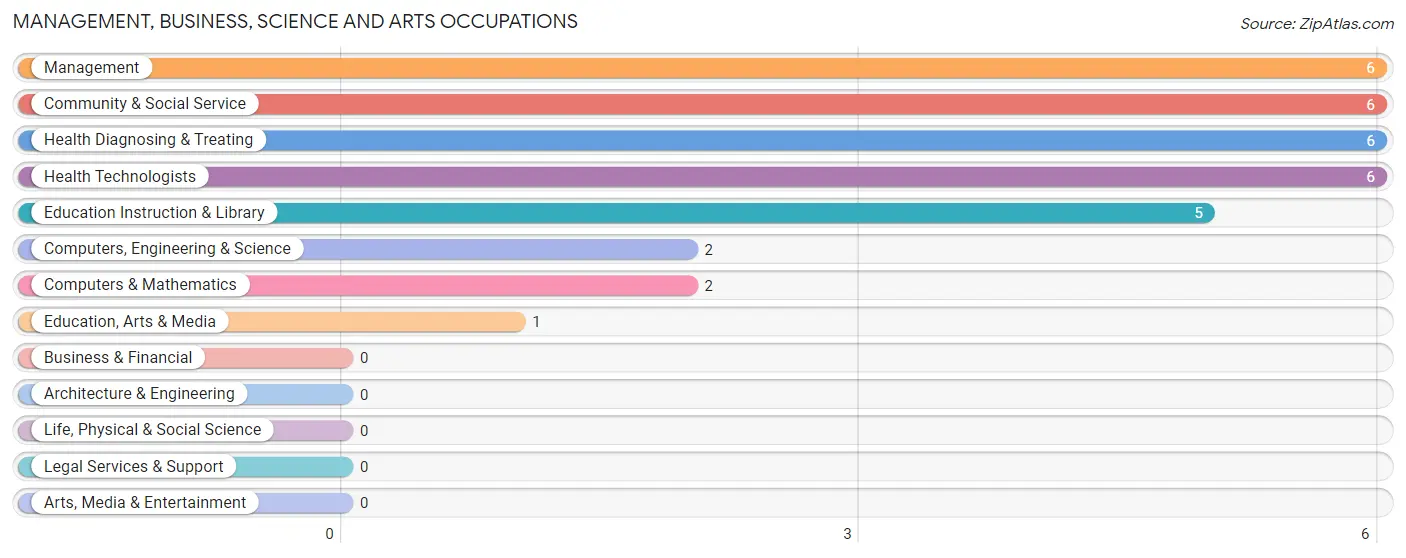
Management, Business, Science and Arts Occupations
The most common Management, Business, Science and Arts occupations in Georgetown borough are Management (6 | 5.2%), Community & Social Service (6 | 5.2%), Health Diagnosing & Treating (6 | 5.2%), Health Technologists (6 | 5.2%), and Education Instruction & Library (5 | 4.3%).
Management, Business, Science and Arts Occupations by Sex
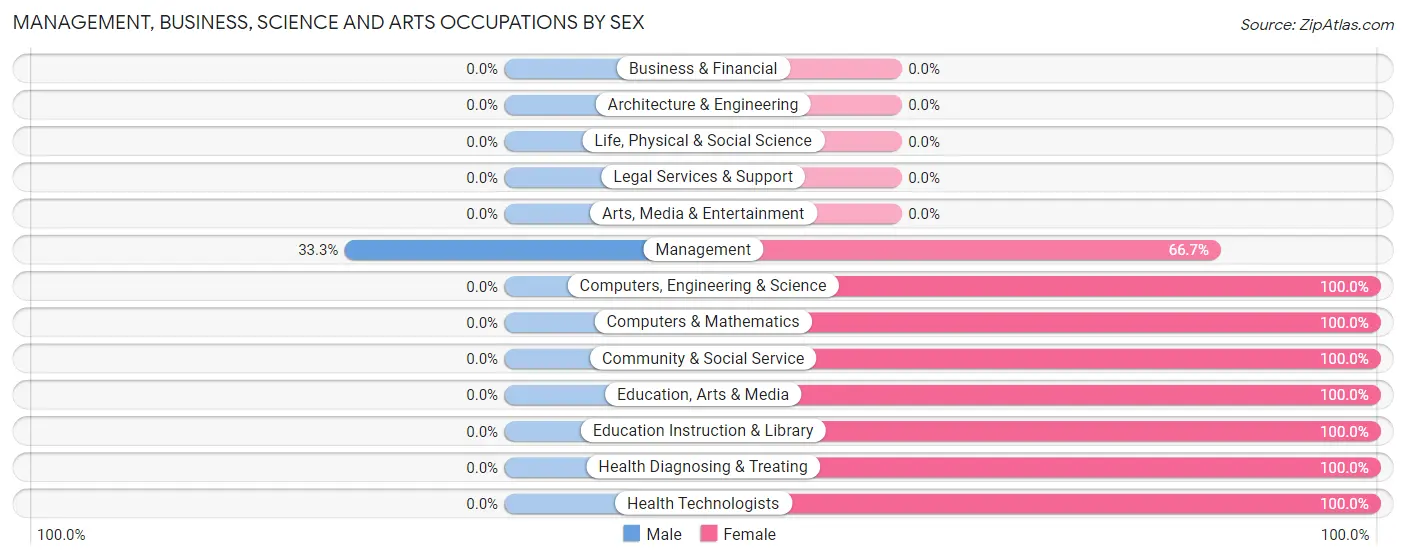
| Occupation | Male | Female |
| Management | 2 (33.3%) | 4 (66.7%) |
| Business & Financial | 0 (0.0%) | 0 (0.0%) |
| Computers, Engineering & Science | 0 (0.0%) | 2 (100.0%) |
| Computers & Mathematics | 0 (0.0%) | 2 (100.0%) |
| Architecture & Engineering | 0 (0.0%) | 0 (0.0%) |
| Life, Physical & Social Science | 0 (0.0%) | 0 (0.0%) |
| Community & Social Service | 0 (0.0%) | 6 (100.0%) |
| Education, Arts & Media | 0 (0.0%) | 1 (100.0%) |
| Legal Services & Support | 0 (0.0%) | 0 (0.0%) |
| Education Instruction & Library | 0 (0.0%) | 5 (100.0%) |
| Arts, Media & Entertainment | 0 (0.0%) | 0 (0.0%) |
| Health Diagnosing & Treating | 0 (0.0%) | 6 (100.0%) |
| Health Technologists | 0 (0.0%) | 6 (100.0%) |
| Total (Category) | 2 (10.0%) | 18 (90.0%) |
| Total (Overall) | 69 (60.0%) | 46 (40.0%) |
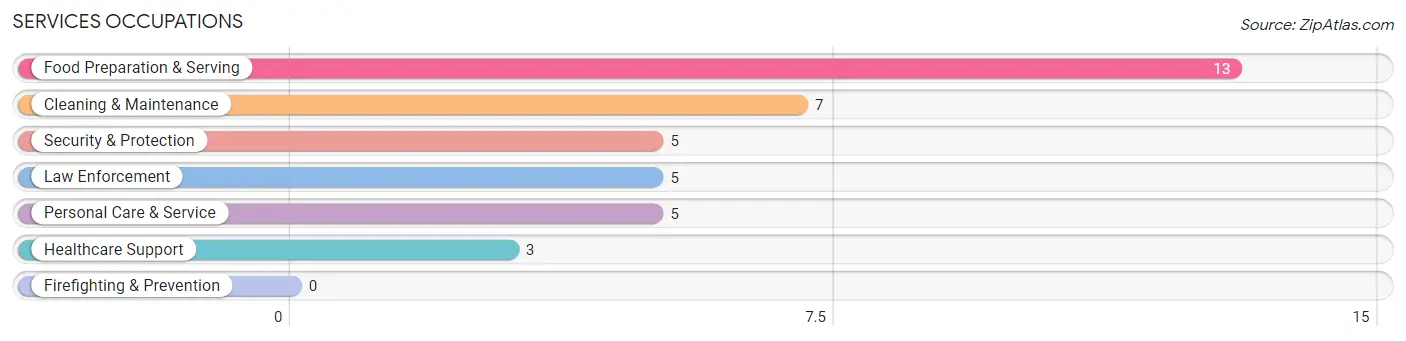
Services Occupations
The most common Services occupations in Georgetown borough are Food Preparation & Serving (13 | 11.3%), Cleaning & Maintenance (7 | 6.1%), Security & Protection (5 | 4.3%), Law Enforcement (5 | 4.3%), and Personal Care & Service (5 | 4.3%).
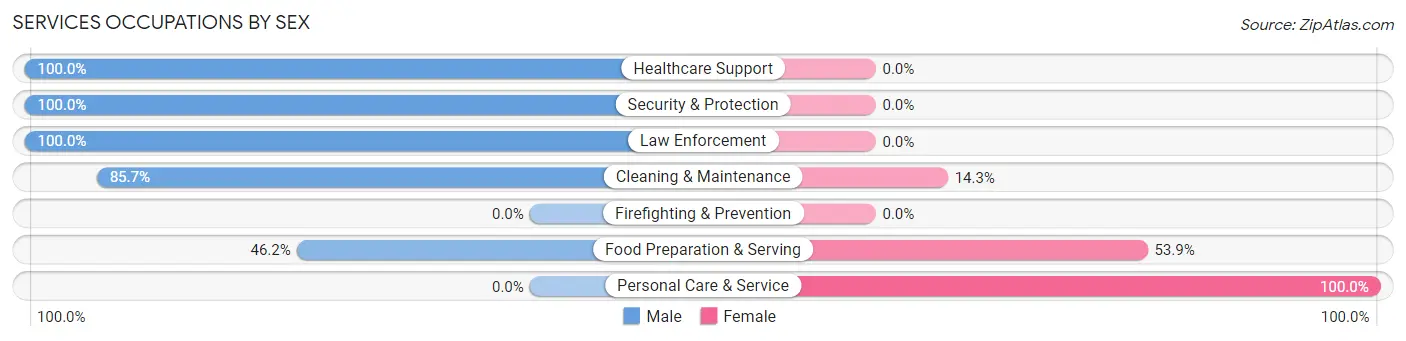
Services Occupations by Sex
Within the Services occupations in Georgetown borough, the most male-oriented occupations are Healthcare Support (100.0%), Security & Protection (100.0%), and Law Enforcement (100.0%), while the most female-oriented occupations are Personal Care & Service (100.0%), Food Preparation & Serving (53.8%), and Cleaning & Maintenance (14.3%).
| Occupation | Male | Female |
| Healthcare Support | 3 (100.0%) | 0 (0.0%) |
| Security & Protection | 5 (100.0%) | 0 (0.0%) |
| Firefighting & Prevention | 0 (0.0%) | 0 (0.0%) |
| Law Enforcement | 5 (100.0%) | 0 (0.0%) |
| Food Preparation & Serving | 6 (46.2%) | 7 (53.8%) |
| Cleaning & Maintenance | 6 (85.7%) | 1 (14.3%) |
| Personal Care & Service | 0 (0.0%) | 5 (100.0%) |
| Total (Category) | 20 (60.6%) | 13 (39.4%) |
| Total (Overall) | 69 (60.0%) | 46 (40.0%) |
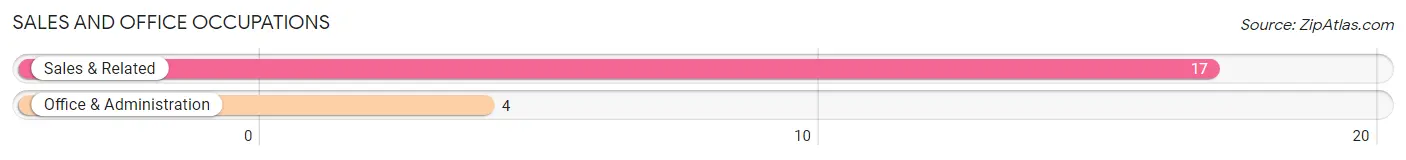
Sales and Office Occupations
The most common Sales and Office occupations in Georgetown borough are Sales & Related (17 | 14.8%), and Office & Administration (4 | 3.5%).
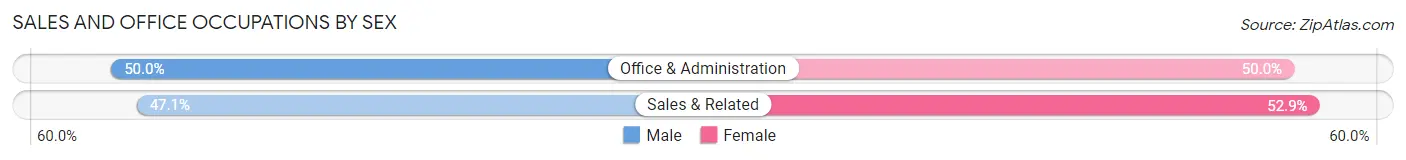
Sales and Office Occupations by Sex
| Occupation | Male | Female |
| Sales & Related | 8 (47.1%) | 9 (52.9%) |
| Office & Administration | 2 (50.0%) | 2 (50.0%) |
| Total (Category) | 10 (47.6%) | 11 (52.4%) |
| Total (Overall) | 69 (60.0%) | 46 (40.0%) |
Natural Resources, Construction and Maintenance Occupations
The most common Natural Resources, Construction and Maintenance occupations in Georgetown borough are Construction & Extraction (9 | 7.8%), Installation, Maintenance & Repair (3 | 2.6%), and Farming, Fishing & Forestry (2 | 1.7%).
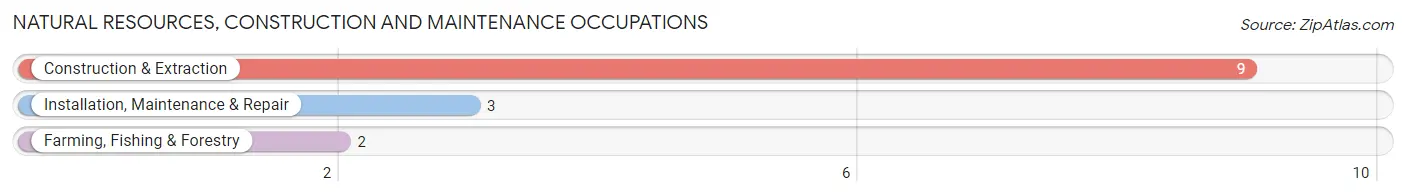
Natural Resources, Construction and Maintenance Occupations by Sex
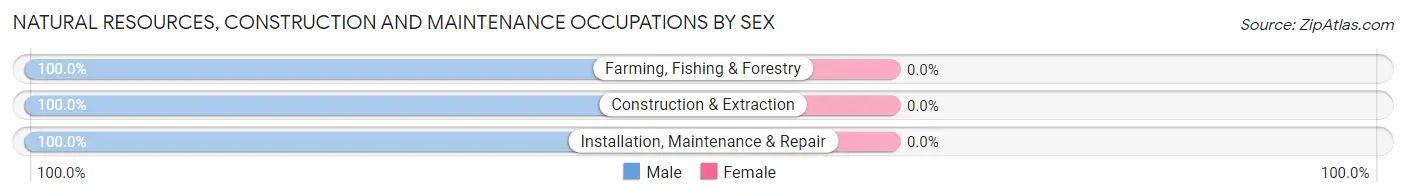
| Occupation | Male | Female |
| Farming, Fishing & Forestry | 2 (100.0%) | 0 (0.0%) |
| Construction & Extraction | 9 (100.0%) | 0 (0.0%) |
| Installation, Maintenance & Repair | 3 (100.0%) | 0 (0.0%) |
| Total (Category) | 14 (100.0%) | 0 (0.0%) |
| Total (Overall) | 69 (60.0%) | 46 (40.0%) |
Production, Transportation and Moving Occupations
The most common Production, Transportation and Moving occupations in Georgetown borough are Transportation (11 | 9.6%), Production (9 | 7.8%), and Material Moving (7 | 6.1%).
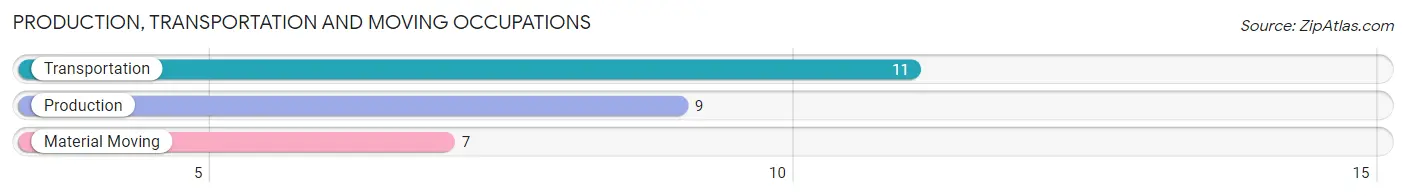
Production, Transportation and Moving Occupations by Sex
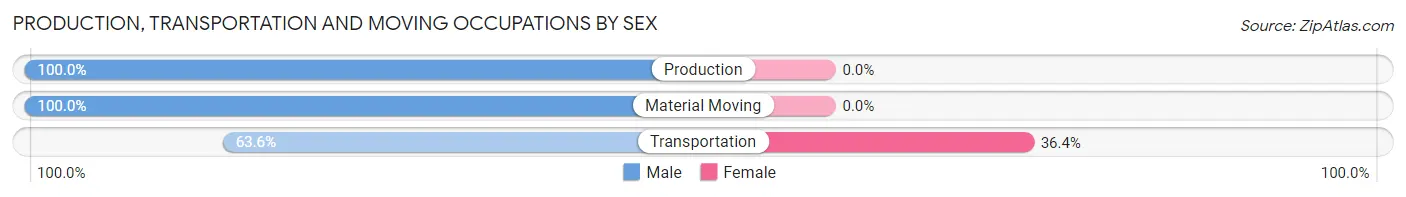
| Occupation | Male | Female |
| Production | 9 (100.0%) | 0 (0.0%) |
| Transportation | 7 (63.6%) | 4 (36.4%) |
| Material Moving | 7 (100.0%) | 0 (0.0%) |
| Total (Category) | 23 (85.2%) | 4 (14.8%) |
| Total (Overall) | 69 (60.0%) | 46 (40.0%) |
Employment Industries by Sex in Georgetown borough
Employment Industries in Georgetown borough
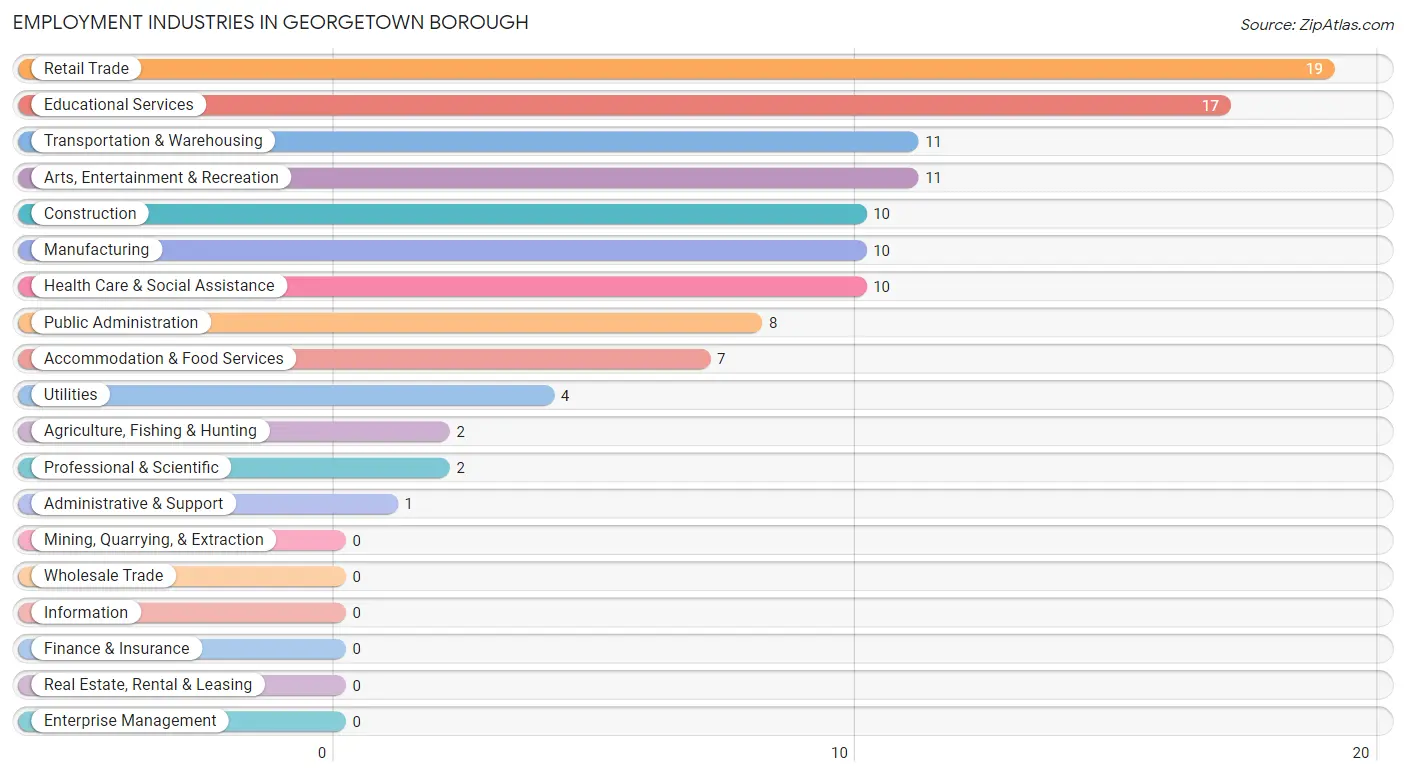
The major employment industries in Georgetown borough include Retail Trade (19 | 16.5%), Educational Services (17 | 14.8%), Transportation & Warehousing (11 | 9.6%), Arts, Entertainment & Recreation (11 | 9.6%), and Construction (10 | 8.7%).
Employment Industries by Sex in Georgetown borough
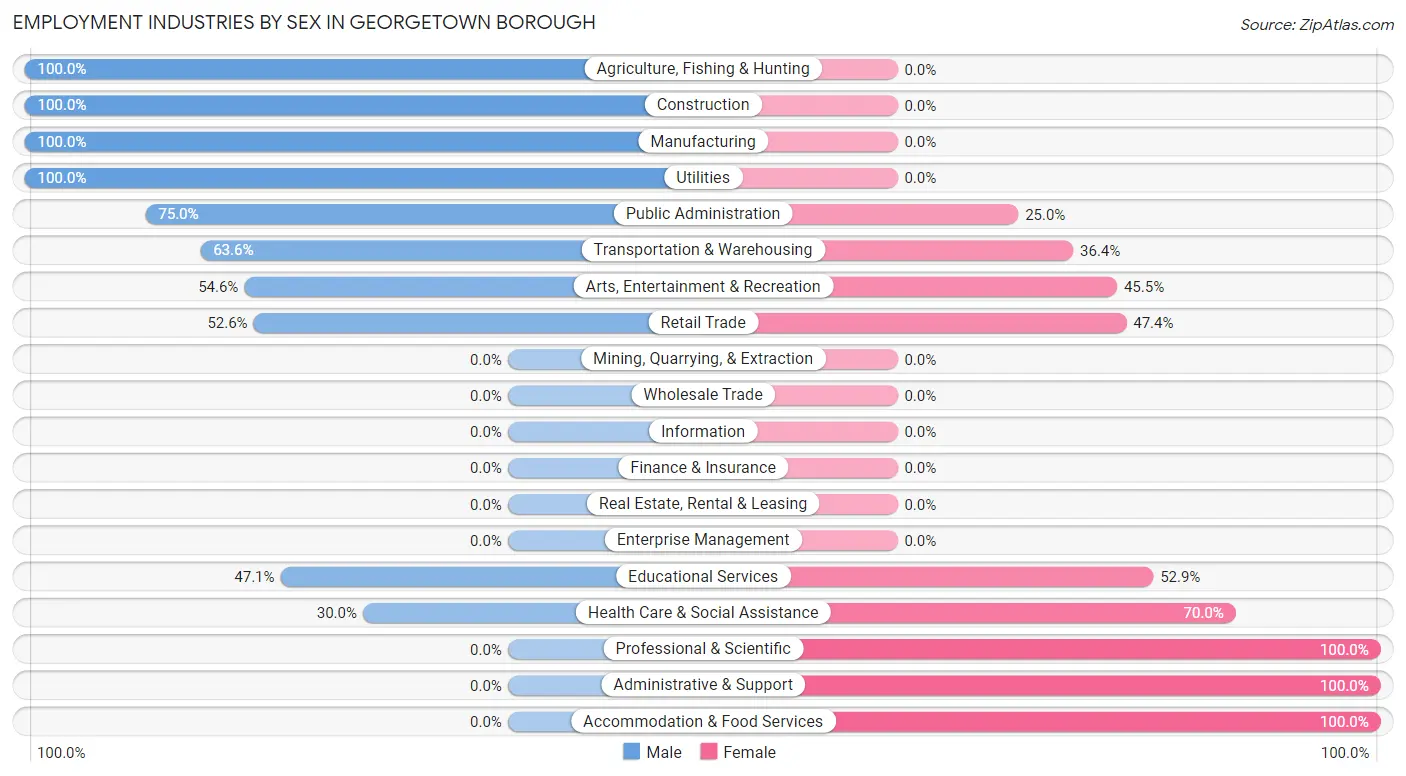
The Georgetown borough industries that see more men than women are Agriculture, Fishing & Hunting (100.0%), Construction (100.0%), and Manufacturing (100.0%), whereas the industries that tend to have a higher number of women are Professional & Scientific (100.0%), Administrative & Support (100.0%), and Accommodation & Food Services (100.0%).
| Industry | Male | Female |
| Agriculture, Fishing & Hunting | 2 (100.0%) | 0 (0.0%) |
| Mining, Quarrying, & Extraction | 0 (0.0%) | 0 (0.0%) |
| Construction | 10 (100.0%) | 0 (0.0%) |
| Manufacturing | 10 (100.0%) | 0 (0.0%) |
| Wholesale Trade | 0 (0.0%) | 0 (0.0%) |
| Retail Trade | 10 (52.6%) | 9 (47.4%) |
| Transportation & Warehousing | 7 (63.6%) | 4 (36.4%) |
| Utilities | 4 (100.0%) | 0 (0.0%) |
| Information | 0 (0.0%) | 0 (0.0%) |
| Finance & Insurance | 0 (0.0%) | 0 (0.0%) |
| Real Estate, Rental & Leasing | 0 (0.0%) | 0 (0.0%) |
| Professional & Scientific | 0 (0.0%) | 2 (100.0%) |
| Enterprise Management | 0 (0.0%) | 0 (0.0%) |
| Administrative & Support | 0 (0.0%) | 1 (100.0%) |
| Educational Services | 8 (47.1%) | 9 (52.9%) |
| Health Care & Social Assistance | 3 (30.0%) | 7 (70.0%) |
| Arts, Entertainment & Recreation | 6 (54.5%) | 5 (45.5%) |
| Accommodation & Food Services | 0 (0.0%) | 7 (100.0%) |
| Public Administration | 6 (75.0%) | 2 (25.0%) |
| Total | 69 (60.0%) | 46 (40.0%) |
Education in Georgetown borough
School Enrollment in Georgetown borough
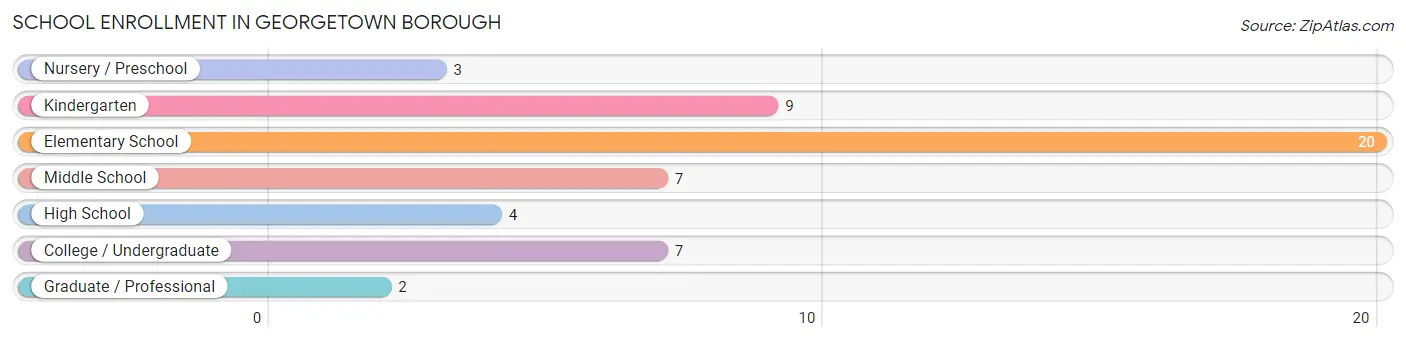
The most common levels of schooling among the 52 students in Georgetown borough are elementary school (20 | 38.5%), kindergarten (9 | 17.3%), and middle school (7 | 13.5%).
| School Level | # Students | % Students |
| Nursery / Preschool | 3 | 5.8% |
| Kindergarten | 9 | 17.3% |
| Elementary School | 20 | 38.5% |
| Middle School | 7 | 13.5% |
| High School | 4 | 7.7% |
| College / Undergraduate | 7 | 13.5% |
| Graduate / Professional | 2 | 3.8% |
| Total | 52 | 100.0% |
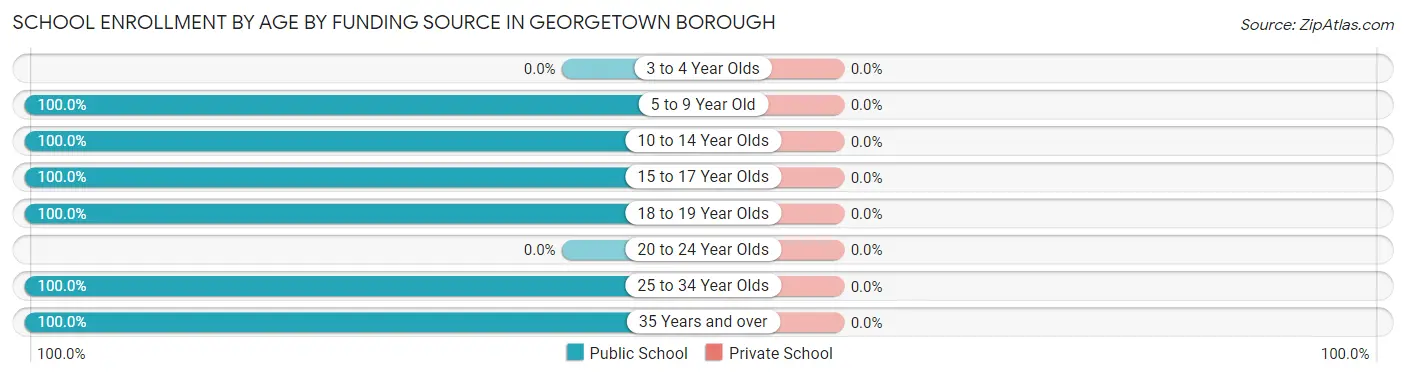
School Enrollment by Age by Funding Source in Georgetown borough
| Age Bracket | Public School | Private School |
| 3 to 4 Year Olds | 0 (0.0%) | 0 (0.0%) |
| 5 to 9 Year Old | 32 (100.0%) | 0 (0.0%) |
| 10 to 14 Year Olds | 7 (100.0%) | 0 (0.0%) |
| 15 to 17 Year Olds | 4 (100.0%) | 0 (0.0%) |
| 18 to 19 Year Olds | 5 (100.0%) | 0 (0.0%) |
| 20 to 24 Year Olds | 0 (0.0%) | 0 (0.0%) |
| 25 to 34 Year Olds | 2 (100.0%) | 0 (0.0%) |
| 35 Years and over | 2 (100.0%) | 0 (0.0%) |
| Total | 52 (100.0%) | 0 (0.0%) |
Educational Attainment by Field of Study in Georgetown borough
Science & technology (10 | 29.4%), computers & mathematics (5 | 14.7%), education (5 | 14.7%), liberal arts & history (5 | 14.7%), and communications (4 | 11.8%) are the most common fields of study among 34 individuals in Georgetown borough who have obtained a bachelor's degree or higher.
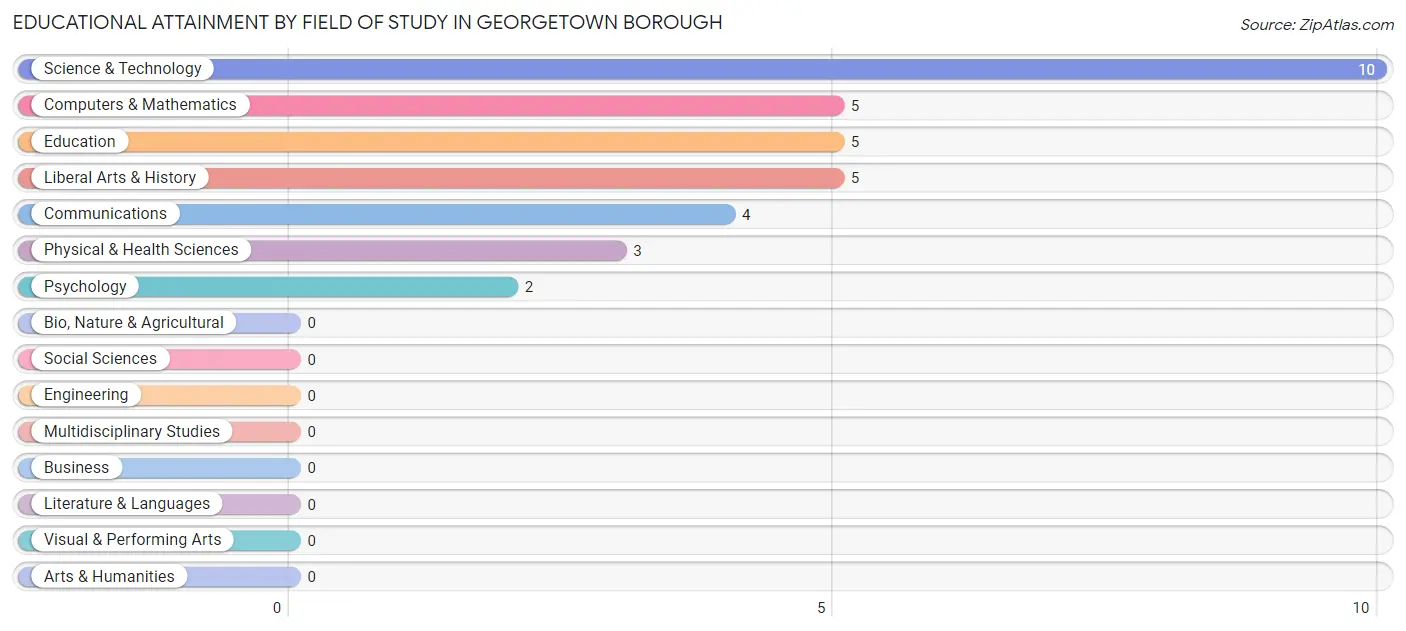
| Field of Study | # Graduates | % Graduates |
| Computers & Mathematics | 5 | 14.7% |
| Bio, Nature & Agricultural | 0 | 0.0% |
| Physical & Health Sciences | 3 | 8.8% |
| Psychology | 2 | 5.9% |
| Social Sciences | 0 | 0.0% |
| Engineering | 0 | 0.0% |
| Multidisciplinary Studies | 0 | 0.0% |
| Science & Technology | 10 | 29.4% |
| Business | 0 | 0.0% |
| Education | 5 | 14.7% |
| Literature & Languages | 0 | 0.0% |
| Liberal Arts & History | 5 | 14.7% |
| Visual & Performing Arts | 0 | 0.0% |
| Communications | 4 | 11.8% |
| Arts & Humanities | 0 | 0.0% |
| Total | 34 | 100.0% |
Transportation & Commute in Georgetown borough
Vehicle Availability by Sex in Georgetown borough
The most prevalent vehicle ownership categories in Georgetown borough are males with 3 vehicles (21, accounting for 30.4%) and females with 3 vehicles (4, making up 45.7%).
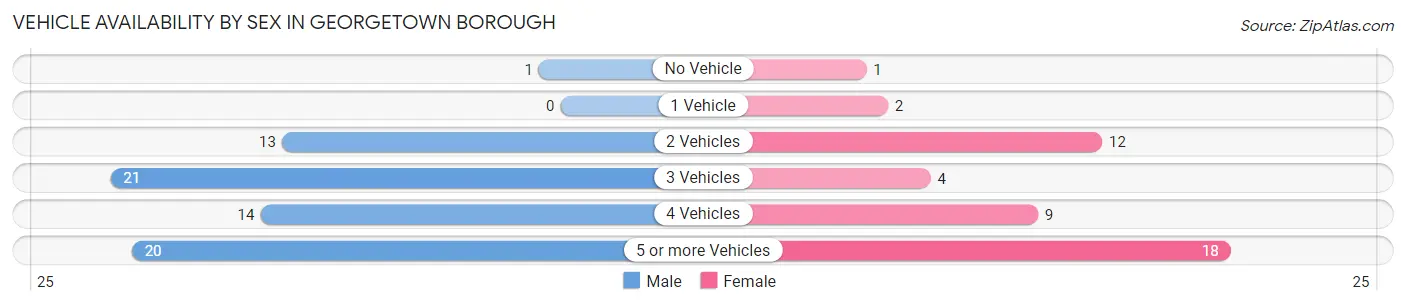
| Vehicles Available | Male | Female |
| No Vehicle | 1 (1.5%) | 1 (2.2%) |
| 1 Vehicle | 0 (0.0%) | 2 (4.3%) |
| 2 Vehicles | 13 (18.8%) | 12 (26.1%) |
| 3 Vehicles | 21 (30.4%) | 4 (8.7%) |
| 4 Vehicles | 14 (20.3%) | 9 (19.6%) |
| 5 or more Vehicles | 20 (29.0%) | 18 (39.1%) |
| Total | 69 (100.0%) | 46 (100.0%) |
Commute Time in Georgetown borough
The most frequently occuring commute durations in Georgetown borough are 20 to 24 minutes (23 commuters, 21.5%), 35 to 39 minutes (22 commuters, 20.6%), and 30 to 34 minutes (19 commuters, 17.8%).
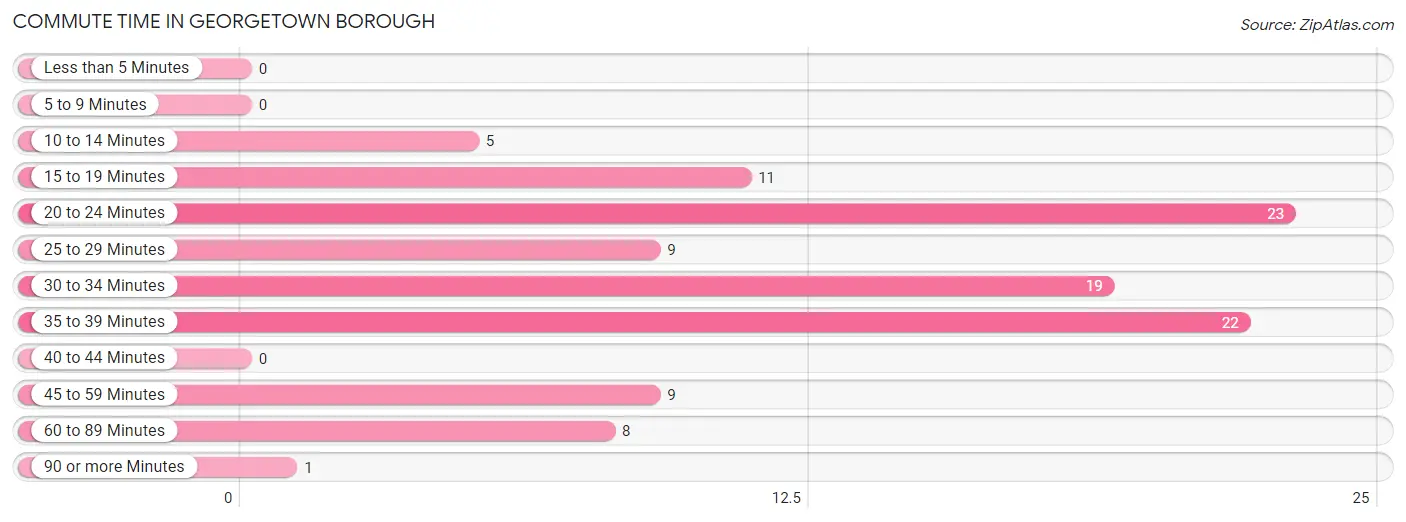
| Commute Time | # Commuters | % Commuters |
| Less than 5 Minutes | 0 | 0.0% |
| 5 to 9 Minutes | 0 | 0.0% |
| 10 to 14 Minutes | 5 | 4.7% |
| 15 to 19 Minutes | 11 | 10.3% |
| 20 to 24 Minutes | 23 | 21.5% |
| 25 to 29 Minutes | 9 | 8.4% |
| 30 to 34 Minutes | 19 | 17.8% |
| 35 to 39 Minutes | 22 | 20.6% |
| 40 to 44 Minutes | 0 | 0.0% |
| 45 to 59 Minutes | 9 | 8.4% |
| 60 to 89 Minutes | 8 | 7.5% |
| 90 or more Minutes | 1 | 0.9% |
Commute Time by Sex in Georgetown borough
The most common commute times in Georgetown borough are 20 to 24 minutes (18 commuters, 26.9%) for males and 30 to 34 minutes (14 commuters, 35.0%) for females.
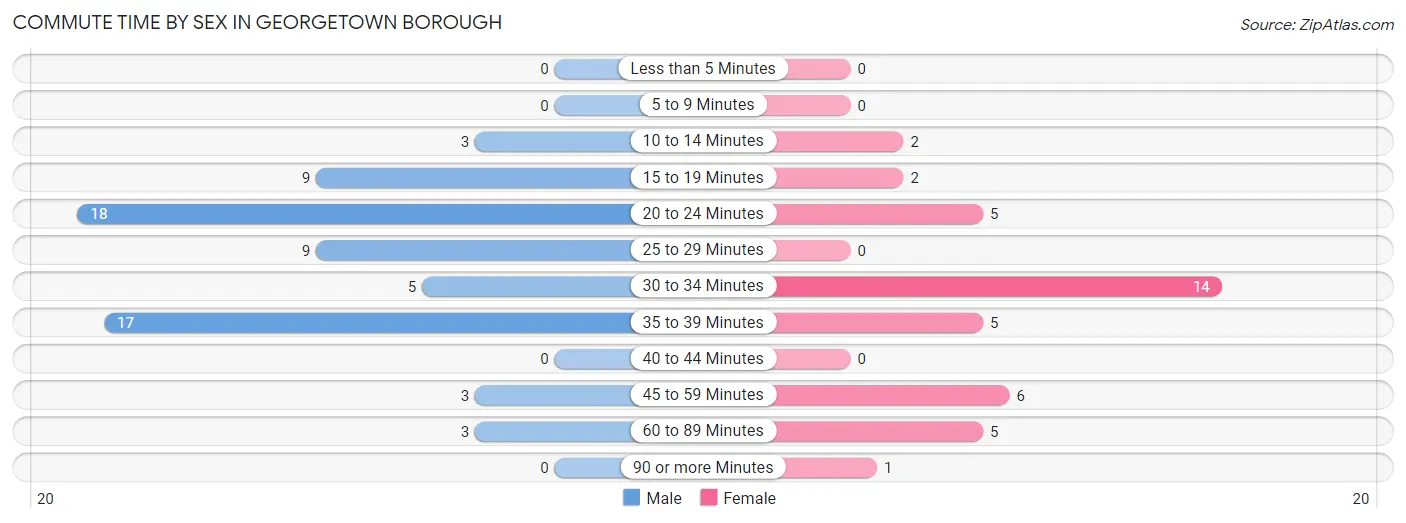
| Commute Time | Male | Female |
| Less than 5 Minutes | 0 (0.0%) | 0 (0.0%) |
| 5 to 9 Minutes | 0 (0.0%) | 0 (0.0%) |
| 10 to 14 Minutes | 3 (4.5%) | 2 (5.0%) |
| 15 to 19 Minutes | 9 (13.4%) | 2 (5.0%) |
| 20 to 24 Minutes | 18 (26.9%) | 5 (12.5%) |
| 25 to 29 Minutes | 9 (13.4%) | 0 (0.0%) |
| 30 to 34 Minutes | 5 (7.5%) | 14 (35.0%) |
| 35 to 39 Minutes | 17 (25.4%) | 5 (12.5%) |
| 40 to 44 Minutes | 0 (0.0%) | 0 (0.0%) |
| 45 to 59 Minutes | 3 (4.5%) | 6 (15.0%) |
| 60 to 89 Minutes | 3 (4.5%) | 5 (12.5%) |
| 90 or more Minutes | 0 (0.0%) | 1 (2.5%) |
Time of Departure to Work by Sex in Georgetown borough
The most frequent times of departure to work in Georgetown borough are 12:00 AM to 4:59 AM (12, 17.9%) for males and 12:00 PM to 3:59 PM (14, 35.0%) for females.
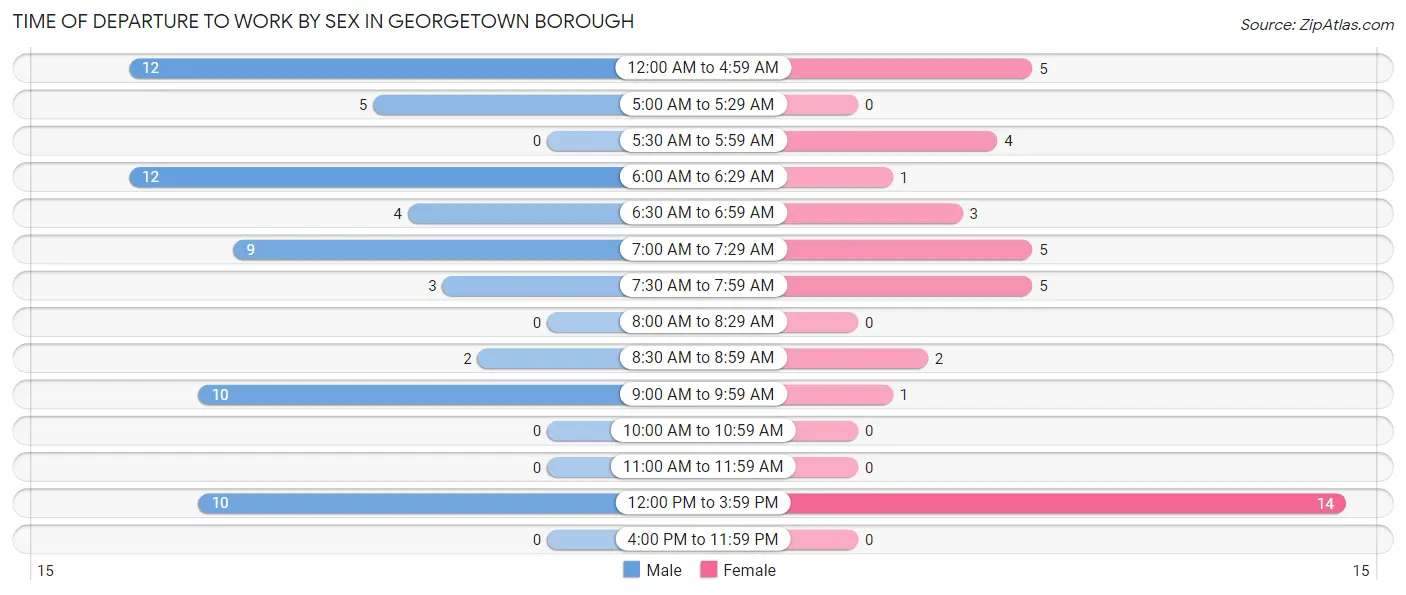
| Time of Departure | Male | Female |
| 12:00 AM to 4:59 AM | 12 (17.9%) | 5 (12.5%) |
| 5:00 AM to 5:29 AM | 5 (7.5%) | 0 (0.0%) |
| 5:30 AM to 5:59 AM | 0 (0.0%) | 4 (10.0%) |
| 6:00 AM to 6:29 AM | 12 (17.9%) | 1 (2.5%) |
| 6:30 AM to 6:59 AM | 4 (6.0%) | 3 (7.5%) |
| 7:00 AM to 7:29 AM | 9 (13.4%) | 5 (12.5%) |
| 7:30 AM to 7:59 AM | 3 (4.5%) | 5 (12.5%) |
| 8:00 AM to 8:29 AM | 0 (0.0%) | 0 (0.0%) |
| 8:30 AM to 8:59 AM | 2 (3.0%) | 2 (5.0%) |
| 9:00 AM to 9:59 AM | 10 (14.9%) | 1 (2.5%) |
| 10:00 AM to 10:59 AM | 0 (0.0%) | 0 (0.0%) |
| 11:00 AM to 11:59 AM | 0 (0.0%) | 0 (0.0%) |
| 12:00 PM to 3:59 PM | 10 (14.9%) | 14 (35.0%) |
| 4:00 PM to 11:59 PM | 0 (0.0%) | 0 (0.0%) |
| Total | 67 (100.0%) | 40 (100.0%) |
Housing Occupancy in Georgetown borough
Occupancy by Ownership in Georgetown borough
Of the total 70 dwellings in Georgetown borough, owner-occupied units account for 63 (90.0%), while renter-occupied units make up 7 (10.0%).
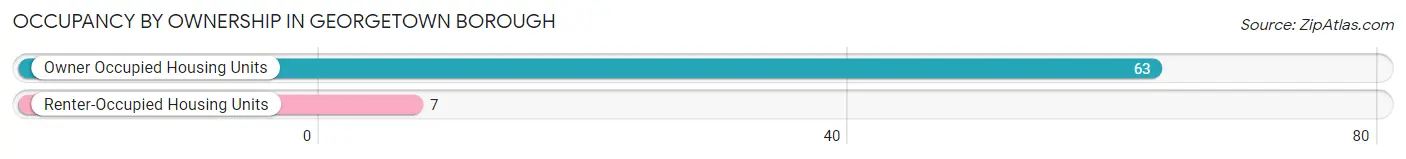
| Occupancy | # Housing Units | % Housing Units |
| Owner Occupied Housing Units | 63 | 90.0% |
| Renter-Occupied Housing Units | 7 | 10.0% |
| Total Occupied Housing Units | 70 | 100.0% |
Occupancy by Household Size in Georgetown borough
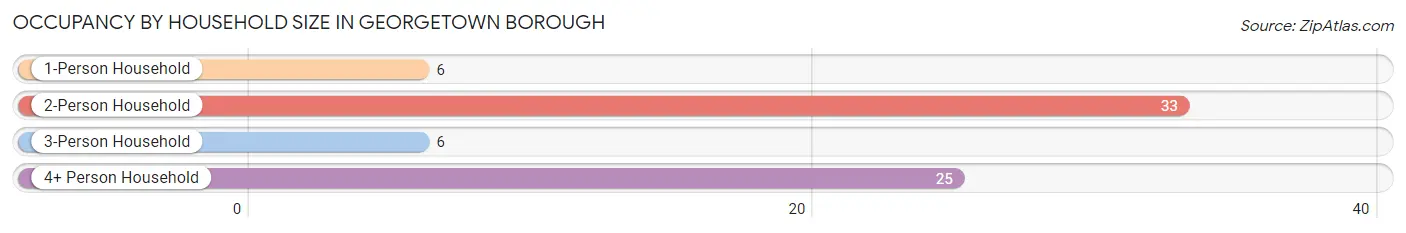
| Household Size | # Housing Units | % Housing Units |
| 1-Person Household | 6 | 8.6% |
| 2-Person Household | 33 | 47.1% |
| 3-Person Household | 6 | 8.6% |
| 4+ Person Household | 25 | 35.7% |
| Total Housing Units | 70 | 100.0% |
Occupancy by Ownership by Household Size in Georgetown borough
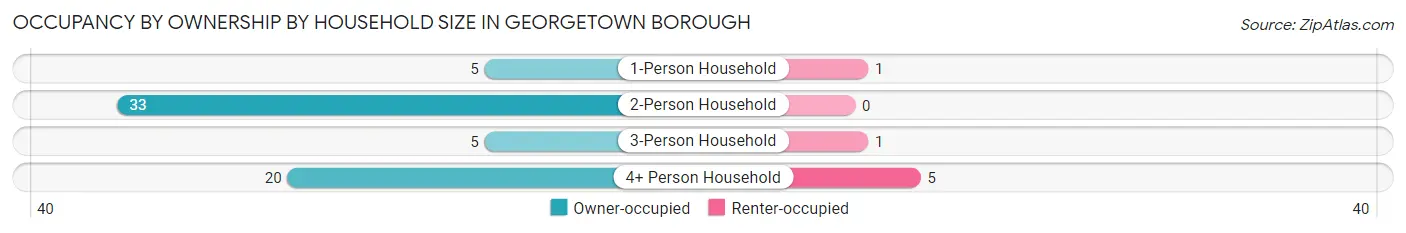
| Household Size | Owner-occupied | Renter-occupied |
| 1-Person Household | 5 (83.3%) | 1 (16.7%) |
| 2-Person Household | 33 (100.0%) | 0 (0.0%) |
| 3-Person Household | 5 (83.3%) | 1 (16.7%) |
| 4+ Person Household | 20 (80.0%) | 5 (20.0%) |
| Total Housing Units | 63 (90.0%) | 7 (10.0%) |
Occupancy by Educational Attainment in Georgetown borough
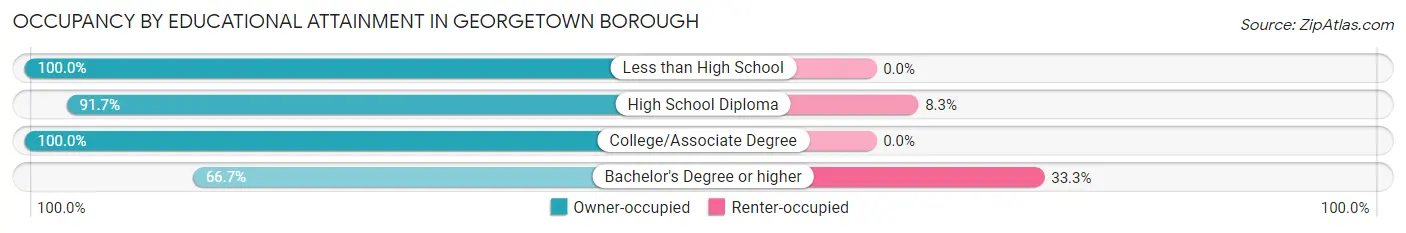
| Household Size | Owner-occupied | Renter-occupied |
| Less than High School | 4 (100.0%) | 0 (0.0%) |
| High School Diploma | 22 (91.7%) | 2 (8.3%) |
| College/Associate Degree | 27 (100.0%) | 0 (0.0%) |
| Bachelor's Degree or higher | 10 (66.7%) | 5 (33.3%) |
Occupancy by Age of Householder in Georgetown borough
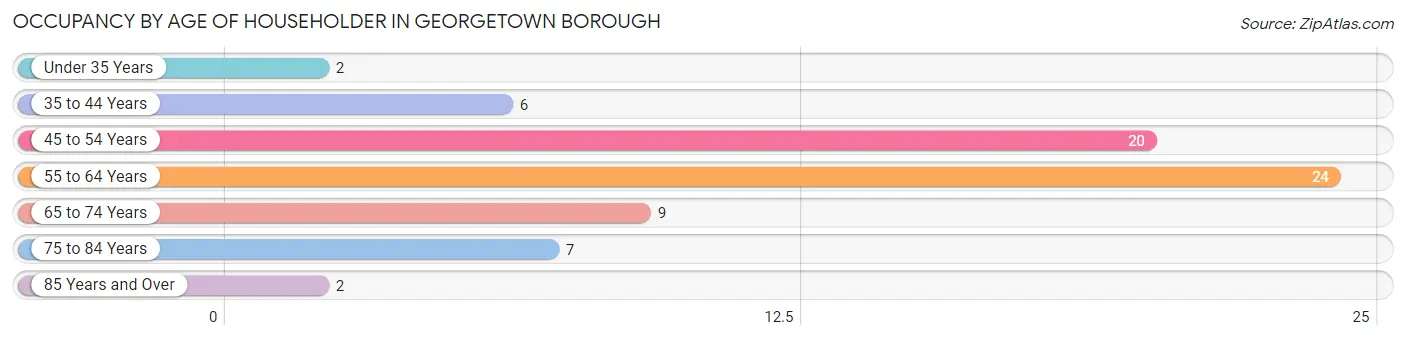
| Age Bracket | # Households | % Households |
| Under 35 Years | 2 | 2.9% |
| 35 to 44 Years | 6 | 8.6% |
| 45 to 54 Years | 20 | 28.6% |
| 55 to 64 Years | 24 | 34.3% |
| 65 to 74 Years | 9 | 12.9% |
| 75 to 84 Years | 7 | 10.0% |
| 85 Years and Over | 2 | 2.9% |
| Total | 70 | 100.0% |
Housing Finances in Georgetown borough
Median Income by Occupancy in Georgetown borough
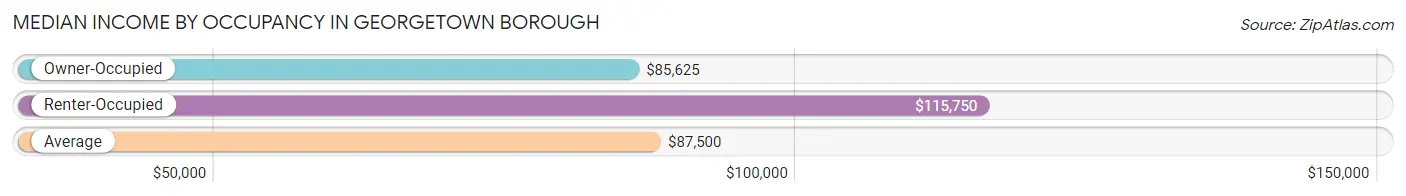
| Occupancy Type | # Households | Median Income |
| Owner-Occupied | 63 (90.0%) | $85,625 |
| Renter-Occupied | 7 (10.0%) | $115,750 |
| Average | 70 (100.0%) | $87,500 |
Occupancy by Householder Income Bracket in Georgetown borough
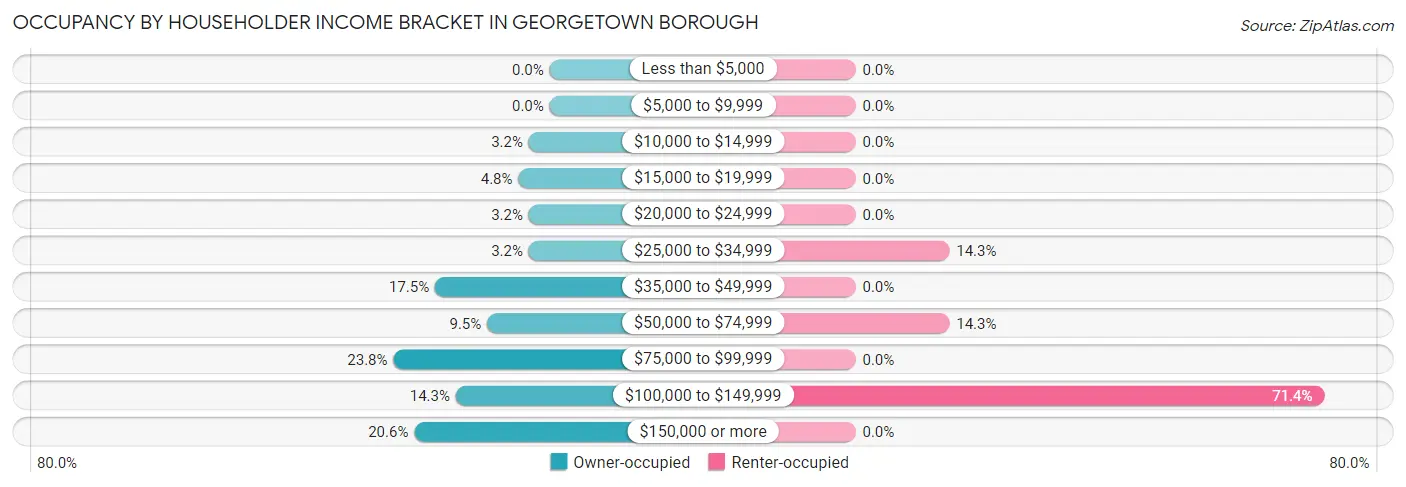
| Income Bracket | Owner-occupied | Renter-occupied |
| Less than $5,000 | 0 (0.0%) | 0 (0.0%) |
| $5,000 to $9,999 | 0 (0.0%) | 0 (0.0%) |
| $10,000 to $14,999 | 2 (3.2%) | 0 (0.0%) |
| $15,000 to $19,999 | 3 (4.8%) | 0 (0.0%) |
| $20,000 to $24,999 | 2 (3.2%) | 0 (0.0%) |
| $25,000 to $34,999 | 2 (3.2%) | 1 (14.3%) |
| $35,000 to $49,999 | 11 (17.5%) | 0 (0.0%) |
| $50,000 to $74,999 | 6 (9.5%) | 1 (14.3%) |
| $75,000 to $99,999 | 15 (23.8%) | 0 (0.0%) |
| $100,000 to $149,999 | 9 (14.3%) | 5 (71.4%) |
| $150,000 or more | 13 (20.6%) | 0 (0.0%) |
| Total | 63 (100.0%) | 7 (100.0%) |
Monthly Housing Cost Tiers in Georgetown borough
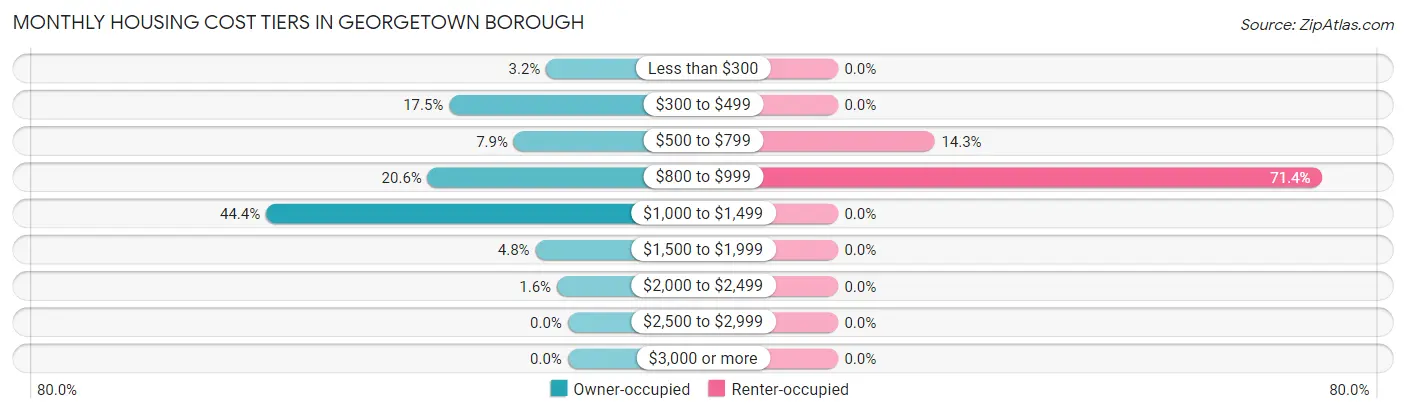
| Monthly Cost | Owner-occupied | Renter-occupied |
| Less than $300 | 2 (3.2%) | 0 (0.0%) |
| $300 to $499 | 11 (17.5%) | 0 (0.0%) |
| $500 to $799 | 5 (7.9%) | 1 (14.3%) |
| $800 to $999 | 13 (20.6%) | 5 (71.4%) |
| $1,000 to $1,499 | 28 (44.4%) | 0 (0.0%) |
| $1,500 to $1,999 | 3 (4.8%) | 0 (0.0%) |
| $2,000 to $2,499 | 1 (1.6%) | 0 (0.0%) |
| $2,500 to $2,999 | 0 (0.0%) | 0 (0.0%) |
| $3,000 or more | 0 (0.0%) | 0 (0.0%) |
| Total | 63 (100.0%) | 7 (100.0%) |
Physical Housing Characteristics in Georgetown borough
Housing Structures in Georgetown borough
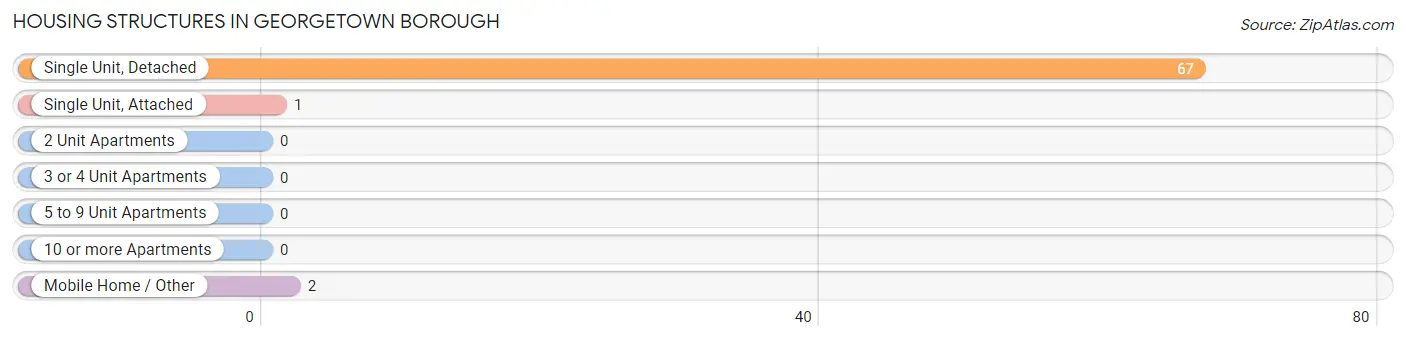
| Structure Type | # Housing Units | % Housing Units |
| Single Unit, Detached | 67 | 95.7% |
| Single Unit, Attached | 1 | 1.4% |
| 2 Unit Apartments | 0 | 0.0% |
| 3 or 4 Unit Apartments | 0 | 0.0% |
| 5 to 9 Unit Apartments | 0 | 0.0% |
| 10 or more Apartments | 0 | 0.0% |
| Mobile Home / Other | 2 | 2.9% |
| Total | 70 | 100.0% |
Housing Structures by Occupancy in Georgetown borough
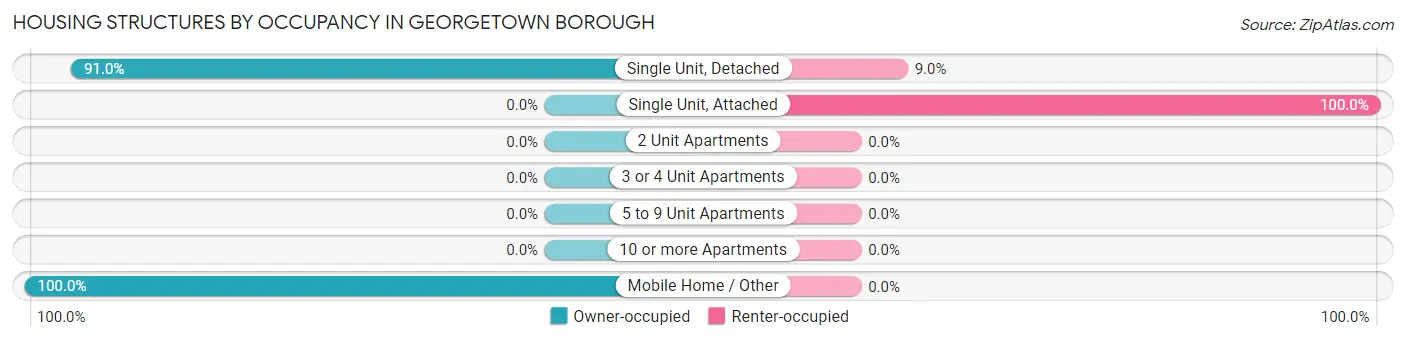
| Structure Type | Owner-occupied | Renter-occupied |
| Single Unit, Detached | 61 (91.0%) | 6 (9.0%) |
| Single Unit, Attached | 0 (0.0%) | 1 (100.0%) |
| 2 Unit Apartments | 0 (0.0%) | 0 (0.0%) |
| 3 or 4 Unit Apartments | 0 (0.0%) | 0 (0.0%) |
| 5 to 9 Unit Apartments | 0 (0.0%) | 0 (0.0%) |
| 10 or more Apartments | 0 (0.0%) | 0 (0.0%) |
| Mobile Home / Other | 2 (100.0%) | 0 (0.0%) |
| Total | 63 (90.0%) | 7 (10.0%) |
Housing Structures by Number of Rooms in Georgetown borough
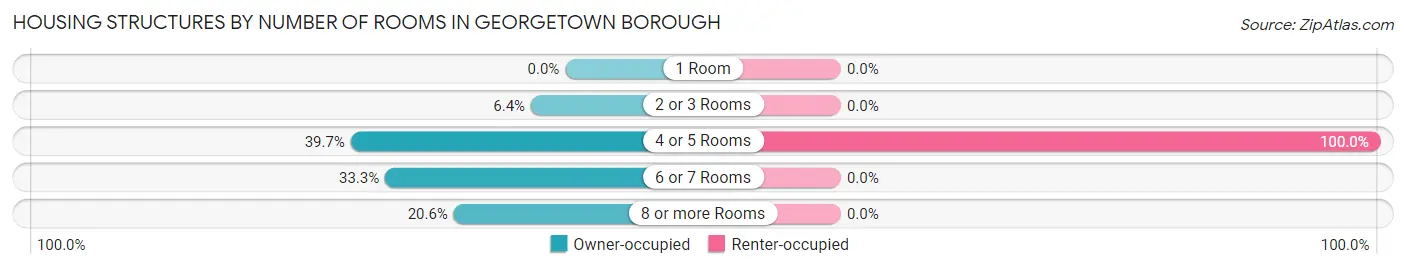
| Number of Rooms | Owner-occupied | Renter-occupied |
| 1 Room | 0 (0.0%) | 0 (0.0%) |
| 2 or 3 Rooms | 4 (6.4%) | 0 (0.0%) |
| 4 or 5 Rooms | 25 (39.7%) | 7 (100.0%) |
| 6 or 7 Rooms | 21 (33.3%) | 0 (0.0%) |
| 8 or more Rooms | 13 (20.6%) | 0 (0.0%) |
| Total | 63 (100.0%) | 7 (100.0%) |
Housing Structure by Heating Type in Georgetown borough
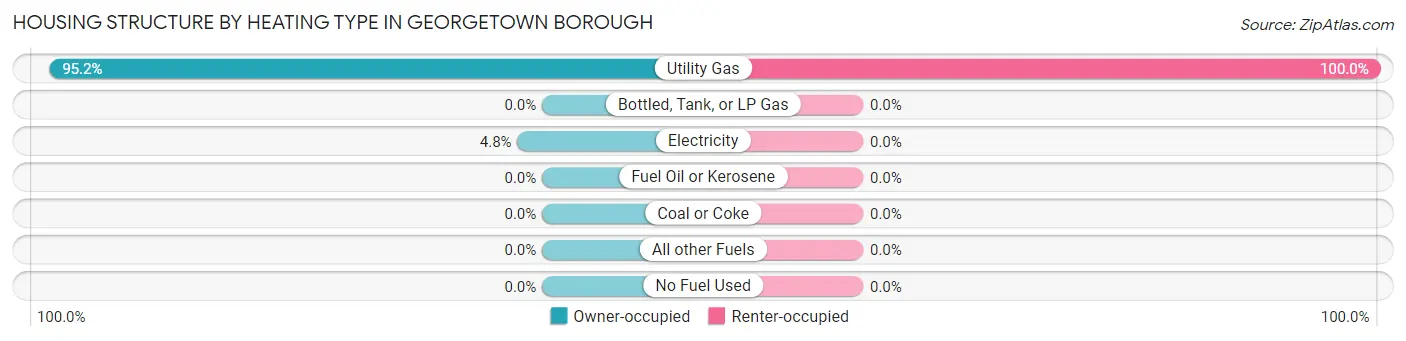
| Heating Type | Owner-occupied | Renter-occupied |
| Utility Gas | 60 (95.2%) | 7 (100.0%) |
| Bottled, Tank, or LP Gas | 0 (0.0%) | 0 (0.0%) |
| Electricity | 3 (4.8%) | 0 (0.0%) |
| Fuel Oil or Kerosene | 0 (0.0%) | 0 (0.0%) |
| Coal or Coke | 0 (0.0%) | 0 (0.0%) |
| All other Fuels | 0 (0.0%) | 0 (0.0%) |
| No Fuel Used | 0 (0.0%) | 0 (0.0%) |
| Total | 63 (100.0%) | 7 (100.0%) |
Household Vehicle Usage in Georgetown borough
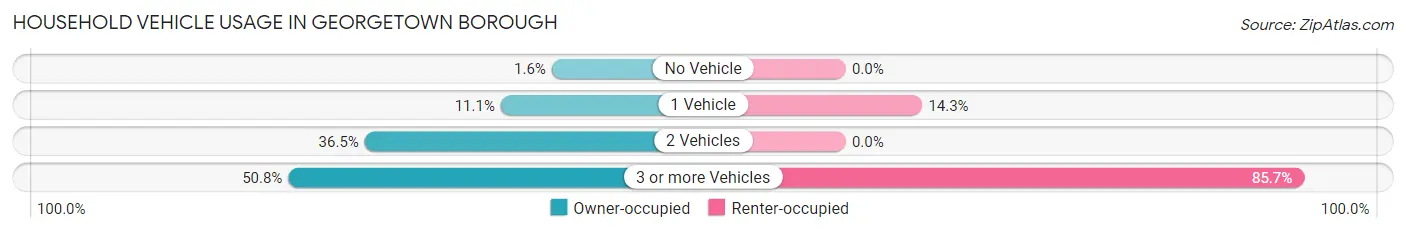
| Vehicles per Household | Owner-occupied | Renter-occupied |
| No Vehicle | 1 (1.6%) | 0 (0.0%) |
| 1 Vehicle | 7 (11.1%) | 1 (14.3%) |
| 2 Vehicles | 23 (36.5%) | 0 (0.0%) |
| 3 or more Vehicles | 32 (50.8%) | 6 (85.7%) |
| Total | 63 (100.0%) | 7 (100.0%) |
Real Estate & Mortgages in Georgetown borough
Real Estate and Mortgage Overview in Georgetown borough
| Characteristic | Without Mortgage | With Mortgage |
| Housing Units | 16 | 47 |
| Median Property Value | $118,800 | $184,400 |
| Median Household Income | $70,000 | $12 |
| Monthly Housing Costs | $360 | $0 |
| Real Estate Taxes | $1,250 | $2 |
Property Value by Mortgage Status in Georgetown borough
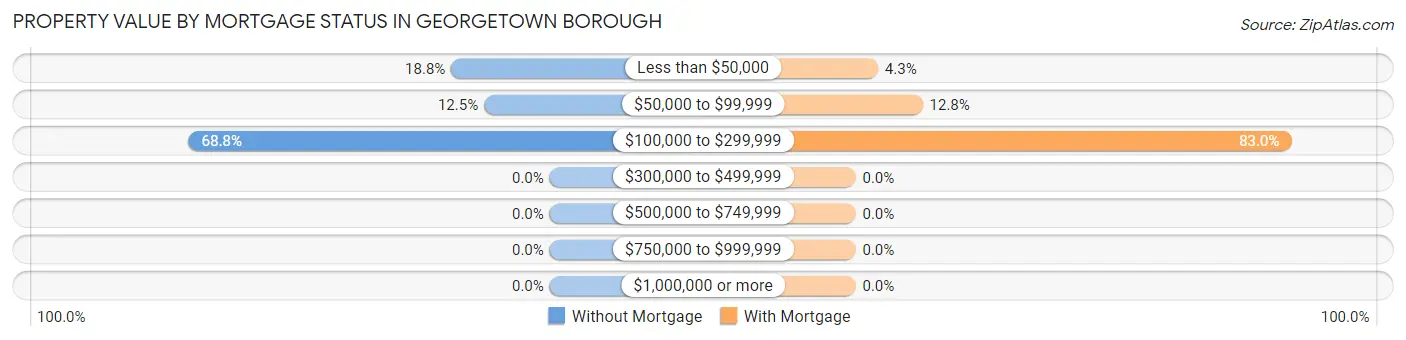
| Property Value | Without Mortgage | With Mortgage |
| Less than $50,000 | 3 (18.8%) | 2 (4.3%) |
| $50,000 to $99,999 | 2 (12.5%) | 6 (12.8%) |
| $100,000 to $299,999 | 11 (68.8%) | 39 (83.0%) |
| $300,000 to $499,999 | 0 (0.0%) | 0 (0.0%) |
| $500,000 to $749,999 | 0 (0.0%) | 0 (0.0%) |
| $750,000 to $999,999 | 0 (0.0%) | 0 (0.0%) |
| $1,000,000 or more | 0 (0.0%) | 0 (0.0%) |
| Total | 16 (100.0%) | 47 (100.0%) |
Household Income by Mortgage Status in Georgetown borough
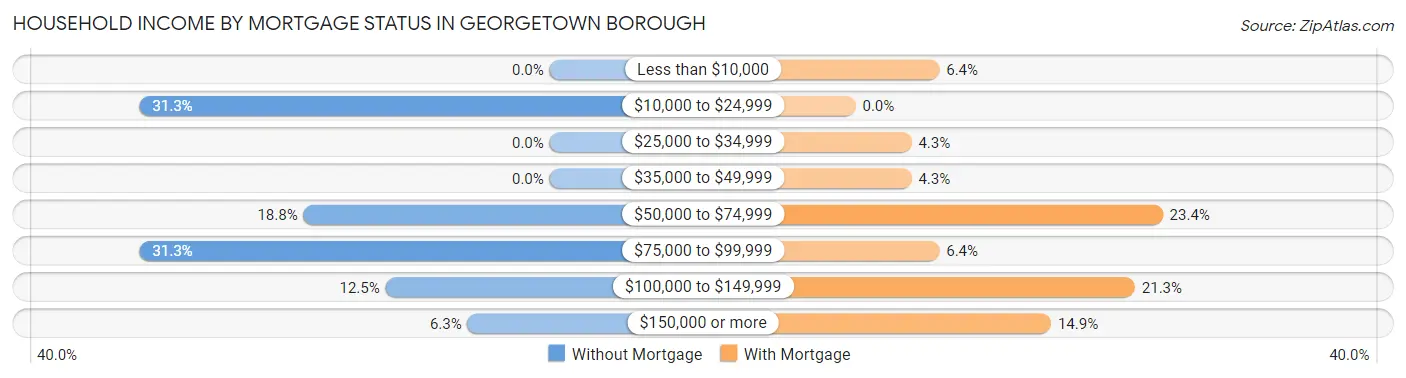
| Household Income | Without Mortgage | With Mortgage |
| Less than $10,000 | 0 (0.0%) | 3 (6.4%) |
| $10,000 to $24,999 | 5 (31.2%) | 0 (0.0%) |
| $25,000 to $34,999 | 0 (0.0%) | 2 (4.3%) |
| $35,000 to $49,999 | 0 (0.0%) | 2 (4.3%) |
| $50,000 to $74,999 | 3 (18.8%) | 11 (23.4%) |
| $75,000 to $99,999 | 5 (31.2%) | 3 (6.4%) |
| $100,000 to $149,999 | 2 (12.5%) | 10 (21.3%) |
| $150,000 or more | 1 (6.2%) | 7 (14.9%) |
| Total | 16 (100.0%) | 47 (100.0%) |
Property Value to Household Income Ratio in Georgetown borough
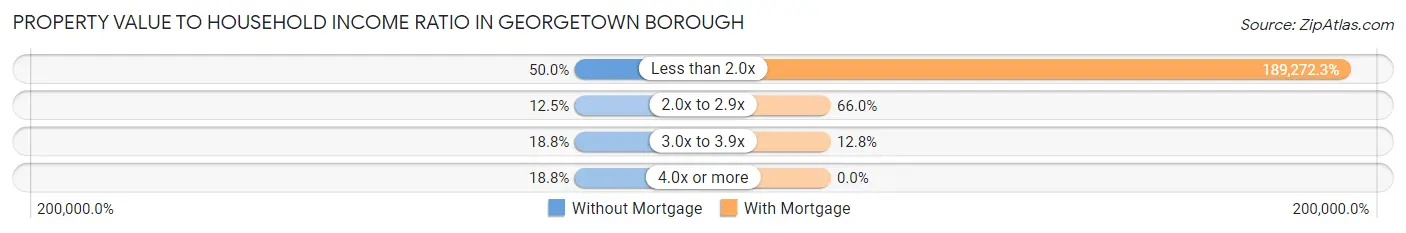
| Value-to-Income Ratio | Without Mortgage | With Mortgage |
| Less than 2.0x | 8 (50.0%) | 88,958 (189,272.3%) |
| 2.0x to 2.9x | 2 (12.5%) | 31 (66.0%) |
| 3.0x to 3.9x | 3 (18.8%) | 6 (12.8%) |
| 4.0x or more | 3 (18.8%) | 0 (0.0%) |
| Total | 16 (100.0%) | 47 (100.0%) |
Real Estate Taxes by Mortgage Status in Georgetown borough
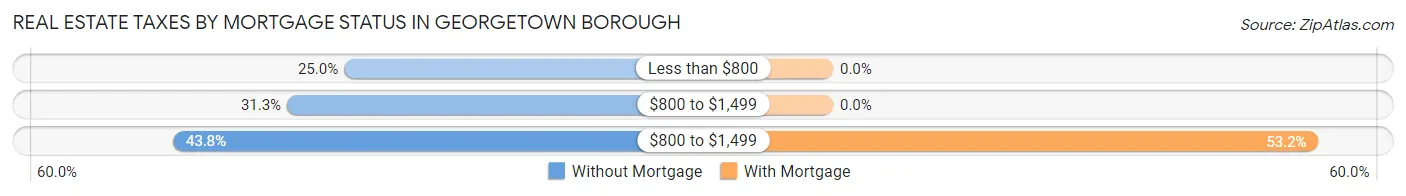
| Property Taxes | Without Mortgage | With Mortgage |
| Less than $800 | 4 (25.0%) | 0 (0.0%) |
| $800 to $1,499 | 5 (31.2%) | 0 (0.0%) |
| $800 to $1,499 | 7 (43.8%) | 25 (53.2%) |
| Total | 16 (100.0%) | 47 (100.0%) |
Health & Disability in Georgetown borough
Health Insurance Coverage by Age in Georgetown borough
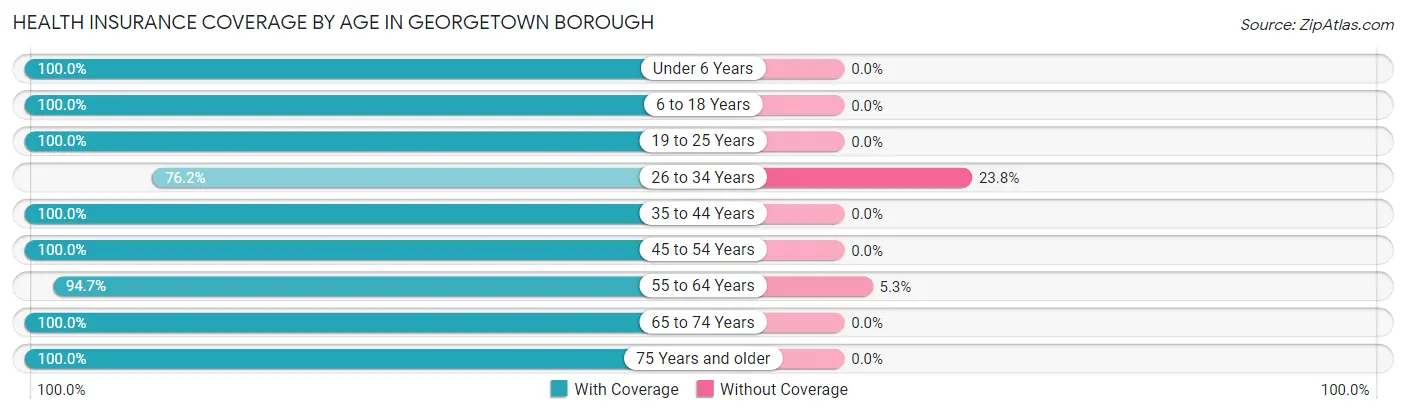
| Age Bracket | With Coverage | Without Coverage |
| Under 6 Years | 13 (100.0%) | 0 (0.0%) |
| 6 to 18 Years | 42 (100.0%) | 0 (0.0%) |
| 19 to 25 Years | 18 (100.0%) | 0 (0.0%) |
| 26 to 34 Years | 16 (76.2%) | 5 (23.8%) |
| 35 to 44 Years | 19 (100.0%) | 0 (0.0%) |
| 45 to 54 Years | 34 (100.0%) | 0 (0.0%) |
| 55 to 64 Years | 36 (94.7%) | 2 (5.3%) |
| 65 to 74 Years | 17 (100.0%) | 0 (0.0%) |
| 75 Years and older | 9 (100.0%) | 0 (0.0%) |
| Total | 204 (96.7%) | 7 (3.3%) |
Health Insurance Coverage by Citizenship Status in Georgetown borough
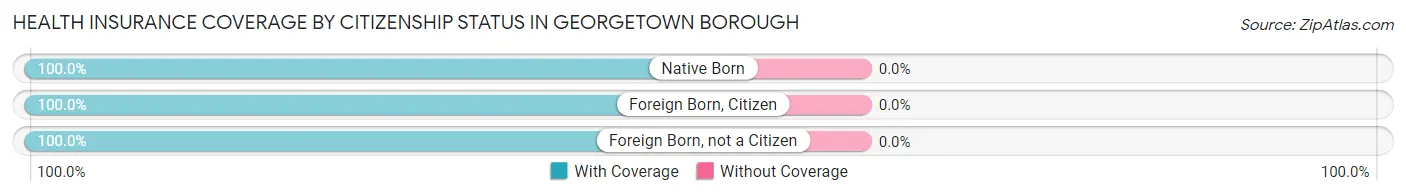
| Citizenship Status | With Coverage | Without Coverage |
| Native Born | 13 (100.0%) | 0 (0.0%) |
| Foreign Born, Citizen | 42 (100.0%) | 0 (0.0%) |
| Foreign Born, not a Citizen | 18 (100.0%) | 0 (0.0%) |
Health Insurance Coverage by Household Income in Georgetown borough
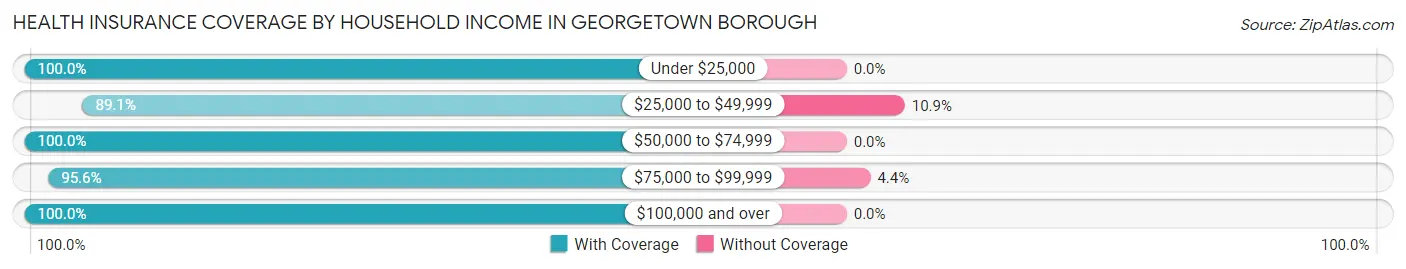
| Household Income | With Coverage | Without Coverage |
| Under $25,000 | 14 (100.0%) | 0 (0.0%) |
| $25,000 to $49,999 | 41 (89.1%) | 5 (10.9%) |
| $50,000 to $74,999 | 17 (100.0%) | 0 (0.0%) |
| $75,000 to $99,999 | 43 (95.6%) | 2 (4.4%) |
| $100,000 and over | 89 (100.0%) | 0 (0.0%) |
Public vs Private Health Insurance Coverage by Age in Georgetown borough
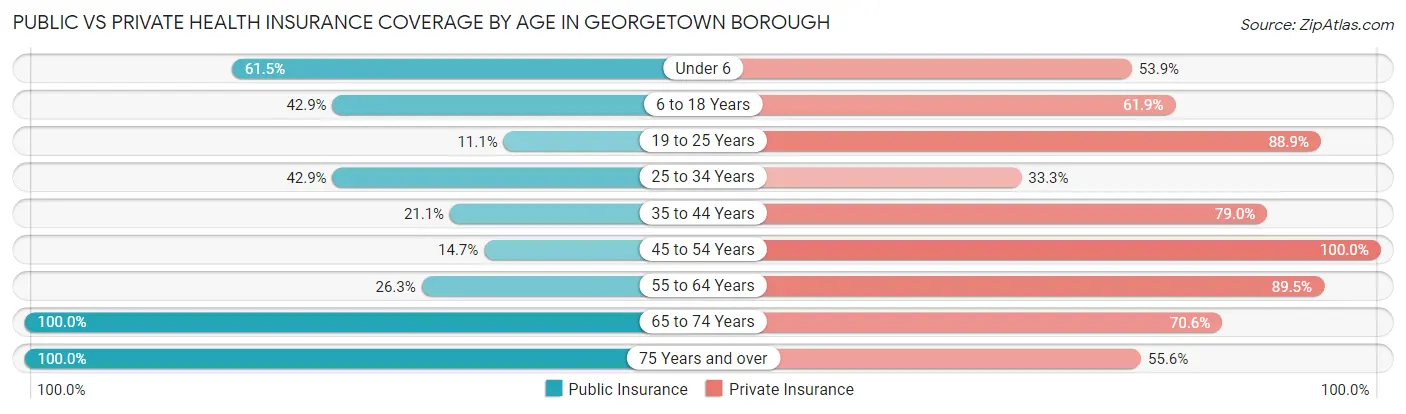
| Age Bracket | Public Insurance | Private Insurance |
| Under 6 | 8 (61.5%) | 7 (53.8%) |
| 6 to 18 Years | 18 (42.9%) | 26 (61.9%) |
| 19 to 25 Years | 2 (11.1%) | 16 (88.9%) |
| 25 to 34 Years | 9 (42.9%) | 7 (33.3%) |
| 35 to 44 Years | 4 (21.0%) | 15 (78.9%) |
| 45 to 54 Years | 5 (14.7%) | 34 (100.0%) |
| 55 to 64 Years | 10 (26.3%) | 34 (89.5%) |
| 65 to 74 Years | 17 (100.0%) | 12 (70.6%) |
| 75 Years and over | 9 (100.0%) | 5 (55.6%) |
| Total | 82 (38.9%) | 156 (73.9%) |
Disability Status by Sex by Age in Georgetown borough
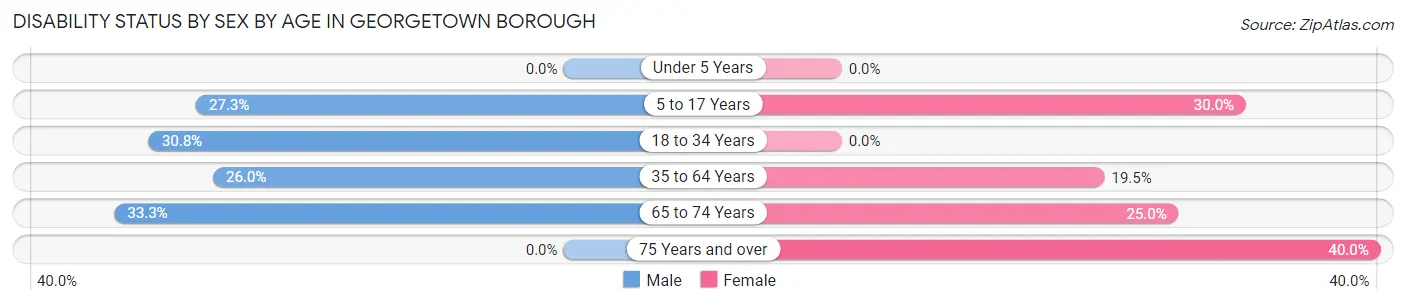
| Age Bracket | Male | Female |
| Under 5 Years | 0 (0.0%) | 0 (0.0%) |
| 5 to 17 Years | 9 (27.3%) | 3 (30.0%) |
| 18 to 34 Years | 8 (30.8%) | 0 (0.0%) |
| 35 to 64 Years | 13 (26.0%) | 8 (19.5%) |
| 65 to 74 Years | 3 (33.3%) | 2 (25.0%) |
| 75 Years and over | 0 (0.0%) | 2 (40.0%) |
Disability Class by Sex by Age in Georgetown borough
Disability Class: Hearing Difficulty
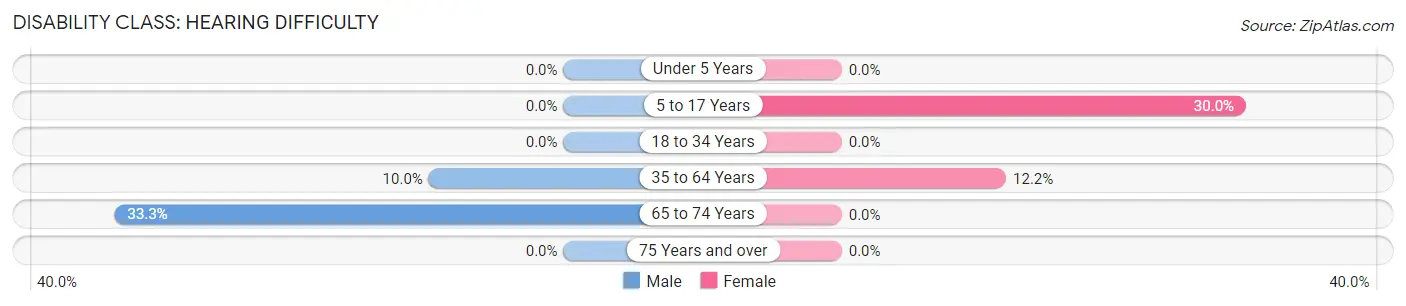
| Age Bracket | Male | Female |
| Under 5 Years | 0 (0.0%) | 0 (0.0%) |
| 5 to 17 Years | 0 (0.0%) | 3 (30.0%) |
| 18 to 34 Years | 0 (0.0%) | 0 (0.0%) |
| 35 to 64 Years | 5 (10.0%) | 5 (12.2%) |
| 65 to 74 Years | 3 (33.3%) | 0 (0.0%) |
| 75 Years and over | 0 (0.0%) | 0 (0.0%) |
Disability Class: Vision Difficulty
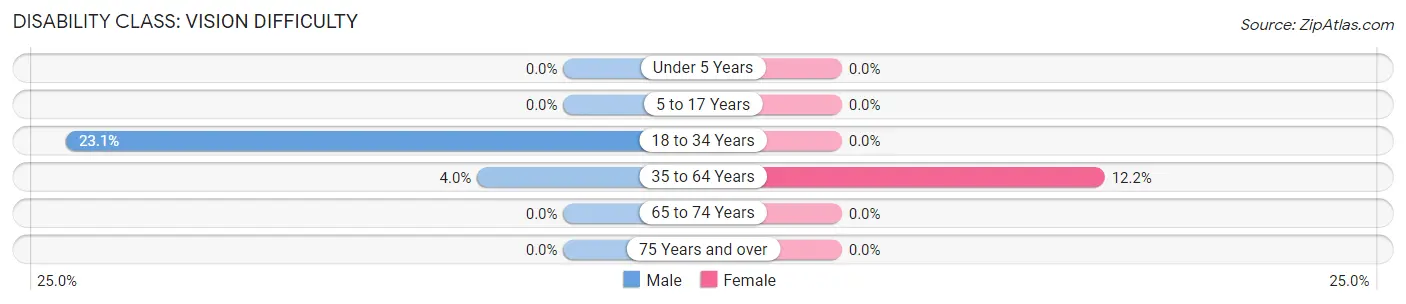
| Age Bracket | Male | Female |
| Under 5 Years | 0 (0.0%) | 0 (0.0%) |
| 5 to 17 Years | 0 (0.0%) | 0 (0.0%) |
| 18 to 34 Years | 6 (23.1%) | 0 (0.0%) |
| 35 to 64 Years | 2 (4.0%) | 5 (12.2%) |
| 65 to 74 Years | 0 (0.0%) | 0 (0.0%) |
| 75 Years and over | 0 (0.0%) | 0 (0.0%) |
Disability Class: Cognitive Difficulty
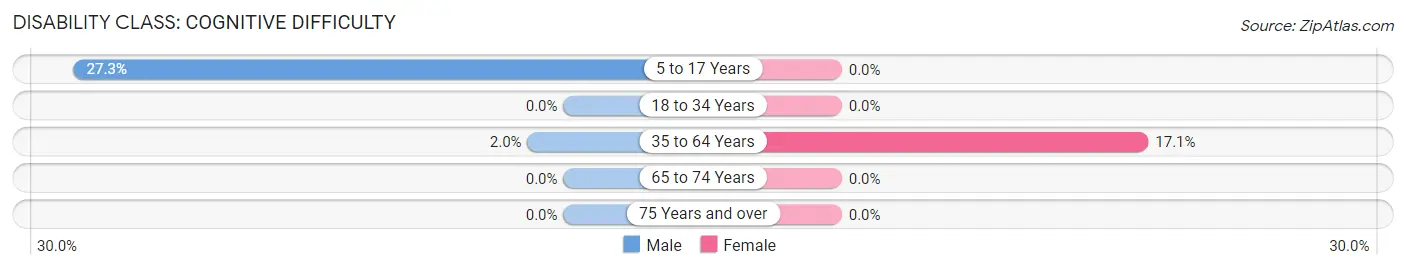
| Age Bracket | Male | Female |
| 5 to 17 Years | 9 (27.3%) | 0 (0.0%) |
| 18 to 34 Years | 0 (0.0%) | 0 (0.0%) |
| 35 to 64 Years | 1 (2.0%) | 7 (17.1%) |
| 65 to 74 Years | 0 (0.0%) | 0 (0.0%) |
| 75 Years and over | 0 (0.0%) | 0 (0.0%) |
Disability Class: Ambulatory Difficulty
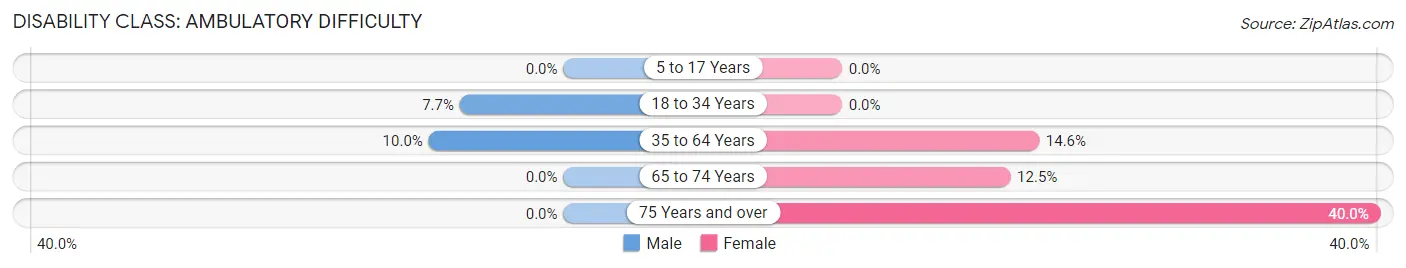
| Age Bracket | Male | Female |
| 5 to 17 Years | 0 (0.0%) | 0 (0.0%) |
| 18 to 34 Years | 2 (7.7%) | 0 (0.0%) |
| 35 to 64 Years | 5 (10.0%) | 6 (14.6%) |
| 65 to 74 Years | 0 (0.0%) | 1 (12.5%) |
| 75 Years and over | 0 (0.0%) | 2 (40.0%) |
Disability Class: Self-Care Difficulty
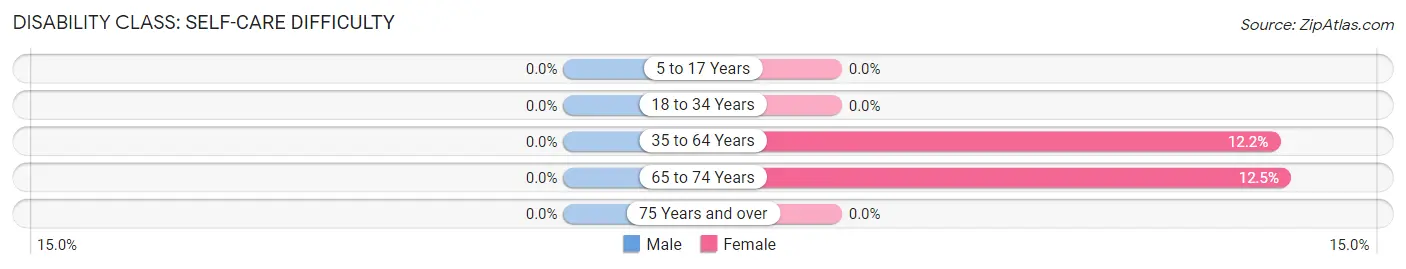
| Age Bracket | Male | Female |
| 5 to 17 Years | 0 (0.0%) | 0 (0.0%) |
| 18 to 34 Years | 0 (0.0%) | 0 (0.0%) |
| 35 to 64 Years | 0 (0.0%) | 5 (12.2%) |
| 65 to 74 Years | 0 (0.0%) | 1 (12.5%) |
| 75 Years and over | 0 (0.0%) | 0 (0.0%) |
Technology Access in Georgetown borough
Computing Device Access in Georgetown borough
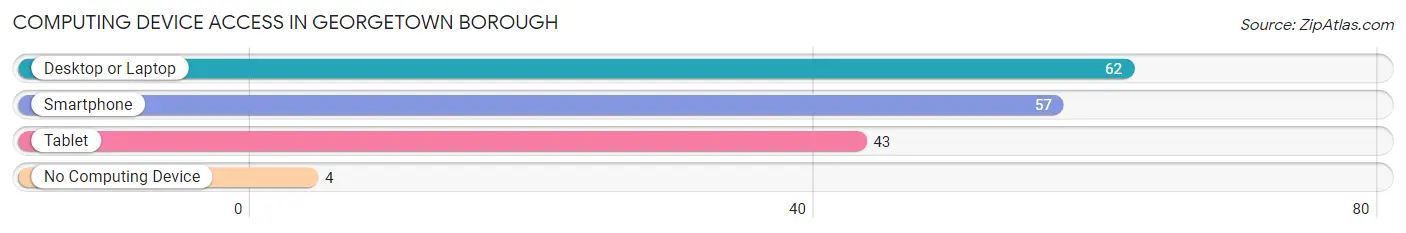
| Device Type | # Households | % Households |
| Desktop or Laptop | 62 | 88.6% |
| Smartphone | 57 | 81.4% |
| Tablet | 43 | 61.4% |
| No Computing Device | 4 | 5.7% |
| Total | 70 | 100.0% |
Internet Access in Georgetown borough
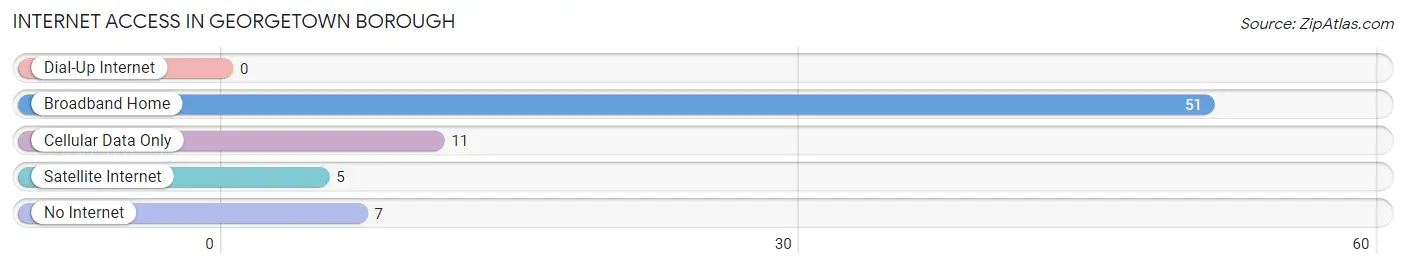
| Internet Type | # Households | % Households |
| Dial-Up Internet | 0 | 0.0% |
| Broadband Home | 51 | 72.9% |
| Cellular Data Only | 11 | 15.7% |
| Satellite Internet | 5 | 7.1% |
| No Internet | 7 | 10.0% |
| Total | 70 | 100.0% |
Georgetown borough Summary
Georgetown Borough is a small borough located in Beaver County, Pennsylvania. It is situated along the Ohio River, approximately 25 miles northwest of Pittsburgh. The population of Georgetown Borough was 1,845 at the 2010 census.
Geography
Georgetown Borough is located at 40°37'45" North, 80°25'45" West (40.629, -80.429). According to the United States Census Bureau, the borough has a total area of 0.7 square miles (1.8 km2), all of it land.
History
Georgetown Borough was founded in 1832 by a group of settlers from Georgetown, Ohio. The town was originally known as Georgetownville, but the name was changed to Georgetown Borough in 1836. The town was incorporated in 1845.
Georgetown Borough was an important stop on the Underground Railroad, with many of the town's residents helping to hide and transport escaped slaves. The town was also home to a number of prominent abolitionists, including William Lloyd Garrison and Frederick Douglass.
Economy
Georgetown Borough is a small, rural community with a limited economy. The town is home to a few small businesses, including a grocery store, a hardware store, and a few restaurants. The town also has a few small manufacturing companies, including a metal fabrication shop and a plastics manufacturer.
Demographics
As of the 2010 census, the population of Georgetown Borough was 1,845. The racial makeup of the borough was 97.2% White, 0.7% African American, 0.2% Native American, 0.2% Asian, 0.2% from other races, and 1.7% from two or more races. Hispanic or Latino of any race were 0.7% of the population.
The median income for a household in the borough was $37,500, and the median income for a family was $45,000. The per capita income for the borough was $17,845. About 11.2% of families and 14.2% of the population were below the poverty line, including 18.2% of those under age 18 and 8.3% of those age 65 or over.
Conclusion
Georgetown Borough is a small, rural community located in Beaver County, Pennsylvania. It is situated along the Ohio River, approximately 25 miles northwest of Pittsburgh. The population of Georgetown Borough was 1,845 at the 2010 census. The town has a limited economy, with a few small businesses and manufacturing companies. The racial makeup of the borough was 97.2% White, 0.7% African American, 0.2% Native American, 0.2% Asian, 0.2% from other races, and 1.7% from two or more races. The median income for a household in the borough was $37,500, and the median income for a family was $45,000. Georgetown Borough has a long and rich history, and was an important stop on the Underground Railroad.
Common Questions
What is Per Capita Income in Georgetown borough?
Per Capita income in Georgetown borough is $33,674.
What is the Median Family Income in Georgetown borough?
Median Family Income in Georgetown borough is $88,333.
What is the Median Household income in Georgetown borough?
Median Household Income in Georgetown borough is $87,500.
What is Income or Wage Gap in Georgetown borough?
Income or Wage Gap in Georgetown borough is 25.6%.
Women in Georgetown borough earn 74.4 cents for every dollar earned by a man.
What is Inequality or Gini Index in Georgetown borough?
Inequality or Gini Index in Georgetown borough is 0.38.
What is the Total Population of Georgetown borough?
Total Population of Georgetown borough is 211.
What is the Total Male Population of Georgetown borough?
Total Male Population of Georgetown borough is 129.
What is the Total Female Population of Georgetown borough?
Total Female Population of Georgetown borough is 82.
What is the Ratio of Males per 100 Females in Georgetown borough?
There are 157.32 Males per 100 Females in Georgetown borough.
What is the Ratio of Females per 100 Males in Georgetown borough?
There are 63.57 Females per 100 Males in Georgetown borough.
What is the Median Population Age in Georgetown borough?
Median Population Age in Georgetown borough is 37.8 Years.
What is the Average Family Size in Georgetown borough
Average Family Size in Georgetown borough is 3.0 People.
What is the Average Household Size in Georgetown borough
Average Household Size in Georgetown borough is 3.0 People.
How Large is the Labor Force in Georgetown borough?
There are 115 People in the Labor Forcein in Georgetown borough.
What is the Percentage of People in the Labor Force in Georgetown borough?
71.4% of People are in the Labor Force in Georgetown borough.