Cairnbrook, PA Map & Demographics
Cairnbrook Map
Cairnbrook Overview
$25,147
PER CAPITA INCOME
$83,145
AVG FAMILY INCOME
$65,938
AVG HOUSEHOLD INCOME
0.35
INEQUALITY / GINI INDEX
531
TOTAL POPULATION
222
MALE POPULATION
309
FEMALE POPULATION
71.84
MALES / 100 FEMALES
139.19
FEMALES / 100 MALES
35.8
MEDIAN AGE
4.0
AVG FAMILY SIZE
3.1
AVG HOUSEHOLD SIZE
237
LABOR FORCE [ PEOPLE ]
62.5%
PERCENT IN LABOR FORCE
Cairnbrook Zip Codes
Cairnbrook Area Codes
Income in Cairnbrook
Income Overview in Cairnbrook
Per Capita Income in Cairnbrook is $25,147, while median incomes of families and households are $83,145 and $65,938 respectively.
| Characteristic | Number | Measure |
| Per Capita Income | 531 | $25,147 |
| Median Family Income | 116 | $83,145 |
| Mean Family Income | 116 | $87,739 |
| Median Household Income | 173 | $65,938 |
| Mean Household Income | 173 | $71,080 |
| Income Deficit | 116 | $0 |
| Wage / Income Gap (%) | 531 | 0.00% |
| Wage / Income Gap ($) | 531 | 100.00¢ per $1 |
| Gini / Inequality Index | 531 | 0.35 |
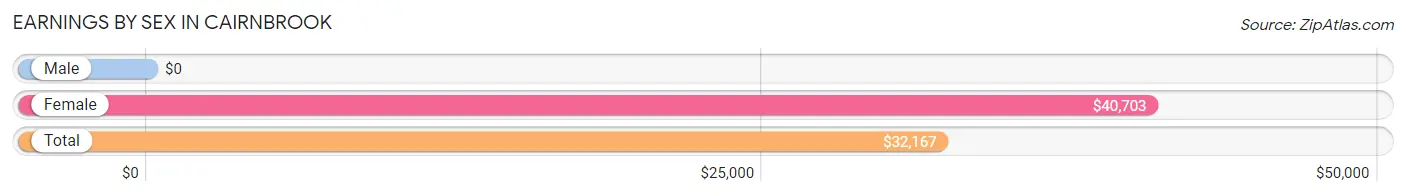
Earnings by Sex in Cairnbrook
| Sex | Number | Average Earnings |
| Male | 165 (56.9%) | $0 |
| Female | 125 (43.1%) | $40,703 |
| Total | 290 (100.0%) | $32,167 |
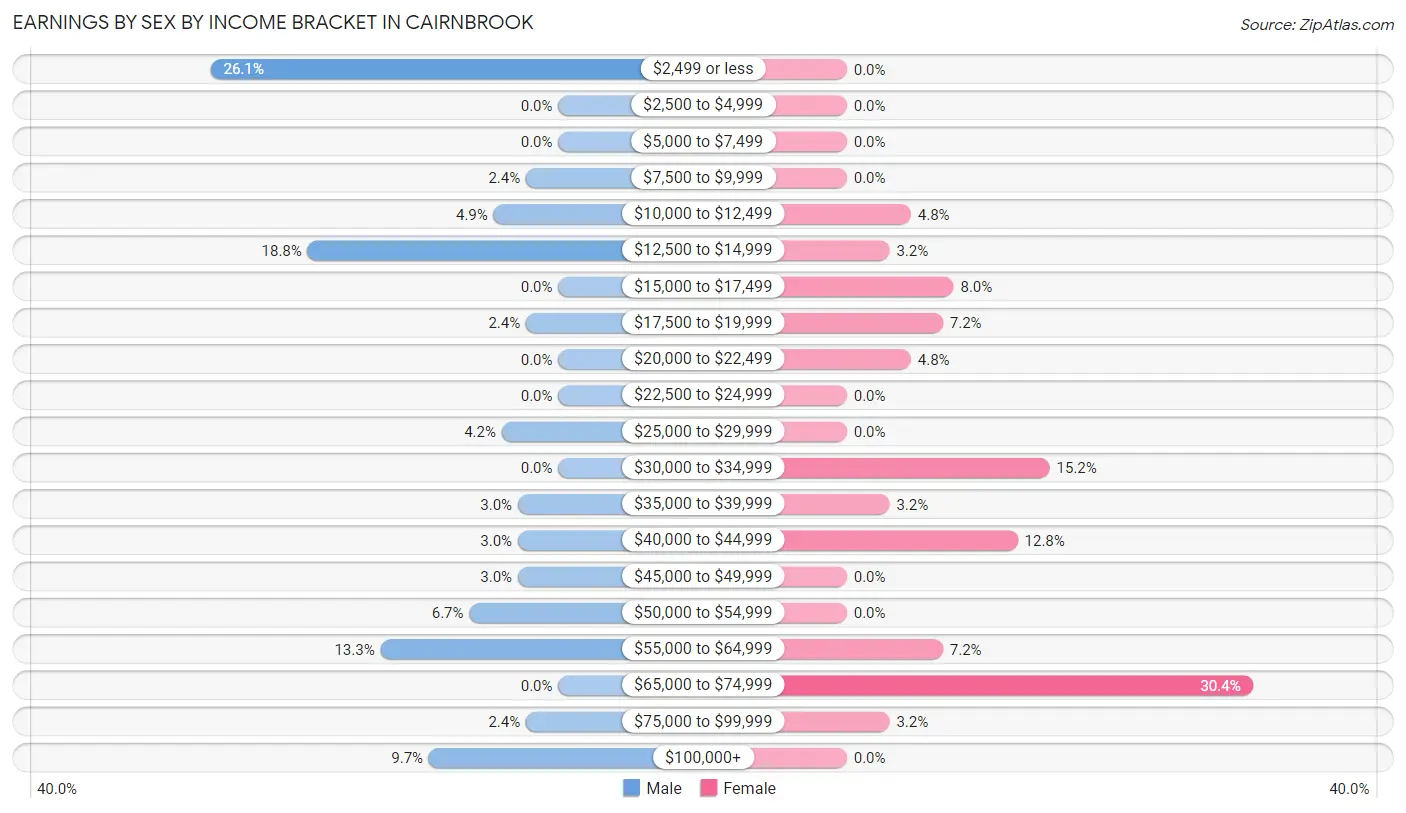
Earnings by Sex by Income Bracket in Cairnbrook
The most common earnings brackets in Cairnbrook are $2,499 or less for men (43 | 26.1%) and $65,000 to $74,999 for women (38 | 30.4%).
| Income | Male | Female |
| $2,499 or less | 43 (26.1%) | 0 (0.0%) |
| $2,500 to $4,999 | 0 (0.0%) | 0 (0.0%) |
| $5,000 to $7,499 | 0 (0.0%) | 0 (0.0%) |
| $7,500 to $9,999 | 4 (2.4%) | 0 (0.0%) |
| $10,000 to $12,499 | 8 (4.9%) | 6 (4.8%) |
| $12,500 to $14,999 | 31 (18.8%) | 4 (3.2%) |
| $15,000 to $17,499 | 0 (0.0%) | 10 (8.0%) |
| $17,500 to $19,999 | 4 (2.4%) | 9 (7.2%) |
| $20,000 to $22,499 | 0 (0.0%) | 6 (4.8%) |
| $22,500 to $24,999 | 0 (0.0%) | 0 (0.0%) |
| $25,000 to $29,999 | 7 (4.2%) | 0 (0.0%) |
| $30,000 to $34,999 | 0 (0.0%) | 19 (15.2%) |
| $35,000 to $39,999 | 5 (3.0%) | 4 (3.2%) |
| $40,000 to $44,999 | 5 (3.0%) | 16 (12.8%) |
| $45,000 to $49,999 | 5 (3.0%) | 0 (0.0%) |
| $50,000 to $54,999 | 11 (6.7%) | 0 (0.0%) |
| $55,000 to $64,999 | 22 (13.3%) | 9 (7.2%) |
| $65,000 to $74,999 | 0 (0.0%) | 38 (30.4%) |
| $75,000 to $99,999 | 4 (2.4%) | 4 (3.2%) |
| $100,000+ | 16 (9.7%) | 0 (0.0%) |
| Total | 165 (100.0%) | 125 (100.0%) |
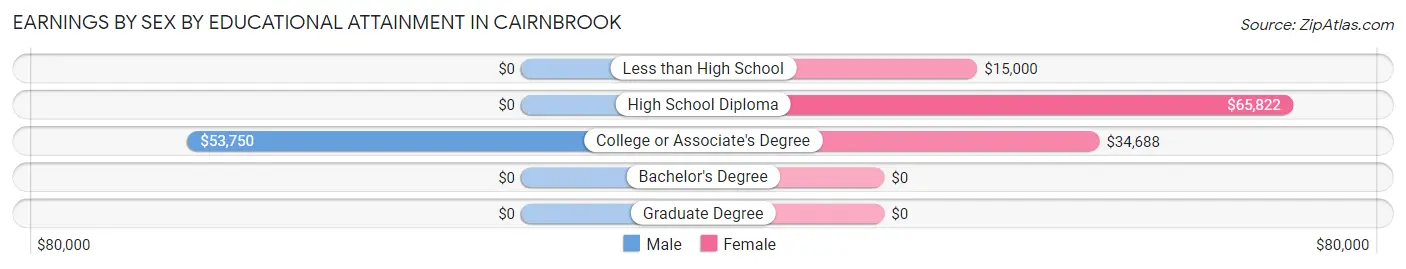
Earnings by Sex by Educational Attainment in Cairnbrook
| Educational Attainment | Male Income | Female Income |
| Less than High School | - | - |
| High School Diploma | - | - |
| College or Associate's Degree | $53,750 | $34,688 |
| Bachelor's Degree | - | - |
| Graduate Degree | - | - |
| Total | - | - |
Family Income in Cairnbrook
Family Income Brackets in Cairnbrook
According to the Cairnbrook family income data, there are 45 families falling into the $75,000 to $99,999 income range, which is the most common income bracket and makes up 38.8% of all families.
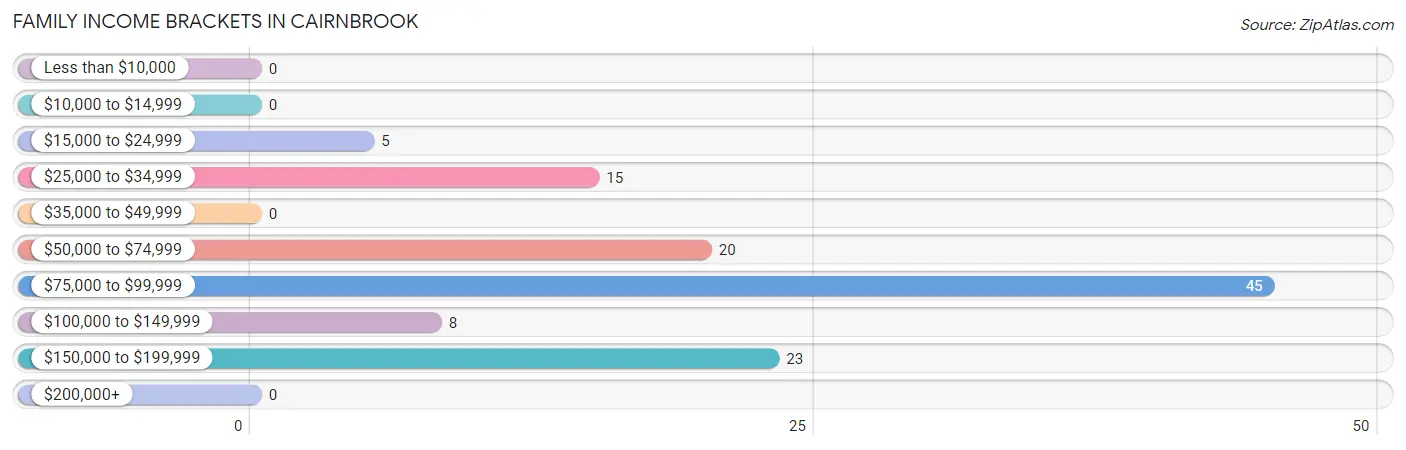
| Income Bracket | # Families | % Families |
| Less than $10,000 | 0 | 0.0% |
| $10,000 to $14,999 | 0 | 0.0% |
| $15,000 to $24,999 | 5 | 4.3% |
| $25,000 to $34,999 | 15 | 12.9% |
| $35,000 to $49,999 | 0 | 0.0% |
| $50,000 to $74,999 | 20 | 17.2% |
| $75,000 to $99,999 | 45 | 38.8% |
| $100,000 to $149,999 | 8 | 6.9% |
| $150,000 to $199,999 | 23 | 19.8% |
| $200,000+ | 0 | 0.0% |
Family Income by Famaliy Size in Cairnbrook
3-person families (27 | 23.3%) account for the highest median family income in Cairnbrook with $81,458 per family, while 2-person families (30 | 25.9%) have the highest median income of $32,812 per family member.
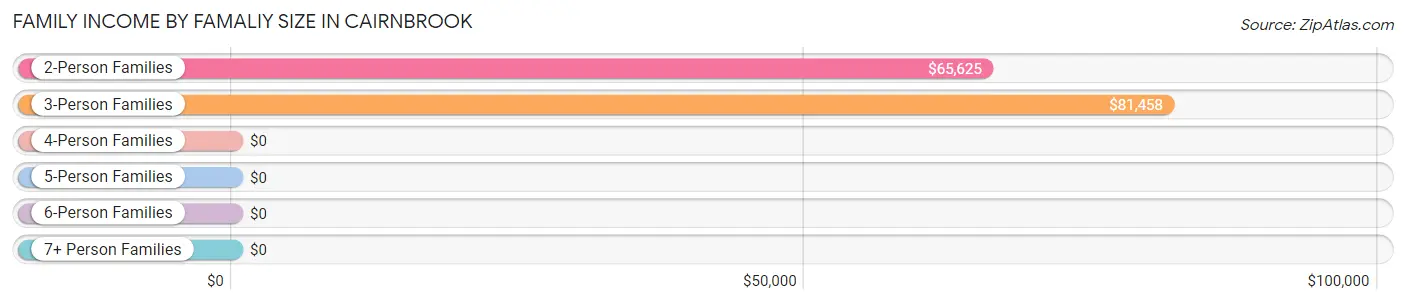
| Income Bracket | # Families | Median Income |
| 2-Person Families | 30 (25.9%) | $65,625 |
| 3-Person Families | 27 (23.3%) | $81,458 |
| 4-Person Families | 20 (17.2%) | $0 |
| 5-Person Families | 31 (26.7%) | $0 |
| 6-Person Families | 0 (0.0%) | $0 |
| 7+ Person Families | 8 (6.9%) | $0 |
| Total | 116 (100.0%) | $83,145 |
Family Income by Number of Earners in Cairnbrook
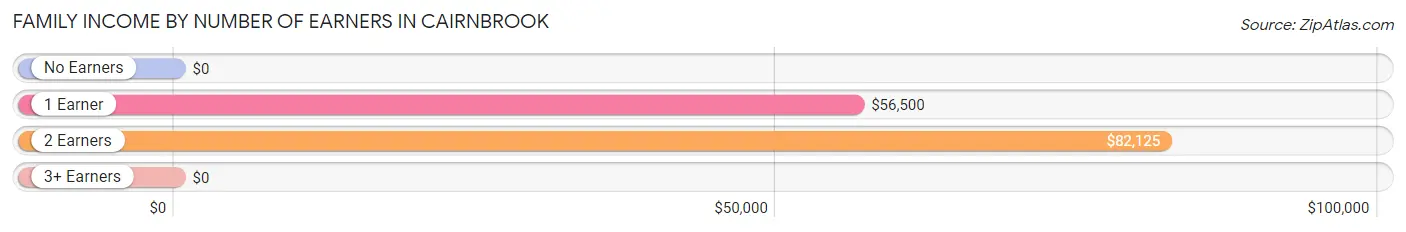
| Number of Earners | # Families | Median Income |
| No Earners | 7 (6.0%) | $0 |
| 1 Earner | 20 (17.2%) | $56,500 |
| 2 Earners | 51 (44.0%) | $82,125 |
| 3+ Earners | 38 (32.8%) | $0 |
| Total | 116 (100.0%) | $83,145 |
Household Income in Cairnbrook
Household Income Brackets in Cairnbrook
With 49 households falling in the category, the $75,000 to $99,999 income range is the most frequent in Cairnbrook, accounting for 28.3% of all households.
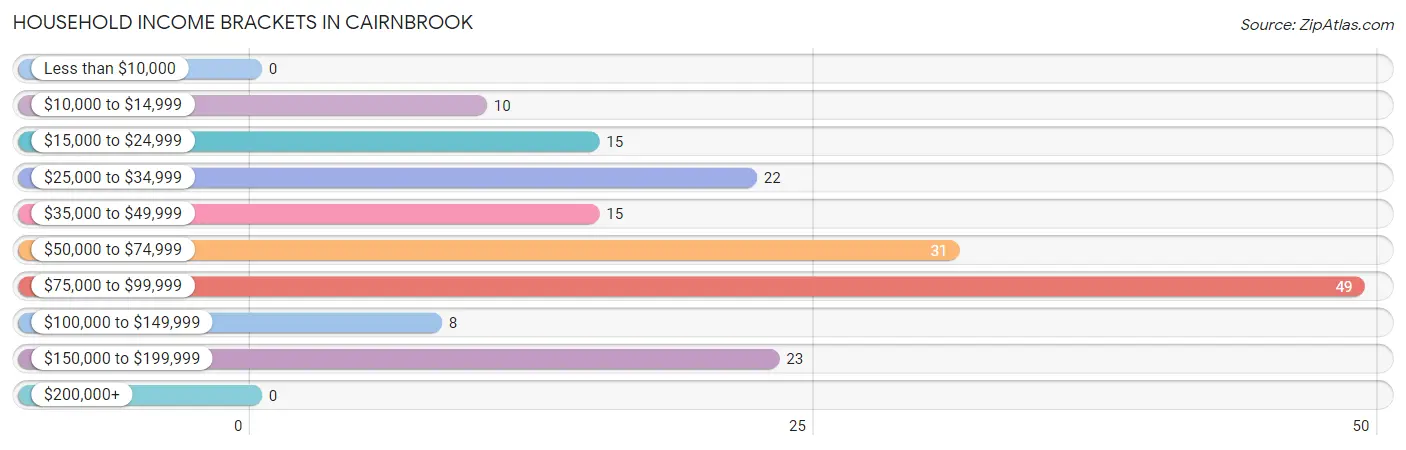
| Income Bracket | # Households | % Households |
| Less than $10,000 | 0 | 0.0% |
| $10,000 to $14,999 | 10 | 5.8% |
| $15,000 to $24,999 | 15 | 8.7% |
| $25,000 to $34,999 | 22 | 12.7% |
| $35,000 to $49,999 | 15 | 8.7% |
| $50,000 to $74,999 | 31 | 17.9% |
| $75,000 to $99,999 | 49 | 28.3% |
| $100,000 to $149,999 | 8 | 4.6% |
| $150,000 to $199,999 | 23 | 13.3% |
| $200,000+ | 0 | 0.0% |
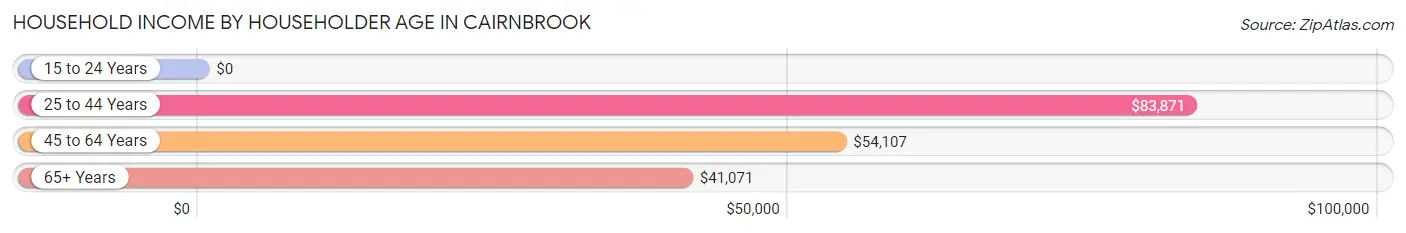
Household Income by Householder Age in Cairnbrook
The median household income in Cairnbrook is $65,938, with the highest median household income of $83,871 found in the 25 to 44 years age bracket for the primary householder. A total of 68 households (39.3%) fall into this category.
| Income Bracket | # Households | Median Income |
| 15 to 24 Years | 0 (0.0%) | $0 |
| 25 to 44 Years | 68 (39.3%) | $83,871 |
| 45 to 64 Years | 61 (35.3%) | $54,107 |
| 65+ Years | 44 (25.4%) | $41,071 |
| Total | 173 (100.0%) | $65,938 |
Poverty in Cairnbrook
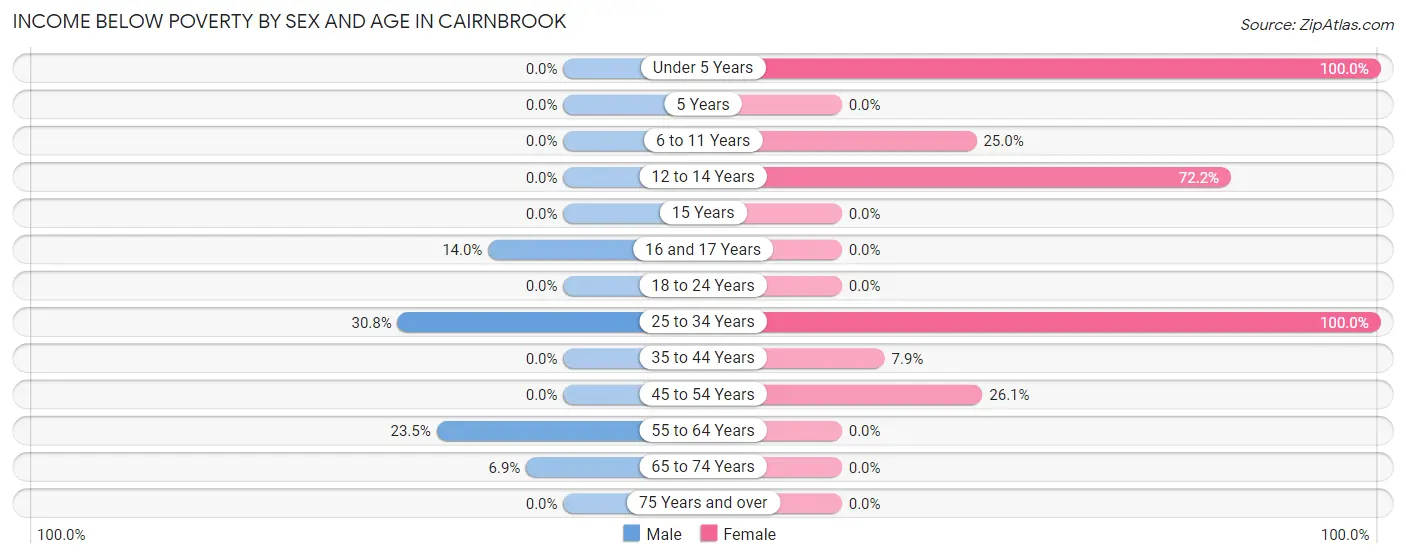
Income Below Poverty by Sex and Age in Cairnbrook
With 9.0% poverty level for males and 22.3% for females among the residents of Cairnbrook, 25 to 34 year old males and under 5 year old females are the most vulnerable to poverty, with 8 males (30.8%) and 19 females (100.0%) in their respective age groups living below the poverty level.
| Age Bracket | Male | Female |
| Under 5 Years | 0 (0.0%) | 19 (100.0%) |
| 5 Years | 0 (0.0%) | 0 (0.0%) |
| 6 to 11 Years | 0 (0.0%) | 16 (25.0%) |
| 12 to 14 Years | 0 (0.0%) | 13 (72.2%) |
| 15 Years | 0 (0.0%) | 0 (0.0%) |
| 16 and 17 Years | 6 (14.0%) | 0 (0.0%) |
| 18 to 24 Years | 0 (0.0%) | 0 (0.0%) |
| 25 to 34 Years | 8 (30.8%) | 10 (100.0%) |
| 35 to 44 Years | 0 (0.0%) | 5 (7.9%) |
| 45 to 54 Years | 0 (0.0%) | 6 (26.1%) |
| 55 to 64 Years | 4 (23.5%) | 0 (0.0%) |
| 65 to 74 Years | 2 (6.9%) | 0 (0.0%) |
| 75 Years and over | 0 (0.0%) | 0 (0.0%) |
| Total | 20 (9.0%) | 69 (22.3%) |
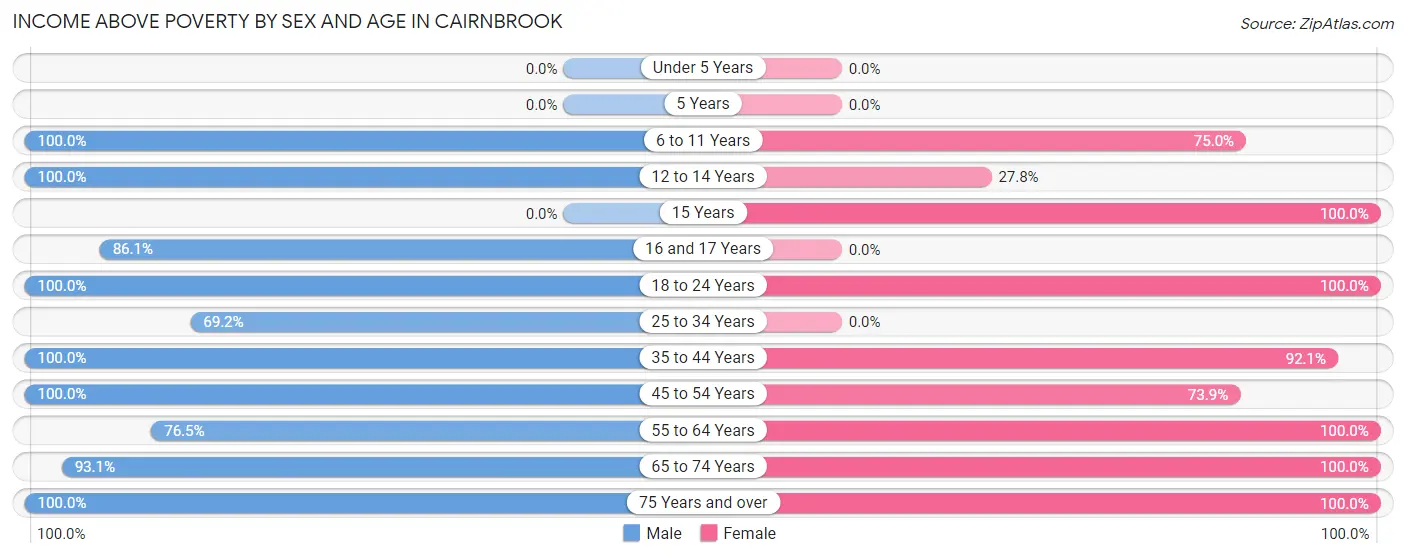
Income Above Poverty by Sex and Age in Cairnbrook
According to the poverty statistics in Cairnbrook, males aged 6 to 11 years and females aged 15 years are the age groups that are most secure financially, with 100.0% of males and 100.0% of females in these age groups living above the poverty line.
| Age Bracket | Male | Female |
| Under 5 Years | 0 (0.0%) | 0 (0.0%) |
| 5 Years | 0 (0.0%) | 0 (0.0%) |
| 6 to 11 Years | 17 (100.0%) | 48 (75.0%) |
| 12 to 14 Years | 4 (100.0%) | 5 (27.8%) |
| 15 Years | 0 (0.0%) | 30 (100.0%) |
| 16 and 17 Years | 37 (86.1%) | 0 (0.0%) |
| 18 to 24 Years | 5 (100.0%) | 16 (100.0%) |
| 25 to 34 Years | 18 (69.2%) | 0 (0.0%) |
| 35 to 44 Years | 51 (100.0%) | 58 (92.1%) |
| 45 to 54 Years | 16 (100.0%) | 17 (73.9%) |
| 55 to 64 Years | 13 (76.5%) | 47 (100.0%) |
| 65 to 74 Years | 27 (93.1%) | 8 (100.0%) |
| 75 Years and over | 14 (100.0%) | 11 (100.0%) |
| Total | 202 (91.0%) | 240 (77.7%) |
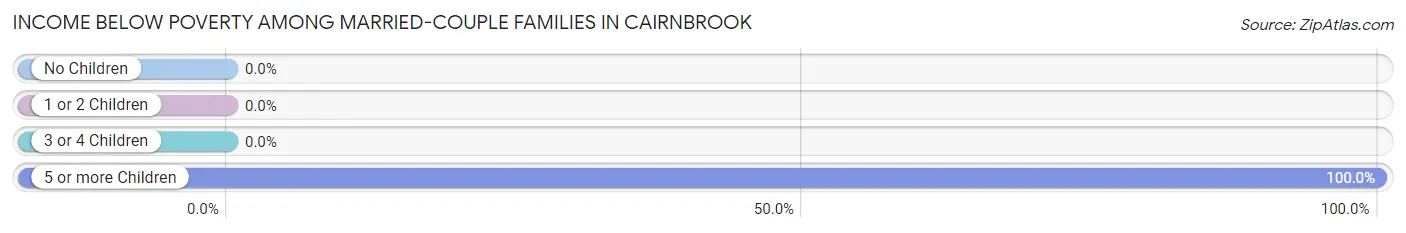
Income Below Poverty Among Married-Couple Families in Cairnbrook
The poverty statistics for married-couple families in Cairnbrook show that 8.0% or 8 of the total 100 families live below the poverty line. Families with 5 or more children have the highest poverty rate of 100.0%, comprising of 8 families. On the other hand, families with no children have the lowest poverty rate of 0.0%, which includes 0 families.
| Children | Above Poverty | Below Poverty |
| No Children | 36 (100.0%) | 0 (0.0%) |
| 1 or 2 Children | 25 (100.0%) | 0 (0.0%) |
| 3 or 4 Children | 31 (100.0%) | 0 (0.0%) |
| 5 or more Children | 0 (0.0%) | 8 (100.0%) |
| Total | 92 (92.0%) | 8 (8.0%) |
Income Below Poverty Among Single-Parent Households in Cairnbrook
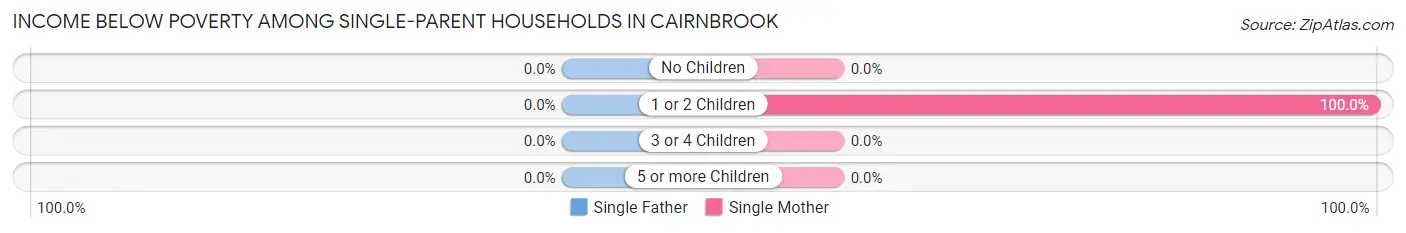
| Children | Single Father | Single Mother |
| No Children | 0 (0.0%) | 0 (0.0%) |
| 1 or 2 Children | 0 (0.0%) | 5 (100.0%) |
| 3 or 4 Children | 0 (0.0%) | 0 (0.0%) |
| 5 or more Children | 0 (0.0%) | 0 (0.0%) |
| Total | 0 (0.0%) | 5 (31.2%) |
Income Below Poverty Among Married-Couple vs Single-Parent Households in Cairnbrook
The poverty data for Cairnbrook shows that 8 of the married-couple family households (8.0%) and 5 of the single-parent households (31.2%) are living below the poverty level. Within the married-couple family households, those with 5 or more children have the highest poverty rate, with 8 households (100.0%) falling below the poverty line. Among the single-parent households, those with 1 or 2 children have the highest poverty rate, with 5 household (100.0%) living below poverty.
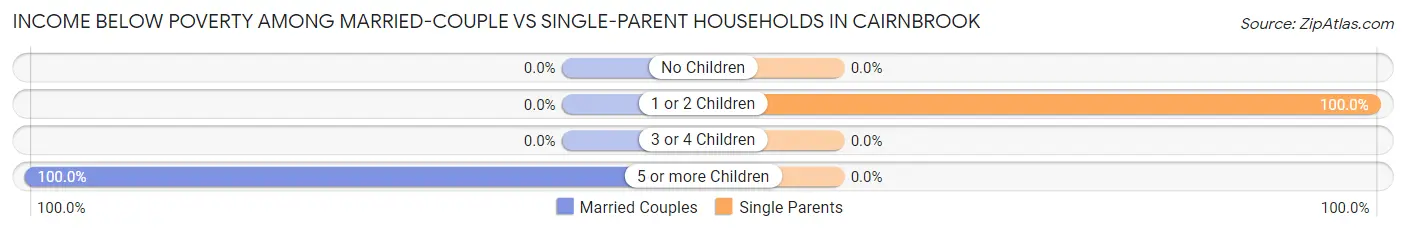
| Children | Married-Couple Families | Single-Parent Households |
| No Children | 0 (0.0%) | 0 (0.0%) |
| 1 or 2 Children | 0 (0.0%) | 5 (100.0%) |
| 3 or 4 Children | 0 (0.0%) | 0 (0.0%) |
| 5 or more Children | 8 (100.0%) | 0 (0.0%) |
| Total | 8 (8.0%) | 5 (31.2%) |
Race in Cairnbrook
The most populous races in Cairnbrook are White / Caucasian (529 | 99.6%), and Two or more Races (2 | 0.4%).
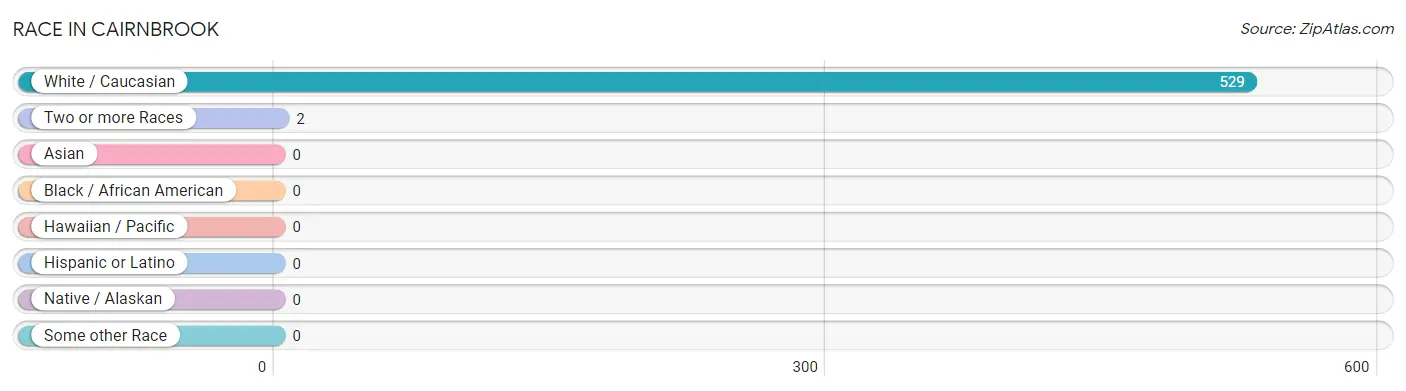
| Race | # Population | % Population |
| Asian | 0 | 0.0% |
| Black / African American | 0 | 0.0% |
| Hawaiian / Pacific | 0 | 0.0% |
| Hispanic or Latino | 0 | 0.0% |
| Native / Alaskan | 0 | 0.0% |
| White / Caucasian | 529 | 99.6% |
| Two or more Races | 2 | 0.4% |
| Some other Race | 0 | 0.0% |
| Total | 531 | 100.0% |
Ancestry in Cairnbrook
The most populous ancestries reported in Cairnbrook are Polish (60 | 11.3%), German (50 | 9.4%), Irish (43 | 8.1%), Italian (24 | 4.5%), and Hungarian (21 | 4.0%), together accounting for 37.3% of all Cairnbrook residents.
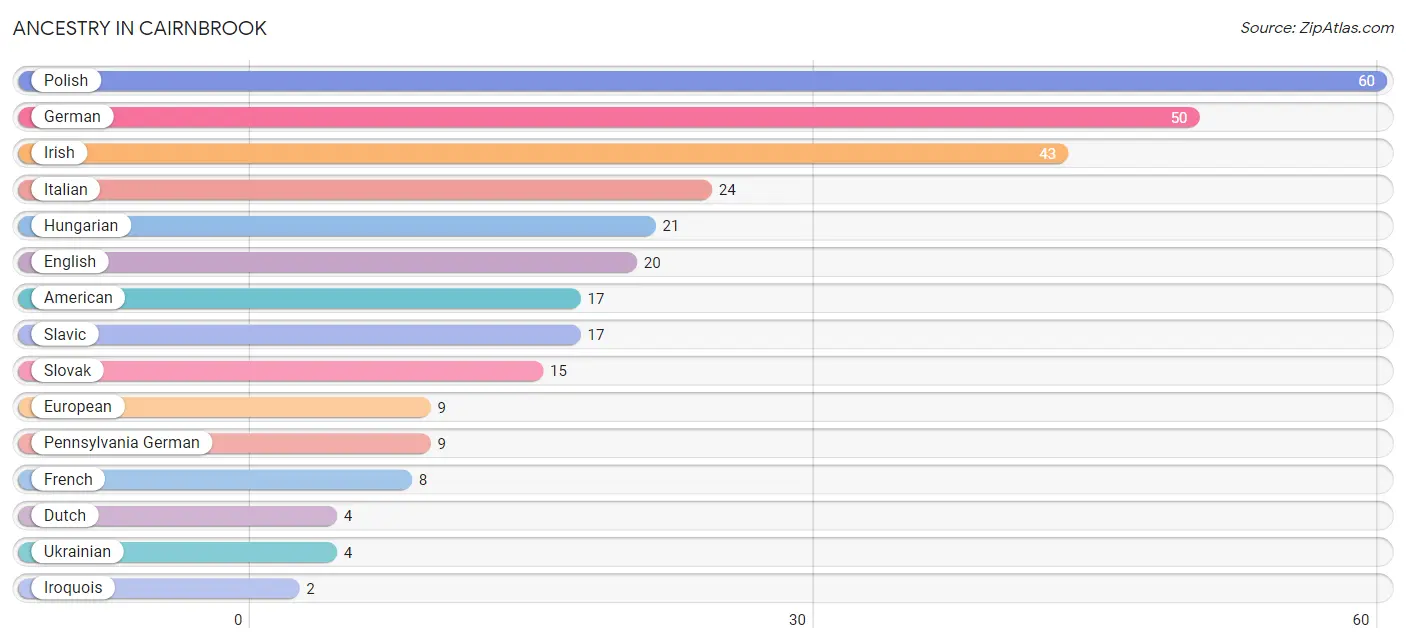
| Ancestry | # Population | % Population |
| American | 17 | 3.2% |
| Dutch | 4 | 0.7% |
| English | 20 | 3.8% |
| European | 9 | 1.7% |
| French | 8 | 1.5% |
| German | 50 | 9.4% |
| Hungarian | 21 | 4.0% |
| Irish | 43 | 8.1% |
| Iroquois | 2 | 0.4% |
| Italian | 24 | 4.5% |
| Pennsylvania German | 9 | 1.7% |
| Polish | 60 | 11.3% |
| Slavic | 17 | 3.2% |
| Slovak | 15 | 2.8% |
| Ukrainian | 4 | 0.7% | View All 15 Rows |
Immigrants in Cairnbrook

| Immigration Origin | # Population | % Population | View All 0 Rows |
Sex and Age in Cairnbrook
Sex and Age in Cairnbrook
The most populous age groups in Cairnbrook are 15 to 19 Years (43 | 19.4%) for men and 5 to 9 Years (64 | 20.7%) for women.
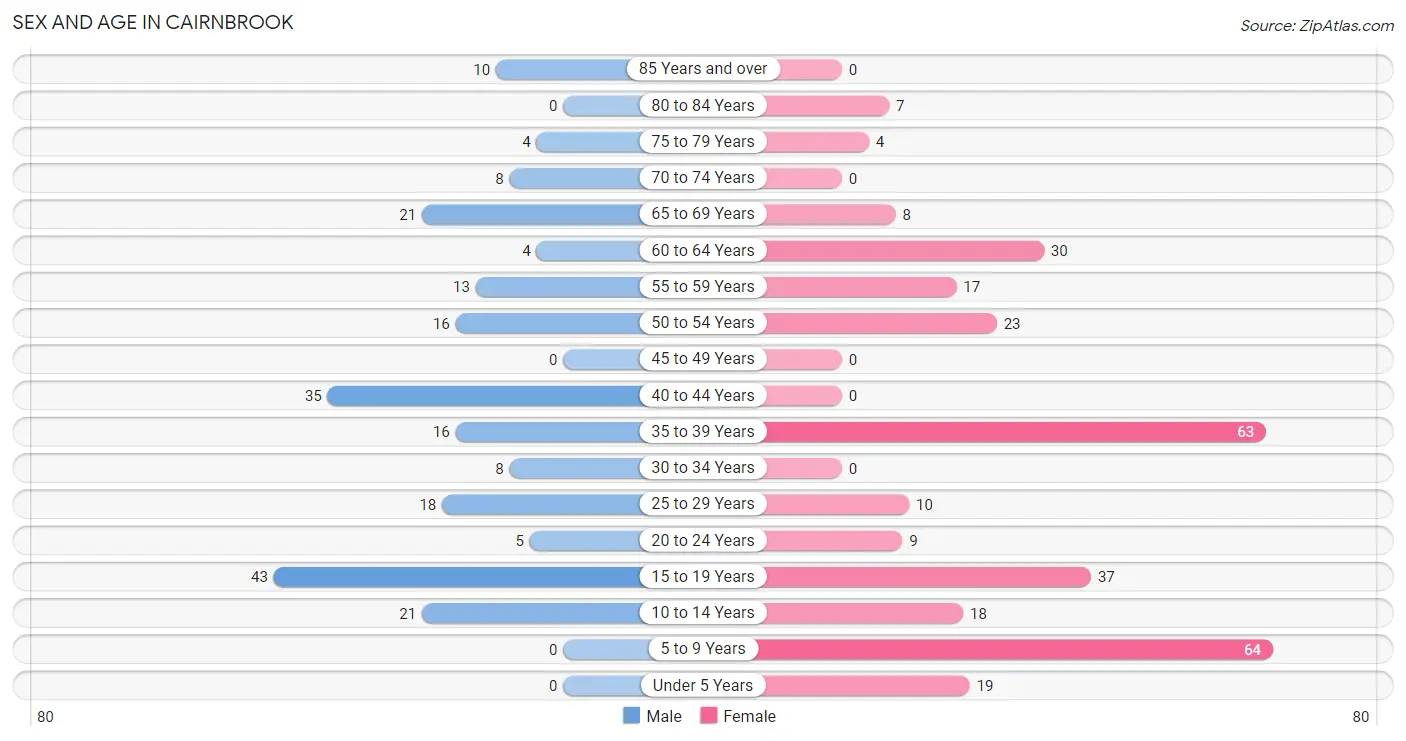
| Age Bracket | Male | Female |
| Under 5 Years | 0 (0.0%) | 19 (6.1%) |
| 5 to 9 Years | 0 (0.0%) | 64 (20.7%) |
| 10 to 14 Years | 21 (9.5%) | 18 (5.8%) |
| 15 to 19 Years | 43 (19.4%) | 37 (12.0%) |
| 20 to 24 Years | 5 (2.2%) | 9 (2.9%) |
| 25 to 29 Years | 18 (8.1%) | 10 (3.2%) |
| 30 to 34 Years | 8 (3.6%) | 0 (0.0%) |
| 35 to 39 Years | 16 (7.2%) | 63 (20.4%) |
| 40 to 44 Years | 35 (15.8%) | 0 (0.0%) |
| 45 to 49 Years | 0 (0.0%) | 0 (0.0%) |
| 50 to 54 Years | 16 (7.2%) | 23 (7.4%) |
| 55 to 59 Years | 13 (5.9%) | 17 (5.5%) |
| 60 to 64 Years | 4 (1.8%) | 30 (9.7%) |
| 65 to 69 Years | 21 (9.5%) | 8 (2.6%) |
| 70 to 74 Years | 8 (3.6%) | 0 (0.0%) |
| 75 to 79 Years | 4 (1.8%) | 4 (1.3%) |
| 80 to 84 Years | 0 (0.0%) | 7 (2.3%) |
| 85 Years and over | 10 (4.5%) | 0 (0.0%) |
| Total | 222 (100.0%) | 309 (100.0%) |
Families and Households in Cairnbrook
Median Family Size in Cairnbrook
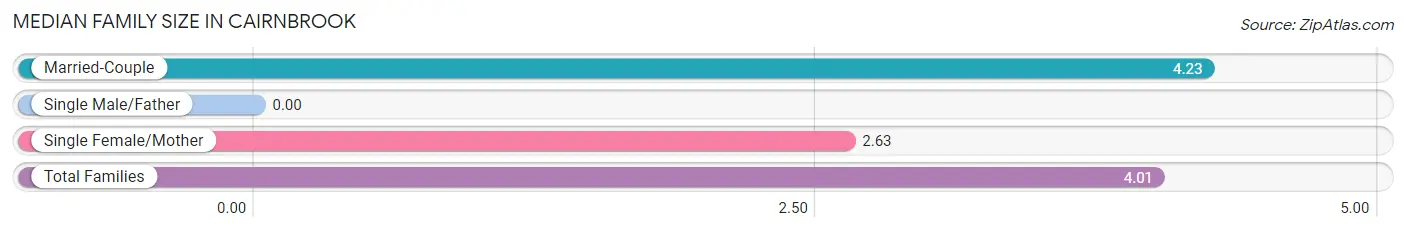
| Family Type | # Families | Family Size |
| Married-Couple | 100 (86.2%) | 4.23 |
| Single Male/Father | 0 (0.0%) | - |
| Single Female/Mother | 16 (13.8%) | 2.63 |
| Total Families | 116 (100.0%) | 4.01 |
Median Household Size in Cairnbrook
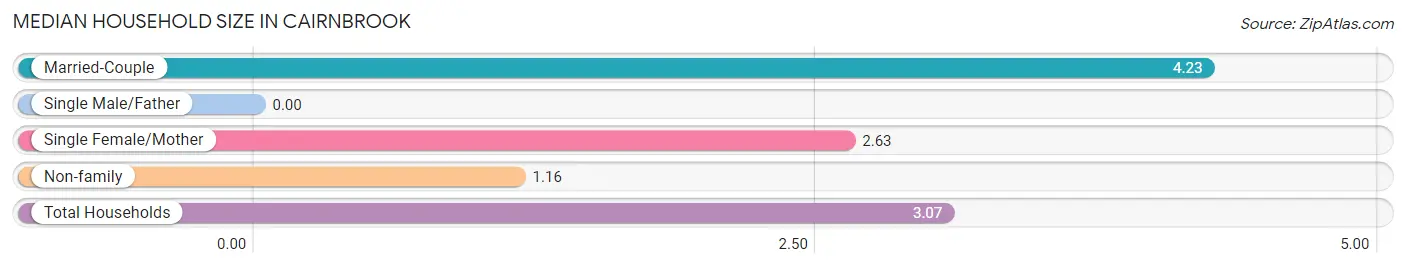
| Household Type | # Households | Household Size |
| Married-Couple | 100 (57.8%) | 4.23 |
| Single Male/Father | 0 (0.0%) | - |
| Single Female/Mother | 16 (9.2%) | 2.63 |
| Non-family | 57 (33.0%) | 1.16 |
| Total Households | 173 (100.0%) | 3.07 |
Household Size by Marriage Status in Cairnbrook
Out of a total of 173 households in Cairnbrook, 116 (67.0%) are family households, while 57 (33.0%) are nonfamily households. The most numerous type of family households are 5-person households, comprising 31, and the most common type of nonfamily households are 1-person households, comprising 51.
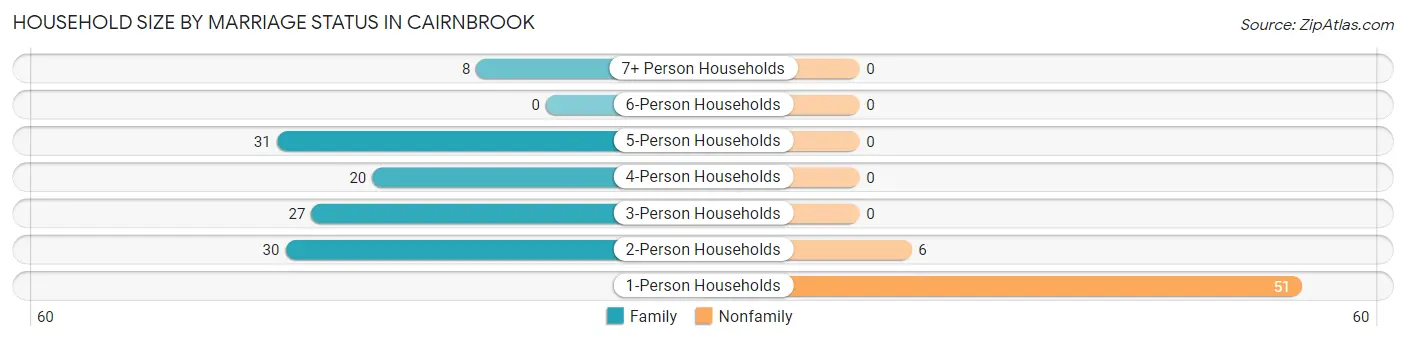
| Household Size | Family Households | Nonfamily Households |
| 1-Person Households | - | 51 (29.5%) |
| 2-Person Households | 30 (17.3%) | 6 (3.5%) |
| 3-Person Households | 27 (15.6%) | 0 (0.0%) |
| 4-Person Households | 20 (11.6%) | 0 (0.0%) |
| 5-Person Households | 31 (17.9%) | 0 (0.0%) |
| 6-Person Households | 0 (0.0%) | 0 (0.0%) |
| 7+ Person Households | 8 (4.6%) | 0 (0.0%) |
| Total | 116 (67.0%) | 57 (33.0%) |
Female Fertility in Cairnbrook
Fertility by Age in Cairnbrook
Average fertility rate in Cairnbrook is 84.0 births per 1,000 women. Women in the age bracket of 20 to 34 years have the highest fertility rate with 526.0 births per 1,000 women. Women in the age bracket of 20 to 34 years acount for 100.0% of all women with births.
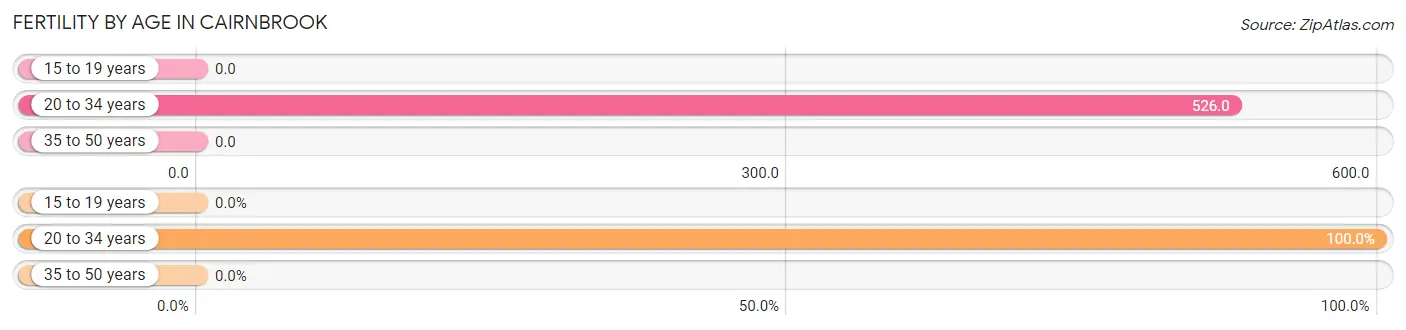
| Age Bracket | Women with Births | Births / 1,000 Women |
| 15 to 19 years | 0 (0.0%) | 0.0 |
| 20 to 34 years | 10 (100.0%) | 526.0 |
| 35 to 50 years | 0 (0.0%) | 0.0 |
| Total | 10 (100.0%) | 84.0 |
Fertility by Age by Marriage Status in Cairnbrook
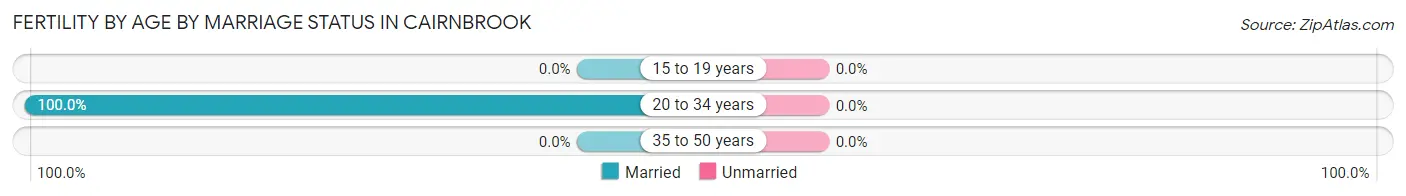
| Age Bracket | Married | Unmarried |
| 15 to 19 years | 0 (0.0%) | 0 (0.0%) |
| 20 to 34 years | 10 (100.0%) | 0 (0.0%) |
| 35 to 50 years | 0 (0.0%) | 0 (0.0%) |
| Total | 10 (100.0%) | 0 (0.0%) |
Fertility by Education in Cairnbrook
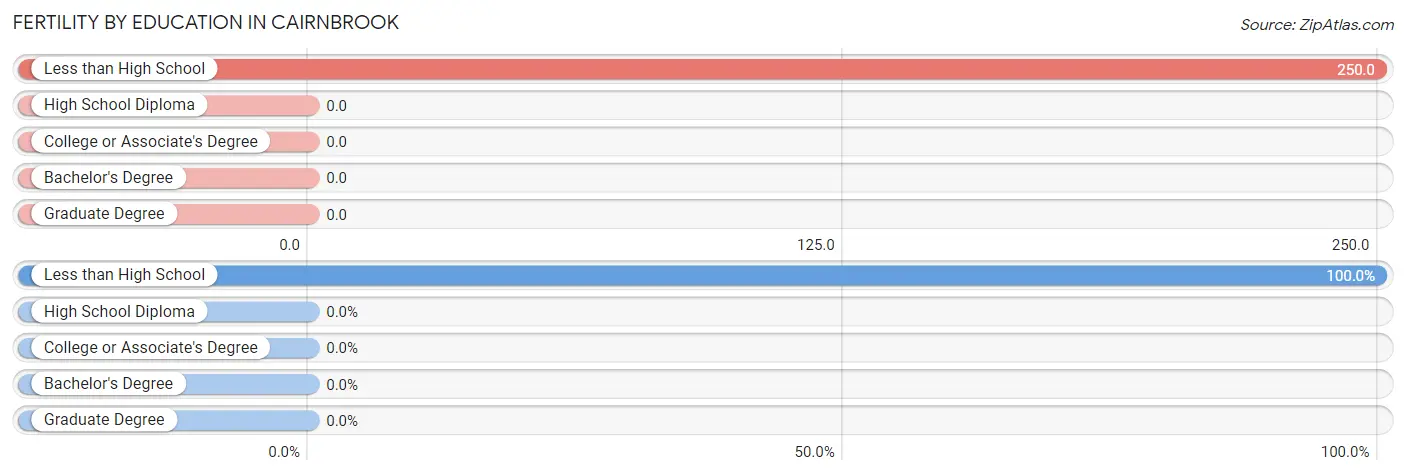
| Educational Attainment | Women with Births | Births / 1,000 Women |
| Less than High School | 10 (100.0%) | 250.0 |
| High School Diploma | 0 (0.0%) | 0.0 |
| College or Associate's Degree | 0 (0.0%) | 0.0 |
| Bachelor's Degree | 0 (0.0%) | 0.0 |
| Graduate Degree | 0 (0.0%) | 0.0 |
| Total | 10 (100.0%) | 84.0 |
Fertility by Education by Marriage Status in Cairnbrook
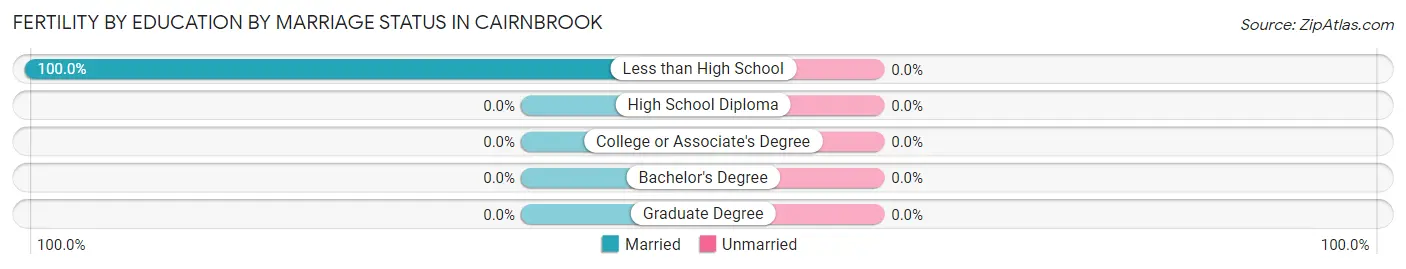
| Educational Attainment | Married | Unmarried |
| Less than High School | 10 (100.0%) | 0 (0.0%) |
| High School Diploma | 0 (0.0%) | 0 (0.0%) |
| College or Associate's Degree | 0 (0.0%) | 0 (0.0%) |
| Bachelor's Degree | 0 (0.0%) | 0 (0.0%) |
| Graduate Degree | 0 (0.0%) | 0 (0.0%) |
| Total | 10 (100.0%) | 0 (0.0%) |
Employment Characteristics in Cairnbrook
Employment by Class of Employer in Cairnbrook
Among the 231 employed individuals in Cairnbrook, private company employees (156 | 67.5%), not-for-profit organizations (38 | 16.5%), and local government employees (37 | 16.0%) make up the most common classes of employment.
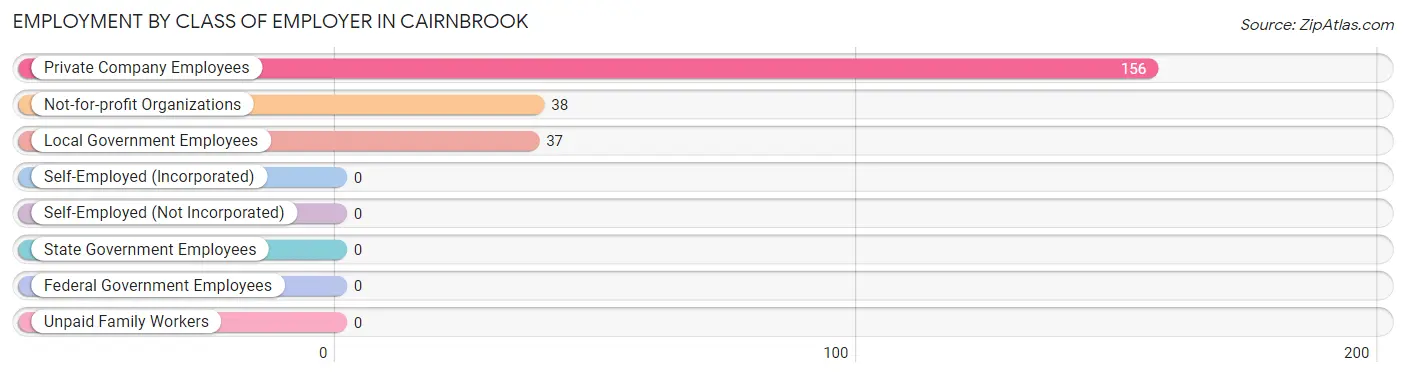
| Employer Class | # Employees | % Employees |
| Private Company Employees | 156 | 67.5% |
| Self-Employed (Incorporated) | 0 | 0.0% |
| Self-Employed (Not Incorporated) | 0 | 0.0% |
| Not-for-profit Organizations | 38 | 16.5% |
| Local Government Employees | 37 | 16.0% |
| State Government Employees | 0 | 0.0% |
| Federal Government Employees | 0 | 0.0% |
| Unpaid Family Workers | 0 | 0.0% |
| Total | 231 | 100.0% |
Employment Status by Age in Cairnbrook
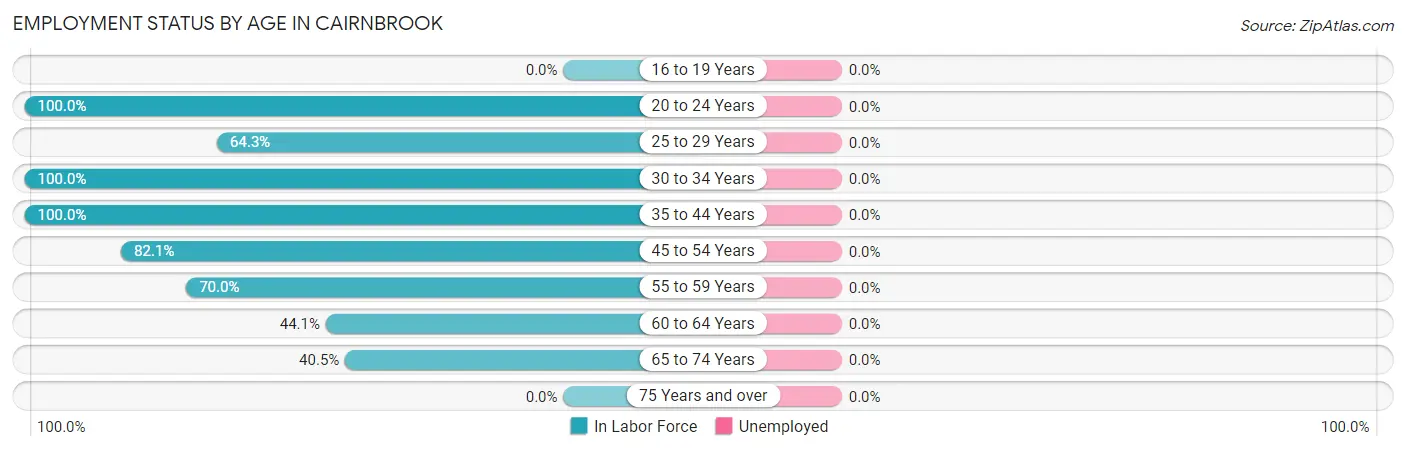
| Age Bracket | In Labor Force | Unemployed |
| 16 to 19 Years | 0 (0.0%) | 0 (0.0%) |
| 20 to 24 Years | 14 (100.0%) | 0 (0.0%) |
| 25 to 29 Years | 18 (64.3%) | 0 (0.0%) |
| 30 to 34 Years | 8 (100.0%) | 0 (0.0%) |
| 35 to 44 Years | 114 (100.0%) | 0 (0.0%) |
| 45 to 54 Years | 32 (82.1%) | 0 (0.0%) |
| 55 to 59 Years | 21 (70.0%) | 0 (0.0%) |
| 60 to 64 Years | 15 (44.1%) | 0 (0.0%) |
| 65 to 74 Years | 15 (40.5%) | 0 (0.0%) |
| 75 Years and over | 0 (0.0%) | 0 (0.0%) |
| Total | 237 (62.5%) | 0 (0.0%) |
Employment Status by Educational Attainment in Cairnbrook
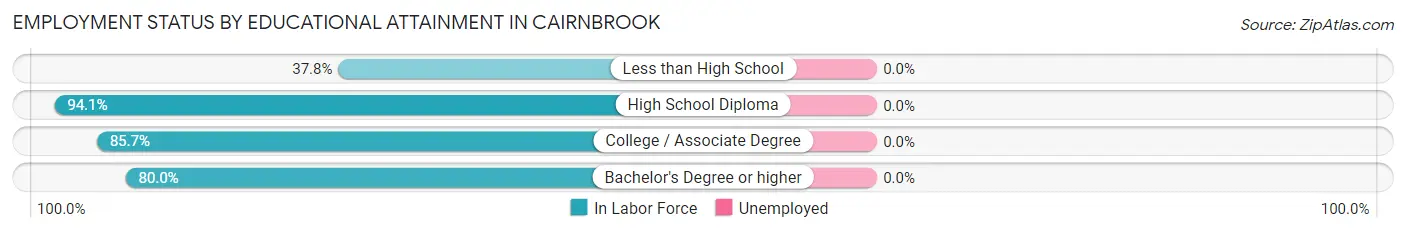
| Educational Attainment | In Labor Force | Unemployed |
| Less than High School | 14 (37.8%) | 0 (0.0%) |
| High School Diploma | 112 (94.1%) | 0 (0.0%) |
| College / Associate Degree | 66 (85.7%) | 0 (0.0%) |
| Bachelor's Degree or higher | 16 (80.0%) | 0 (0.0%) |
| Total | 208 (82.2%) | 0 (0.0%) |
Employment Occupations by Sex in Cairnbrook
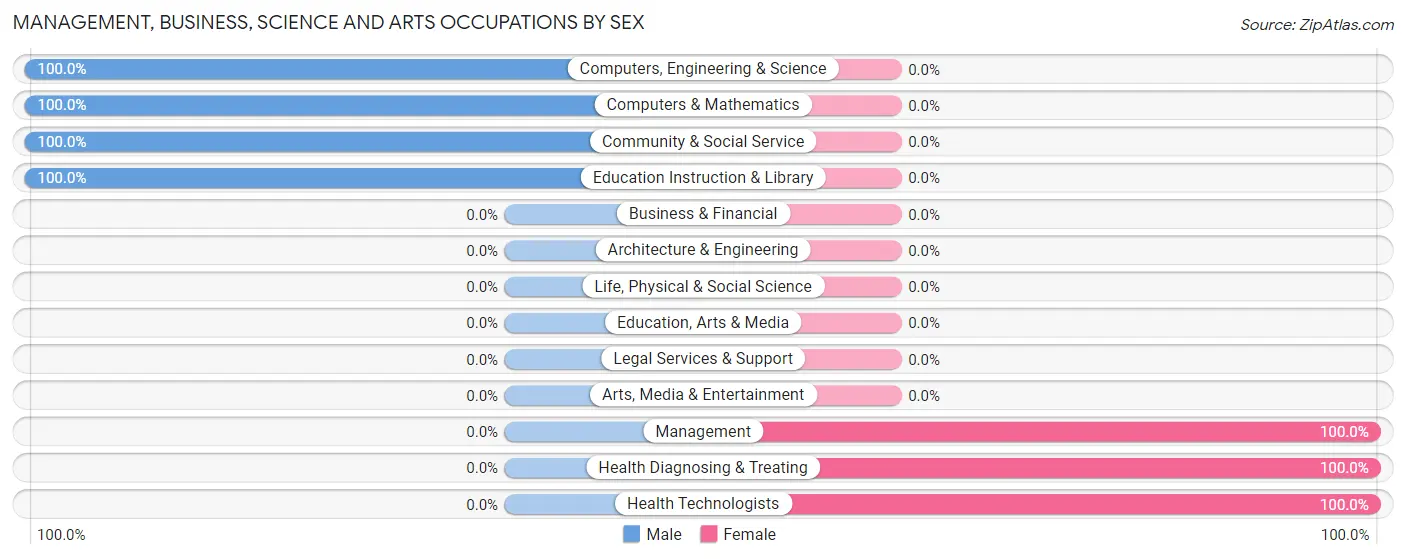
Management, Business, Science and Arts Occupations
The most common Management, Business, Science and Arts occupations in Cairnbrook are Health Diagnosing & Treating (67 | 28.3%), Community & Social Service (31 | 13.1%), Education Instruction & Library (31 | 13.1%), Health Technologists (29 | 12.2%), and Computers, Engineering & Science (16 | 6.8%).
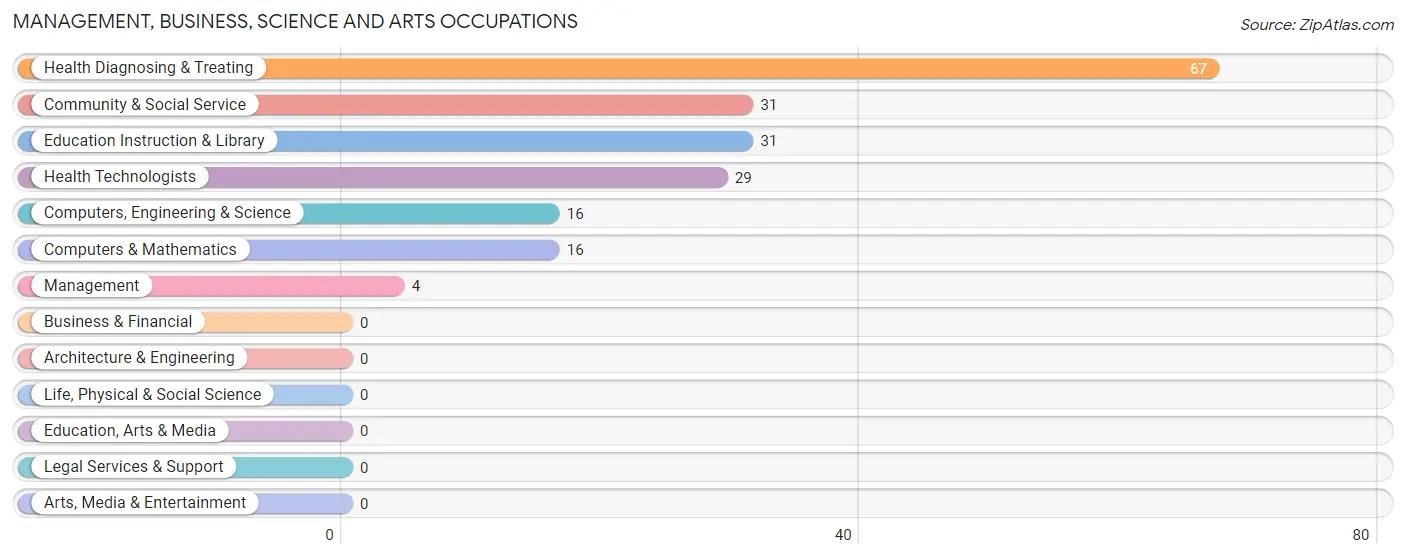
Management, Business, Science and Arts Occupations by Sex
Within the Management, Business, Science and Arts occupations in Cairnbrook, the most male-oriented occupations are Computers, Engineering & Science (100.0%), Computers & Mathematics (100.0%), and Community & Social Service (100.0%), while the most female-oriented occupations are Management (100.0%), Health Diagnosing & Treating (100.0%), and Health Technologists (100.0%).
| Occupation | Male | Female |
| Management | 0 (0.0%) | 4 (100.0%) |
| Business & Financial | 0 (0.0%) | 0 (0.0%) |
| Computers, Engineering & Science | 16 (100.0%) | 0 (0.0%) |
| Computers & Mathematics | 16 (100.0%) | 0 (0.0%) |
| Architecture & Engineering | 0 (0.0%) | 0 (0.0%) |
| Life, Physical & Social Science | 0 (0.0%) | 0 (0.0%) |
| Community & Social Service | 31 (100.0%) | 0 (0.0%) |
| Education, Arts & Media | 0 (0.0%) | 0 (0.0%) |
| Legal Services & Support | 0 (0.0%) | 0 (0.0%) |
| Education Instruction & Library | 31 (100.0%) | 0 (0.0%) |
| Arts, Media & Entertainment | 0 (0.0%) | 0 (0.0%) |
| Health Diagnosing & Treating | 0 (0.0%) | 67 (100.0%) |
| Health Technologists | 0 (0.0%) | 29 (100.0%) |
| Total (Category) | 47 (39.8%) | 71 (60.2%) |
| Total (Overall) | 122 (51.5%) | 115 (48.5%) |
Services Occupations
The most common Services occupations in Cairnbrook are Healthcare Support (10 | 4.2%), Food Preparation & Serving (4 | 1.7%), and Cleaning & Maintenance (4 | 1.7%).
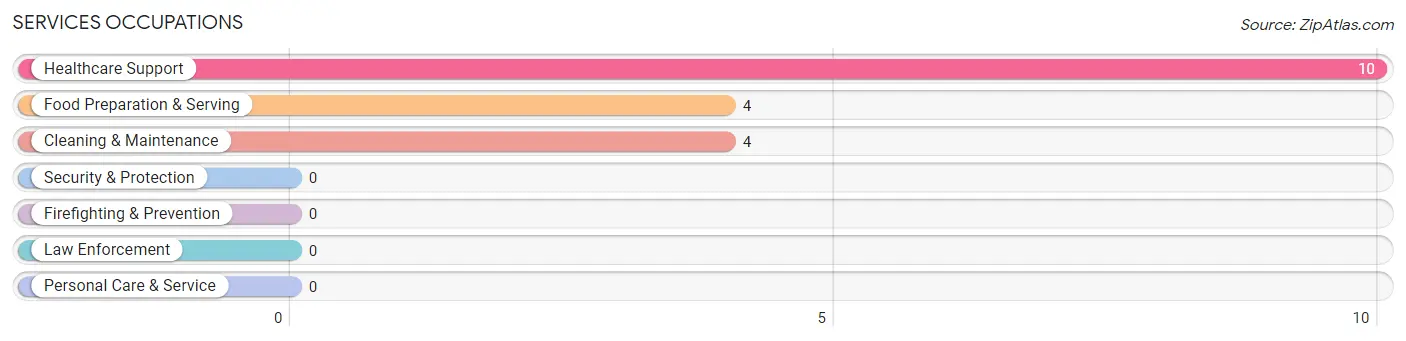
Services Occupations by Sex
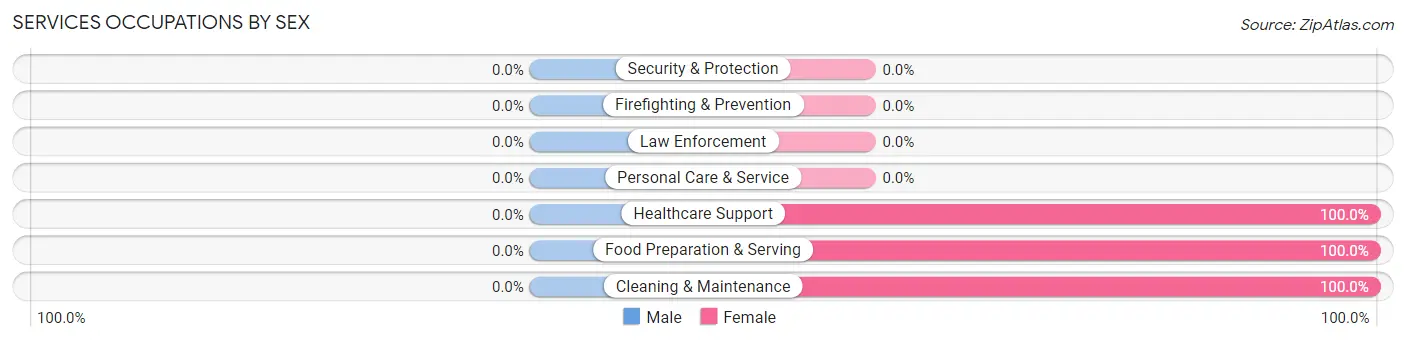
| Occupation | Male | Female |
| Healthcare Support | 0 (0.0%) | 10 (100.0%) |
| Security & Protection | 0 (0.0%) | 0 (0.0%) |
| Firefighting & Prevention | 0 (0.0%) | 0 (0.0%) |
| Law Enforcement | 0 (0.0%) | 0 (0.0%) |
| Food Preparation & Serving | 0 (0.0%) | 4 (100.0%) |
| Cleaning & Maintenance | 0 (0.0%) | 4 (100.0%) |
| Personal Care & Service | 0 (0.0%) | 0 (0.0%) |
| Total (Category) | 0 (0.0%) | 18 (100.0%) |
| Total (Overall) | 122 (51.5%) | 115 (48.5%) |
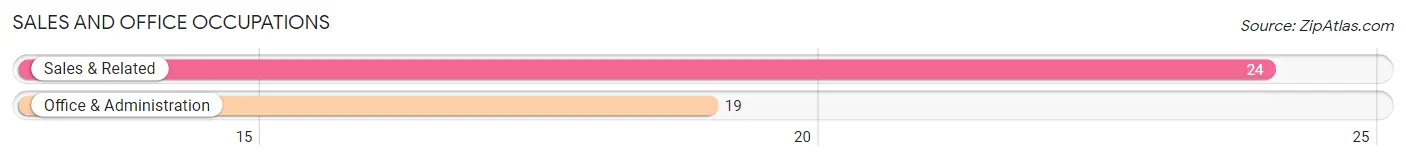
Sales and Office Occupations
The most common Sales and Office occupations in Cairnbrook are Sales & Related (24 | 10.1%), and Office & Administration (19 | 8.0%).
Sales and Office Occupations by Sex
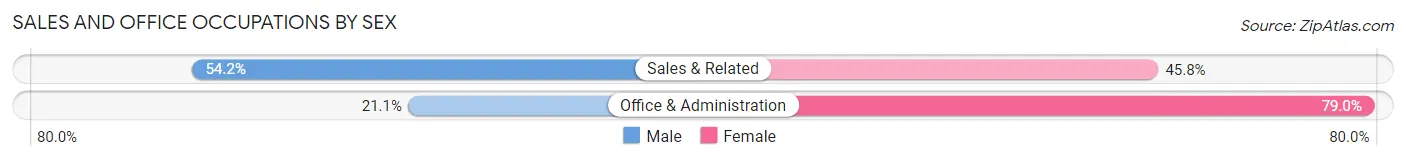
| Occupation | Male | Female |
| Sales & Related | 13 (54.2%) | 11 (45.8%) |
| Office & Administration | 4 (21.0%) | 15 (78.9%) |
| Total (Category) | 17 (39.5%) | 26 (60.5%) |
| Total (Overall) | 122 (51.5%) | 115 (48.5%) |
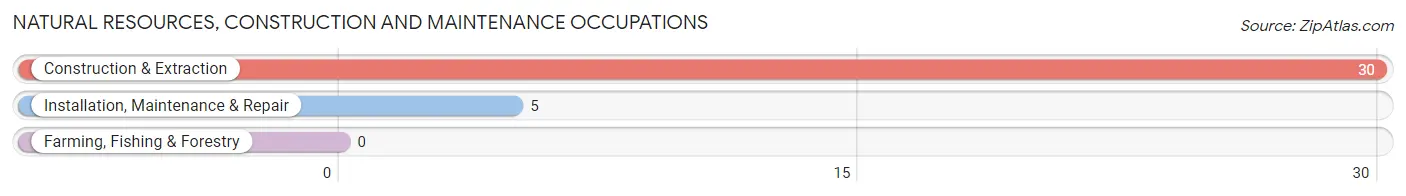
Natural Resources, Construction and Maintenance Occupations
The most common Natural Resources, Construction and Maintenance occupations in Cairnbrook are Construction & Extraction (30 | 12.7%), and Installation, Maintenance & Repair (5 | 2.1%).
Natural Resources, Construction and Maintenance Occupations by Sex
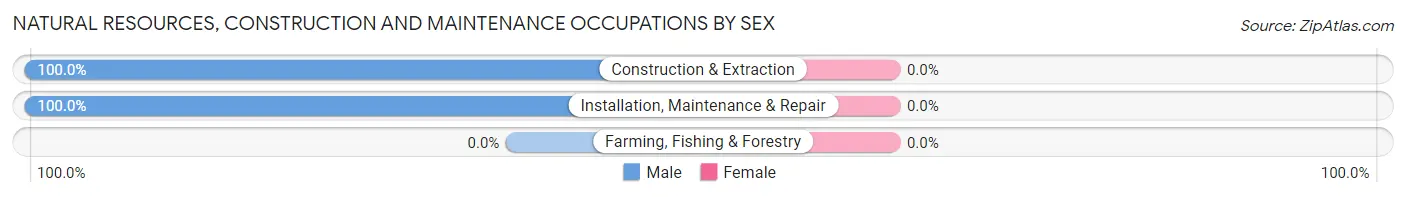
| Occupation | Male | Female |
| Farming, Fishing & Forestry | 0 (0.0%) | 0 (0.0%) |
| Construction & Extraction | 30 (100.0%) | 0 (0.0%) |
| Installation, Maintenance & Repair | 5 (100.0%) | 0 (0.0%) |
| Total (Category) | 35 (100.0%) | 0 (0.0%) |
| Total (Overall) | 122 (51.5%) | 115 (48.5%) |
Production, Transportation and Moving Occupations
The most common Production, Transportation and Moving occupations in Cairnbrook are Material Moving (14 | 5.9%), Production (5 | 2.1%), and Transportation (4 | 1.7%).
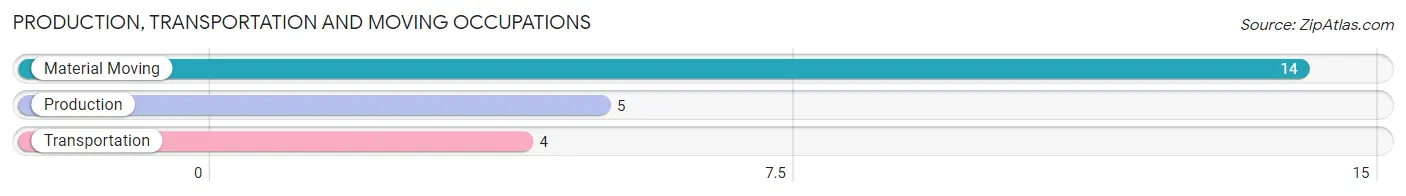
Production, Transportation and Moving Occupations by Sex
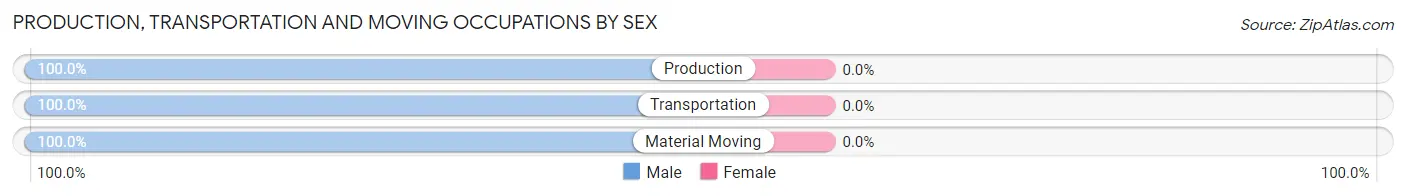
| Occupation | Male | Female |
| Production | 5 (100.0%) | 0 (0.0%) |
| Transportation | 4 (100.0%) | 0 (0.0%) |
| Material Moving | 14 (100.0%) | 0 (0.0%) |
| Total (Category) | 23 (100.0%) | 0 (0.0%) |
| Total (Overall) | 122 (51.5%) | 115 (48.5%) |
Employment Industries by Sex in Cairnbrook
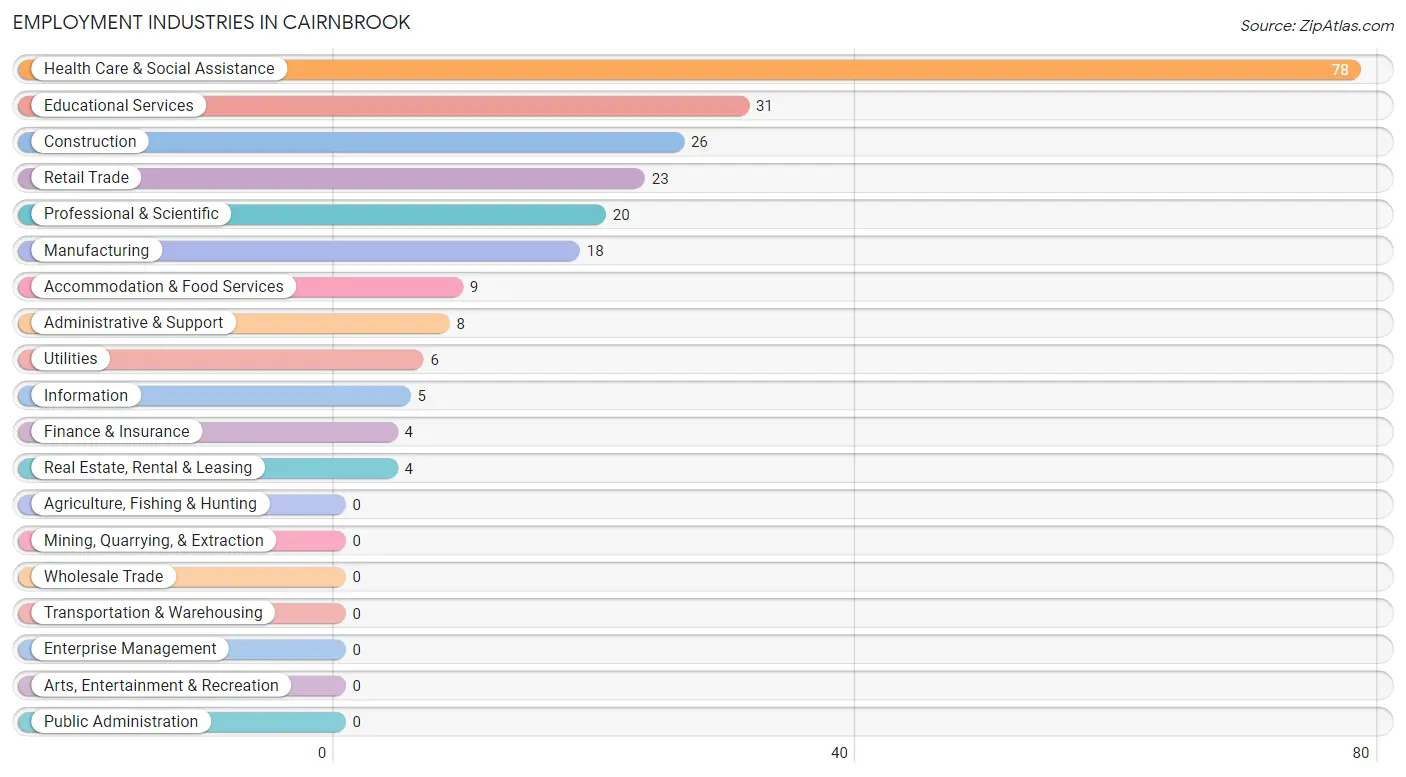
Employment Industries in Cairnbrook
The major employment industries in Cairnbrook include Health Care & Social Assistance (78 | 32.9%), Educational Services (31 | 13.1%), Construction (26 | 11.0%), Retail Trade (23 | 9.7%), and Professional & Scientific (20 | 8.4%).
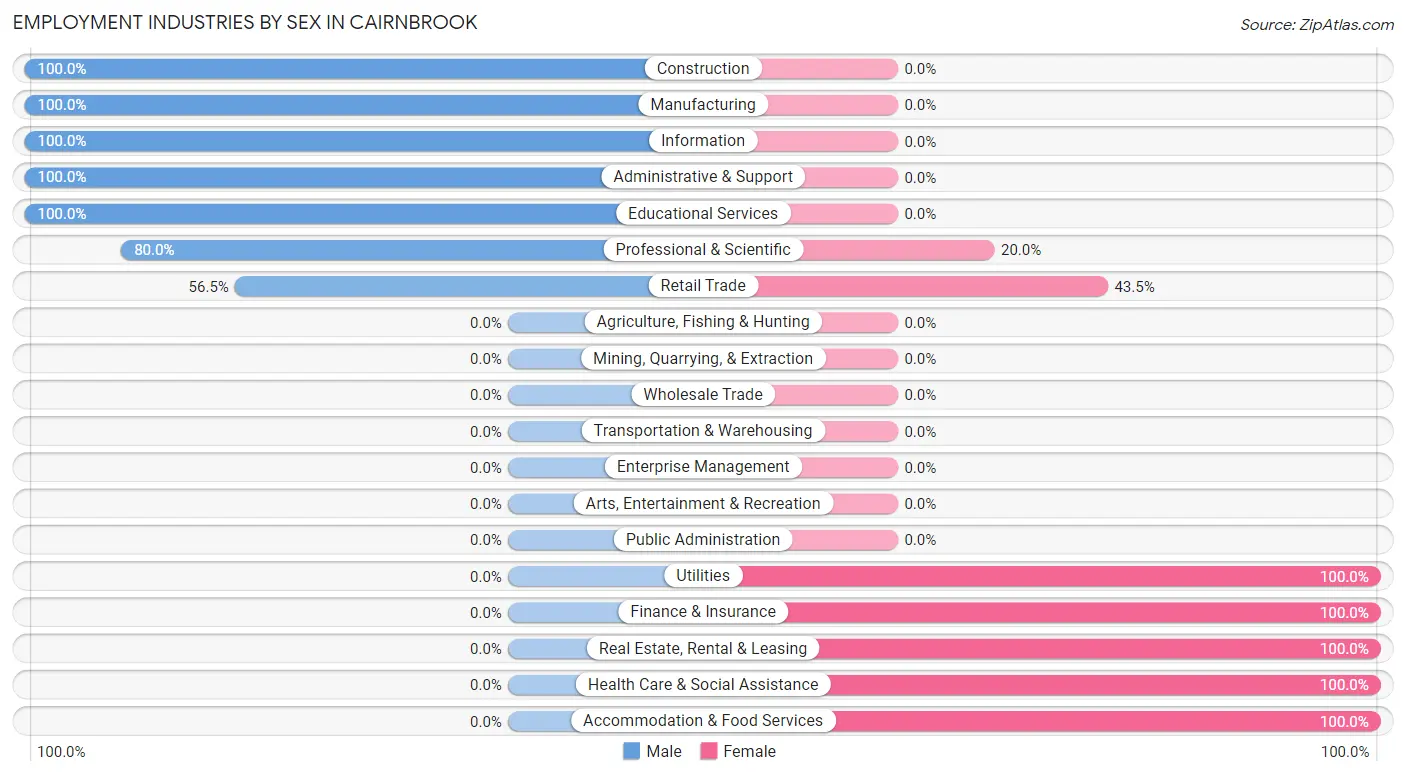
Employment Industries by Sex in Cairnbrook
The Cairnbrook industries that see more men than women are Construction (100.0%), Manufacturing (100.0%), and Information (100.0%), whereas the industries that tend to have a higher number of women are Utilities (100.0%), Finance & Insurance (100.0%), and Real Estate, Rental & Leasing (100.0%).
| Industry | Male | Female |
| Agriculture, Fishing & Hunting | 0 (0.0%) | 0 (0.0%) |
| Mining, Quarrying, & Extraction | 0 (0.0%) | 0 (0.0%) |
| Construction | 26 (100.0%) | 0 (0.0%) |
| Manufacturing | 18 (100.0%) | 0 (0.0%) |
| Wholesale Trade | 0 (0.0%) | 0 (0.0%) |
| Retail Trade | 13 (56.5%) | 10 (43.5%) |
| Transportation & Warehousing | 0 (0.0%) | 0 (0.0%) |
| Utilities | 0 (0.0%) | 6 (100.0%) |
| Information | 5 (100.0%) | 0 (0.0%) |
| Finance & Insurance | 0 (0.0%) | 4 (100.0%) |
| Real Estate, Rental & Leasing | 0 (0.0%) | 4 (100.0%) |
| Professional & Scientific | 16 (80.0%) | 4 (20.0%) |
| Enterprise Management | 0 (0.0%) | 0 (0.0%) |
| Administrative & Support | 8 (100.0%) | 0 (0.0%) |
| Educational Services | 31 (100.0%) | 0 (0.0%) |
| Health Care & Social Assistance | 0 (0.0%) | 78 (100.0%) |
| Arts, Entertainment & Recreation | 0 (0.0%) | 0 (0.0%) |
| Accommodation & Food Services | 0 (0.0%) | 9 (100.0%) |
| Public Administration | 0 (0.0%) | 0 (0.0%) |
| Total | 122 (51.5%) | 115 (48.5%) |
Education in Cairnbrook
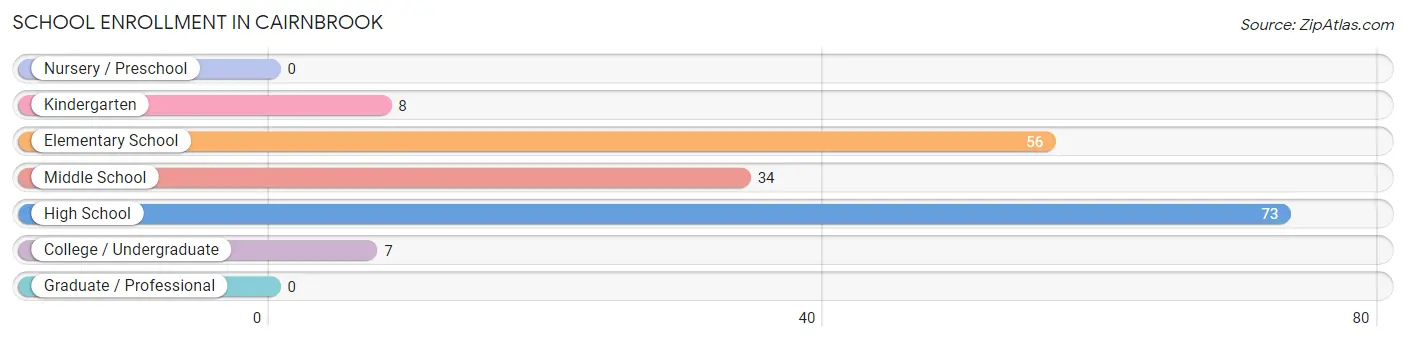
School Enrollment in Cairnbrook
The most common levels of schooling among the 178 students in Cairnbrook are high school (73 | 41.0%), elementary school (56 | 31.5%), and middle school (34 | 19.1%).
| School Level | # Students | % Students |
| Nursery / Preschool | 0 | 0.0% |
| Kindergarten | 8 | 4.5% |
| Elementary School | 56 | 31.5% |
| Middle School | 34 | 19.1% |
| High School | 73 | 41.0% |
| College / Undergraduate | 7 | 3.9% |
| Graduate / Professional | 0 | 0.0% |
| Total | 178 | 100.0% |
School Enrollment by Age by Funding Source in Cairnbrook
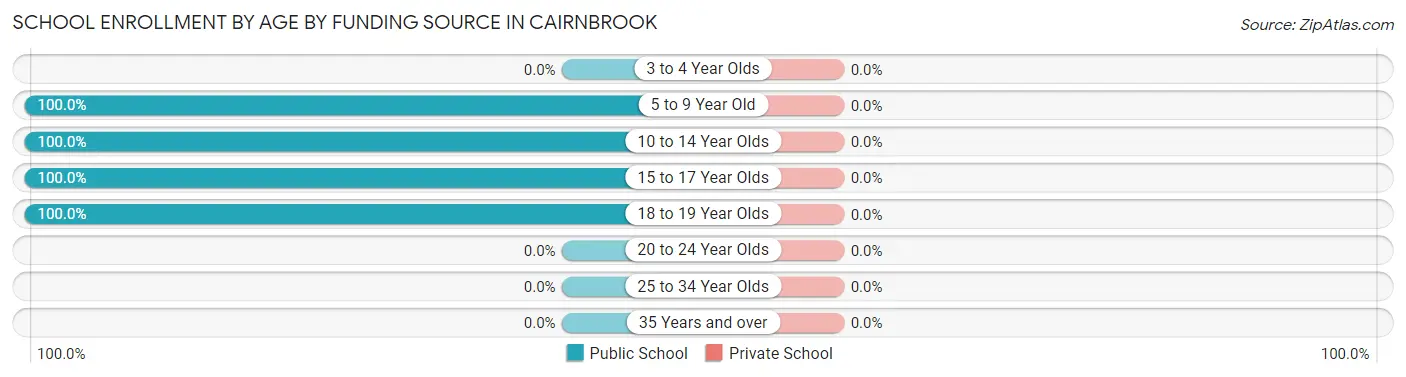
| Age Bracket | Public School | Private School |
| 3 to 4 Year Olds | 0 (0.0%) | 0 (0.0%) |
| 5 to 9 Year Old | 64 (100.0%) | 0 (0.0%) |
| 10 to 14 Year Olds | 34 (100.0%) | 0 (0.0%) |
| 15 to 17 Year Olds | 73 (100.0%) | 0 (0.0%) |
| 18 to 19 Year Olds | 7 (100.0%) | 0 (0.0%) |
| 20 to 24 Year Olds | 0 (0.0%) | 0 (0.0%) |
| 25 to 34 Year Olds | 0 (0.0%) | 0 (0.0%) |
| 35 Years and over | 0 (0.0%) | 0 (0.0%) |
| Total | 178 (100.0%) | 0 (0.0%) |
Educational Attainment by Field of Study in Cairnbrook
Computers & mathematics (16 | 57.1%), science & technology (4 | 14.3%), business (4 | 14.3%), and education (4 | 14.3%) are the most common fields of study among 28 individuals in Cairnbrook who have obtained a bachelor's degree or higher.
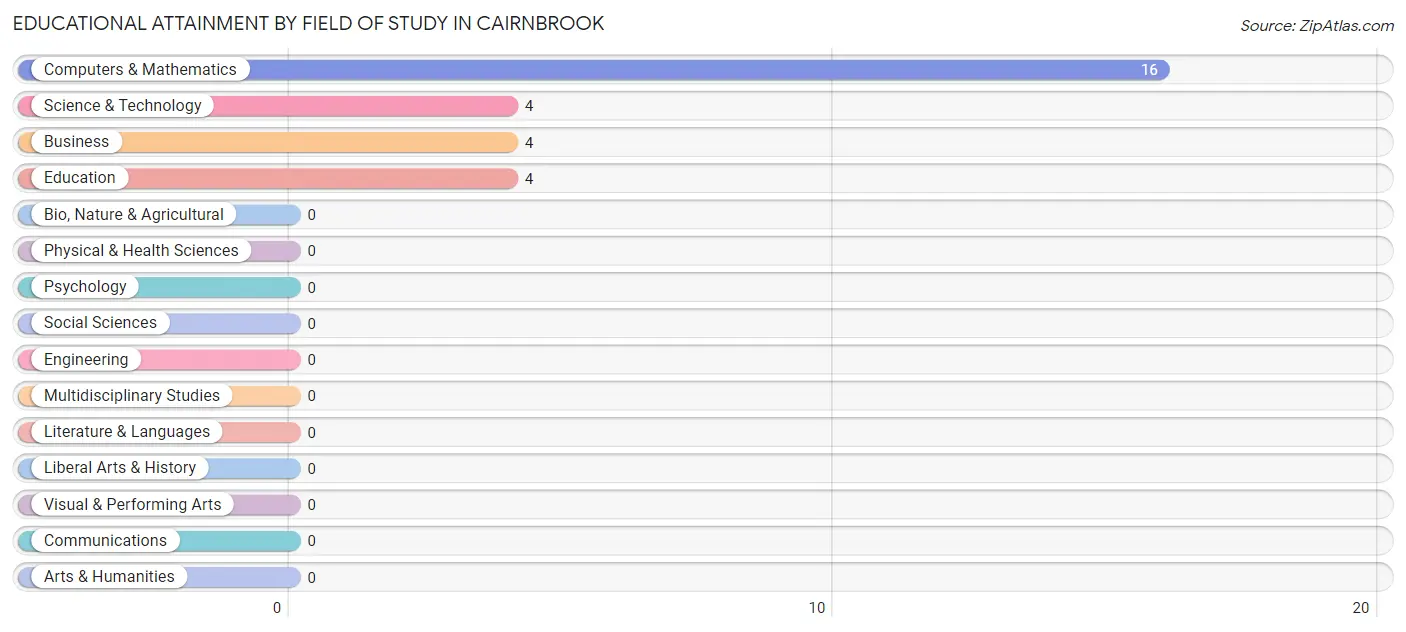
| Field of Study | # Graduates | % Graduates |
| Computers & Mathematics | 16 | 57.1% |
| Bio, Nature & Agricultural | 0 | 0.0% |
| Physical & Health Sciences | 0 | 0.0% |
| Psychology | 0 | 0.0% |
| Social Sciences | 0 | 0.0% |
| Engineering | 0 | 0.0% |
| Multidisciplinary Studies | 0 | 0.0% |
| Science & Technology | 4 | 14.3% |
| Business | 4 | 14.3% |
| Education | 4 | 14.3% |
| Literature & Languages | 0 | 0.0% |
| Liberal Arts & History | 0 | 0.0% |
| Visual & Performing Arts | 0 | 0.0% |
| Communications | 0 | 0.0% |
| Arts & Humanities | 0 | 0.0% |
| Total | 28 | 100.0% |
Transportation & Commute in Cairnbrook
Vehicle Availability by Sex in Cairnbrook
The most prevalent vehicle ownership categories in Cairnbrook are males with 2 vehicles (67, accounting for 54.9%) and females with 2 vehicles (54, making up 61.5%).
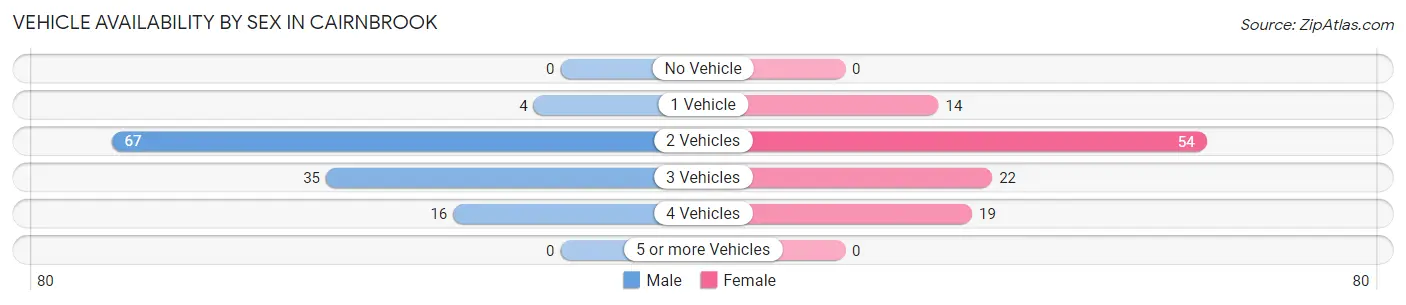
| Vehicles Available | Male | Female |
| No Vehicle | 0 (0.0%) | 0 (0.0%) |
| 1 Vehicle | 4 (3.3%) | 14 (12.8%) |
| 2 Vehicles | 67 (54.9%) | 54 (49.5%) |
| 3 Vehicles | 35 (28.7%) | 22 (20.2%) |
| 4 Vehicles | 16 (13.1%) | 19 (17.4%) |
| 5 or more Vehicles | 0 (0.0%) | 0 (0.0%) |
| Total | 122 (100.0%) | 109 (100.0%) |
Commute Time in Cairnbrook
The most frequently occuring commute durations in Cairnbrook are 30 to 34 minutes (75 commuters, 33.0%), 15 to 19 minutes (35 commuters, 15.4%), and 20 to 24 minutes (35 commuters, 15.4%).
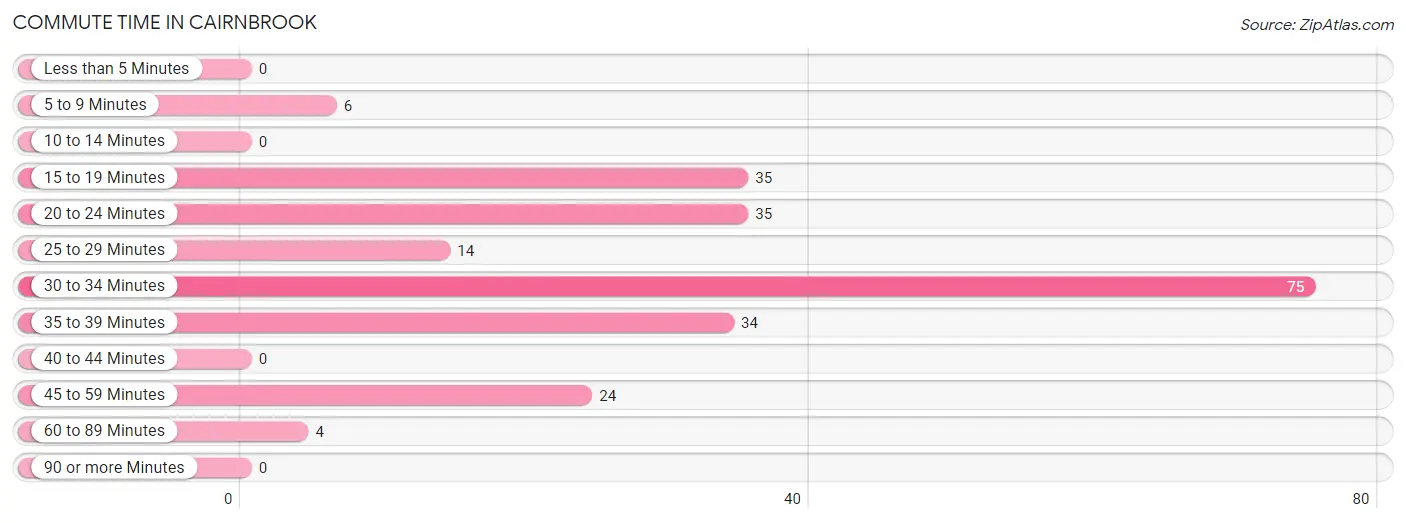
| Commute Time | # Commuters | % Commuters |
| Less than 5 Minutes | 0 | 0.0% |
| 5 to 9 Minutes | 6 | 2.6% |
| 10 to 14 Minutes | 0 | 0.0% |
| 15 to 19 Minutes | 35 | 15.4% |
| 20 to 24 Minutes | 35 | 15.4% |
| 25 to 29 Minutes | 14 | 6.2% |
| 30 to 34 Minutes | 75 | 33.0% |
| 35 to 39 Minutes | 34 | 15.0% |
| 40 to 44 Minutes | 0 | 0.0% |
| 45 to 59 Minutes | 24 | 10.6% |
| 60 to 89 Minutes | 4 | 1.8% |
| 90 or more Minutes | 0 | 0.0% |
Commute Time by Sex in Cairnbrook
The most common commute times in Cairnbrook are 15 to 19 minutes (31 commuters, 25.4%) for males and 30 to 34 minutes (51 commuters, 48.6%) for females.
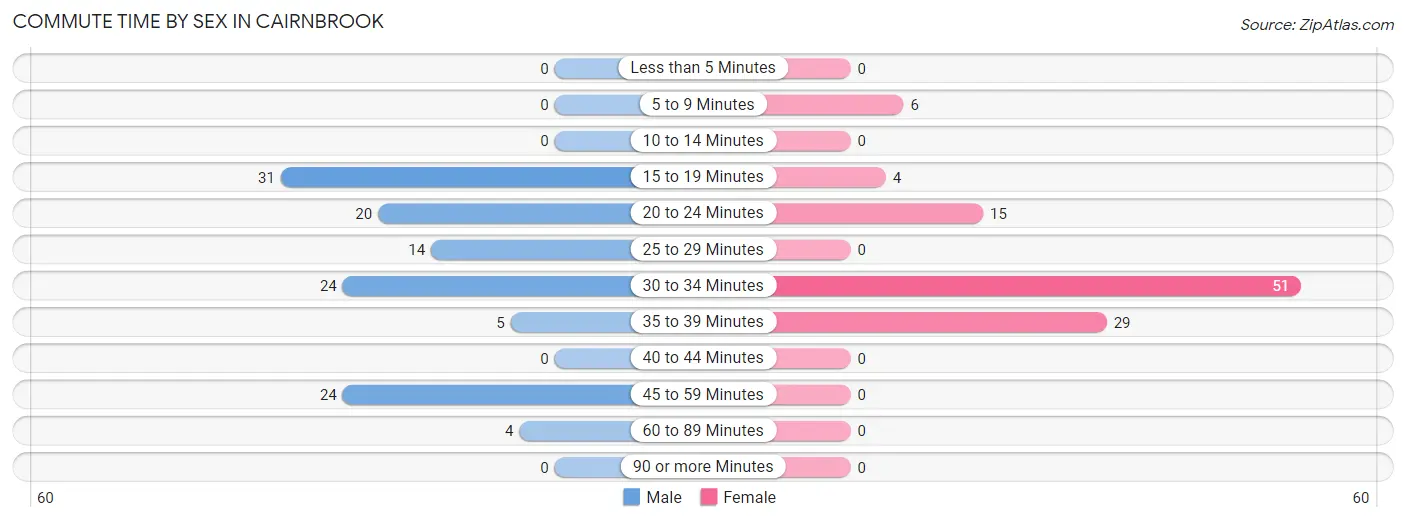
| Commute Time | Male | Female |
| Less than 5 Minutes | 0 (0.0%) | 0 (0.0%) |
| 5 to 9 Minutes | 0 (0.0%) | 6 (5.7%) |
| 10 to 14 Minutes | 0 (0.0%) | 0 (0.0%) |
| 15 to 19 Minutes | 31 (25.4%) | 4 (3.8%) |
| 20 to 24 Minutes | 20 (16.4%) | 15 (14.3%) |
| 25 to 29 Minutes | 14 (11.5%) | 0 (0.0%) |
| 30 to 34 Minutes | 24 (19.7%) | 51 (48.6%) |
| 35 to 39 Minutes | 5 (4.1%) | 29 (27.6%) |
| 40 to 44 Minutes | 0 (0.0%) | 0 (0.0%) |
| 45 to 59 Minutes | 24 (19.7%) | 0 (0.0%) |
| 60 to 89 Minutes | 4 (3.3%) | 0 (0.0%) |
| 90 or more Minutes | 0 (0.0%) | 0 (0.0%) |
Time of Departure to Work by Sex in Cairnbrook
The most frequent times of departure to work in Cairnbrook are 12:00 PM to 3:59 PM (31, 25.4%) for males and 6:00 AM to 6:29 AM (47, 44.8%) for females.
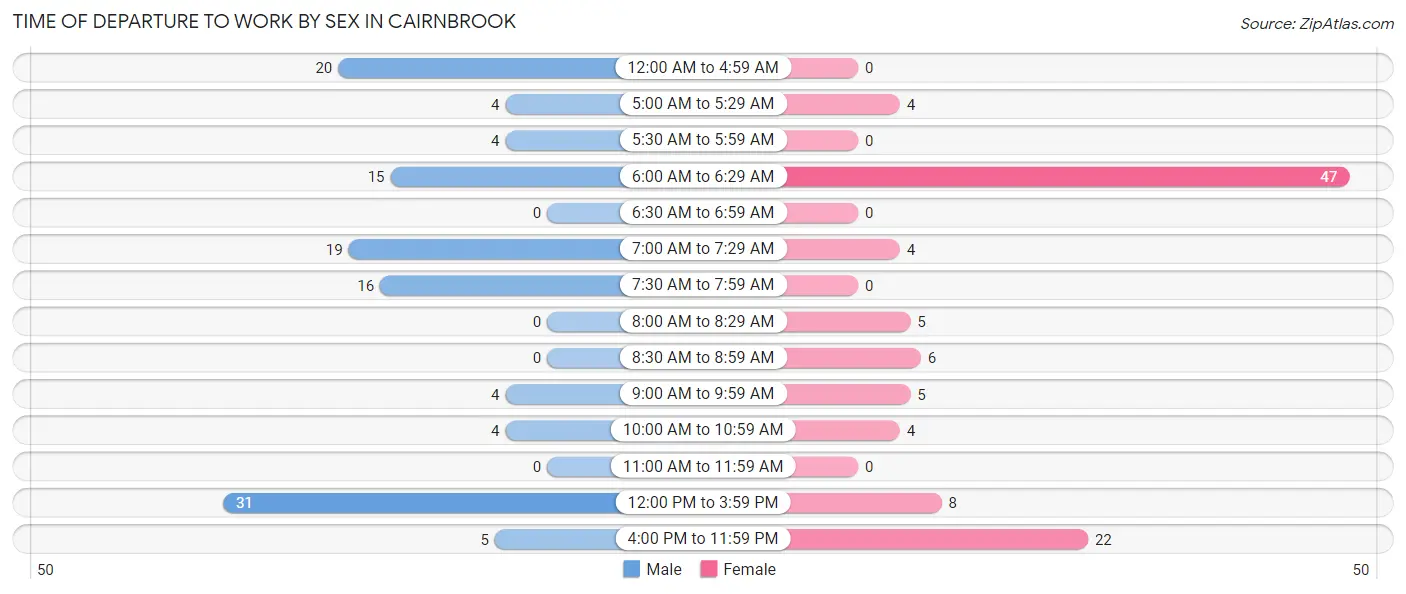
| Time of Departure | Male | Female |
| 12:00 AM to 4:59 AM | 20 (16.4%) | 0 (0.0%) |
| 5:00 AM to 5:29 AM | 4 (3.3%) | 4 (3.8%) |
| 5:30 AM to 5:59 AM | 4 (3.3%) | 0 (0.0%) |
| 6:00 AM to 6:29 AM | 15 (12.3%) | 47 (44.8%) |
| 6:30 AM to 6:59 AM | 0 (0.0%) | 0 (0.0%) |
| 7:00 AM to 7:29 AM | 19 (15.6%) | 4 (3.8%) |
| 7:30 AM to 7:59 AM | 16 (13.1%) | 0 (0.0%) |
| 8:00 AM to 8:29 AM | 0 (0.0%) | 5 (4.8%) |
| 8:30 AM to 8:59 AM | 0 (0.0%) | 6 (5.7%) |
| 9:00 AM to 9:59 AM | 4 (3.3%) | 5 (4.8%) |
| 10:00 AM to 10:59 AM | 4 (3.3%) | 4 (3.8%) |
| 11:00 AM to 11:59 AM | 0 (0.0%) | 0 (0.0%) |
| 12:00 PM to 3:59 PM | 31 (25.4%) | 8 (7.6%) |
| 4:00 PM to 11:59 PM | 5 (4.1%) | 22 (20.9%) |
| Total | 122 (100.0%) | 105 (100.0%) |
Housing Occupancy in Cairnbrook
Occupancy by Ownership in Cairnbrook
Of the total 173 dwellings in Cairnbrook, owner-occupied units account for 151 (87.3%), while renter-occupied units make up 22 (12.7%).
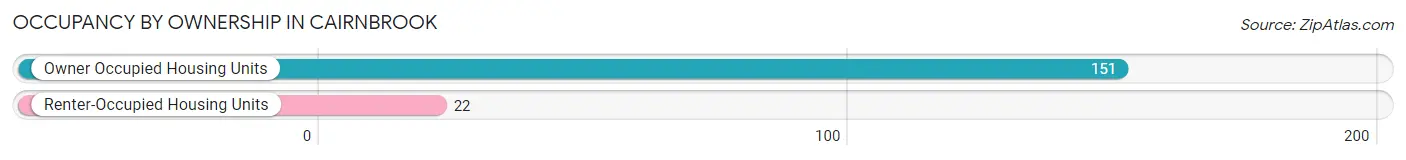
| Occupancy | # Housing Units | % Housing Units |
| Owner Occupied Housing Units | 151 | 87.3% |
| Renter-Occupied Housing Units | 22 | 12.7% |
| Total Occupied Housing Units | 173 | 100.0% |
Occupancy by Household Size in Cairnbrook
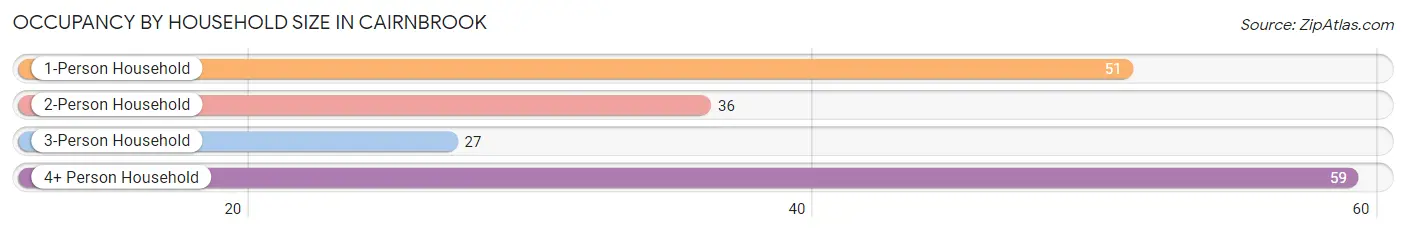
| Household Size | # Housing Units | % Housing Units |
| 1-Person Household | 51 | 29.5% |
| 2-Person Household | 36 | 20.8% |
| 3-Person Household | 27 | 15.6% |
| 4+ Person Household | 59 | 34.1% |
| Total Housing Units | 173 | 100.0% |
Occupancy by Ownership by Household Size in Cairnbrook
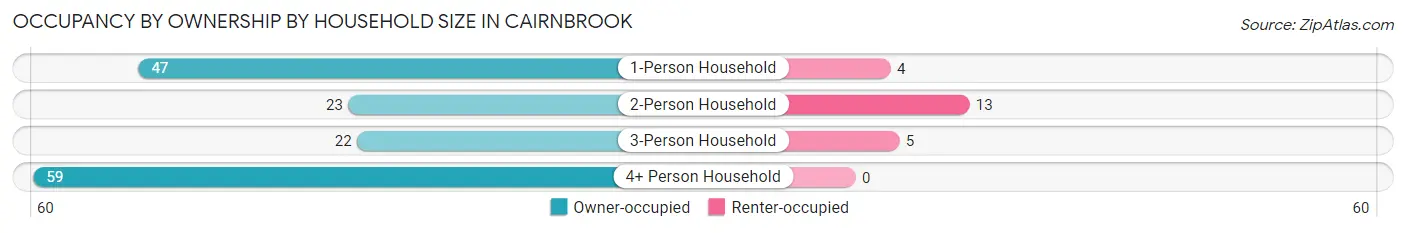
| Household Size | Owner-occupied | Renter-occupied |
| 1-Person Household | 47 (92.2%) | 4 (7.8%) |
| 2-Person Household | 23 (63.9%) | 13 (36.1%) |
| 3-Person Household | 22 (81.5%) | 5 (18.5%) |
| 4+ Person Household | 59 (100.0%) | 0 (0.0%) |
| Total Housing Units | 151 (87.3%) | 22 (12.7%) |
Occupancy by Educational Attainment in Cairnbrook
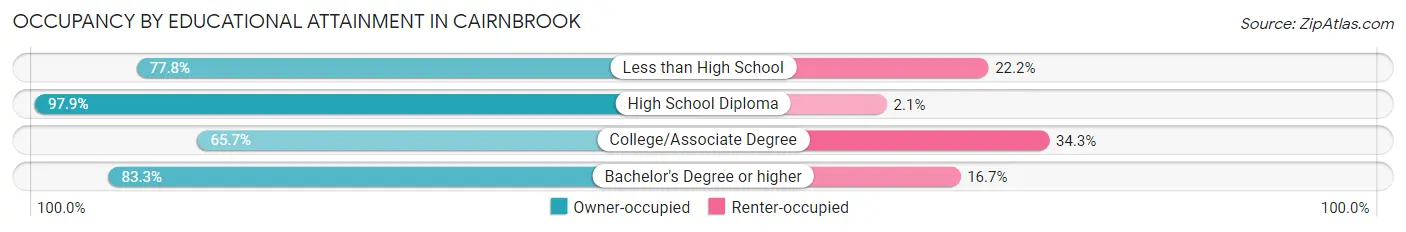
| Household Size | Owner-occupied | Renter-occupied |
| Less than High School | 14 (77.8%) | 4 (22.2%) |
| High School Diploma | 94 (97.9%) | 2 (2.1%) |
| College/Associate Degree | 23 (65.7%) | 12 (34.3%) |
| Bachelor's Degree or higher | 20 (83.3%) | 4 (16.7%) |
Occupancy by Age of Householder in Cairnbrook
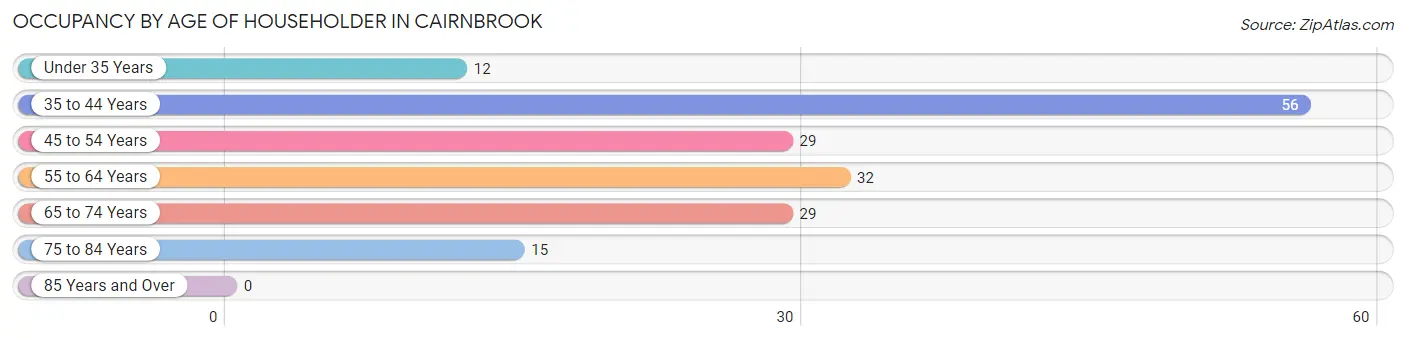
| Age Bracket | # Households | % Households |
| Under 35 Years | 12 | 6.9% |
| 35 to 44 Years | 56 | 32.4% |
| 45 to 54 Years | 29 | 16.8% |
| 55 to 64 Years | 32 | 18.5% |
| 65 to 74 Years | 29 | 16.8% |
| 75 to 84 Years | 15 | 8.7% |
| 85 Years and Over | 0 | 0.0% |
| Total | 173 | 100.0% |
Housing Finances in Cairnbrook
Median Income by Occupancy in Cairnbrook
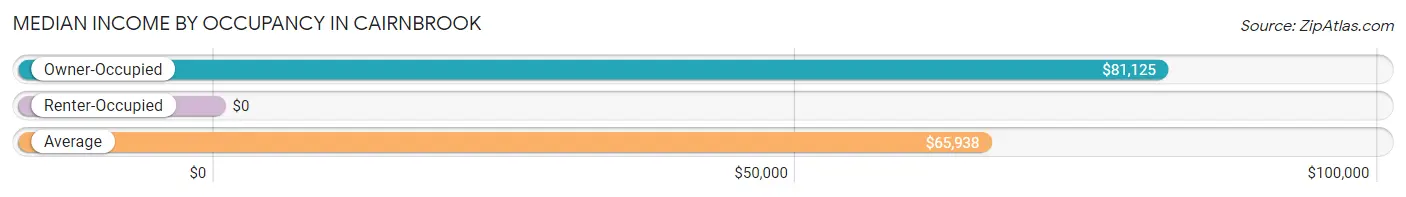
| Occupancy Type | # Households | Median Income |
| Owner-Occupied | 151 (87.3%) | $81,125 |
| Renter-Occupied | 22 (12.7%) | $0 |
| Average | 173 (100.0%) | $65,938 |
Occupancy by Householder Income Bracket in Cairnbrook
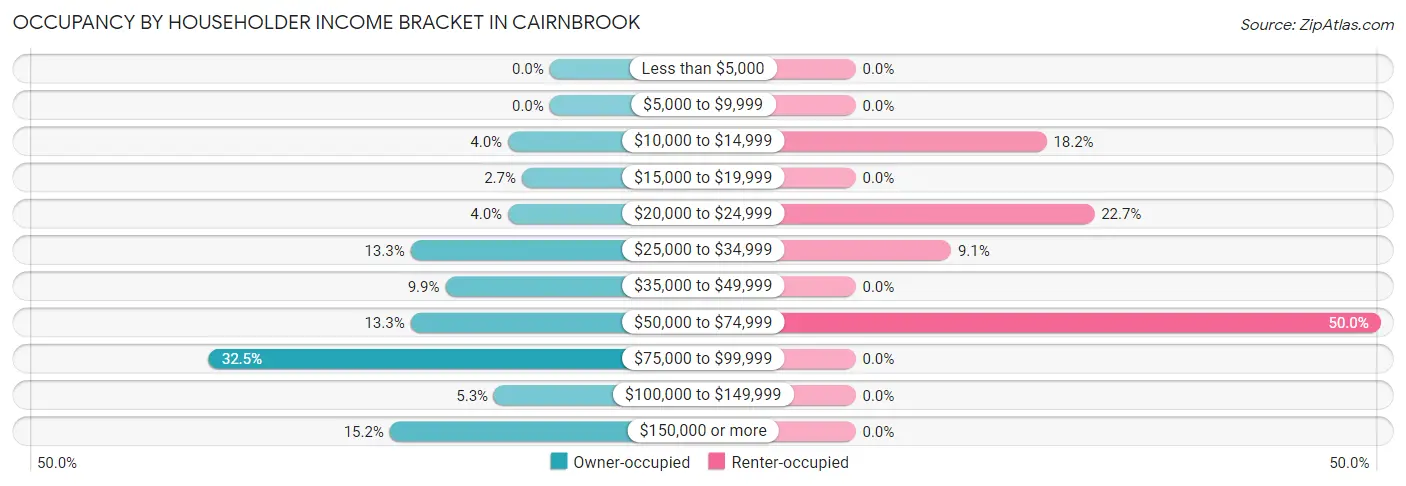
| Income Bracket | Owner-occupied | Renter-occupied |
| Less than $5,000 | 0 (0.0%) | 0 (0.0%) |
| $5,000 to $9,999 | 0 (0.0%) | 0 (0.0%) |
| $10,000 to $14,999 | 6 (4.0%) | 4 (18.2%) |
| $15,000 to $19,999 | 4 (2.6%) | 0 (0.0%) |
| $20,000 to $24,999 | 6 (4.0%) | 5 (22.7%) |
| $25,000 to $34,999 | 20 (13.3%) | 2 (9.1%) |
| $35,000 to $49,999 | 15 (9.9%) | 0 (0.0%) |
| $50,000 to $74,999 | 20 (13.3%) | 11 (50.0%) |
| $75,000 to $99,999 | 49 (32.5%) | 0 (0.0%) |
| $100,000 to $149,999 | 8 (5.3%) | 0 (0.0%) |
| $150,000 or more | 23 (15.2%) | 0 (0.0%) |
| Total | 151 (100.0%) | 22 (100.0%) |
Monthly Housing Cost Tiers in Cairnbrook
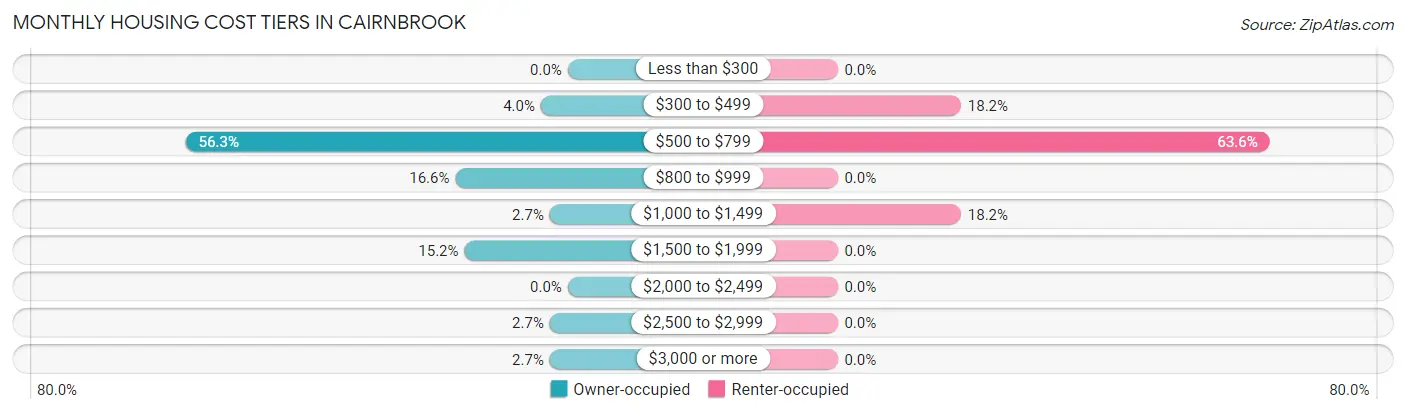
| Monthly Cost | Owner-occupied | Renter-occupied |
| Less than $300 | 0 (0.0%) | 0 (0.0%) |
| $300 to $499 | 6 (4.0%) | 4 (18.2%) |
| $500 to $799 | 85 (56.3%) | 14 (63.6%) |
| $800 to $999 | 25 (16.6%) | 0 (0.0%) |
| $1,000 to $1,499 | 4 (2.6%) | 4 (18.2%) |
| $1,500 to $1,999 | 23 (15.2%) | 0 (0.0%) |
| $2,000 to $2,499 | 0 (0.0%) | 0 (0.0%) |
| $2,500 to $2,999 | 4 (2.6%) | 0 (0.0%) |
| $3,000 or more | 4 (2.6%) | 0 (0.0%) |
| Total | 151 (100.0%) | 22 (100.0%) |
Physical Housing Characteristics in Cairnbrook
Housing Structures in Cairnbrook
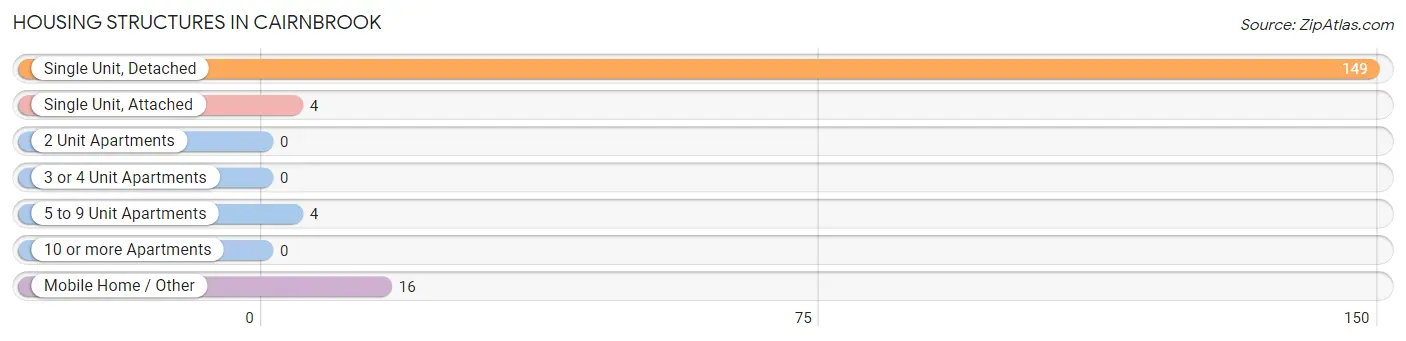
| Structure Type | # Housing Units | % Housing Units |
| Single Unit, Detached | 149 | 86.1% |
| Single Unit, Attached | 4 | 2.3% |
| 2 Unit Apartments | 0 | 0.0% |
| 3 or 4 Unit Apartments | 0 | 0.0% |
| 5 to 9 Unit Apartments | 4 | 2.3% |
| 10 or more Apartments | 0 | 0.0% |
| Mobile Home / Other | 16 | 9.2% |
| Total | 173 | 100.0% |
Housing Structures by Occupancy in Cairnbrook
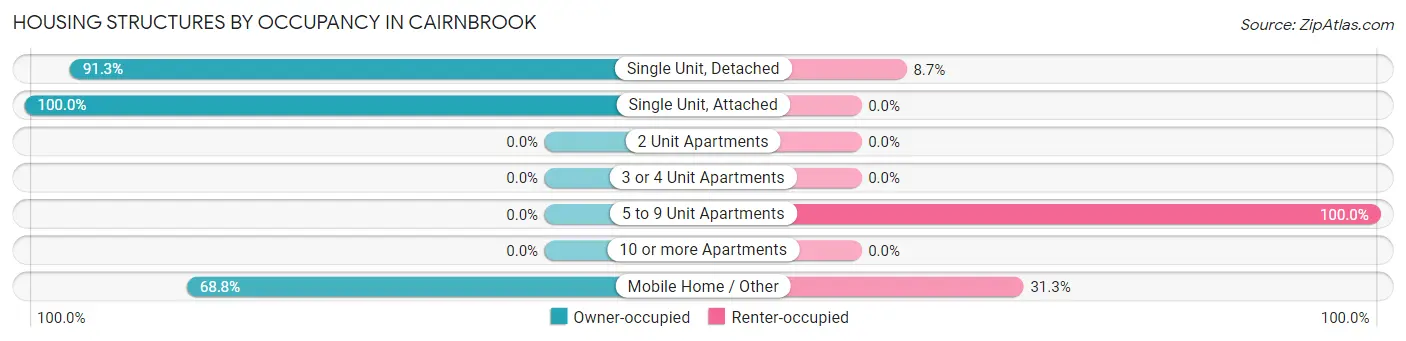
| Structure Type | Owner-occupied | Renter-occupied |
| Single Unit, Detached | 136 (91.3%) | 13 (8.7%) |
| Single Unit, Attached | 4 (100.0%) | 0 (0.0%) |
| 2 Unit Apartments | 0 (0.0%) | 0 (0.0%) |
| 3 or 4 Unit Apartments | 0 (0.0%) | 0 (0.0%) |
| 5 to 9 Unit Apartments | 0 (0.0%) | 4 (100.0%) |
| 10 or more Apartments | 0 (0.0%) | 0 (0.0%) |
| Mobile Home / Other | 11 (68.8%) | 5 (31.2%) |
| Total | 151 (87.3%) | 22 (12.7%) |
Housing Structures by Number of Rooms in Cairnbrook
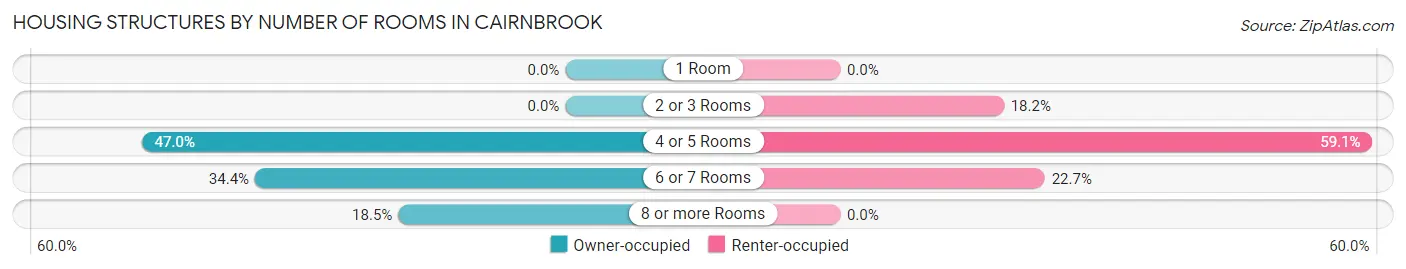
| Number of Rooms | Owner-occupied | Renter-occupied |
| 1 Room | 0 (0.0%) | 0 (0.0%) |
| 2 or 3 Rooms | 0 (0.0%) | 4 (18.2%) |
| 4 or 5 Rooms | 71 (47.0%) | 13 (59.1%) |
| 6 or 7 Rooms | 52 (34.4%) | 5 (22.7%) |
| 8 or more Rooms | 28 (18.5%) | 0 (0.0%) |
| Total | 151 (100.0%) | 22 (100.0%) |
Housing Structure by Heating Type in Cairnbrook
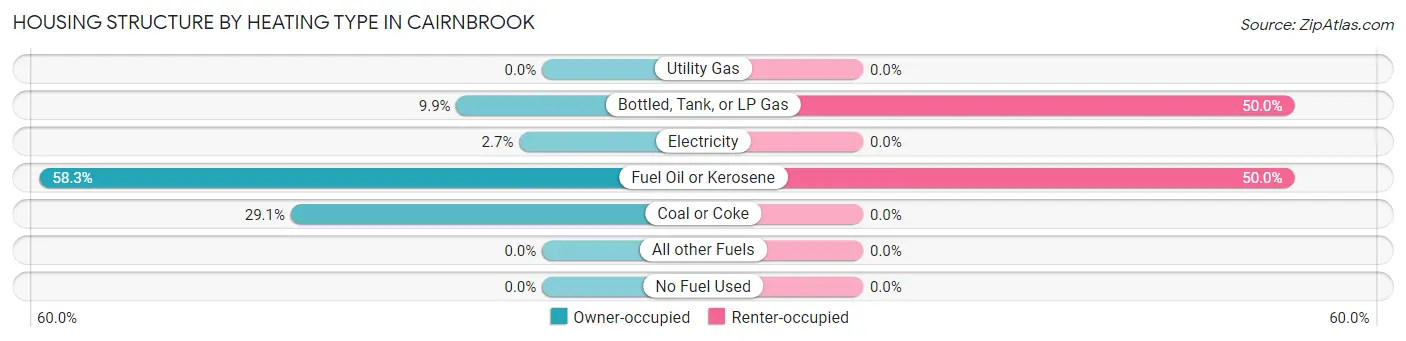
| Heating Type | Owner-occupied | Renter-occupied |
| Utility Gas | 0 (0.0%) | 0 (0.0%) |
| Bottled, Tank, or LP Gas | 15 (9.9%) | 11 (50.0%) |
| Electricity | 4 (2.6%) | 0 (0.0%) |
| Fuel Oil or Kerosene | 88 (58.3%) | 11 (50.0%) |
| Coal or Coke | 44 (29.1%) | 0 (0.0%) |
| All other Fuels | 0 (0.0%) | 0 (0.0%) |
| No Fuel Used | 0 (0.0%) | 0 (0.0%) |
| Total | 151 (100.0%) | 22 (100.0%) |
Household Vehicle Usage in Cairnbrook
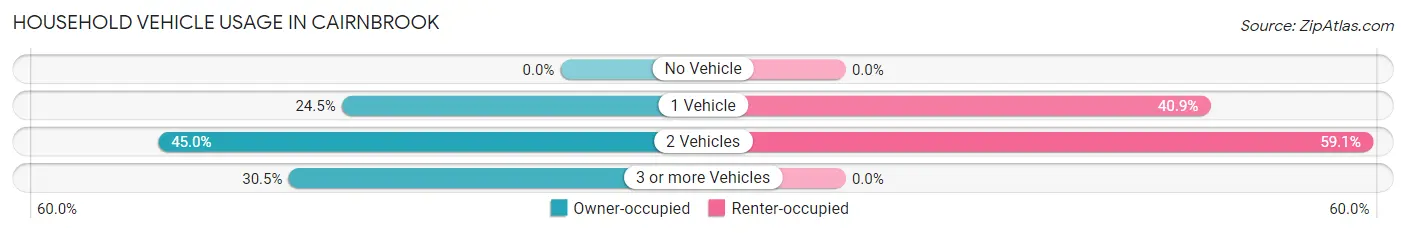
| Vehicles per Household | Owner-occupied | Renter-occupied |
| No Vehicle | 0 (0.0%) | 0 (0.0%) |
| 1 Vehicle | 37 (24.5%) | 9 (40.9%) |
| 2 Vehicles | 68 (45.0%) | 13 (59.1%) |
| 3 or more Vehicles | 46 (30.5%) | 0 (0.0%) |
| Total | 151 (100.0%) | 22 (100.0%) |
Real Estate & Mortgages in Cairnbrook
Real Estate and Mortgage Overview in Cairnbrook
| Characteristic | Without Mortgage | With Mortgage |
| Housing Units | 80 | 71 |
| Median Property Value | $77,400 | $87,700 |
| Median Household Income | $80,417 | $23 |
| Monthly Housing Costs | $671 | $4 |
| Real Estate Taxes | $1,244 | $0 |
Property Value by Mortgage Status in Cairnbrook
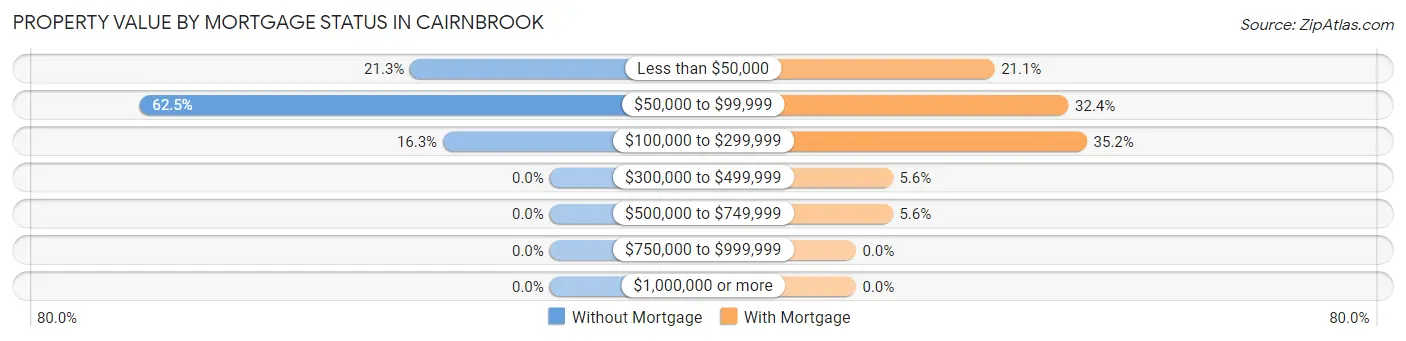
| Property Value | Without Mortgage | With Mortgage |
| Less than $50,000 | 17 (21.2%) | 15 (21.1%) |
| $50,000 to $99,999 | 50 (62.5%) | 23 (32.4%) |
| $100,000 to $299,999 | 13 (16.3%) | 25 (35.2%) |
| $300,000 to $499,999 | 0 (0.0%) | 4 (5.6%) |
| $500,000 to $749,999 | 0 (0.0%) | 4 (5.6%) |
| $750,000 to $999,999 | 0 (0.0%) | 0 (0.0%) |
| $1,000,000 or more | 0 (0.0%) | 0 (0.0%) |
| Total | 80 (100.0%) | 71 (100.0%) |
Household Income by Mortgage Status in Cairnbrook
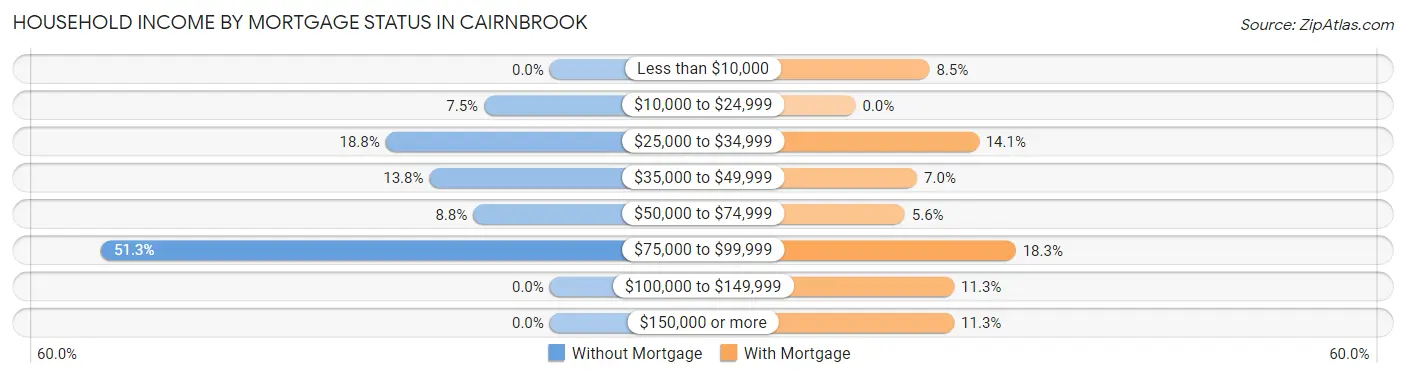
| Household Income | Without Mortgage | With Mortgage |
| Less than $10,000 | 0 (0.0%) | 6 (8.5%) |
| $10,000 to $24,999 | 6 (7.5%) | 0 (0.0%) |
| $25,000 to $34,999 | 15 (18.8%) | 10 (14.1%) |
| $35,000 to $49,999 | 11 (13.8%) | 5 (7.0%) |
| $50,000 to $74,999 | 7 (8.7%) | 4 (5.6%) |
| $75,000 to $99,999 | 41 (51.2%) | 13 (18.3%) |
| $100,000 to $149,999 | 0 (0.0%) | 8 (11.3%) |
| $150,000 or more | 0 (0.0%) | 8 (11.3%) |
| Total | 80 (100.0%) | 71 (100.0%) |
Property Value to Household Income Ratio in Cairnbrook

| Value-to-Income Ratio | Without Mortgage | With Mortgage |
| Less than 2.0x | 59 (73.8%) | 82,188 (115,757.8%) |
| 2.0x to 2.9x | 7 (8.7%) | 54 (76.1%) |
| 3.0x to 3.9x | 14 (17.5%) | 13 (18.3%) |
| 4.0x or more | 0 (0.0%) | 0 (0.0%) |
| Total | 80 (100.0%) | 71 (100.0%) |
Real Estate Taxes by Mortgage Status in Cairnbrook
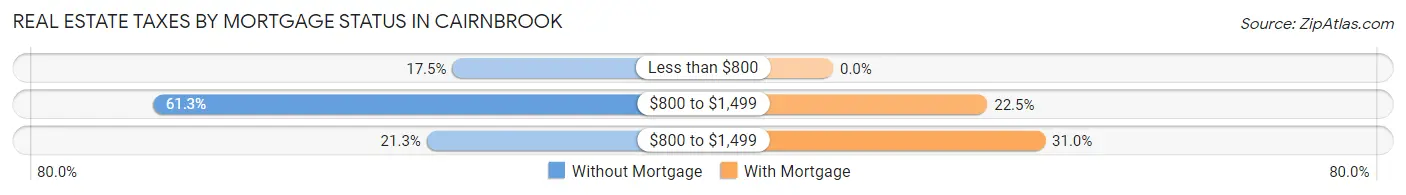
| Property Taxes | Without Mortgage | With Mortgage |
| Less than $800 | 14 (17.5%) | 0 (0.0%) |
| $800 to $1,499 | 49 (61.3%) | 16 (22.5%) |
| $800 to $1,499 | 17 (21.2%) | 22 (31.0%) |
| Total | 80 (100.0%) | 71 (100.0%) |
Health & Disability in Cairnbrook
Health Insurance Coverage by Age in Cairnbrook
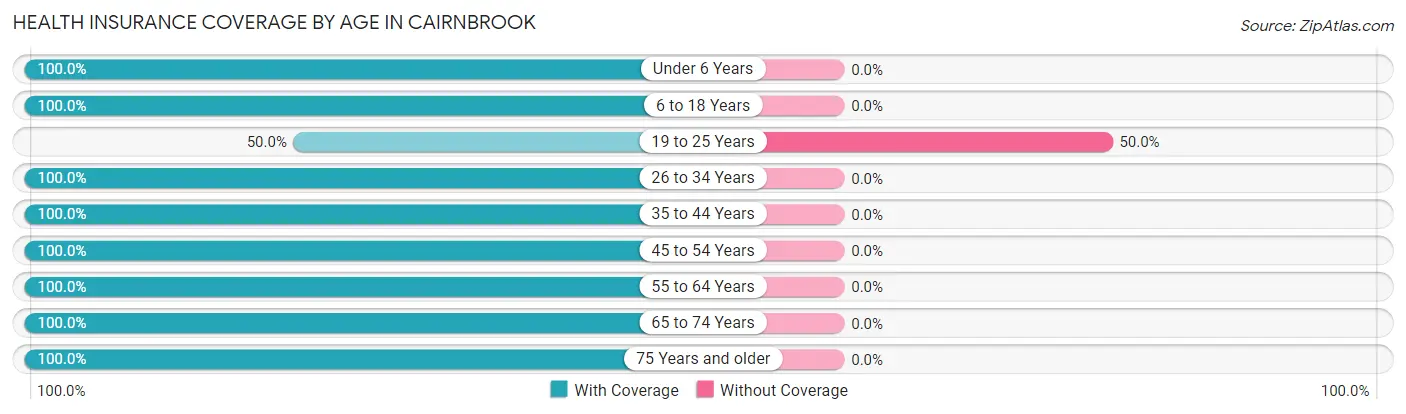
| Age Bracket | With Coverage | Without Coverage |
| Under 6 Years | 19 (100.0%) | 0 (0.0%) |
| 6 to 18 Years | 183 (100.0%) | 0 (0.0%) |
| 19 to 25 Years | 9 (50.0%) | 9 (50.0%) |
| 26 to 34 Years | 32 (100.0%) | 0 (0.0%) |
| 35 to 44 Years | 114 (100.0%) | 0 (0.0%) |
| 45 to 54 Years | 39 (100.0%) | 0 (0.0%) |
| 55 to 64 Years | 64 (100.0%) | 0 (0.0%) |
| 65 to 74 Years | 37 (100.0%) | 0 (0.0%) |
| 75 Years and older | 25 (100.0%) | 0 (0.0%) |
| Total | 522 (98.3%) | 9 (1.7%) |
Health Insurance Coverage by Citizenship Status in Cairnbrook
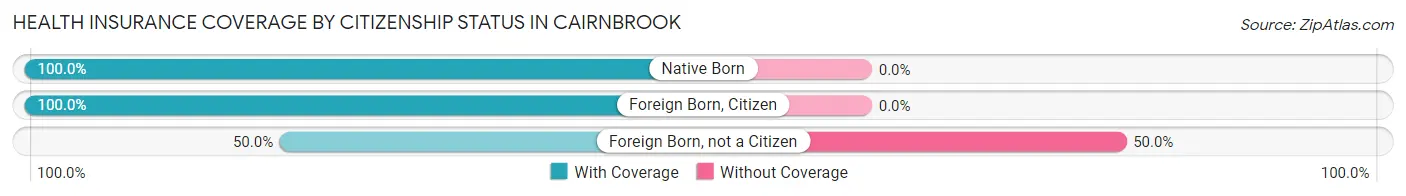
| Citizenship Status | With Coverage | Without Coverage |
| Native Born | 19 (100.0%) | 0 (0.0%) |
| Foreign Born, Citizen | 183 (100.0%) | 0 (0.0%) |
| Foreign Born, not a Citizen | 9 (50.0%) | 9 (50.0%) |
Health Insurance Coverage by Household Income in Cairnbrook
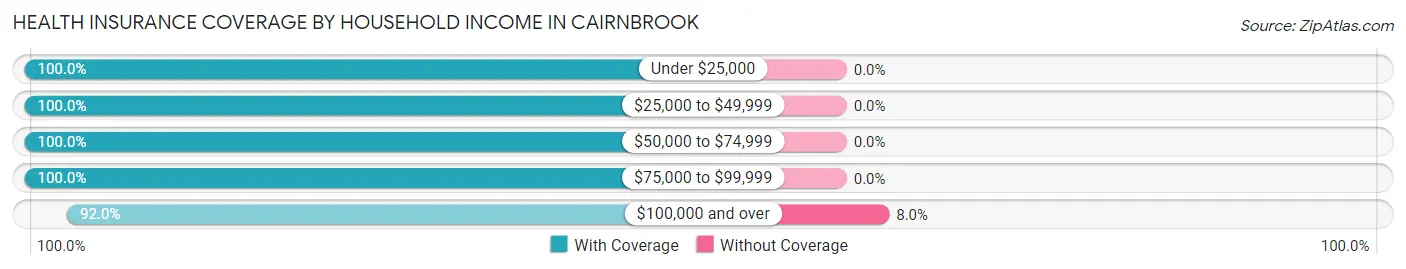
| Household Income | With Coverage | Without Coverage |
| Under $25,000 | 36 (100.0%) | 0 (0.0%) |
| $25,000 to $49,999 | 102 (100.0%) | 0 (0.0%) |
| $50,000 to $74,999 | 60 (100.0%) | 0 (0.0%) |
| $75,000 to $99,999 | 220 (100.0%) | 0 (0.0%) |
| $100,000 and over | 104 (92.0%) | 9 (8.0%) |
Public vs Private Health Insurance Coverage by Age in Cairnbrook
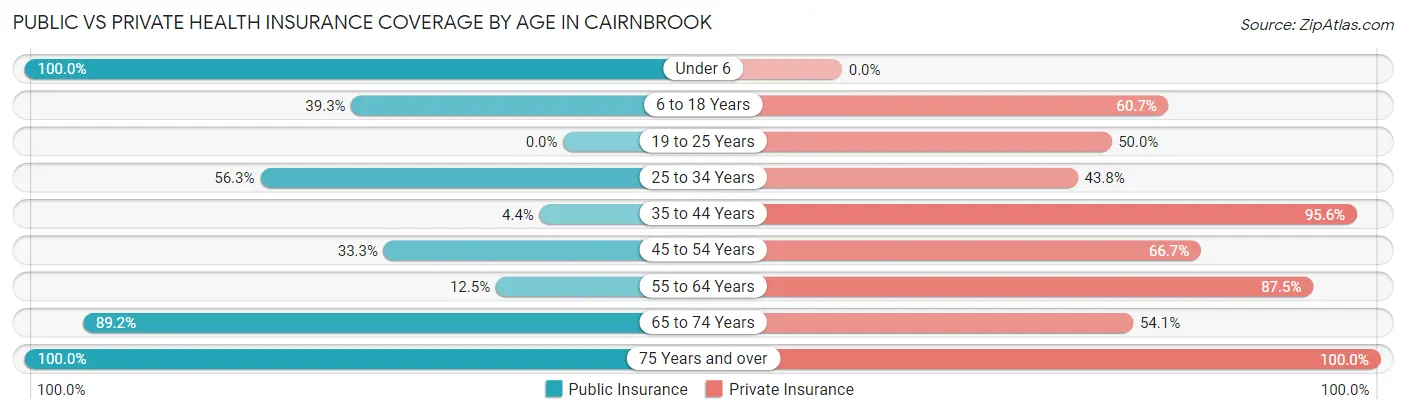
| Age Bracket | Public Insurance | Private Insurance |
| Under 6 | 19 (100.0%) | 0 (0.0%) |
| 6 to 18 Years | 72 (39.3%) | 111 (60.7%) |
| 19 to 25 Years | 0 (0.0%) | 9 (50.0%) |
| 25 to 34 Years | 18 (56.2%) | 14 (43.8%) |
| 35 to 44 Years | 5 (4.4%) | 109 (95.6%) |
| 45 to 54 Years | 13 (33.3%) | 26 (66.7%) |
| 55 to 64 Years | 8 (12.5%) | 56 (87.5%) |
| 65 to 74 Years | 33 (89.2%) | 20 (54.0%) |
| 75 Years and over | 25 (100.0%) | 25 (100.0%) |
| Total | 193 (36.3%) | 370 (69.7%) |
Disability Status by Sex by Age in Cairnbrook
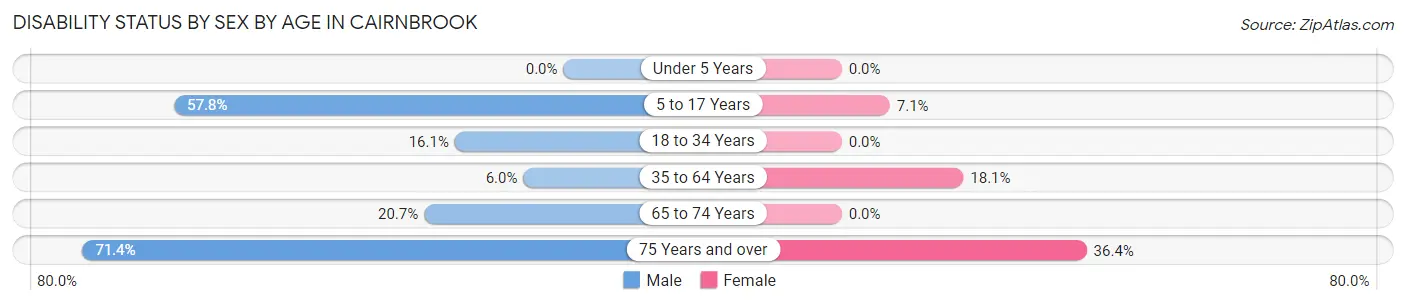
| Age Bracket | Male | Female |
| Under 5 Years | 0 (0.0%) | 0 (0.0%) |
| 5 to 17 Years | 37 (57.8%) | 8 (7.1%) |
| 18 to 34 Years | 5 (16.1%) | 0 (0.0%) |
| 35 to 64 Years | 5 (5.9%) | 24 (18.0%) |
| 65 to 74 Years | 6 (20.7%) | 0 (0.0%) |
| 75 Years and over | 10 (71.4%) | 4 (36.4%) |
Disability Class by Sex by Age in Cairnbrook
Disability Class: Hearing Difficulty
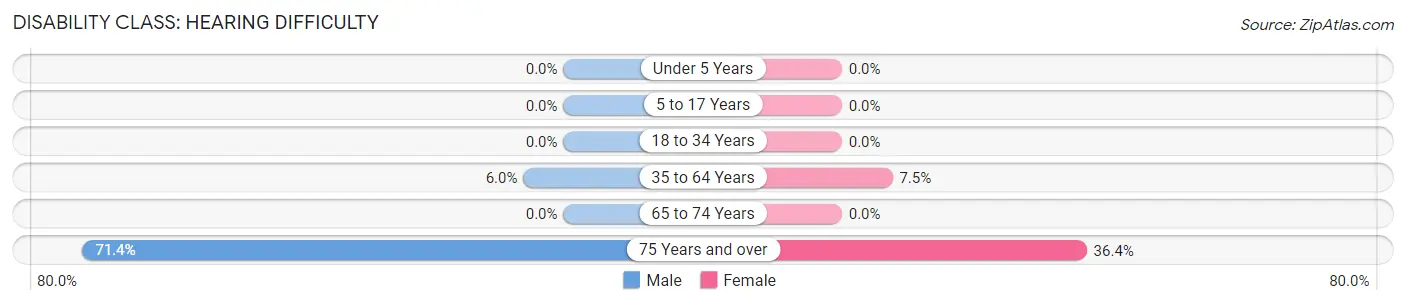
| Age Bracket | Male | Female |
| Under 5 Years | 0 (0.0%) | 0 (0.0%) |
| 5 to 17 Years | 0 (0.0%) | 0 (0.0%) |
| 18 to 34 Years | 0 (0.0%) | 0 (0.0%) |
| 35 to 64 Years | 5 (5.9%) | 10 (7.5%) |
| 65 to 74 Years | 0 (0.0%) | 0 (0.0%) |
| 75 Years and over | 10 (71.4%) | 4 (36.4%) |
Disability Class: Vision Difficulty
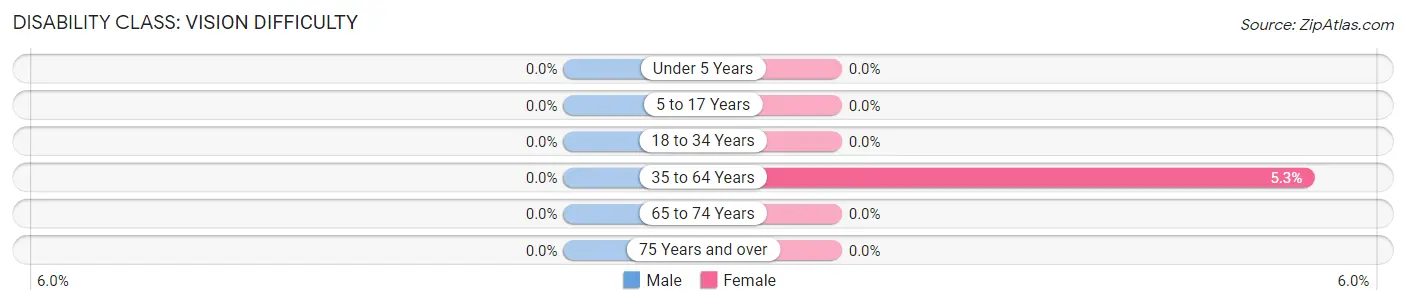
| Age Bracket | Male | Female |
| Under 5 Years | 0 (0.0%) | 0 (0.0%) |
| 5 to 17 Years | 0 (0.0%) | 0 (0.0%) |
| 18 to 34 Years | 0 (0.0%) | 0 (0.0%) |
| 35 to 64 Years | 0 (0.0%) | 7 (5.3%) |
| 65 to 74 Years | 0 (0.0%) | 0 (0.0%) |
| 75 Years and over | 0 (0.0%) | 0 (0.0%) |
Disability Class: Cognitive Difficulty
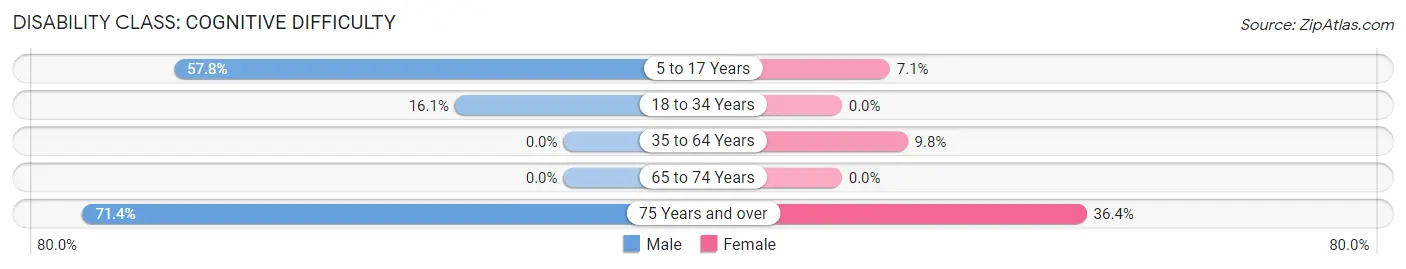
| Age Bracket | Male | Female |
| 5 to 17 Years | 37 (57.8%) | 8 (7.1%) |
| 18 to 34 Years | 5 (16.1%) | 0 (0.0%) |
| 35 to 64 Years | 0 (0.0%) | 13 (9.8%) |
| 65 to 74 Years | 0 (0.0%) | 0 (0.0%) |
| 75 Years and over | 10 (71.4%) | 4 (36.4%) |
Disability Class: Ambulatory Difficulty
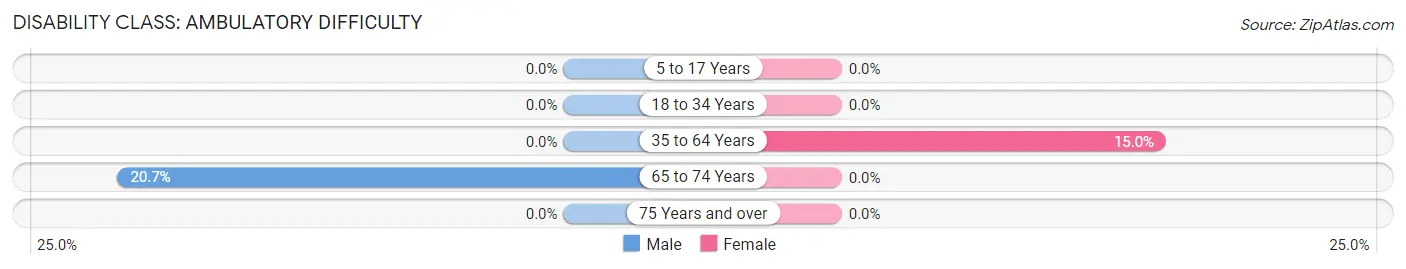
| Age Bracket | Male | Female |
| 5 to 17 Years | 0 (0.0%) | 0 (0.0%) |
| 18 to 34 Years | 0 (0.0%) | 0 (0.0%) |
| 35 to 64 Years | 0 (0.0%) | 20 (15.0%) |
| 65 to 74 Years | 6 (20.7%) | 0 (0.0%) |
| 75 Years and over | 0 (0.0%) | 0 (0.0%) |
Disability Class: Self-Care Difficulty
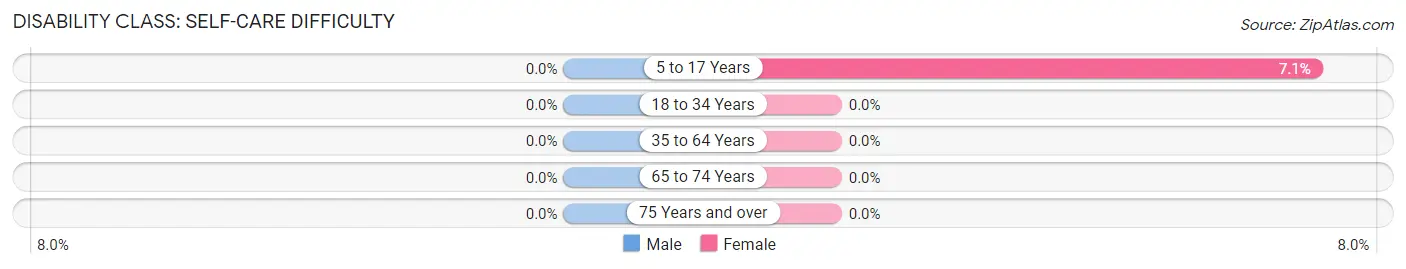
| Age Bracket | Male | Female |
| 5 to 17 Years | 0 (0.0%) | 8 (7.1%) |
| 18 to 34 Years | 0 (0.0%) | 0 (0.0%) |
| 35 to 64 Years | 0 (0.0%) | 0 (0.0%) |
| 65 to 74 Years | 0 (0.0%) | 0 (0.0%) |
| 75 Years and over | 0 (0.0%) | 0 (0.0%) |
Technology Access in Cairnbrook
Computing Device Access in Cairnbrook
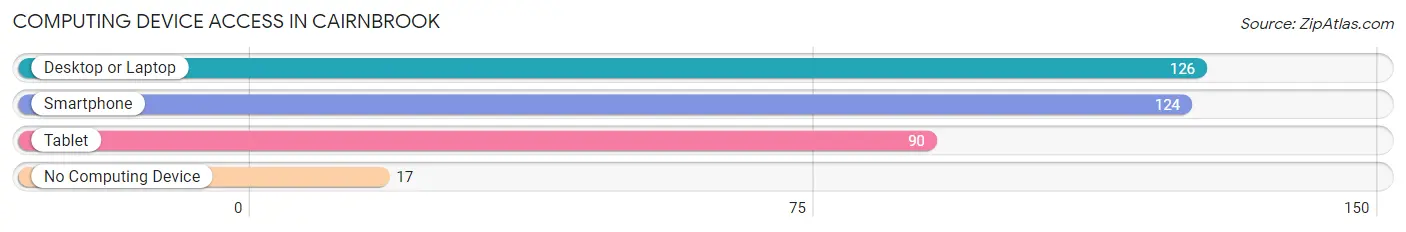
| Device Type | # Households | % Households |
| Desktop or Laptop | 126 | 72.8% |
| Smartphone | 124 | 71.7% |
| Tablet | 90 | 52.0% |
| No Computing Device | 17 | 9.8% |
| Total | 173 | 100.0% |
Internet Access in Cairnbrook
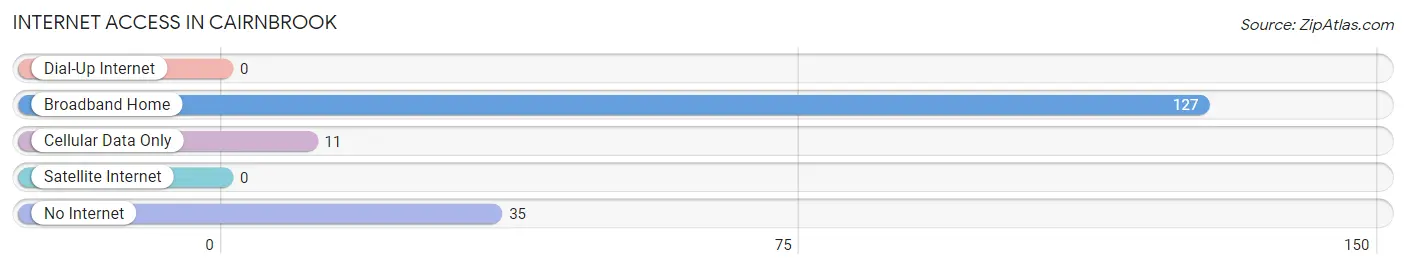
| Internet Type | # Households | % Households |
| Dial-Up Internet | 0 | 0.0% |
| Broadband Home | 127 | 73.4% |
| Cellular Data Only | 11 | 6.4% |
| Satellite Internet | 0 | 0.0% |
| No Internet | 35 | 20.2% |
| Total | 173 | 100.0% |
Cairnbrook Summary
Cairnbrook is a small borough located in Somerset County, Pennsylvania. It is situated in the Laurel Highlands region of the state, and is part of the Johnstown Metropolitan Statistical Area. The population of Cairnbrook was 545 at the 2010 census.
History
Cairnbrook was founded in 1891 by the Cairnbrook Coal Company. The company was formed by a group of investors from Philadelphia, who purchased a large tract of land in the area. The company built a coal mine and a railroad line to transport the coal to markets in the region. The town was named after the Cairnbrook Coal Company, and the name was derived from the Scottish word for “cairn”, which is a pile of stones used as a marker or memorial.
The town grew rapidly in the early 20th century, and by 1910 the population had reached 1,000. The coal industry was the main source of employment in the town, and the town was home to several coal mines. The town also had a number of stores, churches, and other businesses.
In the 1950s, the coal industry began to decline, and the town’s population began to decline as well. By the 1970s, the population had dropped to just over 500. The town has remained relatively stable since then, and the population has remained around 500.
Geography
Cairnbrook is located in southwestern Somerset County, in the Laurel Highlands region of Pennsylvania. It is situated in the Conemaugh River Valley, and is bordered by Shade Township to the north, Quemahoning Township to the east, and Jenner Township to the south and west.
The borough has a total area of 0.6 square miles, all of which is land. The borough is located in the Eastern Standard Time Zone (EST).
Economy
The economy of Cairnbrook is largely based on agriculture and tourism. The town is home to several farms, and the surrounding area is known for its apple orchards and vineyards. The town is also home to several small businesses, including a grocery store, a hardware store, and a restaurant.
The town is also a popular tourist destination, and is home to several attractions, including the Cairnbrook Historical Society Museum, the Cairnbrook Railroad Station, and the Cairnbrook Country Club.
Demographics
As of the 2010 census, the population of Cairnbrook was 545. The racial makeup of the borough was 97.3% White, 0.7% African American, 0.2% Native American, 0.2% Asian, 0.2% from other races, and 1.6% from two or more races. Hispanic or Latino of any race were 0.7% of the population.
The median income for a household in the borough was $37,500, and the median income for a family was $41,250. The per capita income for the borough was $17,845. About 8.3% of families and 10.2% of the population were below the poverty line, including 14.3% of those under age 18 and none of those age 65 or over.
Common Questions
What is Per Capita Income in Cairnbrook?
Per Capita income in Cairnbrook is $25,147.
What is the Median Family Income in Cairnbrook?
Median Family Income in Cairnbrook is $83,145.
What is the Median Household income in Cairnbrook?
Median Household Income in Cairnbrook is $65,938.
What is Inequality or Gini Index in Cairnbrook?
Inequality or Gini Index in Cairnbrook is 0.35.
What is the Total Population of Cairnbrook?
Total Population of Cairnbrook is 531.
What is the Total Male Population of Cairnbrook?
Total Male Population of Cairnbrook is 222.
What is the Total Female Population of Cairnbrook?
Total Female Population of Cairnbrook is 309.
What is the Ratio of Males per 100 Females in Cairnbrook?
There are 71.84 Males per 100 Females in Cairnbrook.
What is the Ratio of Females per 100 Males in Cairnbrook?
There are 139.19 Females per 100 Males in Cairnbrook.
What is the Median Population Age in Cairnbrook?
Median Population Age in Cairnbrook is 35.8 Years.
What is the Average Family Size in Cairnbrook
Average Family Size in Cairnbrook is 4.0 People.
What is the Average Household Size in Cairnbrook
Average Household Size in Cairnbrook is 3.1 People.
How Large is the Labor Force in Cairnbrook?
There are 237 People in the Labor Forcein in Cairnbrook.
What is the Percentage of People in the Labor Force in Cairnbrook?
62.5% of People are in the Labor Force in Cairnbrook.