Lenhartsville borough, PA Map & Demographics
Lenhartsville borough Overview
$31,459
PER CAPITA INCOME
$82,000
AVG FAMILY INCOME
$64,063
AVG HOUSEHOLD INCOME
7.2%
WAGE / INCOME GAP [ % ]
92.8¢/ $1
WAGE / INCOME GAP [ $ ]
0.41
INEQUALITY / GINI INDEX
166
TOTAL POPULATION
73
MALE POPULATION
93
FEMALE POPULATION
78.49
MALES / 100 FEMALES
127.40
FEMALES / 100 MALES
38.0
MEDIAN AGE
3.1
AVG FAMILY SIZE
2.4
AVG HOUSEHOLD SIZE
85
LABOR FORCE [ PEOPLE ]
63.0%
PERCENT IN LABOR FORCE
2.4%
UNEMPLOYMENT RATE
Income in Lenhartsville borough
Income Overview in Lenhartsville borough
Per Capita Income in Lenhartsville borough is $31,459, while median incomes of families and households are $82,000 and $64,063 respectively.
| Characteristic | Number | Measure |
| Per Capita Income | 166 | $31,459 |
| Median Family Income | 40 | $82,000 |
| Mean Family Income | 40 | $102,693 |
| Median Household Income | 69 | $64,063 |
| Mean Household Income | 69 | $78,412 |
| Income Deficit | 40 | $0 |
| Wage / Income Gap (%) | 166 | 7.22% |
| Wage / Income Gap ($) | 166 | 92.78¢ per $1 |
| Gini / Inequality Index | 166 | 0.41 |
Earnings by Sex in Lenhartsville borough
Average Earnings in Lenhartsville borough are $43,750, $45,000 for men and $41,750 for women, a difference of 7.2%.
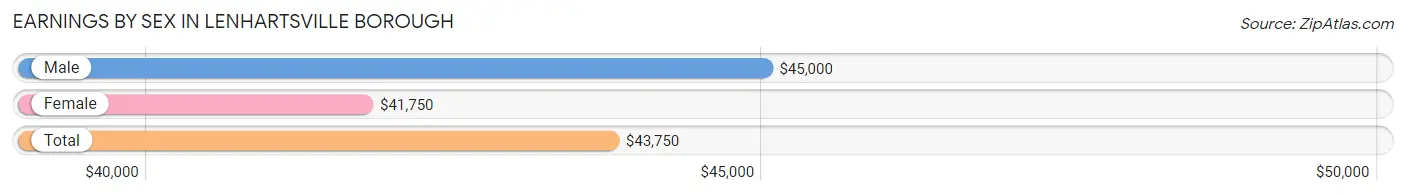
| Sex | Number | Average Earnings |
| Male | 48 (53.9%) | $45,000 |
| Female | 41 (46.1%) | $41,750 |
| Total | 89 (100.0%) | $43,750 |
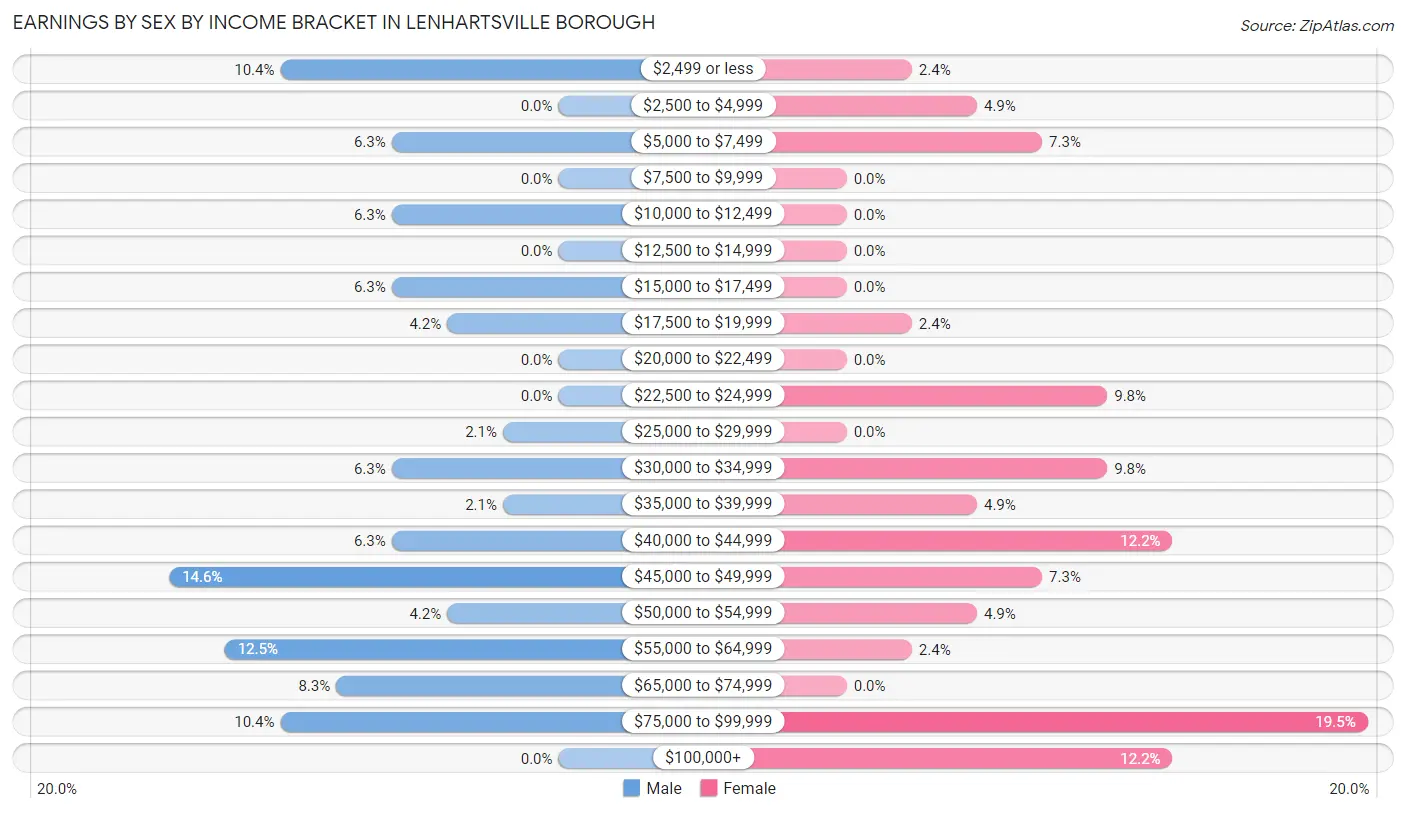
Earnings by Sex by Income Bracket in Lenhartsville borough
The most common earnings brackets in Lenhartsville borough are $45,000 to $49,999 for men (7 | 14.6%) and $75,000 to $99,999 for women (8 | 19.5%).
| Income | Male | Female |
| $2,499 or less | 5 (10.4%) | 1 (2.4%) |
| $2,500 to $4,999 | 0 (0.0%) | 2 (4.9%) |
| $5,000 to $7,499 | 3 (6.2%) | 3 (7.3%) |
| $7,500 to $9,999 | 0 (0.0%) | 0 (0.0%) |
| $10,000 to $12,499 | 3 (6.2%) | 0 (0.0%) |
| $12,500 to $14,999 | 0 (0.0%) | 0 (0.0%) |
| $15,000 to $17,499 | 3 (6.2%) | 0 (0.0%) |
| $17,500 to $19,999 | 2 (4.2%) | 1 (2.4%) |
| $20,000 to $22,499 | 0 (0.0%) | 0 (0.0%) |
| $22,500 to $24,999 | 0 (0.0%) | 4 (9.8%) |
| $25,000 to $29,999 | 1 (2.1%) | 0 (0.0%) |
| $30,000 to $34,999 | 3 (6.2%) | 4 (9.8%) |
| $35,000 to $39,999 | 1 (2.1%) | 2 (4.9%) |
| $40,000 to $44,999 | 3 (6.2%) | 5 (12.2%) |
| $45,000 to $49,999 | 7 (14.6%) | 3 (7.3%) |
| $50,000 to $54,999 | 2 (4.2%) | 2 (4.9%) |
| $55,000 to $64,999 | 6 (12.5%) | 1 (2.4%) |
| $65,000 to $74,999 | 4 (8.3%) | 0 (0.0%) |
| $75,000 to $99,999 | 5 (10.4%) | 8 (19.5%) |
| $100,000+ | 0 (0.0%) | 5 (12.2%) |
| Total | 48 (100.0%) | 41 (100.0%) |
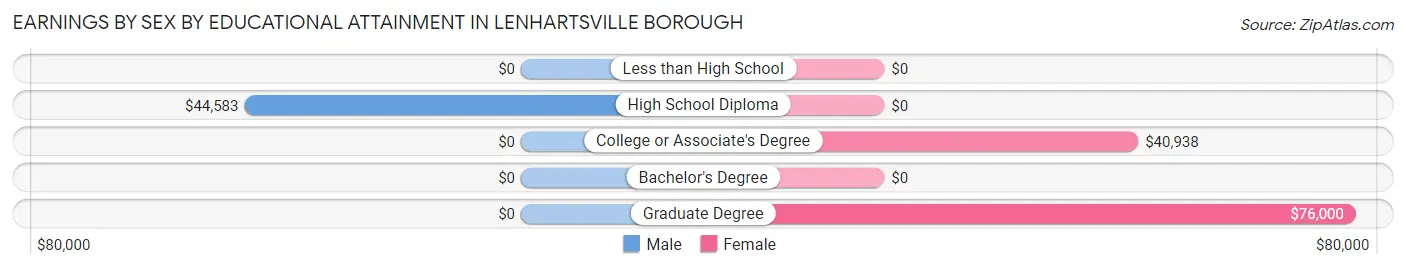
Earnings by Sex by Educational Attainment in Lenhartsville borough
Average earnings in Lenhartsville borough are $46,500 for men and $48,125 for women, a difference of 3.4%. Men with an educational attainment of high school diploma enjoy the highest average annual earnings of $44,583, while those with high school diploma education earn the least with $44,583. Women with an educational attainment of graduate degree earn the most with the average annual earnings of $76,000, while those with college or associate's degree education have the smallest earnings of $40,938.
| Educational Attainment | Male Income | Female Income |
| Less than High School | - | - |
| High School Diploma | $44,583 | $0 |
| College or Associate's Degree | - | - |
| Bachelor's Degree | - | - |
| Graduate Degree | - | - |
| Total | $46,500 | $48,125 |
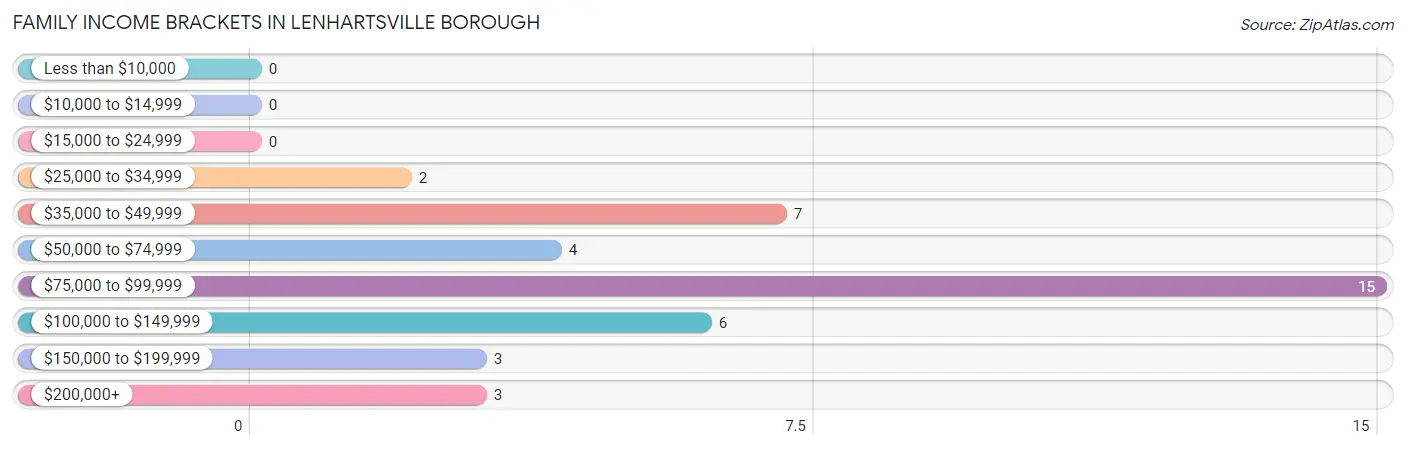
Family Income in Lenhartsville borough
Family Income Brackets in Lenhartsville borough
According to the Lenhartsville borough family income data, there are 15 families falling into the $75,000 to $99,999 income range, which is the most common income bracket and makes up 37.5% of all families.
| Income Bracket | # Families | % Families |
| Less than $10,000 | 0 | 0.0% |
| $10,000 to $14,999 | 0 | 0.0% |
| $15,000 to $24,999 | 0 | 0.0% |
| $25,000 to $34,999 | 2 | 5.0% |
| $35,000 to $49,999 | 7 | 17.5% |
| $50,000 to $74,999 | 4 | 10.0% |
| $75,000 to $99,999 | 15 | 37.5% |
| $100,000 to $149,999 | 6 | 15.0% |
| $150,000 to $199,999 | 3 | 7.5% |
| $200,000+ | 3 | 7.5% |
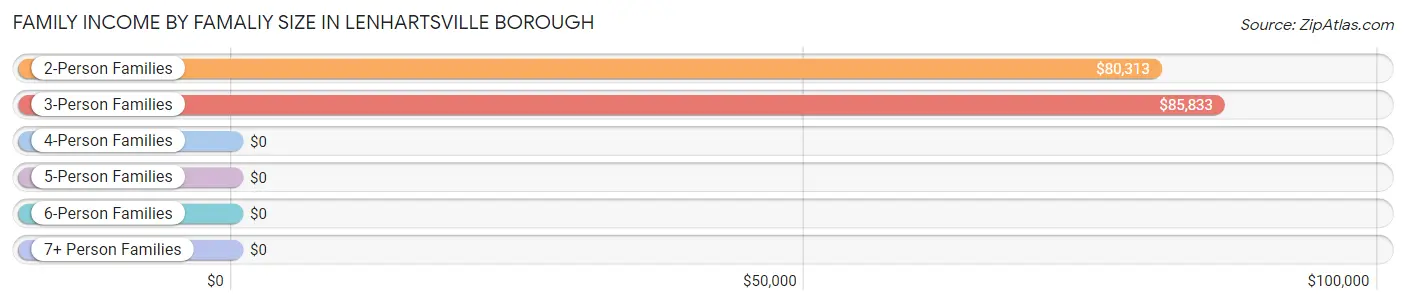
Family Income by Famaliy Size in Lenhartsville borough
3-person families (20 | 50.0%) account for the highest median family income in Lenhartsville borough with $85,833 per family, while 2-person families (13 | 32.5%) have the highest median income of $40,156 per family member.
| Income Bracket | # Families | Median Income |
| 2-Person Families | 13 (32.5%) | $80,313 |
| 3-Person Families | 20 (50.0%) | $85,833 |
| 4-Person Families | 3 (7.5%) | $0 |
| 5-Person Families | 3 (7.5%) | $0 |
| 6-Person Families | 0 (0.0%) | $0 |
| 7+ Person Families | 1 (2.5%) | $0 |
| Total | 40 (100.0%) | $82,000 |
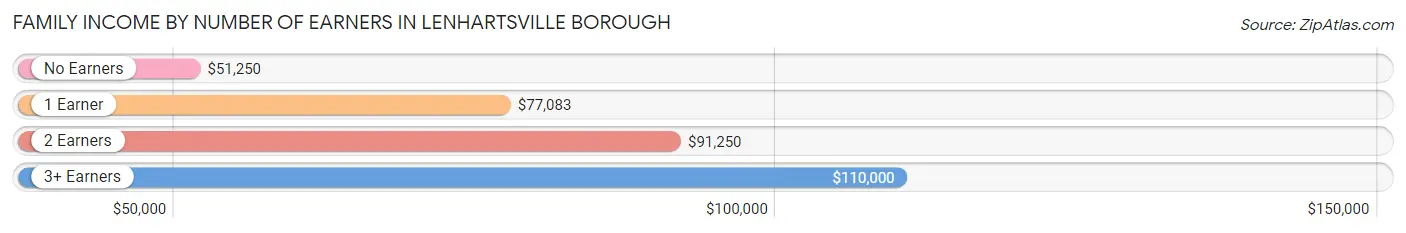
Family Income by Number of Earners in Lenhartsville borough
The median family income in Lenhartsville borough is $82,000, with families comprising 3+ earners (6) having the highest median family income of $110,000, while families with no earners (3) have the lowest median family income of $51,250, accounting for 15.0% and 7.5% of families, respectively.
| Number of Earners | # Families | Median Income |
| No Earners | 3 (7.5%) | $51,250 |
| 1 Earner | 13 (32.5%) | $77,083 |
| 2 Earners | 18 (45.0%) | $91,250 |
| 3+ Earners | 6 (15.0%) | $110,000 |
| Total | 40 (100.0%) | $82,000 |
Household Income in Lenhartsville borough
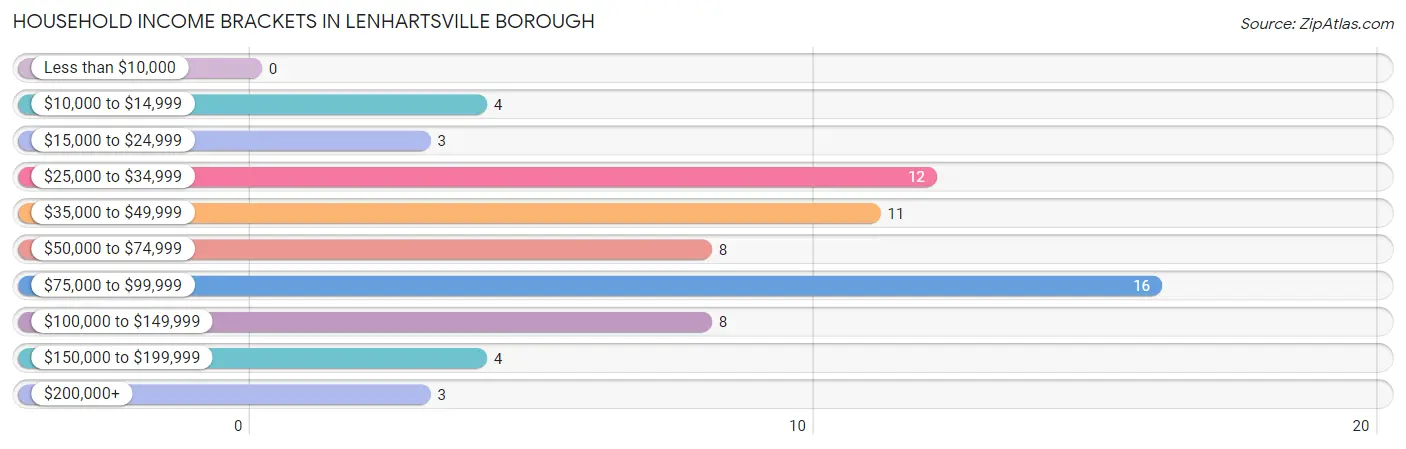
Household Income Brackets in Lenhartsville borough
With 16 households falling in the category, the $75,000 to $99,999 income range is the most frequent in Lenhartsville borough, accounting for 23.2% of all households.
| Income Bracket | # Households | % Households |
| Less than $10,000 | 0 | 0.0% |
| $10,000 to $14,999 | 4 | 5.8% |
| $15,000 to $24,999 | 3 | 4.3% |
| $25,000 to $34,999 | 12 | 17.4% |
| $35,000 to $49,999 | 11 | 15.9% |
| $50,000 to $74,999 | 8 | 11.6% |
| $75,000 to $99,999 | 16 | 23.2% |
| $100,000 to $149,999 | 8 | 11.6% |
| $150,000 to $199,999 | 4 | 5.8% |
| $200,000+ | 3 | 4.3% |
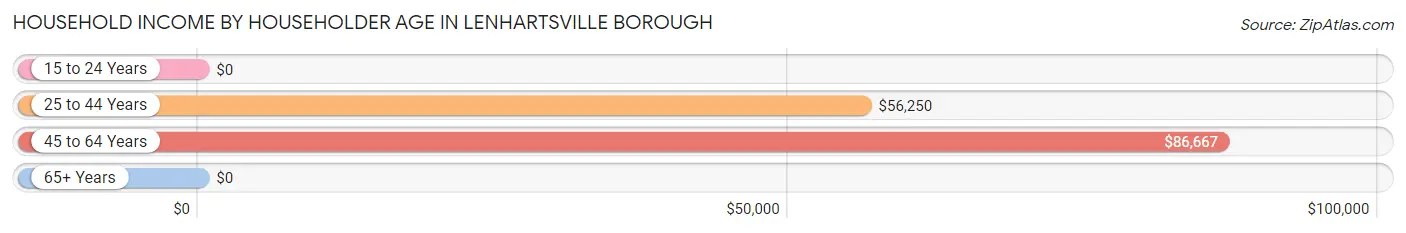
Household Income by Householder Age in Lenhartsville borough
The median household income in Lenhartsville borough is $64,063, with the highest median household income of $86,667 found in the 45 to 64 years age bracket for the primary householder. A total of 24 households (34.8%) fall into this category. Meanwhile, the 15 to 24 years age bracket for the primary householder has the lowest median household income of $0, with 2 households (2.9%) in this group.
| Income Bracket | # Households | Median Income |
| 15 to 24 Years | 2 (2.9%) | $0 |
| 25 to 44 Years | 28 (40.6%) | $56,250 |
| 45 to 64 Years | 24 (34.8%) | $86,667 |
| 65+ Years | 15 (21.7%) | $0 |
| Total | 69 (100.0%) | $64,063 |
Poverty in Lenhartsville borough
Income Below Poverty by Sex and Age in Lenhartsville borough
With 12.5% poverty level for males and 17.2% for females among the residents of Lenhartsville borough, 6 to 11 year old males and 55 to 64 year old females are the most vulnerable to poverty, with 4 males (66.7%) and 4 females (57.1%) in their respective age groups living below the poverty level.
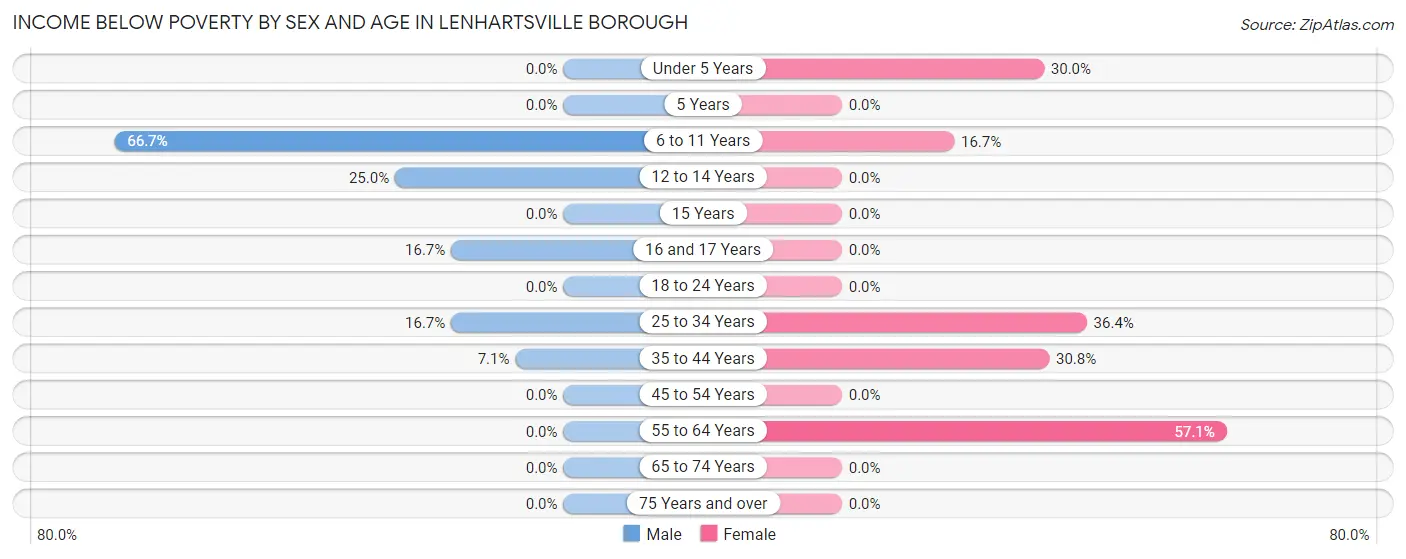
| Age Bracket | Male | Female |
| Under 5 Years | 0 (0.0%) | 3 (30.0%) |
| 5 Years | 0 (0.0%) | 0 (0.0%) |
| 6 to 11 Years | 4 (66.7%) | 1 (16.7%) |
| 12 to 14 Years | 1 (25.0%) | 0 (0.0%) |
| 15 Years | 0 (0.0%) | 0 (0.0%) |
| 16 and 17 Years | 1 (16.7%) | 0 (0.0%) |
| 18 to 24 Years | 0 (0.0%) | 0 (0.0%) |
| 25 to 34 Years | 2 (16.7%) | 4 (36.4%) |
| 35 to 44 Years | 1 (7.1%) | 4 (30.8%) |
| 45 to 54 Years | 0 (0.0%) | 0 (0.0%) |
| 55 to 64 Years | 0 (0.0%) | 4 (57.1%) |
| 65 to 74 Years | 0 (0.0%) | 0 (0.0%) |
| 75 Years and over | 0 (0.0%) | 0 (0.0%) |
| Total | 9 (12.5%) | 16 (17.2%) |
Income Above Poverty by Sex and Age in Lenhartsville borough
According to the poverty statistics in Lenhartsville borough, males aged under 5 years and females aged 12 to 14 years are the age groups that are most secure financially, with 100.0% of males and 100.0% of females in these age groups living above the poverty line.
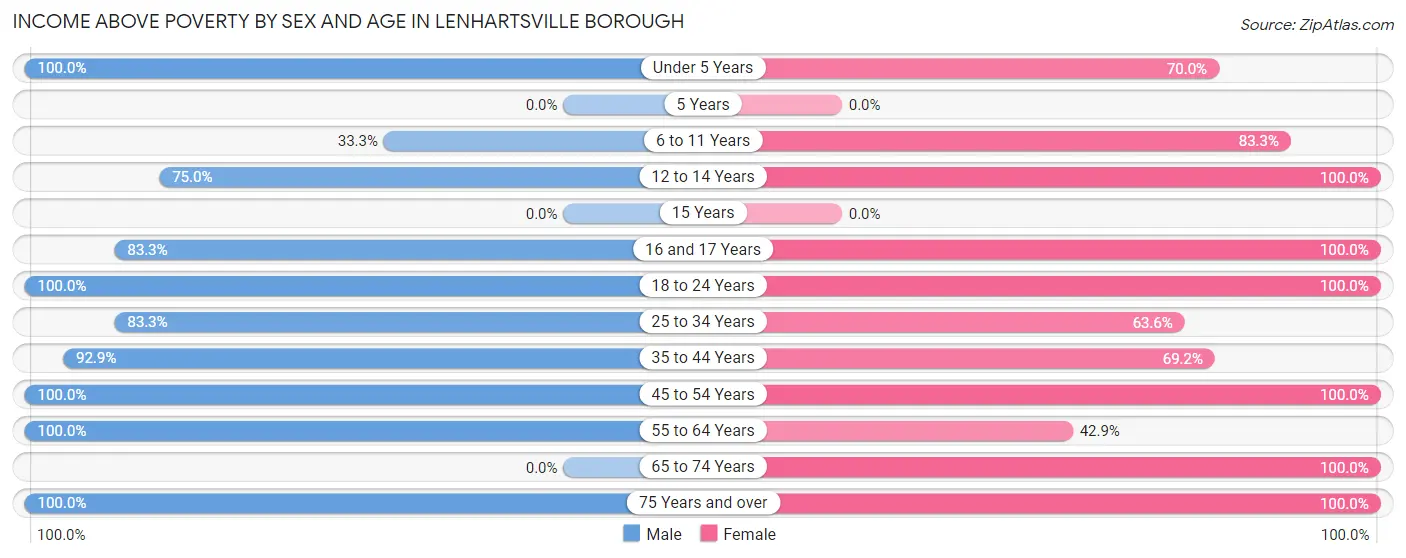
| Age Bracket | Male | Female |
| Under 5 Years | 2 (100.0%) | 7 (70.0%) |
| 5 Years | 0 (0.0%) | 0 (0.0%) |
| 6 to 11 Years | 2 (33.3%) | 5 (83.3%) |
| 12 to 14 Years | 3 (75.0%) | 2 (100.0%) |
| 15 Years | 0 (0.0%) | 0 (0.0%) |
| 16 and 17 Years | 5 (83.3%) | 1 (100.0%) |
| 18 to 24 Years | 3 (100.0%) | 11 (100.0%) |
| 25 to 34 Years | 10 (83.3%) | 7 (63.6%) |
| 35 to 44 Years | 13 (92.9%) | 9 (69.2%) |
| 45 to 54 Years | 10 (100.0%) | 17 (100.0%) |
| 55 to 64 Years | 10 (100.0%) | 3 (42.9%) |
| 65 to 74 Years | 0 (0.0%) | 4 (100.0%) |
| 75 Years and over | 5 (100.0%) | 11 (100.0%) |
| Total | 63 (87.5%) | 77 (82.8%) |
Income Below Poverty Among Married-Couple Families in Lenhartsville borough
The poverty statistics for married-couple families in Lenhartsville borough show that 3.5% or 1 of the total 29 families live below the poverty line. Families with 5 or more children have the highest poverty rate of 100.0%, comprising of 1 families. On the other hand, families with no children have the lowest poverty rate of 0.0%, which includes 0 families.
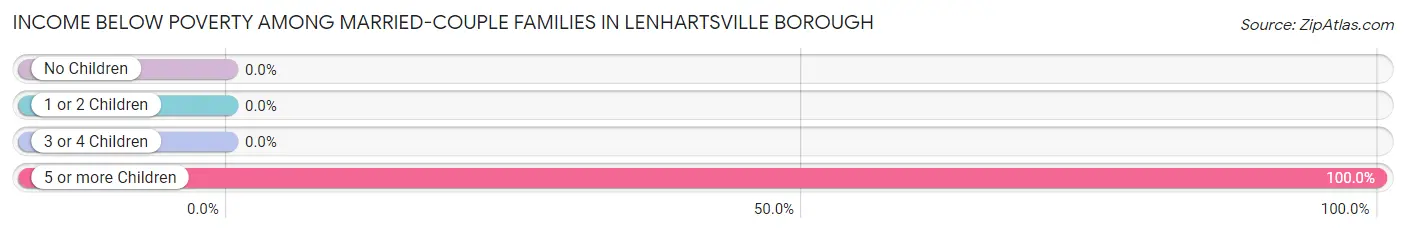
| Children | Above Poverty | Below Poverty |
| No Children | 9 (100.0%) | 0 (0.0%) |
| 1 or 2 Children | 16 (100.0%) | 0 (0.0%) |
| 3 or 4 Children | 3 (100.0%) | 0 (0.0%) |
| 5 or more Children | 0 (0.0%) | 1 (100.0%) |
| Total | 28 (96.6%) | 1 (3.5%) |
Income Below Poverty Among Single-Parent Households in Lenhartsville borough
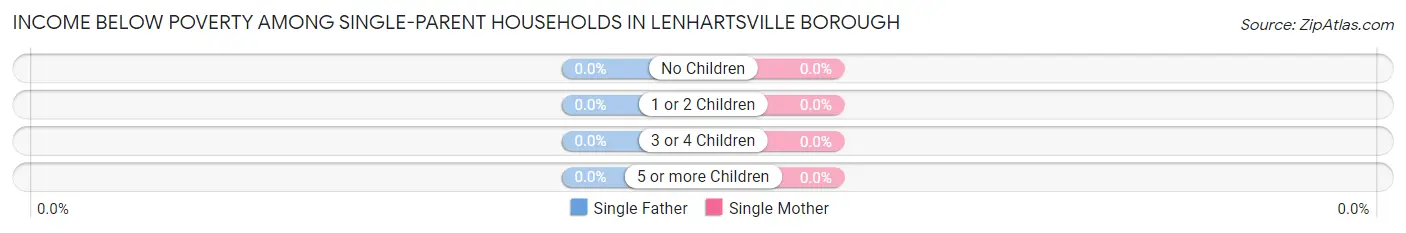
| Children | Single Father | Single Mother |
| No Children | 0 (0.0%) | 0 (0.0%) |
| 1 or 2 Children | 0 (0.0%) | 0 (0.0%) |
| 3 or 4 Children | 0 (0.0%) | 0 (0.0%) |
| 5 or more Children | 0 (0.0%) | 0 (0.0%) |
| Total | 0 (0.0%) | 0 (0.0%) |
Income Below Poverty Among Married-Couple vs Single-Parent Households in Lenhartsville borough
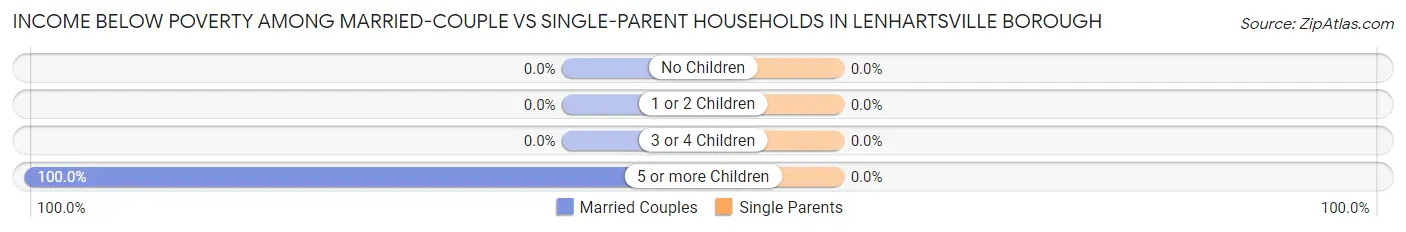
| Children | Married-Couple Families | Single-Parent Households |
| No Children | 0 (0.0%) | 0 (0.0%) |
| 1 or 2 Children | 0 (0.0%) | 0 (0.0%) |
| 3 or 4 Children | 0 (0.0%) | 0 (0.0%) |
| 5 or more Children | 1 (100.0%) | 0 (0.0%) |
| Total | 1 (3.5%) | 0 (0.0%) |
Race in Lenhartsville borough
The most populous races in Lenhartsville borough are White / Caucasian (165 | 99.4%), Hispanic or Latino (2 | 1.2%), and Some other Race (1 | 0.6%).
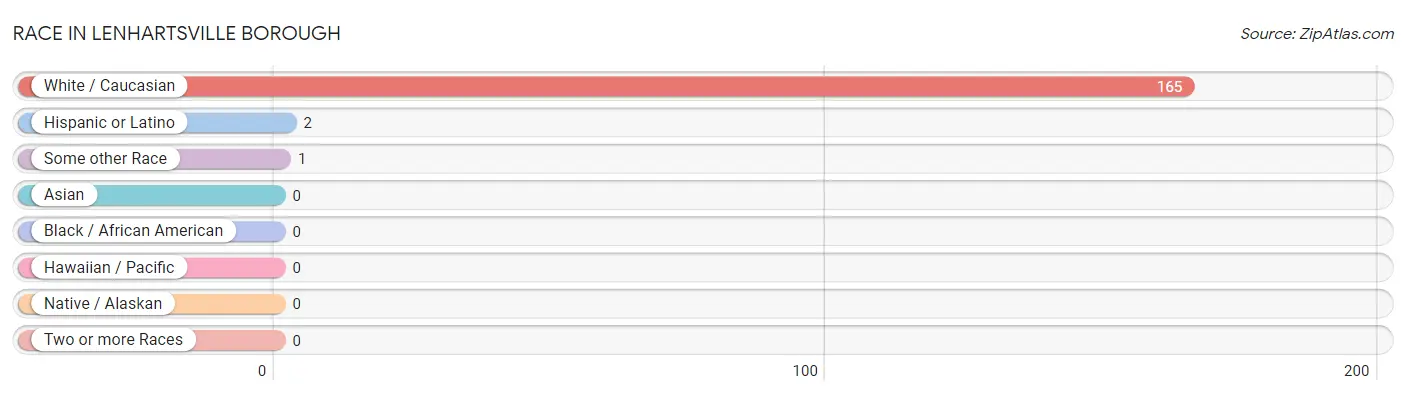
| Race | # Population | % Population |
| Asian | 0 | 0.0% |
| Black / African American | 0 | 0.0% |
| Hawaiian / Pacific | 0 | 0.0% |
| Hispanic or Latino | 2 | 1.2% |
| Native / Alaskan | 0 | 0.0% |
| White / Caucasian | 165 | 99.4% |
| Two or more Races | 0 | 0.0% |
| Some other Race | 1 | 0.6% |
| Total | 166 | 100.0% |
Ancestry in Lenhartsville borough
The most populous ancestries reported in Lenhartsville borough are German (62 | 37.3%), English (40 | 24.1%), Irish (32 | 19.3%), Polish (13 | 7.8%), and Scottish (13 | 7.8%), together accounting for 96.4% of all Lenhartsville borough residents.
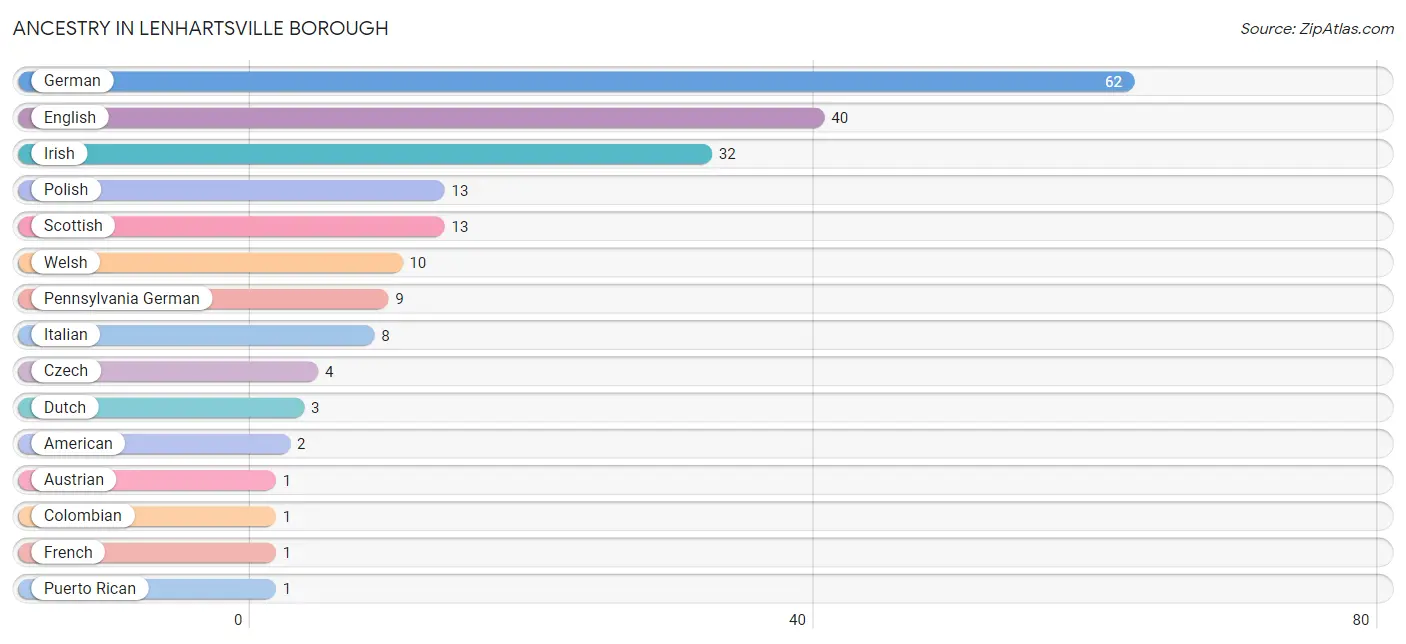
| Ancestry | # Population | % Population |
| American | 2 | 1.2% |
| Austrian | 1 | 0.6% |
| Colombian | 1 | 0.6% |
| Czech | 4 | 2.4% |
| Dutch | 3 | 1.8% |
| English | 40 | 24.1% |
| French | 1 | 0.6% |
| German | 62 | 37.3% |
| Irish | 32 | 19.3% |
| Italian | 8 | 4.8% |
| Pennsylvania German | 9 | 5.4% |
| Polish | 13 | 7.8% |
| Puerto Rican | 1 | 0.6% |
| Romanian | 1 | 0.6% |
| Scottish | 13 | 7.8% |
| South American | 1 | 0.6% |
| Swiss | 1 | 0.6% |
| Welsh | 10 | 6.0% | View All 18 Rows |
Immigrants in Lenhartsville borough
The most numerous immigrant groups reported in Lenhartsville borough came from Europe (4 | 2.4%), Northern Europe (4 | 2.4%), England (1 | 0.6%), and Ireland (1 | 0.6%), together accounting for 6.0% of all Lenhartsville borough residents.
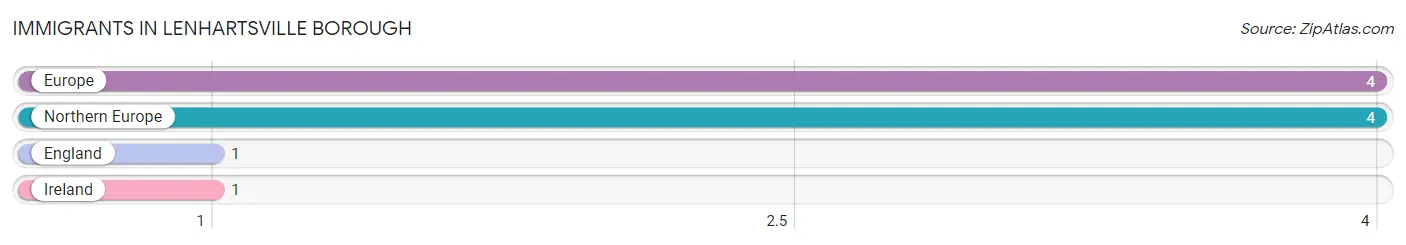
| Immigration Origin | # Population | % Population |
| England | 1 | 0.6% |
| Europe | 4 | 2.4% |
| Ireland | 1 | 0.6% |
| Northern Europe | 4 | 2.4% | View All 4 Rows |
Sex and Age in Lenhartsville borough
Sex and Age in Lenhartsville borough
The most populous age groups in Lenhartsville borough are 40 to 44 Years (9 | 12.3%) for men and Under 5 Years (10 | 10.7%) for women.
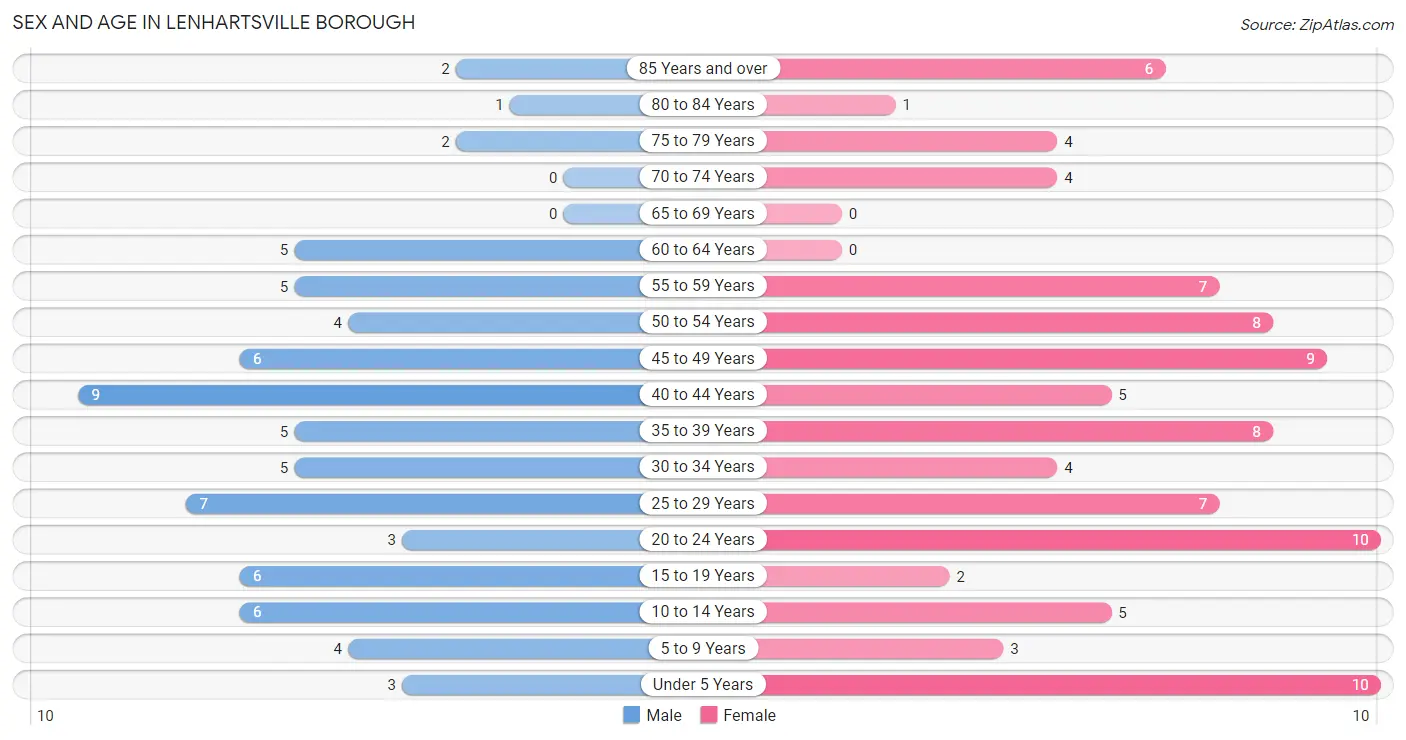
| Age Bracket | Male | Female |
| Under 5 Years | 3 (4.1%) | 10 (10.7%) |
| 5 to 9 Years | 4 (5.5%) | 3 (3.2%) |
| 10 to 14 Years | 6 (8.2%) | 5 (5.4%) |
| 15 to 19 Years | 6 (8.2%) | 2 (2.1%) |
| 20 to 24 Years | 3 (4.1%) | 10 (10.7%) |
| 25 to 29 Years | 7 (9.6%) | 7 (7.5%) |
| 30 to 34 Years | 5 (6.9%) | 4 (4.3%) |
| 35 to 39 Years | 5 (6.9%) | 8 (8.6%) |
| 40 to 44 Years | 9 (12.3%) | 5 (5.4%) |
| 45 to 49 Years | 6 (8.2%) | 9 (9.7%) |
| 50 to 54 Years | 4 (5.5%) | 8 (8.6%) |
| 55 to 59 Years | 5 (6.9%) | 7 (7.5%) |
| 60 to 64 Years | 5 (6.9%) | 0 (0.0%) |
| 65 to 69 Years | 0 (0.0%) | 0 (0.0%) |
| 70 to 74 Years | 0 (0.0%) | 4 (4.3%) |
| 75 to 79 Years | 2 (2.7%) | 4 (4.3%) |
| 80 to 84 Years | 1 (1.4%) | 1 (1.1%) |
| 85 Years and over | 2 (2.7%) | 6 (6.5%) |
| Total | 73 (100.0%) | 93 (100.0%) |
Families and Households in Lenhartsville borough
Median Family Size in Lenhartsville borough
The median family size in Lenhartsville borough is 3.10 persons per family, with married-couple families (29 | 72.5%) accounting for the largest median family size of 3.24 persons per family. On the other hand, single male/father families (5 | 12.5%) represent the smallest median family size with 2.40 persons per family.
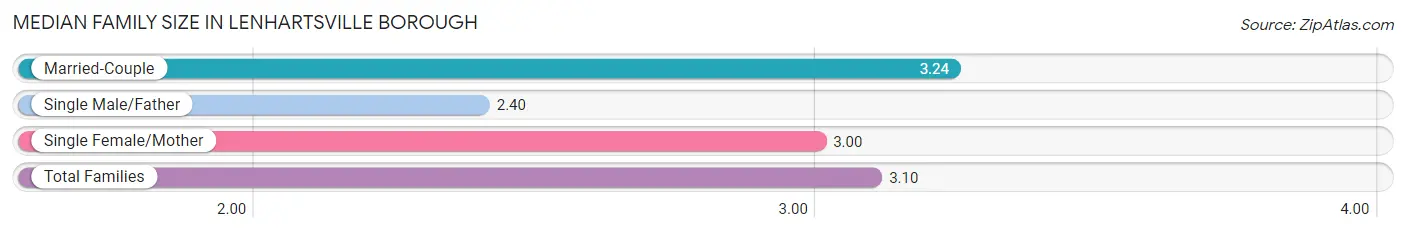
| Family Type | # Families | Family Size |
| Married-Couple | 29 (72.5%) | 3.24 |
| Single Male/Father | 5 (12.5%) | 2.40 |
| Single Female/Mother | 6 (15.0%) | 3.00 |
| Total Families | 40 (100.0%) | 3.10 |
Median Household Size in Lenhartsville borough
The median household size in Lenhartsville borough is 2.41 persons per household, with married-couple households (29 | 42.0%) accounting for the largest median household size of 3.34 persons per household. non-family households (29 | 42.0%) represent the smallest median household size with 1.14 persons per household.
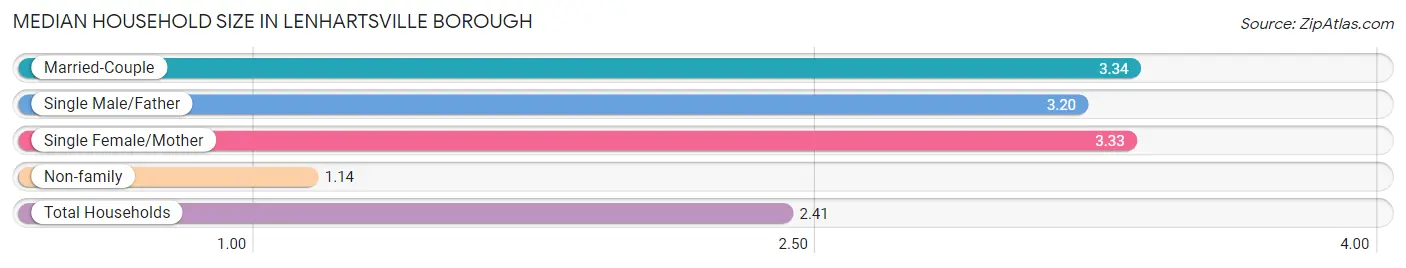
| Household Type | # Households | Household Size |
| Married-Couple | 29 (42.0%) | 3.34 |
| Single Male/Father | 5 (7.2%) | 3.20 |
| Single Female/Mother | 6 (8.7%) | 3.33 |
| Non-family | 29 (42.0%) | 1.14 |
| Total Households | 69 (100.0%) | 2.41 |
Household Size by Marriage Status in Lenhartsville borough
Out of a total of 69 households in Lenhartsville borough, 40 (58.0%) are family households, while 29 (42.0%) are nonfamily households. The most numerous type of family households are 3-person households, comprising 21, and the most common type of nonfamily households are 1-person households, comprising 24.
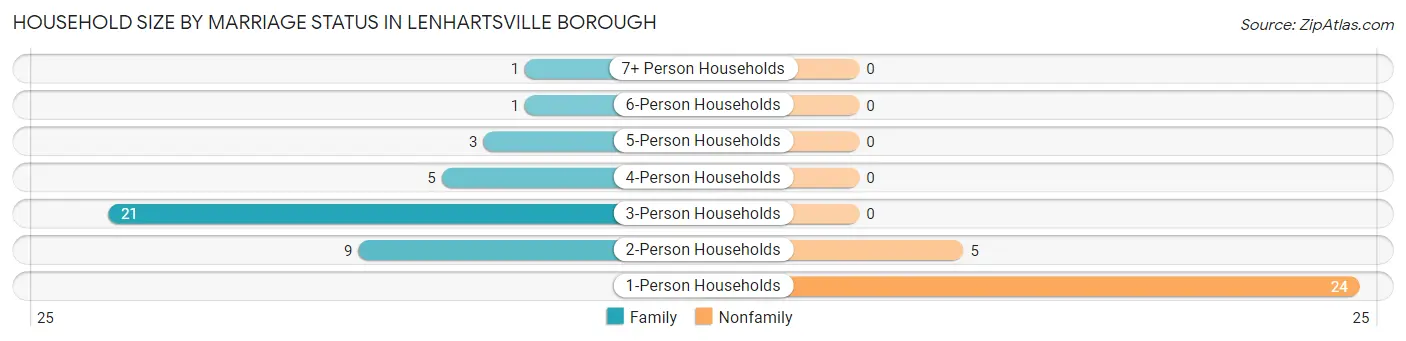
| Household Size | Family Households | Nonfamily Households |
| 1-Person Households | - | 24 (34.8%) |
| 2-Person Households | 9 (13.0%) | 5 (7.2%) |
| 3-Person Households | 21 (30.4%) | 0 (0.0%) |
| 4-Person Households | 5 (7.2%) | 0 (0.0%) |
| 5-Person Households | 3 (4.3%) | 0 (0.0%) |
| 6-Person Households | 1 (1.5%) | 0 (0.0%) |
| 7+ Person Households | 1 (1.5%) | 0 (0.0%) |
| Total | 40 (58.0%) | 29 (42.0%) |
Female Fertility in Lenhartsville borough
Fertility by Age in Lenhartsville borough
Average fertility rate in Lenhartsville borough is 78.0 births per 1,000 women. Women in the age bracket of 20 to 34 years have the highest fertility rate with 95.0 births per 1,000 women. Women in the age bracket of 20 to 34 years acount for 50.0% of all women with births.
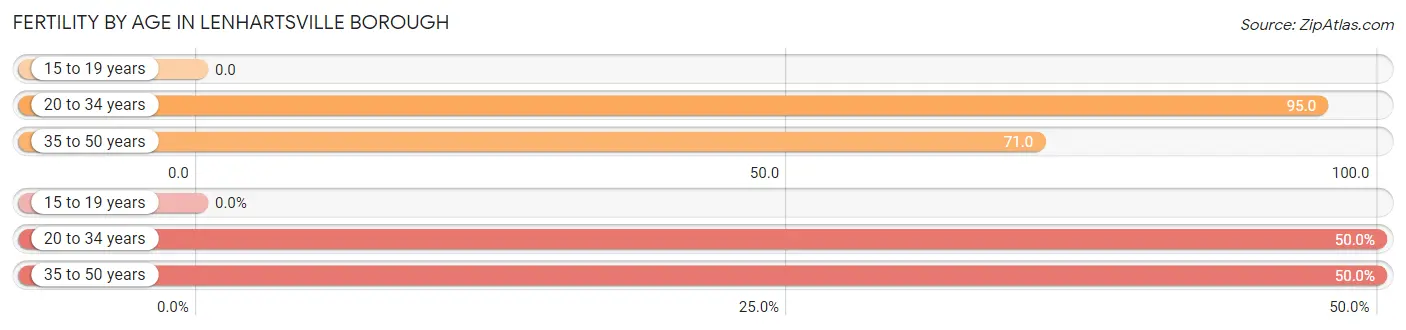
| Age Bracket | Women with Births | Births / 1,000 Women |
| 15 to 19 years | 0 (0.0%) | 0.0 |
| 20 to 34 years | 2 (50.0%) | 95.0 |
| 35 to 50 years | 2 (50.0%) | 71.0 |
| Total | 4 (100.0%) | 78.0 |
Fertility by Age by Marriage Status in Lenhartsville borough
75.0% of women with births (4) in Lenhartsville borough are married. The highest percentage of unmarried women with births falls into 20 to 34 years age bracket with 50.0% of them unmarried at the time of birth, while the lowest percentage of unmarried women with births belong to 35 to 50 years age bracket with 0.0% of them unmarried.
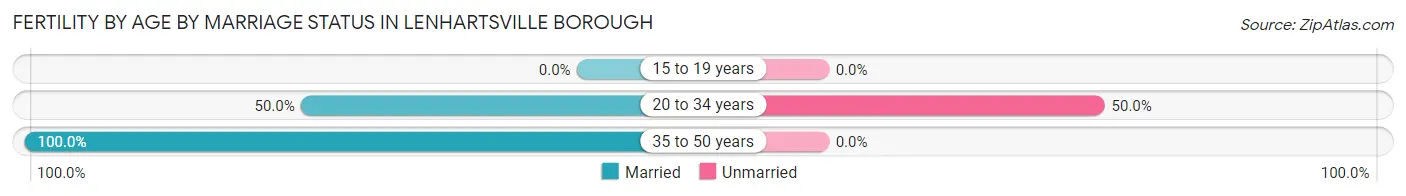
| Age Bracket | Married | Unmarried |
| 15 to 19 years | 0 (0.0%) | 0 (0.0%) |
| 20 to 34 years | 1 (50.0%) | 1 (50.0%) |
| 35 to 50 years | 2 (100.0%) | 0 (0.0%) |
| Total | 3 (75.0%) | 1 (25.0%) |
Fertility by Education in Lenhartsville borough
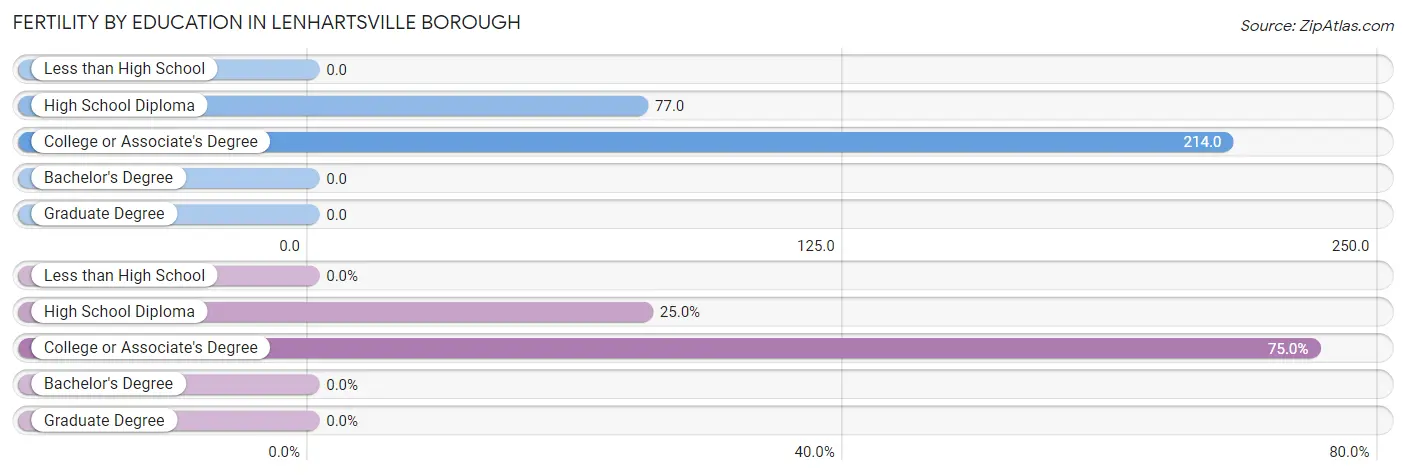
| Educational Attainment | Women with Births | Births / 1,000 Women |
| Less than High School | 0 (0.0%) | 0.0 |
| High School Diploma | 1 (25.0%) | 77.0 |
| College or Associate's Degree | 3 (75.0%) | 214.0 |
| Bachelor's Degree | 0 (0.0%) | 0.0 |
| Graduate Degree | 0 (0.0%) | 0.0 |
| Total | 4 (100.0%) | 78.0 |
Fertility by Education by Marriage Status in Lenhartsville borough
25.0% of women with births in Lenhartsville borough are unmarried. Women with the educational attainment of college or associate's degree are most likely to be married with 100.0% of them married at childbirth, while women with the educational attainment of high school diploma are least likely to be married with 100.0% of them unmarried at childbirth.
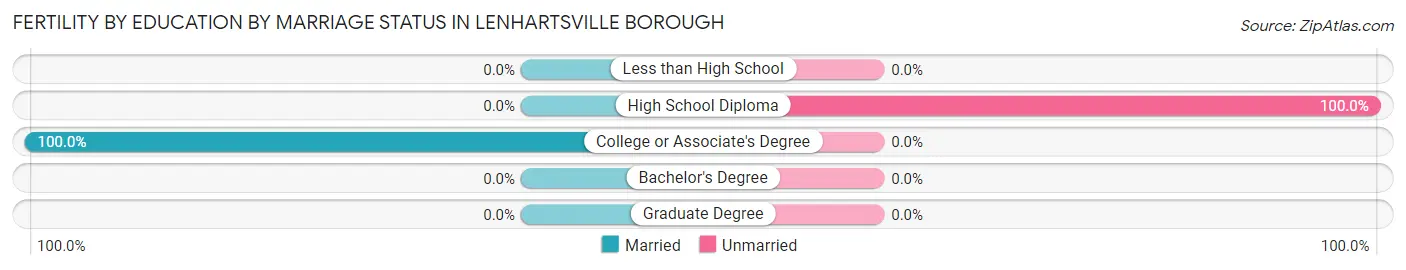
| Educational Attainment | Married | Unmarried |
| Less than High School | 0 (0.0%) | 0 (0.0%) |
| High School Diploma | 0 (0.0%) | 1 (100.0%) |
| College or Associate's Degree | 3 (100.0%) | 0 (0.0%) |
| Bachelor's Degree | 0 (0.0%) | 0 (0.0%) |
| Graduate Degree | 0 (0.0%) | 0 (0.0%) |
| Total | 3 (75.0%) | 1 (25.0%) |
Employment Characteristics in Lenhartsville borough
Employment by Class of Employer in Lenhartsville borough
Among the 81 employed individuals in Lenhartsville borough, private company employees (45 | 55.6%), not-for-profit organizations (12 | 14.8%), and local government employees (12 | 14.8%) make up the most common classes of employment.
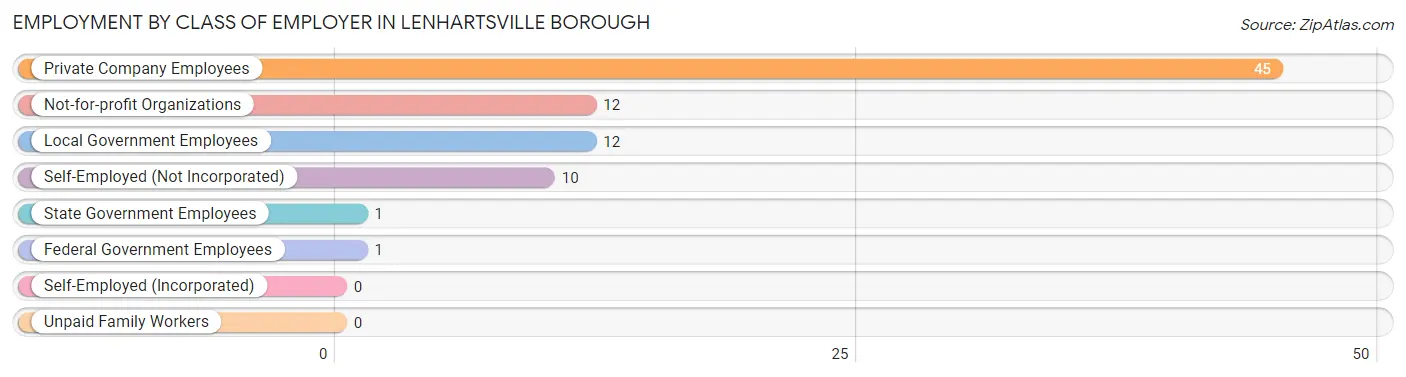
| Employer Class | # Employees | % Employees |
| Private Company Employees | 45 | 55.6% |
| Self-Employed (Incorporated) | 0 | 0.0% |
| Self-Employed (Not Incorporated) | 10 | 12.3% |
| Not-for-profit Organizations | 12 | 14.8% |
| Local Government Employees | 12 | 14.8% |
| State Government Employees | 1 | 1.2% |
| Federal Government Employees | 1 | 1.2% |
| Unpaid Family Workers | 0 | 0.0% |
| Total | 81 | 100.0% |
Employment Status by Age in Lenhartsville borough
According to the labor force statistics for Lenhartsville borough, out of the total population over 16 years of age (135), 63.0% or 85 individuals are in the labor force, with 2.4% or 2 of them unemployed. The age group with the highest labor force participation rate is 60 to 64 years, with 100.0% or 5 individuals in the labor force. Within the labor force, the 20 to 24 years age range has the highest percentage of unemployed individuals, with 16.7% or 1 of them being unemployed.
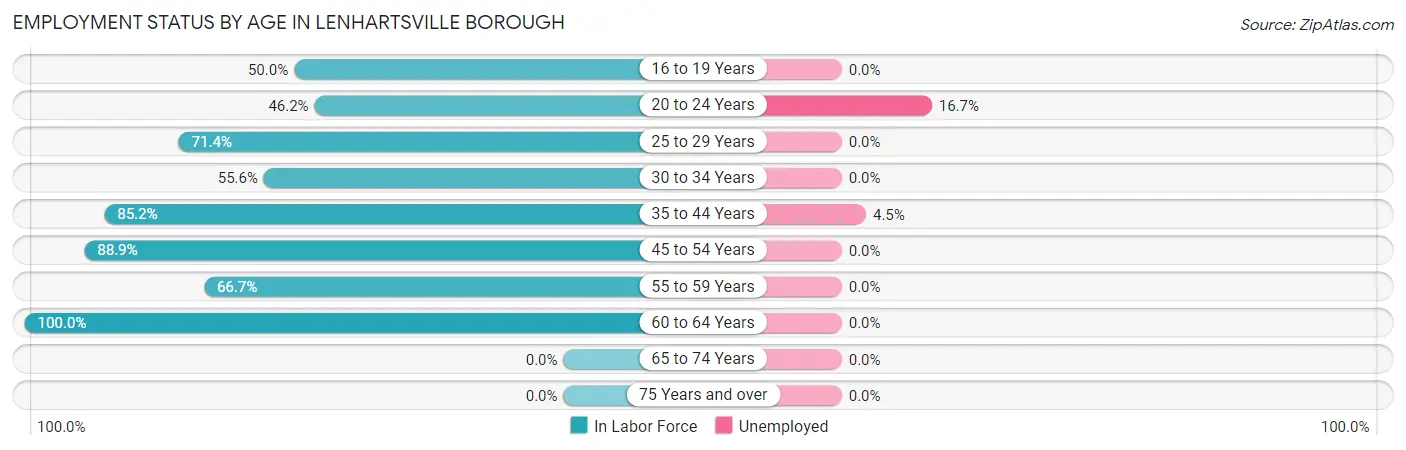
| Age Bracket | In Labor Force | Unemployed |
| 16 to 19 Years | 4 (50.0%) | 0 (0.0%) |
| 20 to 24 Years | 6 (46.2%) | 1 (16.7%) |
| 25 to 29 Years | 10 (71.4%) | 0 (0.0%) |
| 30 to 34 Years | 5 (55.6%) | 0 (0.0%) |
| 35 to 44 Years | 23 (85.2%) | 1 (4.5%) |
| 45 to 54 Years | 24 (88.9%) | 0 (0.0%) |
| 55 to 59 Years | 8 (66.7%) | 0 (0.0%) |
| 60 to 64 Years | 5 (100.0%) | 0 (0.0%) |
| 65 to 74 Years | 0 (0.0%) | 0 (0.0%) |
| 75 Years and over | 0 (0.0%) | 0 (0.0%) |
| Total | 85 (63.0%) | 2 (2.4%) |
Employment Status by Educational Attainment in Lenhartsville borough
According to labor force statistics for Lenhartsville borough, 79.8% of individuals (75) out of the total population between 25 and 64 years of age (94) are in the labor force, with 1.4% or 1 of them being unemployed. The group with the highest labor force participation rate are those with the educational attainment of bachelor's degree or higher, with 100.0% or 32 individuals in the labor force. Within the labor force, individuals with college / associate degree education have the highest percentage of unemployment, with 5.0% or 1 of them being unemployed.

| Educational Attainment | In Labor Force | Unemployed |
| Less than High School | 0 (0.0%) | 0 (0.0%) |
| High School Diploma | 23 (63.9%) | 0 (0.0%) |
| College / Associate Degree | 20 (90.9%) | 1 (5.0%) |
| Bachelor's Degree or higher | 32 (100.0%) | 0 (0.0%) |
| Total | 75 (79.8%) | 1 (1.4%) |
Employment Occupations by Sex in Lenhartsville borough
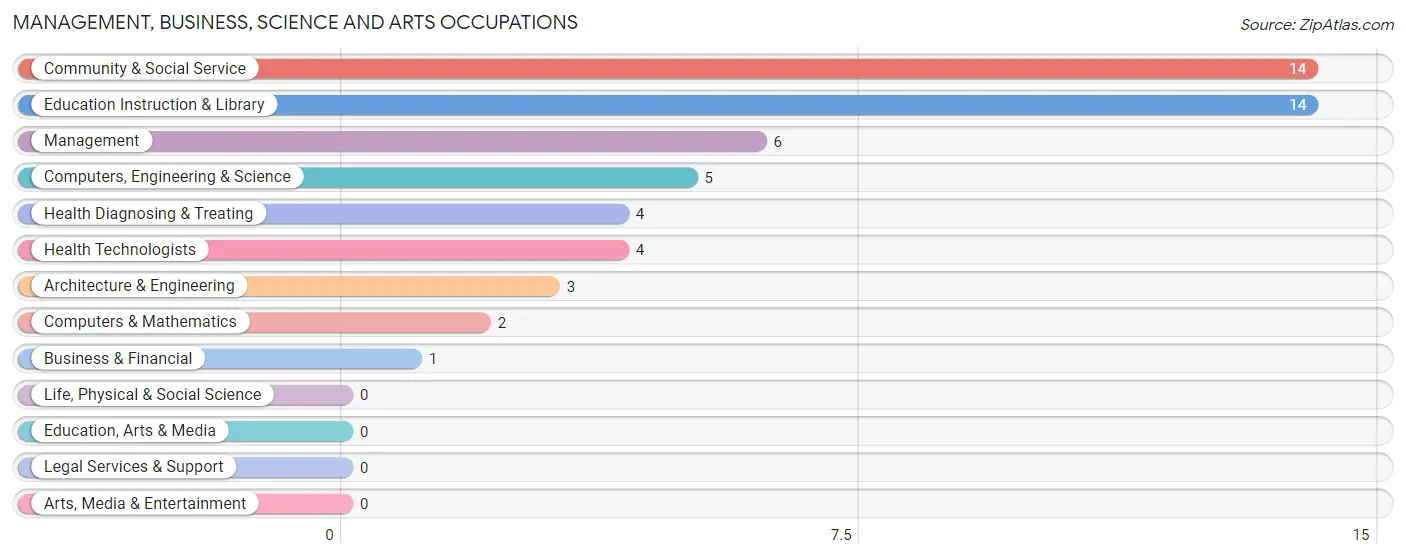
Management, Business, Science and Arts Occupations
The most common Management, Business, Science and Arts occupations in Lenhartsville borough are Community & Social Service (14 | 17.1%), Education Instruction & Library (14 | 17.1%), Management (6 | 7.3%), Computers, Engineering & Science (5 | 6.1%), and Health Diagnosing & Treating (4 | 4.9%).
Management, Business, Science and Arts Occupations by Sex
Within the Management, Business, Science and Arts occupations in Lenhartsville borough, the most male-oriented occupations are Computers, Engineering & Science (100.0%), Computers & Mathematics (100.0%), and Architecture & Engineering (100.0%), while the most female-oriented occupations are Business & Financial (100.0%), Health Diagnosing & Treating (100.0%), and Health Technologists (100.0%).
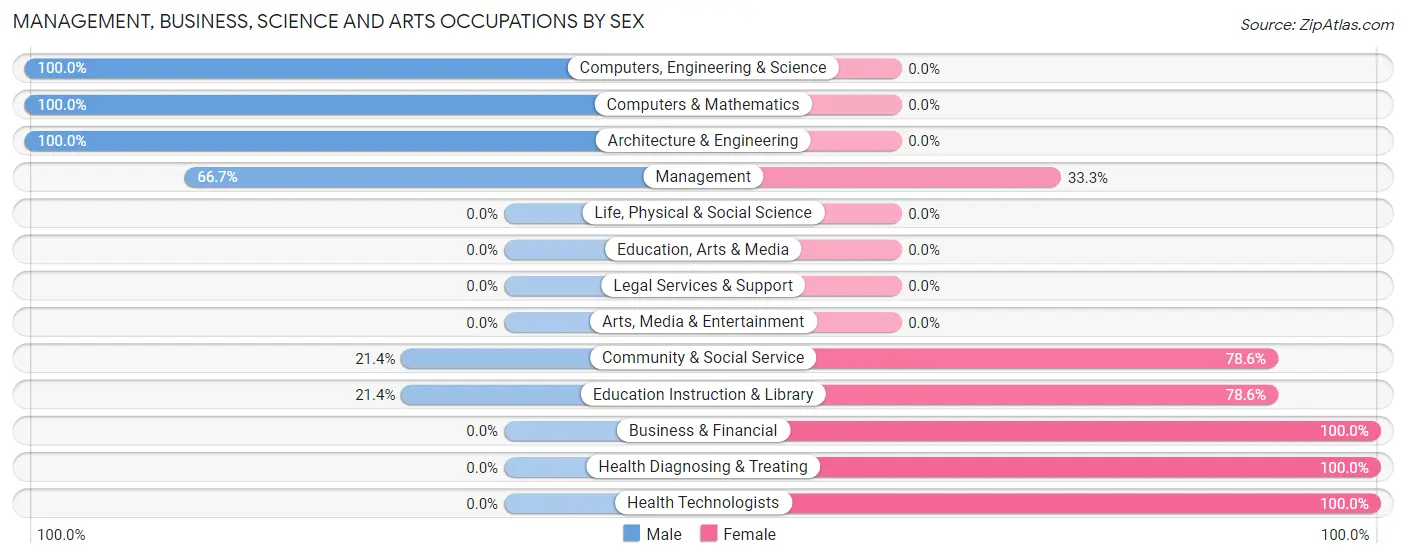
| Occupation | Male | Female |
| Management | 4 (66.7%) | 2 (33.3%) |
| Business & Financial | 0 (0.0%) | 1 (100.0%) |
| Computers, Engineering & Science | 5 (100.0%) | 0 (0.0%) |
| Computers & Mathematics | 2 (100.0%) | 0 (0.0%) |
| Architecture & Engineering | 3 (100.0%) | 0 (0.0%) |
| Life, Physical & Social Science | 0 (0.0%) | 0 (0.0%) |
| Community & Social Service | 3 (21.4%) | 11 (78.6%) |
| Education, Arts & Media | 0 (0.0%) | 0 (0.0%) |
| Legal Services & Support | 0 (0.0%) | 0 (0.0%) |
| Education Instruction & Library | 3 (21.4%) | 11 (78.6%) |
| Arts, Media & Entertainment | 0 (0.0%) | 0 (0.0%) |
| Health Diagnosing & Treating | 0 (0.0%) | 4 (100.0%) |
| Health Technologists | 0 (0.0%) | 4 (100.0%) |
| Total (Category) | 12 (40.0%) | 18 (60.0%) |
| Total (Overall) | 42 (51.2%) | 40 (48.8%) |
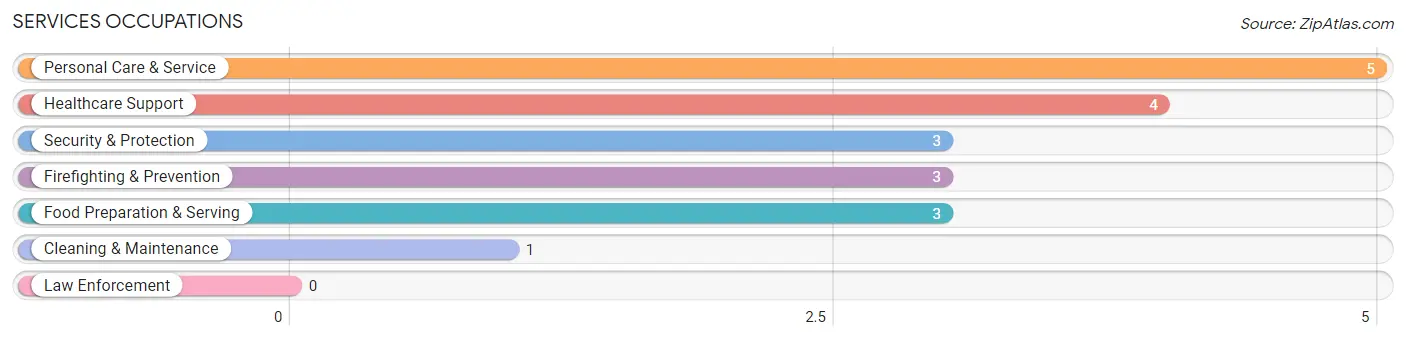
Services Occupations
The most common Services occupations in Lenhartsville borough are Personal Care & Service (5 | 6.1%), Healthcare Support (4 | 4.9%), Security & Protection (3 | 3.7%), Firefighting & Prevention (3 | 3.7%), and Food Preparation & Serving (3 | 3.7%).
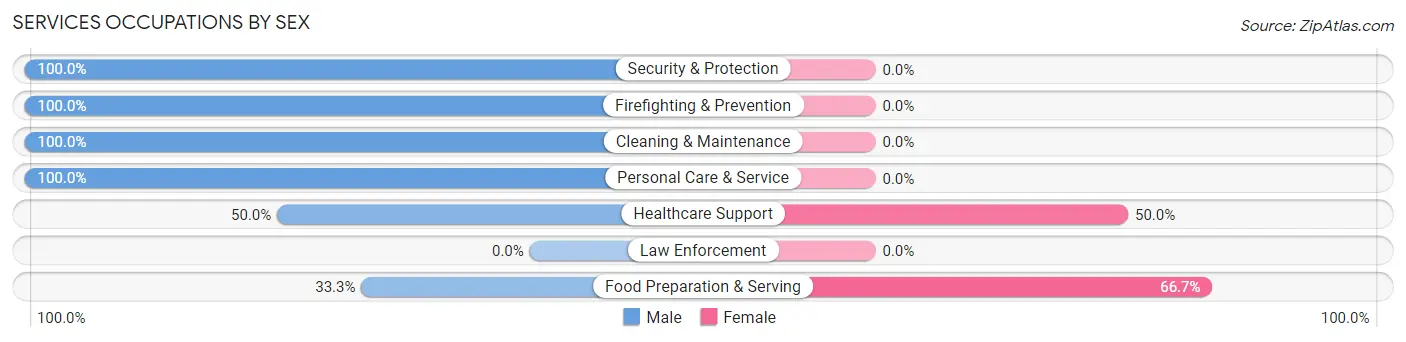
Services Occupations by Sex
Within the Services occupations in Lenhartsville borough, the most male-oriented occupations are Security & Protection (100.0%), Firefighting & Prevention (100.0%), and Cleaning & Maintenance (100.0%), while the most female-oriented occupations are Food Preparation & Serving (66.7%), and Healthcare Support (50.0%).
| Occupation | Male | Female |
| Healthcare Support | 2 (50.0%) | 2 (50.0%) |
| Security & Protection | 3 (100.0%) | 0 (0.0%) |
| Firefighting & Prevention | 3 (100.0%) | 0 (0.0%) |
| Law Enforcement | 0 (0.0%) | 0 (0.0%) |
| Food Preparation & Serving | 1 (33.3%) | 2 (66.7%) |
| Cleaning & Maintenance | 1 (100.0%) | 0 (0.0%) |
| Personal Care & Service | 5 (100.0%) | 0 (0.0%) |
| Total (Category) | 12 (75.0%) | 4 (25.0%) |
| Total (Overall) | 42 (51.2%) | 40 (48.8%) |
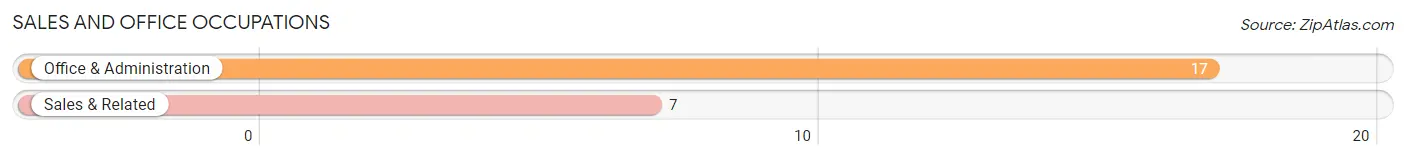
Sales and Office Occupations
The most common Sales and Office occupations in Lenhartsville borough are Office & Administration (17 | 20.7%), and Sales & Related (7 | 8.5%).
Sales and Office Occupations by Sex

| Occupation | Male | Female |
| Sales & Related | 4 (57.1%) | 3 (42.9%) |
| Office & Administration | 3 (17.6%) | 14 (82.4%) |
| Total (Category) | 7 (29.2%) | 17 (70.8%) |
| Total (Overall) | 42 (51.2%) | 40 (48.8%) |
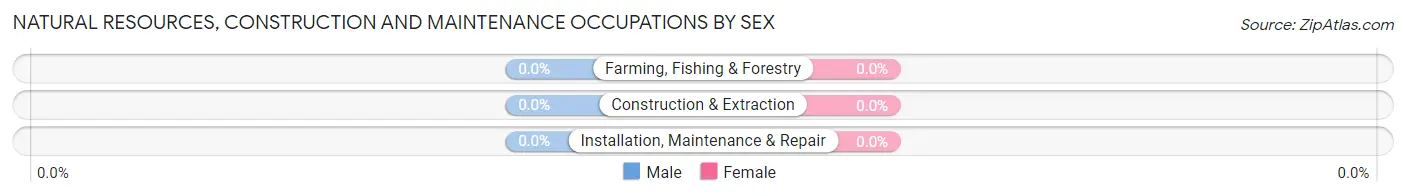
Natural Resources, Construction and Maintenance Occupations

Natural Resources, Construction and Maintenance Occupations by Sex
| Occupation | Male | Female |
| Farming, Fishing & Forestry | 0 (0.0%) | 0 (0.0%) |
| Construction & Extraction | 0 (0.0%) | 0 (0.0%) |
| Installation, Maintenance & Repair | 0 (0.0%) | 0 (0.0%) |
| Total (Category) | 0 (0.0%) | 0 (0.0%) |
| Total (Overall) | 42 (51.2%) | 40 (48.8%) |
Production, Transportation and Moving Occupations
The most common Production, Transportation and Moving occupations in Lenhartsville borough are Material Moving (7 | 8.5%), and Transportation (5 | 6.1%).
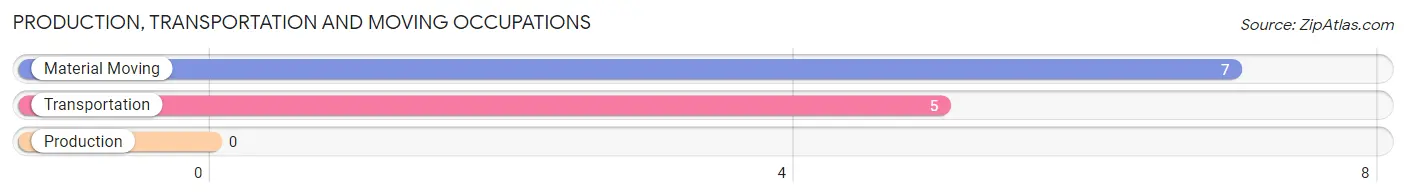
Production, Transportation and Moving Occupations by Sex
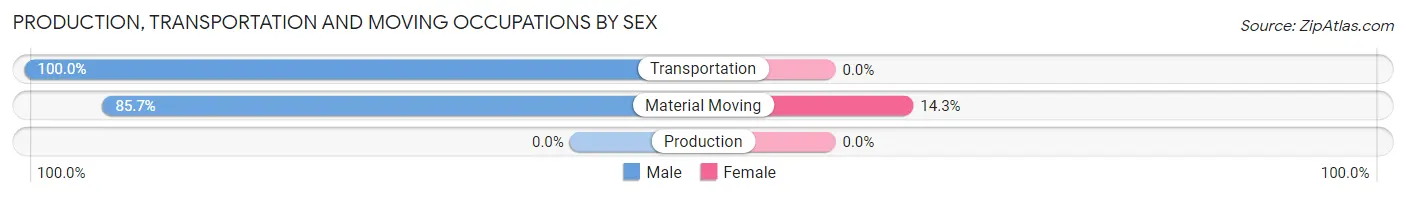
| Occupation | Male | Female |
| Production | 0 (0.0%) | 0 (0.0%) |
| Transportation | 5 (100.0%) | 0 (0.0%) |
| Material Moving | 6 (85.7%) | 1 (14.3%) |
| Total (Category) | 11 (91.7%) | 1 (8.3%) |
| Total (Overall) | 42 (51.2%) | 40 (48.8%) |
Employment Industries by Sex in Lenhartsville borough
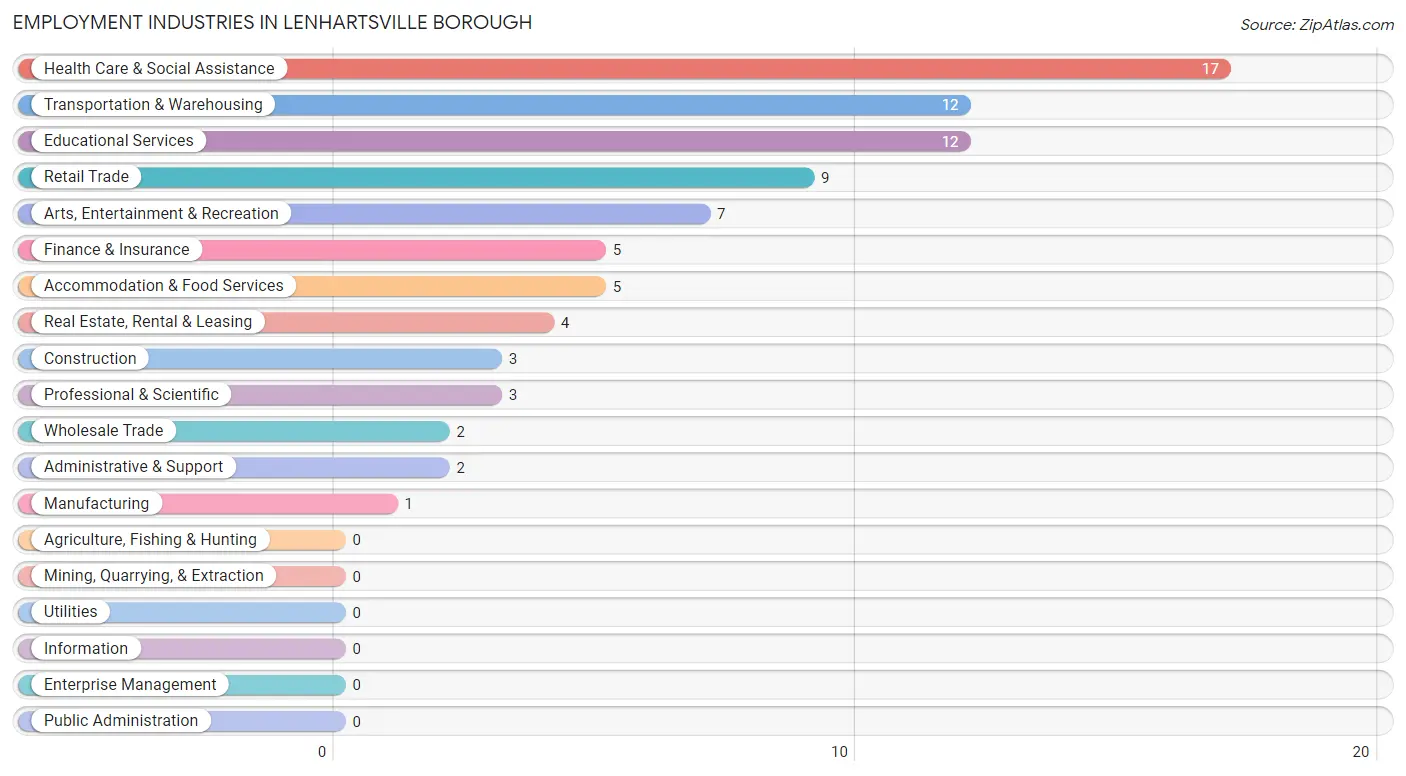
Employment Industries in Lenhartsville borough
The major employment industries in Lenhartsville borough include Health Care & Social Assistance (17 | 20.7%), Transportation & Warehousing (12 | 14.6%), Educational Services (12 | 14.6%), Retail Trade (9 | 11.0%), and Arts, Entertainment & Recreation (7 | 8.5%).
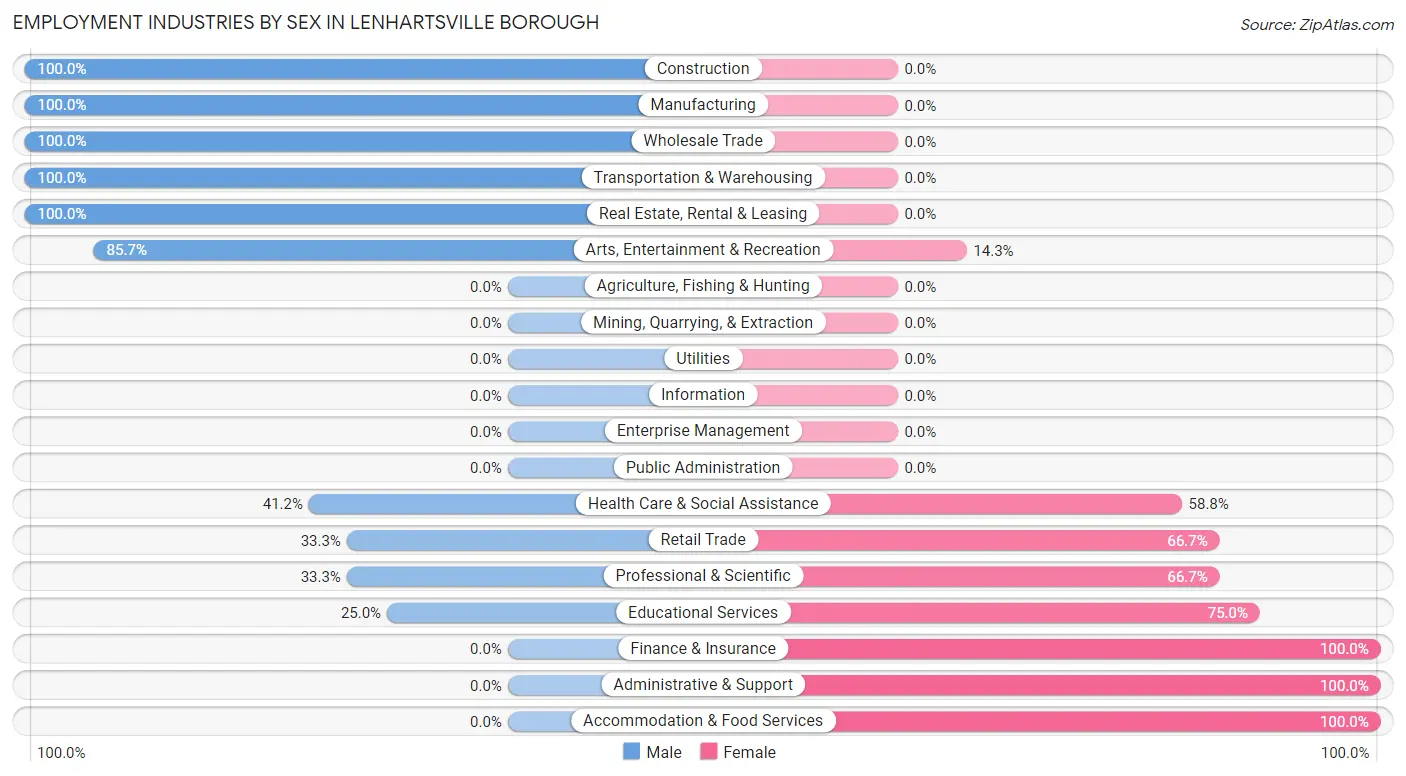
Employment Industries by Sex in Lenhartsville borough
The Lenhartsville borough industries that see more men than women are Construction (100.0%), Manufacturing (100.0%), and Wholesale Trade (100.0%), whereas the industries that tend to have a higher number of women are Finance & Insurance (100.0%), Administrative & Support (100.0%), and Accommodation & Food Services (100.0%).
| Industry | Male | Female |
| Agriculture, Fishing & Hunting | 0 (0.0%) | 0 (0.0%) |
| Mining, Quarrying, & Extraction | 0 (0.0%) | 0 (0.0%) |
| Construction | 3 (100.0%) | 0 (0.0%) |
| Manufacturing | 1 (100.0%) | 0 (0.0%) |
| Wholesale Trade | 2 (100.0%) | 0 (0.0%) |
| Retail Trade | 3 (33.3%) | 6 (66.7%) |
| Transportation & Warehousing | 12 (100.0%) | 0 (0.0%) |
| Utilities | 0 (0.0%) | 0 (0.0%) |
| Information | 0 (0.0%) | 0 (0.0%) |
| Finance & Insurance | 0 (0.0%) | 5 (100.0%) |
| Real Estate, Rental & Leasing | 4 (100.0%) | 0 (0.0%) |
| Professional & Scientific | 1 (33.3%) | 2 (66.7%) |
| Enterprise Management | 0 (0.0%) | 0 (0.0%) |
| Administrative & Support | 0 (0.0%) | 2 (100.0%) |
| Educational Services | 3 (25.0%) | 9 (75.0%) |
| Health Care & Social Assistance | 7 (41.2%) | 10 (58.8%) |
| Arts, Entertainment & Recreation | 6 (85.7%) | 1 (14.3%) |
| Accommodation & Food Services | 0 (0.0%) | 5 (100.0%) |
| Public Administration | 0 (0.0%) | 0 (0.0%) |
| Total | 42 (51.2%) | 40 (48.8%) |
Education in Lenhartsville borough
School Enrollment in Lenhartsville borough
The most common levels of schooling among the 39 students in Lenhartsville borough are high school (12 | 30.8%), middle school (9 | 23.1%), and college / undergraduate (8 | 20.5%).
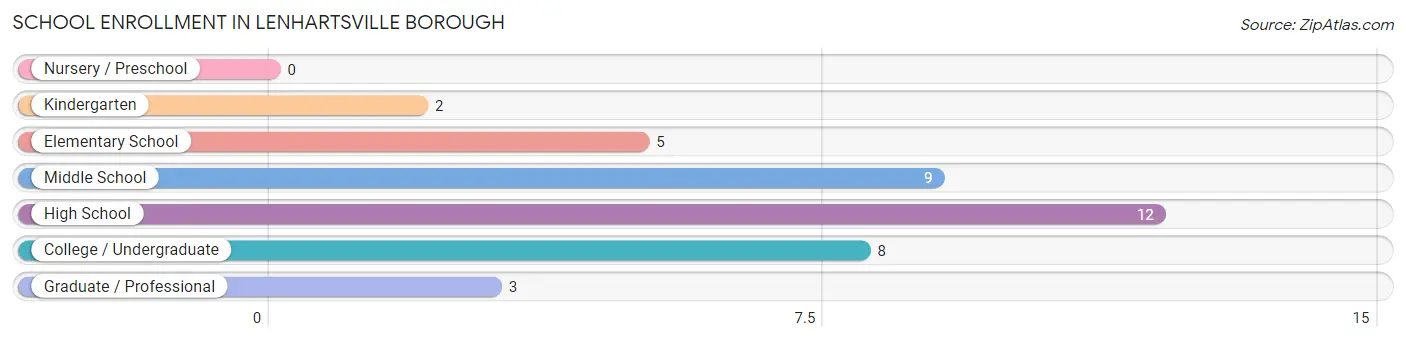
| School Level | # Students | % Students |
| Nursery / Preschool | 0 | 0.0% |
| Kindergarten | 2 | 5.1% |
| Elementary School | 5 | 12.8% |
| Middle School | 9 | 23.1% |
| High School | 12 | 30.8% |
| College / Undergraduate | 8 | 20.5% |
| Graduate / Professional | 3 | 7.7% |
| Total | 39 | 100.0% |
School Enrollment by Age by Funding Source in Lenhartsville borough
Out of a total of 39 students who are enrolled in schools in Lenhartsville borough, 13 (33.3%) attend a private institution, while the remaining 26 (66.7%) are enrolled in public schools. The age group of 5 to 9 year old has the highest likelihood of being enrolled in private schools, with 4 (57.1% in the age bracket) enrolled. Conversely, the age group of 15 to 17 year olds has the lowest likelihood of being enrolled in a private school, with 6 (85.7% in the age bracket) attending a public institution.
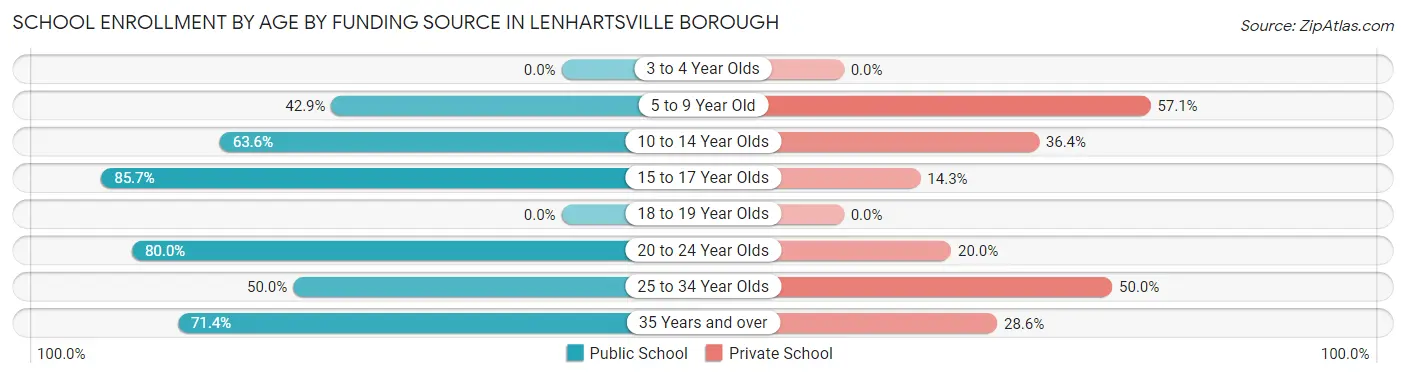
| Age Bracket | Public School | Private School |
| 3 to 4 Year Olds | 0 (0.0%) | 0 (0.0%) |
| 5 to 9 Year Old | 3 (42.9%) | 4 (57.1%) |
| 10 to 14 Year Olds | 7 (63.6%) | 4 (36.4%) |
| 15 to 17 Year Olds | 6 (85.7%) | 1 (14.3%) |
| 18 to 19 Year Olds | 0 (0.0%) | 0 (0.0%) |
| 20 to 24 Year Olds | 4 (80.0%) | 1 (20.0%) |
| 25 to 34 Year Olds | 1 (50.0%) | 1 (50.0%) |
| 35 Years and over | 5 (71.4%) | 2 (28.6%) |
| Total | 26 (66.7%) | 13 (33.3%) |
Educational Attainment by Field of Study in Lenhartsville borough
Education (16 | 45.7%), literature & languages (7 | 20.0%), computers & mathematics (6 | 17.1%), science & technology (4 | 11.4%), and liberal arts & history (1 | 2.9%) are the most common fields of study among 35 individuals in Lenhartsville borough who have obtained a bachelor's degree or higher.
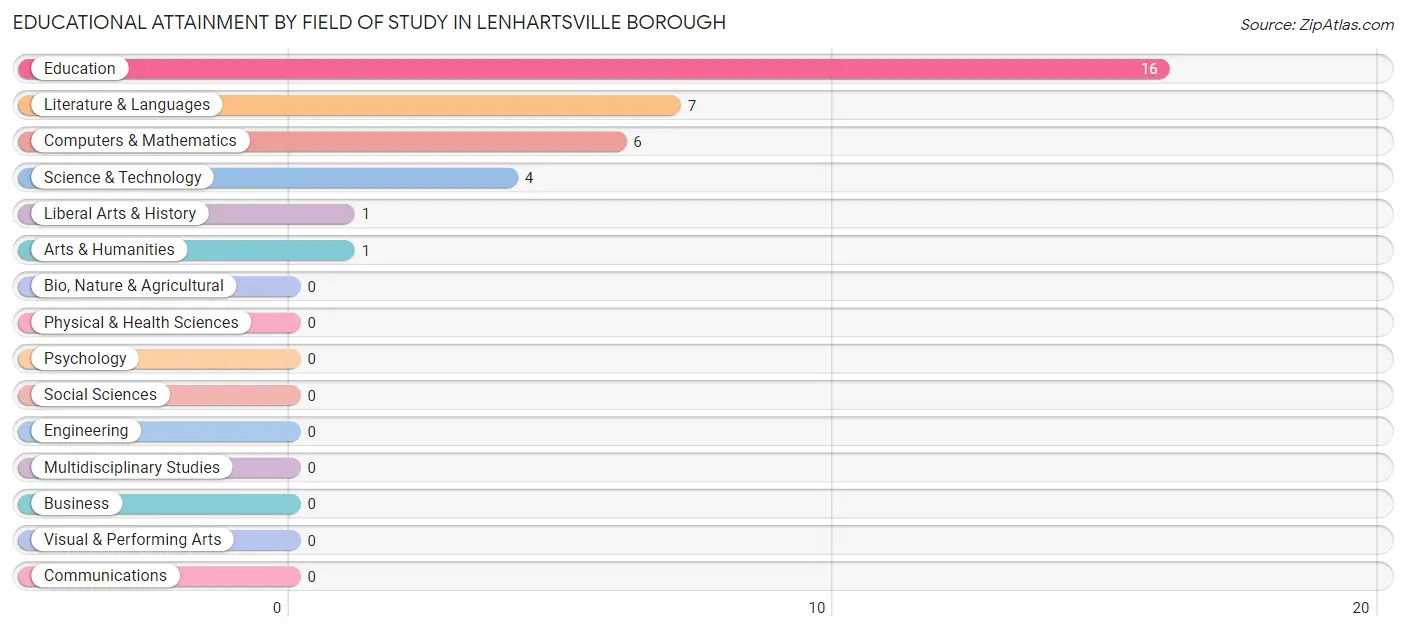
| Field of Study | # Graduates | % Graduates |
| Computers & Mathematics | 6 | 17.1% |
| Bio, Nature & Agricultural | 0 | 0.0% |
| Physical & Health Sciences | 0 | 0.0% |
| Psychology | 0 | 0.0% |
| Social Sciences | 0 | 0.0% |
| Engineering | 0 | 0.0% |
| Multidisciplinary Studies | 0 | 0.0% |
| Science & Technology | 4 | 11.4% |
| Business | 0 | 0.0% |
| Education | 16 | 45.7% |
| Literature & Languages | 7 | 20.0% |
| Liberal Arts & History | 1 | 2.9% |
| Visual & Performing Arts | 0 | 0.0% |
| Communications | 0 | 0.0% |
| Arts & Humanities | 1 | 2.9% |
| Total | 35 | 100.0% |
Transportation & Commute in Lenhartsville borough
Vehicle Availability by Sex in Lenhartsville borough
The most prevalent vehicle ownership categories in Lenhartsville borough are males with 2 vehicles (29, accounting for 69.1%) and females with 2 vehicles (24, making up 74.4%).
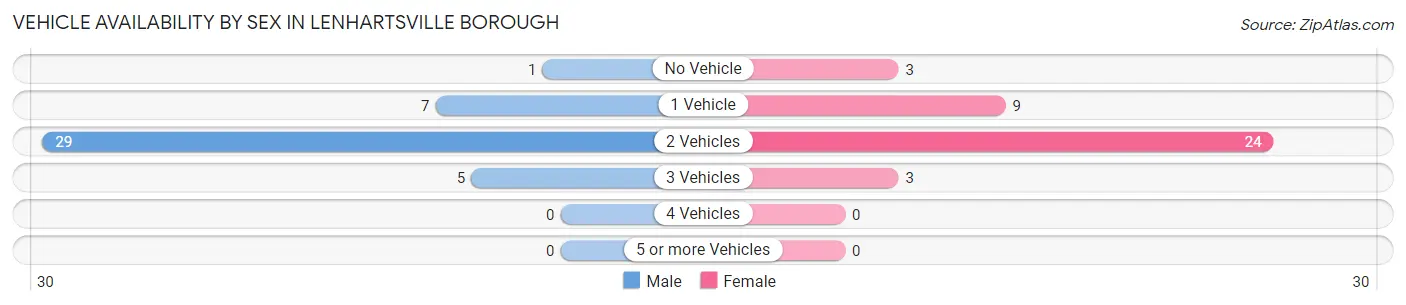
| Vehicles Available | Male | Female |
| No Vehicle | 1 (2.4%) | 3 (7.7%) |
| 1 Vehicle | 7 (16.7%) | 9 (23.1%) |
| 2 Vehicles | 29 (69.1%) | 24 (61.5%) |
| 3 Vehicles | 5 (11.9%) | 3 (7.7%) |
| 4 Vehicles | 0 (0.0%) | 0 (0.0%) |
| 5 or more Vehicles | 0 (0.0%) | 0 (0.0%) |
| Total | 42 (100.0%) | 39 (100.0%) |
Commute Time in Lenhartsville borough
The most frequently occuring commute durations in Lenhartsville borough are 30 to 34 minutes (21 commuters, 28.0%), 20 to 24 minutes (13 commuters, 17.3%), and 45 to 59 minutes (13 commuters, 17.3%).
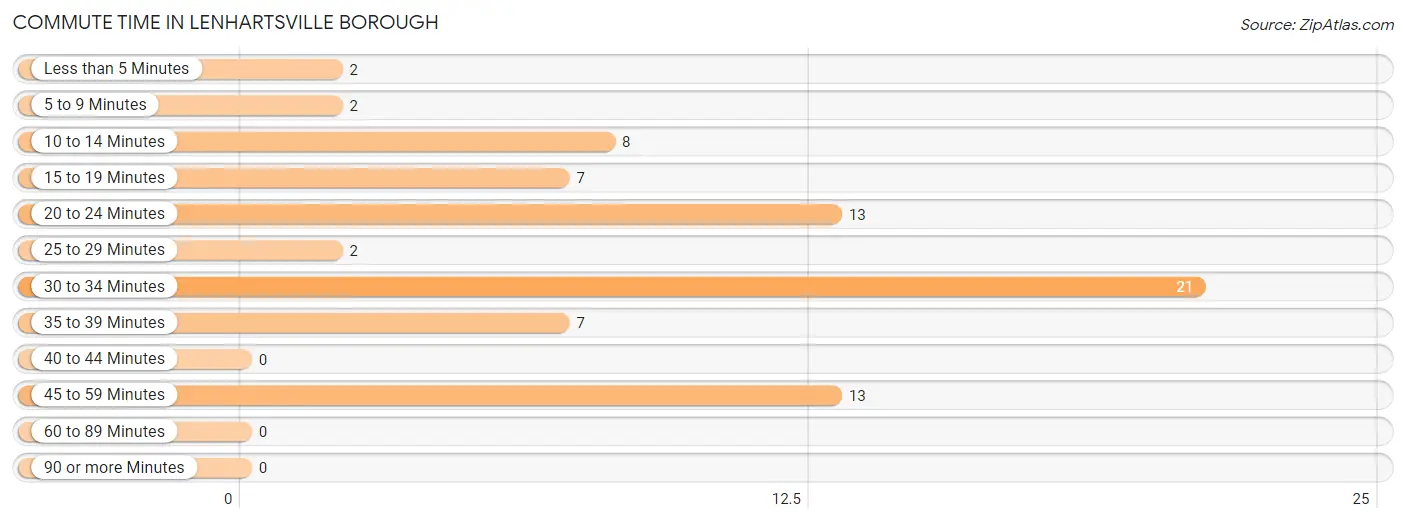
| Commute Time | # Commuters | % Commuters |
| Less than 5 Minutes | 2 | 2.7% |
| 5 to 9 Minutes | 2 | 2.7% |
| 10 to 14 Minutes | 8 | 10.7% |
| 15 to 19 Minutes | 7 | 9.3% |
| 20 to 24 Minutes | 13 | 17.3% |
| 25 to 29 Minutes | 2 | 2.7% |
| 30 to 34 Minutes | 21 | 28.0% |
| 35 to 39 Minutes | 7 | 9.3% |
| 40 to 44 Minutes | 0 | 0.0% |
| 45 to 59 Minutes | 13 | 17.3% |
| 60 to 89 Minutes | 0 | 0.0% |
| 90 or more Minutes | 0 | 0.0% |
Commute Time by Sex in Lenhartsville borough
The most common commute times in Lenhartsville borough are 30 to 34 minutes (11 commuters, 27.5%) for males and 30 to 34 minutes (10 commuters, 28.6%) for females.
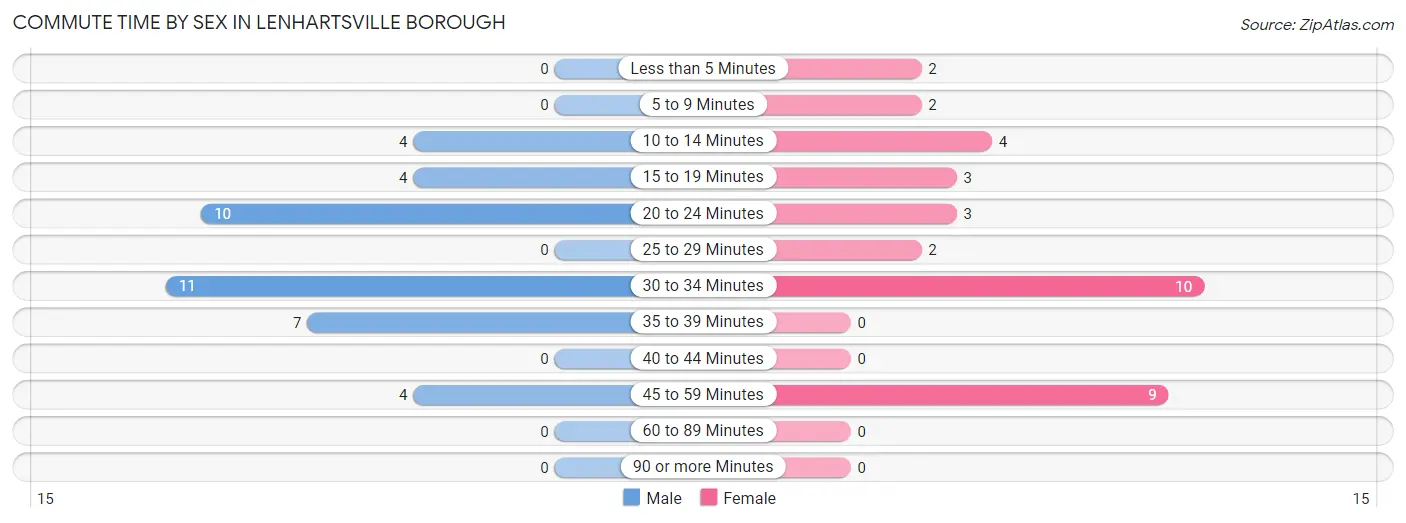
| Commute Time | Male | Female |
| Less than 5 Minutes | 0 (0.0%) | 2 (5.7%) |
| 5 to 9 Minutes | 0 (0.0%) | 2 (5.7%) |
| 10 to 14 Minutes | 4 (10.0%) | 4 (11.4%) |
| 15 to 19 Minutes | 4 (10.0%) | 3 (8.6%) |
| 20 to 24 Minutes | 10 (25.0%) | 3 (8.6%) |
| 25 to 29 Minutes | 0 (0.0%) | 2 (5.7%) |
| 30 to 34 Minutes | 11 (27.5%) | 10 (28.6%) |
| 35 to 39 Minutes | 7 (17.5%) | 0 (0.0%) |
| 40 to 44 Minutes | 0 (0.0%) | 0 (0.0%) |
| 45 to 59 Minutes | 4 (10.0%) | 9 (25.7%) |
| 60 to 89 Minutes | 0 (0.0%) | 0 (0.0%) |
| 90 or more Minutes | 0 (0.0%) | 0 (0.0%) |
Time of Departure to Work by Sex in Lenhartsville borough
The most frequent times of departure to work in Lenhartsville borough are 6:30 AM to 6:59 AM (11, 27.5%) for males and 4:00 PM to 11:59 PM (9, 25.7%) for females.
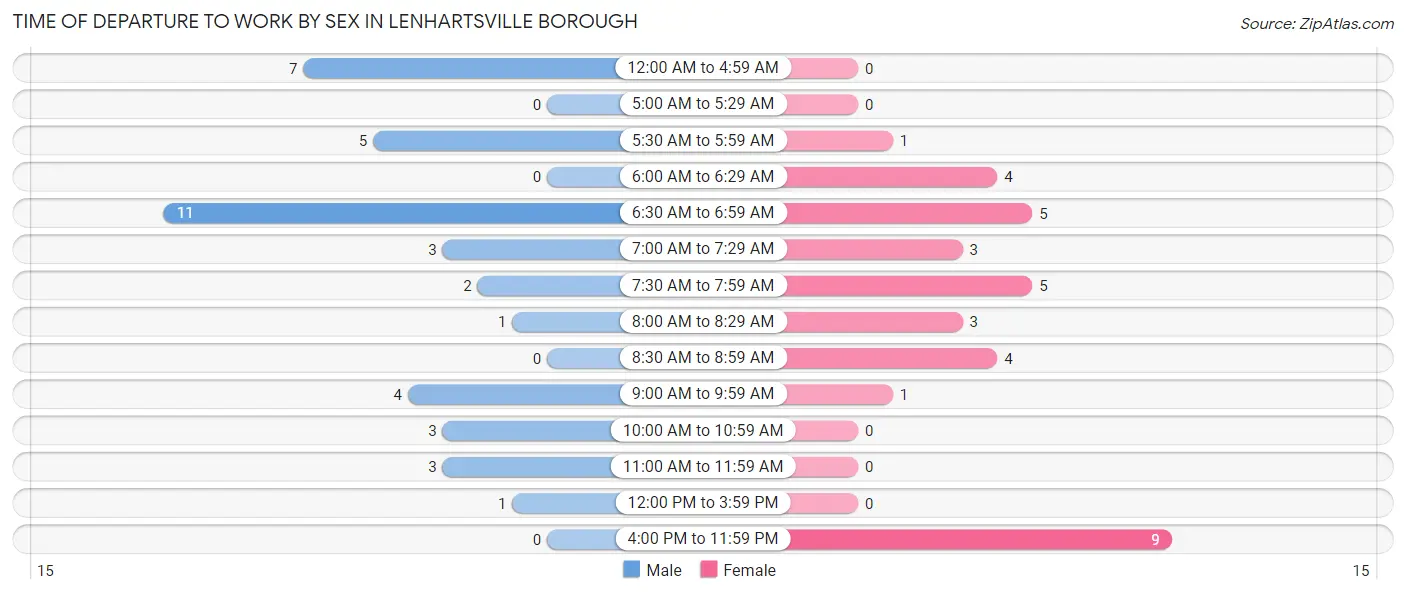
| Time of Departure | Male | Female |
| 12:00 AM to 4:59 AM | 7 (17.5%) | 0 (0.0%) |
| 5:00 AM to 5:29 AM | 0 (0.0%) | 0 (0.0%) |
| 5:30 AM to 5:59 AM | 5 (12.5%) | 1 (2.9%) |
| 6:00 AM to 6:29 AM | 0 (0.0%) | 4 (11.4%) |
| 6:30 AM to 6:59 AM | 11 (27.5%) | 5 (14.3%) |
| 7:00 AM to 7:29 AM | 3 (7.5%) | 3 (8.6%) |
| 7:30 AM to 7:59 AM | 2 (5.0%) | 5 (14.3%) |
| 8:00 AM to 8:29 AM | 1 (2.5%) | 3 (8.6%) |
| 8:30 AM to 8:59 AM | 0 (0.0%) | 4 (11.4%) |
| 9:00 AM to 9:59 AM | 4 (10.0%) | 1 (2.9%) |
| 10:00 AM to 10:59 AM | 3 (7.5%) | 0 (0.0%) |
| 11:00 AM to 11:59 AM | 3 (7.5%) | 0 (0.0%) |
| 12:00 PM to 3:59 PM | 1 (2.5%) | 0 (0.0%) |
| 4:00 PM to 11:59 PM | 0 (0.0%) | 9 (25.7%) |
| Total | 40 (100.0%) | 35 (100.0%) |
Housing Occupancy in Lenhartsville borough
Occupancy by Ownership in Lenhartsville borough
Of the total 69 dwellings in Lenhartsville borough, owner-occupied units account for 36 (52.2%), while renter-occupied units make up 33 (47.8%).
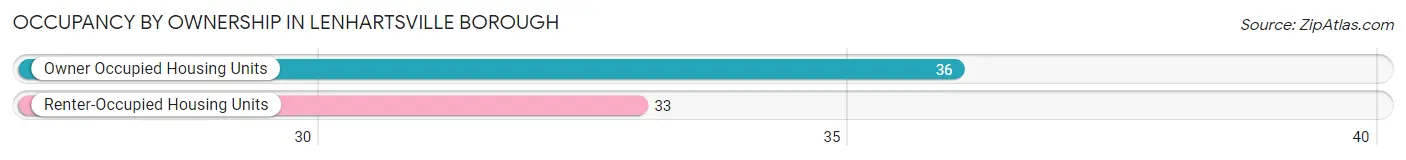
| Occupancy | # Housing Units | % Housing Units |
| Owner Occupied Housing Units | 36 | 52.2% |
| Renter-Occupied Housing Units | 33 | 47.8% |
| Total Occupied Housing Units | 69 | 100.0% |
Occupancy by Household Size in Lenhartsville borough
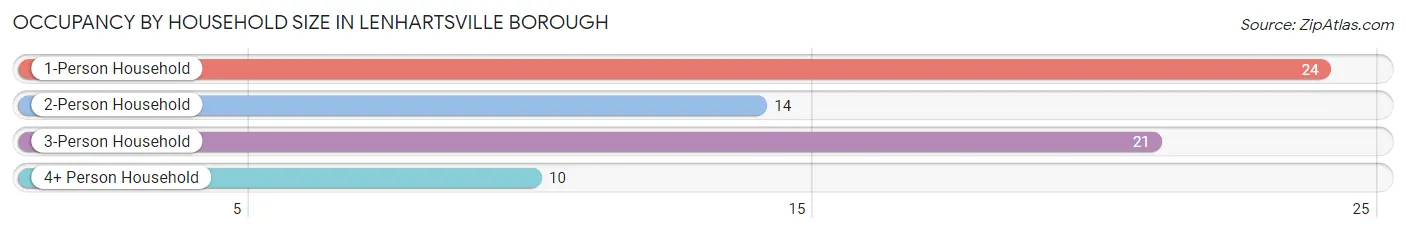
| Household Size | # Housing Units | % Housing Units |
| 1-Person Household | 24 | 34.8% |
| 2-Person Household | 14 | 20.3% |
| 3-Person Household | 21 | 30.4% |
| 4+ Person Household | 10 | 14.5% |
| Total Housing Units | 69 | 100.0% |
Occupancy by Ownership by Household Size in Lenhartsville borough
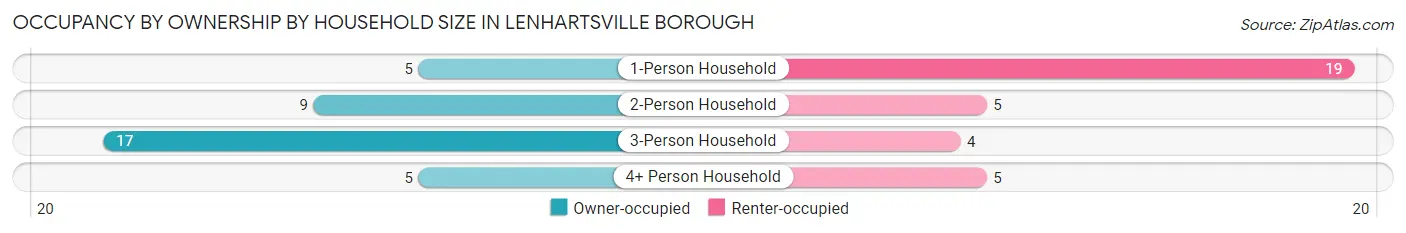
| Household Size | Owner-occupied | Renter-occupied |
| 1-Person Household | 5 (20.8%) | 19 (79.2%) |
| 2-Person Household | 9 (64.3%) | 5 (35.7%) |
| 3-Person Household | 17 (80.9%) | 4 (19.1%) |
| 4+ Person Household | 5 (50.0%) | 5 (50.0%) |
| Total Housing Units | 36 (52.2%) | 33 (47.8%) |
Occupancy by Educational Attainment in Lenhartsville borough
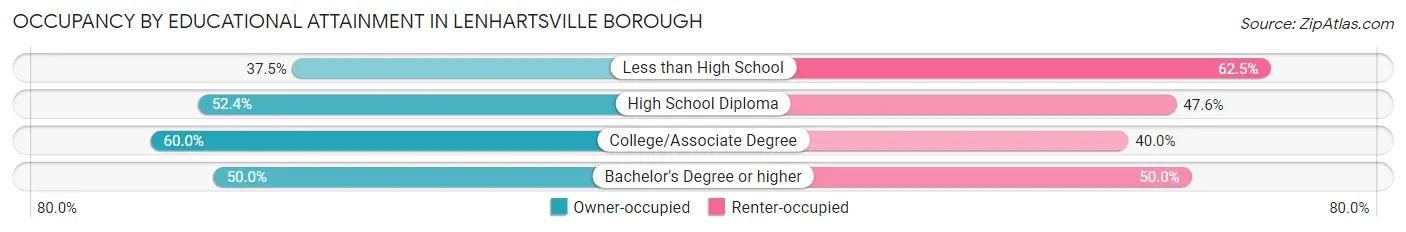
| Household Size | Owner-occupied | Renter-occupied |
| Less than High School | 3 (37.5%) | 5 (62.5%) |
| High School Diploma | 11 (52.4%) | 10 (47.6%) |
| College/Associate Degree | 12 (60.0%) | 8 (40.0%) |
| Bachelor's Degree or higher | 10 (50.0%) | 10 (50.0%) |
Occupancy by Age of Householder in Lenhartsville borough
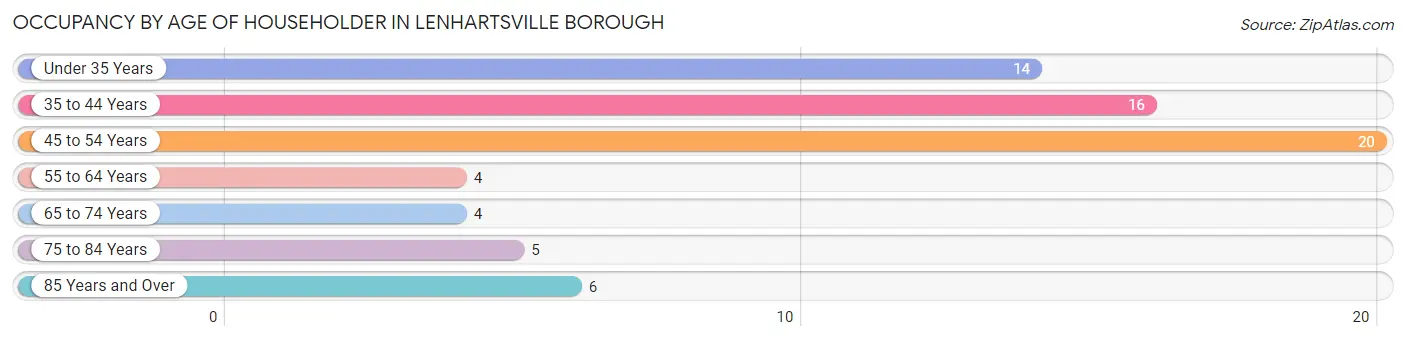
| Age Bracket | # Households | % Households |
| Under 35 Years | 14 | 20.3% |
| 35 to 44 Years | 16 | 23.2% |
| 45 to 54 Years | 20 | 29.0% |
| 55 to 64 Years | 4 | 5.8% |
| 65 to 74 Years | 4 | 5.8% |
| 75 to 84 Years | 5 | 7.2% |
| 85 Years and Over | 6 | 8.7% |
| Total | 69 | 100.0% |
Housing Finances in Lenhartsville borough
Median Income by Occupancy in Lenhartsville borough
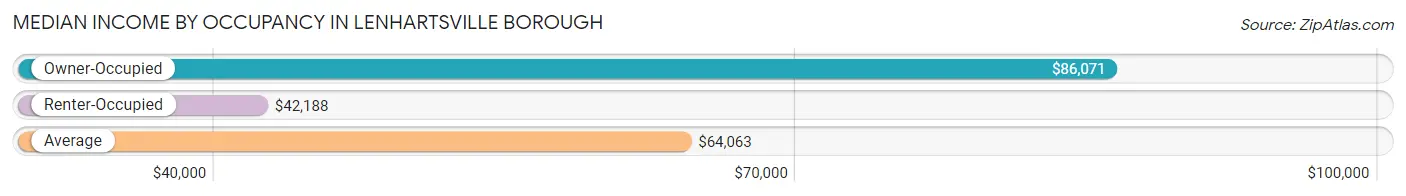
| Occupancy Type | # Households | Median Income |
| Owner-Occupied | 36 (52.2%) | $86,071 |
| Renter-Occupied | 33 (47.8%) | $42,188 |
| Average | 69 (100.0%) | $64,063 |
Occupancy by Householder Income Bracket in Lenhartsville borough
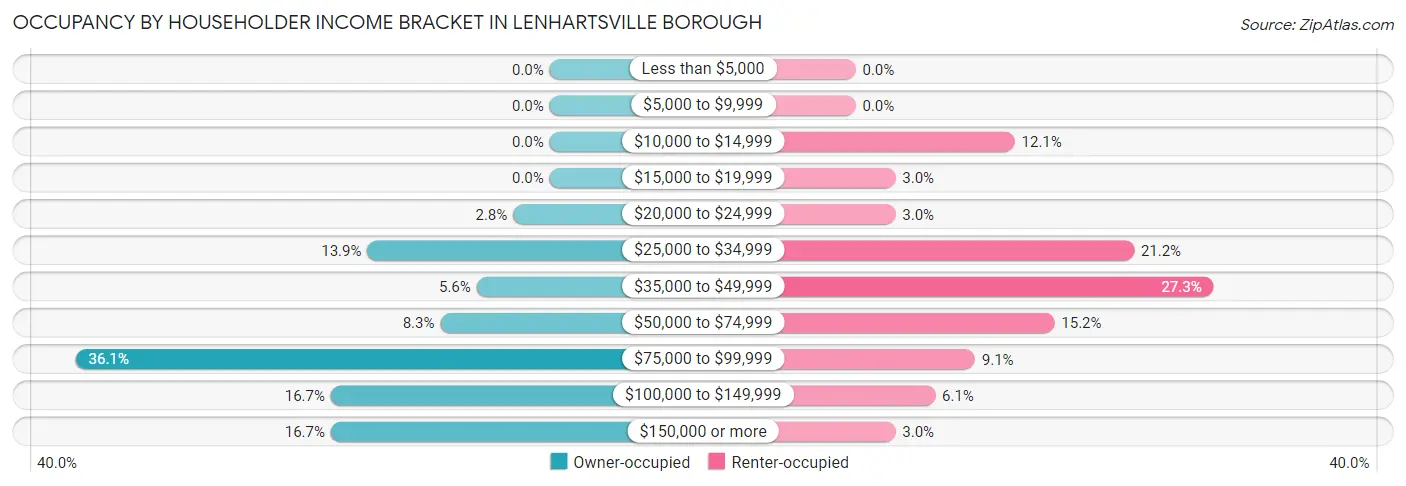
| Income Bracket | Owner-occupied | Renter-occupied |
| Less than $5,000 | 0 (0.0%) | 0 (0.0%) |
| $5,000 to $9,999 | 0 (0.0%) | 0 (0.0%) |
| $10,000 to $14,999 | 0 (0.0%) | 4 (12.1%) |
| $15,000 to $19,999 | 0 (0.0%) | 1 (3.0%) |
| $20,000 to $24,999 | 1 (2.8%) | 1 (3.0%) |
| $25,000 to $34,999 | 5 (13.9%) | 7 (21.2%) |
| $35,000 to $49,999 | 2 (5.6%) | 9 (27.3%) |
| $50,000 to $74,999 | 3 (8.3%) | 5 (15.1%) |
| $75,000 to $99,999 | 13 (36.1%) | 3 (9.1%) |
| $100,000 to $149,999 | 6 (16.7%) | 2 (6.1%) |
| $150,000 or more | 6 (16.7%) | 1 (3.0%) |
| Total | 36 (100.0%) | 33 (100.0%) |
Monthly Housing Cost Tiers in Lenhartsville borough
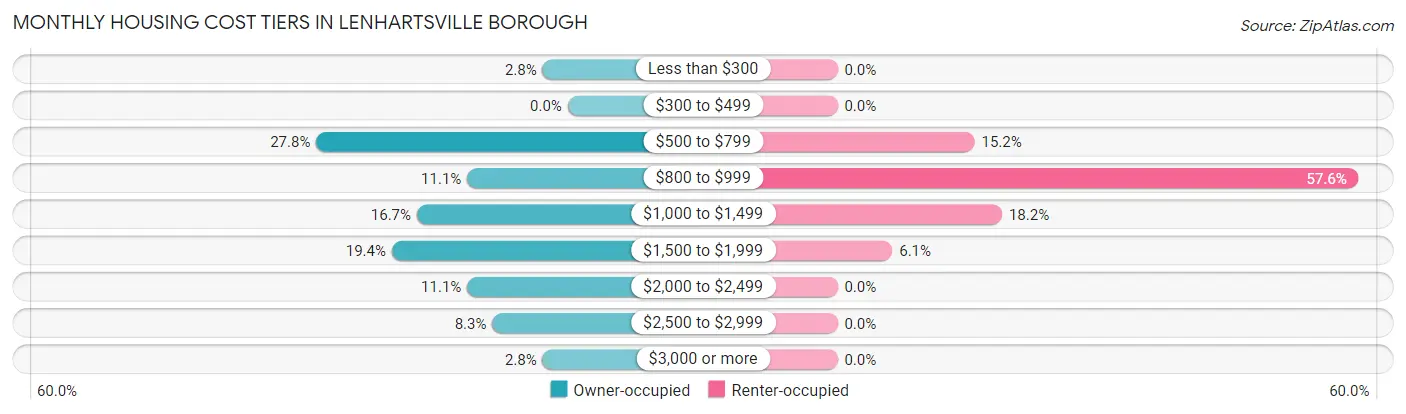
| Monthly Cost | Owner-occupied | Renter-occupied |
| Less than $300 | 1 (2.8%) | 0 (0.0%) |
| $300 to $499 | 0 (0.0%) | 0 (0.0%) |
| $500 to $799 | 10 (27.8%) | 5 (15.1%) |
| $800 to $999 | 4 (11.1%) | 19 (57.6%) |
| $1,000 to $1,499 | 6 (16.7%) | 6 (18.2%) |
| $1,500 to $1,999 | 7 (19.4%) | 2 (6.1%) |
| $2,000 to $2,499 | 4 (11.1%) | 0 (0.0%) |
| $2,500 to $2,999 | 3 (8.3%) | 0 (0.0%) |
| $3,000 or more | 1 (2.8%) | 0 (0.0%) |
| Total | 36 (100.0%) | 33 (100.0%) |
Physical Housing Characteristics in Lenhartsville borough
Housing Structures in Lenhartsville borough
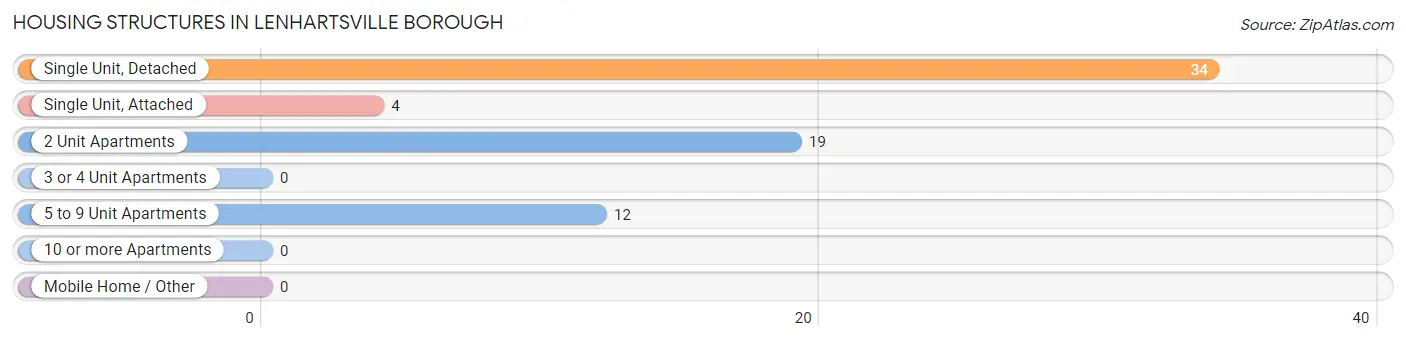
| Structure Type | # Housing Units | % Housing Units |
| Single Unit, Detached | 34 | 49.3% |
| Single Unit, Attached | 4 | 5.8% |
| 2 Unit Apartments | 19 | 27.5% |
| 3 or 4 Unit Apartments | 0 | 0.0% |
| 5 to 9 Unit Apartments | 12 | 17.4% |
| 10 or more Apartments | 0 | 0.0% |
| Mobile Home / Other | 0 | 0.0% |
| Total | 69 | 100.0% |
Housing Structures by Occupancy in Lenhartsville borough
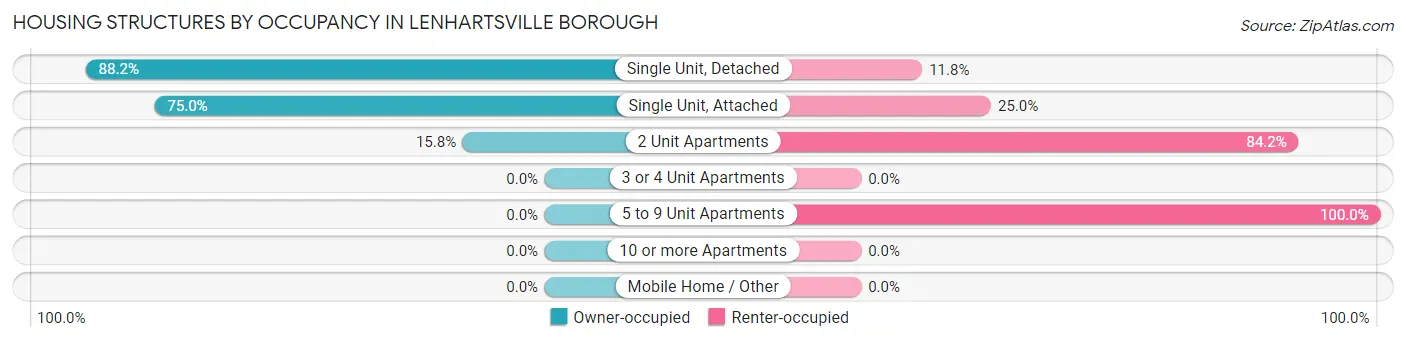
| Structure Type | Owner-occupied | Renter-occupied |
| Single Unit, Detached | 30 (88.2%) | 4 (11.8%) |
| Single Unit, Attached | 3 (75.0%) | 1 (25.0%) |
| 2 Unit Apartments | 3 (15.8%) | 16 (84.2%) |
| 3 or 4 Unit Apartments | 0 (0.0%) | 0 (0.0%) |
| 5 to 9 Unit Apartments | 0 (0.0%) | 12 (100.0%) |
| 10 or more Apartments | 0 (0.0%) | 0 (0.0%) |
| Mobile Home / Other | 0 (0.0%) | 0 (0.0%) |
| Total | 36 (52.2%) | 33 (47.8%) |
Housing Structures by Number of Rooms in Lenhartsville borough
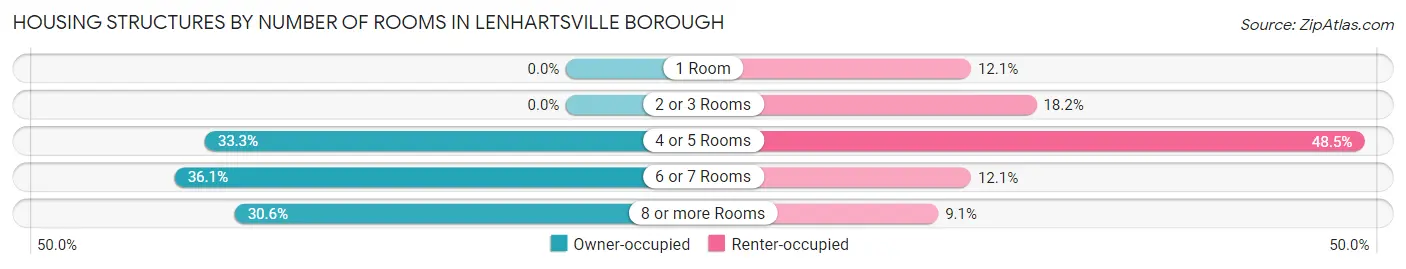
| Number of Rooms | Owner-occupied | Renter-occupied |
| 1 Room | 0 (0.0%) | 4 (12.1%) |
| 2 or 3 Rooms | 0 (0.0%) | 6 (18.2%) |
| 4 or 5 Rooms | 12 (33.3%) | 16 (48.5%) |
| 6 or 7 Rooms | 13 (36.1%) | 4 (12.1%) |
| 8 or more Rooms | 11 (30.6%) | 3 (9.1%) |
| Total | 36 (100.0%) | 33 (100.0%) |
Housing Structure by Heating Type in Lenhartsville borough
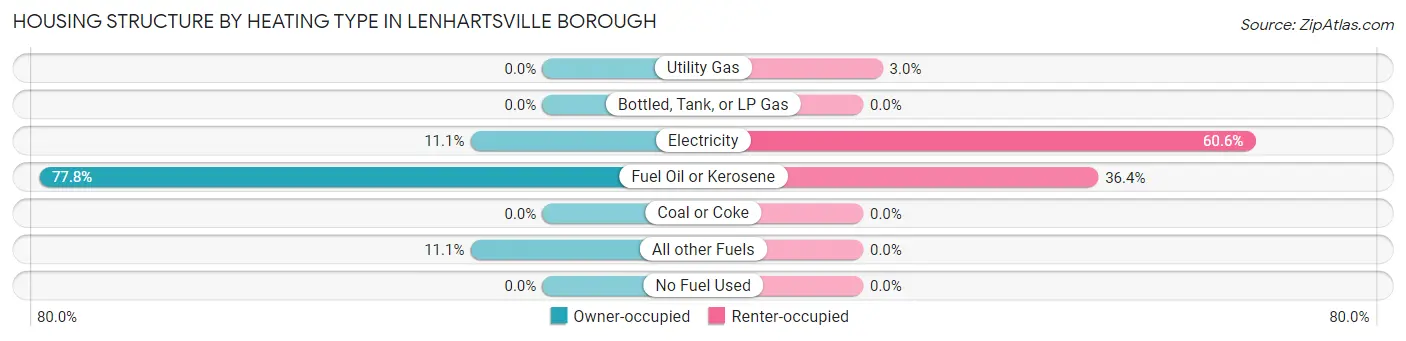
| Heating Type | Owner-occupied | Renter-occupied |
| Utility Gas | 0 (0.0%) | 1 (3.0%) |
| Bottled, Tank, or LP Gas | 0 (0.0%) | 0 (0.0%) |
| Electricity | 4 (11.1%) | 20 (60.6%) |
| Fuel Oil or Kerosene | 28 (77.8%) | 12 (36.4%) |
| Coal or Coke | 0 (0.0%) | 0 (0.0%) |
| All other Fuels | 4 (11.1%) | 0 (0.0%) |
| No Fuel Used | 0 (0.0%) | 0 (0.0%) |
| Total | 36 (100.0%) | 33 (100.0%) |
Household Vehicle Usage in Lenhartsville borough
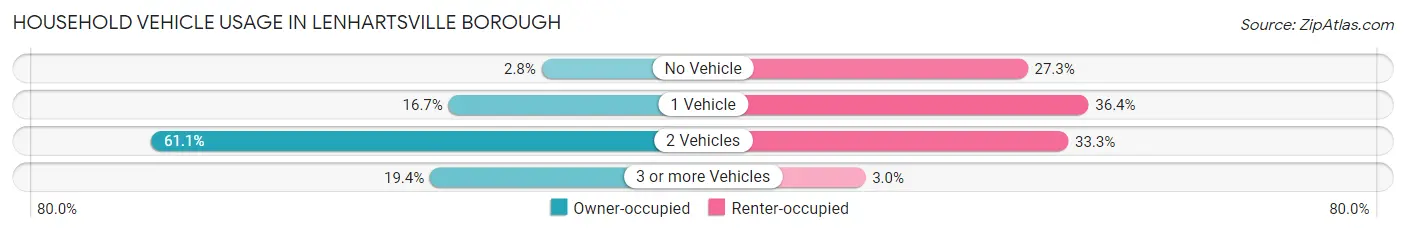
| Vehicles per Household | Owner-occupied | Renter-occupied |
| No Vehicle | 1 (2.8%) | 9 (27.3%) |
| 1 Vehicle | 6 (16.7%) | 12 (36.4%) |
| 2 Vehicles | 22 (61.1%) | 11 (33.3%) |
| 3 or more Vehicles | 7 (19.4%) | 1 (3.0%) |
| Total | 36 (100.0%) | 33 (100.0%) |
Real Estate & Mortgages in Lenhartsville borough
Real Estate and Mortgage Overview in Lenhartsville borough
| Characteristic | Without Mortgage | With Mortgage |
| Housing Units | 15 | 21 |
| Median Property Value | $177,500 | $225,000 |
| Median Household Income | $71,875 | $6 |
| Monthly Housing Costs | $742 | $0 |
| Real Estate Taxes | $3,200 | $0 |
Property Value by Mortgage Status in Lenhartsville borough
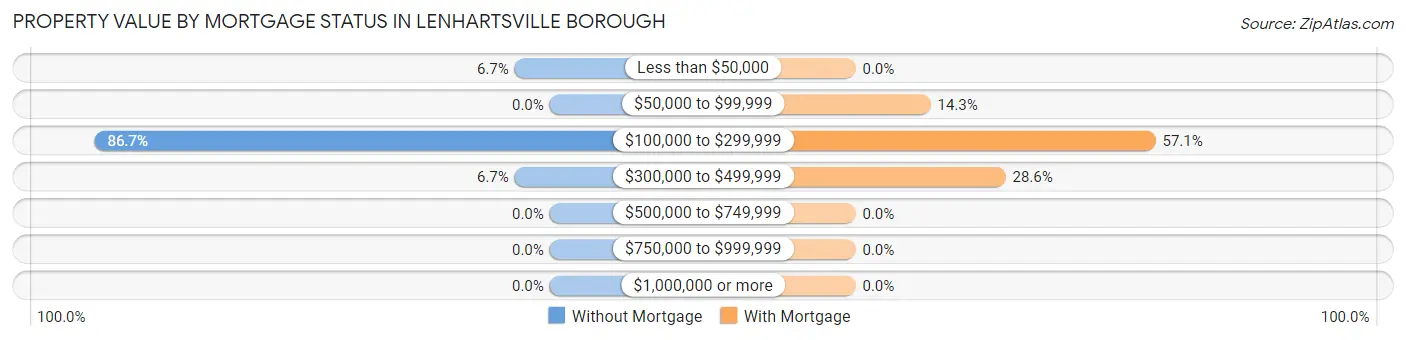
| Property Value | Without Mortgage | With Mortgage |
| Less than $50,000 | 1 (6.7%) | 0 (0.0%) |
| $50,000 to $99,999 | 0 (0.0%) | 3 (14.3%) |
| $100,000 to $299,999 | 13 (86.7%) | 12 (57.1%) |
| $300,000 to $499,999 | 1 (6.7%) | 6 (28.6%) |
| $500,000 to $749,999 | 0 (0.0%) | 0 (0.0%) |
| $750,000 to $999,999 | 0 (0.0%) | 0 (0.0%) |
| $1,000,000 or more | 0 (0.0%) | 0 (0.0%) |
| Total | 15 (100.0%) | 21 (100.0%) |
Household Income by Mortgage Status in Lenhartsville borough
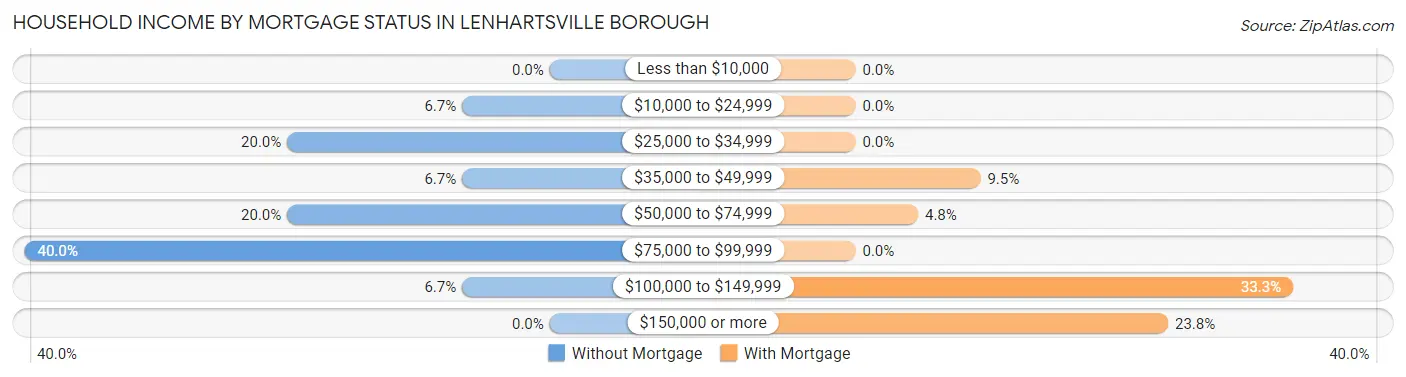
| Household Income | Without Mortgage | With Mortgage |
| Less than $10,000 | 0 (0.0%) | 0 (0.0%) |
| $10,000 to $24,999 | 1 (6.7%) | 0 (0.0%) |
| $25,000 to $34,999 | 3 (20.0%) | 0 (0.0%) |
| $35,000 to $49,999 | 1 (6.7%) | 2 (9.5%) |
| $50,000 to $74,999 | 3 (20.0%) | 1 (4.8%) |
| $75,000 to $99,999 | 6 (40.0%) | 0 (0.0%) |
| $100,000 to $149,999 | 1 (6.7%) | 7 (33.3%) |
| $150,000 or more | 0 (0.0%) | 5 (23.8%) |
| Total | 15 (100.0%) | 21 (100.0%) |
Property Value to Household Income Ratio in Lenhartsville borough
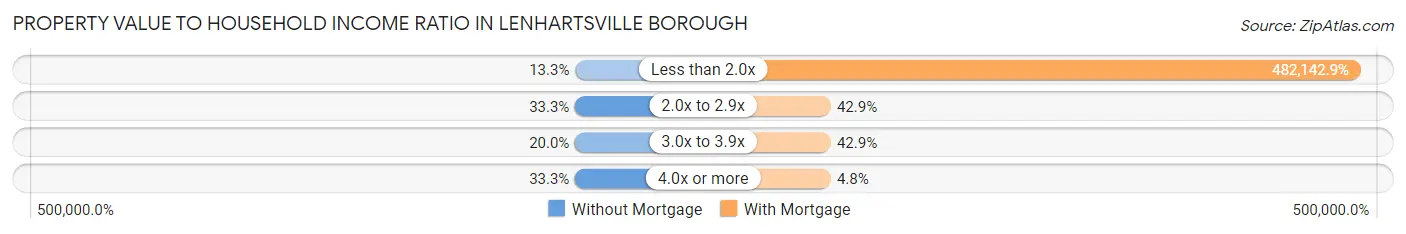
| Value-to-Income Ratio | Without Mortgage | With Mortgage |
| Less than 2.0x | 2 (13.3%) | 101,250 (482,142.9%) |
| 2.0x to 2.9x | 5 (33.3%) | 9 (42.9%) |
| 3.0x to 3.9x | 3 (20.0%) | 9 (42.9%) |
| 4.0x or more | 5 (33.3%) | 1 (4.8%) |
| Total | 15 (100.0%) | 21 (100.0%) |
Real Estate Taxes by Mortgage Status in Lenhartsville borough
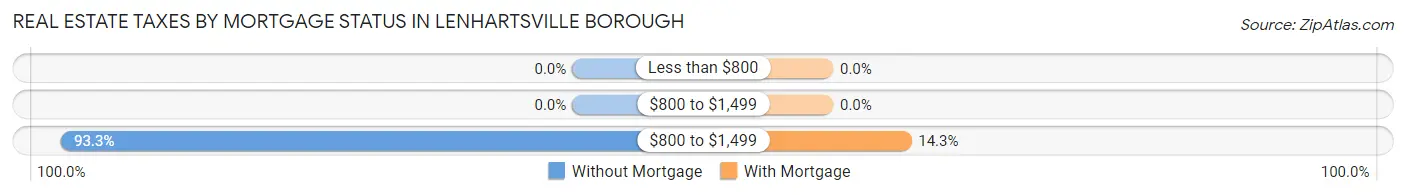
| Property Taxes | Without Mortgage | With Mortgage |
| Less than $800 | 0 (0.0%) | 0 (0.0%) |
| $800 to $1,499 | 0 (0.0%) | 0 (0.0%) |
| $800 to $1,499 | 14 (93.3%) | 3 (14.3%) |
| Total | 15 (100.0%) | 21 (100.0%) |
Health & Disability in Lenhartsville borough
Health Insurance Coverage by Age in Lenhartsville borough
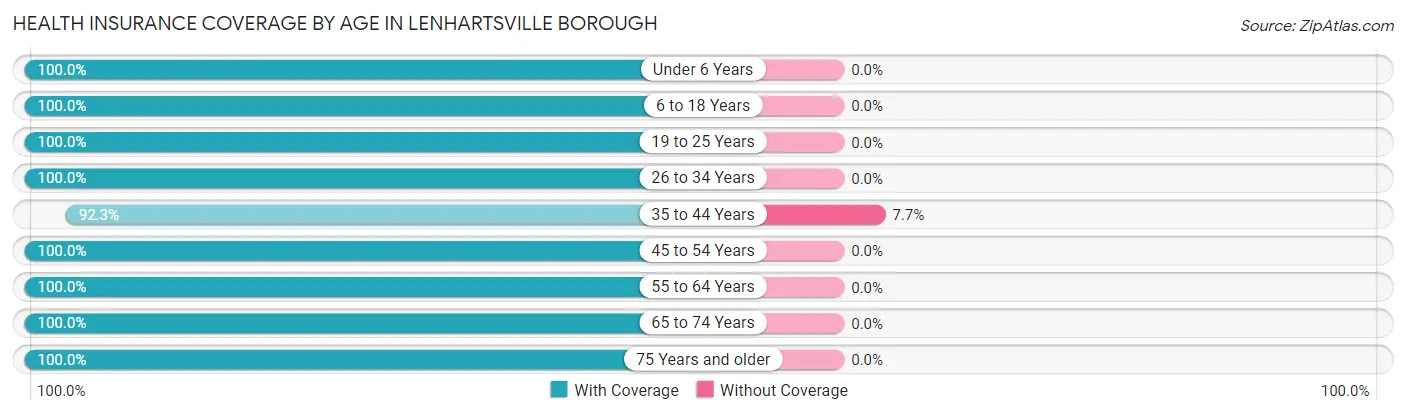
| Age Bracket | With Coverage | Without Coverage |
| Under 6 Years | 13 (100.0%) | 0 (0.0%) |
| 6 to 18 Years | 26 (100.0%) | 0 (0.0%) |
| 19 to 25 Years | 17 (100.0%) | 0 (0.0%) |
| 26 to 34 Years | 19 (100.0%) | 0 (0.0%) |
| 35 to 44 Years | 24 (92.3%) | 2 (7.7%) |
| 45 to 54 Years | 27 (100.0%) | 0 (0.0%) |
| 55 to 64 Years | 17 (100.0%) | 0 (0.0%) |
| 65 to 74 Years | 4 (100.0%) | 0 (0.0%) |
| 75 Years and older | 16 (100.0%) | 0 (0.0%) |
| Total | 163 (98.8%) | 2 (1.2%) |
Health Insurance Coverage by Citizenship Status in Lenhartsville borough
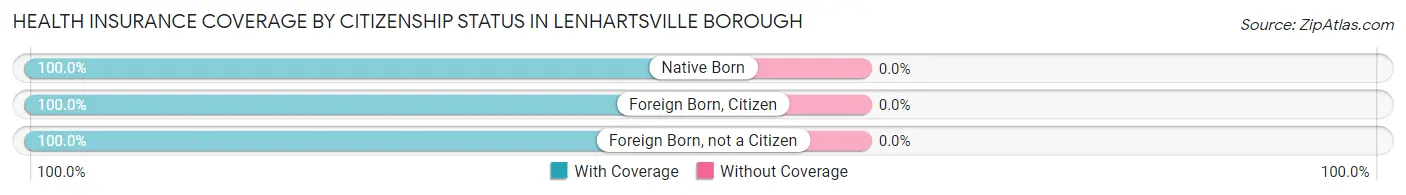
| Citizenship Status | With Coverage | Without Coverage |
| Native Born | 13 (100.0%) | 0 (0.0%) |
| Foreign Born, Citizen | 26 (100.0%) | 0 (0.0%) |
| Foreign Born, not a Citizen | 17 (100.0%) | 0 (0.0%) |
Health Insurance Coverage by Household Income in Lenhartsville borough
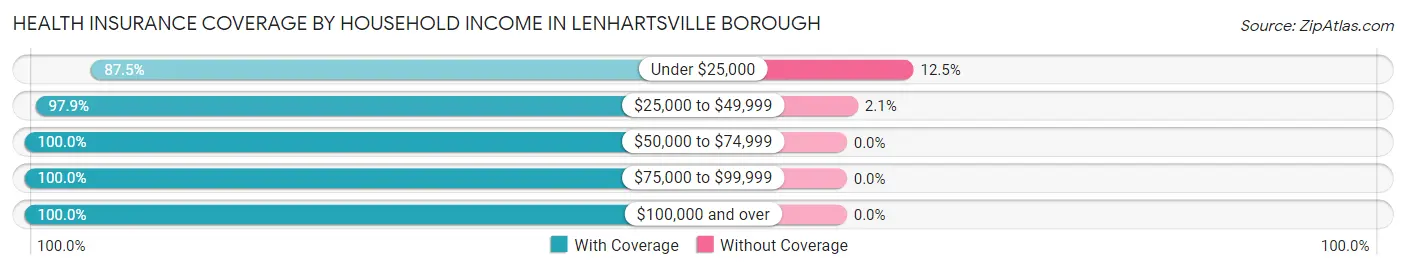
| Household Income | With Coverage | Without Coverage |
| Under $25,000 | 7 (87.5%) | 1 (12.5%) |
| $25,000 to $49,999 | 47 (97.9%) | 1 (2.1%) |
| $50,000 to $74,999 | 16 (100.0%) | 0 (0.0%) |
| $75,000 to $99,999 | 54 (100.0%) | 0 (0.0%) |
| $100,000 and over | 39 (100.0%) | 0 (0.0%) |
Public vs Private Health Insurance Coverage by Age in Lenhartsville borough
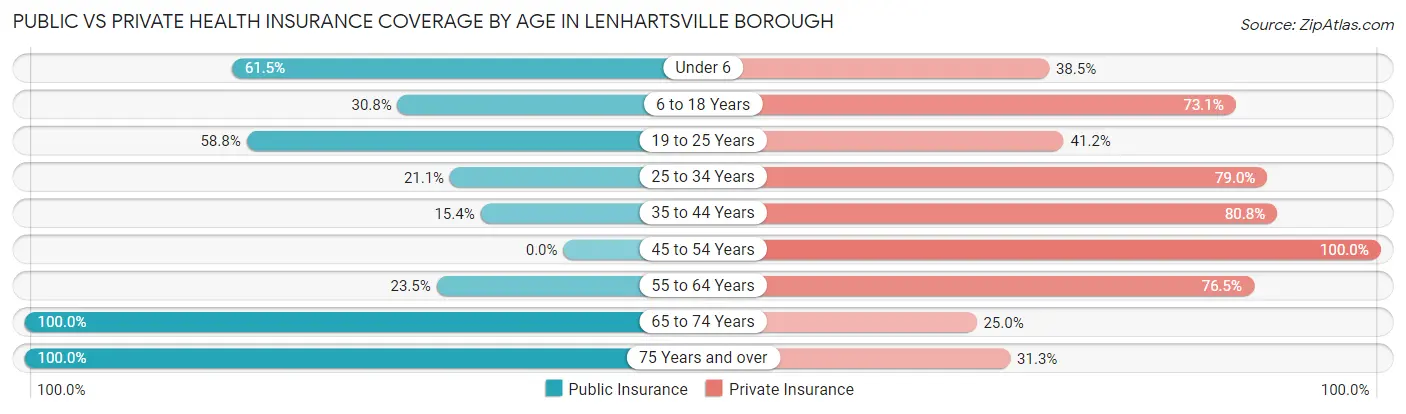
| Age Bracket | Public Insurance | Private Insurance |
| Under 6 | 8 (61.5%) | 5 (38.5%) |
| 6 to 18 Years | 8 (30.8%) | 19 (73.1%) |
| 19 to 25 Years | 10 (58.8%) | 7 (41.2%) |
| 25 to 34 Years | 4 (21.0%) | 15 (78.9%) |
| 35 to 44 Years | 4 (15.4%) | 21 (80.8%) |
| 45 to 54 Years | 0 (0.0%) | 27 (100.0%) |
| 55 to 64 Years | 4 (23.5%) | 13 (76.5%) |
| 65 to 74 Years | 4 (100.0%) | 1 (25.0%) |
| 75 Years and over | 16 (100.0%) | 5 (31.2%) |
| Total | 58 (35.1%) | 113 (68.5%) |
Disability Status by Sex by Age in Lenhartsville borough
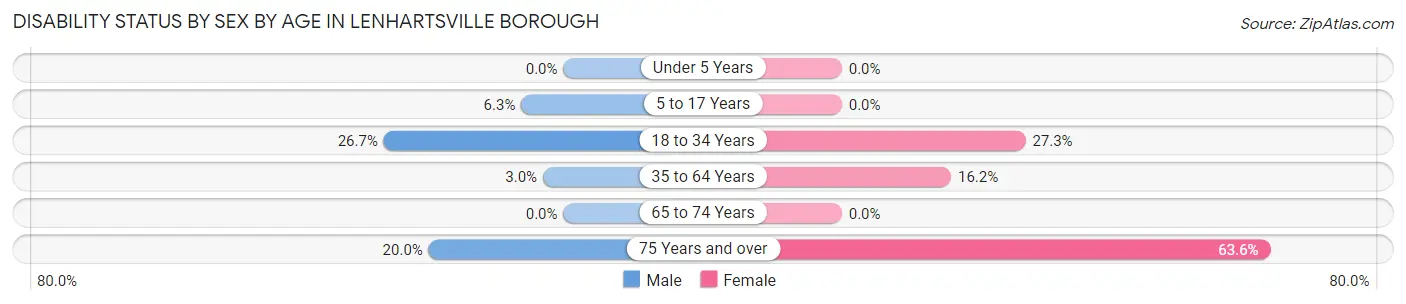
| Age Bracket | Male | Female |
| Under 5 Years | 0 (0.0%) | 0 (0.0%) |
| 5 to 17 Years | 1 (6.2%) | 0 (0.0%) |
| 18 to 34 Years | 4 (26.7%) | 6 (27.3%) |
| 35 to 64 Years | 1 (3.0%) | 6 (16.2%) |
| 65 to 74 Years | 0 (0.0%) | 0 (0.0%) |
| 75 Years and over | 1 (20.0%) | 7 (63.6%) |
Disability Class by Sex by Age in Lenhartsville borough
Disability Class: Hearing Difficulty
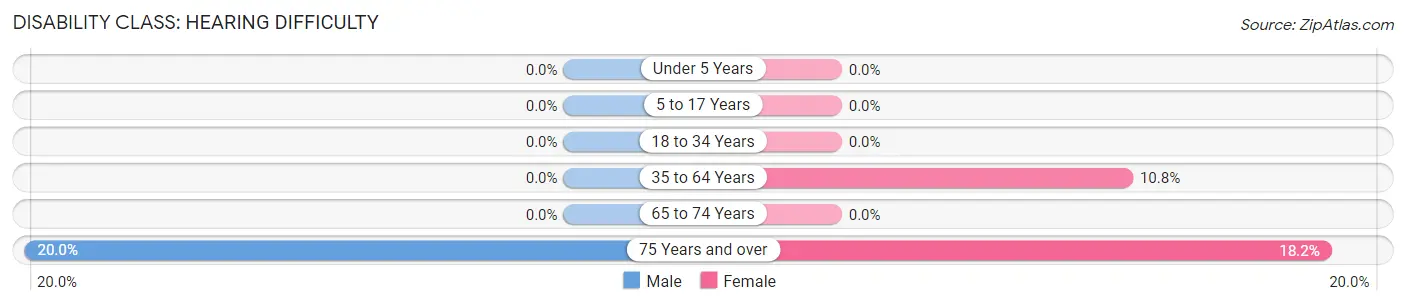
| Age Bracket | Male | Female |
| Under 5 Years | 0 (0.0%) | 0 (0.0%) |
| 5 to 17 Years | 0 (0.0%) | 0 (0.0%) |
| 18 to 34 Years | 0 (0.0%) | 0 (0.0%) |
| 35 to 64 Years | 0 (0.0%) | 4 (10.8%) |
| 65 to 74 Years | 0 (0.0%) | 0 (0.0%) |
| 75 Years and over | 1 (20.0%) | 2 (18.2%) |
Disability Class: Vision Difficulty
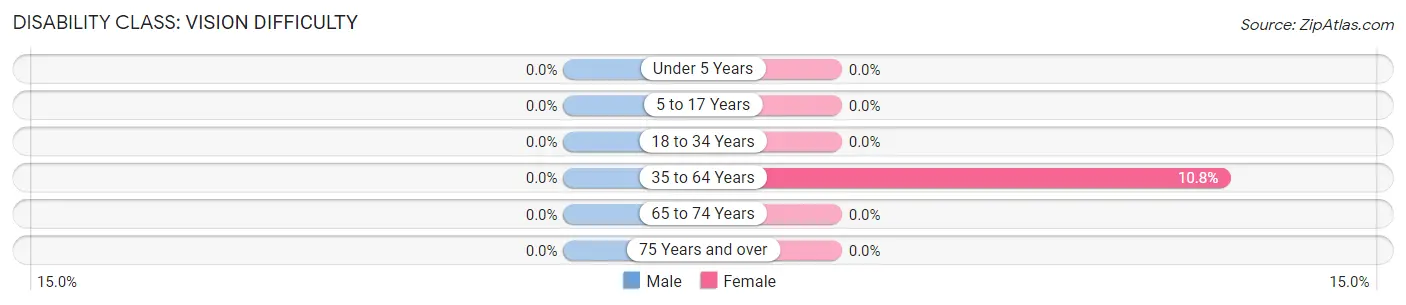
| Age Bracket | Male | Female |
| Under 5 Years | 0 (0.0%) | 0 (0.0%) |
| 5 to 17 Years | 0 (0.0%) | 0 (0.0%) |
| 18 to 34 Years | 0 (0.0%) | 0 (0.0%) |
| 35 to 64 Years | 0 (0.0%) | 4 (10.8%) |
| 65 to 74 Years | 0 (0.0%) | 0 (0.0%) |
| 75 Years and over | 0 (0.0%) | 0 (0.0%) |
Disability Class: Cognitive Difficulty
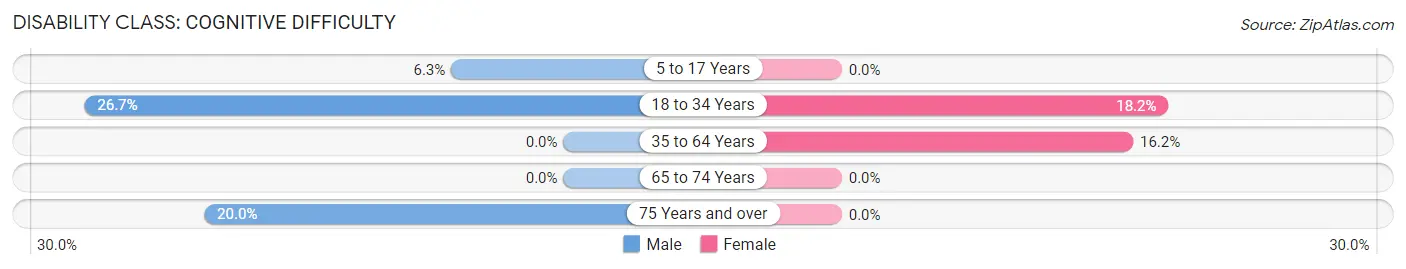
| Age Bracket | Male | Female |
| 5 to 17 Years | 1 (6.2%) | 0 (0.0%) |
| 18 to 34 Years | 4 (26.7%) | 4 (18.2%) |
| 35 to 64 Years | 0 (0.0%) | 6 (16.2%) |
| 65 to 74 Years | 0 (0.0%) | 0 (0.0%) |
| 75 Years and over | 1 (20.0%) | 0 (0.0%) |
Disability Class: Ambulatory Difficulty
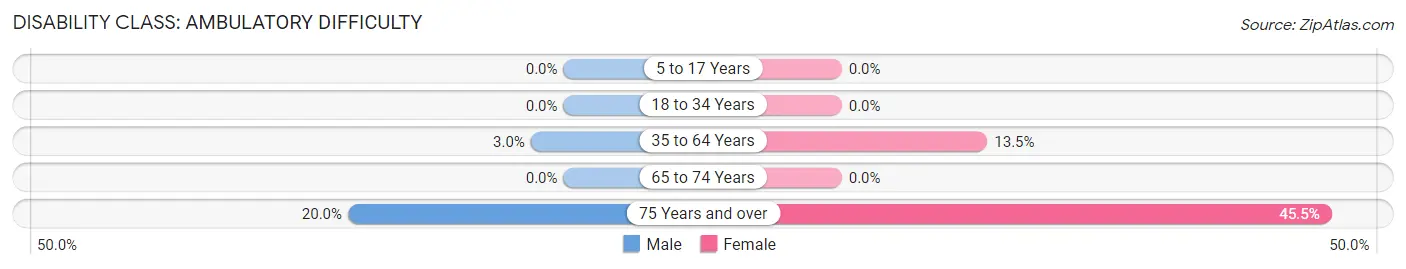
| Age Bracket | Male | Female |
| 5 to 17 Years | 0 (0.0%) | 0 (0.0%) |
| 18 to 34 Years | 0 (0.0%) | 0 (0.0%) |
| 35 to 64 Years | 1 (3.0%) | 5 (13.5%) |
| 65 to 74 Years | 0 (0.0%) | 0 (0.0%) |
| 75 Years and over | 1 (20.0%) | 5 (45.5%) |
Disability Class: Self-Care Difficulty
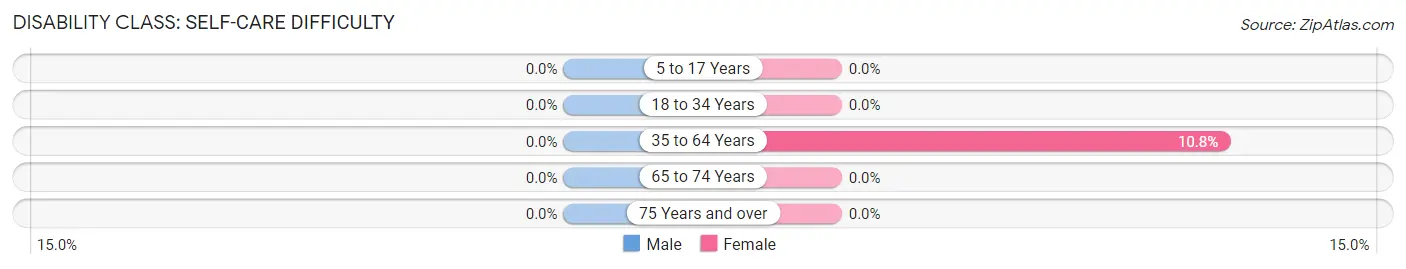
| Age Bracket | Male | Female |
| 5 to 17 Years | 0 (0.0%) | 0 (0.0%) |
| 18 to 34 Years | 0 (0.0%) | 0 (0.0%) |
| 35 to 64 Years | 0 (0.0%) | 4 (10.8%) |
| 65 to 74 Years | 0 (0.0%) | 0 (0.0%) |
| 75 Years and over | 0 (0.0%) | 0 (0.0%) |
Technology Access in Lenhartsville borough
Computing Device Access in Lenhartsville borough
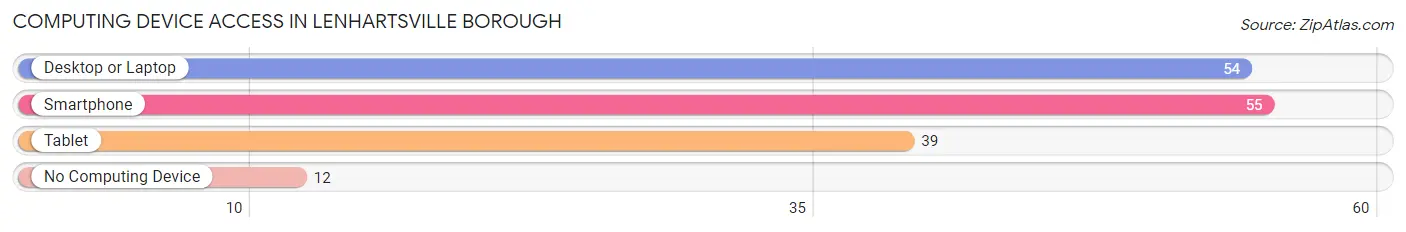
| Device Type | # Households | % Households |
| Desktop or Laptop | 54 | 78.3% |
| Smartphone | 55 | 79.7% |
| Tablet | 39 | 56.5% |
| No Computing Device | 12 | 17.4% |
| Total | 69 | 100.0% |
Internet Access in Lenhartsville borough
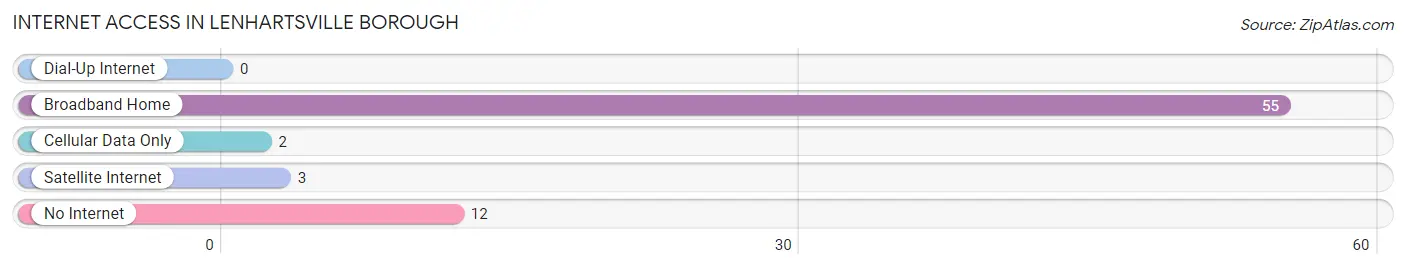
| Internet Type | # Households | % Households |
| Dial-Up Internet | 0 | 0.0% |
| Broadband Home | 55 | 79.7% |
| Cellular Data Only | 2 | 2.9% |
| Satellite Internet | 3 | 4.3% |
| No Internet | 12 | 17.4% |
| Total | 69 | 100.0% |
Lenhartsville borough Summary
Lenhartsville Borough is a small borough located in Berks County, Pennsylvania. It is situated in the southeastern corner of the county, just south of Kutztown and east of Hamburg. The borough is home to approximately 1,000 people and covers an area of 0.3 square miles.
History
Lenhartsville was first settled in the late 1700s by German immigrants. The town was originally known as “Lenhartsville” after the Lenhart family, who were among the first settlers. The Lenhart family owned a large tract of land in the area and the town was named after them. The town was officially incorporated in 1876.
In the late 1800s, Lenhartsville was a thriving agricultural community. The town was home to several farms, a grist mill, a saw mill, a blacksmith shop, and a general store. The town also had a post office, a school, and a church.
In the early 1900s, Lenhartsville began to experience a decline in population as many of the town’s residents moved away in search of better economic opportunities. The town’s population continued to decline until the 1950s when it began to slowly increase again.
Geography
Lenhartsville is located in southeastern Berks County, Pennsylvania. It is situated in the northern part of the county, just south of Kutztown and east of Hamburg. The borough is bordered by Greenwich Township to the north, Richmond Township to the east, and Maxatawny Township to the south and west.
The borough is located in the Appalachian Mountains and is surrounded by rolling hills and valleys. The terrain is mostly wooded and the area is known for its scenic beauty. The borough is home to several small streams, including the Little Lehigh Creek, which runs through the center of town.
Economy
Lenhartsville’s economy is largely based on agriculture and tourism. The town is home to several small farms, which produce a variety of crops, including corn, soybeans, and hay. The town is also home to several small businesses, including a general store, a restaurant, and a bed and breakfast.
The town is also a popular tourist destination. The area is known for its scenic beauty and is home to several popular attractions, including the Lenhartsville Covered Bridge, the Lenhartsville Historical Society Museum, and the Lenhartsville Community Park.
Demographics
As of the 2010 census, Lenhartsville had a population of 1,039. The racial makeup of the borough was 97.3% White, 0.7% African American, 0.2% Native American, 0.2% Asian, 0.2% from other races, and 1.6% from two or more races. Hispanic or Latino of any race were 1.2% of the population.
The median household income in Lenhartsville was $50,938, and the median family income was $58,750. The per capita income for the borough was $22,945. About 5.2% of families and 6.7% of the population were below the poverty line, including 8.3% of those under age 18 and 4.2% of those age 65 or over.
Lenhartsville is a small borough with a rich history and a strong sense of community. The town is home to several small businesses and farms, and is a popular tourist destination. The borough is also home to a diverse population, with a variety of racial and ethnic backgrounds. Lenhartsville is a great place to live, work, and visit.
Common Questions
What is Per Capita Income in Lenhartsville borough?
Per Capita income in Lenhartsville borough is $31,459.
What is the Median Family Income in Lenhartsville borough?
Median Family Income in Lenhartsville borough is $82,000.
What is the Median Household income in Lenhartsville borough?
Median Household Income in Lenhartsville borough is $64,063.
What is Income or Wage Gap in Lenhartsville borough?
Income or Wage Gap in Lenhartsville borough is 7.2%.
Women in Lenhartsville borough earn 92.8 cents for every dollar earned by a man.
What is Inequality or Gini Index in Lenhartsville borough?
Inequality or Gini Index in Lenhartsville borough is 0.41.
What is the Total Population of Lenhartsville borough?
Total Population of Lenhartsville borough is 166.
What is the Total Male Population of Lenhartsville borough?
Total Male Population of Lenhartsville borough is 73.
What is the Total Female Population of Lenhartsville borough?
Total Female Population of Lenhartsville borough is 93.
What is the Ratio of Males per 100 Females in Lenhartsville borough?
There are 78.49 Males per 100 Females in Lenhartsville borough.
What is the Ratio of Females per 100 Males in Lenhartsville borough?
There are 127.40 Females per 100 Males in Lenhartsville borough.
What is the Median Population Age in Lenhartsville borough?
Median Population Age in Lenhartsville borough is 38.0 Years.
What is the Average Family Size in Lenhartsville borough
Average Family Size in Lenhartsville borough is 3.1 People.
What is the Average Household Size in Lenhartsville borough
Average Household Size in Lenhartsville borough is 2.4 People.
How Large is the Labor Force in Lenhartsville borough?
There are 85 People in the Labor Forcein in Lenhartsville borough.
What is the Percentage of People in the Labor Force in Lenhartsville borough?
63.0% of People are in the Labor Force in Lenhartsville borough.
What is the Unemployment Rate in Lenhartsville borough?
Unemployment Rate in Lenhartsville borough is 2.4%.