Tremont borough, PA Map & Demographics
Tremont borough Overview
$29,644
PER CAPITA INCOME
$72,344
AVG FAMILY INCOME
$59,181
AVG HOUSEHOLD INCOME
25.5%
WAGE / INCOME GAP [ % ]
74.5¢/ $1
WAGE / INCOME GAP [ $ ]
0.34
INEQUALITY / GINI INDEX
1,679
TOTAL POPULATION
928
MALE POPULATION
751
FEMALE POPULATION
123.57
MALES / 100 FEMALES
80.93
FEMALES / 100 MALES
43.5
MEDIAN AGE
2.9
AVG FAMILY SIZE
2.5
AVG HOUSEHOLD SIZE
778
LABOR FORCE [ PEOPLE ]
56.6%
PERCENT IN LABOR FORCE
3.1%
UNEMPLOYMENT RATE
Income in Tremont borough
Income Overview in Tremont borough
Per Capita Income in Tremont borough is $29,644, while median incomes of families and households are $72,344 and $59,181 respectively.
| Characteristic | Number | Measure |
| Per Capita Income | 1,679 | $29,644 |
| Median Family Income | 389 | $72,344 |
| Mean Family Income | 389 | $78,215 |
| Median Household Income | 601 | $59,181 |
| Mean Household Income | 601 | $70,945 |
| Income Deficit | 389 | $0 |
| Wage / Income Gap (%) | 1,679 | 25.55% |
| Wage / Income Gap ($) | 1,679 | 74.45¢ per $1 |
| Gini / Inequality Index | 1,679 | 0.34 |
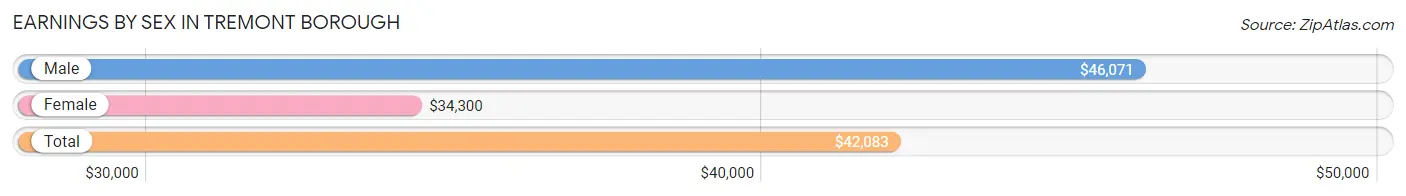
Earnings by Sex in Tremont borough
Average Earnings in Tremont borough are $42,083, $46,071 for men and $34,300 for women, a difference of 25.6%.
| Sex | Number | Average Earnings |
| Male | 500 (64.3%) | $46,071 |
| Female | 278 (35.7%) | $34,300 |
| Total | 778 (100.0%) | $42,083 |
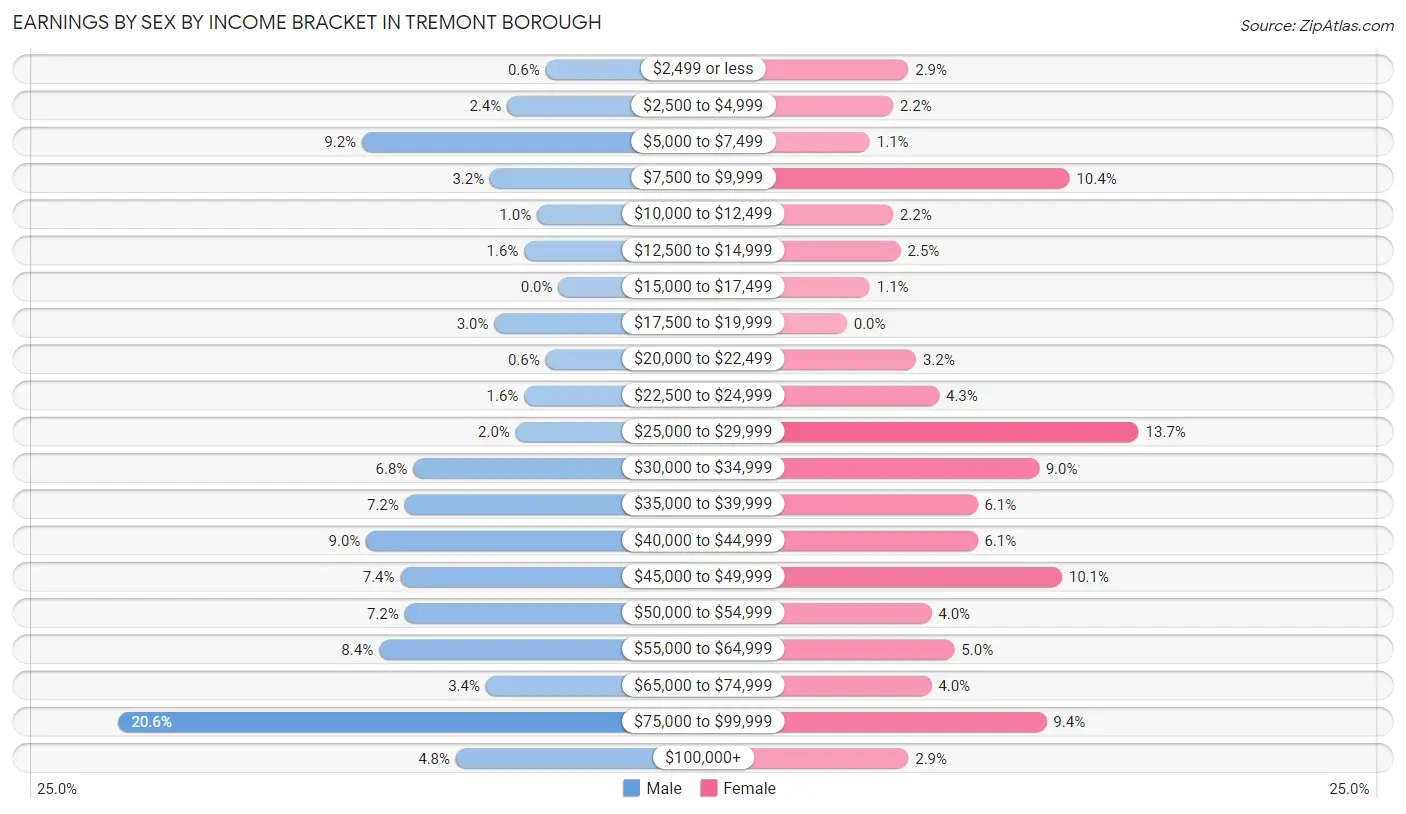
Earnings by Sex by Income Bracket in Tremont borough
The most common earnings brackets in Tremont borough are $75,000 to $99,999 for men (103 | 20.6%) and $25,000 to $29,999 for women (38 | 13.7%).
| Income | Male | Female |
| $2,499 or less | 3 (0.6%) | 8 (2.9%) |
| $2,500 to $4,999 | 12 (2.4%) | 6 (2.2%) |
| $5,000 to $7,499 | 46 (9.2%) | 3 (1.1%) |
| $7,500 to $9,999 | 16 (3.2%) | 29 (10.4%) |
| $10,000 to $12,499 | 5 (1.0%) | 6 (2.2%) |
| $12,500 to $14,999 | 8 (1.6%) | 7 (2.5%) |
| $15,000 to $17,499 | 0 (0.0%) | 3 (1.1%) |
| $17,500 to $19,999 | 15 (3.0%) | 0 (0.0%) |
| $20,000 to $22,499 | 3 (0.6%) | 9 (3.2%) |
| $22,500 to $24,999 | 8 (1.6%) | 12 (4.3%) |
| $25,000 to $29,999 | 10 (2.0%) | 38 (13.7%) |
| $30,000 to $34,999 | 34 (6.8%) | 25 (9.0%) |
| $35,000 to $39,999 | 36 (7.2%) | 17 (6.1%) |
| $40,000 to $44,999 | 45 (9.0%) | 17 (6.1%) |
| $45,000 to $49,999 | 37 (7.4%) | 28 (10.1%) |
| $50,000 to $54,999 | 36 (7.2%) | 11 (4.0%) |
| $55,000 to $64,999 | 42 (8.4%) | 14 (5.0%) |
| $65,000 to $74,999 | 17 (3.4%) | 11 (4.0%) |
| $75,000 to $99,999 | 103 (20.6%) | 26 (9.3%) |
| $100,000+ | 24 (4.8%) | 8 (2.9%) |
| Total | 500 (100.0%) | 278 (100.0%) |
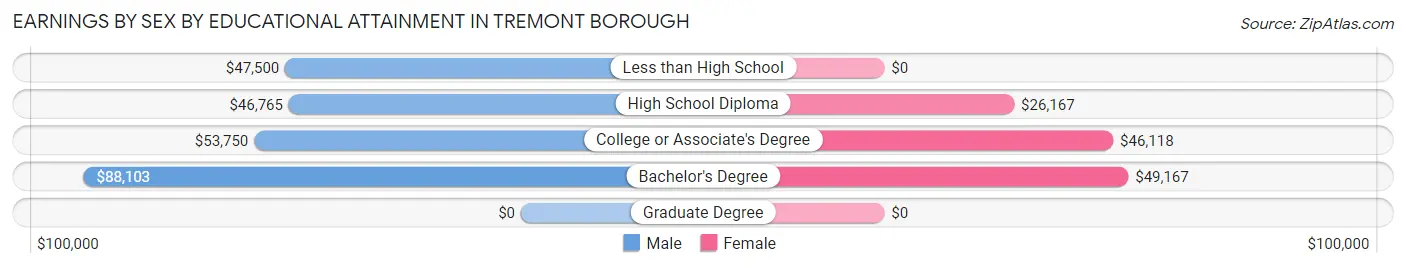
Earnings by Sex by Educational Attainment in Tremont borough
Average earnings in Tremont borough are $50,350 for men and $34,450 for women, a difference of 31.6%. Men with an educational attainment of bachelor's degree enjoy the highest average annual earnings of $88,103, while those with high school diploma education earn the least with $46,765. Women with an educational attainment of bachelor's degree earn the most with the average annual earnings of $49,167, while those with high school diploma education have the smallest earnings of $26,167.
| Educational Attainment | Male Income | Female Income |
| Less than High School | $47,500 | $0 |
| High School Diploma | $46,765 | $26,167 |
| College or Associate's Degree | $53,750 | $46,118 |
| Bachelor's Degree | $88,103 | $49,167 |
| Graduate Degree | - | - |
| Total | $50,350 | $34,450 |
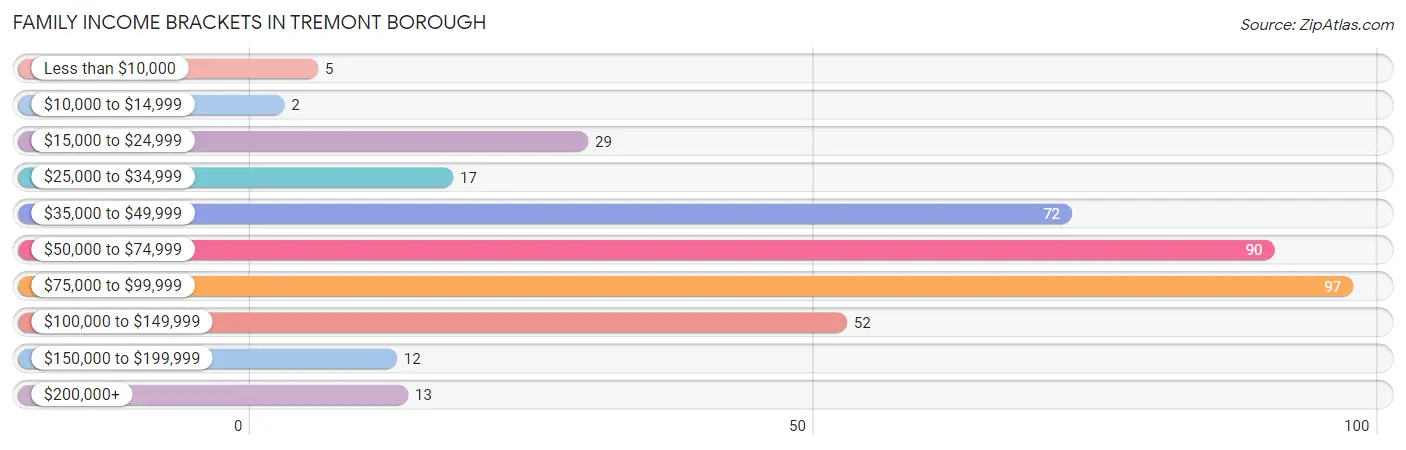
Family Income in Tremont borough
Family Income Brackets in Tremont borough
According to the Tremont borough family income data, there are 97 families falling into the $75,000 to $99,999 income range, which is the most common income bracket and makes up 24.9% of all families. Conversely, the $10,000 to $14,999 income bracket is the least frequent group with only 2 families (0.5%) belonging to this category.
| Income Bracket | # Families | % Families |
| Less than $10,000 | 5 | 1.3% |
| $10,000 to $14,999 | 2 | 0.5% |
| $15,000 to $24,999 | 29 | 7.5% |
| $25,000 to $34,999 | 17 | 4.4% |
| $35,000 to $49,999 | 72 | 18.5% |
| $50,000 to $74,999 | 90 | 23.1% |
| $75,000 to $99,999 | 97 | 24.9% |
| $100,000 to $149,999 | 52 | 13.4% |
| $150,000 to $199,999 | 12 | 3.1% |
| $200,000+ | 13 | 3.3% |
Family Income by Famaliy Size in Tremont borough
5-person families (20 | 5.1%) account for the highest median family income in Tremont borough with $113,750 per family, while 2-person families (218 | 56.0%) have the highest median income of $28,750 per family member.
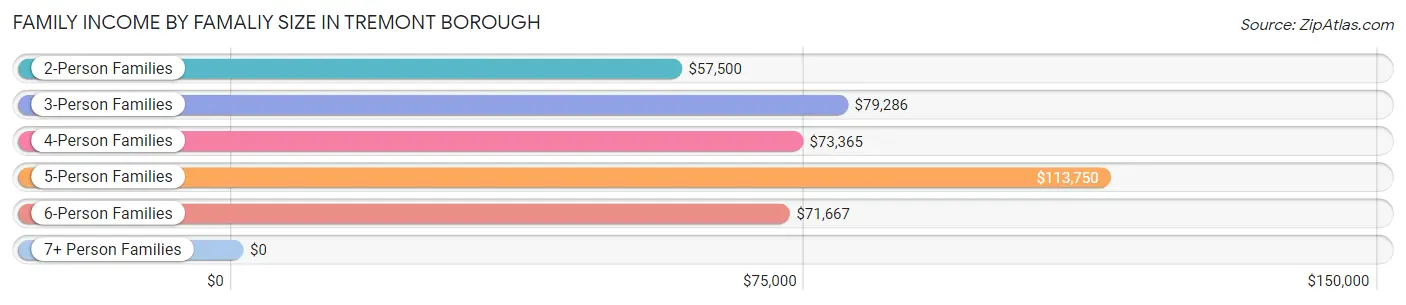
| Income Bracket | # Families | Median Income |
| 2-Person Families | 218 (56.0%) | $57,500 |
| 3-Person Families | 78 (20.1%) | $79,286 |
| 4-Person Families | 57 (14.6%) | $73,365 |
| 5-Person Families | 20 (5.1%) | $113,750 |
| 6-Person Families | 8 (2.1%) | $71,667 |
| 7+ Person Families | 8 (2.1%) | $0 |
| Total | 389 (100.0%) | $72,344 |
Family Income by Number of Earners in Tremont borough
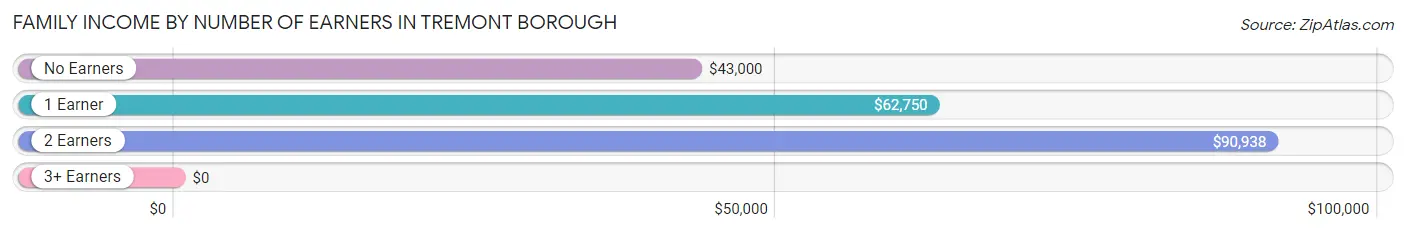
| Number of Earners | # Families | Median Income |
| No Earners | 58 (14.9%) | $43,000 |
| 1 Earner | 144 (37.0%) | $62,750 |
| 2 Earners | 181 (46.5%) | $90,938 |
| 3+ Earners | 6 (1.5%) | $0 |
| Total | 389 (100.0%) | $72,344 |
Household Income in Tremont borough
Household Income Brackets in Tremont borough
With 144 households falling in the category, the $50,000 to $74,999 income range is the most frequent in Tremont borough, accounting for 24.0% of all households. In contrast, only 5 households (0.8%) fall into the less than $10,000 income bracket, making it the least populous group.
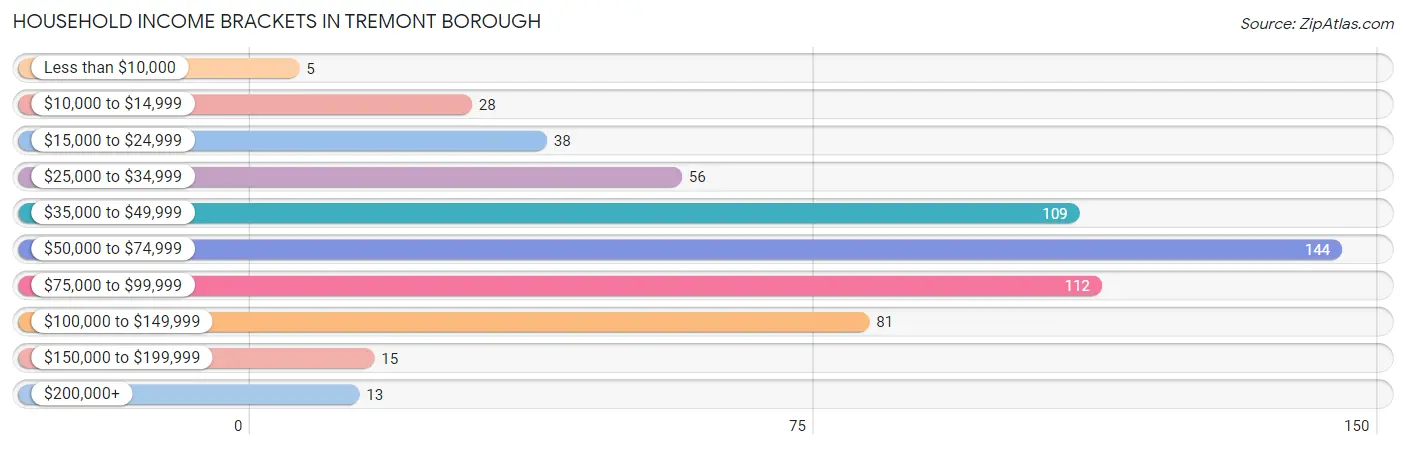
| Income Bracket | # Households | % Households |
| Less than $10,000 | 5 | 0.8% |
| $10,000 to $14,999 | 28 | 4.7% |
| $15,000 to $24,999 | 38 | 6.3% |
| $25,000 to $34,999 | 56 | 9.3% |
| $35,000 to $49,999 | 109 | 18.1% |
| $50,000 to $74,999 | 144 | 24.0% |
| $75,000 to $99,999 | 112 | 18.6% |
| $100,000 to $149,999 | 81 | 13.5% |
| $150,000 to $199,999 | 15 | 2.5% |
| $200,000+ | 13 | 2.2% |
Household Income by Householder Age in Tremont borough
The median household income in Tremont borough is $59,181, with the highest median household income of $84,167 found in the 45 to 64 years age bracket for the primary householder. A total of 222 households (36.9%) fall into this category. Meanwhile, the 15 to 24 years age bracket for the primary householder has the lowest median household income of $0, with 17 households (2.8%) in this group.
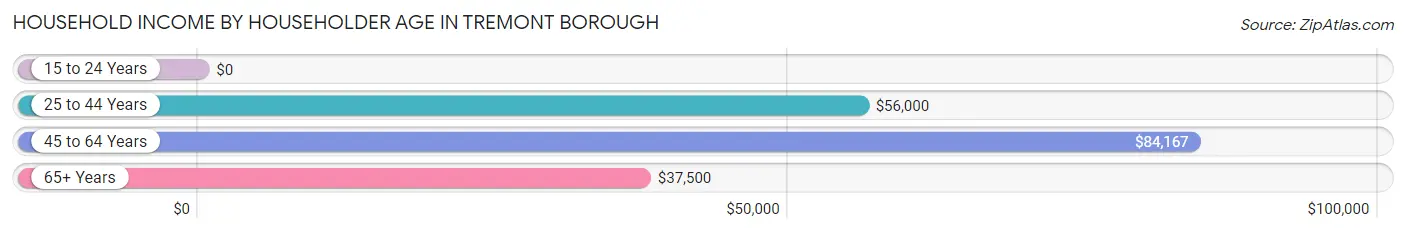
| Income Bracket | # Households | Median Income |
| 15 to 24 Years | 17 (2.8%) | $0 |
| 25 to 44 Years | 238 (39.6%) | $56,000 |
| 45 to 64 Years | 222 (36.9%) | $84,167 |
| 65+ Years | 124 (20.6%) | $37,500 |
| Total | 601 (100.0%) | $59,181 |
Poverty in Tremont borough
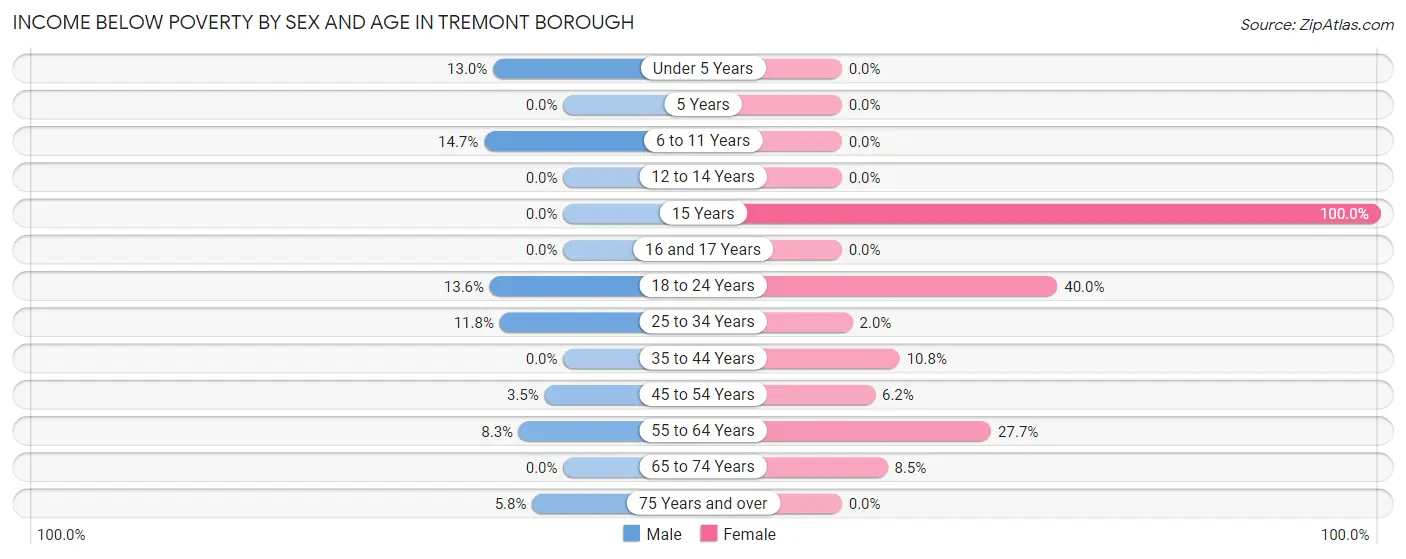
Income Below Poverty by Sex and Age in Tremont borough
With 6.6% poverty level for males and 8.7% for females among the residents of Tremont borough, 6 to 11 year old males and 15 year old females are the most vulnerable to poverty, with 10 males (14.7%) and 4 females (100.0%) in their respective age groups living below the poverty level.
| Age Bracket | Male | Female |
| Under 5 Years | 3 (13.0%) | 0 (0.0%) |
| 5 Years | 0 (0.0%) | 0 (0.0%) |
| 6 to 11 Years | 10 (14.7%) | 0 (0.0%) |
| 12 to 14 Years | 0 (0.0%) | 0 (0.0%) |
| 15 Years | 0 (0.0%) | 4 (100.0%) |
| 16 and 17 Years | 0 (0.0%) | 0 (0.0%) |
| 18 to 24 Years | 9 (13.6%) | 4 (40.0%) |
| 25 to 34 Years | 17 (11.8%) | 2 (2.0%) |
| 35 to 44 Years | 0 (0.0%) | 10 (10.7%) |
| 45 to 54 Years | 4 (3.5%) | 5 (6.2%) |
| 55 to 64 Years | 8 (8.3%) | 28 (27.7%) |
| 65 to 74 Years | 0 (0.0%) | 5 (8.5%) |
| 75 Years and over | 3 (5.8%) | 0 (0.0%) |
| Total | 54 (6.6%) | 58 (8.7%) |
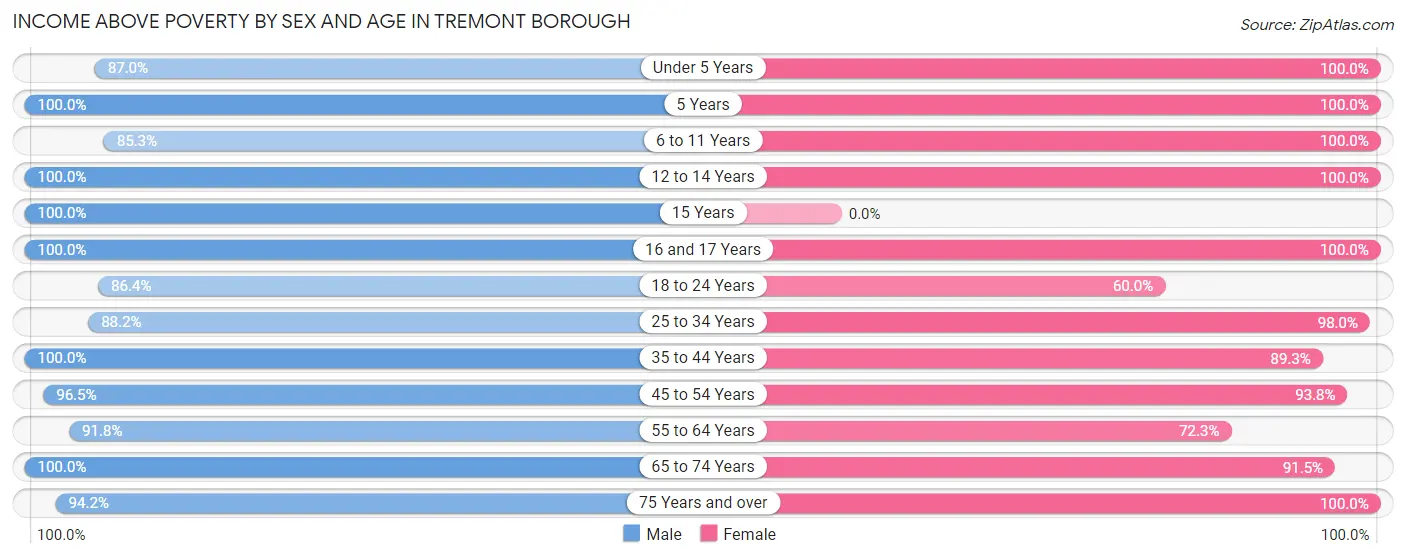
Income Above Poverty by Sex and Age in Tremont borough
According to the poverty statistics in Tremont borough, males aged 5 years and females aged under 5 years are the age groups that are most secure financially, with 100.0% of males and 100.0% of females in these age groups living above the poverty line.
| Age Bracket | Male | Female |
| Under 5 Years | 20 (87.0%) | 49 (100.0%) |
| 5 Years | 3 (100.0%) | 21 (100.0%) |
| 6 to 11 Years | 58 (85.3%) | 51 (100.0%) |
| 12 to 14 Years | 48 (100.0%) | 20 (100.0%) |
| 15 Years | 14 (100.0%) | 0 (0.0%) |
| 16 and 17 Years | 26 (100.0%) | 19 (100.0%) |
| 18 to 24 Years | 57 (86.4%) | 6 (60.0%) |
| 25 to 34 Years | 127 (88.2%) | 98 (98.0%) |
| 35 to 44 Years | 105 (100.0%) | 83 (89.2%) |
| 45 to 54 Years | 111 (96.5%) | 76 (93.8%) |
| 55 to 64 Years | 89 (91.7%) | 73 (72.3%) |
| 65 to 74 Years | 59 (100.0%) | 54 (91.5%) |
| 75 Years and over | 49 (94.2%) | 62 (100.0%) |
| Total | 766 (93.4%) | 612 (91.3%) |
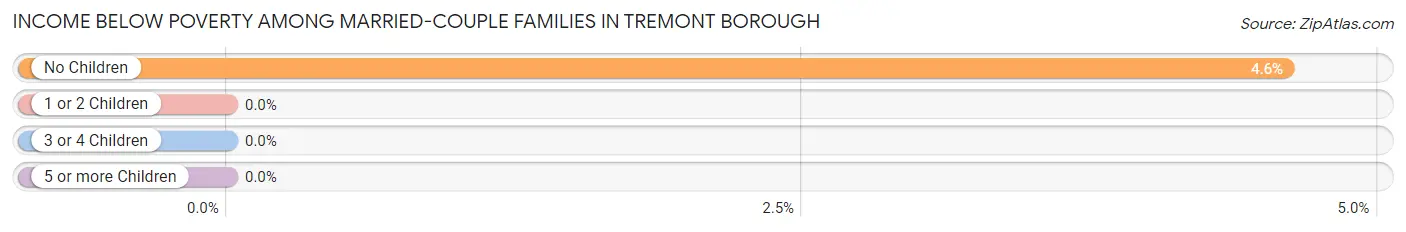
Income Below Poverty Among Married-Couple Families in Tremont borough
The poverty statistics for married-couple families in Tremont borough show that 2.8% or 8 of the total 283 families live below the poverty line. Families with no children have the highest poverty rate of 4.6%, comprising of 8 families. On the other hand, families with 1 or 2 children have the lowest poverty rate of 0.0%, which includes 0 families.
| Children | Above Poverty | Below Poverty |
| No Children | 166 (95.4%) | 8 (4.6%) |
| 1 or 2 Children | 91 (100.0%) | 0 (0.0%) |
| 3 or 4 Children | 15 (100.0%) | 0 (0.0%) |
| 5 or more Children | 3 (100.0%) | 0 (0.0%) |
| Total | 275 (97.2%) | 8 (2.8%) |
Income Below Poverty Among Single-Parent Households in Tremont borough
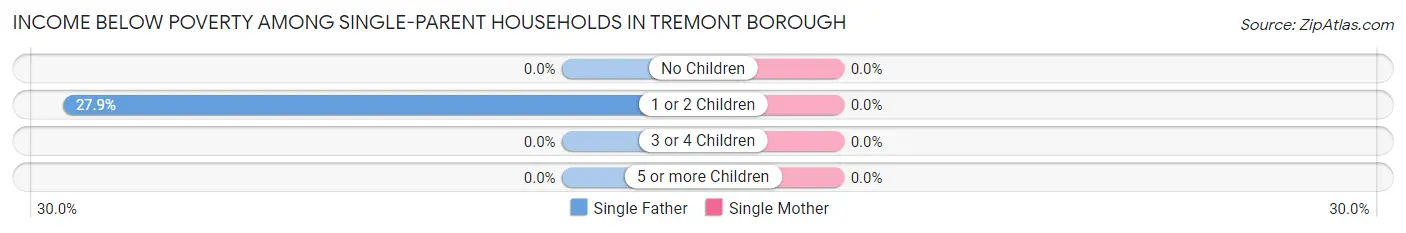
| Children | Single Father | Single Mother |
| No Children | 0 (0.0%) | 0 (0.0%) |
| 1 or 2 Children | 17 (27.9%) | 0 (0.0%) |
| 3 or 4 Children | 0 (0.0%) | 0 (0.0%) |
| 5 or more Children | 0 (0.0%) | 0 (0.0%) |
| Total | 17 (24.3%) | 0 (0.0%) |
Income Below Poverty Among Married-Couple vs Single-Parent Households in Tremont borough
The poverty data for Tremont borough shows that 8 of the married-couple family households (2.8%) and 17 of the single-parent households (16.0%) are living below the poverty level. Within the married-couple family households, those with no children have the highest poverty rate, with 8 households (4.6%) falling below the poverty line. Among the single-parent households, those with 1 or 2 children have the highest poverty rate, with 17 household (19.3%) living below poverty.
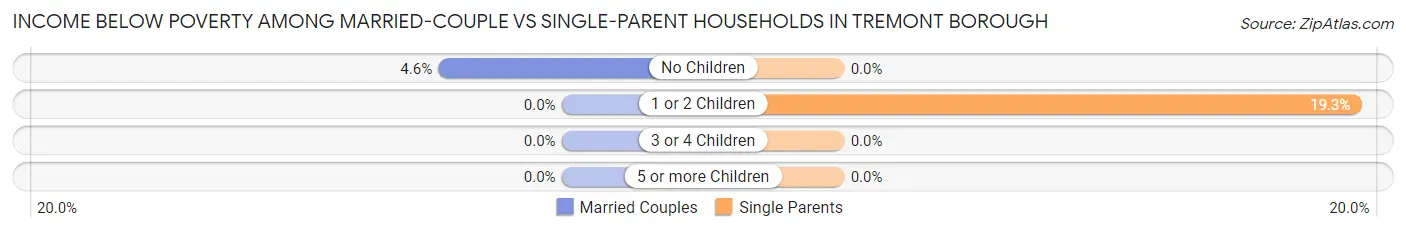
| Children | Married-Couple Families | Single-Parent Households |
| No Children | 8 (4.6%) | 0 (0.0%) |
| 1 or 2 Children | 0 (0.0%) | 17 (19.3%) |
| 3 or 4 Children | 0 (0.0%) | 0 (0.0%) |
| 5 or more Children | 0 (0.0%) | 0 (0.0%) |
| Total | 8 (2.8%) | 17 (16.0%) |
Race in Tremont borough
The most populous races in Tremont borough are White / Caucasian (1,652 | 98.4%), Hispanic or Latino (20 | 1.2%), and Two or more Races (17 | 1.0%).
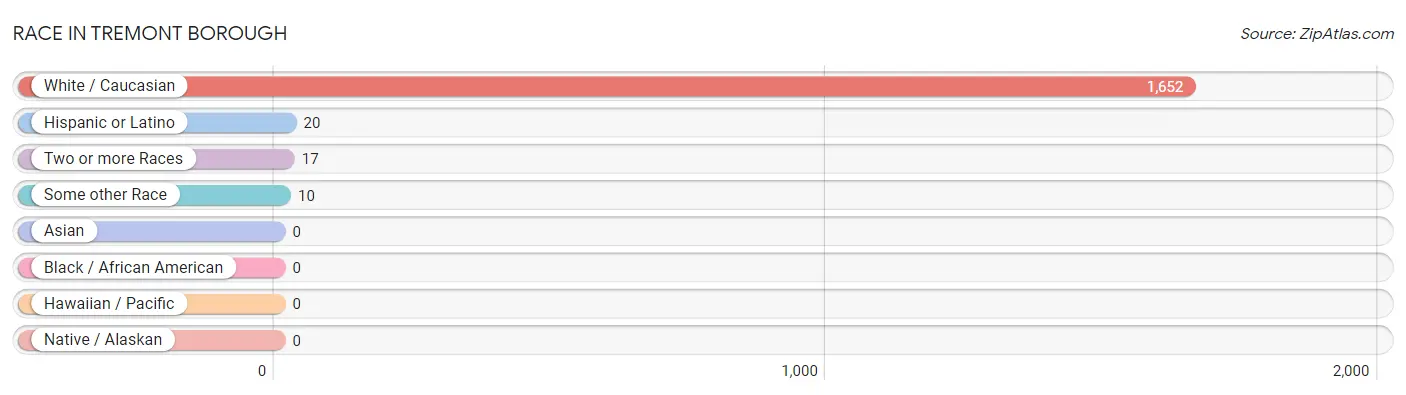
| Race | # Population | % Population |
| Asian | 0 | 0.0% |
| Black / African American | 0 | 0.0% |
| Hawaiian / Pacific | 0 | 0.0% |
| Hispanic or Latino | 20 | 1.2% |
| Native / Alaskan | 0 | 0.0% |
| White / Caucasian | 1,652 | 98.4% |
| Two or more Races | 17 | 1.0% |
| Some other Race | 10 | 0.6% |
| Total | 1,679 | 100.0% |
Ancestry in Tremont borough
The most populous ancestries reported in Tremont borough are German (553 | 32.9%), Irish (244 | 14.5%), Italian (108 | 6.4%), English (80 | 4.8%), and Pennsylvania German (71 | 4.2%), together accounting for 62.9% of all Tremont borough residents.
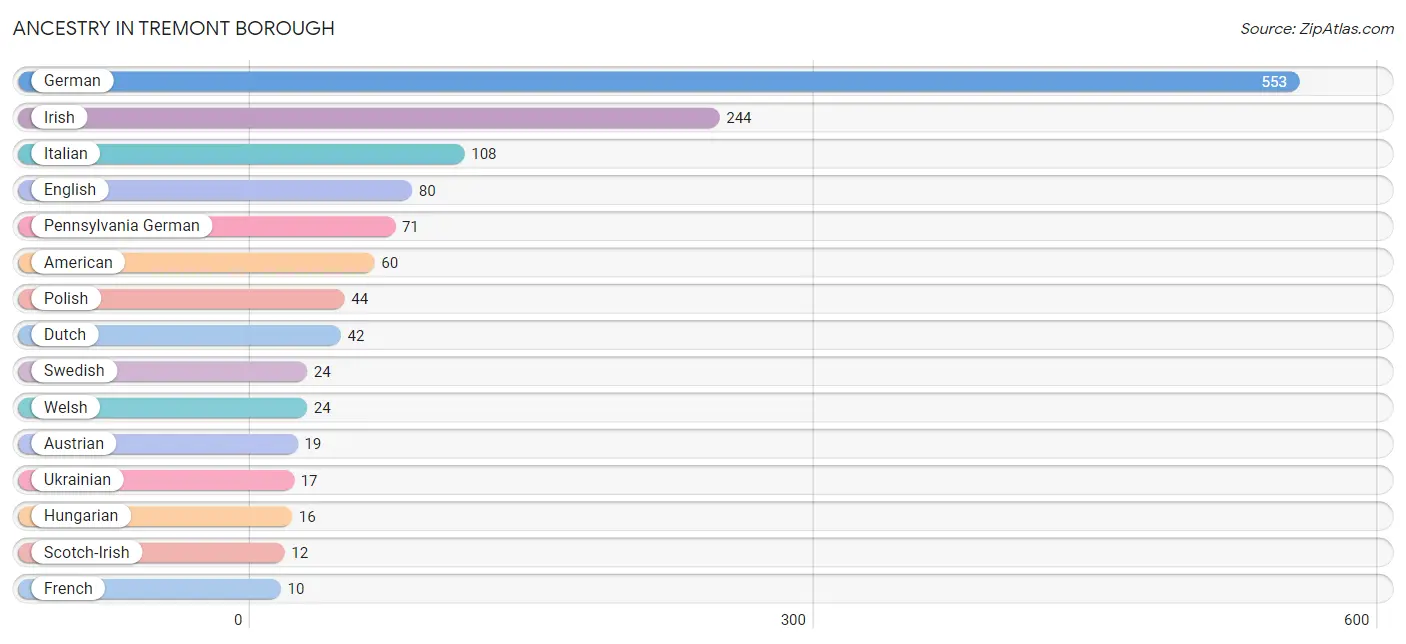
| Ancestry | # Population | % Population |
| American | 60 | 3.6% |
| Austrian | 19 | 1.1% |
| Bhutanese | 2 | 0.1% |
| Czechoslovakian | 3 | 0.2% |
| Dutch | 42 | 2.5% |
| Ecuadorian | 4 | 0.2% |
| English | 80 | 4.8% |
| French | 10 | 0.6% |
| German | 553 | 32.9% |
| Greek | 3 | 0.2% |
| Hungarian | 16 | 0.9% |
| Indian (Asian) | 7 | 0.4% |
| Irish | 244 | 14.5% |
| Italian | 108 | 6.4% |
| Lithuanian | 6 | 0.4% |
| Mexican | 10 | 0.6% |
| Pennsylvania German | 71 | 4.2% |
| Polish | 44 | 2.6% |
| Portuguese | 4 | 0.2% |
| Puerto Rican | 6 | 0.4% |
| Russian | 3 | 0.2% |
| Scotch-Irish | 12 | 0.7% |
| Slovak | 2 | 0.1% |
| South American | 4 | 0.2% |
| Swedish | 24 | 1.4% |
| Swiss | 3 | 0.2% |
| Trinidadian and Tobagonian | 7 | 0.4% |
| Ukrainian | 17 | 1.0% |
| Welsh | 24 | 1.4% | View All 29 Rows |
Immigrants in Tremont borough
The most numerous immigrant groups reported in Tremont borough came from Central America (10 | 0.6%), Latin America (10 | 0.6%), Mexico (10 | 0.6%), Europe (7 | 0.4%), and Eastern Europe (4 | 0.2%), together accounting for 2.5% of all Tremont borough residents.
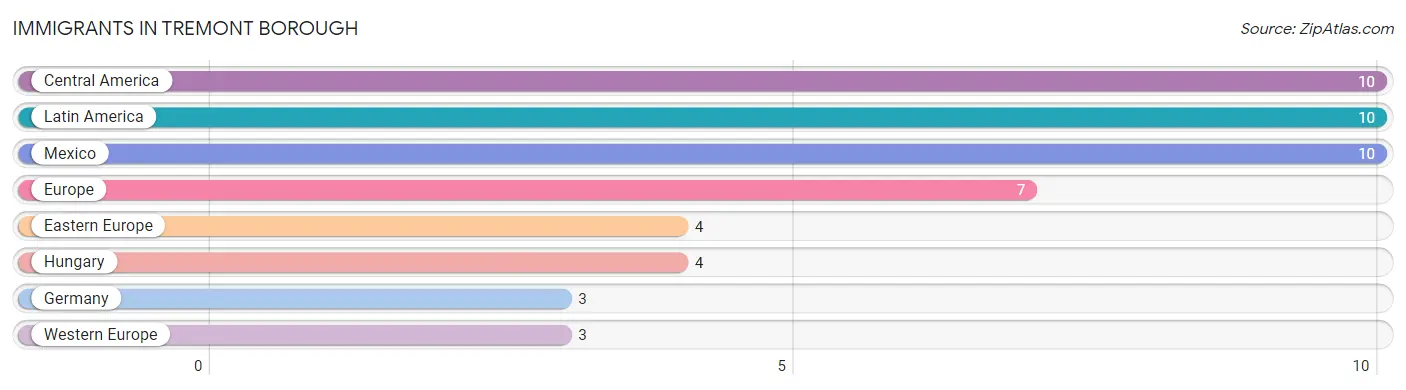
| Immigration Origin | # Population | % Population |
| Central America | 10 | 0.6% |
| Eastern Europe | 4 | 0.2% |
| Europe | 7 | 0.4% |
| Germany | 3 | 0.2% |
| Hungary | 4 | 0.2% |
| Latin America | 10 | 0.6% |
| Mexico | 10 | 0.6% |
| Western Europe | 3 | 0.2% | View All 8 Rows |
Sex and Age in Tremont borough
Sex and Age in Tremont borough
The most populous age groups in Tremont borough are 30 to 34 Years (73 | 7.9%) for men and 5 to 9 Years (58 | 7.7%) for women.
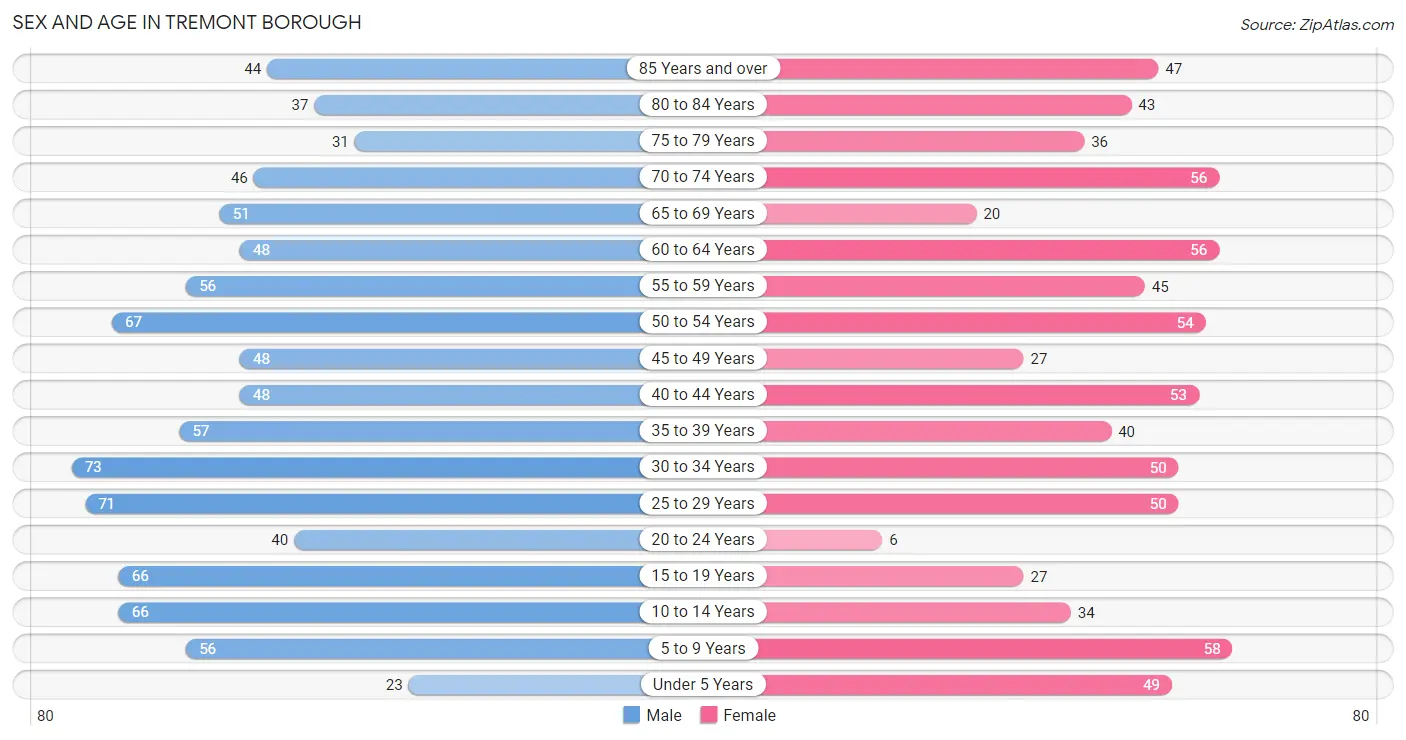
| Age Bracket | Male | Female |
| Under 5 Years | 23 (2.5%) | 49 (6.5%) |
| 5 to 9 Years | 56 (6.0%) | 58 (7.7%) |
| 10 to 14 Years | 66 (7.1%) | 34 (4.5%) |
| 15 to 19 Years | 66 (7.1%) | 27 (3.6%) |
| 20 to 24 Years | 40 (4.3%) | 6 (0.8%) |
| 25 to 29 Years | 71 (7.6%) | 50 (6.7%) |
| 30 to 34 Years | 73 (7.9%) | 50 (6.7%) |
| 35 to 39 Years | 57 (6.1%) | 40 (5.3%) |
| 40 to 44 Years | 48 (5.2%) | 53 (7.1%) |
| 45 to 49 Years | 48 (5.2%) | 27 (3.6%) |
| 50 to 54 Years | 67 (7.2%) | 54 (7.2%) |
| 55 to 59 Years | 56 (6.0%) | 45 (6.0%) |
| 60 to 64 Years | 48 (5.2%) | 56 (7.5%) |
| 65 to 69 Years | 51 (5.5%) | 20 (2.7%) |
| 70 to 74 Years | 46 (5.0%) | 56 (7.5%) |
| 75 to 79 Years | 31 (3.3%) | 36 (4.8%) |
| 80 to 84 Years | 37 (4.0%) | 43 (5.7%) |
| 85 Years and over | 44 (4.7%) | 47 (6.3%) |
| Total | 928 (100.0%) | 751 (100.0%) |
Families and Households in Tremont borough
Median Family Size in Tremont borough
The median family size in Tremont borough is 2.94 persons per family, with single female/mother families (36 | 9.2%) accounting for the largest median family size of 3.06 persons per family. On the other hand, single male/father families (70 | 18.0%) represent the smallest median family size with 2.46 persons per family.
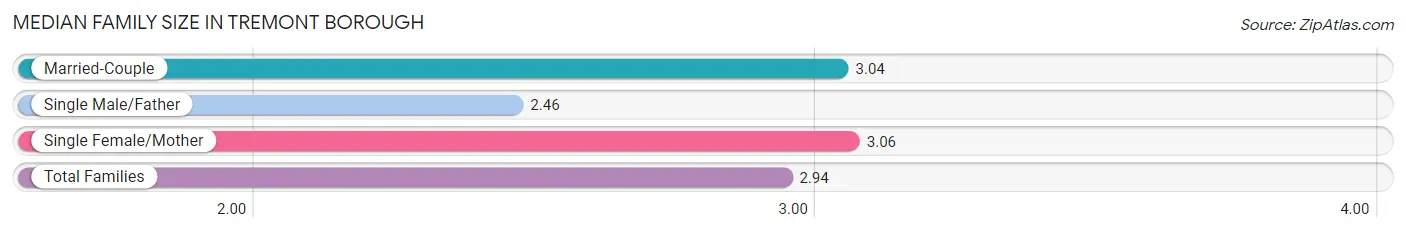
| Family Type | # Families | Family Size |
| Married-Couple | 283 (72.8%) | 3.04 |
| Single Male/Father | 70 (18.0%) | 2.46 |
| Single Female/Mother | 36 (9.2%) | 3.06 |
| Total Families | 389 (100.0%) | 2.94 |
Median Household Size in Tremont borough
The median household size in Tremont borough is 2.47 persons per household, with single female/mother households (36 | 6.0%) accounting for the largest median household size of 3.19 persons per household. non-family households (212 | 35.3%) represent the smallest median household size with 1.42 persons per household.
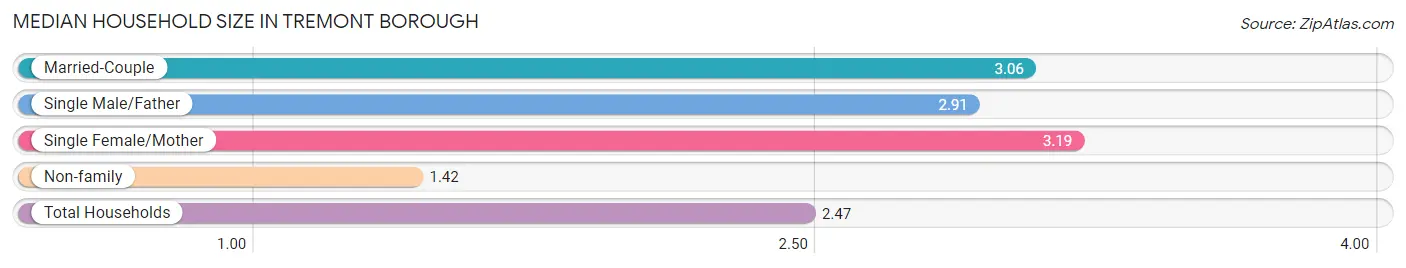
| Household Type | # Households | Household Size |
| Married-Couple | 283 (47.1%) | 3.06 |
| Single Male/Father | 70 (11.7%) | 2.91 |
| Single Female/Mother | 36 (6.0%) | 3.19 |
| Non-family | 212 (35.3%) | 1.42 |
| Total Households | 601 (100.0%) | 2.47 |
Household Size by Marriage Status in Tremont borough
Out of a total of 601 households in Tremont borough, 389 (64.7%) are family households, while 212 (35.3%) are nonfamily households. The most numerous type of family households are 2-person households, comprising 191, and the most common type of nonfamily households are 1-person households, comprising 155.
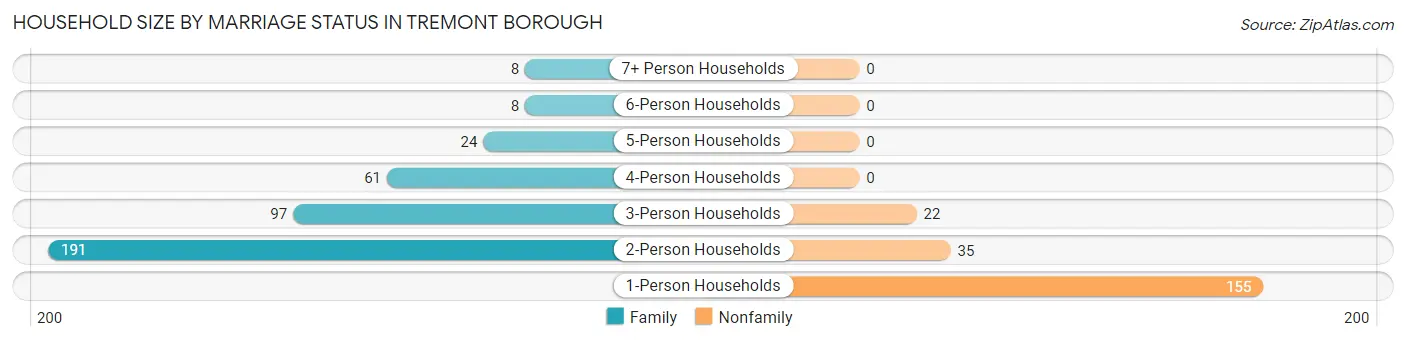
| Household Size | Family Households | Nonfamily Households |
| 1-Person Households | - | 155 (25.8%) |
| 2-Person Households | 191 (31.8%) | 35 (5.8%) |
| 3-Person Households | 97 (16.1%) | 22 (3.7%) |
| 4-Person Households | 61 (10.2%) | 0 (0.0%) |
| 5-Person Households | 24 (4.0%) | 0 (0.0%) |
| 6-Person Households | 8 (1.3%) | 0 (0.0%) |
| 7+ Person Households | 8 (1.3%) | 0 (0.0%) |
| Total | 389 (64.7%) | 212 (35.3%) |
Female Fertility in Tremont borough
Fertility by Age in Tremont borough
Average fertility rate in Tremont borough is 96.0 births per 1,000 women. Women in the age bracket of 15 to 19 years have the highest fertility rate with 111.0 births per 1,000 women. Women in the age bracket of 35 to 50 years acount for 57.7% of all women with births.
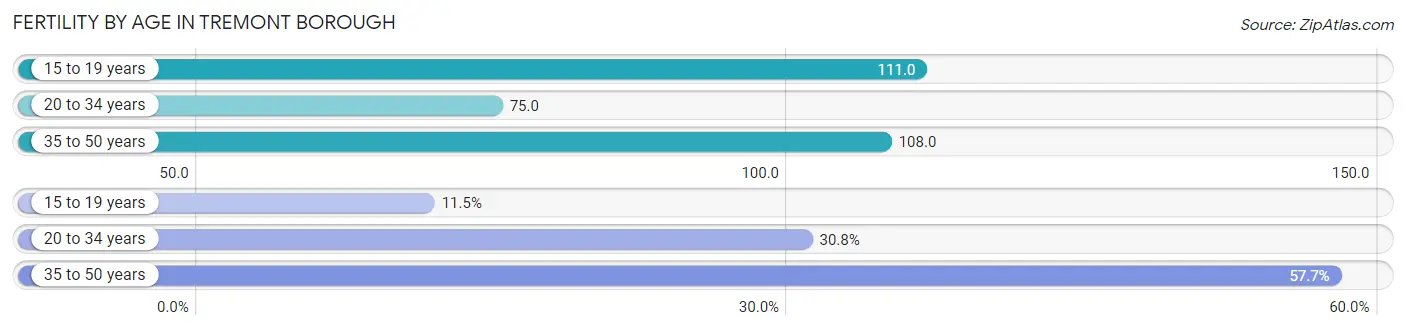
| Age Bracket | Women with Births | Births / 1,000 Women |
| 15 to 19 years | 3 (11.5%) | 111.0 |
| 20 to 34 years | 8 (30.8%) | 75.0 |
| 35 to 50 years | 15 (57.7%) | 108.0 |
| Total | 26 (100.0%) | 96.0 |
Fertility by Age by Marriage Status in Tremont borough
73.1% of women with births (26) in Tremont borough are married. The highest percentage of unmarried women with births falls into 15 to 19 years age bracket with 100.0% of them unmarried at the time of birth, while the lowest percentage of unmarried women with births belong to 35 to 50 years age bracket with 0.0% of them unmarried.
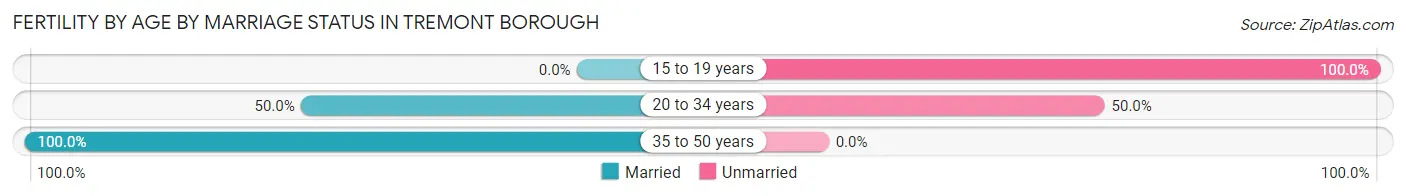
| Age Bracket | Married | Unmarried |
| 15 to 19 years | 0 (0.0%) | 3 (100.0%) |
| 20 to 34 years | 4 (50.0%) | 4 (50.0%) |
| 35 to 50 years | 15 (100.0%) | 0 (0.0%) |
| Total | 19 (73.1%) | 7 (26.9%) |
Fertility by Education in Tremont borough
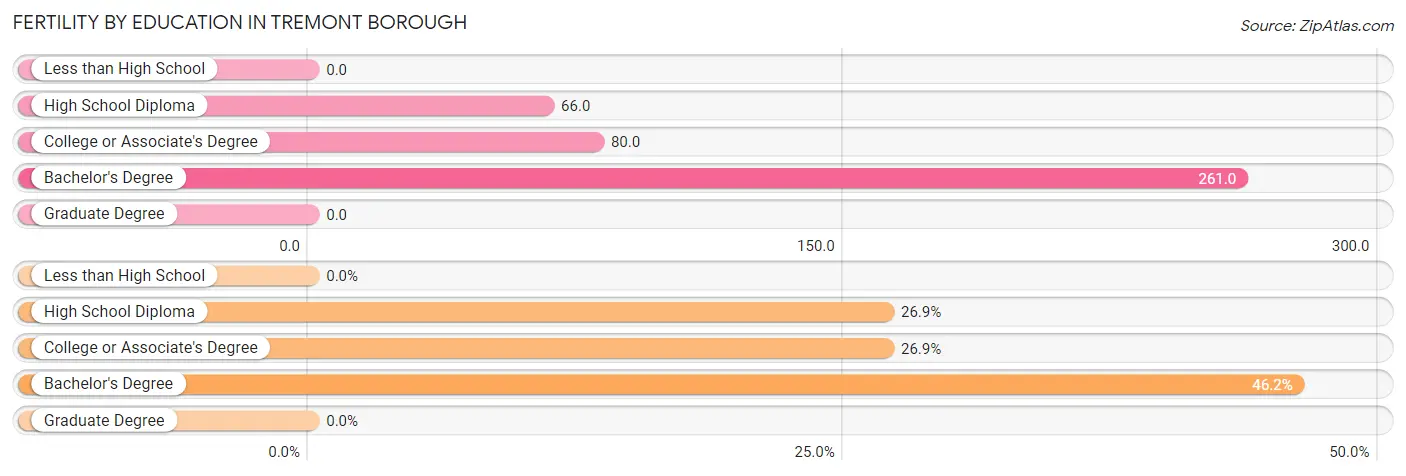
| Educational Attainment | Women with Births | Births / 1,000 Women |
| Less than High School | 0 (0.0%) | 0.0 |
| High School Diploma | 7 (26.9%) | 66.0 |
| College or Associate's Degree | 7 (26.9%) | 80.0 |
| Bachelor's Degree | 12 (46.2%) | 261.0 |
| Graduate Degree | 0 (0.0%) | 0.0 |
| Total | 26 (100.0%) | 96.0 |
Fertility by Education by Marriage Status in Tremont borough
26.9% of women with births in Tremont borough are unmarried. Women with the educational attainment of college or associate's degree are most likely to be married with 100.0% of them married at childbirth, while women with the educational attainment of high school diploma are least likely to be married with 100.0% of them unmarried at childbirth.
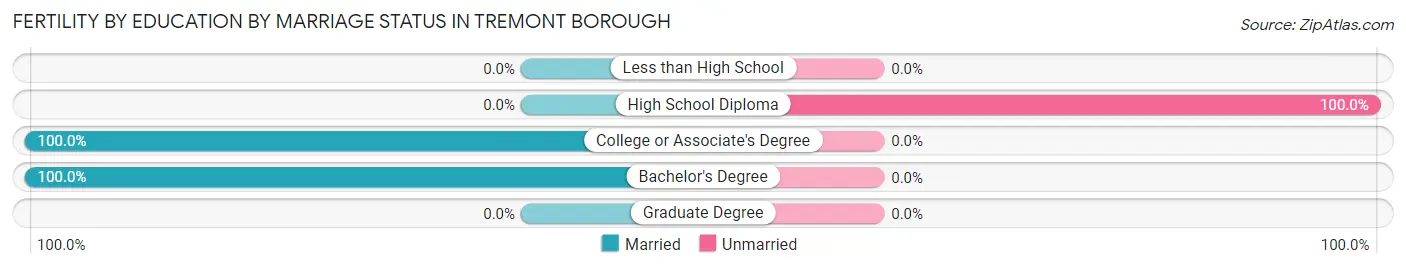
| Educational Attainment | Married | Unmarried |
| Less than High School | 0 (0.0%) | 0 (0.0%) |
| High School Diploma | 0 (0.0%) | 7 (100.0%) |
| College or Associate's Degree | 7 (100.0%) | 0 (0.0%) |
| Bachelor's Degree | 12 (100.0%) | 0 (0.0%) |
| Graduate Degree | 0 (0.0%) | 0 (0.0%) |
| Total | 19 (73.1%) | 7 (26.9%) |
Employment Characteristics in Tremont borough
Employment by Class of Employer in Tremont borough
Among the 749 employed individuals in Tremont borough, private company employees (614 | 82.0%), local government employees (51 | 6.8%), and not-for-profit organizations (37 | 4.9%) make up the most common classes of employment.
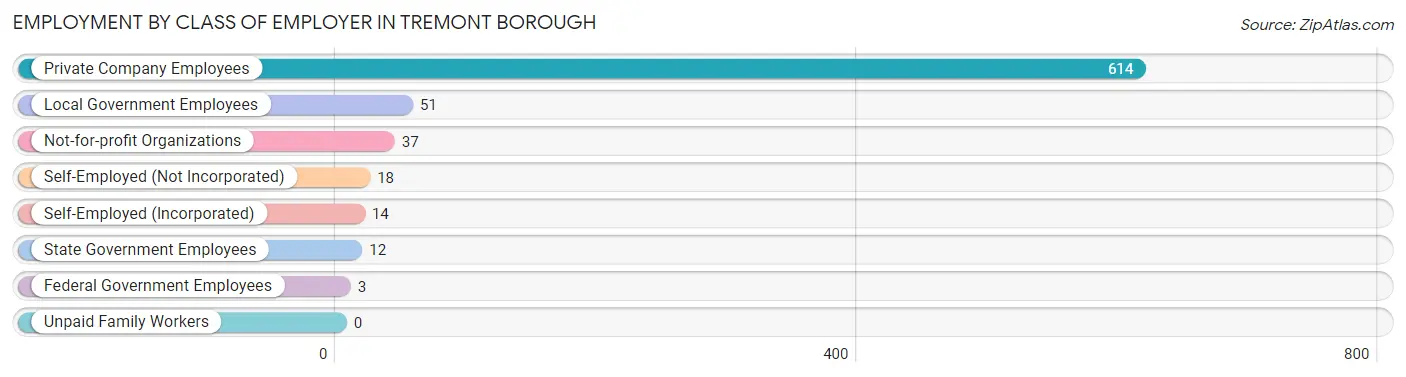
| Employer Class | # Employees | % Employees |
| Private Company Employees | 614 | 82.0% |
| Self-Employed (Incorporated) | 14 | 1.9% |
| Self-Employed (Not Incorporated) | 18 | 2.4% |
| Not-for-profit Organizations | 37 | 4.9% |
| Local Government Employees | 51 | 6.8% |
| State Government Employees | 12 | 1.6% |
| Federal Government Employees | 3 | 0.4% |
| Unpaid Family Workers | 0 | 0.0% |
| Total | 749 | 100.0% |
Employment Status by Age in Tremont borough
According to the labor force statistics for Tremont borough, out of the total population over 16 years of age (1,375), 56.6% or 778 individuals are in the labor force, with 3.1% or 24 of them unemployed. The age group with the highest labor force participation rate is 25 to 29 years, with 96.7% or 117 individuals in the labor force. Within the labor force, the 16 to 19 years age range has the highest percentage of unemployed individuals, with 35.2% or 19 of them being unemployed.
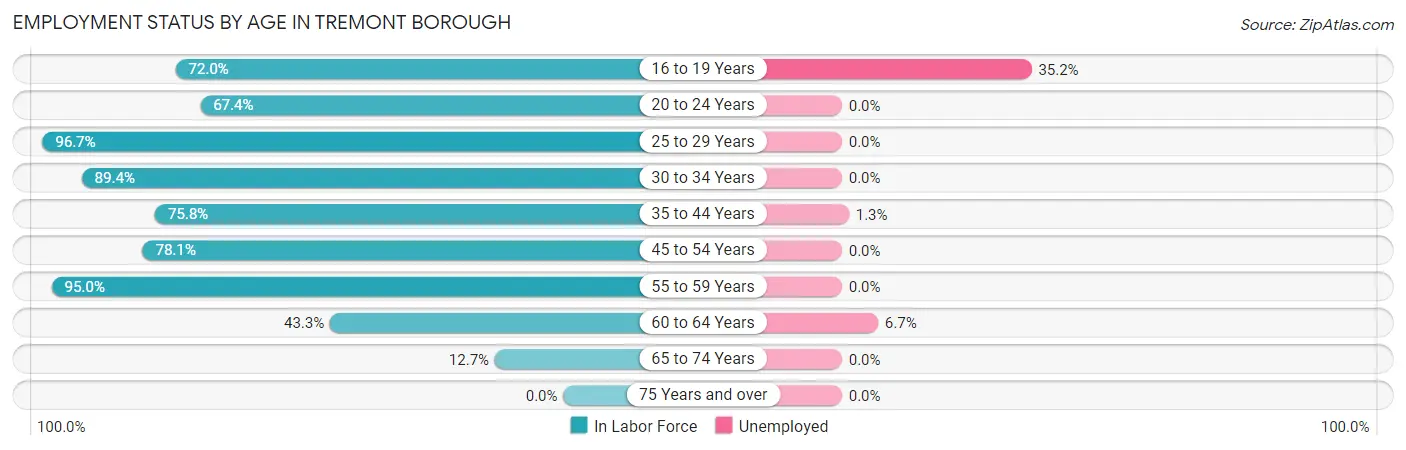
| Age Bracket | In Labor Force | Unemployed |
| 16 to 19 Years | 54 (72.0%) | 19 (35.2%) |
| 20 to 24 Years | 31 (67.4%) | 0 (0.0%) |
| 25 to 29 Years | 117 (96.7%) | 0 (0.0%) |
| 30 to 34 Years | 110 (89.4%) | 0 (0.0%) |
| 35 to 44 Years | 150 (75.8%) | 2 (1.3%) |
| 45 to 54 Years | 153 (78.1%) | 0 (0.0%) |
| 55 to 59 Years | 96 (95.0%) | 0 (0.0%) |
| 60 to 64 Years | 45 (43.3%) | 3 (6.7%) |
| 65 to 74 Years | 22 (12.7%) | 0 (0.0%) |
| 75 Years and over | 0 (0.0%) | 0 (0.0%) |
| Total | 778 (56.6%) | 24 (3.1%) |
Employment Status by Educational Attainment in Tremont borough
According to labor force statistics for Tremont borough, 79.6% of individuals (671) out of the total population between 25 and 64 years of age (843) are in the labor force, with 0.7% or 5 of them being unemployed. The group with the highest labor force participation rate are those with the educational attainment of bachelor's degree or higher, with 92.6% or 113 individuals in the labor force. Within the labor force, individuals with college / associate degree education have the highest percentage of unemployment, with 2.3% or 3 of them being unemployed.
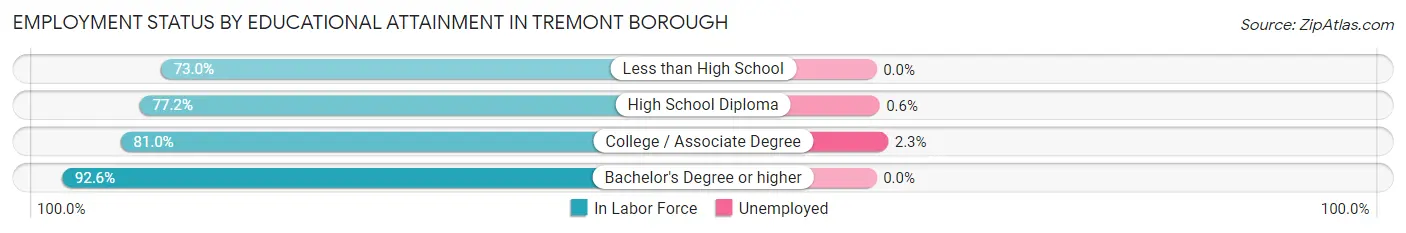
| Educational Attainment | In Labor Force | Unemployed |
| Less than High School | 81 (73.0%) | 0 (0.0%) |
| High School Diploma | 345 (77.2%) | 3 (0.6%) |
| College / Associate Degree | 132 (81.0%) | 4 (2.3%) |
| Bachelor's Degree or higher | 113 (92.6%) | 0 (0.0%) |
| Total | 671 (79.6%) | 6 (0.7%) |
Employment Occupations by Sex in Tremont borough
Management, Business, Science and Arts Occupations
The most common Management, Business, Science and Arts occupations in Tremont borough are Community & Social Service (48 | 6.4%), Education Instruction & Library (42 | 5.6%), Health Diagnosing & Treating (38 | 5.0%), Computers, Engineering & Science (36 | 4.8%), and Management (33 | 4.4%).
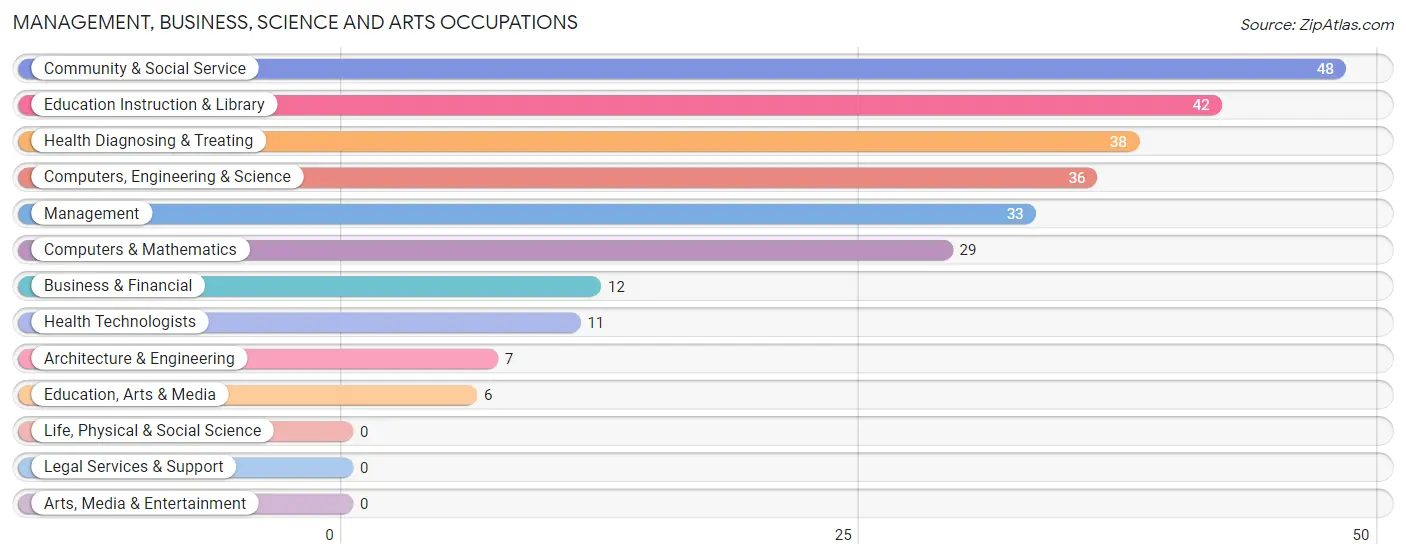
Management, Business, Science and Arts Occupations by Sex
Within the Management, Business, Science and Arts occupations in Tremont borough, the most male-oriented occupations are Computers, Engineering & Science (100.0%), Computers & Mathematics (100.0%), and Architecture & Engineering (100.0%), while the most female-oriented occupations are Health Technologists (100.0%), Health Diagnosing & Treating (86.8%), and Business & Financial (66.7%).
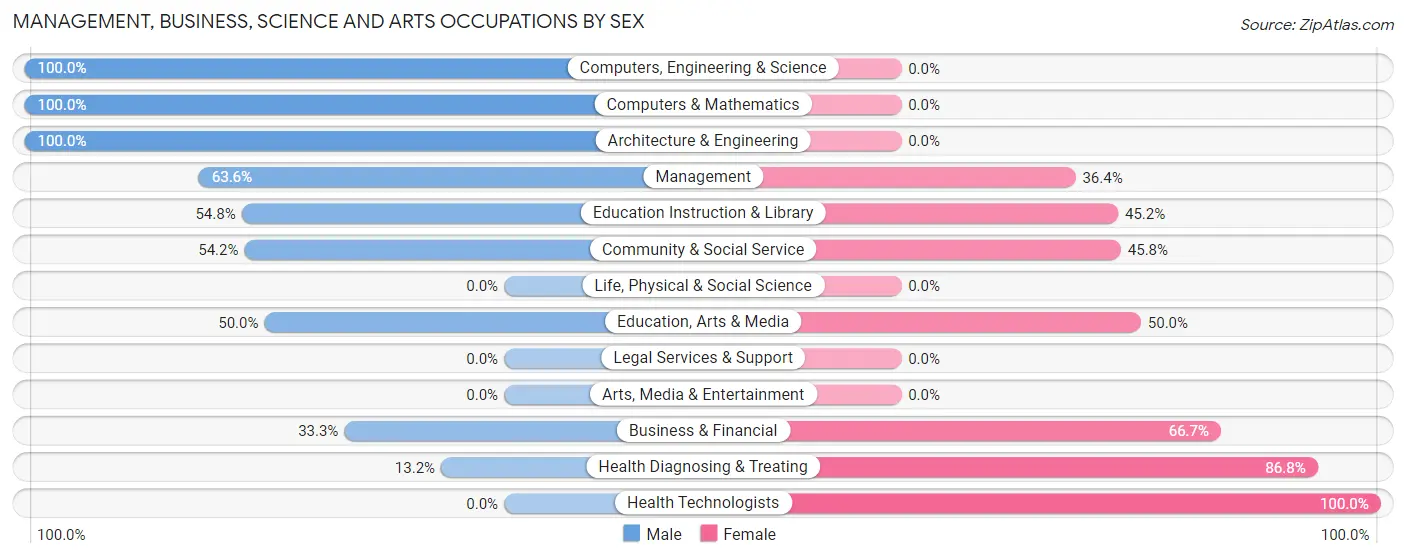
| Occupation | Male | Female |
| Management | 21 (63.6%) | 12 (36.4%) |
| Business & Financial | 4 (33.3%) | 8 (66.7%) |
| Computers, Engineering & Science | 36 (100.0%) | 0 (0.0%) |
| Computers & Mathematics | 29 (100.0%) | 0 (0.0%) |
| Architecture & Engineering | 7 (100.0%) | 0 (0.0%) |
| Life, Physical & Social Science | 0 (0.0%) | 0 (0.0%) |
| Community & Social Service | 26 (54.2%) | 22 (45.8%) |
| Education, Arts & Media | 3 (50.0%) | 3 (50.0%) |
| Legal Services & Support | 0 (0.0%) | 0 (0.0%) |
| Education Instruction & Library | 23 (54.8%) | 19 (45.2%) |
| Arts, Media & Entertainment | 0 (0.0%) | 0 (0.0%) |
| Health Diagnosing & Treating | 5 (13.2%) | 33 (86.8%) |
| Health Technologists | 0 (0.0%) | 11 (100.0%) |
| Total (Category) | 92 (55.1%) | 75 (44.9%) |
| Total (Overall) | 484 (64.2%) | 270 (35.8%) |
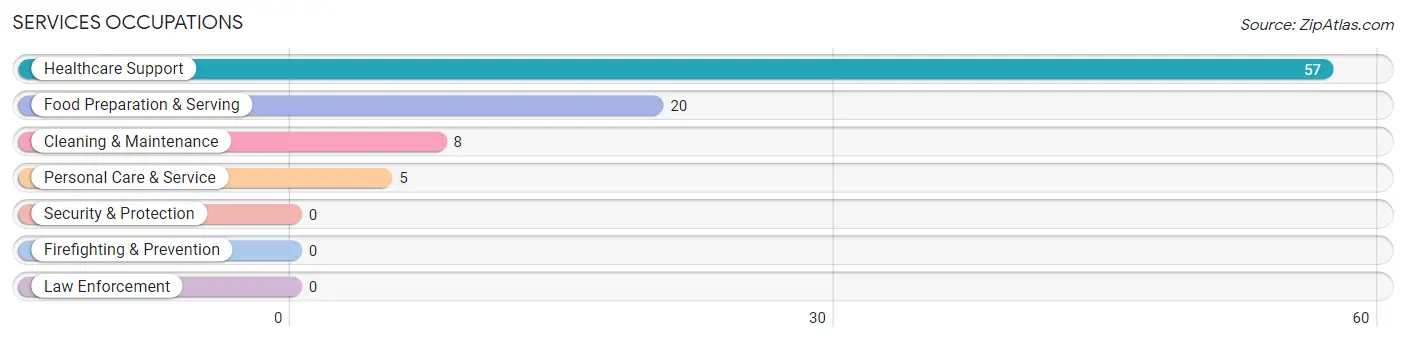
Services Occupations
The most common Services occupations in Tremont borough are Healthcare Support (57 | 7.6%), Food Preparation & Serving (20 | 2.6%), Cleaning & Maintenance (8 | 1.1%), and Personal Care & Service (5 | 0.7%).
Services Occupations by Sex
Within the Services occupations in Tremont borough, the most male-oriented occupations are Cleaning & Maintenance (62.5%), Food Preparation & Serving (15.0%), and Healthcare Support (14.0%), while the most female-oriented occupations are Personal Care & Service (100.0%), Healthcare Support (86.0%), and Food Preparation & Serving (85.0%).
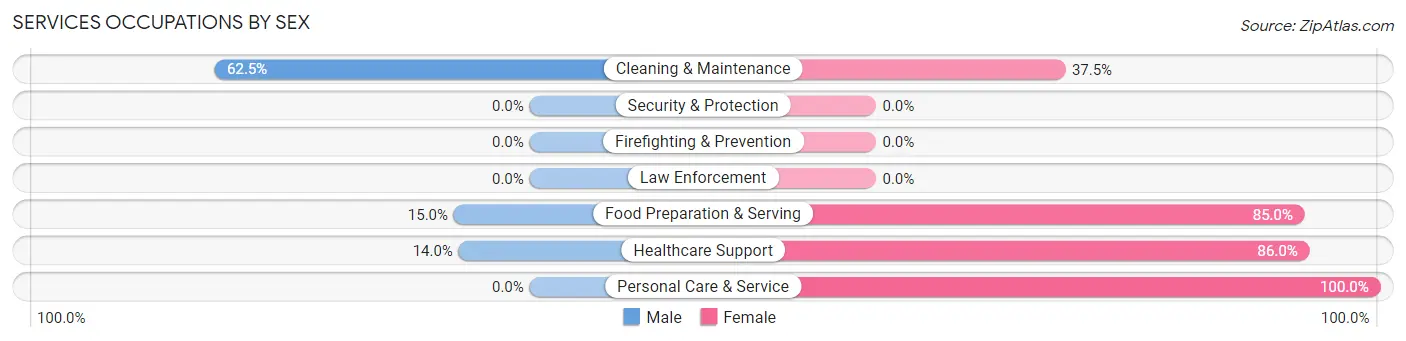
| Occupation | Male | Female |
| Healthcare Support | 8 (14.0%) | 49 (86.0%) |
| Security & Protection | 0 (0.0%) | 0 (0.0%) |
| Firefighting & Prevention | 0 (0.0%) | 0 (0.0%) |
| Law Enforcement | 0 (0.0%) | 0 (0.0%) |
| Food Preparation & Serving | 3 (15.0%) | 17 (85.0%) |
| Cleaning & Maintenance | 5 (62.5%) | 3 (37.5%) |
| Personal Care & Service | 0 (0.0%) | 5 (100.0%) |
| Total (Category) | 16 (17.8%) | 74 (82.2%) |
| Total (Overall) | 484 (64.2%) | 270 (35.8%) |
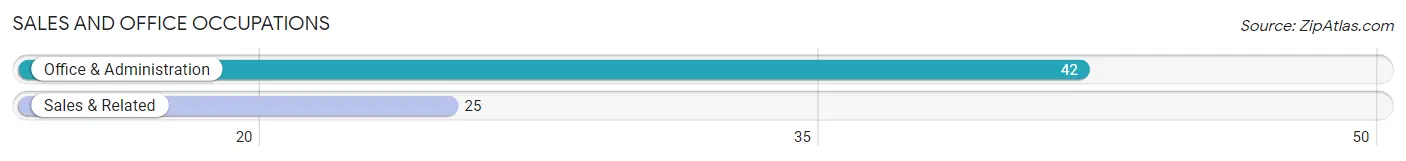
Sales and Office Occupations
The most common Sales and Office occupations in Tremont borough are Office & Administration (42 | 5.6%), and Sales & Related (25 | 3.3%).
Sales and Office Occupations by Sex
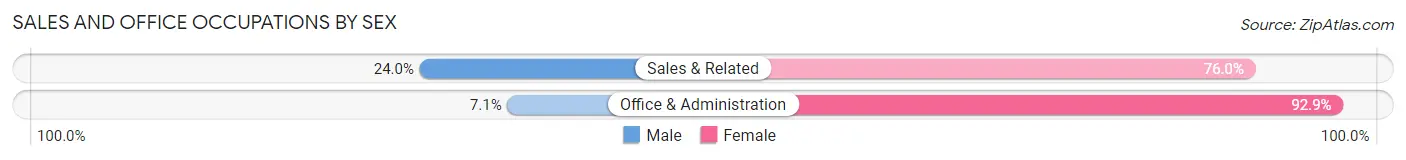
| Occupation | Male | Female |
| Sales & Related | 6 (24.0%) | 19 (76.0%) |
| Office & Administration | 3 (7.1%) | 39 (92.9%) |
| Total (Category) | 9 (13.4%) | 58 (86.6%) |
| Total (Overall) | 484 (64.2%) | 270 (35.8%) |
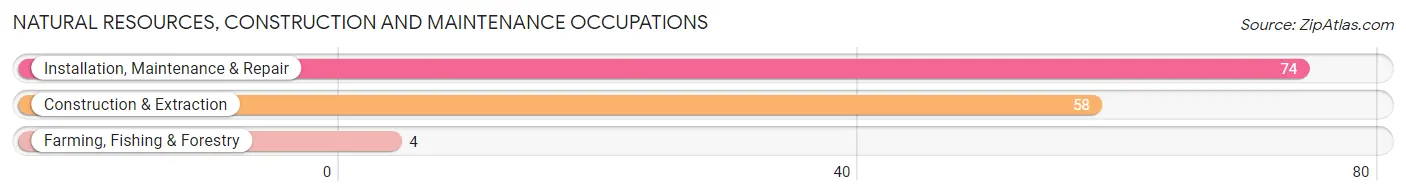
Natural Resources, Construction and Maintenance Occupations
The most common Natural Resources, Construction and Maintenance occupations in Tremont borough are Installation, Maintenance & Repair (74 | 9.8%), Construction & Extraction (58 | 7.7%), and Farming, Fishing & Forestry (4 | 0.5%).
Natural Resources, Construction and Maintenance Occupations by Sex
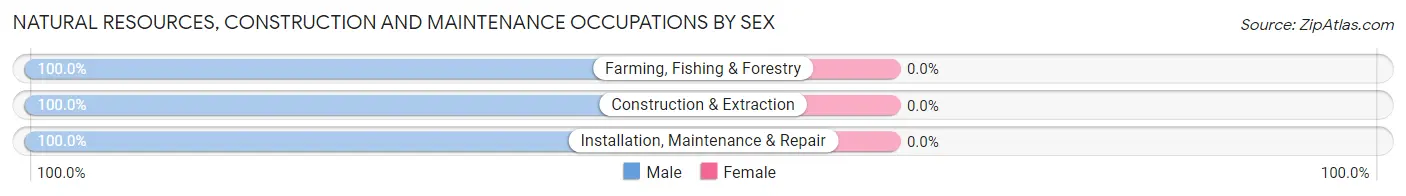
| Occupation | Male | Female |
| Farming, Fishing & Forestry | 4 (100.0%) | 0 (0.0%) |
| Construction & Extraction | 58 (100.0%) | 0 (0.0%) |
| Installation, Maintenance & Repair | 74 (100.0%) | 0 (0.0%) |
| Total (Category) | 136 (100.0%) | 0 (0.0%) |
| Total (Overall) | 484 (64.2%) | 270 (35.8%) |
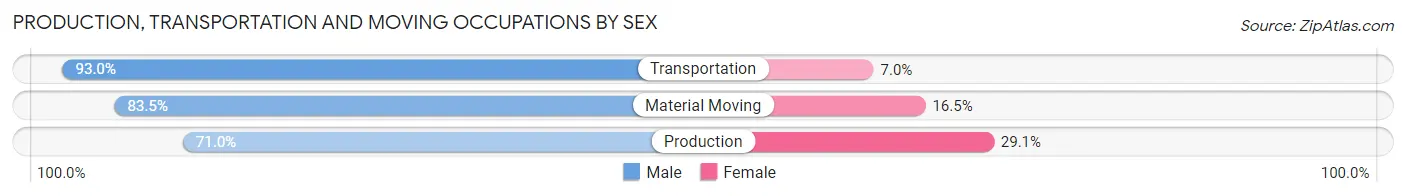
Production, Transportation and Moving Occupations
The most common Production, Transportation and Moving occupations in Tremont borough are Production (148 | 19.6%), Material Moving (103 | 13.7%), and Transportation (43 | 5.7%).
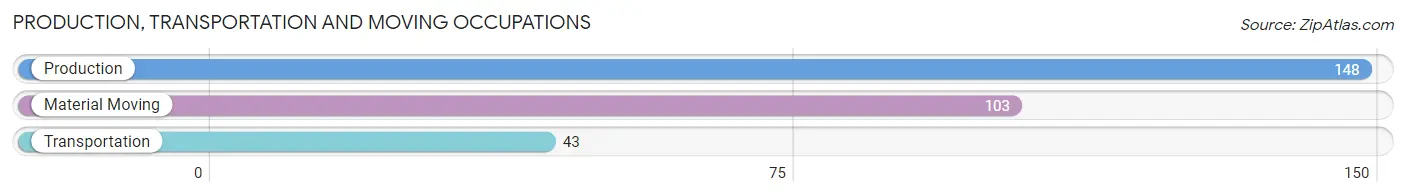
Production, Transportation and Moving Occupations by Sex
| Occupation | Male | Female |
| Production | 105 (71.0%) | 43 (29.0%) |
| Transportation | 40 (93.0%) | 3 (7.0%) |
| Material Moving | 86 (83.5%) | 17 (16.5%) |
| Total (Category) | 231 (78.6%) | 63 (21.4%) |
| Total (Overall) | 484 (64.2%) | 270 (35.8%) |
Employment Industries by Sex in Tremont borough
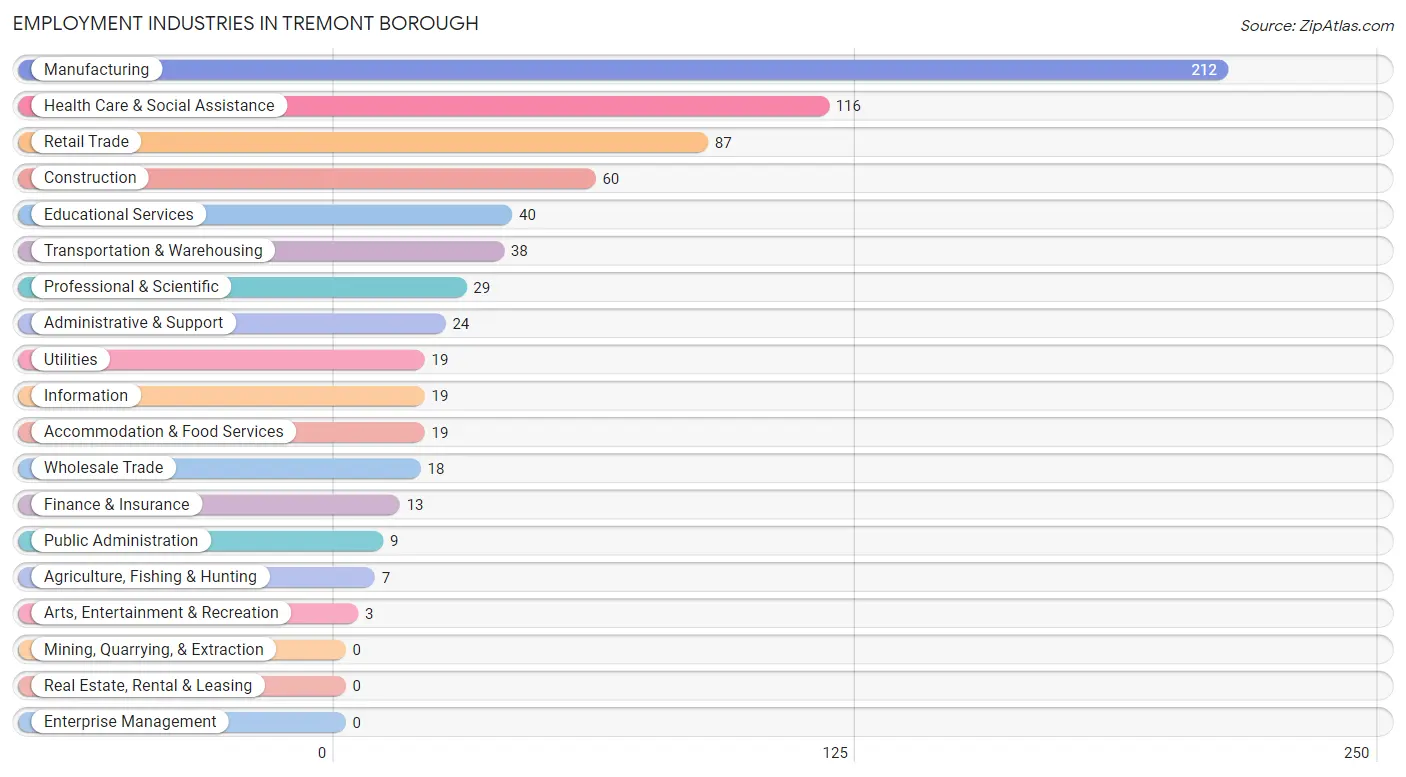
Employment Industries in Tremont borough
The major employment industries in Tremont borough include Manufacturing (212 | 28.1%), Health Care & Social Assistance (116 | 15.4%), Retail Trade (87 | 11.5%), Construction (60 | 8.0%), and Educational Services (40 | 5.3%).
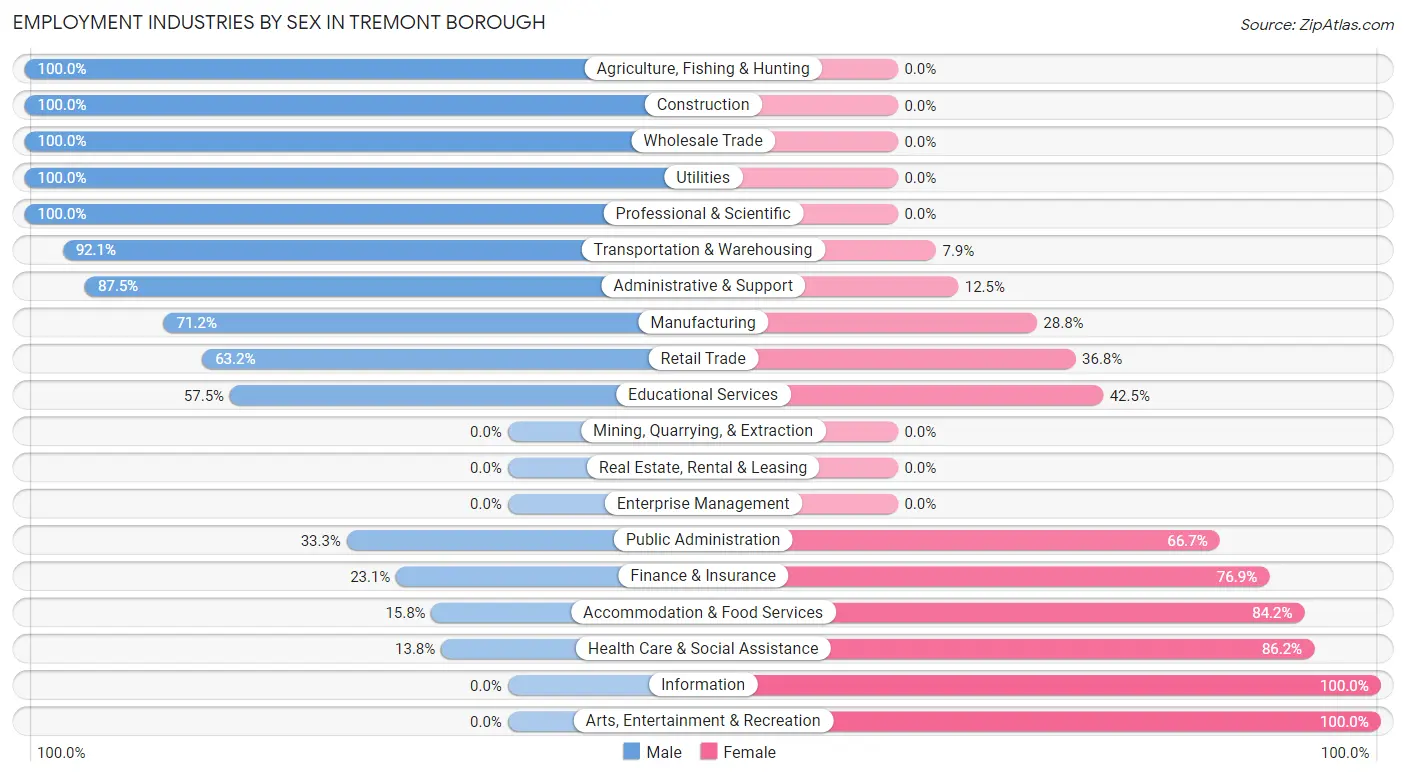
Employment Industries by Sex in Tremont borough
The Tremont borough industries that see more men than women are Agriculture, Fishing & Hunting (100.0%), Construction (100.0%), and Wholesale Trade (100.0%), whereas the industries that tend to have a higher number of women are Information (100.0%), Arts, Entertainment & Recreation (100.0%), and Health Care & Social Assistance (86.2%).
| Industry | Male | Female |
| Agriculture, Fishing & Hunting | 7 (100.0%) | 0 (0.0%) |
| Mining, Quarrying, & Extraction | 0 (0.0%) | 0 (0.0%) |
| Construction | 60 (100.0%) | 0 (0.0%) |
| Manufacturing | 151 (71.2%) | 61 (28.8%) |
| Wholesale Trade | 18 (100.0%) | 0 (0.0%) |
| Retail Trade | 55 (63.2%) | 32 (36.8%) |
| Transportation & Warehousing | 35 (92.1%) | 3 (7.9%) |
| Utilities | 19 (100.0%) | 0 (0.0%) |
| Information | 0 (0.0%) | 19 (100.0%) |
| Finance & Insurance | 3 (23.1%) | 10 (76.9%) |
| Real Estate, Rental & Leasing | 0 (0.0%) | 0 (0.0%) |
| Professional & Scientific | 29 (100.0%) | 0 (0.0%) |
| Enterprise Management | 0 (0.0%) | 0 (0.0%) |
| Administrative & Support | 21 (87.5%) | 3 (12.5%) |
| Educational Services | 23 (57.5%) | 17 (42.5%) |
| Health Care & Social Assistance | 16 (13.8%) | 100 (86.2%) |
| Arts, Entertainment & Recreation | 0 (0.0%) | 3 (100.0%) |
| Accommodation & Food Services | 3 (15.8%) | 16 (84.2%) |
| Public Administration | 3 (33.3%) | 6 (66.7%) |
| Total | 484 (64.2%) | 270 (35.8%) |
Education in Tremont borough
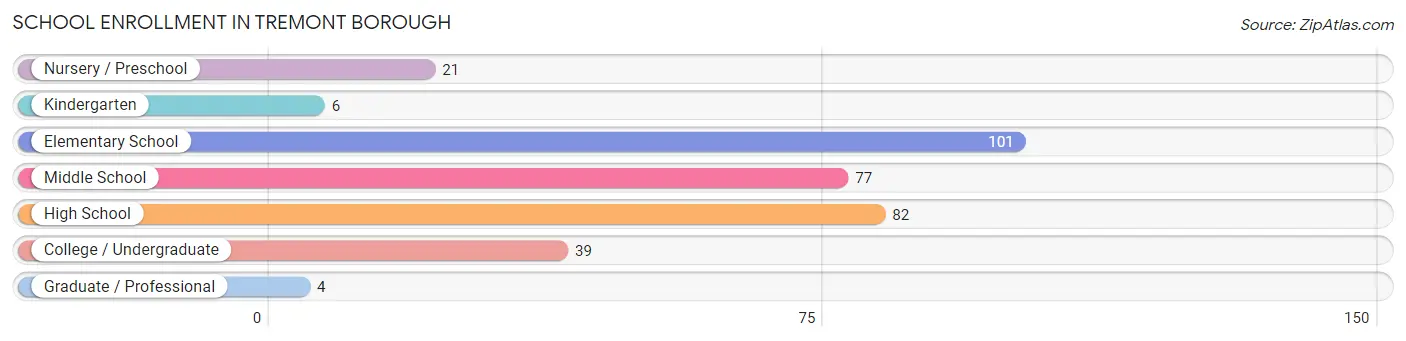
School Enrollment in Tremont borough
The most common levels of schooling among the 330 students in Tremont borough are elementary school (101 | 30.6%), high school (82 | 24.8%), and middle school (77 | 23.3%).
| School Level | # Students | % Students |
| Nursery / Preschool | 21 | 6.4% |
| Kindergarten | 6 | 1.8% |
| Elementary School | 101 | 30.6% |
| Middle School | 77 | 23.3% |
| High School | 82 | 24.8% |
| College / Undergraduate | 39 | 11.8% |
| Graduate / Professional | 4 | 1.2% |
| Total | 330 | 100.0% |
School Enrollment by Age by Funding Source in Tremont borough
Out of a total of 330 students who are enrolled in schools in Tremont borough, 27 (8.2%) attend a private institution, while the remaining 303 (91.8%) are enrolled in public schools. The age group of 3 to 4 year olds has the highest likelihood of being enrolled in private schools, with 4 (100.0% in the age bracket) enrolled. Conversely, the age group of 10 to 14 year olds has the lowest likelihood of being enrolled in a private school, with 100 (100.0% in the age bracket) attending a public institution.
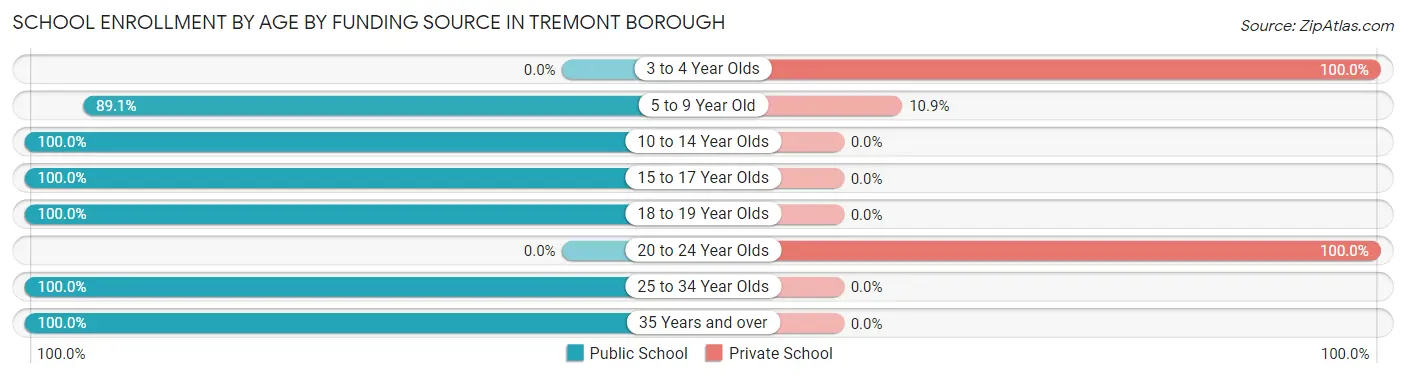
| Age Bracket | Public School | Private School |
| 3 to 4 Year Olds | 0 (0.0%) | 4 (100.0%) |
| 5 to 9 Year Old | 98 (89.1%) | 12 (10.9%) |
| 10 to 14 Year Olds | 100 (100.0%) | 0 (0.0%) |
| 15 to 17 Year Olds | 63 (100.0%) | 0 (0.0%) |
| 18 to 19 Year Olds | 8 (100.0%) | 0 (0.0%) |
| 20 to 24 Year Olds | 0 (0.0%) | 11 (100.0%) |
| 25 to 34 Year Olds | 18 (100.0%) | 0 (0.0%) |
| 35 Years and over | 16 (100.0%) | 0 (0.0%) |
| Total | 303 (91.8%) | 27 (8.2%) |
Educational Attainment by Field of Study in Tremont borough
Computers & mathematics (29 | 17.4%), science & technology (21 | 12.6%), arts & humanities (21 | 12.6%), education (17 | 10.2%), and social sciences (12 | 7.2%) are the most common fields of study among 167 individuals in Tremont borough who have obtained a bachelor's degree or higher.
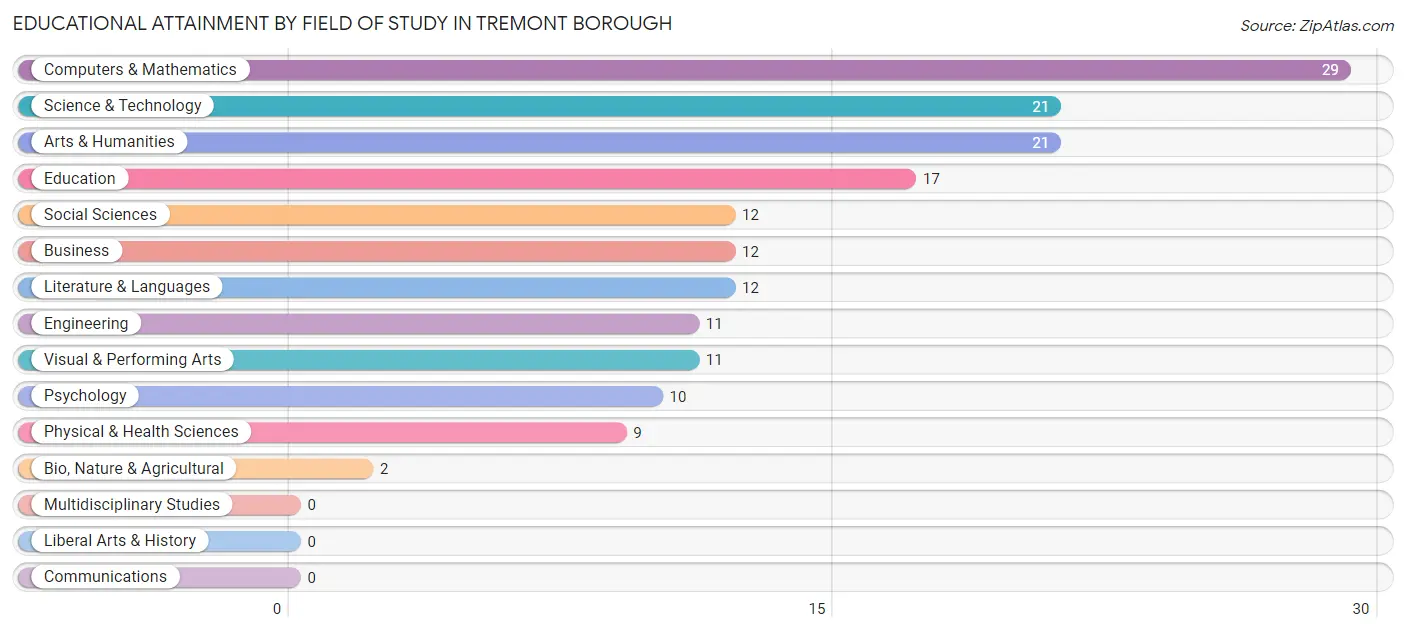
| Field of Study | # Graduates | % Graduates |
| Computers & Mathematics | 29 | 17.4% |
| Bio, Nature & Agricultural | 2 | 1.2% |
| Physical & Health Sciences | 9 | 5.4% |
| Psychology | 10 | 6.0% |
| Social Sciences | 12 | 7.2% |
| Engineering | 11 | 6.6% |
| Multidisciplinary Studies | 0 | 0.0% |
| Science & Technology | 21 | 12.6% |
| Business | 12 | 7.2% |
| Education | 17 | 10.2% |
| Literature & Languages | 12 | 7.2% |
| Liberal Arts & History | 0 | 0.0% |
| Visual & Performing Arts | 11 | 6.6% |
| Communications | 0 | 0.0% |
| Arts & Humanities | 21 | 12.6% |
| Total | 167 | 100.0% |
Transportation & Commute in Tremont borough
Vehicle Availability by Sex in Tremont borough
The most prevalent vehicle ownership categories in Tremont borough are males with 2 vehicles (173, accounting for 36.3%) and females with 2 vehicles (104, making up 64.1%).
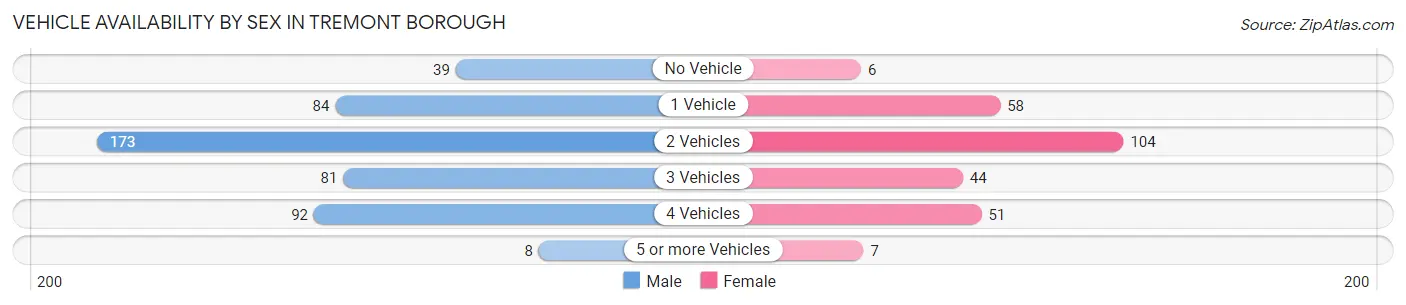
| Vehicles Available | Male | Female |
| No Vehicle | 39 (8.2%) | 6 (2.2%) |
| 1 Vehicle | 84 (17.6%) | 58 (21.5%) |
| 2 Vehicles | 173 (36.3%) | 104 (38.5%) |
| 3 Vehicles | 81 (17.0%) | 44 (16.3%) |
| 4 Vehicles | 92 (19.3%) | 51 (18.9%) |
| 5 or more Vehicles | 8 (1.7%) | 7 (2.6%) |
| Total | 477 (100.0%) | 270 (100.0%) |
Commute Time in Tremont borough
The most frequently occuring commute durations in Tremont borough are 15 to 19 minutes (147 commuters, 20.6%), 20 to 24 minutes (92 commuters, 12.9%), and less than 5 minutes (85 commuters, 11.9%).
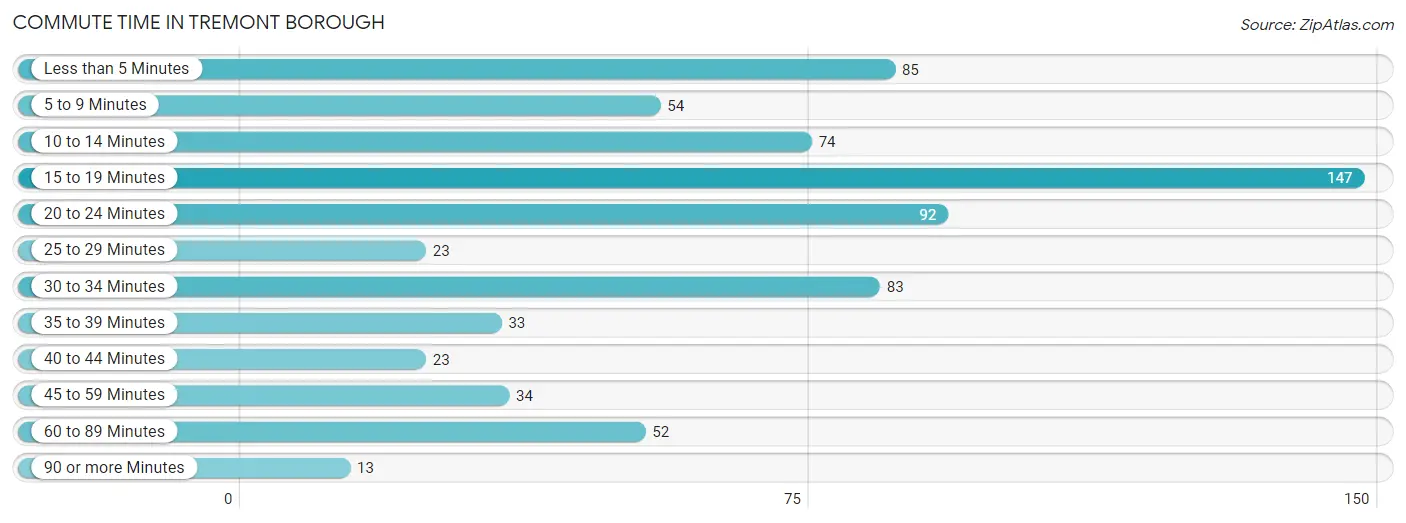
| Commute Time | # Commuters | % Commuters |
| Less than 5 Minutes | 85 | 11.9% |
| 5 to 9 Minutes | 54 | 7.6% |
| 10 to 14 Minutes | 74 | 10.4% |
| 15 to 19 Minutes | 147 | 20.6% |
| 20 to 24 Minutes | 92 | 12.9% |
| 25 to 29 Minutes | 23 | 3.2% |
| 30 to 34 Minutes | 83 | 11.6% |
| 35 to 39 Minutes | 33 | 4.6% |
| 40 to 44 Minutes | 23 | 3.2% |
| 45 to 59 Minutes | 34 | 4.8% |
| 60 to 89 Minutes | 52 | 7.3% |
| 90 or more Minutes | 13 | 1.8% |
Commute Time by Sex in Tremont borough
The most common commute times in Tremont borough are 15 to 19 minutes (99 commuters, 22.0%) for males and less than 5 minutes (63 commuters, 23.9%) for females.
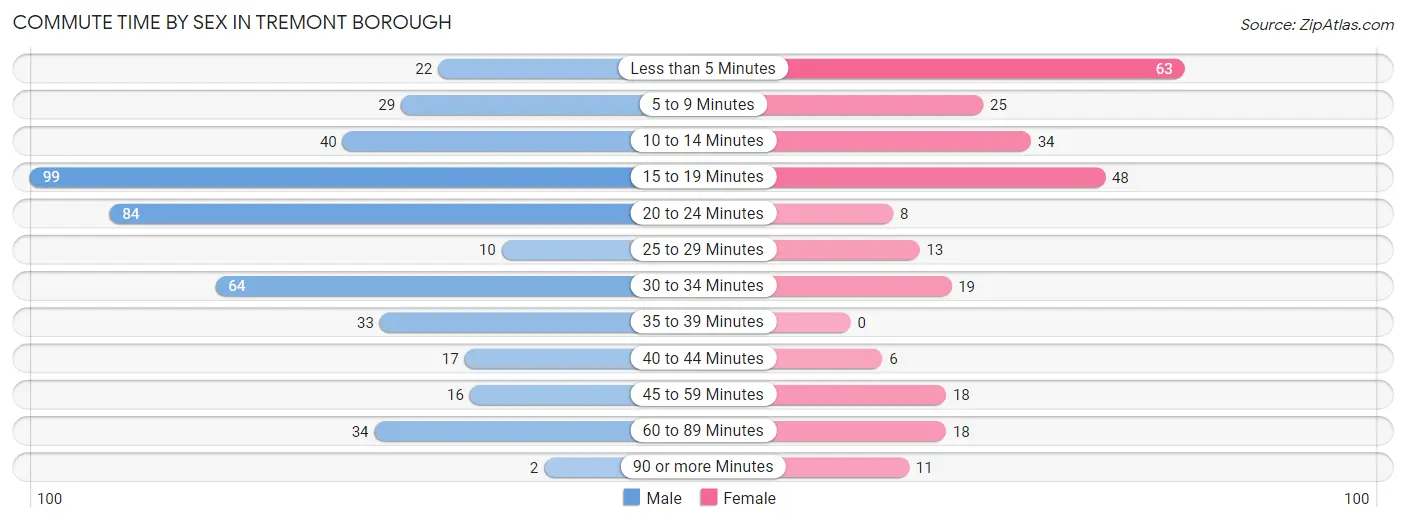
| Commute Time | Male | Female |
| Less than 5 Minutes | 22 (4.9%) | 63 (23.9%) |
| 5 to 9 Minutes | 29 (6.4%) | 25 (9.5%) |
| 10 to 14 Minutes | 40 (8.9%) | 34 (12.9%) |
| 15 to 19 Minutes | 99 (22.0%) | 48 (18.2%) |
| 20 to 24 Minutes | 84 (18.7%) | 8 (3.0%) |
| 25 to 29 Minutes | 10 (2.2%) | 13 (4.9%) |
| 30 to 34 Minutes | 64 (14.2%) | 19 (7.2%) |
| 35 to 39 Minutes | 33 (7.3%) | 0 (0.0%) |
| 40 to 44 Minutes | 17 (3.8%) | 6 (2.3%) |
| 45 to 59 Minutes | 16 (3.6%) | 18 (6.8%) |
| 60 to 89 Minutes | 34 (7.6%) | 18 (6.8%) |
| 90 or more Minutes | 2 (0.4%) | 11 (4.2%) |
Time of Departure to Work by Sex in Tremont borough
The most frequent times of departure to work in Tremont borough are 5:00 AM to 5:29 AM (76, 16.9%) for males and 6:30 AM to 6:59 AM (47, 17.9%) for females.
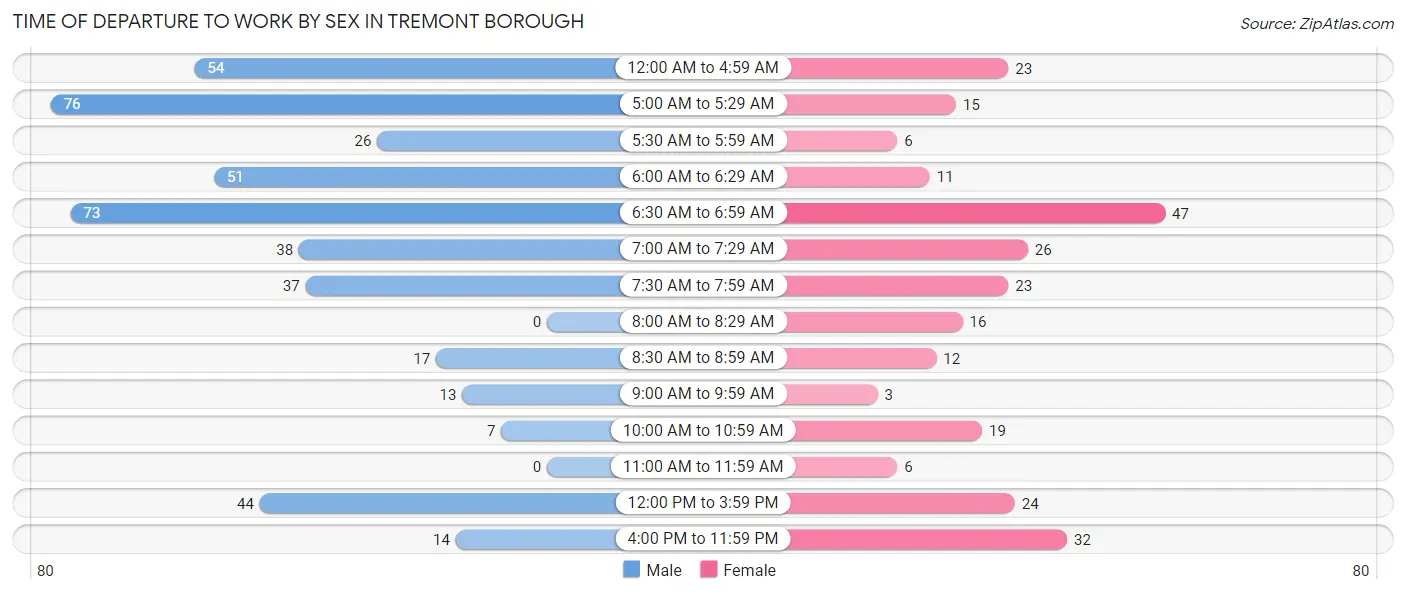
| Time of Departure | Male | Female |
| 12:00 AM to 4:59 AM | 54 (12.0%) | 23 (8.7%) |
| 5:00 AM to 5:29 AM | 76 (16.9%) | 15 (5.7%) |
| 5:30 AM to 5:59 AM | 26 (5.8%) | 6 (2.3%) |
| 6:00 AM to 6:29 AM | 51 (11.3%) | 11 (4.2%) |
| 6:30 AM to 6:59 AM | 73 (16.2%) | 47 (17.9%) |
| 7:00 AM to 7:29 AM | 38 (8.4%) | 26 (9.9%) |
| 7:30 AM to 7:59 AM | 37 (8.2%) | 23 (8.7%) |
| 8:00 AM to 8:29 AM | 0 (0.0%) | 16 (6.1%) |
| 8:30 AM to 8:59 AM | 17 (3.8%) | 12 (4.6%) |
| 9:00 AM to 9:59 AM | 13 (2.9%) | 3 (1.1%) |
| 10:00 AM to 10:59 AM | 7 (1.6%) | 19 (7.2%) |
| 11:00 AM to 11:59 AM | 0 (0.0%) | 6 (2.3%) |
| 12:00 PM to 3:59 PM | 44 (9.8%) | 24 (9.1%) |
| 4:00 PM to 11:59 PM | 14 (3.1%) | 32 (12.2%) |
| Total | 450 (100.0%) | 263 (100.0%) |
Housing Occupancy in Tremont borough
Occupancy by Ownership in Tremont borough
Of the total 601 dwellings in Tremont borough, owner-occupied units account for 459 (76.4%), while renter-occupied units make up 142 (23.6%).
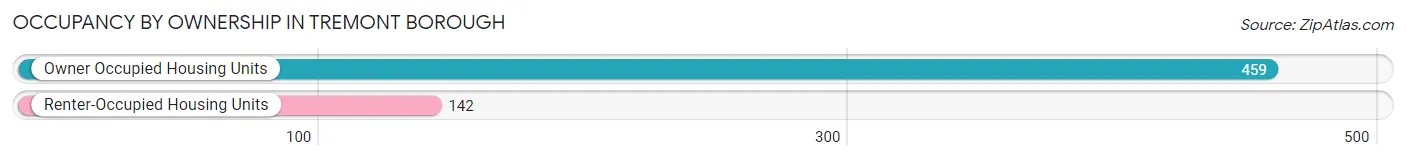
| Occupancy | # Housing Units | % Housing Units |
| Owner Occupied Housing Units | 459 | 76.4% |
| Renter-Occupied Housing Units | 142 | 23.6% |
| Total Occupied Housing Units | 601 | 100.0% |
Occupancy by Household Size in Tremont borough
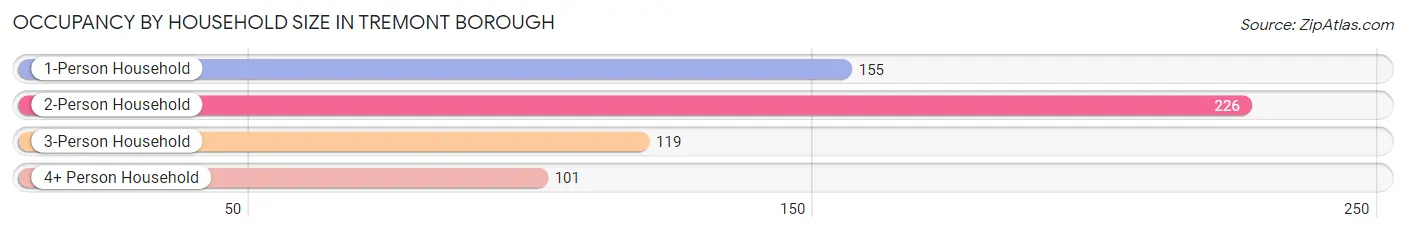
| Household Size | # Housing Units | % Housing Units |
| 1-Person Household | 155 | 25.8% |
| 2-Person Household | 226 | 37.6% |
| 3-Person Household | 119 | 19.8% |
| 4+ Person Household | 101 | 16.8% |
| Total Housing Units | 601 | 100.0% |
Occupancy by Ownership by Household Size in Tremont borough
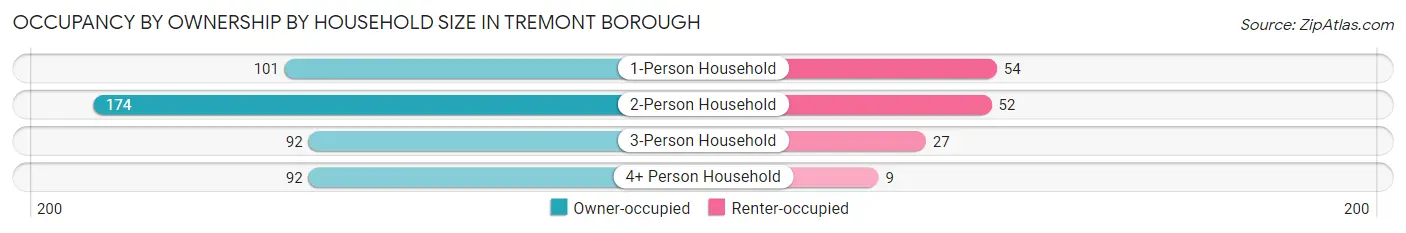
| Household Size | Owner-occupied | Renter-occupied |
| 1-Person Household | 101 (65.2%) | 54 (34.8%) |
| 2-Person Household | 174 (77.0%) | 52 (23.0%) |
| 3-Person Household | 92 (77.3%) | 27 (22.7%) |
| 4+ Person Household | 92 (91.1%) | 9 (8.9%) |
| Total Housing Units | 459 (76.4%) | 142 (23.6%) |
Occupancy by Educational Attainment in Tremont borough
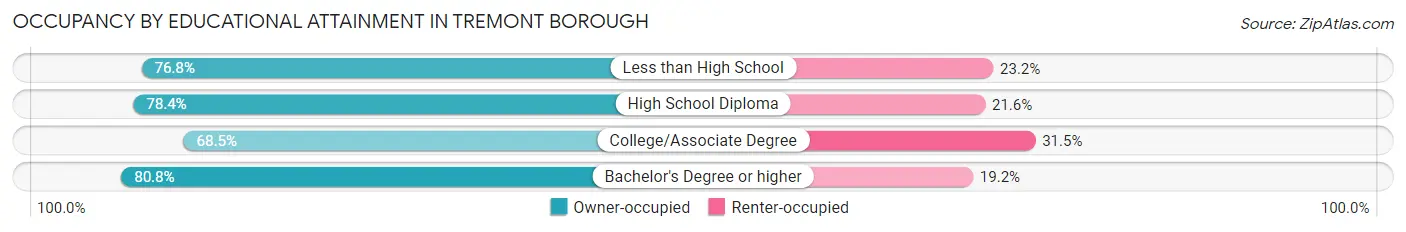
| Household Size | Owner-occupied | Renter-occupied |
| Less than High School | 53 (76.8%) | 16 (23.2%) |
| High School Diploma | 258 (78.4%) | 71 (21.6%) |
| College/Associate Degree | 89 (68.5%) | 41 (31.5%) |
| Bachelor's Degree or higher | 59 (80.8%) | 14 (19.2%) |
Occupancy by Age of Householder in Tremont borough
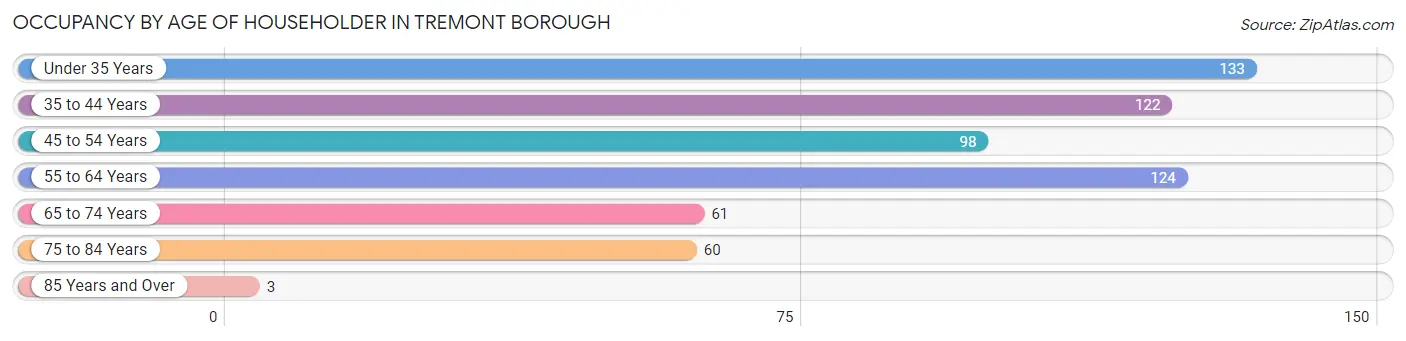
| Age Bracket | # Households | % Households |
| Under 35 Years | 133 | 22.1% |
| 35 to 44 Years | 122 | 20.3% |
| 45 to 54 Years | 98 | 16.3% |
| 55 to 64 Years | 124 | 20.6% |
| 65 to 74 Years | 61 | 10.2% |
| 75 to 84 Years | 60 | 10.0% |
| 85 Years and Over | 3 | 0.5% |
| Total | 601 | 100.0% |
Housing Finances in Tremont borough
Median Income by Occupancy in Tremont borough
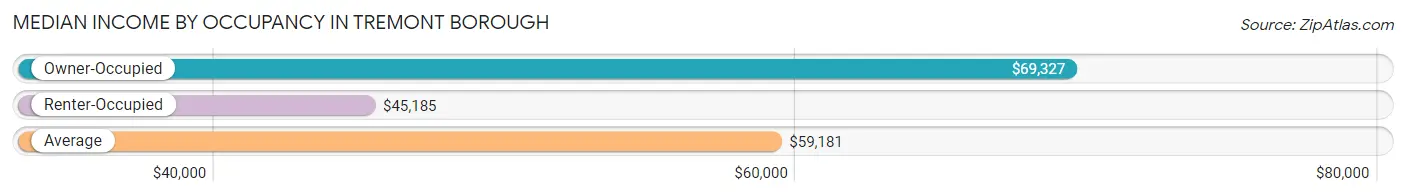
| Occupancy Type | # Households | Median Income |
| Owner-Occupied | 459 (76.4%) | $69,327 |
| Renter-Occupied | 142 (23.6%) | $45,185 |
| Average | 601 (100.0%) | $59,181 |
Occupancy by Householder Income Bracket in Tremont borough
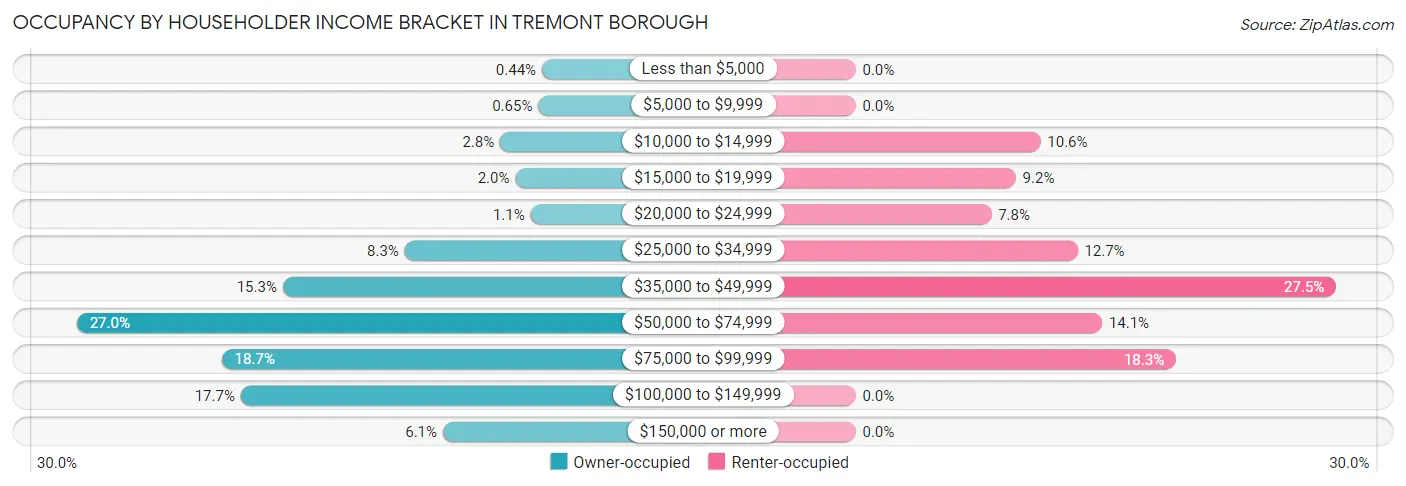
| Income Bracket | Owner-occupied | Renter-occupied |
| Less than $5,000 | 2 (0.4%) | 0 (0.0%) |
| $5,000 to $9,999 | 3 (0.6%) | 0 (0.0%) |
| $10,000 to $14,999 | 13 (2.8%) | 15 (10.6%) |
| $15,000 to $19,999 | 9 (2.0%) | 13 (9.1%) |
| $20,000 to $24,999 | 5 (1.1%) | 11 (7.7%) |
| $25,000 to $34,999 | 38 (8.3%) | 18 (12.7%) |
| $35,000 to $49,999 | 70 (15.2%) | 39 (27.5%) |
| $50,000 to $74,999 | 124 (27.0%) | 20 (14.1%) |
| $75,000 to $99,999 | 86 (18.7%) | 26 (18.3%) |
| $100,000 to $149,999 | 81 (17.6%) | 0 (0.0%) |
| $150,000 or more | 28 (6.1%) | 0 (0.0%) |
| Total | 459 (100.0%) | 142 (100.0%) |
Monthly Housing Cost Tiers in Tremont borough
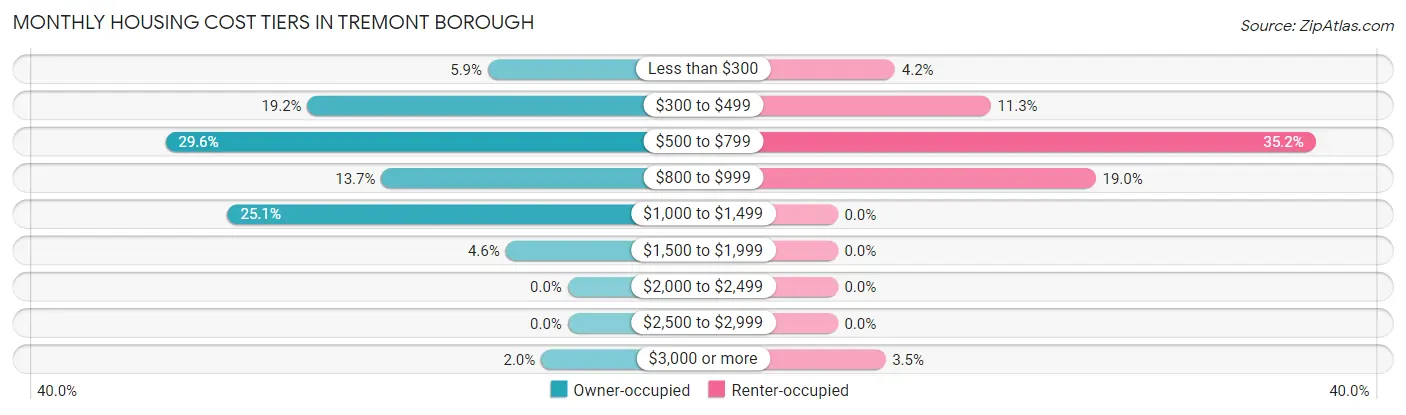
| Monthly Cost | Owner-occupied | Renter-occupied |
| Less than $300 | 27 (5.9%) | 6 (4.2%) |
| $300 to $499 | 88 (19.2%) | 16 (11.3%) |
| $500 to $799 | 136 (29.6%) | 50 (35.2%) |
| $800 to $999 | 63 (13.7%) | 27 (19.0%) |
| $1,000 to $1,499 | 115 (25.1%) | 0 (0.0%) |
| $1,500 to $1,999 | 21 (4.6%) | 0 (0.0%) |
| $2,000 to $2,499 | 0 (0.0%) | 0 (0.0%) |
| $2,500 to $2,999 | 0 (0.0%) | 0 (0.0%) |
| $3,000 or more | 9 (2.0%) | 5 (3.5%) |
| Total | 459 (100.0%) | 142 (100.0%) |
Physical Housing Characteristics in Tremont borough
Housing Structures in Tremont borough
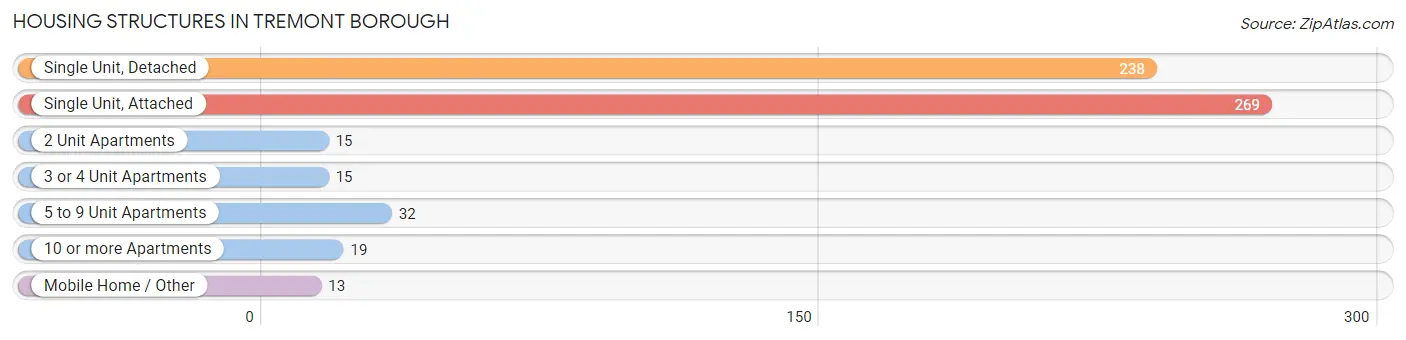
| Structure Type | # Housing Units | % Housing Units |
| Single Unit, Detached | 238 | 39.6% |
| Single Unit, Attached | 269 | 44.8% |
| 2 Unit Apartments | 15 | 2.5% |
| 3 or 4 Unit Apartments | 15 | 2.5% |
| 5 to 9 Unit Apartments | 32 | 5.3% |
| 10 or more Apartments | 19 | 3.2% |
| Mobile Home / Other | 13 | 2.2% |
| Total | 601 | 100.0% |
Housing Structures by Occupancy in Tremont borough
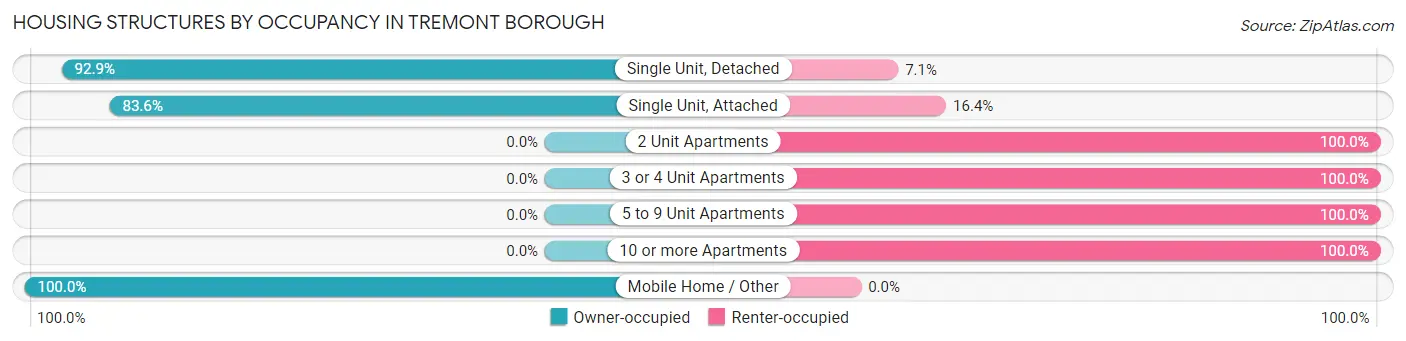
| Structure Type | Owner-occupied | Renter-occupied |
| Single Unit, Detached | 221 (92.9%) | 17 (7.1%) |
| Single Unit, Attached | 225 (83.6%) | 44 (16.4%) |
| 2 Unit Apartments | 0 (0.0%) | 15 (100.0%) |
| 3 or 4 Unit Apartments | 0 (0.0%) | 15 (100.0%) |
| 5 to 9 Unit Apartments | 0 (0.0%) | 32 (100.0%) |
| 10 or more Apartments | 0 (0.0%) | 19 (100.0%) |
| Mobile Home / Other | 13 (100.0%) | 0 (0.0%) |
| Total | 459 (76.4%) | 142 (23.6%) |
Housing Structures by Number of Rooms in Tremont borough
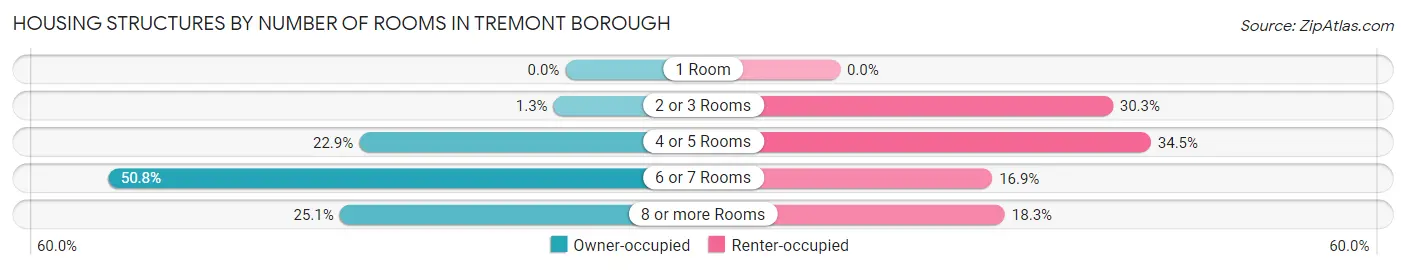
| Number of Rooms | Owner-occupied | Renter-occupied |
| 1 Room | 0 (0.0%) | 0 (0.0%) |
| 2 or 3 Rooms | 6 (1.3%) | 43 (30.3%) |
| 4 or 5 Rooms | 105 (22.9%) | 49 (34.5%) |
| 6 or 7 Rooms | 233 (50.8%) | 24 (16.9%) |
| 8 or more Rooms | 115 (25.1%) | 26 (18.3%) |
| Total | 459 (100.0%) | 142 (100.0%) |
Housing Structure by Heating Type in Tremont borough
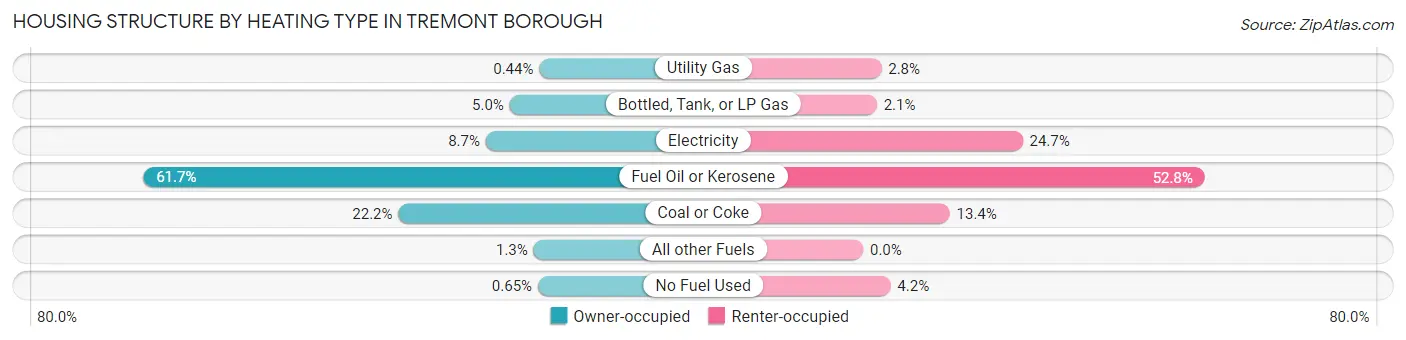
| Heating Type | Owner-occupied | Renter-occupied |
| Utility Gas | 2 (0.4%) | 4 (2.8%) |
| Bottled, Tank, or LP Gas | 23 (5.0%) | 3 (2.1%) |
| Electricity | 40 (8.7%) | 35 (24.6%) |
| Fuel Oil or Kerosene | 283 (61.7%) | 75 (52.8%) |
| Coal or Coke | 102 (22.2%) | 19 (13.4%) |
| All other Fuels | 6 (1.3%) | 0 (0.0%) |
| No Fuel Used | 3 (0.6%) | 6 (4.2%) |
| Total | 459 (100.0%) | 142 (100.0%) |
Household Vehicle Usage in Tremont borough
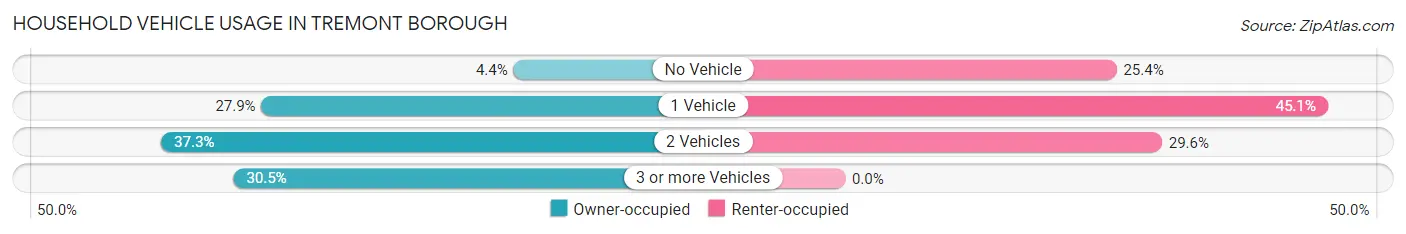
| Vehicles per Household | Owner-occupied | Renter-occupied |
| No Vehicle | 20 (4.4%) | 36 (25.4%) |
| 1 Vehicle | 128 (27.9%) | 64 (45.1%) |
| 2 Vehicles | 171 (37.2%) | 42 (29.6%) |
| 3 or more Vehicles | 140 (30.5%) | 0 (0.0%) |
| Total | 459 (100.0%) | 142 (100.0%) |
Real Estate & Mortgages in Tremont borough
Real Estate and Mortgage Overview in Tremont borough
| Characteristic | Without Mortgage | With Mortgage |
| Housing Units | 234 | 225 |
| Median Property Value | $73,600 | $84,800 |
| Median Household Income | $59,167 | $24 |
| Monthly Housing Costs | $511 | $6 |
| Real Estate Taxes | $1,112 | $0 |
Property Value by Mortgage Status in Tremont borough
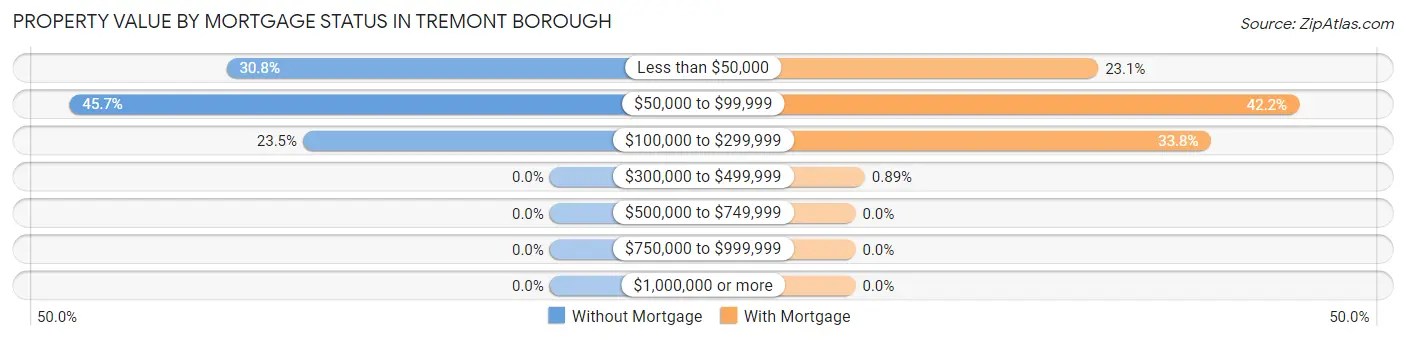
| Property Value | Without Mortgage | With Mortgage |
| Less than $50,000 | 72 (30.8%) | 52 (23.1%) |
| $50,000 to $99,999 | 107 (45.7%) | 95 (42.2%) |
| $100,000 to $299,999 | 55 (23.5%) | 76 (33.8%) |
| $300,000 to $499,999 | 0 (0.0%) | 2 (0.9%) |
| $500,000 to $749,999 | 0 (0.0%) | 0 (0.0%) |
| $750,000 to $999,999 | 0 (0.0%) | 0 (0.0%) |
| $1,000,000 or more | 0 (0.0%) | 0 (0.0%) |
| Total | 234 (100.0%) | 225 (100.0%) |
Household Income by Mortgage Status in Tremont borough
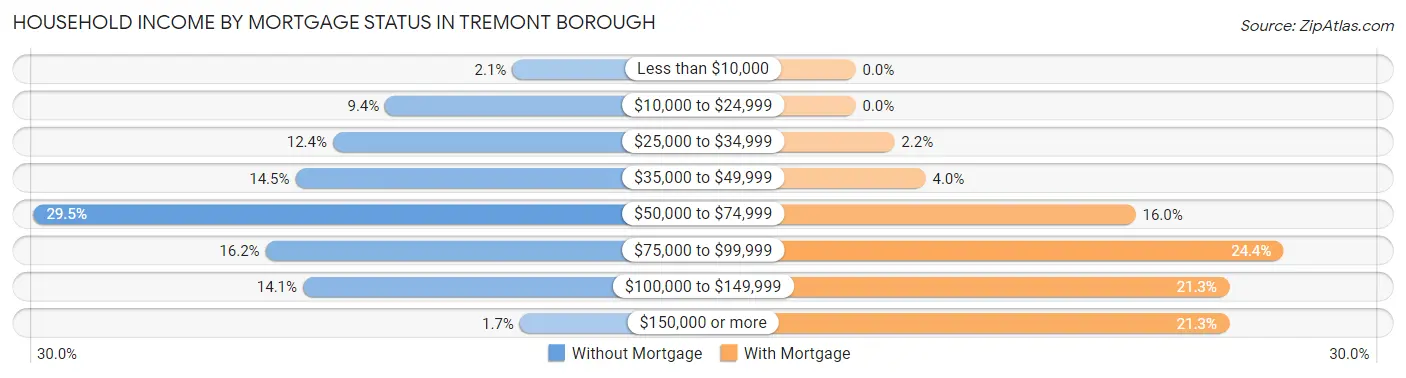
| Household Income | Without Mortgage | With Mortgage |
| Less than $10,000 | 5 (2.1%) | 0 (0.0%) |
| $10,000 to $24,999 | 22 (9.4%) | 0 (0.0%) |
| $25,000 to $34,999 | 29 (12.4%) | 5 (2.2%) |
| $35,000 to $49,999 | 34 (14.5%) | 9 (4.0%) |
| $50,000 to $74,999 | 69 (29.5%) | 36 (16.0%) |
| $75,000 to $99,999 | 38 (16.2%) | 55 (24.4%) |
| $100,000 to $149,999 | 33 (14.1%) | 48 (21.3%) |
| $150,000 or more | 4 (1.7%) | 48 (21.3%) |
| Total | 234 (100.0%) | 225 (100.0%) |
Property Value to Household Income Ratio in Tremont borough
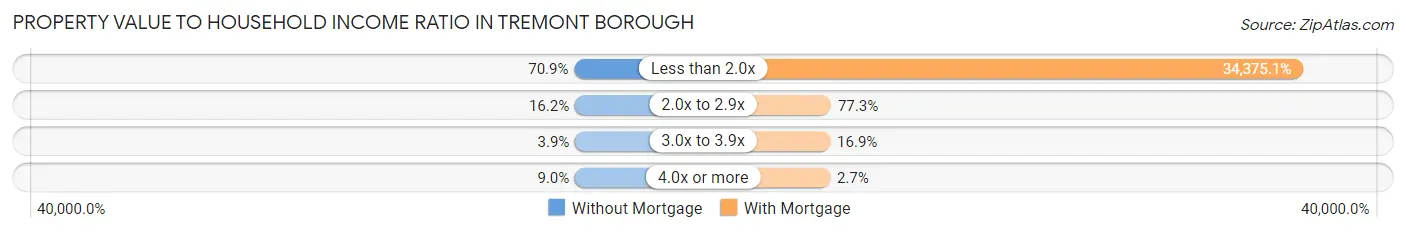
| Value-to-Income Ratio | Without Mortgage | With Mortgage |
| Less than 2.0x | 166 (70.9%) | 77,344 (34,375.1%) |
| 2.0x to 2.9x | 38 (16.2%) | 174 (77.3%) |
| 3.0x to 3.9x | 9 (3.8%) | 38 (16.9%) |
| 4.0x or more | 21 (9.0%) | 6 (2.7%) |
| Total | 234 (100.0%) | 225 (100.0%) |
Real Estate Taxes by Mortgage Status in Tremont borough
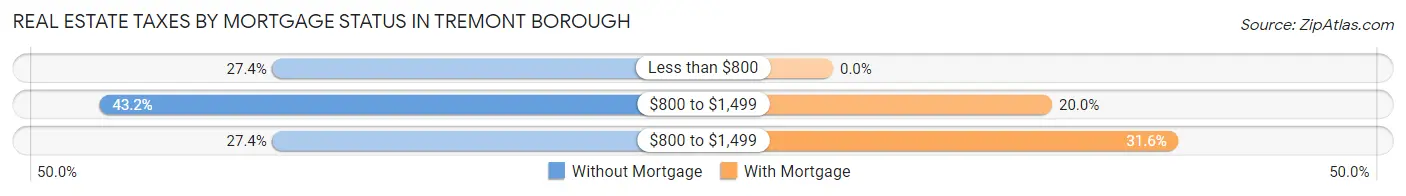
| Property Taxes | Without Mortgage | With Mortgage |
| Less than $800 | 64 (27.4%) | 0 (0.0%) |
| $800 to $1,499 | 101 (43.2%) | 45 (20.0%) |
| $800 to $1,499 | 64 (27.4%) | 71 (31.6%) |
| Total | 234 (100.0%) | 225 (100.0%) |
Health & Disability in Tremont borough
Health Insurance Coverage by Age in Tremont borough
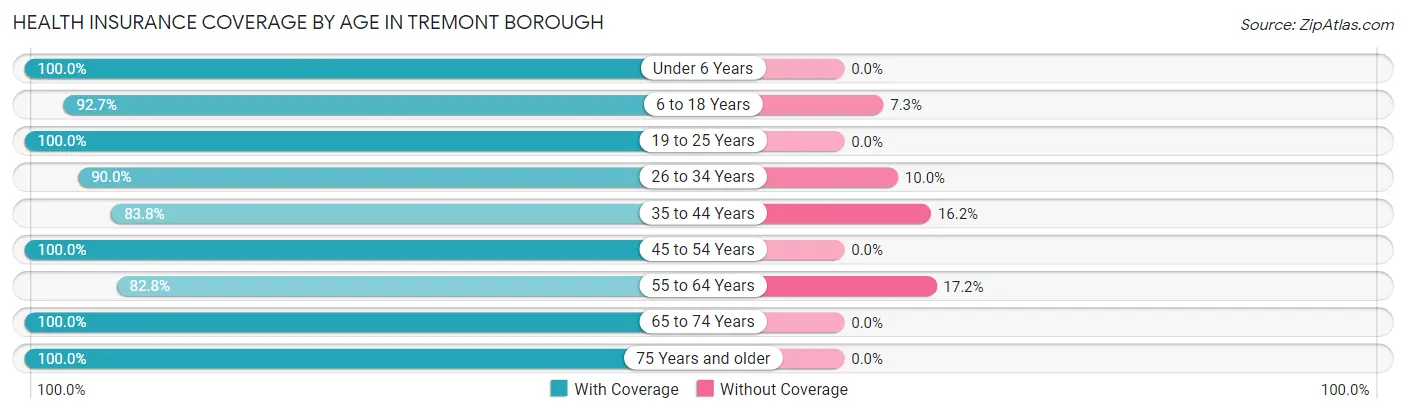
| Age Bracket | With Coverage | Without Coverage |
| Under 6 Years | 96 (100.0%) | 0 (0.0%) |
| 6 to 18 Years | 255 (92.7%) | 20 (7.3%) |
| 19 to 25 Years | 78 (100.0%) | 0 (0.0%) |
| 26 to 34 Years | 198 (90.0%) | 22 (10.0%) |
| 35 to 44 Years | 166 (83.8%) | 32 (16.2%) |
| 45 to 54 Years | 196 (100.0%) | 0 (0.0%) |
| 55 to 64 Years | 164 (82.8%) | 34 (17.2%) |
| 65 to 74 Years | 118 (100.0%) | 0 (0.0%) |
| 75 Years and older | 114 (100.0%) | 0 (0.0%) |
| Total | 1,385 (92.8%) | 108 (7.2%) |
Health Insurance Coverage by Citizenship Status in Tremont borough
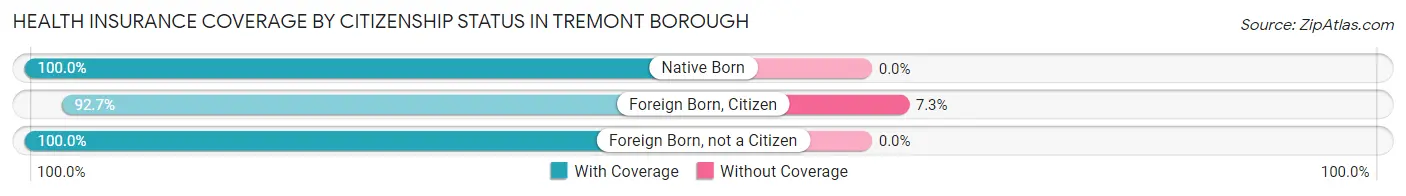
| Citizenship Status | With Coverage | Without Coverage |
| Native Born | 96 (100.0%) | 0 (0.0%) |
| Foreign Born, Citizen | 255 (92.7%) | 20 (7.3%) |
| Foreign Born, not a Citizen | 78 (100.0%) | 0 (0.0%) |
Health Insurance Coverage by Household Income in Tremont borough
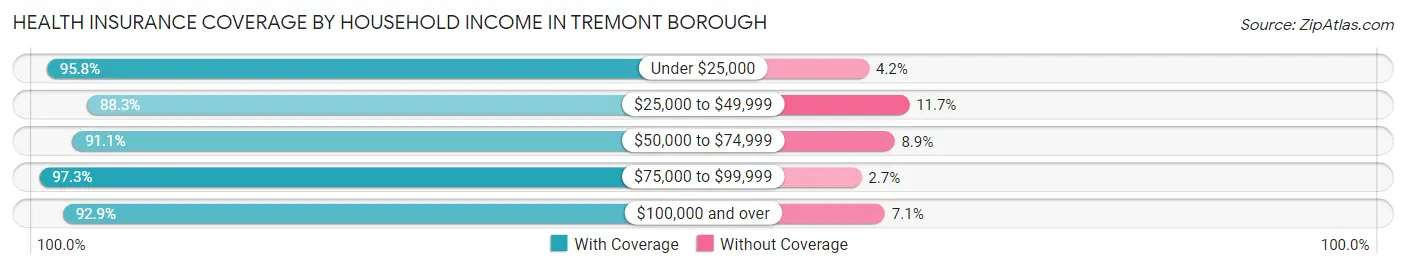
| Household Income | With Coverage | Without Coverage |
| Under $25,000 | 92 (95.8%) | 4 (4.2%) |
| $25,000 to $49,999 | 287 (88.3%) | 38 (11.7%) |
| $50,000 to $74,999 | 306 (91.1%) | 30 (8.9%) |
| $75,000 to $99,999 | 355 (97.3%) | 10 (2.7%) |
| $100,000 and over | 338 (92.9%) | 26 (7.1%) |
Public vs Private Health Insurance Coverage by Age in Tremont borough
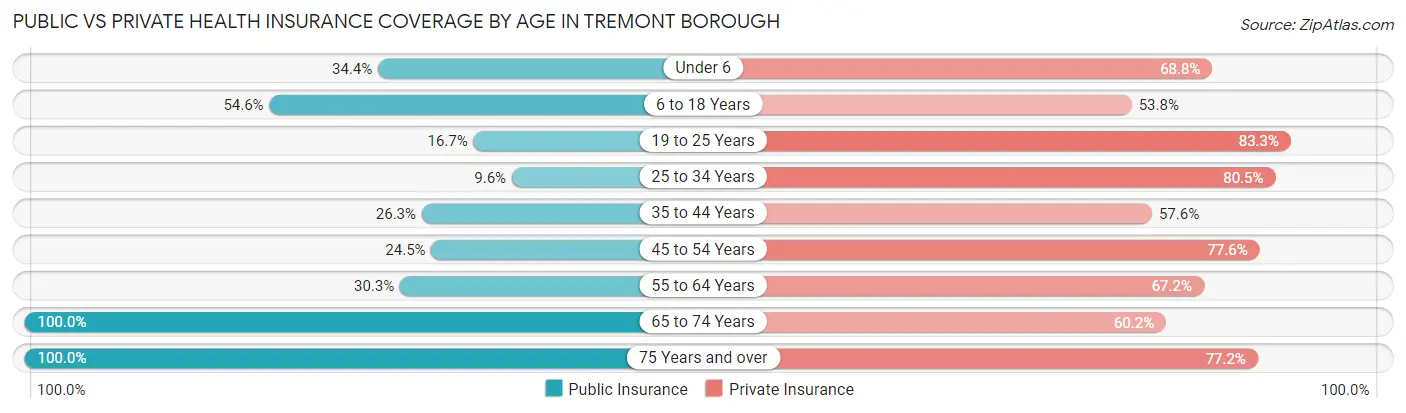
| Age Bracket | Public Insurance | Private Insurance |
| Under 6 | 33 (34.4%) | 66 (68.8%) |
| 6 to 18 Years | 150 (54.5%) | 148 (53.8%) |
| 19 to 25 Years | 13 (16.7%) | 65 (83.3%) |
| 25 to 34 Years | 21 (9.6%) | 177 (80.4%) |
| 35 to 44 Years | 52 (26.3%) | 114 (57.6%) |
| 45 to 54 Years | 48 (24.5%) | 152 (77.5%) |
| 55 to 64 Years | 60 (30.3%) | 133 (67.2%) |
| 65 to 74 Years | 118 (100.0%) | 71 (60.2%) |
| 75 Years and over | 114 (100.0%) | 88 (77.2%) |
| Total | 609 (40.8%) | 1,014 (67.9%) |
Disability Status by Sex by Age in Tremont borough
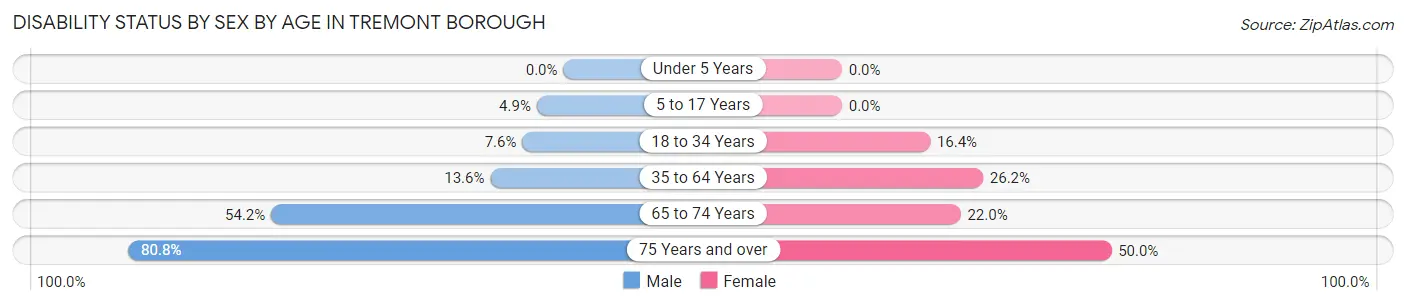
| Age Bracket | Male | Female |
| Under 5 Years | 0 (0.0%) | 0 (0.0%) |
| 5 to 17 Years | 8 (4.9%) | 0 (0.0%) |
| 18 to 34 Years | 16 (7.6%) | 18 (16.4%) |
| 35 to 64 Years | 43 (13.6%) | 72 (26.2%) |
| 65 to 74 Years | 32 (54.2%) | 13 (22.0%) |
| 75 Years and over | 42 (80.8%) | 31 (50.0%) |
Disability Class by Sex by Age in Tremont borough
Disability Class: Hearing Difficulty
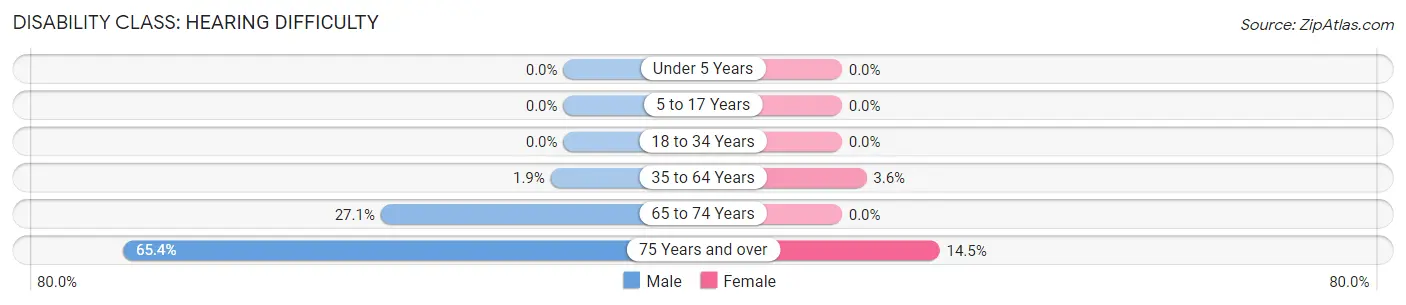
| Age Bracket | Male | Female |
| Under 5 Years | 0 (0.0%) | 0 (0.0%) |
| 5 to 17 Years | 0 (0.0%) | 0 (0.0%) |
| 18 to 34 Years | 0 (0.0%) | 0 (0.0%) |
| 35 to 64 Years | 6 (1.9%) | 10 (3.6%) |
| 65 to 74 Years | 16 (27.1%) | 0 (0.0%) |
| 75 Years and over | 34 (65.4%) | 9 (14.5%) |
Disability Class: Vision Difficulty
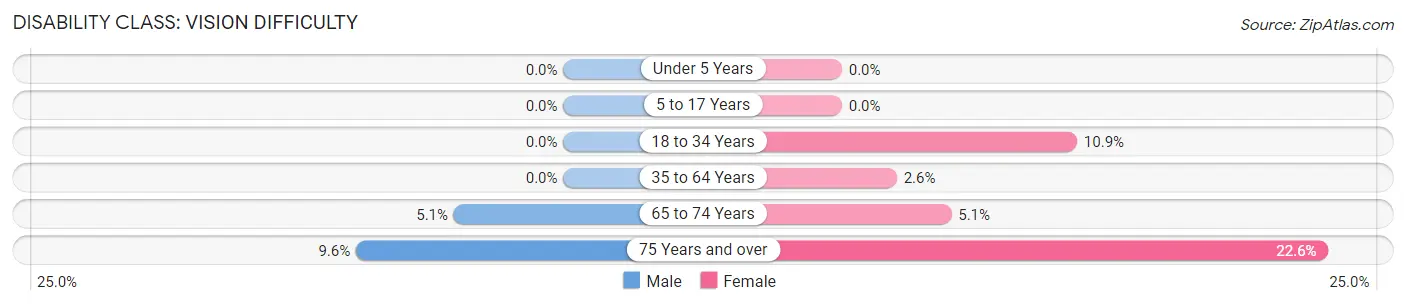
| Age Bracket | Male | Female |
| Under 5 Years | 0 (0.0%) | 0 (0.0%) |
| 5 to 17 Years | 0 (0.0%) | 0 (0.0%) |
| 18 to 34 Years | 0 (0.0%) | 12 (10.9%) |
| 35 to 64 Years | 0 (0.0%) | 7 (2.5%) |
| 65 to 74 Years | 3 (5.1%) | 3 (5.1%) |
| 75 Years and over | 5 (9.6%) | 14 (22.6%) |
Disability Class: Cognitive Difficulty
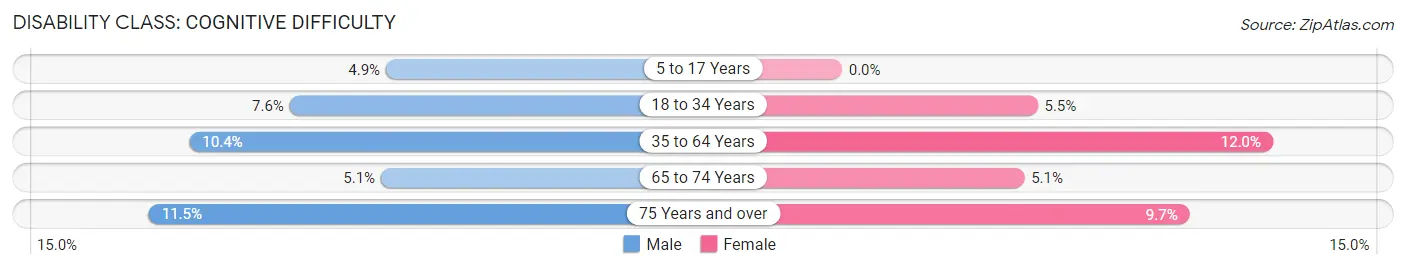
| Age Bracket | Male | Female |
| 5 to 17 Years | 8 (4.9%) | 0 (0.0%) |
| 18 to 34 Years | 16 (7.6%) | 6 (5.4%) |
| 35 to 64 Years | 33 (10.4%) | 33 (12.0%) |
| 65 to 74 Years | 3 (5.1%) | 3 (5.1%) |
| 75 Years and over | 6 (11.5%) | 6 (9.7%) |
Disability Class: Ambulatory Difficulty
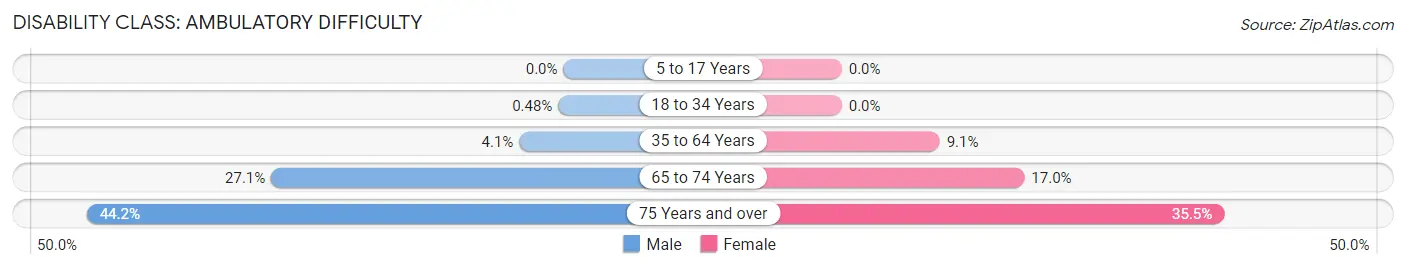
| Age Bracket | Male | Female |
| 5 to 17 Years | 0 (0.0%) | 0 (0.0%) |
| 18 to 34 Years | 1 (0.5%) | 0 (0.0%) |
| 35 to 64 Years | 13 (4.1%) | 25 (9.1%) |
| 65 to 74 Years | 16 (27.1%) | 10 (17.0%) |
| 75 Years and over | 23 (44.2%) | 22 (35.5%) |
Disability Class: Self-Care Difficulty
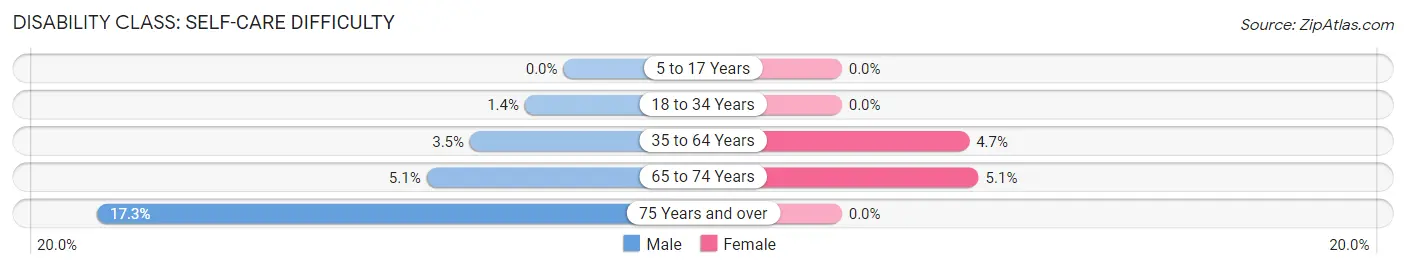
| Age Bracket | Male | Female |
| 5 to 17 Years | 0 (0.0%) | 0 (0.0%) |
| 18 to 34 Years | 3 (1.4%) | 0 (0.0%) |
| 35 to 64 Years | 11 (3.5%) | 13 (4.7%) |
| 65 to 74 Years | 3 (5.1%) | 3 (5.1%) |
| 75 Years and over | 9 (17.3%) | 0 (0.0%) |
Technology Access in Tremont borough
Computing Device Access in Tremont borough
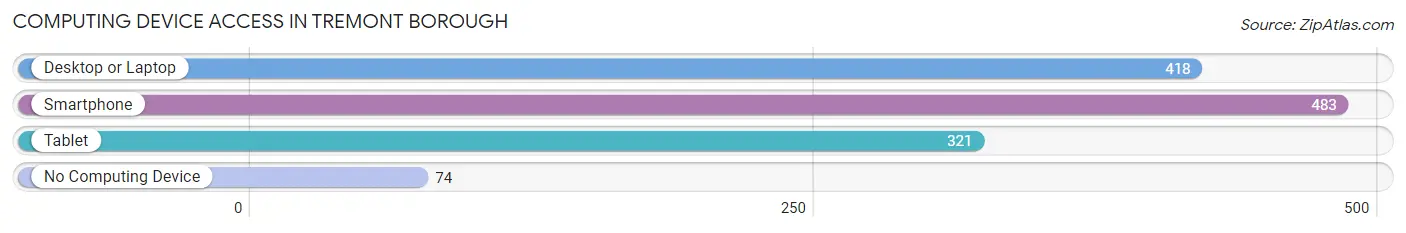
| Device Type | # Households | % Households |
| Desktop or Laptop | 418 | 69.6% |
| Smartphone | 483 | 80.4% |
| Tablet | 321 | 53.4% |
| No Computing Device | 74 | 12.3% |
| Total | 601 | 100.0% |
Internet Access in Tremont borough
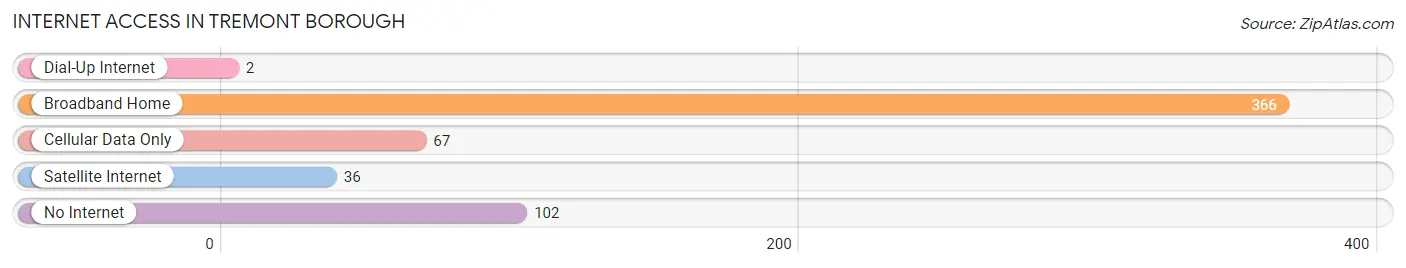
| Internet Type | # Households | % Households |
| Dial-Up Internet | 2 | 0.3% |
| Broadband Home | 366 | 60.9% |
| Cellular Data Only | 67 | 11.2% |
| Satellite Internet | 36 | 6.0% |
| No Internet | 102 | 17.0% |
| Total | 601 | 100.0% |
Tremont borough Summary
Tremont Borough is a small borough located in Schuylkill County, Pennsylvania. It is situated in the southern part of the county, approximately five miles south of Pottsville. The borough is surrounded by West Brunswick Township, East Brunswick Township, and Pine Grove Township. According to the 2010 census, the population of Tremont Borough was 1,817.
History
Tremont Borough was founded in 1845 by a group of German immigrants. The name of the borough is derived from the Latin phrase “tres montes”, which means “three mountains”. This is in reference to the three mountains that surround the borough. The first settlers of the area were mostly farmers and miners. The first post office was established in 1848.
In the late 19th century, the borough experienced a period of growth and development. The first school was built in 1876, and the first church was built in 1877. The first bank was established in 1883. The first newspaper, the Tremont Times, was established in 1885.
In the early 20th century, the borough continued to grow and develop. The first fire company was established in 1906, and the first library was established in 1908. The first hospital was established in 1910.
Geography
Tremont Borough is located in the southern part of Schuylkill County, approximately five miles south of Pottsville. The borough is situated in the Appalachian Mountains, and is surrounded by West Brunswick Township, East Brunswick Township, and Pine Grove Township. The borough is located at an elevation of 1,068 feet above sea level.
The borough has a total area of 0.7 square miles, all of which is land. The borough is located in the Schuylkill River watershed. The climate is classified as humid continental, with cold winters and hot, humid summers.
Economy
The economy of Tremont Borough is largely based on agriculture and tourism. The borough is home to several farms, which produce a variety of crops, including corn, soybeans, hay, and wheat. The borough is also home to several tourist attractions, including the historic Tremont Hotel, the Tremont Opera House, and the Tremont Historical Society Museum.
Demographics
According to the 2010 census, the population of Tremont Borough was 1,817. The racial makeup of the borough was 97.3% White, 0.7% African American, 0.2% Native American, 0.3% Asian, 0.2% from other races, and 1.3% from two or more races. Hispanic or Latino of any race were 1.2% of the population.
The median household income in Tremont Borough was $41,250, and the median family income was $48,750. The per capita income was $20,945. About 11.2% of families and 13.2% of the population were below the poverty line, including 17.2% of those under age 18 and 8.2% of those age 65 or over.
Common Questions
What is Per Capita Income in Tremont borough?
Per Capita income in Tremont borough is $29,644.
What is the Median Family Income in Tremont borough?
Median Family Income in Tremont borough is $72,344.
What is the Median Household income in Tremont borough?
Median Household Income in Tremont borough is $59,181.
What is Income or Wage Gap in Tremont borough?
Income or Wage Gap in Tremont borough is 25.5%.
Women in Tremont borough earn 74.5 cents for every dollar earned by a man.
What is Inequality or Gini Index in Tremont borough?
Inequality or Gini Index in Tremont borough is 0.34.
What is the Total Population of Tremont borough?
Total Population of Tremont borough is 1,679.
What is the Total Male Population of Tremont borough?
Total Male Population of Tremont borough is 928.
What is the Total Female Population of Tremont borough?
Total Female Population of Tremont borough is 751.
What is the Ratio of Males per 100 Females in Tremont borough?
There are 123.57 Males per 100 Females in Tremont borough.
What is the Ratio of Females per 100 Males in Tremont borough?
There are 80.93 Females per 100 Males in Tremont borough.
What is the Median Population Age in Tremont borough?
Median Population Age in Tremont borough is 43.5 Years.
What is the Average Family Size in Tremont borough
Average Family Size in Tremont borough is 2.9 People.
What is the Average Household Size in Tremont borough
Average Household Size in Tremont borough is 2.5 People.
How Large is the Labor Force in Tremont borough?
There are 778 People in the Labor Forcein in Tremont borough.
What is the Percentage of People in the Labor Force in Tremont borough?
56.6% of People are in the Labor Force in Tremont borough.
What is the Unemployment Rate in Tremont borough?
Unemployment Rate in Tremont borough is 3.1%.