Belle Vernon borough, PA Map & Demographics
Belle Vernon borough Overview
$44,974
PER CAPITA INCOME
$73,438
AVG FAMILY INCOME
$39,007
AVG HOUSEHOLD INCOME
39.5%
WAGE / INCOME GAP [ % ]
60.5¢/ $1
WAGE / INCOME GAP [ $ ]
0.57
INEQUALITY / GINI INDEX
803
TOTAL POPULATION
370
MALE POPULATION
433
FEMALE POPULATION
85.45
MALES / 100 FEMALES
117.03
FEMALES / 100 MALES
52.4
MEDIAN AGE
2.5
AVG FAMILY SIZE
1.6
AVG HOUSEHOLD SIZE
426
LABOR FORCE [ PEOPLE ]
58.4%
PERCENT IN LABOR FORCE
9.4%
UNEMPLOYMENT RATE
Income in Belle Vernon borough
Income Overview in Belle Vernon borough
Per Capita Income in Belle Vernon borough is $44,974, while median incomes of families and households are $73,438 and $39,007 respectively.
| Characteristic | Number | Measure |
| Per Capita Income | 803 | $44,974 |
| Median Family Income | 164 | $73,438 |
| Mean Family Income | 164 | $137,435 |
| Median Household Income | 515 | $39,007 |
| Mean Household Income | 515 | $70,807 |
| Income Deficit | 164 | $0 |
| Wage / Income Gap (%) | 803 | 39.49% |
| Wage / Income Gap ($) | 803 | 60.51¢ per $1 |
| Gini / Inequality Index | 803 | 0.57 |
Earnings by Sex in Belle Vernon borough
Average Earnings in Belle Vernon borough are $40,893, $55,000 for men and $33,281 for women, a difference of 39.5%.
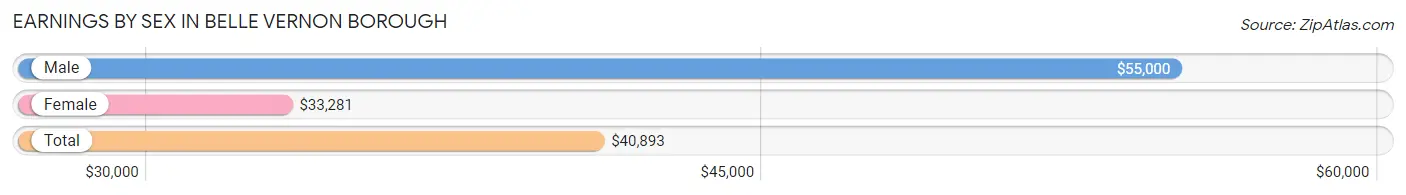
| Sex | Number | Average Earnings |
| Male | 242 (57.1%) | $55,000 |
| Female | 182 (42.9%) | $33,281 |
| Total | 424 (100.0%) | $40,893 |
Earnings by Sex by Income Bracket in Belle Vernon borough
The most common earnings brackets in Belle Vernon borough are $55,000 to $64,999 for men (49 | 20.3%) and $30,000 to $34,999 for women (41 | 22.5%).
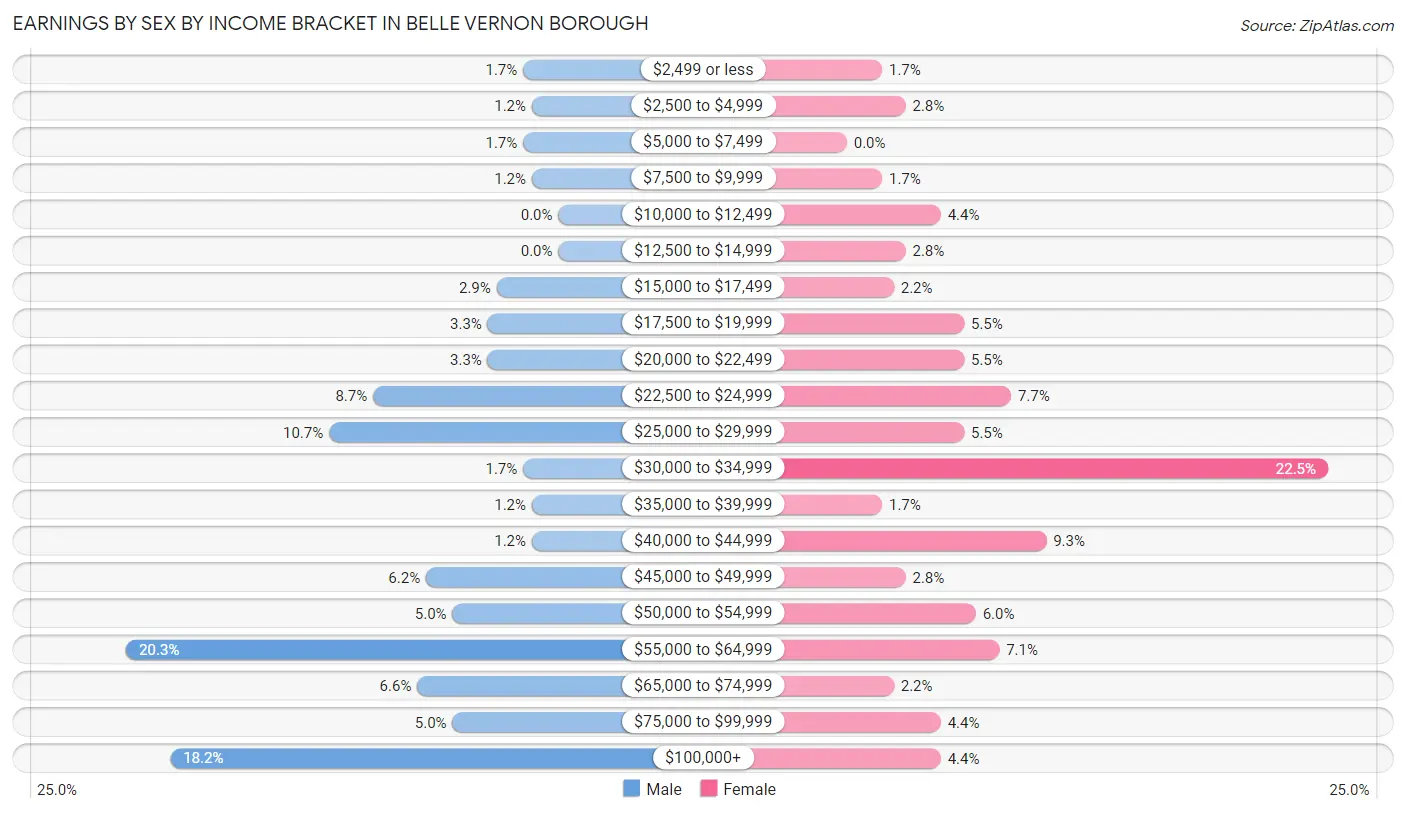
| Income | Male | Female |
| $2,499 or less | 4 (1.7%) | 3 (1.7%) |
| $2,500 to $4,999 | 3 (1.2%) | 5 (2.8%) |
| $5,000 to $7,499 | 4 (1.7%) | 0 (0.0%) |
| $7,500 to $9,999 | 3 (1.2%) | 3 (1.7%) |
| $10,000 to $12,499 | 0 (0.0%) | 8 (4.4%) |
| $12,500 to $14,999 | 0 (0.0%) | 5 (2.8%) |
| $15,000 to $17,499 | 7 (2.9%) | 4 (2.2%) |
| $17,500 to $19,999 | 8 (3.3%) | 10 (5.5%) |
| $20,000 to $22,499 | 8 (3.3%) | 10 (5.5%) |
| $22,500 to $24,999 | 21 (8.7%) | 14 (7.7%) |
| $25,000 to $29,999 | 26 (10.7%) | 10 (5.5%) |
| $30,000 to $34,999 | 4 (1.7%) | 41 (22.5%) |
| $35,000 to $39,999 | 3 (1.2%) | 3 (1.7%) |
| $40,000 to $44,999 | 3 (1.2%) | 17 (9.3%) |
| $45,000 to $49,999 | 15 (6.2%) | 5 (2.8%) |
| $50,000 to $54,999 | 12 (5.0%) | 11 (6.0%) |
| $55,000 to $64,999 | 49 (20.3%) | 13 (7.1%) |
| $65,000 to $74,999 | 16 (6.6%) | 4 (2.2%) |
| $75,000 to $99,999 | 12 (5.0%) | 8 (4.4%) |
| $100,000+ | 44 (18.2%) | 8 (4.4%) |
| Total | 242 (100.0%) | 182 (100.0%) |
Earnings by Sex by Educational Attainment in Belle Vernon borough
Average earnings in Belle Vernon borough are $55,577 for men and $33,906 for women, a difference of 39.0%. Men with an educational attainment of high school diploma enjoy the highest average annual earnings of $57,381, while those with college or associate's degree education earn the least with $24,821. Women with an educational attainment of bachelor's degree earn the most with the average annual earnings of $53,750, while those with college or associate's degree education have the smallest earnings of $32,250.
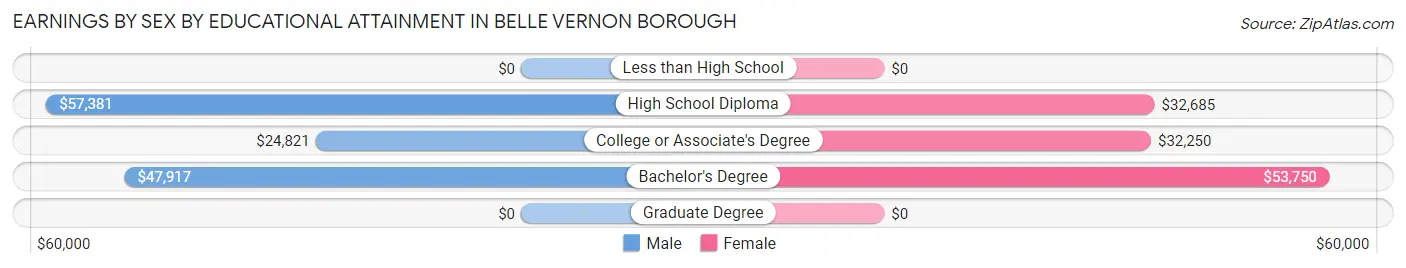
| Educational Attainment | Male Income | Female Income |
| Less than High School | - | - |
| High School Diploma | $57,381 | $32,685 |
| College or Associate's Degree | $24,821 | $32,250 |
| Bachelor's Degree | $47,917 | $53,750 |
| Graduate Degree | - | - |
| Total | $55,577 | $33,906 |
Family Income in Belle Vernon borough
Family Income Brackets in Belle Vernon borough
According to the Belle Vernon borough family income data, there are 40 families falling into the $50,000 to $74,999 income range, which is the most common income bracket and makes up 24.4% of all families.
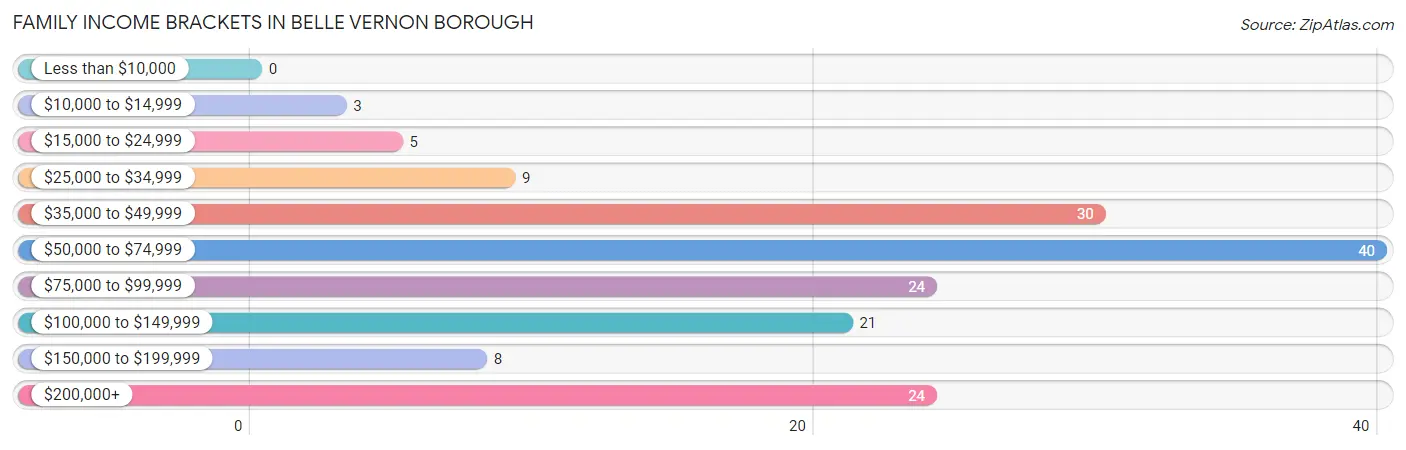
| Income Bracket | # Families | % Families |
| Less than $10,000 | 0 | 0.0% |
| $10,000 to $14,999 | 3 | 1.8% |
| $15,000 to $24,999 | 5 | 3.0% |
| $25,000 to $34,999 | 9 | 5.5% |
| $35,000 to $49,999 | 30 | 18.3% |
| $50,000 to $74,999 | 40 | 24.4% |
| $75,000 to $99,999 | 24 | 14.6% |
| $100,000 to $149,999 | 21 | 12.8% |
| $150,000 to $199,999 | 8 | 4.9% |
| $200,000+ | 24 | 14.6% |
Family Income by Famaliy Size in Belle Vernon borough
3-person families (41 | 25.0%) account for the highest median family income in Belle Vernon borough with $83,646 per family, while 2-person families (106 | 64.6%) have the highest median income of $30,125 per family member.
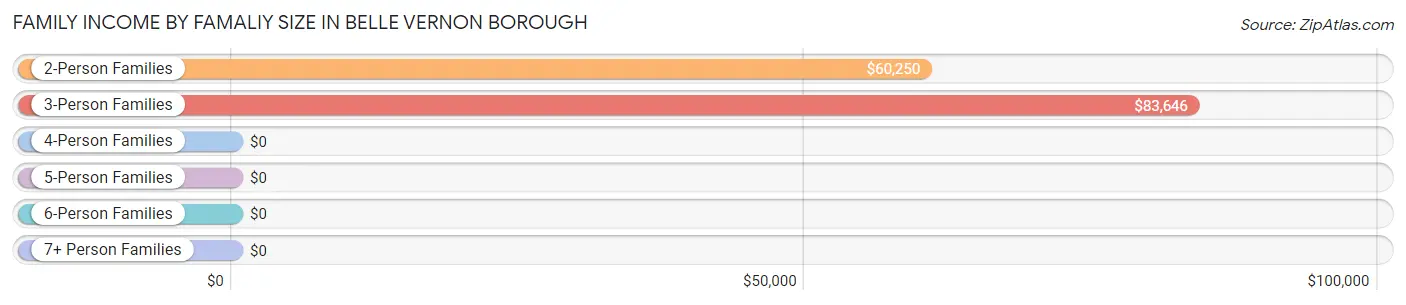
| Income Bracket | # Families | Median Income |
| 2-Person Families | 106 (64.6%) | $60,250 |
| 3-Person Families | 41 (25.0%) | $83,646 |
| 4-Person Families | 7 (4.3%) | $0 |
| 5-Person Families | 5 (3.0%) | $0 |
| 6-Person Families | 5 (3.0%) | $0 |
| 7+ Person Families | 0 (0.0%) | $0 |
| Total | 164 (100.0%) | $73,438 |
Family Income by Number of Earners in Belle Vernon borough
The median family income in Belle Vernon borough is $73,438, with families comprising 3+ earners (18) having the highest median family income of $171,250, while families with no earners (28) have the lowest median family income of $38,333, accounting for 11.0% and 17.1% of families, respectively.
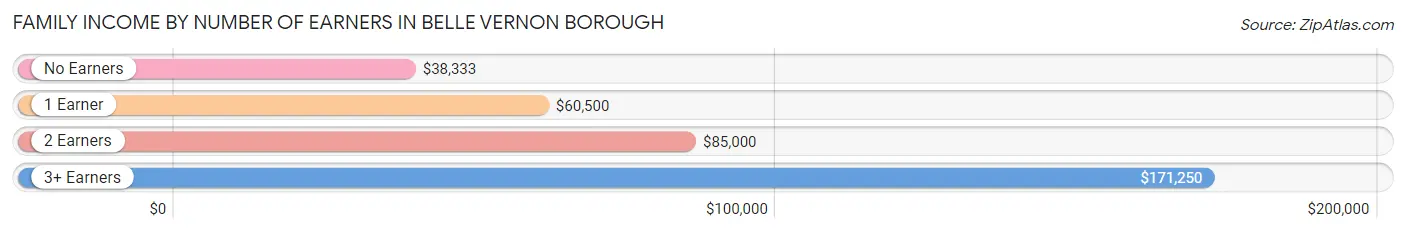
| Number of Earners | # Families | Median Income |
| No Earners | 28 (17.1%) | $38,333 |
| 1 Earner | 46 (28.1%) | $60,500 |
| 2 Earners | 72 (43.9%) | $85,000 |
| 3+ Earners | 18 (11.0%) | $171,250 |
| Total | 164 (100.0%) | $73,438 |
Household Income in Belle Vernon borough
Household Income Brackets in Belle Vernon borough
With 85 households falling in the category, the $15,000 to $24,999 income range is the most frequent in Belle Vernon borough, accounting for 16.5% of all households. In contrast, only 19 households (3.7%) fall into the $150,000 to $199,999 income bracket, making it the least populous group.
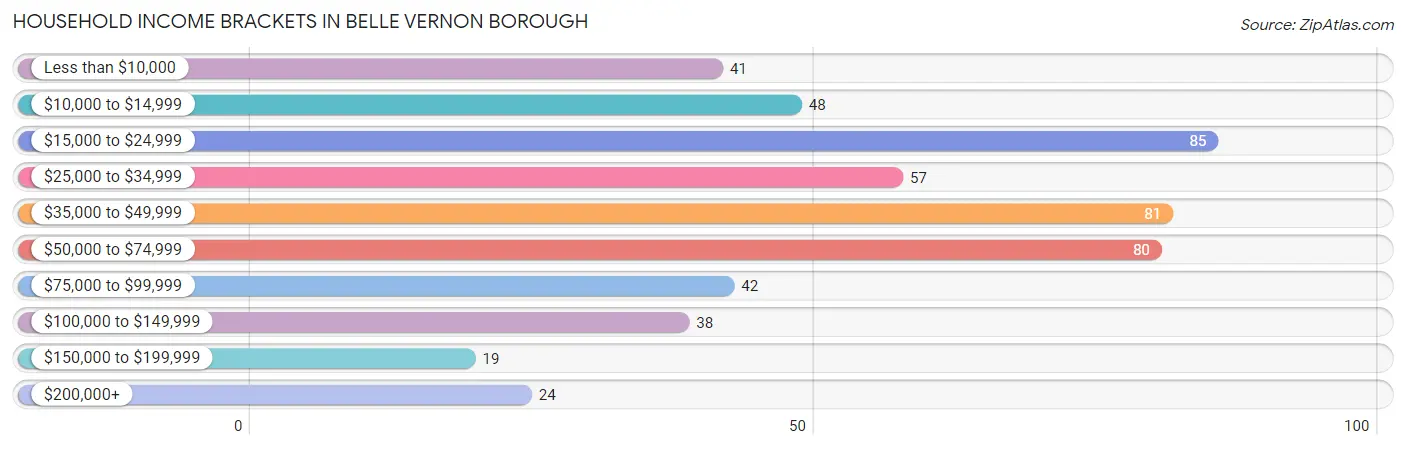
| Income Bracket | # Households | % Households |
| Less than $10,000 | 41 | 8.0% |
| $10,000 to $14,999 | 48 | 9.3% |
| $15,000 to $24,999 | 85 | 16.5% |
| $25,000 to $34,999 | 57 | 11.1% |
| $35,000 to $49,999 | 81 | 15.7% |
| $50,000 to $74,999 | 80 | 15.5% |
| $75,000 to $99,999 | 42 | 8.2% |
| $100,000 to $149,999 | 38 | 7.4% |
| $150,000 to $199,999 | 19 | 3.7% |
| $200,000+ | 24 | 4.7% |
Household Income by Householder Age in Belle Vernon borough
The median household income in Belle Vernon borough is $39,007, with the highest median household income of $57,000 found in the 25 to 44 years age bracket for the primary householder. A total of 152 households (29.5%) fall into this category.
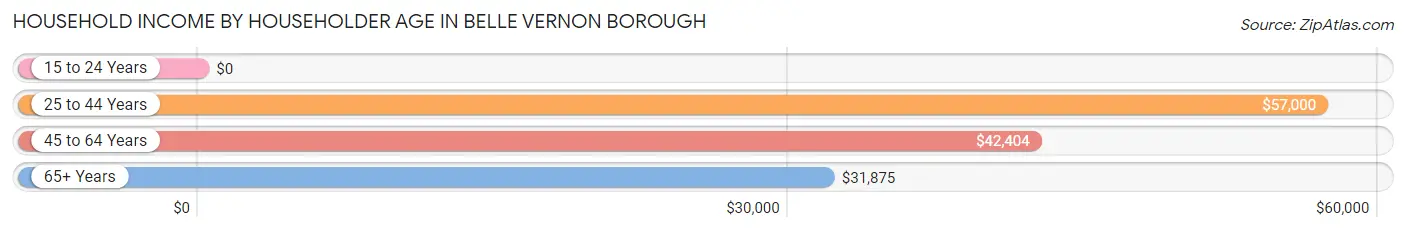
| Income Bracket | # Households | Median Income |
| 15 to 24 Years | 0 (0.0%) | $0 |
| 25 to 44 Years | 152 (29.5%) | $57,000 |
| 45 to 64 Years | 161 (31.3%) | $42,404 |
| 65+ Years | 202 (39.2%) | $31,875 |
| Total | 515 (100.0%) | $39,007 |
Poverty in Belle Vernon borough
Income Below Poverty by Sex and Age in Belle Vernon borough
With 5.7% poverty level for males and 21.7% for females among the residents of Belle Vernon borough, 55 to 64 year old males and 35 to 44 year old females are the most vulnerable to poverty, with 17 males (23.0%) and 15 females (36.6%) in their respective age groups living below the poverty level.
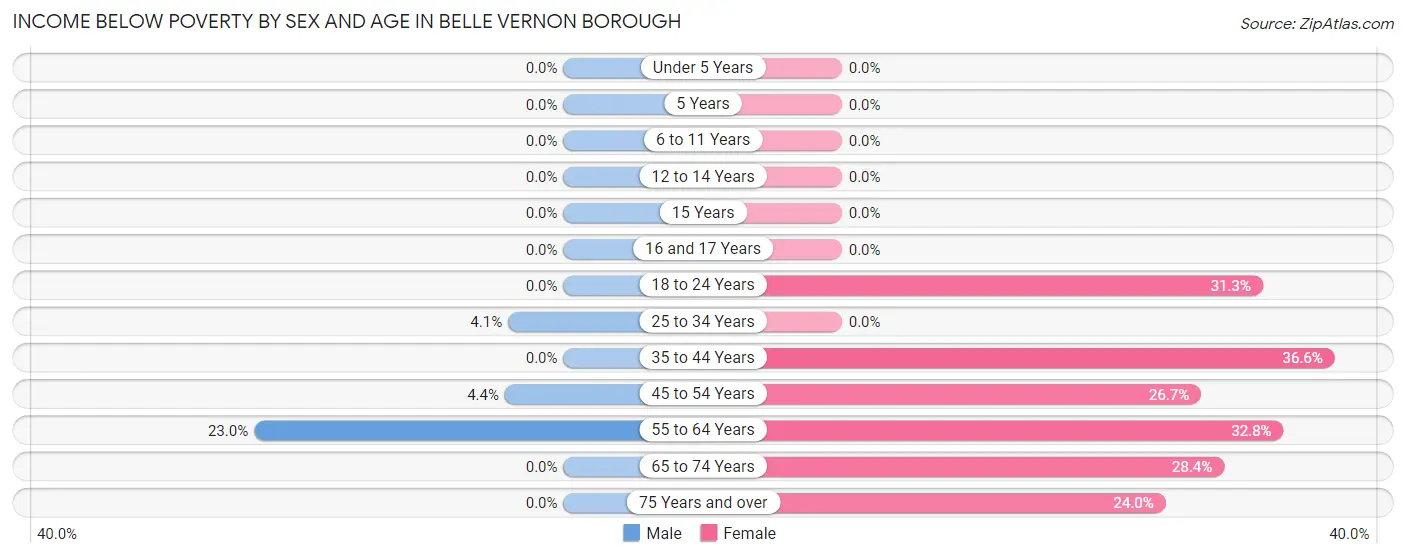
| Age Bracket | Male | Female |
| Under 5 Years | 0 (0.0%) | 0 (0.0%) |
| 5 Years | 0 (0.0%) | 0 (0.0%) |
| 6 to 11 Years | 0 (0.0%) | 0 (0.0%) |
| 12 to 14 Years | 0 (0.0%) | 0 (0.0%) |
| 15 Years | 0 (0.0%) | 0 (0.0%) |
| 16 and 17 Years | 0 (0.0%) | 0 (0.0%) |
| 18 to 24 Years | 0 (0.0%) | 5 (31.2%) |
| 25 to 34 Years | 3 (4.1%) | 0 (0.0%) |
| 35 to 44 Years | 0 (0.0%) | 15 (36.6%) |
| 45 to 54 Years | 1 (4.3%) | 8 (26.7%) |
| 55 to 64 Years | 17 (23.0%) | 20 (32.8%) |
| 65 to 74 Years | 0 (0.0%) | 21 (28.4%) |
| 75 Years and over | 0 (0.0%) | 25 (24.0%) |
| Total | 21 (5.7%) | 94 (21.7%) |
Income Above Poverty by Sex and Age in Belle Vernon borough
According to the poverty statistics in Belle Vernon borough, males aged under 5 years and females aged under 5 years are the age groups that are most secure financially, with 100.0% of males and 100.0% of females in these age groups living above the poverty line.
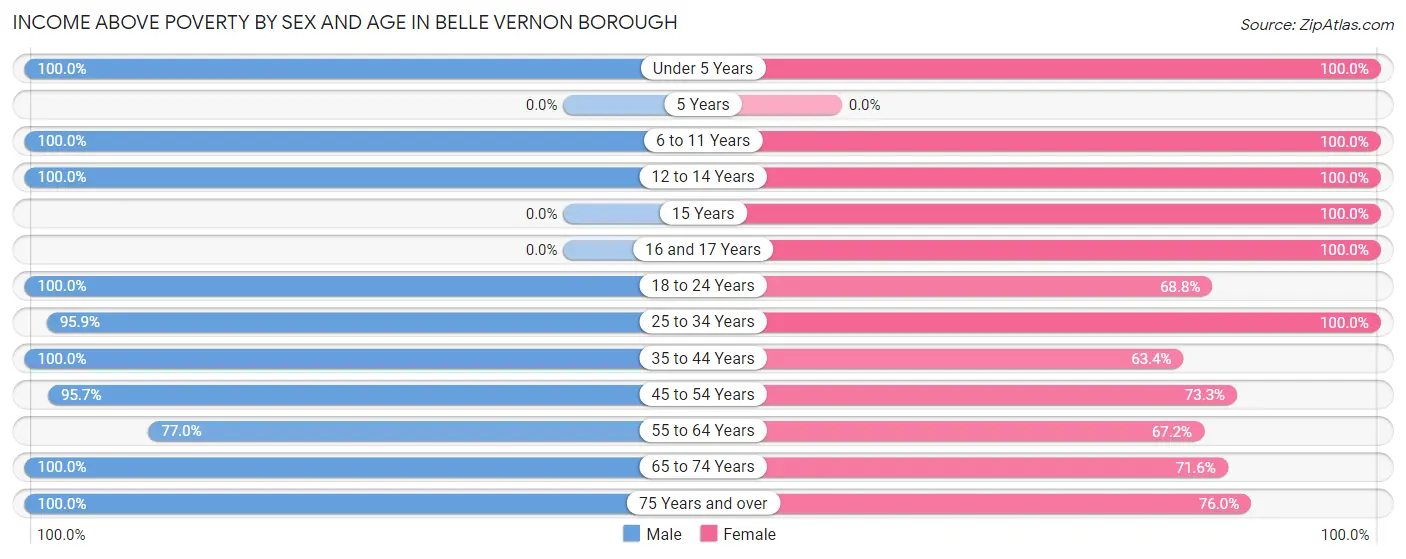
| Age Bracket | Male | Female |
| Under 5 Years | 19 (100.0%) | 19 (100.0%) |
| 5 Years | 0 (0.0%) | 0 (0.0%) |
| 6 to 11 Years | 3 (100.0%) | 1 (100.0%) |
| 12 to 14 Years | 15 (100.0%) | 12 (100.0%) |
| 15 Years | 0 (0.0%) | 4 (100.0%) |
| 16 and 17 Years | 0 (0.0%) | 4 (100.0%) |
| 18 to 24 Years | 21 (100.0%) | 11 (68.8%) |
| 25 to 34 Years | 70 (95.9%) | 67 (100.0%) |
| 35 to 44 Years | 67 (100.0%) | 26 (63.4%) |
| 45 to 54 Years | 22 (95.7%) | 22 (73.3%) |
| 55 to 64 Years | 57 (77.0%) | 41 (67.2%) |
| 65 to 74 Years | 41 (100.0%) | 53 (71.6%) |
| 75 Years and over | 34 (100.0%) | 79 (76.0%) |
| Total | 349 (94.3%) | 339 (78.3%) |
Income Below Poverty Among Married-Couple Families in Belle Vernon borough
The poverty statistics for married-couple families in Belle Vernon borough show that 3.2% or 3 of the total 94 families live below the poverty line. Families with no children have the highest poverty rate of 4.0%, comprising of 3 families. On the other hand, families with 1 or 2 children have the lowest poverty rate of 0.0%, which includes 0 families.
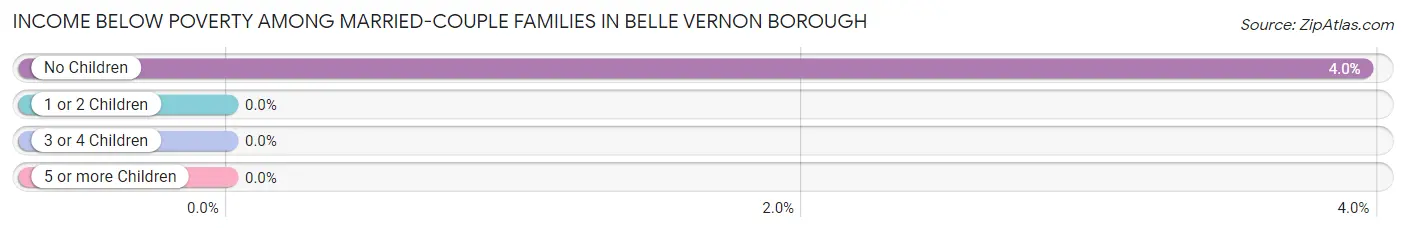
| Children | Above Poverty | Below Poverty |
| No Children | 73 (96.1%) | 3 (4.0%) |
| 1 or 2 Children | 16 (100.0%) | 0 (0.0%) |
| 3 or 4 Children | 2 (100.0%) | 0 (0.0%) |
| 5 or more Children | 0 (0.0%) | 0 (0.0%) |
| Total | 91 (96.8%) | 3 (3.2%) |
Income Below Poverty Among Single-Parent Households in Belle Vernon borough
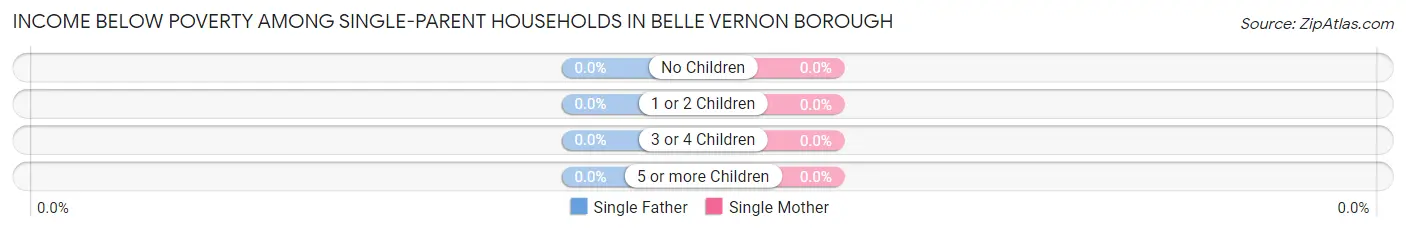
| Children | Single Father | Single Mother |
| No Children | 0 (0.0%) | 0 (0.0%) |
| 1 or 2 Children | 0 (0.0%) | 0 (0.0%) |
| 3 or 4 Children | 0 (0.0%) | 0 (0.0%) |
| 5 or more Children | 0 (0.0%) | 0 (0.0%) |
| Total | 0 (0.0%) | 0 (0.0%) |
Income Below Poverty Among Married-Couple vs Single-Parent Households in Belle Vernon borough
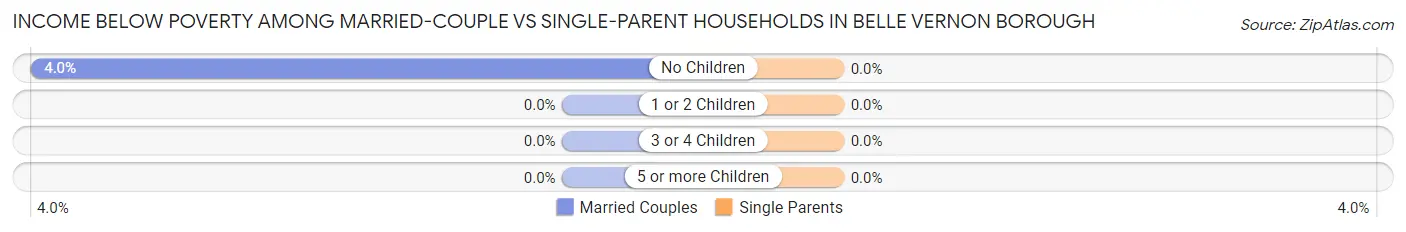
| Children | Married-Couple Families | Single-Parent Households |
| No Children | 3 (4.0%) | 0 (0.0%) |
| 1 or 2 Children | 0 (0.0%) | 0 (0.0%) |
| 3 or 4 Children | 0 (0.0%) | 0 (0.0%) |
| 5 or more Children | 0 (0.0%) | 0 (0.0%) |
| Total | 3 (3.2%) | 0 (0.0%) |
Race in Belle Vernon borough
The most populous races in Belle Vernon borough are White / Caucasian (688 | 85.7%), Two or more Races (65 | 8.1%), and Black / African American (40 | 5.0%).
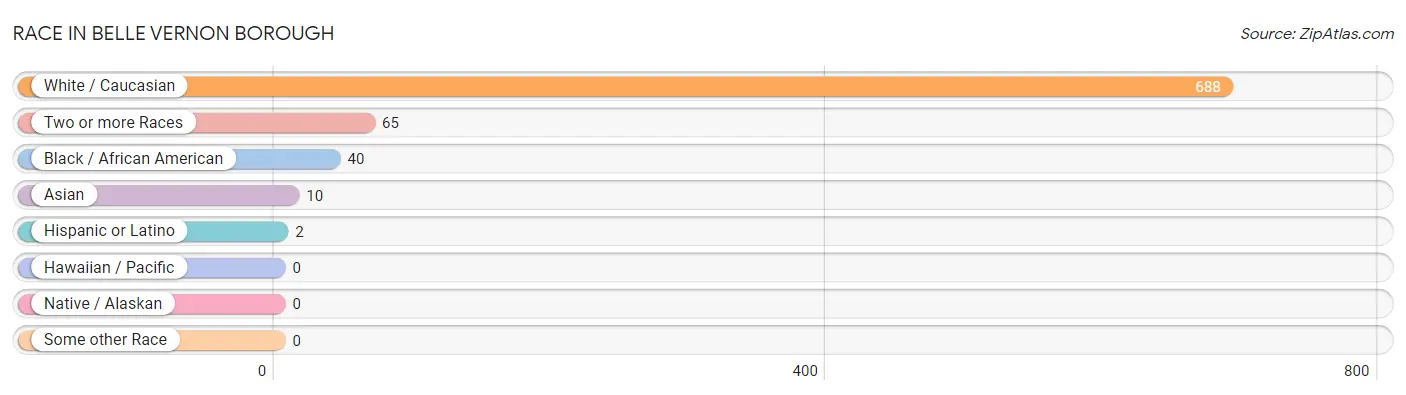
| Race | # Population | % Population |
| Asian | 10 | 1.3% |
| Black / African American | 40 | 5.0% |
| Hawaiian / Pacific | 0 | 0.0% |
| Hispanic or Latino | 2 | 0.3% |
| Native / Alaskan | 0 | 0.0% |
| White / Caucasian | 688 | 85.7% |
| Two or more Races | 65 | 8.1% |
| Some other Race | 0 | 0.0% |
| Total | 803 | 100.0% |
Ancestry in Belle Vernon borough
The most populous ancestries reported in Belle Vernon borough are Italian (177 | 22.0%), Irish (151 | 18.8%), English (131 | 16.3%), German (65 | 8.1%), and Polish (55 | 6.9%), together accounting for 72.1% of all Belle Vernon borough residents.
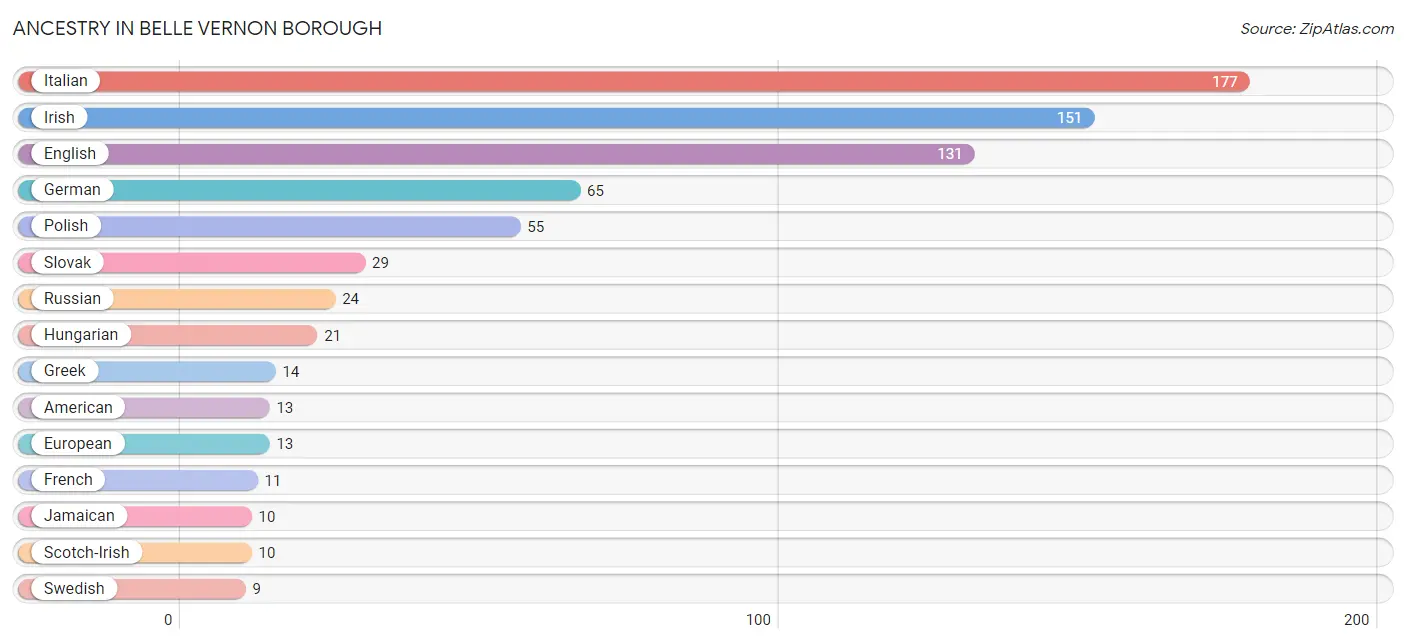
| Ancestry | # Population | % Population |
| American | 13 | 1.6% |
| Arab | 4 | 0.5% |
| Celtic | 3 | 0.4% |
| Cherokee | 6 | 0.7% |
| Croatian | 3 | 0.4% |
| Dutch | 1 | 0.1% |
| Eastern European | 3 | 0.4% |
| English | 131 | 16.3% |
| European | 13 | 1.6% |
| Finnish | 3 | 0.4% |
| French | 11 | 1.4% |
| German | 65 | 8.1% |
| Greek | 14 | 1.7% |
| Hungarian | 21 | 2.6% |
| Indian (Asian) | 8 | 1.0% |
| Irish | 151 | 18.8% |
| Italian | 177 | 22.0% |
| Jamaican | 10 | 1.3% |
| Korean | 4 | 0.5% |
| Lebanese | 4 | 0.5% |
| Lithuanian | 3 | 0.4% |
| Polish | 55 | 6.9% |
| Puerto Rican | 2 | 0.3% |
| Russian | 24 | 3.0% |
| Scotch-Irish | 10 | 1.3% |
| Slovak | 29 | 3.6% |
| Swedish | 9 | 1.1% |
| Ukrainian | 3 | 0.4% |
| Welsh | 8 | 1.0% | View All 29 Rows |
Immigrants in Belle Vernon borough
The most numerous immigrant groups reported in Belle Vernon borough came from Asia (10 | 1.3%), China (8 | 1.0%), Eastern Asia (8 | 1.0%), Philippines (2 | 0.3%), and South Eastern Asia (2 | 0.3%), together accounting for 3.8% of all Belle Vernon borough residents.
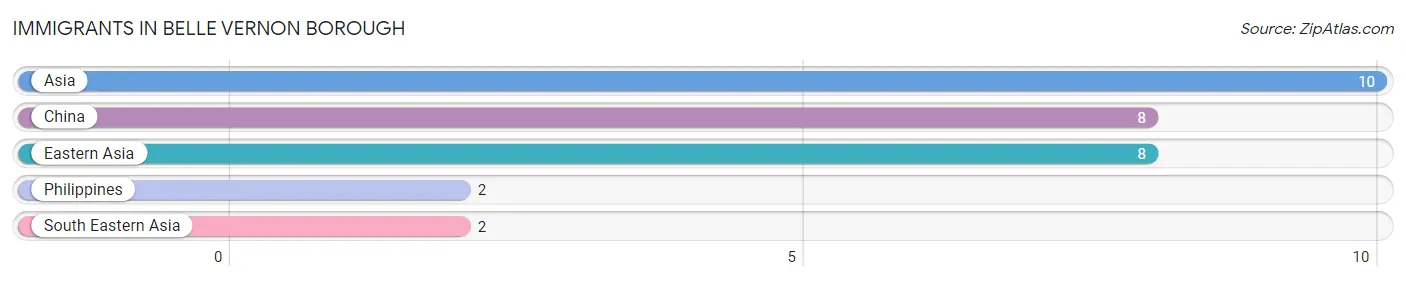
| Immigration Origin | # Population | % Population |
| Asia | 10 | 1.3% |
| China | 8 | 1.0% |
| Eastern Asia | 8 | 1.0% |
| Philippines | 2 | 0.3% |
| South Eastern Asia | 2 | 0.3% | View All 5 Rows |
Sex and Age in Belle Vernon borough
Sex and Age in Belle Vernon borough
The most populous age groups in Belle Vernon borough are 60 to 64 Years (49 | 13.2%) for men and 75 to 79 Years (57 | 13.2%) for women.
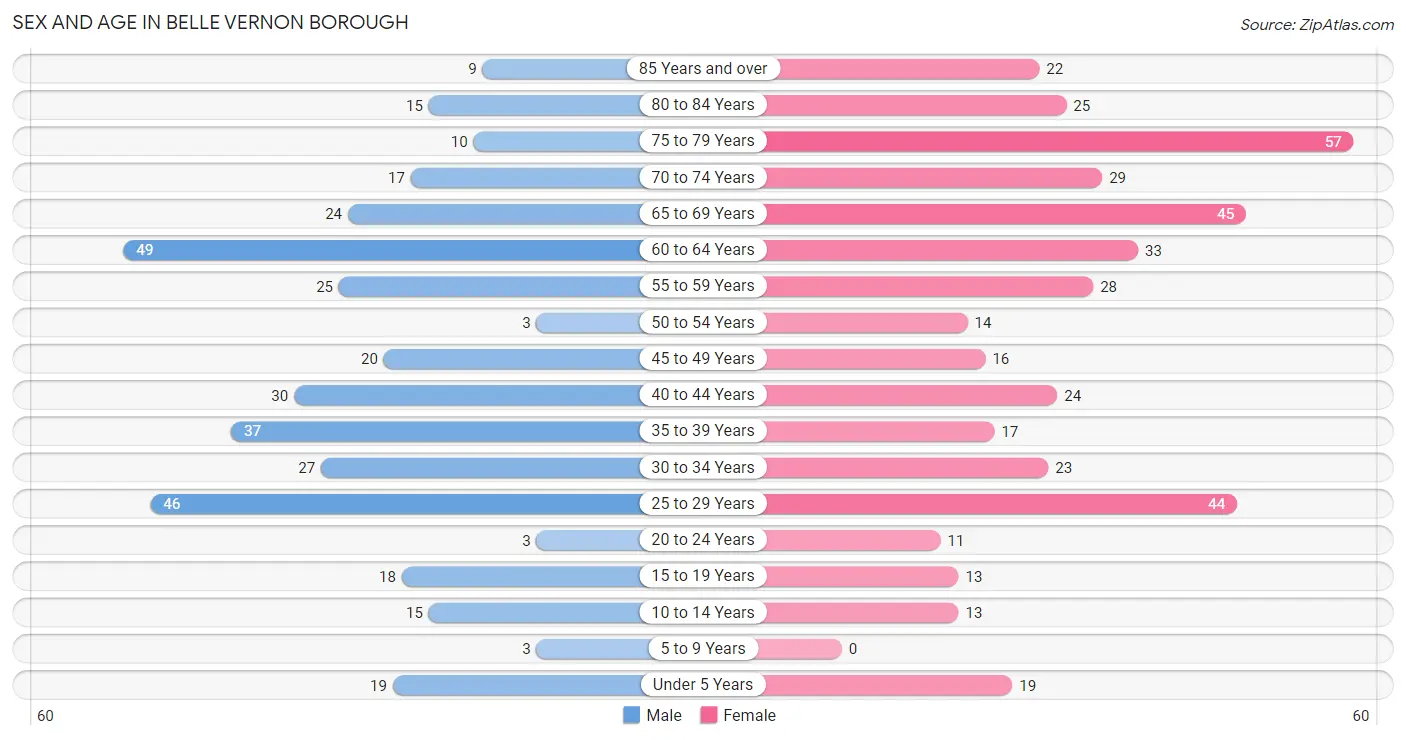
| Age Bracket | Male | Female |
| Under 5 Years | 19 (5.1%) | 19 (4.4%) |
| 5 to 9 Years | 3 (0.8%) | 0 (0.0%) |
| 10 to 14 Years | 15 (4.1%) | 13 (3.0%) |
| 15 to 19 Years | 18 (4.9%) | 13 (3.0%) |
| 20 to 24 Years | 3 (0.8%) | 11 (2.5%) |
| 25 to 29 Years | 46 (12.4%) | 44 (10.2%) |
| 30 to 34 Years | 27 (7.3%) | 23 (5.3%) |
| 35 to 39 Years | 37 (10.0%) | 17 (3.9%) |
| 40 to 44 Years | 30 (8.1%) | 24 (5.5%) |
| 45 to 49 Years | 20 (5.4%) | 16 (3.7%) |
| 50 to 54 Years | 3 (0.8%) | 14 (3.2%) |
| 55 to 59 Years | 25 (6.8%) | 28 (6.5%) |
| 60 to 64 Years | 49 (13.2%) | 33 (7.6%) |
| 65 to 69 Years | 24 (6.5%) | 45 (10.4%) |
| 70 to 74 Years | 17 (4.6%) | 29 (6.7%) |
| 75 to 79 Years | 10 (2.7%) | 57 (13.2%) |
| 80 to 84 Years | 15 (4.1%) | 25 (5.8%) |
| 85 Years and over | 9 (2.4%) | 22 (5.1%) |
| Total | 370 (100.0%) | 433 (100.0%) |
Families and Households in Belle Vernon borough
Median Family Size in Belle Vernon borough
The median family size in Belle Vernon borough is 2.51 persons per family, with single female/mother families (22 | 13.4%) accounting for the largest median family size of 3.14 persons per family. On the other hand, single male/father families (48 | 29.3%) represent the smallest median family size with 2.19 persons per family.
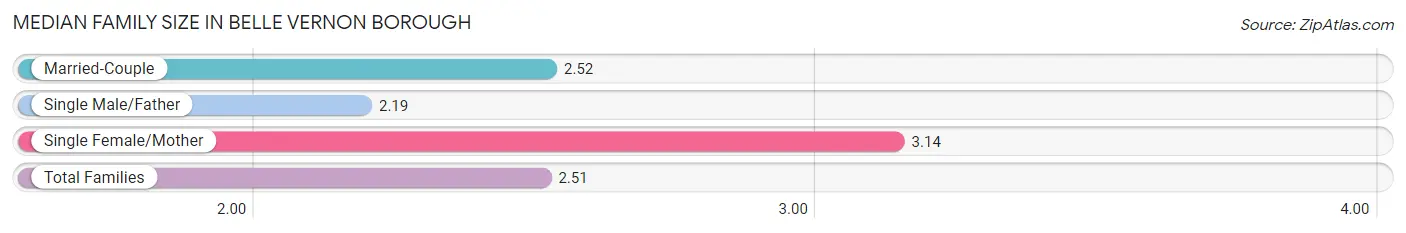
| Family Type | # Families | Family Size |
| Married-Couple | 94 (57.3%) | 2.52 |
| Single Male/Father | 48 (29.3%) | 2.19 |
| Single Female/Mother | 22 (13.4%) | 3.14 |
| Total Families | 164 (100.0%) | 2.51 |
Median Household Size in Belle Vernon borough
The median household size in Belle Vernon borough is 1.56 persons per household, with single female/mother households (22 | 4.3%) accounting for the largest median household size of 3.36 persons per household. non-family households (351 | 68.2%) represent the smallest median household size with 1.10 persons per household.
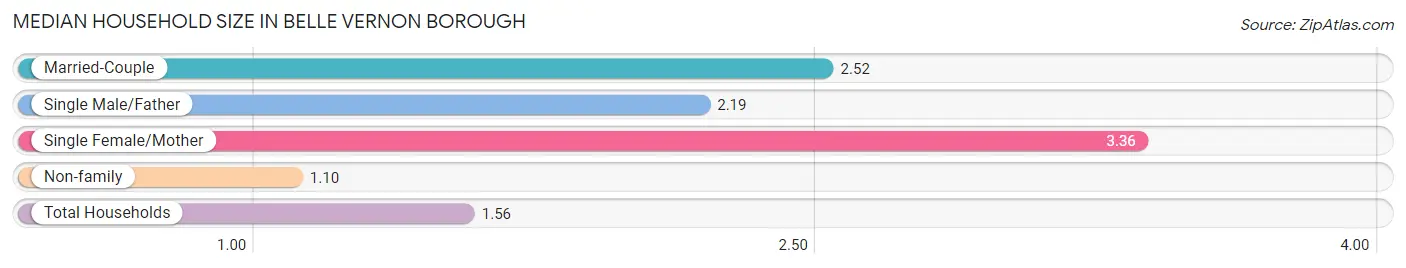
| Household Type | # Households | Household Size |
| Married-Couple | 94 (18.2%) | 2.52 |
| Single Male/Father | 48 (9.3%) | 2.19 |
| Single Female/Mother | 22 (4.3%) | 3.36 |
| Non-family | 351 (68.2%) | 1.10 |
| Total Households | 515 (100.0%) | 1.56 |
Household Size by Marriage Status in Belle Vernon borough
Out of a total of 515 households in Belle Vernon borough, 164 (31.8%) are family households, while 351 (68.2%) are nonfamily households. The most numerous type of family households are 2-person households, comprising 100, and the most common type of nonfamily households are 1-person households, comprising 310.
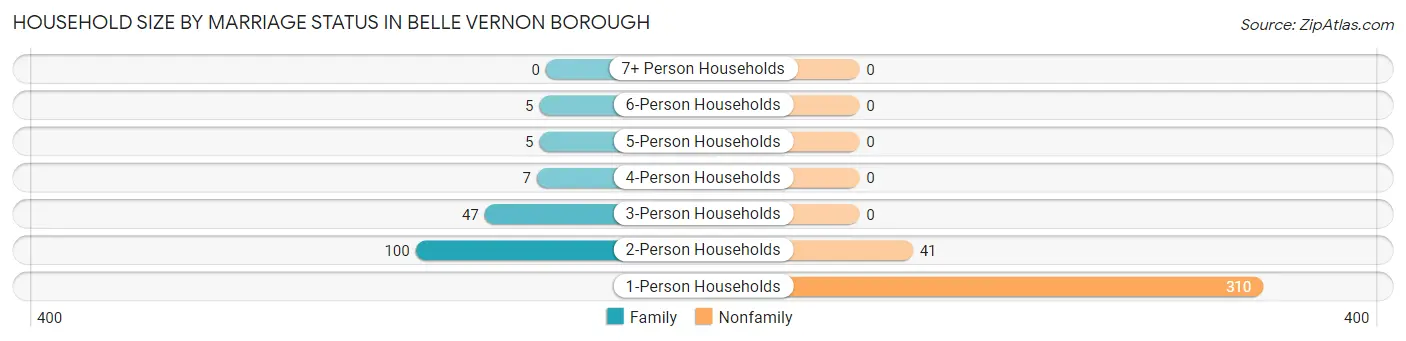
| Household Size | Family Households | Nonfamily Households |
| 1-Person Households | - | 310 (60.2%) |
| 2-Person Households | 100 (19.4%) | 41 (8.0%) |
| 3-Person Households | 47 (9.1%) | 0 (0.0%) |
| 4-Person Households | 7 (1.4%) | 0 (0.0%) |
| 5-Person Households | 5 (1.0%) | 0 (0.0%) |
| 6-Person Households | 5 (1.0%) | 0 (0.0%) |
| 7+ Person Households | 0 (0.0%) | 0 (0.0%) |
| Total | 164 (31.8%) | 351 (68.2%) |
Female Fertility in Belle Vernon borough
Fertility by Age in Belle Vernon borough
Average fertility rate in Belle Vernon borough is 13.0 births per 1,000 women. Women in the age bracket of 20 to 34 years have the highest fertility rate with 26.0 births per 1,000 women. Women in the age bracket of 20 to 34 years acount for 100.0% of all women with births.
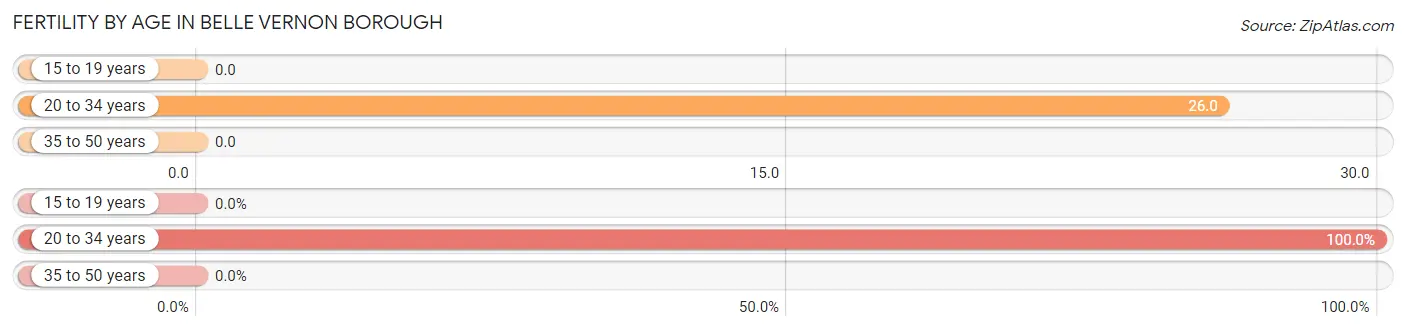
| Age Bracket | Women with Births | Births / 1,000 Women |
| 15 to 19 years | 0 (0.0%) | 0.0 |
| 20 to 34 years | 2 (100.0%) | 26.0 |
| 35 to 50 years | 0 (0.0%) | 0.0 |
| Total | 2 (100.0%) | 13.0 |
Fertility by Age by Marriage Status in Belle Vernon borough
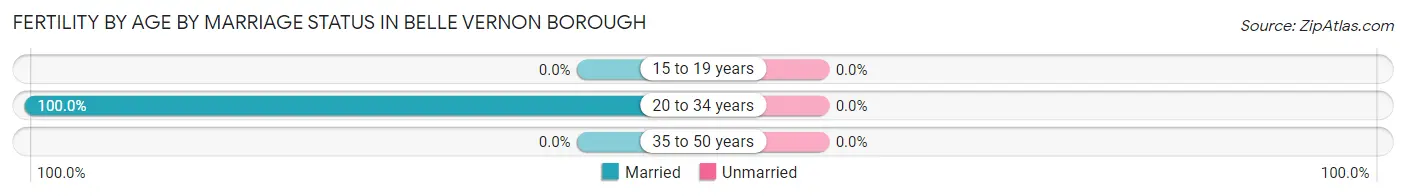
| Age Bracket | Married | Unmarried |
| 15 to 19 years | 0 (0.0%) | 0 (0.0%) |
| 20 to 34 years | 2 (100.0%) | 0 (0.0%) |
| 35 to 50 years | 0 (0.0%) | 0 (0.0%) |
| Total | 2 (100.0%) | 0 (0.0%) |
Fertility by Education in Belle Vernon borough
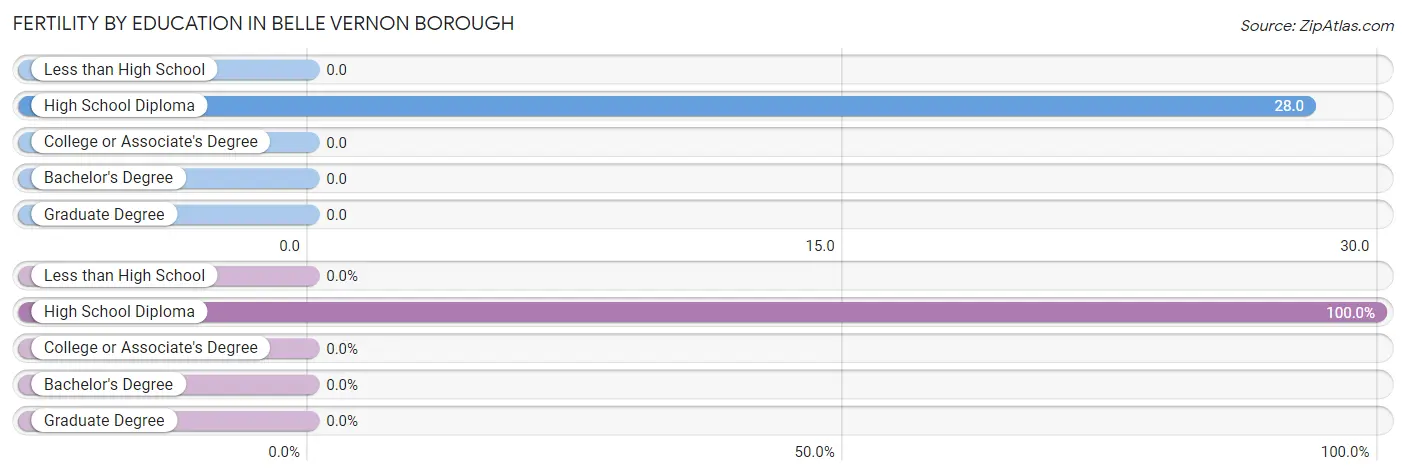
| Educational Attainment | Women with Births | Births / 1,000 Women |
| Less than High School | 0 (0.0%) | 0.0 |
| High School Diploma | 2 (100.0%) | 28.0 |
| College or Associate's Degree | 0 (0.0%) | 0.0 |
| Bachelor's Degree | 0 (0.0%) | 0.0 |
| Graduate Degree | 0 (0.0%) | 0.0 |
| Total | 2 (100.0%) | 13.0 |
Fertility by Education by Marriage Status in Belle Vernon borough
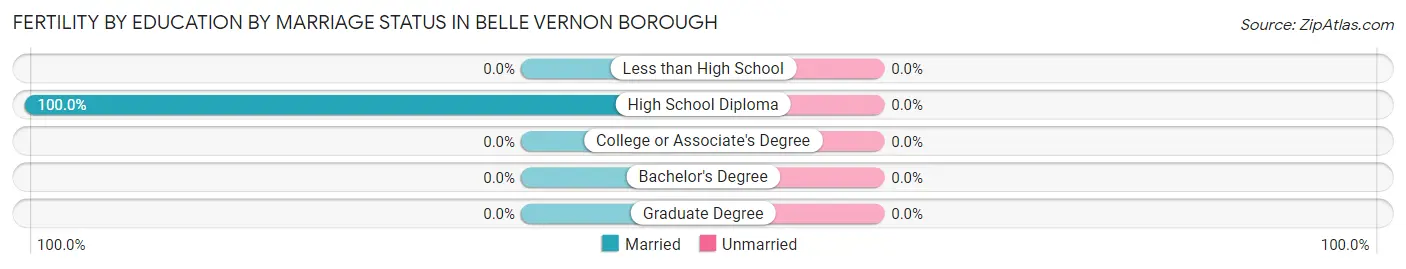
| Educational Attainment | Married | Unmarried |
| Less than High School | 0 (0.0%) | 0 (0.0%) |
| High School Diploma | 2 (100.0%) | 0 (0.0%) |
| College or Associate's Degree | 0 (0.0%) | 0 (0.0%) |
| Bachelor's Degree | 0 (0.0%) | 0 (0.0%) |
| Graduate Degree | 0 (0.0%) | 0 (0.0%) |
| Total | 2 (100.0%) | 0 (0.0%) |
Employment Characteristics in Belle Vernon borough
Employment by Class of Employer in Belle Vernon borough
Among the 386 employed individuals in Belle Vernon borough, private company employees (298 | 77.2%), not-for-profit organizations (33 | 8.6%), and self-employed (incorporated) (21 | 5.4%) make up the most common classes of employment.
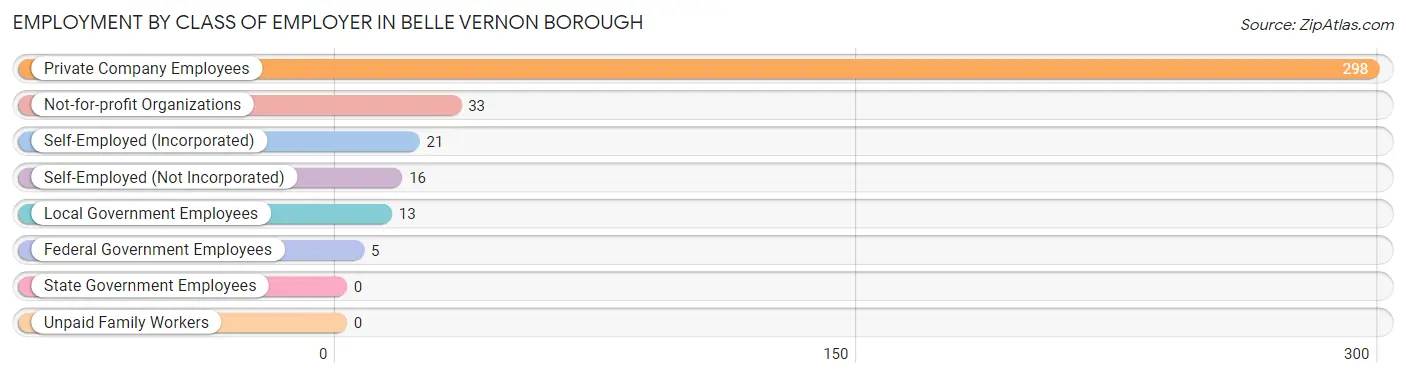
| Employer Class | # Employees | % Employees |
| Private Company Employees | 298 | 77.2% |
| Self-Employed (Incorporated) | 21 | 5.4% |
| Self-Employed (Not Incorporated) | 16 | 4.2% |
| Not-for-profit Organizations | 33 | 8.6% |
| Local Government Employees | 13 | 3.4% |
| State Government Employees | 0 | 0.0% |
| Federal Government Employees | 5 | 1.3% |
| Unpaid Family Workers | 0 | 0.0% |
| Total | 386 | 100.0% |
Employment Status by Age in Belle Vernon borough
According to the labor force statistics for Belle Vernon borough, out of the total population over 16 years of age (730), 58.4% or 426 individuals are in the labor force, with 9.4% or 40 of them unemployed. The age group with the highest labor force participation rate is 30 to 34 years, with 98.0% or 49 individuals in the labor force. Within the labor force, the 20 to 24 years age range has the highest percentage of unemployed individuals, with 45.5% or 5 of them being unemployed.
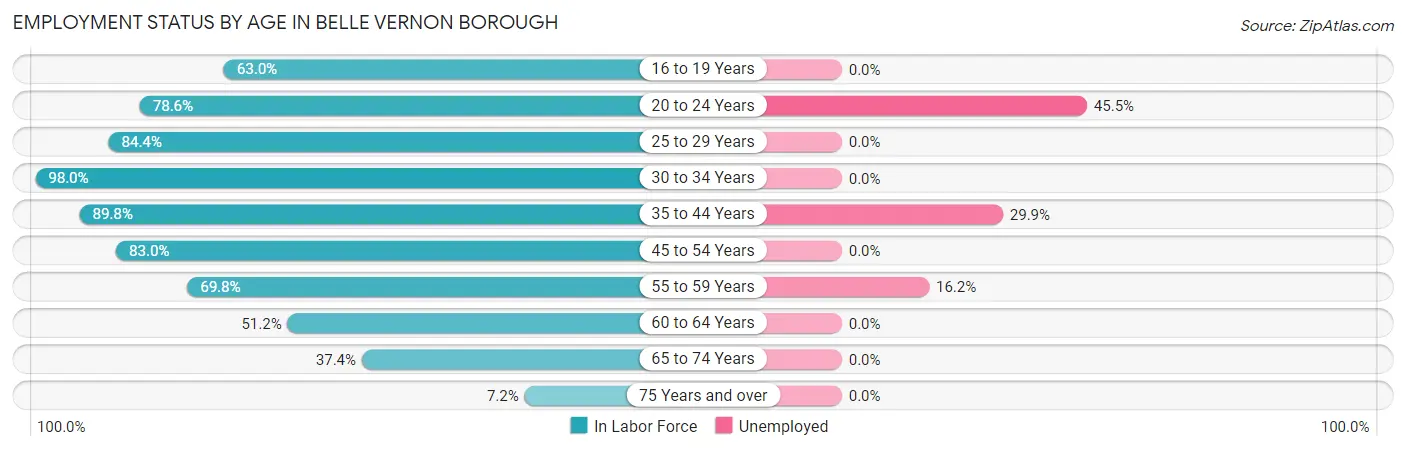
| Age Bracket | In Labor Force | Unemployed |
| 16 to 19 Years | 17 (63.0%) | 0 (0.0%) |
| 20 to 24 Years | 11 (78.6%) | 5 (45.5%) |
| 25 to 29 Years | 76 (84.4%) | 0 (0.0%) |
| 30 to 34 Years | 49 (98.0%) | 0 (0.0%) |
| 35 to 44 Years | 97 (89.8%) | 29 (29.9%) |
| 45 to 54 Years | 44 (83.0%) | 0 (0.0%) |
| 55 to 59 Years | 37 (69.8%) | 6 (16.2%) |
| 60 to 64 Years | 42 (51.2%) | 0 (0.0%) |
| 65 to 74 Years | 43 (37.4%) | 0 (0.0%) |
| 75 Years and over | 10 (7.2%) | 0 (0.0%) |
| Total | 426 (58.4%) | 40 (9.4%) |
Employment Status by Educational Attainment in Belle Vernon borough
According to labor force statistics for Belle Vernon borough, 79.1% of individuals (345) out of the total population between 25 and 64 years of age (436) are in the labor force, with 10.1% or 35 of them being unemployed. The group with the highest labor force participation rate are those with the educational attainment of bachelor's degree or higher, with 92.5% or 62 individuals in the labor force. Within the labor force, individuals with college / associate degree education have the highest percentage of unemployment, with 30.2% or 29 of them being unemployed.
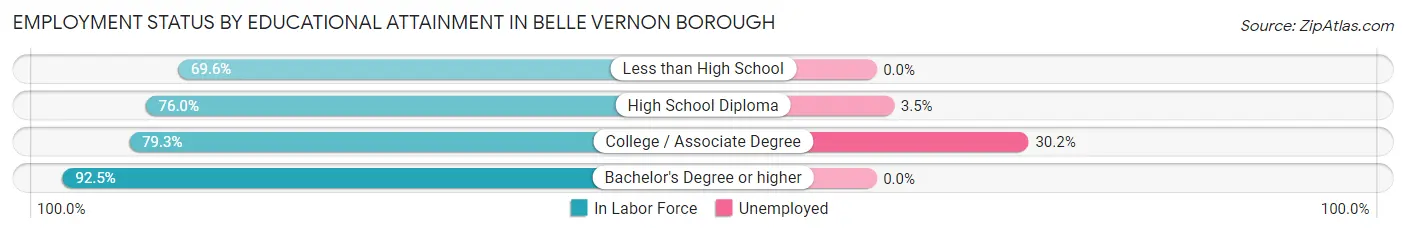
| Educational Attainment | In Labor Force | Unemployed |
| Less than High School | 16 (69.6%) | 0 (0.0%) |
| High School Diploma | 171 (76.0%) | 8 (3.5%) |
| College / Associate Degree | 96 (79.3%) | 37 (30.2%) |
| Bachelor's Degree or higher | 62 (92.5%) | 0 (0.0%) |
| Total | 345 (79.1%) | 44 (10.1%) |
Employment Occupations by Sex in Belle Vernon borough
Management, Business, Science and Arts Occupations
The most common Management, Business, Science and Arts occupations in Belle Vernon borough are Community & Social Service (37 | 9.6%), Computers, Engineering & Science (18 | 4.7%), Health Diagnosing & Treating (16 | 4.2%), Computers & Mathematics (15 | 3.9%), and Education Instruction & Library (14 | 3.6%).
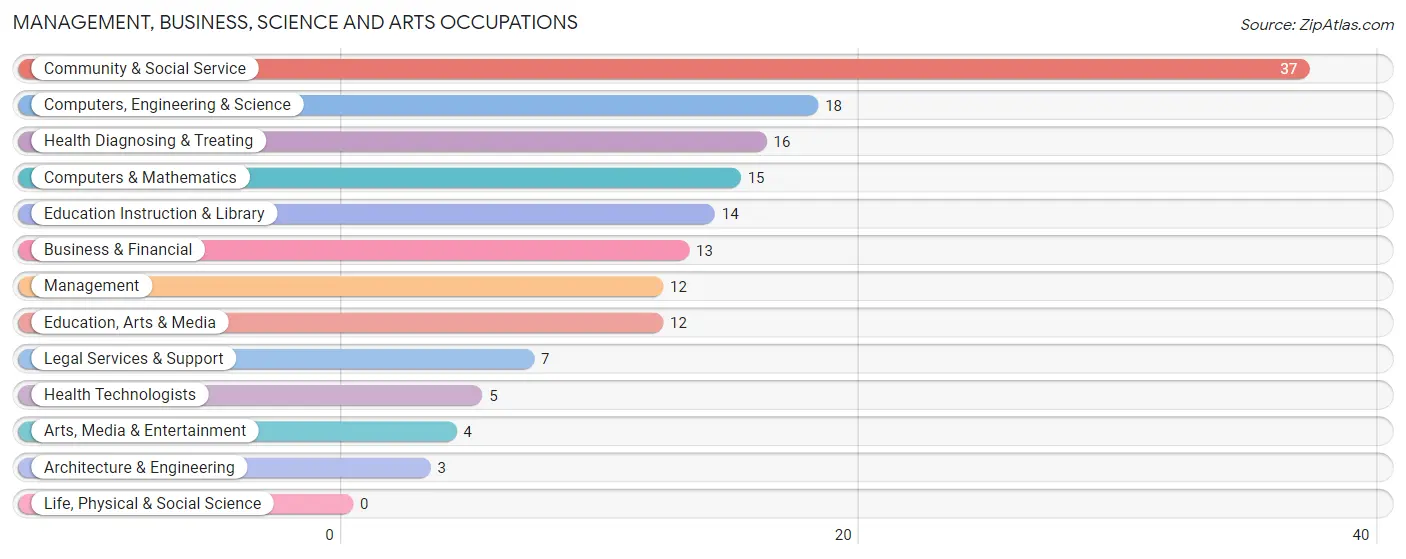
Management, Business, Science and Arts Occupations by Sex
Within the Management, Business, Science and Arts occupations in Belle Vernon borough, the most male-oriented occupations are Architecture & Engineering (100.0%), Legal Services & Support (100.0%), and Computers, Engineering & Science (77.8%), while the most female-oriented occupations are Business & Financial (100.0%), Education Instruction & Library (100.0%), and Arts, Media & Entertainment (100.0%).
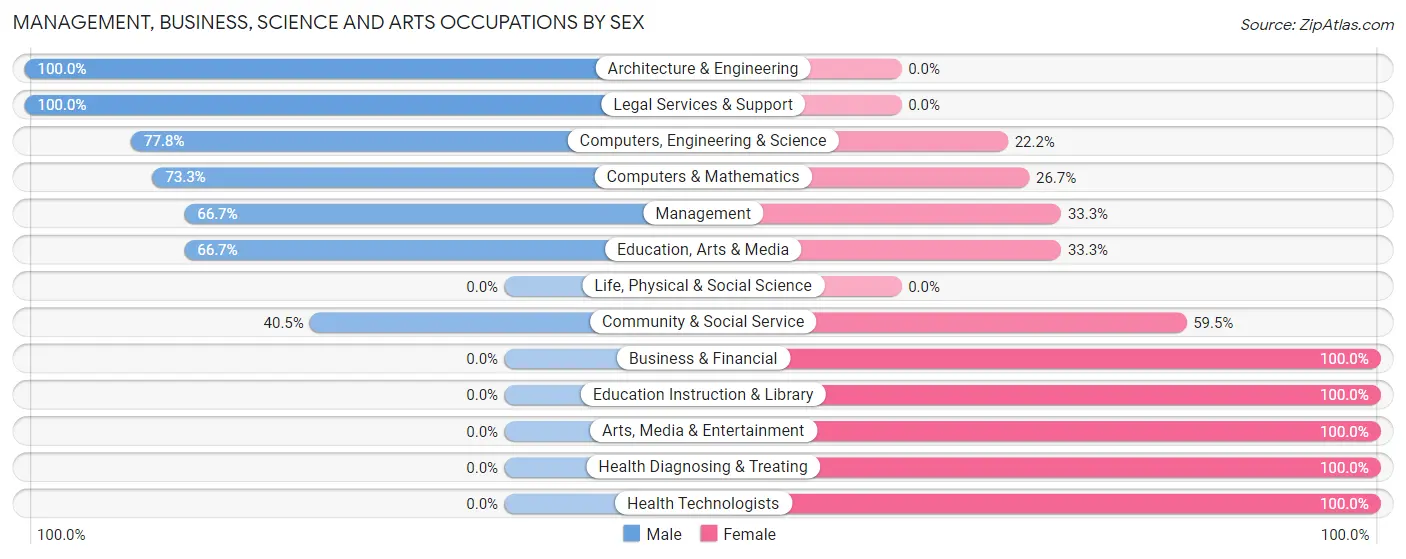
| Occupation | Male | Female |
| Management | 8 (66.7%) | 4 (33.3%) |
| Business & Financial | 0 (0.0%) | 13 (100.0%) |
| Computers, Engineering & Science | 14 (77.8%) | 4 (22.2%) |
| Computers & Mathematics | 11 (73.3%) | 4 (26.7%) |
| Architecture & Engineering | 3 (100.0%) | 0 (0.0%) |
| Life, Physical & Social Science | 0 (0.0%) | 0 (0.0%) |
| Community & Social Service | 15 (40.5%) | 22 (59.5%) |
| Education, Arts & Media | 8 (66.7%) | 4 (33.3%) |
| Legal Services & Support | 7 (100.0%) | 0 (0.0%) |
| Education Instruction & Library | 0 (0.0%) | 14 (100.0%) |
| Arts, Media & Entertainment | 0 (0.0%) | 4 (100.0%) |
| Health Diagnosing & Treating | 0 (0.0%) | 16 (100.0%) |
| Health Technologists | 0 (0.0%) | 5 (100.0%) |
| Total (Category) | 37 (38.5%) | 59 (61.5%) |
| Total (Overall) | 222 (57.5%) | 164 (42.5%) |
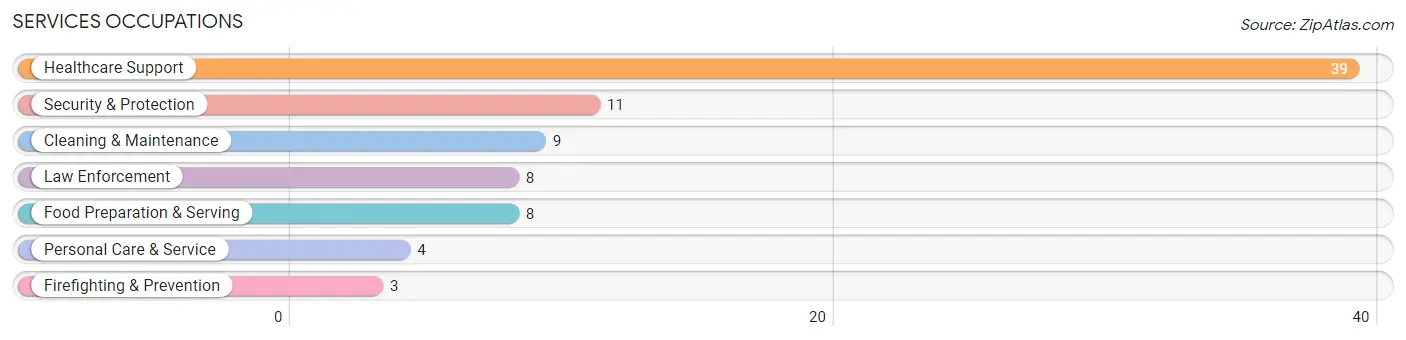
Services Occupations
The most common Services occupations in Belle Vernon borough are Healthcare Support (39 | 10.1%), Security & Protection (11 | 2.9%), Cleaning & Maintenance (9 | 2.3%), Law Enforcement (8 | 2.1%), and Food Preparation & Serving (8 | 2.1%).
Services Occupations by Sex
Within the Services occupations in Belle Vernon borough, the most male-oriented occupations are Security & Protection (100.0%), Firefighting & Prevention (100.0%), and Law Enforcement (100.0%), while the most female-oriented occupations are Personal Care & Service (100.0%), Healthcare Support (89.7%), and Food Preparation & Serving (37.5%).
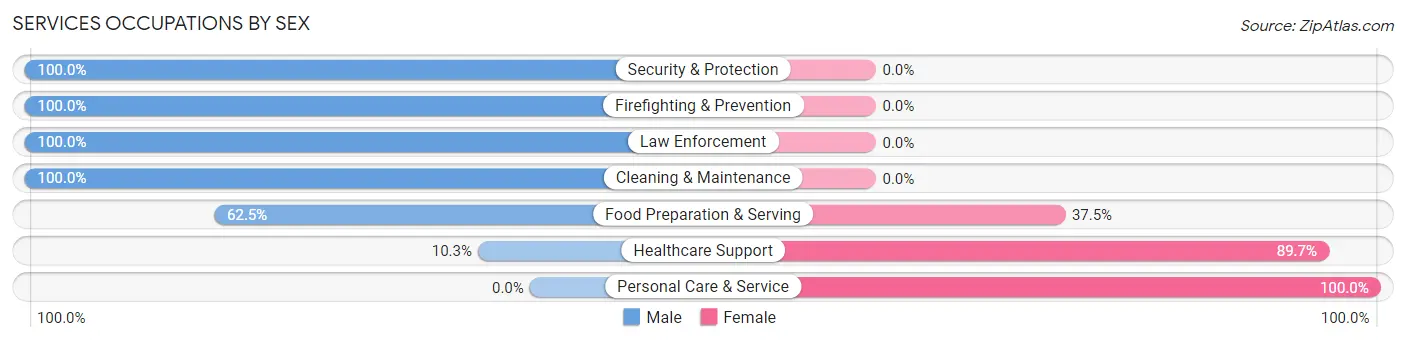
| Occupation | Male | Female |
| Healthcare Support | 4 (10.3%) | 35 (89.7%) |
| Security & Protection | 11 (100.0%) | 0 (0.0%) |
| Firefighting & Prevention | 3 (100.0%) | 0 (0.0%) |
| Law Enforcement | 8 (100.0%) | 0 (0.0%) |
| Food Preparation & Serving | 5 (62.5%) | 3 (37.5%) |
| Cleaning & Maintenance | 9 (100.0%) | 0 (0.0%) |
| Personal Care & Service | 0 (0.0%) | 4 (100.0%) |
| Total (Category) | 29 (40.8%) | 42 (59.2%) |
| Total (Overall) | 222 (57.5%) | 164 (42.5%) |
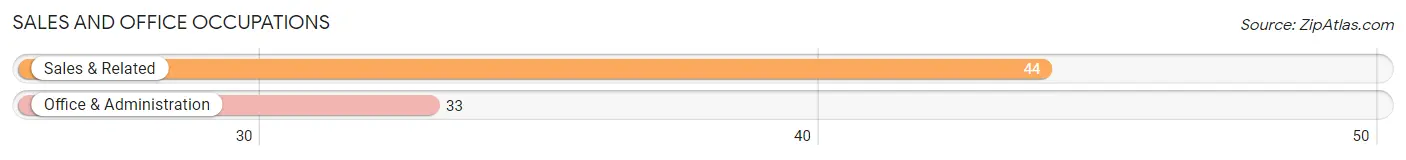
Sales and Office Occupations
The most common Sales and Office occupations in Belle Vernon borough are Sales & Related (44 | 11.4%), and Office & Administration (33 | 8.6%).
Sales and Office Occupations by Sex
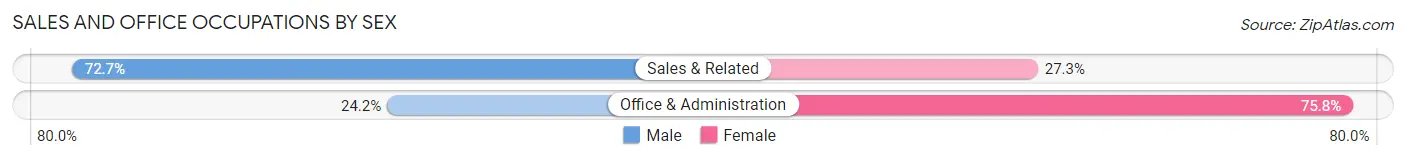
| Occupation | Male | Female |
| Sales & Related | 32 (72.7%) | 12 (27.3%) |
| Office & Administration | 8 (24.2%) | 25 (75.8%) |
| Total (Category) | 40 (51.9%) | 37 (48.0%) |
| Total (Overall) | 222 (57.5%) | 164 (42.5%) |
Natural Resources, Construction and Maintenance Occupations
The most common Natural Resources, Construction and Maintenance occupations in Belle Vernon borough are Construction & Extraction (29 | 7.5%), and Installation, Maintenance & Repair (3 | 0.8%).
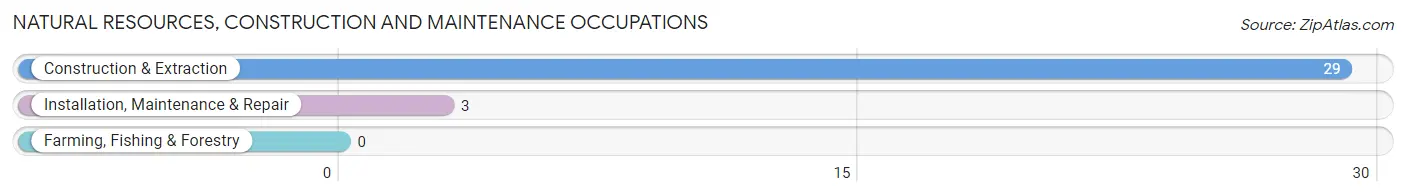
Natural Resources, Construction and Maintenance Occupations by Sex
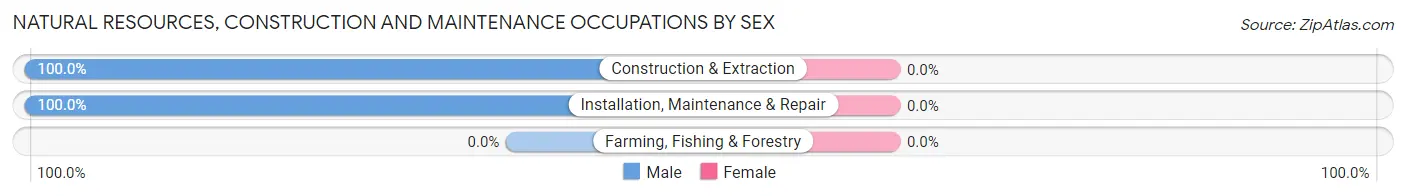
| Occupation | Male | Female |
| Farming, Fishing & Forestry | 0 (0.0%) | 0 (0.0%) |
| Construction & Extraction | 29 (100.0%) | 0 (0.0%) |
| Installation, Maintenance & Repair | 3 (100.0%) | 0 (0.0%) |
| Total (Category) | 32 (100.0%) | 0 (0.0%) |
| Total (Overall) | 222 (57.5%) | 164 (42.5%) |
Production, Transportation and Moving Occupations
The most common Production, Transportation and Moving occupations in Belle Vernon borough are Material Moving (61 | 15.8%), Production (43 | 11.1%), and Transportation (6 | 1.5%).
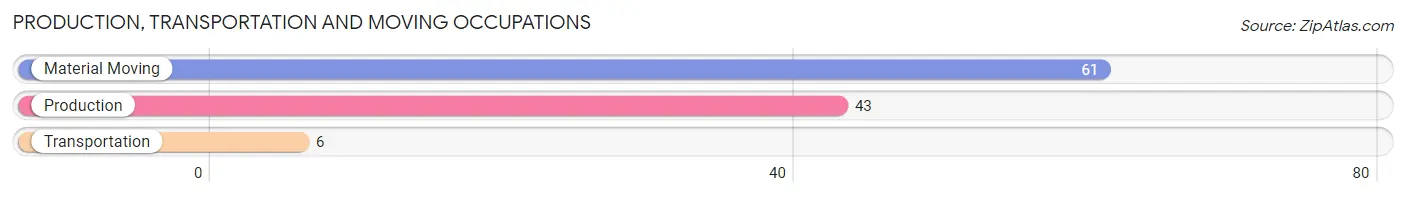
Production, Transportation and Moving Occupations by Sex
| Occupation | Male | Female |
| Production | 37 (86.1%) | 6 (14.0%) |
| Transportation | 3 (50.0%) | 3 (50.0%) |
| Material Moving | 44 (72.1%) | 17 (27.9%) |
| Total (Category) | 84 (76.4%) | 26 (23.6%) |
| Total (Overall) | 222 (57.5%) | 164 (42.5%) |
Employment Industries by Sex in Belle Vernon borough
Employment Industries in Belle Vernon borough
The major employment industries in Belle Vernon borough include Retail Trade (87 | 22.5%), Health Care & Social Assistance (73 | 18.9%), Transportation & Warehousing (35 | 9.1%), Manufacturing (33 | 8.6%), and Construction (29 | 7.5%).
Employment Industries by Sex in Belle Vernon borough
The Belle Vernon borough industries that see more men than women are Agriculture, Fishing & Hunting (100.0%), Construction (100.0%), and Wholesale Trade (100.0%), whereas the industries that tend to have a higher number of women are Educational Services (100.0%), Professional & Scientific (81.2%), and Health Care & Social Assistance (79.4%).
| Industry | Male | Female |
| Agriculture, Fishing & Hunting | 4 (100.0%) | 0 (0.0%) |
| Mining, Quarrying, & Extraction | 0 (0.0%) | 0 (0.0%) |
| Construction | 29 (100.0%) | 0 (0.0%) |
| Manufacturing | 24 (72.7%) | 9 (27.3%) |
| Wholesale Trade | 8 (100.0%) | 0 (0.0%) |
| Retail Trade | 48 (55.2%) | 39 (44.8%) |
| Transportation & Warehousing | 27 (77.1%) | 8 (22.9%) |
| Utilities | 14 (100.0%) | 0 (0.0%) |
| Information | 3 (100.0%) | 0 (0.0%) |
| Finance & Insurance | 4 (26.7%) | 11 (73.3%) |
| Real Estate, Rental & Leasing | 3 (100.0%) | 0 (0.0%) |
| Professional & Scientific | 3 (18.8%) | 13 (81.2%) |
| Enterprise Management | 0 (0.0%) | 0 (0.0%) |
| Administrative & Support | 13 (100.0%) | 0 (0.0%) |
| Educational Services | 0 (0.0%) | 14 (100.0%) |
| Health Care & Social Assistance | 15 (20.5%) | 58 (79.4%) |
| Arts, Entertainment & Recreation | 3 (100.0%) | 0 (0.0%) |
| Accommodation & Food Services | 9 (75.0%) | 3 (25.0%) |
| Public Administration | 11 (100.0%) | 0 (0.0%) |
| Total | 222 (57.5%) | 164 (42.5%) |
Education in Belle Vernon borough
School Enrollment in Belle Vernon borough
The most common levels of schooling among the 68 students in Belle Vernon borough are middle school (25 | 36.8%), kindergarten (14 | 20.6%), and high school (14 | 20.6%).
| School Level | # Students | % Students |
| Nursery / Preschool | 0 | 0.0% |
| Kindergarten | 14 | 20.6% |
| Elementary School | 0 | 0.0% |
| Middle School | 25 | 36.8% |
| High School | 14 | 20.6% |
| College / Undergraduate | 8 | 11.8% |
| Graduate / Professional | 7 | 10.3% |
| Total | 68 | 100.0% |
School Enrollment by Age by Funding Source in Belle Vernon borough
Out of a total of 68 students who are enrolled in schools in Belle Vernon borough, 15 (22.1%) attend a private institution, while the remaining 53 (77.9%) are enrolled in public schools. The age group of 18 to 19 year olds has the highest likelihood of being enrolled in private schools, with 8 (100.0% in the age bracket) enrolled. Conversely, the age group of 3 to 4 year olds has the lowest likelihood of being enrolled in a private school, with 11 (100.0% in the age bracket) attending a public institution.
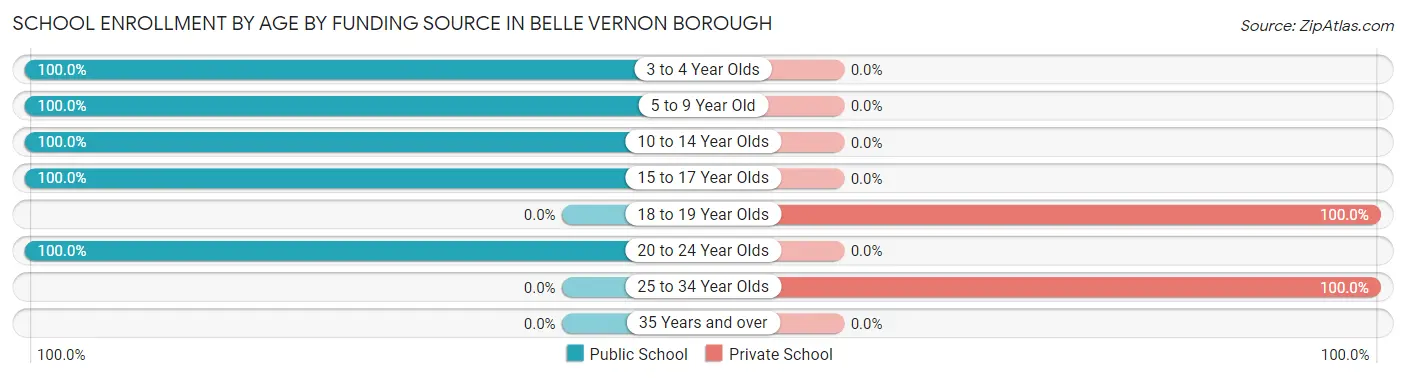
| Age Bracket | Public School | Private School |
| 3 to 4 Year Olds | 11 (100.0%) | 0 (0.0%) |
| 5 to 9 Year Old | 3 (100.0%) | 0 (0.0%) |
| 10 to 14 Year Olds | 28 (100.0%) | 0 (0.0%) |
| 15 to 17 Year Olds | 8 (100.0%) | 0 (0.0%) |
| 18 to 19 Year Olds | 0 (0.0%) | 8 (100.0%) |
| 20 to 24 Year Olds | 3 (100.0%) | 0 (0.0%) |
| 25 to 34 Year Olds | 0 (0.0%) | 7 (100.0%) |
| 35 Years and over | 0 (0.0%) | 0 (0.0%) |
| Total | 53 (77.9%) | 15 (22.1%) |
Educational Attainment by Field of Study in Belle Vernon borough
Education (31 | 21.5%), computers & mathematics (20 | 13.9%), business (19 | 13.2%), liberal arts & history (17 | 11.8%), and psychology (15 | 10.4%) are the most common fields of study among 144 individuals in Belle Vernon borough who have obtained a bachelor's degree or higher.
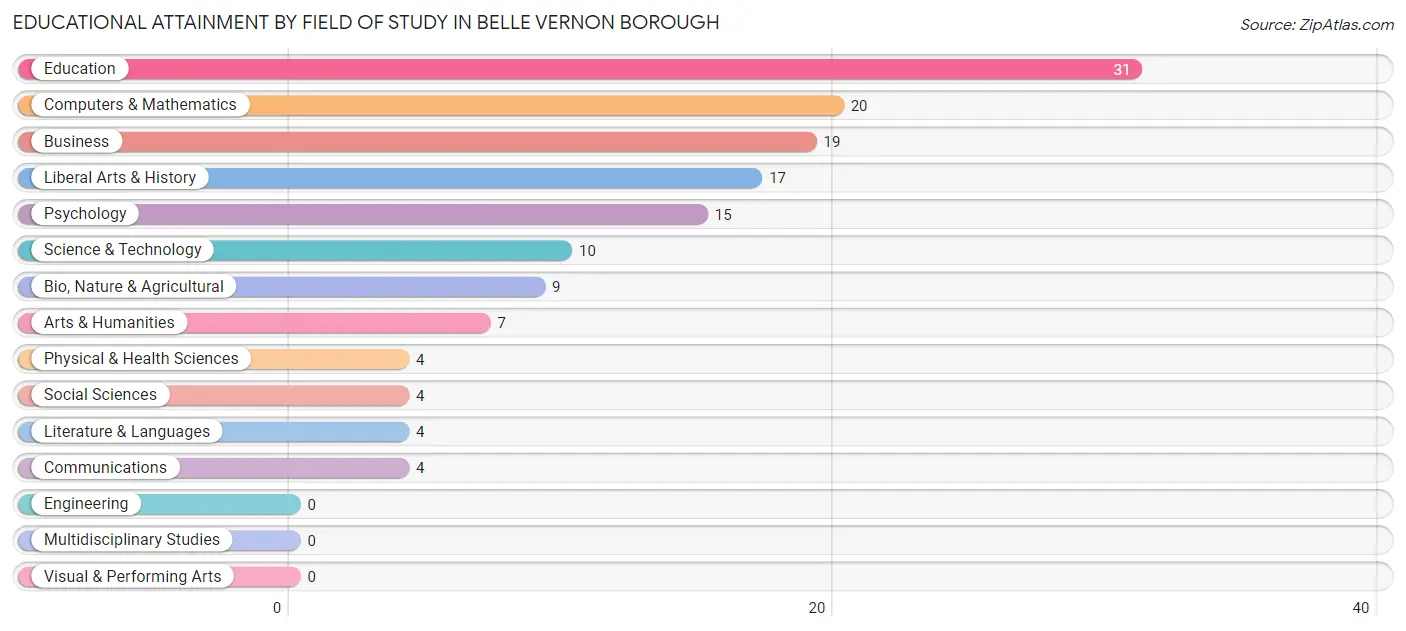
| Field of Study | # Graduates | % Graduates |
| Computers & Mathematics | 20 | 13.9% |
| Bio, Nature & Agricultural | 9 | 6.2% |
| Physical & Health Sciences | 4 | 2.8% |
| Psychology | 15 | 10.4% |
| Social Sciences | 4 | 2.8% |
| Engineering | 0 | 0.0% |
| Multidisciplinary Studies | 0 | 0.0% |
| Science & Technology | 10 | 6.9% |
| Business | 19 | 13.2% |
| Education | 31 | 21.5% |
| Literature & Languages | 4 | 2.8% |
| Liberal Arts & History | 17 | 11.8% |
| Visual & Performing Arts | 0 | 0.0% |
| Communications | 4 | 2.8% |
| Arts & Humanities | 7 | 4.9% |
| Total | 144 | 100.0% |
Transportation & Commute in Belle Vernon borough
Vehicle Availability by Sex in Belle Vernon borough
The most prevalent vehicle ownership categories in Belle Vernon borough are males with 2 vehicles (84, accounting for 37.8%) and females with 2 vehicles (52, making up 51.2%).
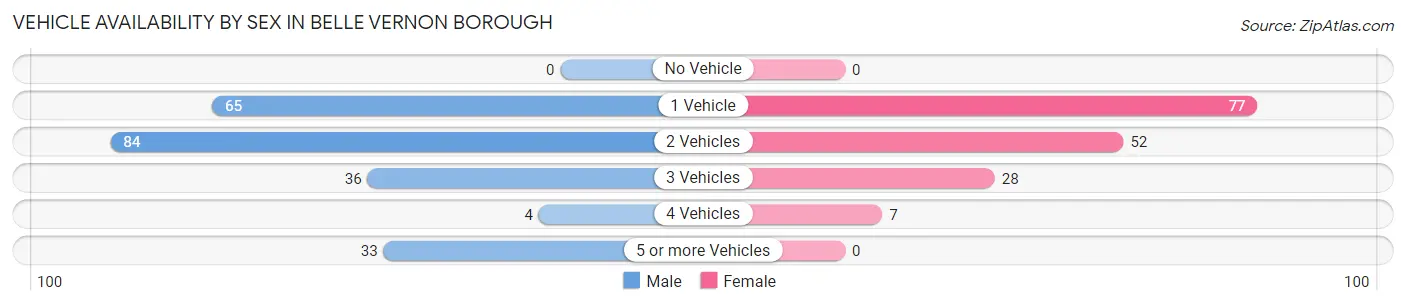
| Vehicles Available | Male | Female |
| No Vehicle | 0 (0.0%) | 0 (0.0%) |
| 1 Vehicle | 65 (29.3%) | 77 (46.9%) |
| 2 Vehicles | 84 (37.8%) | 52 (31.7%) |
| 3 Vehicles | 36 (16.2%) | 28 (17.1%) |
| 4 Vehicles | 4 (1.8%) | 7 (4.3%) |
| 5 or more Vehicles | 33 (14.9%) | 0 (0.0%) |
| Total | 222 (100.0%) | 164 (100.0%) |
Commute Time in Belle Vernon borough
The most frequently occuring commute durations in Belle Vernon borough are 45 to 59 minutes (59 commuters, 16.4%), 10 to 14 minutes (58 commuters, 16.2%), and 60 to 89 minutes (47 commuters, 13.1%).
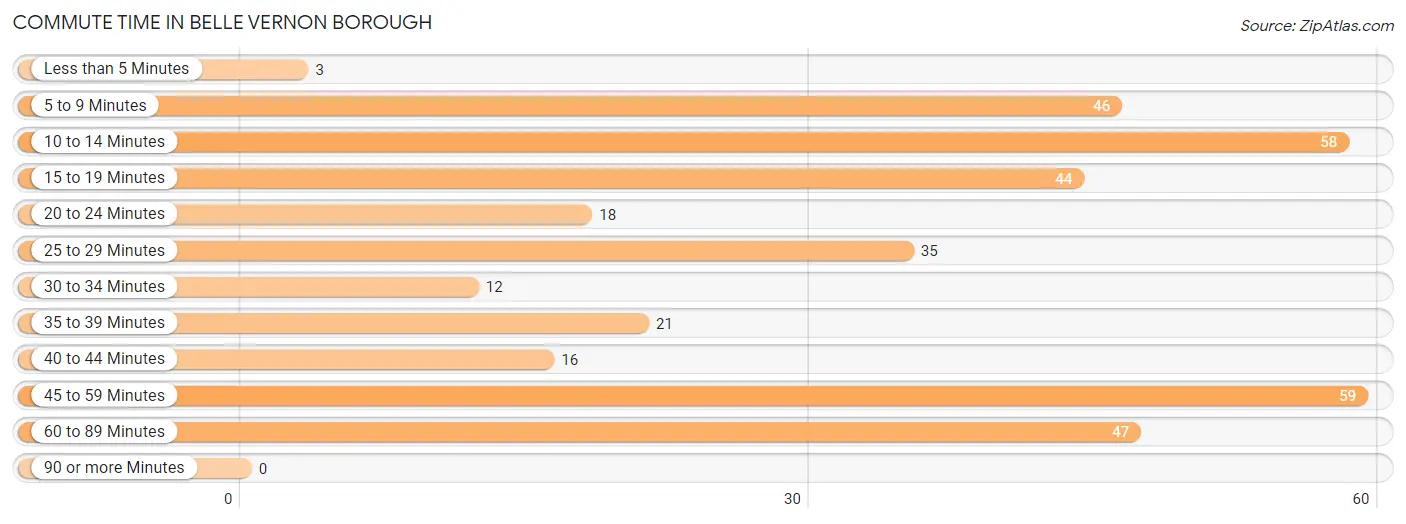
| Commute Time | # Commuters | % Commuters |
| Less than 5 Minutes | 3 | 0.8% |
| 5 to 9 Minutes | 46 | 12.8% |
| 10 to 14 Minutes | 58 | 16.2% |
| 15 to 19 Minutes | 44 | 12.3% |
| 20 to 24 Minutes | 18 | 5.0% |
| 25 to 29 Minutes | 35 | 9.8% |
| 30 to 34 Minutes | 12 | 3.3% |
| 35 to 39 Minutes | 21 | 5.9% |
| 40 to 44 Minutes | 16 | 4.5% |
| 45 to 59 Minutes | 59 | 16.4% |
| 60 to 89 Minutes | 47 | 13.1% |
| 90 or more Minutes | 0 | 0.0% |
Commute Time by Sex in Belle Vernon borough
The most common commute times in Belle Vernon borough are 60 to 89 minutes (41 commuters, 20.1%) for males and 45 to 59 minutes (44 commuters, 28.4%) for females.
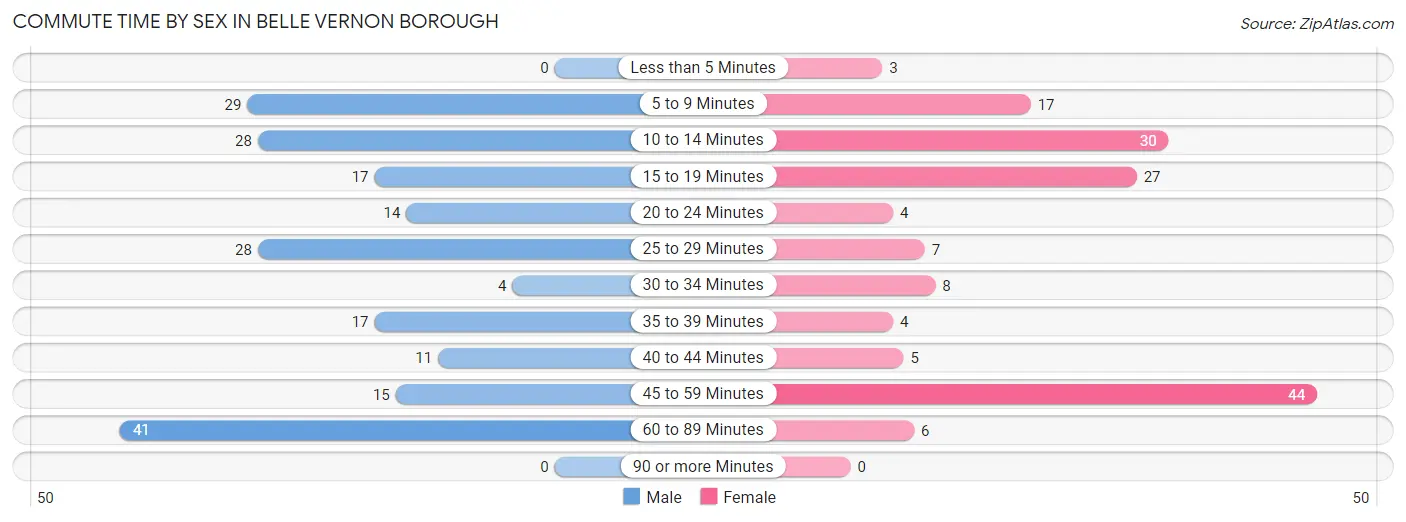
| Commute Time | Male | Female |
| Less than 5 Minutes | 0 (0.0%) | 3 (1.9%) |
| 5 to 9 Minutes | 29 (14.2%) | 17 (11.0%) |
| 10 to 14 Minutes | 28 (13.7%) | 30 (19.4%) |
| 15 to 19 Minutes | 17 (8.3%) | 27 (17.4%) |
| 20 to 24 Minutes | 14 (6.9%) | 4 (2.6%) |
| 25 to 29 Minutes | 28 (13.7%) | 7 (4.5%) |
| 30 to 34 Minutes | 4 (2.0%) | 8 (5.2%) |
| 35 to 39 Minutes | 17 (8.3%) | 4 (2.6%) |
| 40 to 44 Minutes | 11 (5.4%) | 5 (3.2%) |
| 45 to 59 Minutes | 15 (7.3%) | 44 (28.4%) |
| 60 to 89 Minutes | 41 (20.1%) | 6 (3.9%) |
| 90 or more Minutes | 0 (0.0%) | 0 (0.0%) |
Time of Departure to Work by Sex in Belle Vernon borough
The most frequent times of departure to work in Belle Vernon borough are 7:00 AM to 7:29 AM (54, 26.5%) for males and 8:00 AM to 8:29 AM (40, 25.8%) for females.
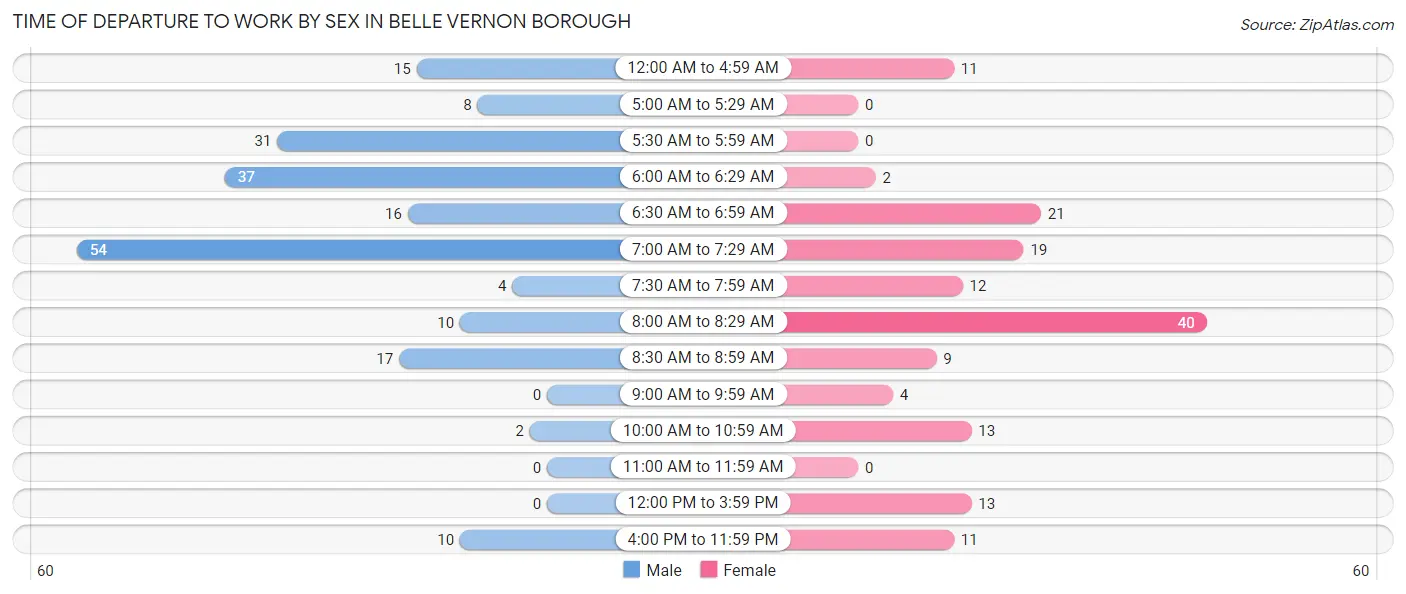
| Time of Departure | Male | Female |
| 12:00 AM to 4:59 AM | 15 (7.3%) | 11 (7.1%) |
| 5:00 AM to 5:29 AM | 8 (3.9%) | 0 (0.0%) |
| 5:30 AM to 5:59 AM | 31 (15.2%) | 0 (0.0%) |
| 6:00 AM to 6:29 AM | 37 (18.1%) | 2 (1.3%) |
| 6:30 AM to 6:59 AM | 16 (7.8%) | 21 (13.6%) |
| 7:00 AM to 7:29 AM | 54 (26.5%) | 19 (12.3%) |
| 7:30 AM to 7:59 AM | 4 (2.0%) | 12 (7.7%) |
| 8:00 AM to 8:29 AM | 10 (4.9%) | 40 (25.8%) |
| 8:30 AM to 8:59 AM | 17 (8.3%) | 9 (5.8%) |
| 9:00 AM to 9:59 AM | 0 (0.0%) | 4 (2.6%) |
| 10:00 AM to 10:59 AM | 2 (1.0%) | 13 (8.4%) |
| 11:00 AM to 11:59 AM | 0 (0.0%) | 0 (0.0%) |
| 12:00 PM to 3:59 PM | 0 (0.0%) | 13 (8.4%) |
| 4:00 PM to 11:59 PM | 10 (4.9%) | 11 (7.1%) |
| Total | 204 (100.0%) | 155 (100.0%) |
Housing Occupancy in Belle Vernon borough
Occupancy by Ownership in Belle Vernon borough
Of the total 515 dwellings in Belle Vernon borough, owner-occupied units account for 191 (37.1%), while renter-occupied units make up 324 (62.9%).
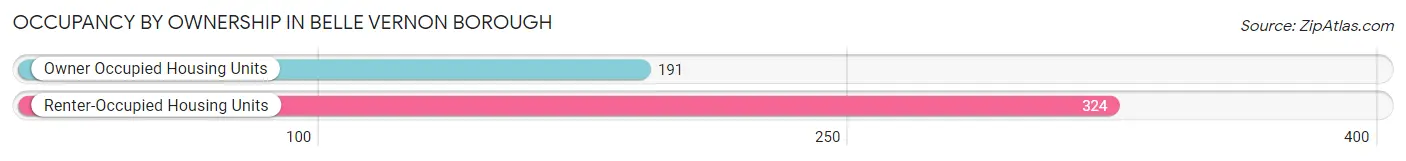
| Occupancy | # Housing Units | % Housing Units |
| Owner Occupied Housing Units | 191 | 37.1% |
| Renter-Occupied Housing Units | 324 | 62.9% |
| Total Occupied Housing Units | 515 | 100.0% |
Occupancy by Household Size in Belle Vernon borough
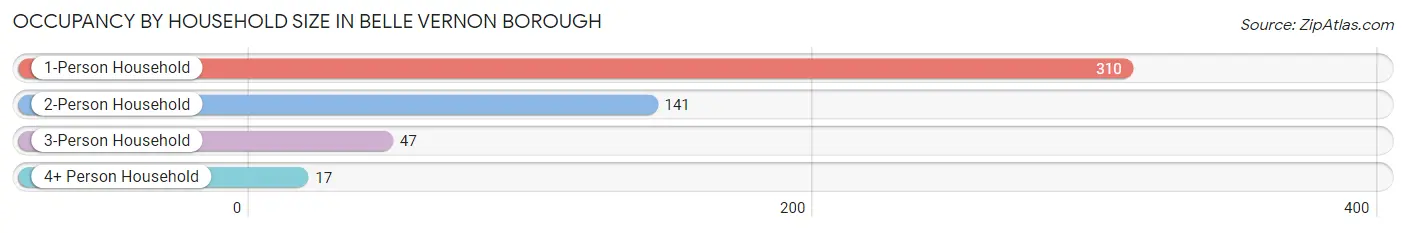
| Household Size | # Housing Units | % Housing Units |
| 1-Person Household | 310 | 60.2% |
| 2-Person Household | 141 | 27.4% |
| 3-Person Household | 47 | 9.1% |
| 4+ Person Household | 17 | 3.3% |
| Total Housing Units | 515 | 100.0% |
Occupancy by Ownership by Household Size in Belle Vernon borough
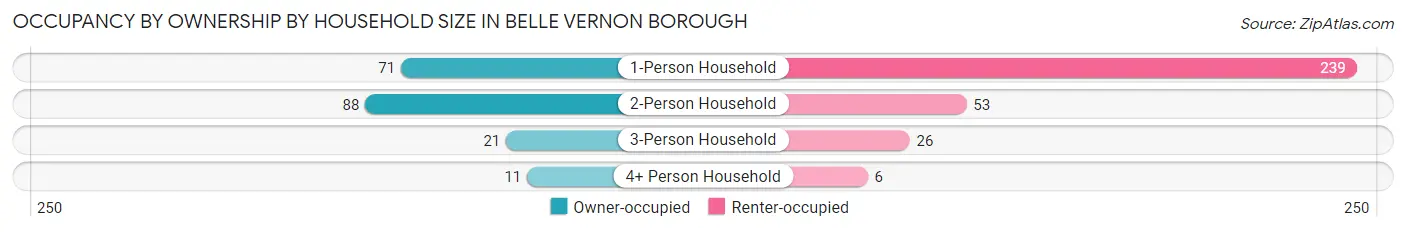
| Household Size | Owner-occupied | Renter-occupied |
| 1-Person Household | 71 (22.9%) | 239 (77.1%) |
| 2-Person Household | 88 (62.4%) | 53 (37.6%) |
| 3-Person Household | 21 (44.7%) | 26 (55.3%) |
| 4+ Person Household | 11 (64.7%) | 6 (35.3%) |
| Total Housing Units | 191 (37.1%) | 324 (62.9%) |
Occupancy by Educational Attainment in Belle Vernon borough
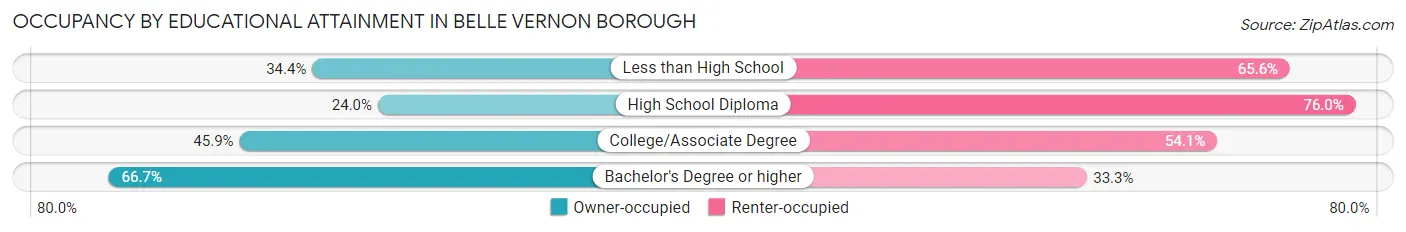
| Household Size | Owner-occupied | Renter-occupied |
| Less than High School | 11 (34.4%) | 21 (65.6%) |
| High School Diploma | 64 (24.0%) | 203 (76.0%) |
| College/Associate Degree | 62 (45.9%) | 73 (54.1%) |
| Bachelor's Degree or higher | 54 (66.7%) | 27 (33.3%) |
Occupancy by Age of Householder in Belle Vernon borough
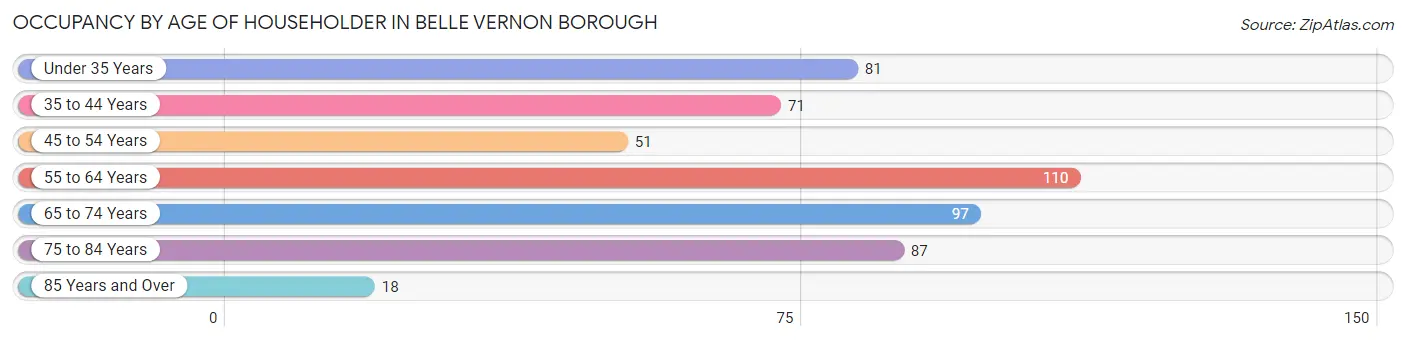
| Age Bracket | # Households | % Households |
| Under 35 Years | 81 | 15.7% |
| 35 to 44 Years | 71 | 13.8% |
| 45 to 54 Years | 51 | 9.9% |
| 55 to 64 Years | 110 | 21.4% |
| 65 to 74 Years | 97 | 18.8% |
| 75 to 84 Years | 87 | 16.9% |
| 85 Years and Over | 18 | 3.5% |
| Total | 515 | 100.0% |
Housing Finances in Belle Vernon borough
Median Income by Occupancy in Belle Vernon borough
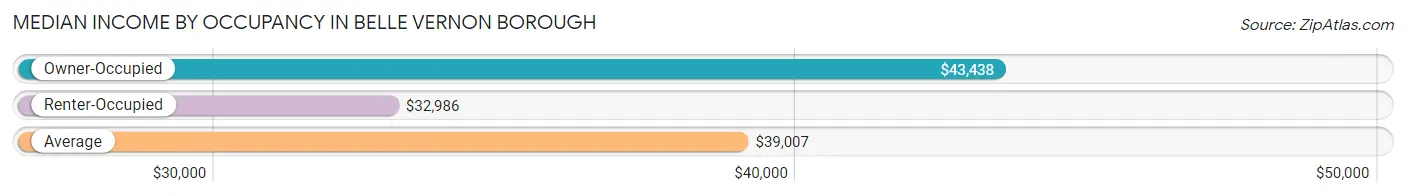
| Occupancy Type | # Households | Median Income |
| Owner-Occupied | 191 (37.1%) | $43,438 |
| Renter-Occupied | 324 (62.9%) | $32,986 |
| Average | 515 (100.0%) | $39,007 |
Occupancy by Householder Income Bracket in Belle Vernon borough
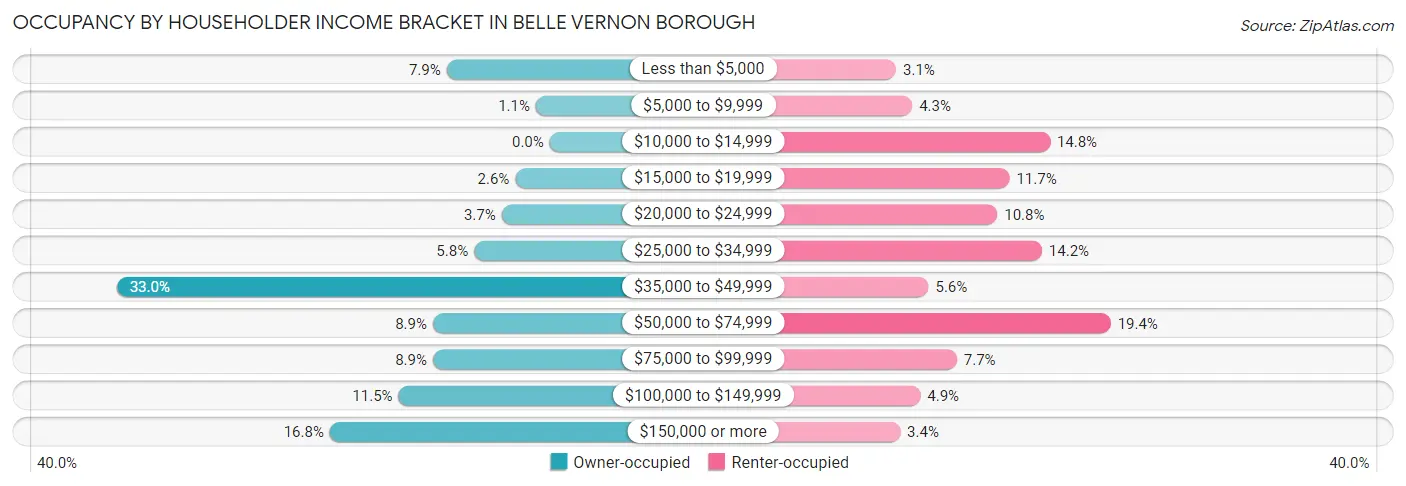
| Income Bracket | Owner-occupied | Renter-occupied |
| Less than $5,000 | 15 (7.9%) | 10 (3.1%) |
| $5,000 to $9,999 | 2 (1.1%) | 14 (4.3%) |
| $10,000 to $14,999 | 0 (0.0%) | 48 (14.8%) |
| $15,000 to $19,999 | 5 (2.6%) | 38 (11.7%) |
| $20,000 to $24,999 | 7 (3.7%) | 35 (10.8%) |
| $25,000 to $34,999 | 11 (5.8%) | 46 (14.2%) |
| $35,000 to $49,999 | 63 (33.0%) | 18 (5.6%) |
| $50,000 to $74,999 | 17 (8.9%) | 63 (19.4%) |
| $75,000 to $99,999 | 17 (8.9%) | 25 (7.7%) |
| $100,000 to $149,999 | 22 (11.5%) | 16 (4.9%) |
| $150,000 or more | 32 (16.8%) | 11 (3.4%) |
| Total | 191 (100.0%) | 324 (100.0%) |
Monthly Housing Cost Tiers in Belle Vernon borough
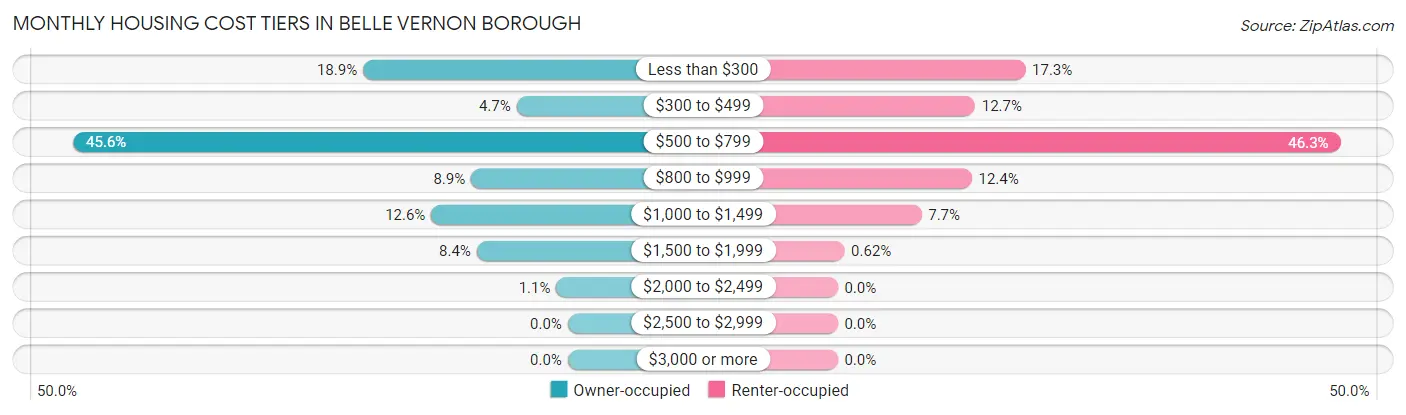
| Monthly Cost | Owner-occupied | Renter-occupied |
| Less than $300 | 36 (18.9%) | 56 (17.3%) |
| $300 to $499 | 9 (4.7%) | 41 (12.7%) |
| $500 to $799 | 87 (45.6%) | 150 (46.3%) |
| $800 to $999 | 17 (8.9%) | 40 (12.3%) |
| $1,000 to $1,499 | 24 (12.6%) | 25 (7.7%) |
| $1,500 to $1,999 | 16 (8.4%) | 2 (0.6%) |
| $2,000 to $2,499 | 2 (1.1%) | 0 (0.0%) |
| $2,500 to $2,999 | 0 (0.0%) | 0 (0.0%) |
| $3,000 or more | 0 (0.0%) | 0 (0.0%) |
| Total | 191 (100.0%) | 324 (100.0%) |
Physical Housing Characteristics in Belle Vernon borough
Housing Structures in Belle Vernon borough
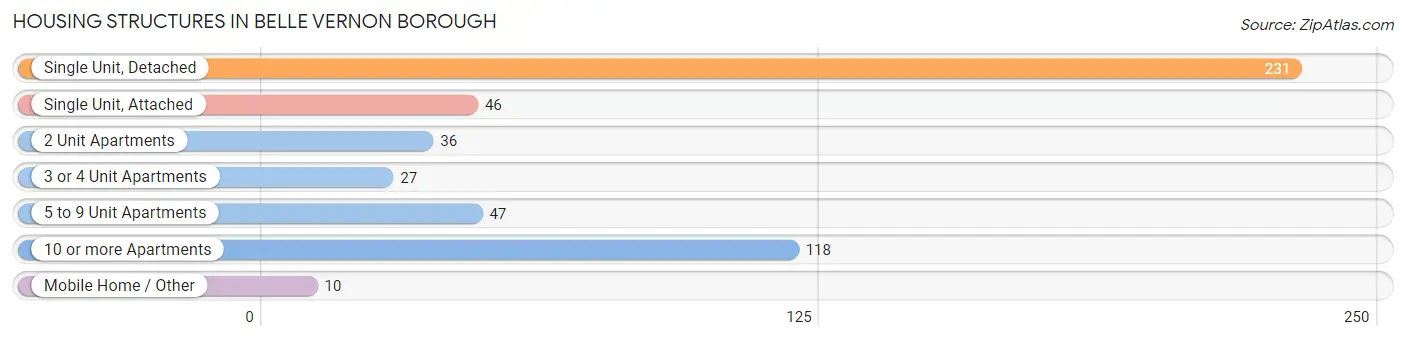
| Structure Type | # Housing Units | % Housing Units |
| Single Unit, Detached | 231 | 44.9% |
| Single Unit, Attached | 46 | 8.9% |
| 2 Unit Apartments | 36 | 7.0% |
| 3 or 4 Unit Apartments | 27 | 5.2% |
| 5 to 9 Unit Apartments | 47 | 9.1% |
| 10 or more Apartments | 118 | 22.9% |
| Mobile Home / Other | 10 | 1.9% |
| Total | 515 | 100.0% |
Housing Structures by Occupancy in Belle Vernon borough
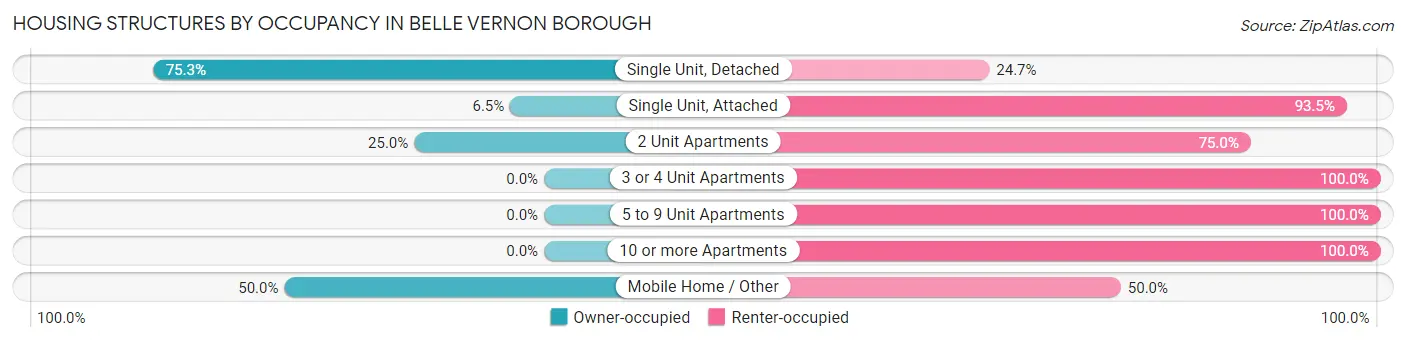
| Structure Type | Owner-occupied | Renter-occupied |
| Single Unit, Detached | 174 (75.3%) | 57 (24.7%) |
| Single Unit, Attached | 3 (6.5%) | 43 (93.5%) |
| 2 Unit Apartments | 9 (25.0%) | 27 (75.0%) |
| 3 or 4 Unit Apartments | 0 (0.0%) | 27 (100.0%) |
| 5 to 9 Unit Apartments | 0 (0.0%) | 47 (100.0%) |
| 10 or more Apartments | 0 (0.0%) | 118 (100.0%) |
| Mobile Home / Other | 5 (50.0%) | 5 (50.0%) |
| Total | 191 (37.1%) | 324 (62.9%) |
Housing Structures by Number of Rooms in Belle Vernon borough
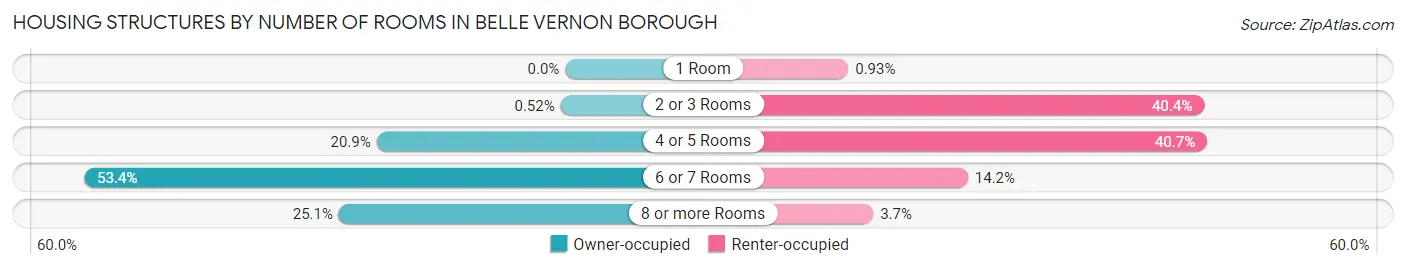
| Number of Rooms | Owner-occupied | Renter-occupied |
| 1 Room | 0 (0.0%) | 3 (0.9%) |
| 2 or 3 Rooms | 1 (0.5%) | 131 (40.4%) |
| 4 or 5 Rooms | 40 (20.9%) | 132 (40.7%) |
| 6 or 7 Rooms | 102 (53.4%) | 46 (14.2%) |
| 8 or more Rooms | 48 (25.1%) | 12 (3.7%) |
| Total | 191 (100.0%) | 324 (100.0%) |
Housing Structure by Heating Type in Belle Vernon borough
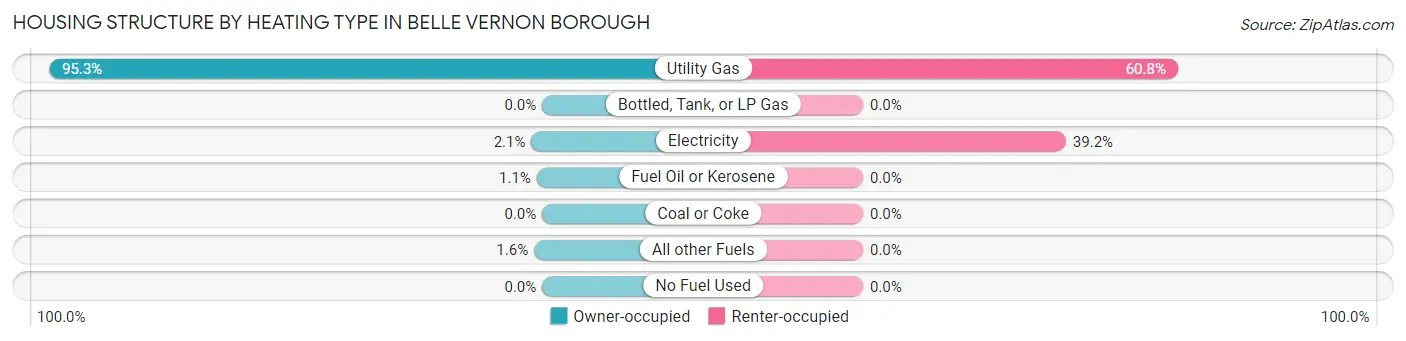
| Heating Type | Owner-occupied | Renter-occupied |
| Utility Gas | 182 (95.3%) | 197 (60.8%) |
| Bottled, Tank, or LP Gas | 0 (0.0%) | 0 (0.0%) |
| Electricity | 4 (2.1%) | 127 (39.2%) |
| Fuel Oil or Kerosene | 2 (1.1%) | 0 (0.0%) |
| Coal or Coke | 0 (0.0%) | 0 (0.0%) |
| All other Fuels | 3 (1.6%) | 0 (0.0%) |
| No Fuel Used | 0 (0.0%) | 0 (0.0%) |
| Total | 191 (100.0%) | 324 (100.0%) |
Household Vehicle Usage in Belle Vernon borough
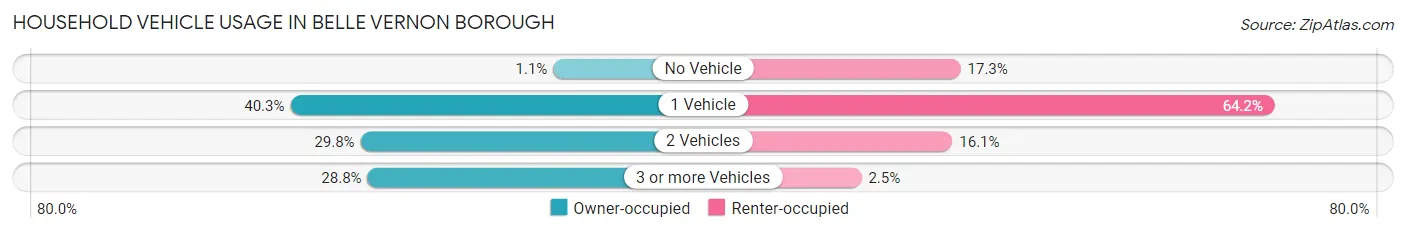
| Vehicles per Household | Owner-occupied | Renter-occupied |
| No Vehicle | 2 (1.1%) | 56 (17.3%) |
| 1 Vehicle | 77 (40.3%) | 208 (64.2%) |
| 2 Vehicles | 57 (29.8%) | 52 (16.1%) |
| 3 or more Vehicles | 55 (28.8%) | 8 (2.5%) |
| Total | 191 (100.0%) | 324 (100.0%) |
Real Estate & Mortgages in Belle Vernon borough
Real Estate and Mortgage Overview in Belle Vernon borough
| Characteristic | Without Mortgage | With Mortgage |
| Housing Units | 125 | 66 |
| Median Property Value | $134,600 | $130,000 |
| Median Household Income | $39,395 | $7 |
| Monthly Housing Costs | $603 | $0 |
| Real Estate Taxes | $1,775 | $5 |
Property Value by Mortgage Status in Belle Vernon borough
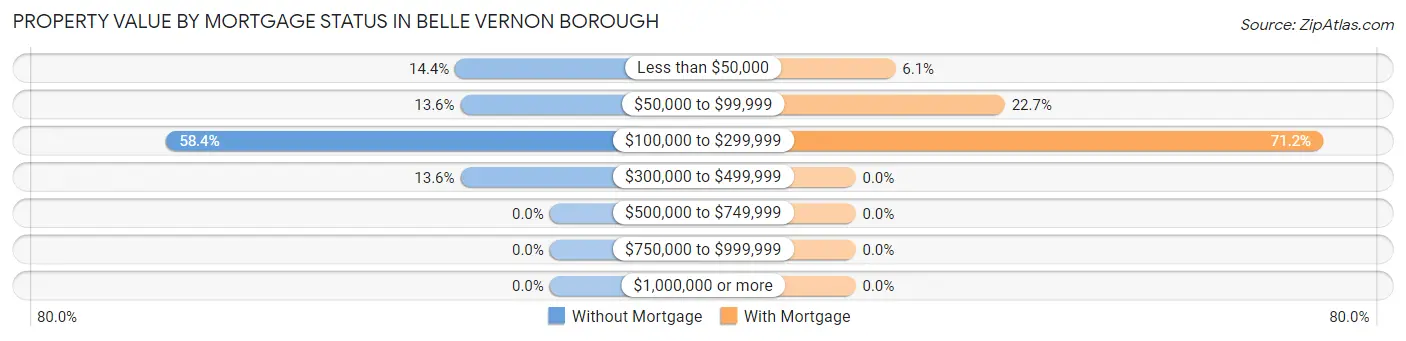
| Property Value | Without Mortgage | With Mortgage |
| Less than $50,000 | 18 (14.4%) | 4 (6.1%) |
| $50,000 to $99,999 | 17 (13.6%) | 15 (22.7%) |
| $100,000 to $299,999 | 73 (58.4%) | 47 (71.2%) |
| $300,000 to $499,999 | 17 (13.6%) | 0 (0.0%) |
| $500,000 to $749,999 | 0 (0.0%) | 0 (0.0%) |
| $750,000 to $999,999 | 0 (0.0%) | 0 (0.0%) |
| $1,000,000 or more | 0 (0.0%) | 0 (0.0%) |
| Total | 125 (100.0%) | 66 (100.0%) |
Household Income by Mortgage Status in Belle Vernon borough
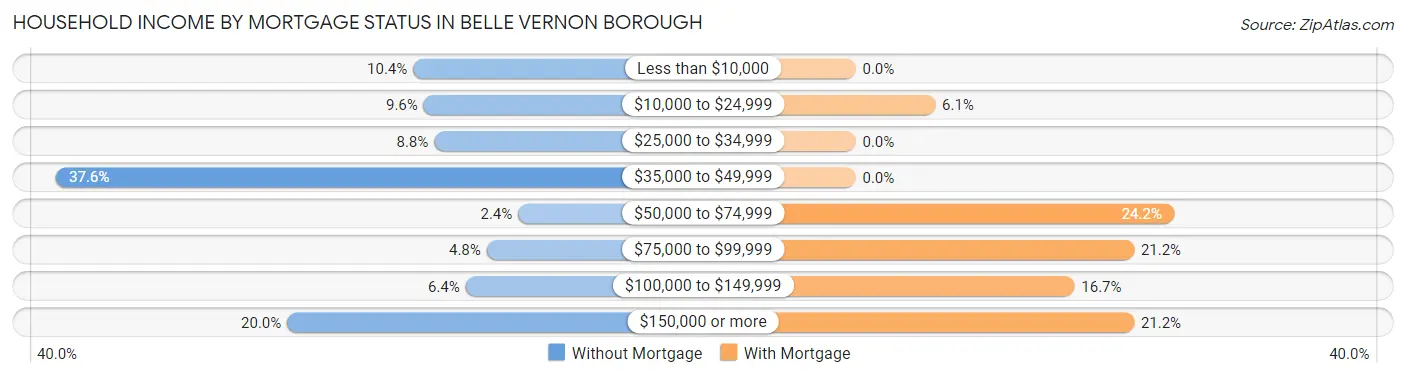
| Household Income | Without Mortgage | With Mortgage |
| Less than $10,000 | 13 (10.4%) | 0 (0.0%) |
| $10,000 to $24,999 | 12 (9.6%) | 4 (6.1%) |
| $25,000 to $34,999 | 11 (8.8%) | 0 (0.0%) |
| $35,000 to $49,999 | 47 (37.6%) | 0 (0.0%) |
| $50,000 to $74,999 | 3 (2.4%) | 16 (24.2%) |
| $75,000 to $99,999 | 6 (4.8%) | 14 (21.2%) |
| $100,000 to $149,999 | 8 (6.4%) | 11 (16.7%) |
| $150,000 or more | 25 (20.0%) | 14 (21.2%) |
| Total | 125 (100.0%) | 66 (100.0%) |
Property Value to Household Income Ratio in Belle Vernon borough
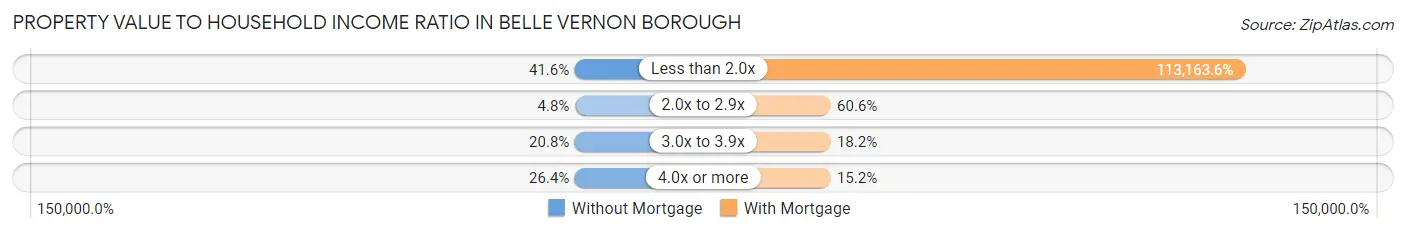
| Value-to-Income Ratio | Without Mortgage | With Mortgage |
| Less than 2.0x | 52 (41.6%) | 74,688 (113,163.6%) |
| 2.0x to 2.9x | 6 (4.8%) | 40 (60.6%) |
| 3.0x to 3.9x | 26 (20.8%) | 12 (18.2%) |
| 4.0x or more | 33 (26.4%) | 10 (15.1%) |
| Total | 125 (100.0%) | 66 (100.0%) |
Real Estate Taxes by Mortgage Status in Belle Vernon borough
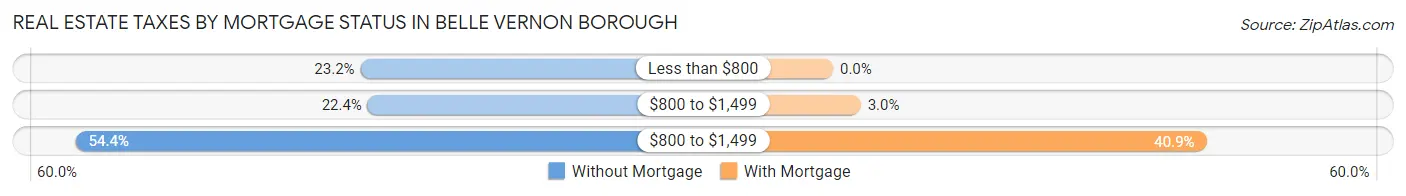
| Property Taxes | Without Mortgage | With Mortgage |
| Less than $800 | 29 (23.2%) | 0 (0.0%) |
| $800 to $1,499 | 28 (22.4%) | 2 (3.0%) |
| $800 to $1,499 | 68 (54.4%) | 27 (40.9%) |
| Total | 125 (100.0%) | 66 (100.0%) |
Health & Disability in Belle Vernon borough
Health Insurance Coverage by Age in Belle Vernon borough
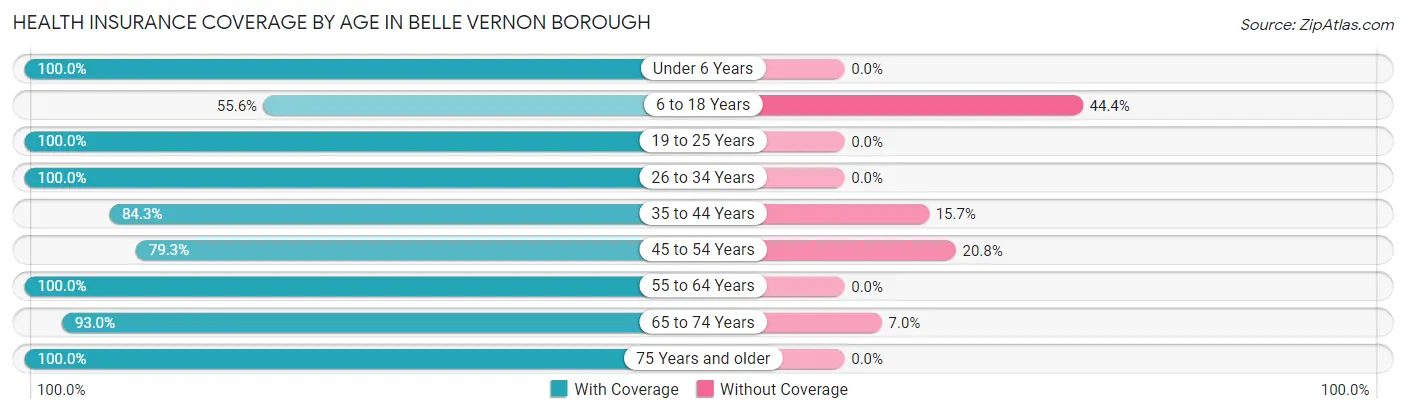
| Age Bracket | With Coverage | Without Coverage |
| Under 6 Years | 38 (100.0%) | 0 (0.0%) |
| 6 to 18 Years | 30 (55.6%) | 24 (44.4%) |
| 19 to 25 Years | 36 (100.0%) | 0 (0.0%) |
| 26 to 34 Years | 126 (100.0%) | 0 (0.0%) |
| 35 to 44 Years | 91 (84.3%) | 17 (15.7%) |
| 45 to 54 Years | 42 (79.2%) | 11 (20.7%) |
| 55 to 64 Years | 135 (100.0%) | 0 (0.0%) |
| 65 to 74 Years | 107 (93.0%) | 8 (7.0%) |
| 75 Years and older | 138 (100.0%) | 0 (0.0%) |
| Total | 743 (92.5%) | 60 (7.5%) |
Health Insurance Coverage by Citizenship Status in Belle Vernon borough
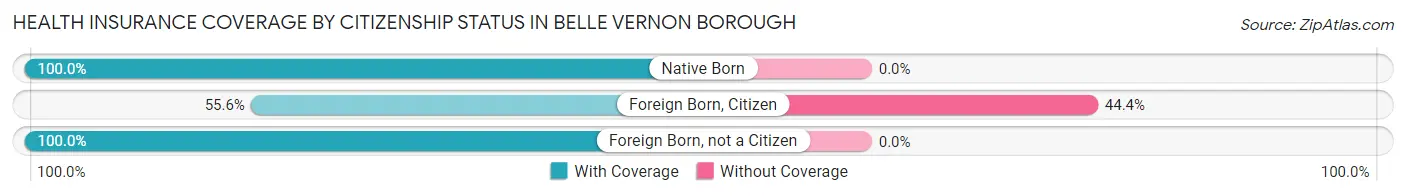
| Citizenship Status | With Coverage | Without Coverage |
| Native Born | 38 (100.0%) | 0 (0.0%) |
| Foreign Born, Citizen | 30 (55.6%) | 24 (44.4%) |
| Foreign Born, not a Citizen | 36 (100.0%) | 0 (0.0%) |
Health Insurance Coverage by Household Income in Belle Vernon borough
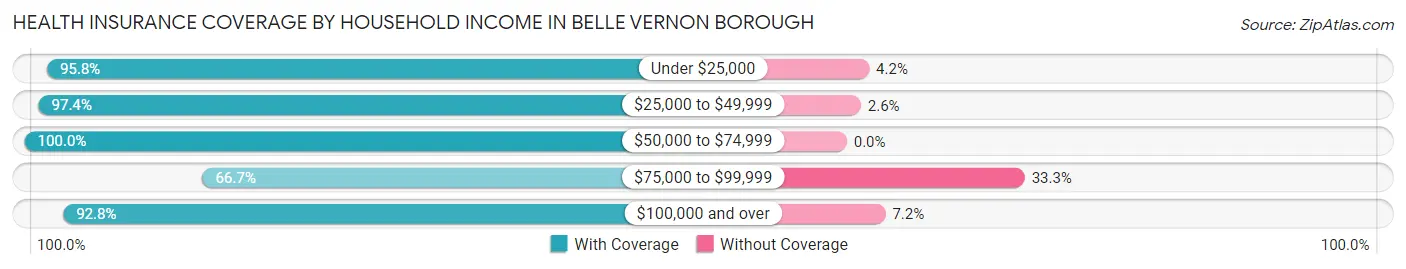
| Household Income | With Coverage | Without Coverage |
| Under $25,000 | 183 (95.8%) | 8 (4.2%) |
| $25,000 to $49,999 | 185 (97.4%) | 5 (2.6%) |
| $50,000 to $74,999 | 162 (100.0%) | 0 (0.0%) |
| $75,000 to $99,999 | 72 (66.7%) | 36 (33.3%) |
| $100,000 and over | 141 (92.8%) | 11 (7.2%) |
Public vs Private Health Insurance Coverage by Age in Belle Vernon borough
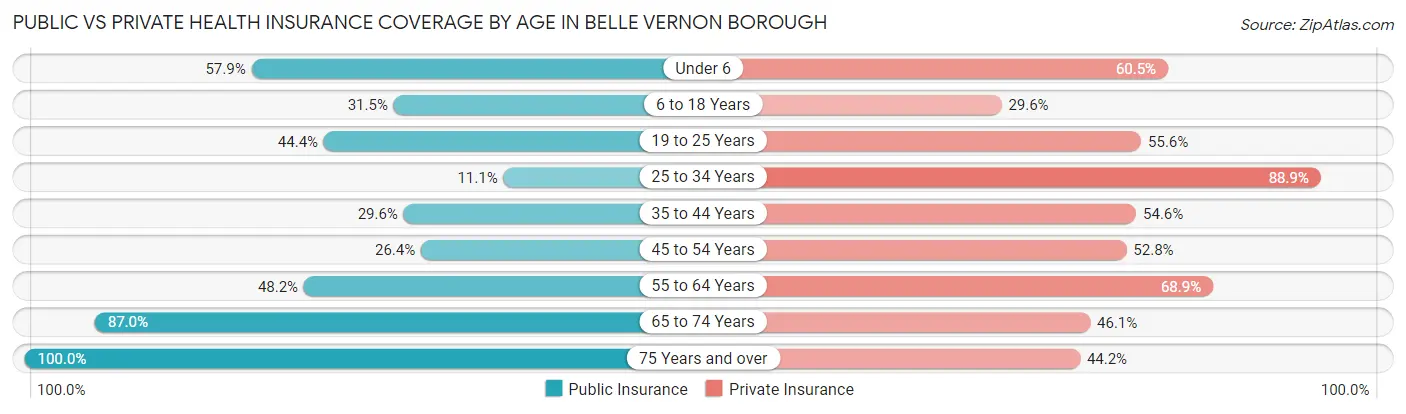
| Age Bracket | Public Insurance | Private Insurance |
| Under 6 | 22 (57.9%) | 23 (60.5%) |
| 6 to 18 Years | 17 (31.5%) | 16 (29.6%) |
| 19 to 25 Years | 16 (44.4%) | 20 (55.6%) |
| 25 to 34 Years | 14 (11.1%) | 112 (88.9%) |
| 35 to 44 Years | 32 (29.6%) | 59 (54.6%) |
| 45 to 54 Years | 14 (26.4%) | 28 (52.8%) |
| 55 to 64 Years | 65 (48.1%) | 93 (68.9%) |
| 65 to 74 Years | 100 (87.0%) | 53 (46.1%) |
| 75 Years and over | 138 (100.0%) | 61 (44.2%) |
| Total | 418 (52.0%) | 465 (57.9%) |
Disability Status by Sex by Age in Belle Vernon borough
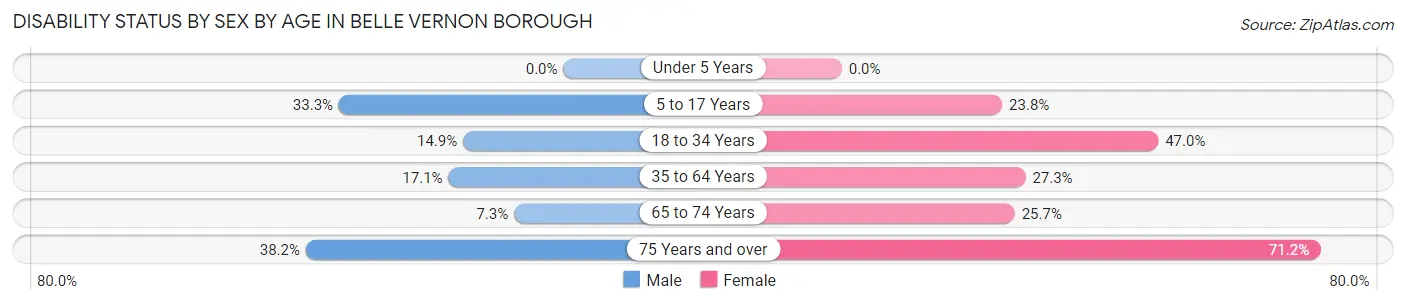
| Age Bracket | Male | Female |
| Under 5 Years | 0 (0.0%) | 0 (0.0%) |
| 5 to 17 Years | 6 (33.3%) | 5 (23.8%) |
| 18 to 34 Years | 14 (14.9%) | 39 (47.0%) |
| 35 to 64 Years | 28 (17.1%) | 36 (27.3%) |
| 65 to 74 Years | 3 (7.3%) | 19 (25.7%) |
| 75 Years and over | 13 (38.2%) | 74 (71.2%) |
Disability Class by Sex by Age in Belle Vernon borough
Disability Class: Hearing Difficulty
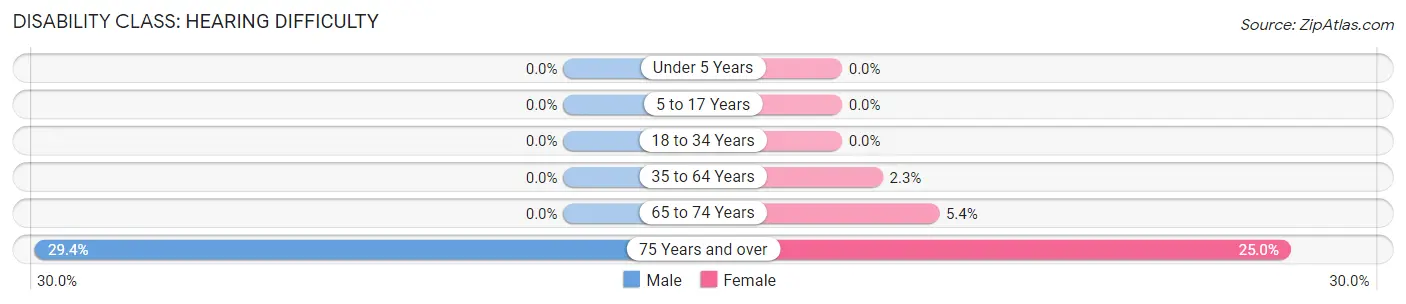
| Age Bracket | Male | Female |
| Under 5 Years | 0 (0.0%) | 0 (0.0%) |
| 5 to 17 Years | 0 (0.0%) | 0 (0.0%) |
| 18 to 34 Years | 0 (0.0%) | 0 (0.0%) |
| 35 to 64 Years | 0 (0.0%) | 3 (2.3%) |
| 65 to 74 Years | 0 (0.0%) | 4 (5.4%) |
| 75 Years and over | 10 (29.4%) | 26 (25.0%) |
Disability Class: Vision Difficulty
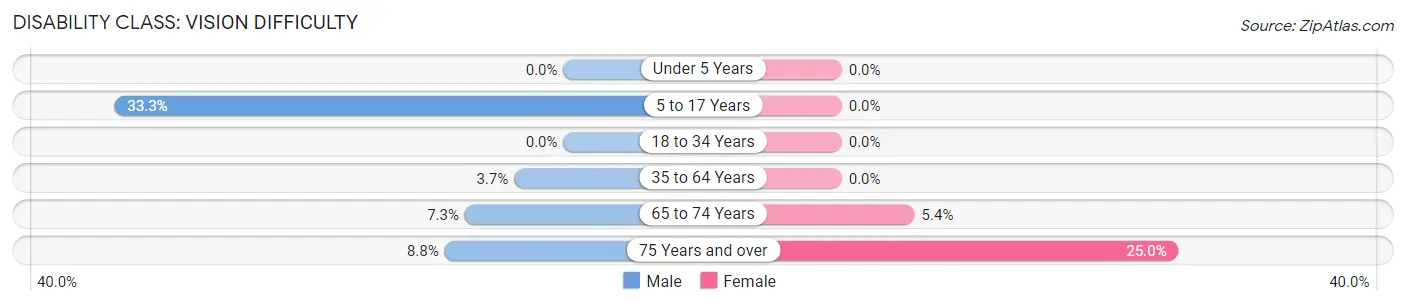
| Age Bracket | Male | Female |
| Under 5 Years | 0 (0.0%) | 0 (0.0%) |
| 5 to 17 Years | 6 (33.3%) | 0 (0.0%) |
| 18 to 34 Years | 0 (0.0%) | 0 (0.0%) |
| 35 to 64 Years | 6 (3.7%) | 0 (0.0%) |
| 65 to 74 Years | 3 (7.3%) | 4 (5.4%) |
| 75 Years and over | 3 (8.8%) | 26 (25.0%) |
Disability Class: Cognitive Difficulty
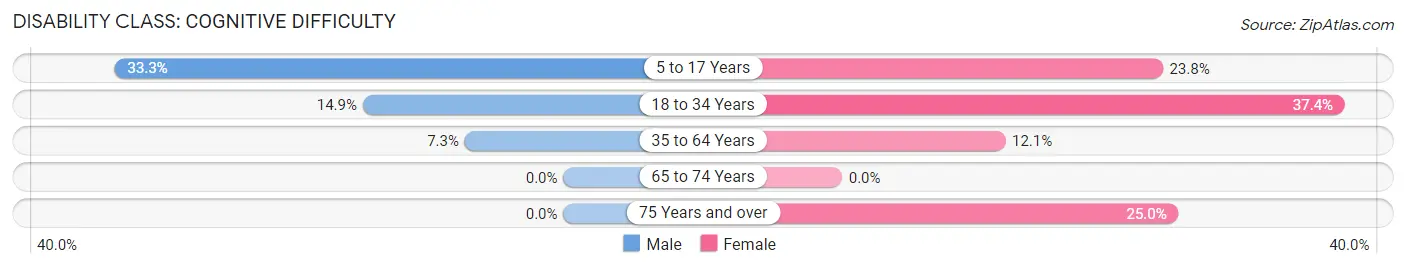
| Age Bracket | Male | Female |
| 5 to 17 Years | 6 (33.3%) | 5 (23.8%) |
| 18 to 34 Years | 14 (14.9%) | 31 (37.3%) |
| 35 to 64 Years | 12 (7.3%) | 16 (12.1%) |
| 65 to 74 Years | 0 (0.0%) | 0 (0.0%) |
| 75 Years and over | 0 (0.0%) | 26 (25.0%) |
Disability Class: Ambulatory Difficulty
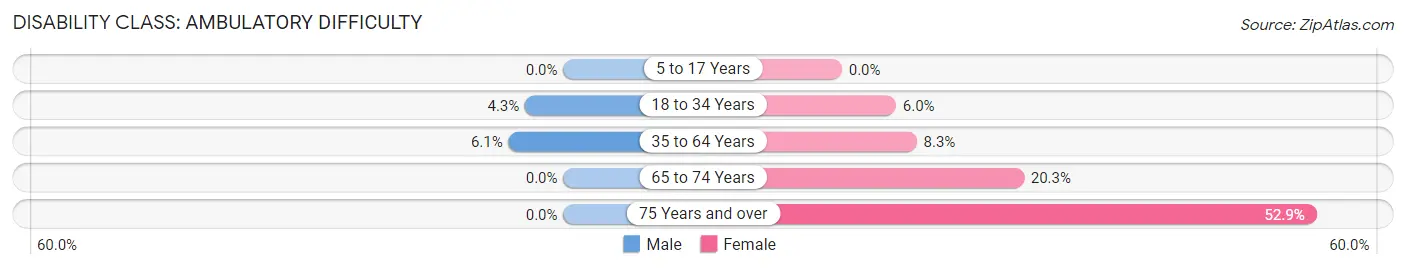
| Age Bracket | Male | Female |
| 5 to 17 Years | 0 (0.0%) | 0 (0.0%) |
| 18 to 34 Years | 4 (4.3%) | 5 (6.0%) |
| 35 to 64 Years | 10 (6.1%) | 11 (8.3%) |
| 65 to 74 Years | 0 (0.0%) | 15 (20.3%) |
| 75 Years and over | 0 (0.0%) | 55 (52.9%) |
Disability Class: Self-Care Difficulty
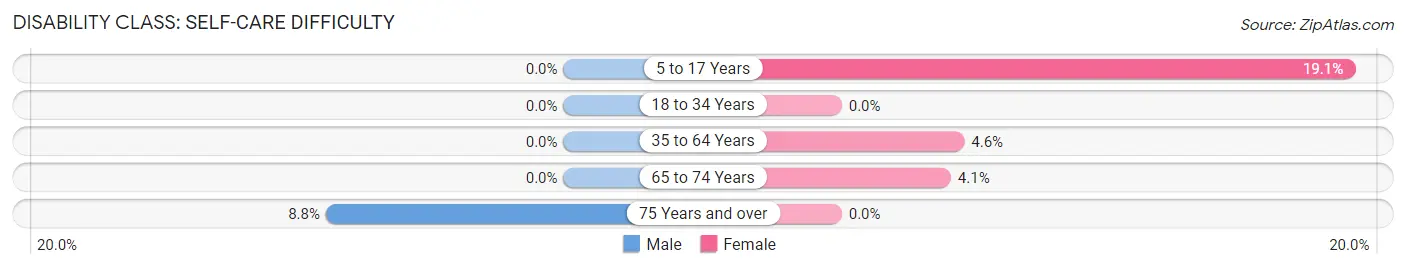
| Age Bracket | Male | Female |
| 5 to 17 Years | 0 (0.0%) | 4 (19.1%) |
| 18 to 34 Years | 0 (0.0%) | 0 (0.0%) |
| 35 to 64 Years | 0 (0.0%) | 6 (4.5%) |
| 65 to 74 Years | 0 (0.0%) | 3 (4.1%) |
| 75 Years and over | 3 (8.8%) | 0 (0.0%) |
Technology Access in Belle Vernon borough
Computing Device Access in Belle Vernon borough
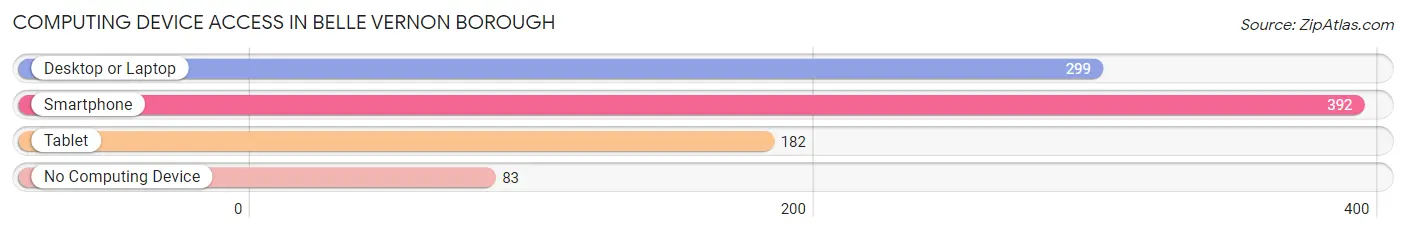
| Device Type | # Households | % Households |
| Desktop or Laptop | 299 | 58.1% |
| Smartphone | 392 | 76.1% |
| Tablet | 182 | 35.3% |
| No Computing Device | 83 | 16.1% |
| Total | 515 | 100.0% |
Internet Access in Belle Vernon borough
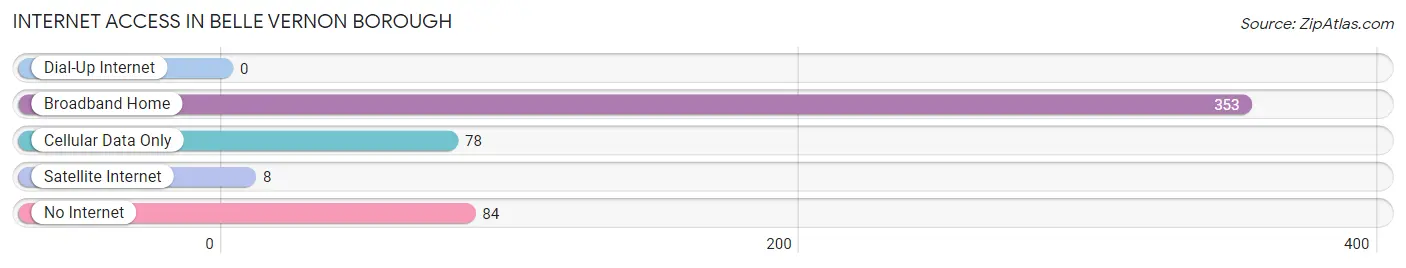
| Internet Type | # Households | % Households |
| Dial-Up Internet | 0 | 0.0% |
| Broadband Home | 353 | 68.5% |
| Cellular Data Only | 78 | 15.1% |
| Satellite Internet | 8 | 1.5% |
| No Internet | 84 | 16.3% |
| Total | 515 | 100.0% |
Belle Vernon borough Summary
Belle Vernon Borough is a borough located in Fayette County, Pennsylvania. It is situated along the Monongahela River, approximately 25 miles south of Pittsburgh. The population of Belle Vernon Borough was 2,945 at the 2010 census.
History
Belle Vernon Borough was founded in 1836 by John and Mary Belle, who named the town after their daughter, Vernon. The town was incorporated in 1867. Belle Vernon was a major stop on the Pittsburgh and Lake Erie Railroad, which ran through the town until the late 1960s. The railroad was a major factor in the growth of the town, as it allowed for the transportation of goods and people.
In the early 1900s, Belle Vernon was a thriving industrial center, with several coal mines, steel mills, and other factories. The town was also home to several large retail stores, including a department store, a grocery store, and a drug store.
In the 1950s, the town began to decline as the steel industry moved away from the area. The town's population decreased, and many of the businesses closed. In the late 1970s, the town began to experience a resurgence, as new businesses moved into the area.
Geography
Belle Vernon Borough is located at 40°10'N 79°51'W (40.17, -79.85). It is situated along the Monongahela River, approximately 25 miles south of Pittsburgh. The borough has a total area of 1.2 square miles, all of which is land.
Economy
The economy of Belle Vernon Borough is largely based on retail and services. The town is home to several small businesses, including restaurants, shops, and professional services. The town is also home to a number of manufacturing companies, including a steel mill and a plastics factory.
Demographics
As of the 2010 census, there were 2,945 people, 1,220 households, and 790 families residing in the borough. The population density was 2,457.3 people per square mile. The racial makeup of the borough was 97.2% White, 0.7% African American, 0.2% Native American, 0.3% Asian, 0.1% from other races, and 1.5% from two or more races. Hispanic or Latino of any race were 0.7% of the population.
The median income for a household in the borough was $37,917, and the median income for a family was $45,000. Males had a median income of $35,000 versus $25,000 for females. The per capita income for the borough was $17,845. About 8.2% of families and 10.2% of the population were below the poverty line, including 14.2% of those under age 18 and 8.2% of those age 65 or over.
Conclusion
Belle Vernon Borough is a small borough located in Fayette County, Pennsylvania. It is situated along the Monongahela River, approximately 25 miles south of Pittsburgh. The town was founded in 1836 and was once a thriving industrial center. Today, the economy of Belle Vernon Borough is largely based on retail and services. The population of the borough was 2,945 at the 2010 census.
Common Questions
What is Per Capita Income in Belle Vernon borough?
Per Capita income in Belle Vernon borough is $44,974.
What is the Median Family Income in Belle Vernon borough?
Median Family Income in Belle Vernon borough is $73,438.
What is the Median Household income in Belle Vernon borough?
Median Household Income in Belle Vernon borough is $39,007.
What is Income or Wage Gap in Belle Vernon borough?
Income or Wage Gap in Belle Vernon borough is 39.5%.
Women in Belle Vernon borough earn 60.5 cents for every dollar earned by a man.
What is Inequality or Gini Index in Belle Vernon borough?
Inequality or Gini Index in Belle Vernon borough is 0.57.
What is the Total Population of Belle Vernon borough?
Total Population of Belle Vernon borough is 803.
What is the Total Male Population of Belle Vernon borough?
Total Male Population of Belle Vernon borough is 370.
What is the Total Female Population of Belle Vernon borough?
Total Female Population of Belle Vernon borough is 433.
What is the Ratio of Males per 100 Females in Belle Vernon borough?
There are 85.45 Males per 100 Females in Belle Vernon borough.
What is the Ratio of Females per 100 Males in Belle Vernon borough?
There are 117.03 Females per 100 Males in Belle Vernon borough.
What is the Median Population Age in Belle Vernon borough?
Median Population Age in Belle Vernon borough is 52.4 Years.
What is the Average Family Size in Belle Vernon borough
Average Family Size in Belle Vernon borough is 2.5 People.
What is the Average Household Size in Belle Vernon borough
Average Household Size in Belle Vernon borough is 1.6 People.
How Large is the Labor Force in Belle Vernon borough?
There are 426 People in the Labor Forcein in Belle Vernon borough.
What is the Percentage of People in the Labor Force in Belle Vernon borough?
58.4% of People are in the Labor Force in Belle Vernon borough.
What is the Unemployment Rate in Belle Vernon borough?
Unemployment Rate in Belle Vernon borough is 9.4%.