East Side borough, PA Map & Demographics
East Side borough Overview
$35,766
PER CAPITA INCOME
$81,875
AVG FAMILY INCOME
$66,875
AVG HOUSEHOLD INCOME
52.3%
WAGE / INCOME GAP [ % ]
47.7¢/ $1
WAGE / INCOME GAP [ $ ]
0.45
INEQUALITY / GINI INDEX
259
TOTAL POPULATION
116
MALE POPULATION
143
FEMALE POPULATION
81.12
MALES / 100 FEMALES
123.28
FEMALES / 100 MALES
40.7
MEDIAN AGE
3.1
AVG FAMILY SIZE
2.4
AVG HOUSEHOLD SIZE
132
LABOR FORCE [ PEOPLE ]
64.1%
PERCENT IN LABOR FORCE
4.5%
UNEMPLOYMENT RATE
Income in East Side borough
Income Overview in East Side borough
Per Capita Income in East Side borough is $35,766, while median incomes of families and households are $81,875 and $66,875 respectively.
| Characteristic | Number | Measure |
| Per Capita Income | 259 | $35,766 |
| Median Family Income | 64 | $81,875 |
| Mean Family Income | 64 | $91,484 |
| Median Household Income | 109 | $66,875 |
| Mean Household Income | 109 | $80,242 |
| Income Deficit | 64 | $0 |
| Wage / Income Gap (%) | 259 | 52.27% |
| Wage / Income Gap ($) | 259 | 47.73¢ per $1 |
| Gini / Inequality Index | 259 | 0.45 |
Earnings by Sex in East Side borough
Average Earnings in East Side borough are $40,000, $55,000 for men and $26,250 for women, a difference of 52.3%.
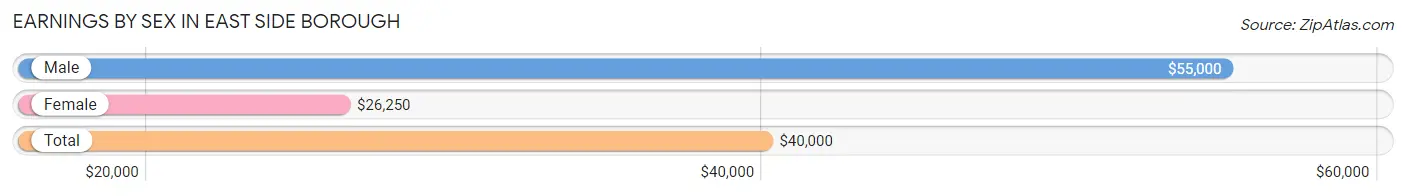
| Sex | Number | Average Earnings |
| Male | 68 (51.5%) | $55,000 |
| Female | 64 (48.5%) | $26,250 |
| Total | 132 (100.0%) | $40,000 |
Earnings by Sex by Income Bracket in East Side borough
The most common earnings brackets in East Side borough are $75,000 to $99,999 for men (14 | 20.6%) and $55,000 to $64,999 for women (13 | 20.3%).
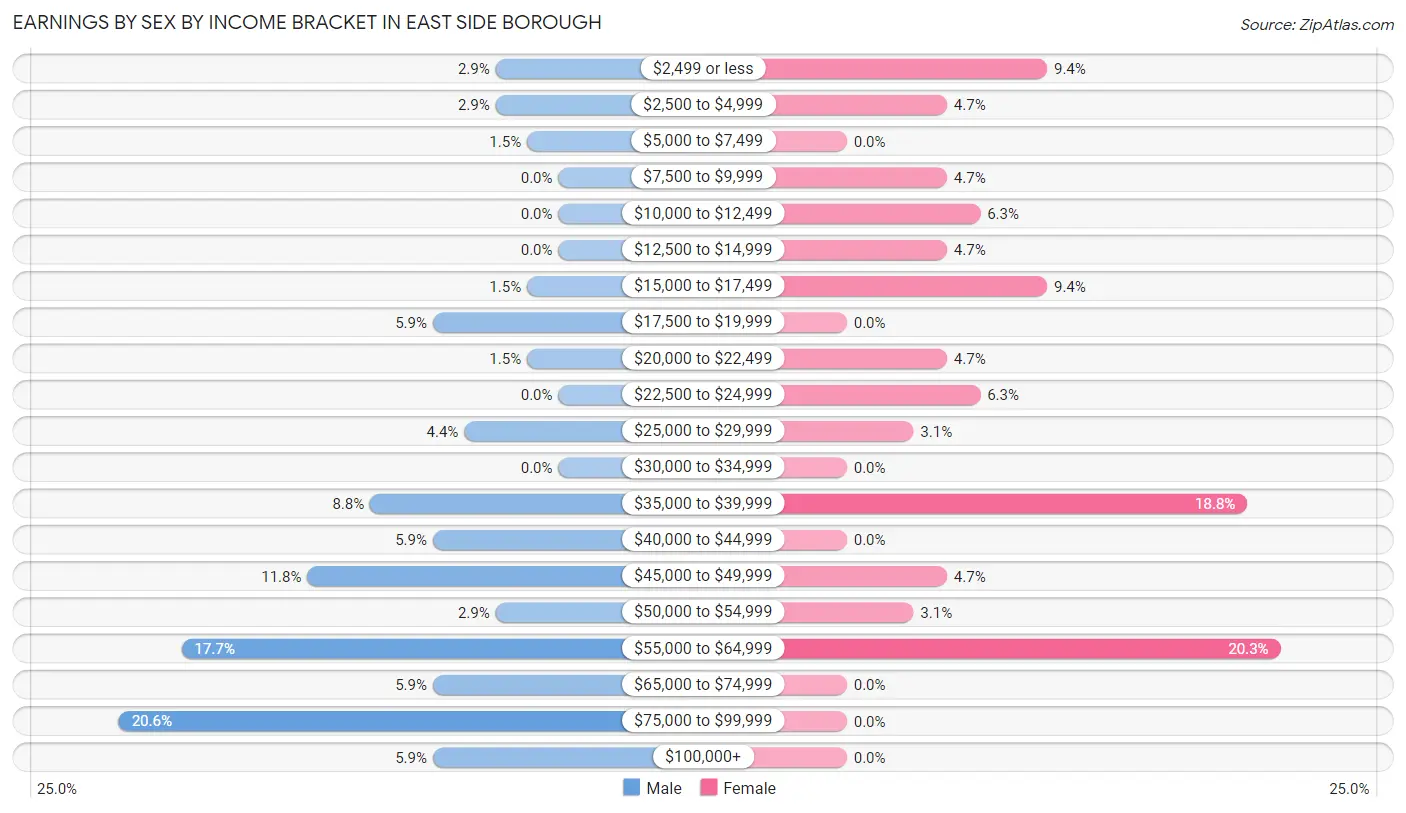
| Income | Male | Female |
| $2,499 or less | 2 (2.9%) | 6 (9.4%) |
| $2,500 to $4,999 | 2 (2.9%) | 3 (4.7%) |
| $5,000 to $7,499 | 1 (1.5%) | 0 (0.0%) |
| $7,500 to $9,999 | 0 (0.0%) | 3 (4.7%) |
| $10,000 to $12,499 | 0 (0.0%) | 4 (6.2%) |
| $12,500 to $14,999 | 0 (0.0%) | 3 (4.7%) |
| $15,000 to $17,499 | 1 (1.5%) | 6 (9.4%) |
| $17,500 to $19,999 | 4 (5.9%) | 0 (0.0%) |
| $20,000 to $22,499 | 1 (1.5%) | 3 (4.7%) |
| $22,500 to $24,999 | 0 (0.0%) | 4 (6.2%) |
| $25,000 to $29,999 | 3 (4.4%) | 2 (3.1%) |
| $30,000 to $34,999 | 0 (0.0%) | 0 (0.0%) |
| $35,000 to $39,999 | 6 (8.8%) | 12 (18.8%) |
| $40,000 to $44,999 | 4 (5.9%) | 0 (0.0%) |
| $45,000 to $49,999 | 8 (11.8%) | 3 (4.7%) |
| $50,000 to $54,999 | 2 (2.9%) | 2 (3.1%) |
| $55,000 to $64,999 | 12 (17.6%) | 13 (20.3%) |
| $65,000 to $74,999 | 4 (5.9%) | 0 (0.0%) |
| $75,000 to $99,999 | 14 (20.6%) | 0 (0.0%) |
| $100,000+ | 4 (5.9%) | 0 (0.0%) |
| Total | 68 (100.0%) | 64 (100.0%) |
Earnings by Sex by Educational Attainment in East Side borough
Average earnings in East Side borough are $55,000 for men and $35,104 for women, a difference of 36.2%. Men with an educational attainment of high school diploma enjoy the highest average annual earnings of $49,821, while those with college or associate's degree education earn the least with $43,438. Women with an educational attainment of college or associate's degree earn the most with the average annual earnings of $55,000, while those with high school diploma education have the smallest earnings of $15,417.
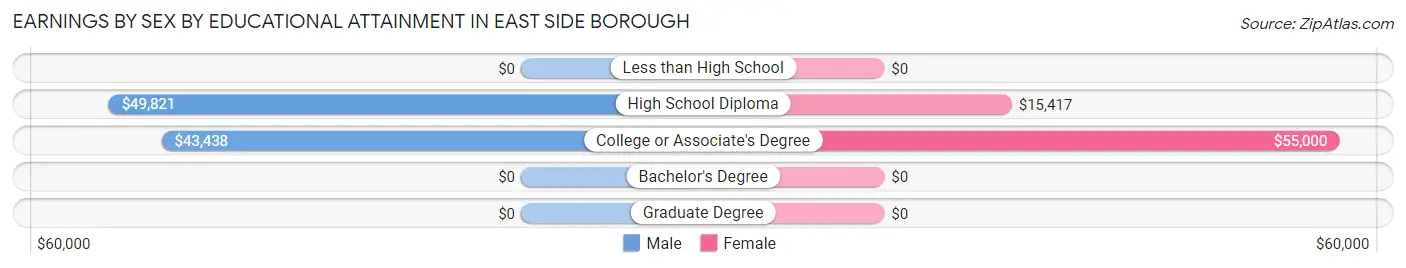
| Educational Attainment | Male Income | Female Income |
| Less than High School | - | - |
| High School Diploma | $49,821 | $15,417 |
| College or Associate's Degree | $43,438 | $55,000 |
| Bachelor's Degree | - | - |
| Graduate Degree | - | - |
| Total | $55,000 | $35,104 |
Family Income in East Side borough
Family Income Brackets in East Side borough
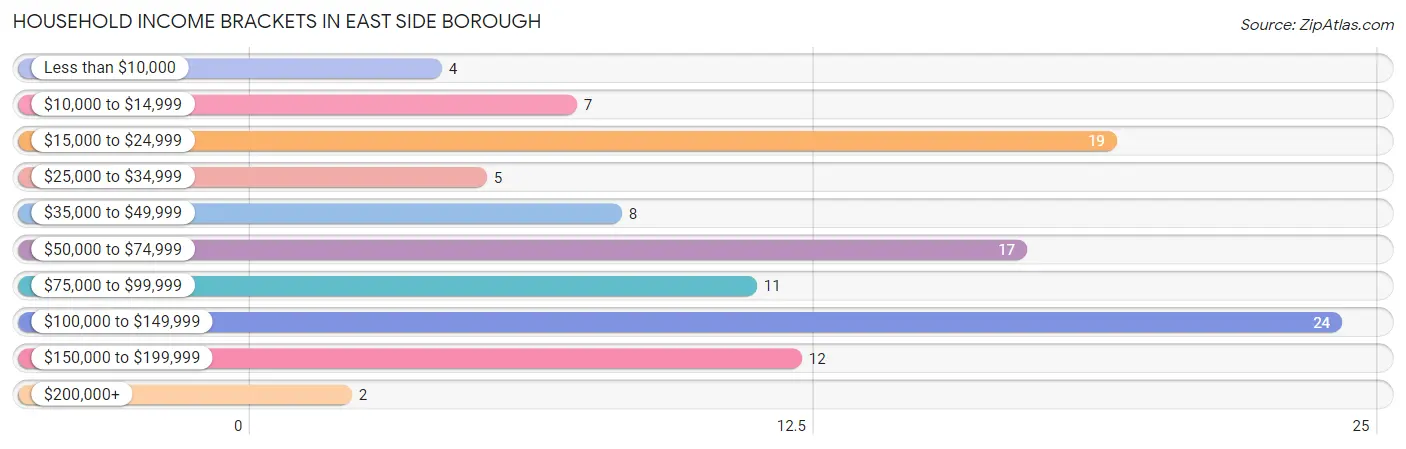
According to the East Side borough family income data, there are 23 families falling into the $100,000 to $149,999 income range, which is the most common income bracket and makes up 35.9% of all families. Conversely, the $10,000 to $14,999 income bracket is the least frequent group with only 1 families (1.6%) belonging to this category.
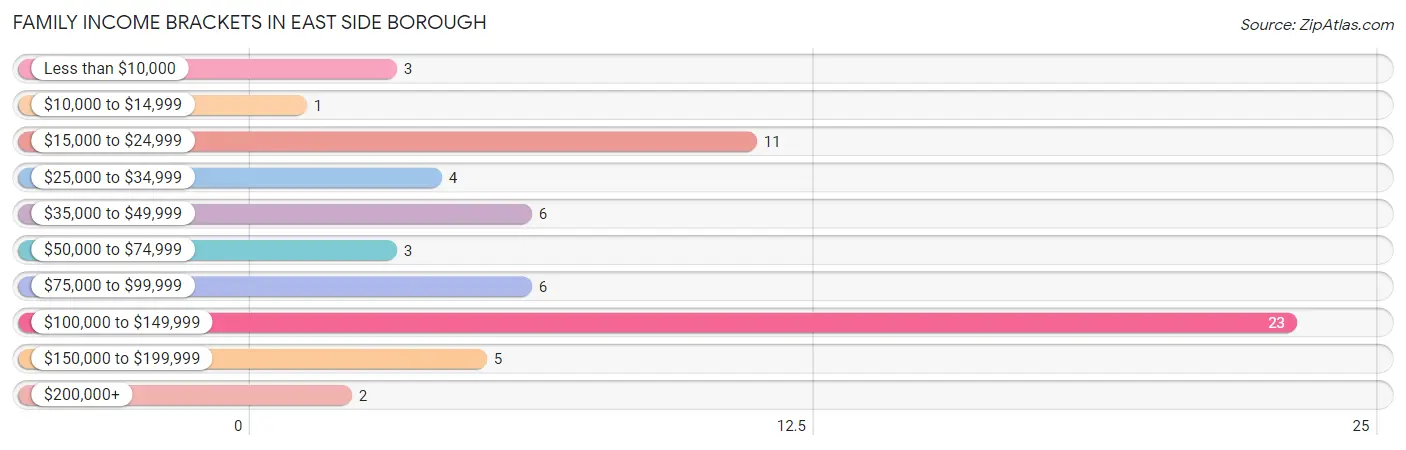
| Income Bracket | # Families | % Families |
| Less than $10,000 | 3 | 4.7% |
| $10,000 to $14,999 | 1 | 1.6% |
| $15,000 to $24,999 | 11 | 17.2% |
| $25,000 to $34,999 | 4 | 6.3% |
| $35,000 to $49,999 | 6 | 9.4% |
| $50,000 to $74,999 | 3 | 4.7% |
| $75,000 to $99,999 | 6 | 9.4% |
| $100,000 to $149,999 | 23 | 35.9% |
| $150,000 to $199,999 | 5 | 7.8% |
| $200,000+ | 2 | 3.1% |
Family Income by Famaliy Size in East Side borough
4-person families (14 | 21.9%) account for the highest median family income in East Side borough with $124,167 per family, while 4-person families (14 | 21.9%) have the highest median income of $31,042 per family member.
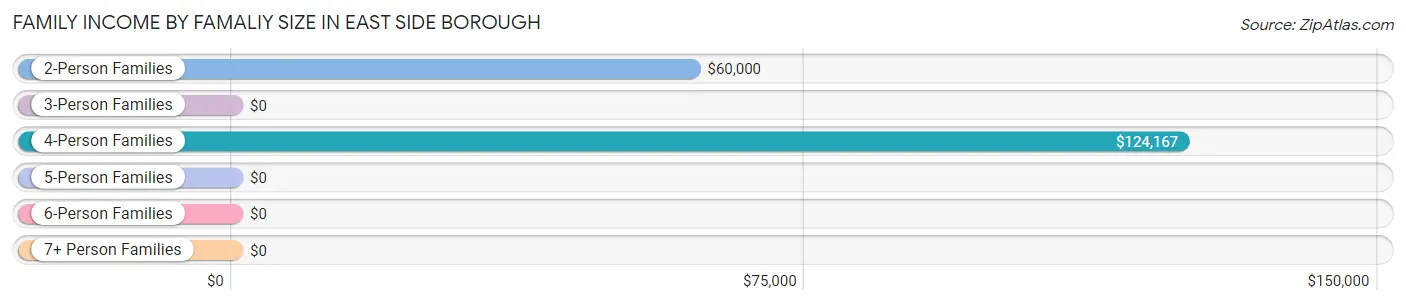
| Income Bracket | # Families | Median Income |
| 2-Person Families | 24 (37.5%) | $60,000 |
| 3-Person Families | 19 (29.7%) | $0 |
| 4-Person Families | 14 (21.9%) | $124,167 |
| 5-Person Families | 2 (3.1%) | $0 |
| 6-Person Families | 5 (7.8%) | $0 |
| 7+ Person Families | 0 (0.0%) | $0 |
| Total | 64 (100.0%) | $81,875 |
Family Income by Number of Earners in East Side borough
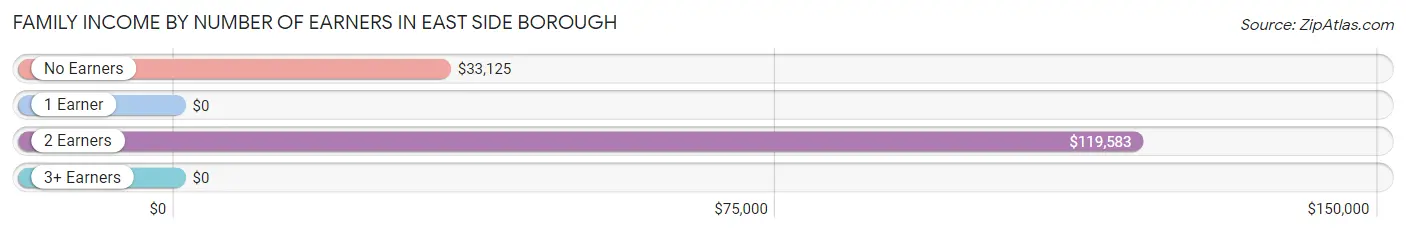
| Number of Earners | # Families | Median Income |
| No Earners | 9 (14.1%) | $33,125 |
| 1 Earner | 21 (32.8%) | $0 |
| 2 Earners | 27 (42.2%) | $119,583 |
| 3+ Earners | 7 (10.9%) | $0 |
| Total | 64 (100.0%) | $81,875 |
Household Income in East Side borough
Household Income Brackets in East Side borough
With 24 households falling in the category, the $100,000 to $149,999 income range is the most frequent in East Side borough, accounting for 22.0% of all households. In contrast, only 2 households (1.8%) fall into the $200,000+ income bracket, making it the least populous group.
| Income Bracket | # Households | % Households |
| Less than $10,000 | 4 | 3.7% |
| $10,000 to $14,999 | 7 | 6.4% |
| $15,000 to $24,999 | 19 | 17.4% |
| $25,000 to $34,999 | 5 | 4.6% |
| $35,000 to $49,999 | 8 | 7.3% |
| $50,000 to $74,999 | 17 | 15.6% |
| $75,000 to $99,999 | 11 | 10.1% |
| $100,000 to $149,999 | 24 | 22.0% |
| $150,000 to $199,999 | 12 | 11.0% |
| $200,000+ | 2 | 1.8% |
Household Income by Householder Age in East Side borough
The median household income in East Side borough is $66,875, with the highest median household income of $73,750 found in the 45 to 64 years age bracket for the primary householder. A total of 40 households (36.7%) fall into this category.
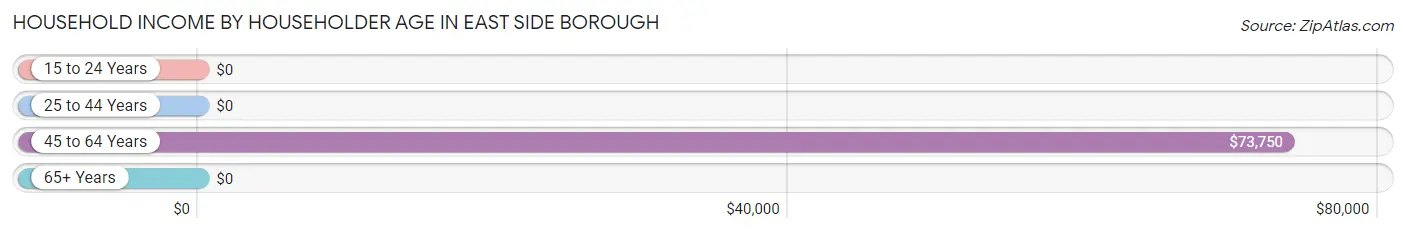
| Income Bracket | # Households | Median Income |
| 15 to 24 Years | 0 (0.0%) | $0 |
| 25 to 44 Years | 41 (37.6%) | $0 |
| 45 to 64 Years | 40 (36.7%) | $73,750 |
| 65+ Years | 28 (25.7%) | $0 |
| Total | 109 (100.0%) | $66,875 |
Poverty in East Side borough
Income Below Poverty by Sex and Age in East Side borough
With 14.7% poverty level for males and 23.8% for females among the residents of East Side borough, under 5 year old males and 45 to 54 year old females are the most vulnerable to poverty, with 2 males (100.0%) and 7 females (63.6%) in their respective age groups living below the poverty level.
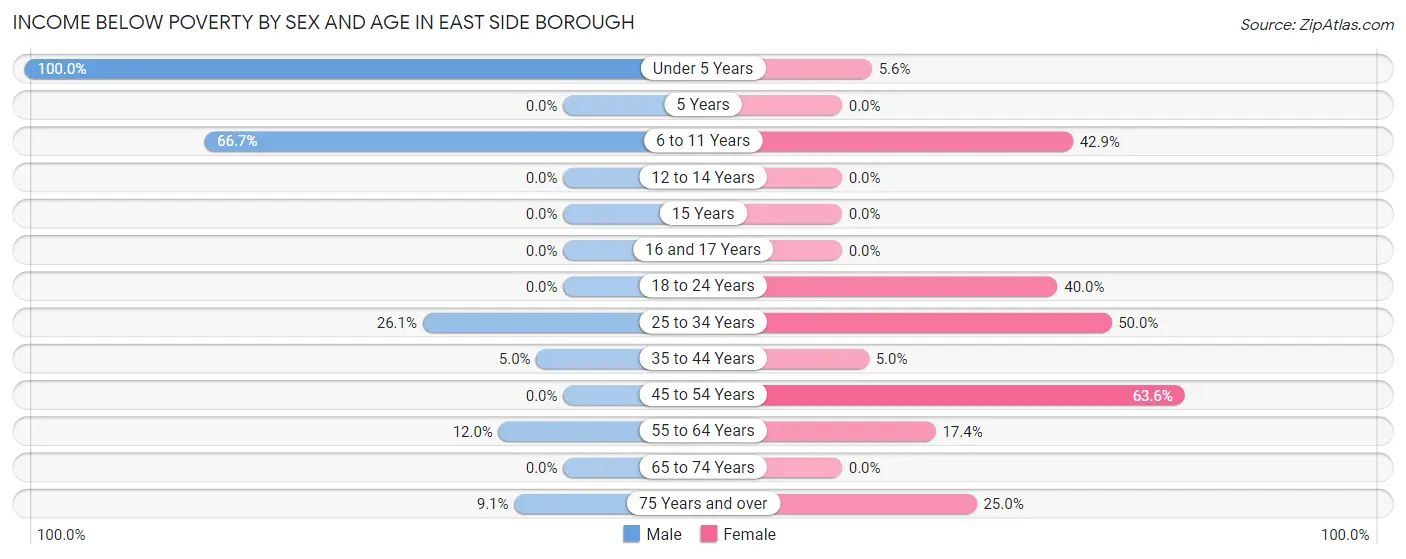
| Age Bracket | Male | Female |
| Under 5 Years | 2 (100.0%) | 1 (5.6%) |
| 5 Years | 0 (0.0%) | 0 (0.0%) |
| 6 to 11 Years | 4 (66.7%) | 6 (42.9%) |
| 12 to 14 Years | 0 (0.0%) | 0 (0.0%) |
| 15 Years | 0 (0.0%) | 0 (0.0%) |
| 16 and 17 Years | 0 (0.0%) | 0 (0.0%) |
| 18 to 24 Years | 0 (0.0%) | 2 (40.0%) |
| 25 to 34 Years | 6 (26.1%) | 9 (50.0%) |
| 35 to 44 Years | 1 (5.0%) | 1 (5.0%) |
| 45 to 54 Years | 0 (0.0%) | 7 (63.6%) |
| 55 to 64 Years | 3 (12.0%) | 4 (17.4%) |
| 65 to 74 Years | 0 (0.0%) | 0 (0.0%) |
| 75 Years and over | 1 (9.1%) | 4 (25.0%) |
| Total | 17 (14.7%) | 34 (23.8%) |
Income Above Poverty by Sex and Age in East Side borough
According to the poverty statistics in East Side borough, males aged 5 years and females aged 5 years are the age groups that are most secure financially, with 100.0% of males and 100.0% of females in these age groups living above the poverty line.
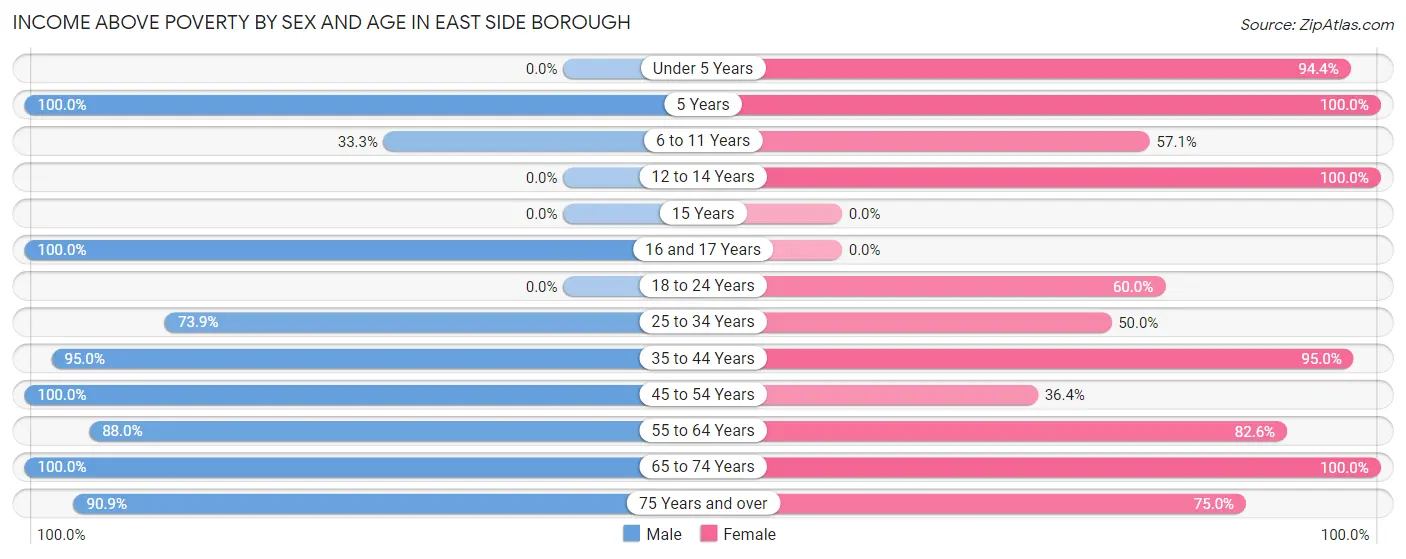
| Age Bracket | Male | Female |
| Under 5 Years | 0 (0.0%) | 17 (94.4%) |
| 5 Years | 4 (100.0%) | 5 (100.0%) |
| 6 to 11 Years | 2 (33.3%) | 8 (57.1%) |
| 12 to 14 Years | 0 (0.0%) | 4 (100.0%) |
| 15 Years | 0 (0.0%) | 0 (0.0%) |
| 16 and 17 Years | 2 (100.0%) | 0 (0.0%) |
| 18 to 24 Years | 0 (0.0%) | 3 (60.0%) |
| 25 to 34 Years | 17 (73.9%) | 9 (50.0%) |
| 35 to 44 Years | 19 (95.0%) | 19 (95.0%) |
| 45 to 54 Years | 12 (100.0%) | 4 (36.4%) |
| 55 to 64 Years | 22 (88.0%) | 19 (82.6%) |
| 65 to 74 Years | 11 (100.0%) | 9 (100.0%) |
| 75 Years and over | 10 (90.9%) | 12 (75.0%) |
| Total | 99 (85.3%) | 109 (76.2%) |
Income Below Poverty Among Married-Couple Families in East Side borough
The poverty statistics for married-couple families in East Side borough show that 19.3% or 11 of the total 57 families live below the poverty line. Families with 1 or 2 children have the highest poverty rate of 30.3%, comprising of 10 families. On the other hand, families with no children have the lowest poverty rate of 4.2%, which includes 1 families.
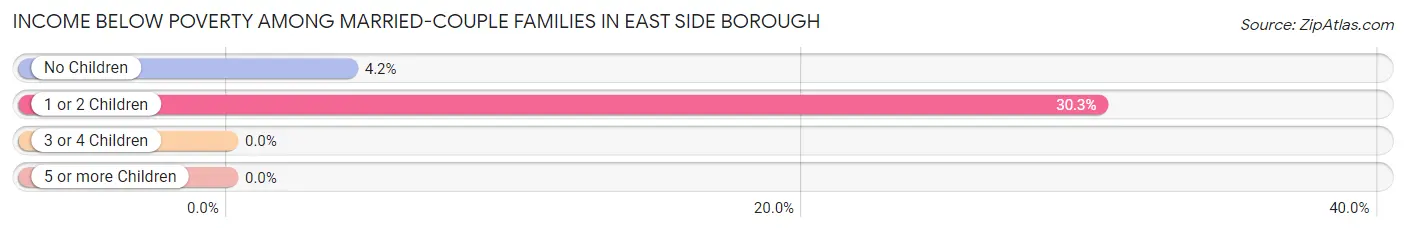
| Children | Above Poverty | Below Poverty |
| No Children | 23 (95.8%) | 1 (4.2%) |
| 1 or 2 Children | 23 (69.7%) | 10 (30.3%) |
| 3 or 4 Children | 0 (0.0%) | 0 (0.0%) |
| 5 or more Children | 0 (0.0%) | 0 (0.0%) |
| Total | 46 (80.7%) | 11 (19.3%) |
Income Below Poverty Among Single-Parent Households in East Side borough
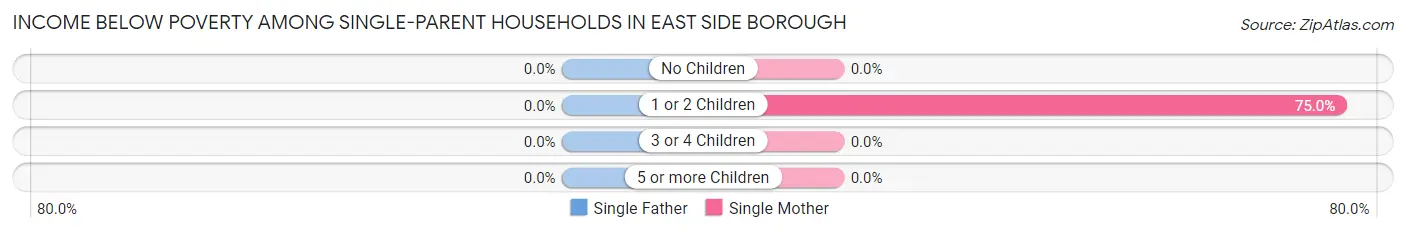
| Children | Single Father | Single Mother |
| No Children | 0 (0.0%) | 0 (0.0%) |
| 1 or 2 Children | 0 (0.0%) | 3 (75.0%) |
| 3 or 4 Children | 0 (0.0%) | 0 (0.0%) |
| 5 or more Children | 0 (0.0%) | 0 (0.0%) |
| Total | 0 (0.0%) | 3 (75.0%) |
Income Below Poverty Among Married-Couple vs Single-Parent Households in East Side borough
The poverty data for East Side borough shows that 11 of the married-couple family households (19.3%) and 3 of the single-parent households (42.9%) are living below the poverty level. Within the married-couple family households, those with 1 or 2 children have the highest poverty rate, with 10 households (30.3%) falling below the poverty line. Among the single-parent households, those with 1 or 2 children have the highest poverty rate, with 3 household (42.9%) living below poverty.
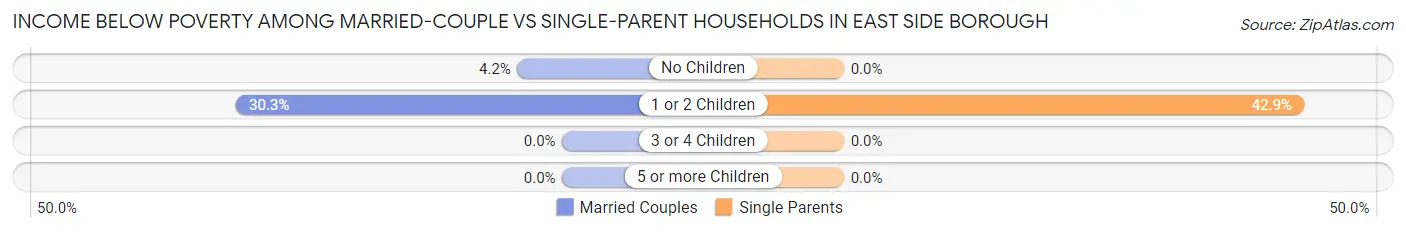
| Children | Married-Couple Families | Single-Parent Households |
| No Children | 1 (4.2%) | 0 (0.0%) |
| 1 or 2 Children | 10 (30.3%) | 3 (42.9%) |
| 3 or 4 Children | 0 (0.0%) | 0 (0.0%) |
| 5 or more Children | 0 (0.0%) | 0 (0.0%) |
| Total | 11 (19.3%) | 3 (42.9%) |
Race in East Side borough
The most populous races in East Side borough are White / Caucasian (248 | 95.8%), Hispanic or Latino (9 | 3.5%), and Asian (7 | 2.7%).
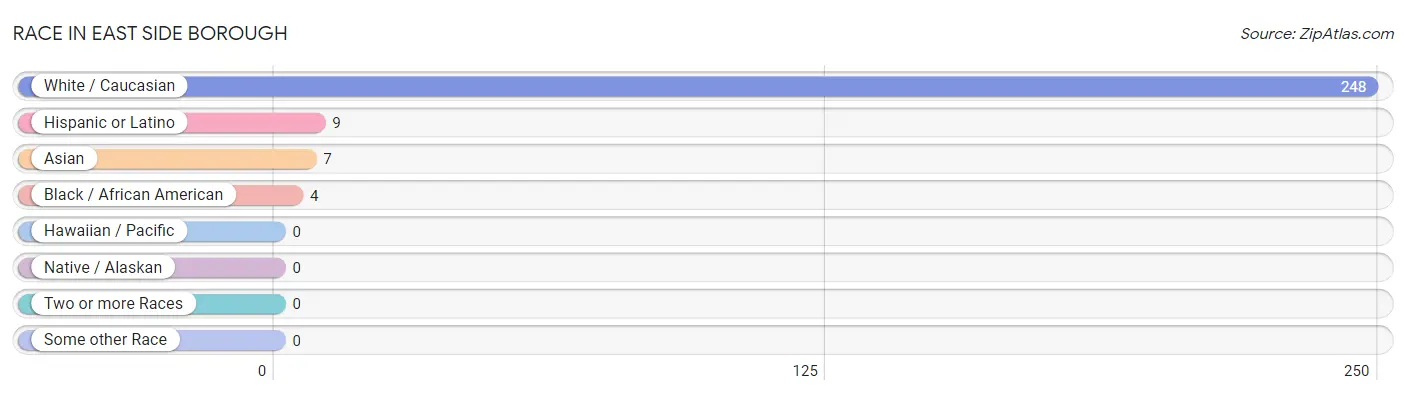
| Race | # Population | % Population |
| Asian | 7 | 2.7% |
| Black / African American | 4 | 1.5% |
| Hawaiian / Pacific | 0 | 0.0% |
| Hispanic or Latino | 9 | 3.5% |
| Native / Alaskan | 0 | 0.0% |
| White / Caucasian | 248 | 95.8% |
| Two or more Races | 0 | 0.0% |
| Some other Race | 0 | 0.0% |
| Total | 259 | 100.0% |
Ancestry in East Side borough
The most populous ancestries reported in East Side borough are German (71 | 27.4%), Italian (66 | 25.5%), Irish (49 | 18.9%), Welsh (26 | 10.0%), and Pennsylvania German (17 | 6.6%), together accounting for 88.4% of all East Side borough residents.
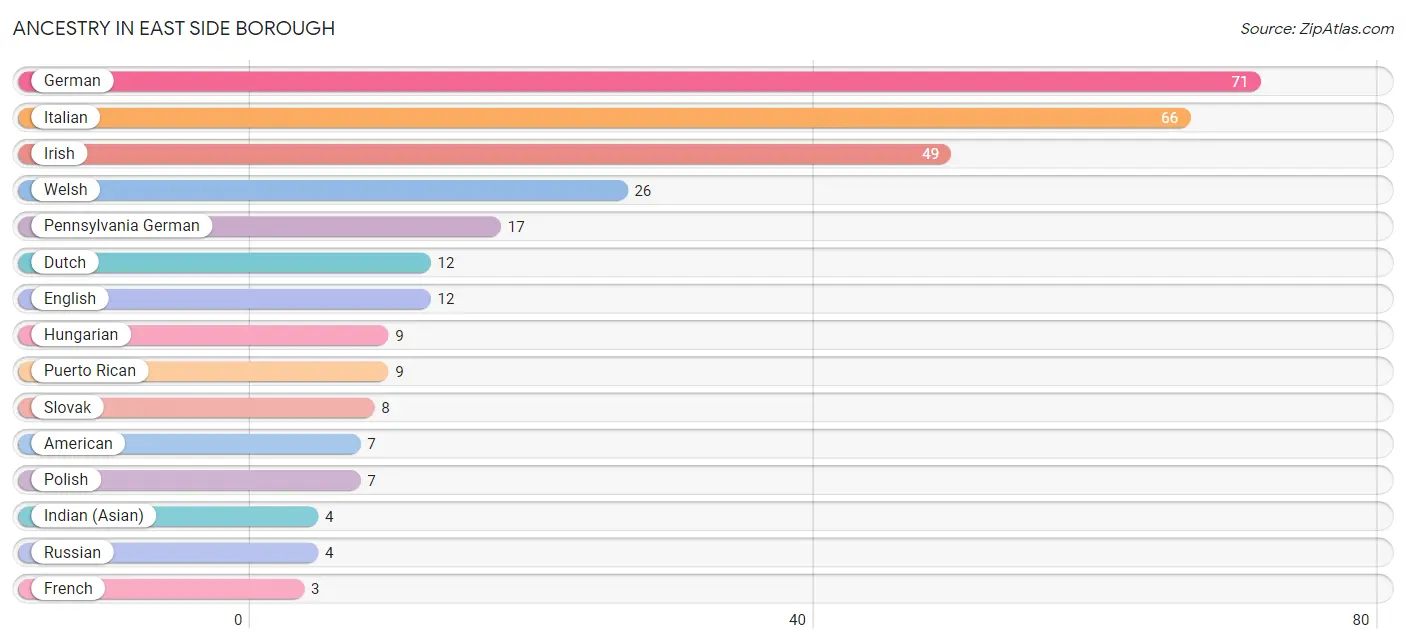
| Ancestry | # Population | % Population |
| American | 7 | 2.7% |
| Dutch | 12 | 4.6% |
| Eastern European | 2 | 0.8% |
| English | 12 | 4.6% |
| French | 3 | 1.2% |
| German | 71 | 27.4% |
| Hungarian | 9 | 3.5% |
| Indian (Asian) | 4 | 1.5% |
| Irish | 49 | 18.9% |
| Italian | 66 | 25.5% |
| Norwegian | 2 | 0.8% |
| Pennsylvania German | 17 | 6.6% |
| Polish | 7 | 2.7% |
| Puerto Rican | 9 | 3.5% |
| Romanian | 2 | 0.8% |
| Russian | 4 | 1.5% |
| Scandinavian | 1 | 0.4% |
| Scotch-Irish | 3 | 1.2% |
| Slovak | 8 | 3.1% |
| Sri Lankan | 3 | 1.2% |
| Swiss | 1 | 0.4% |
| Welsh | 26 | 10.0% | View All 22 Rows |
Immigrants in East Side borough
The most numerous immigrant groups reported in East Side borough came from Asia (6 | 2.3%), China (4 | 1.5%), Eastern Asia (4 | 1.5%), Eastern Europe (2 | 0.8%), and Europe (2 | 0.8%), together accounting for 6.9% of all East Side borough residents.
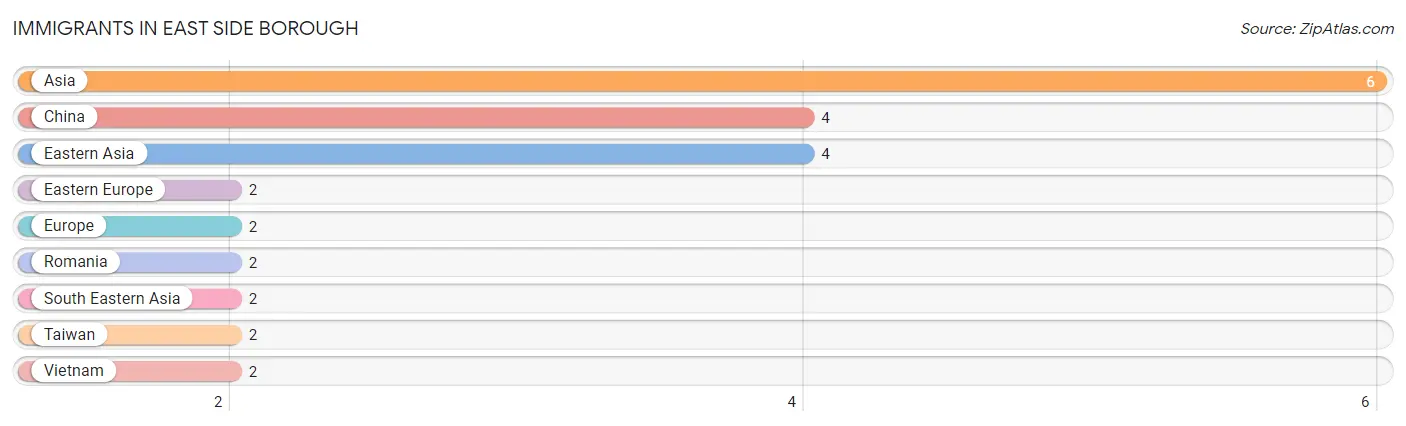
| Immigration Origin | # Population | % Population |
| Asia | 6 | 2.3% |
| China | 4 | 1.5% |
| Eastern Asia | 4 | 1.5% |
| Eastern Europe | 2 | 0.8% |
| Europe | 2 | 0.8% |
| Romania | 2 | 0.8% |
| South Eastern Asia | 2 | 0.8% |
| Taiwan | 2 | 0.8% |
| Vietnam | 2 | 0.8% | View All 9 Rows |
Sex and Age in East Side borough
Sex and Age in East Side borough
The most populous age groups in East Side borough are 30 to 34 Years (18 | 15.5%) for men and Under 5 Years (18 | 12.6%) for women.
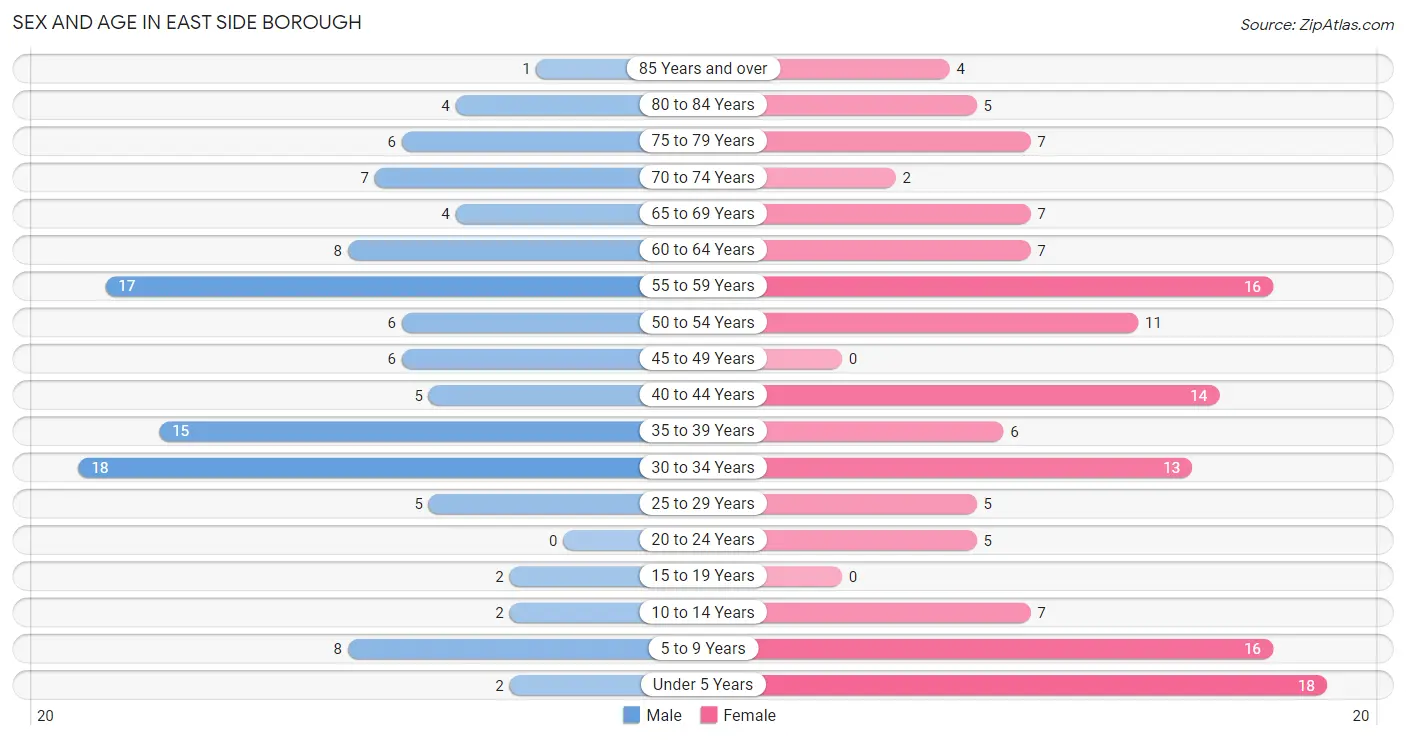
| Age Bracket | Male | Female |
| Under 5 Years | 2 (1.7%) | 18 (12.6%) |
| 5 to 9 Years | 8 (6.9%) | 16 (11.2%) |
| 10 to 14 Years | 2 (1.7%) | 7 (4.9%) |
| 15 to 19 Years | 2 (1.7%) | 0 (0.0%) |
| 20 to 24 Years | 0 (0.0%) | 5 (3.5%) |
| 25 to 29 Years | 5 (4.3%) | 5 (3.5%) |
| 30 to 34 Years | 18 (15.5%) | 13 (9.1%) |
| 35 to 39 Years | 15 (12.9%) | 6 (4.2%) |
| 40 to 44 Years | 5 (4.3%) | 14 (9.8%) |
| 45 to 49 Years | 6 (5.2%) | 0 (0.0%) |
| 50 to 54 Years | 6 (5.2%) | 11 (7.7%) |
| 55 to 59 Years | 17 (14.7%) | 16 (11.2%) |
| 60 to 64 Years | 8 (6.9%) | 7 (4.9%) |
| 65 to 69 Years | 4 (3.5%) | 7 (4.9%) |
| 70 to 74 Years | 7 (6.0%) | 2 (1.4%) |
| 75 to 79 Years | 6 (5.2%) | 7 (4.9%) |
| 80 to 84 Years | 4 (3.5%) | 5 (3.5%) |
| 85 Years and over | 1 (0.9%) | 4 (2.8%) |
| Total | 116 (100.0%) | 143 (100.0%) |
Families and Households in East Side borough
Median Family Size in East Side borough
The median family size in East Side borough is 3.14 persons per family, with single female/mother families (4 | 6.2%) accounting for the largest median family size of 3.75 persons per family. On the other hand, single male/father families (3 | 4.7%) represent the smallest median family size with 2.33 persons per family.
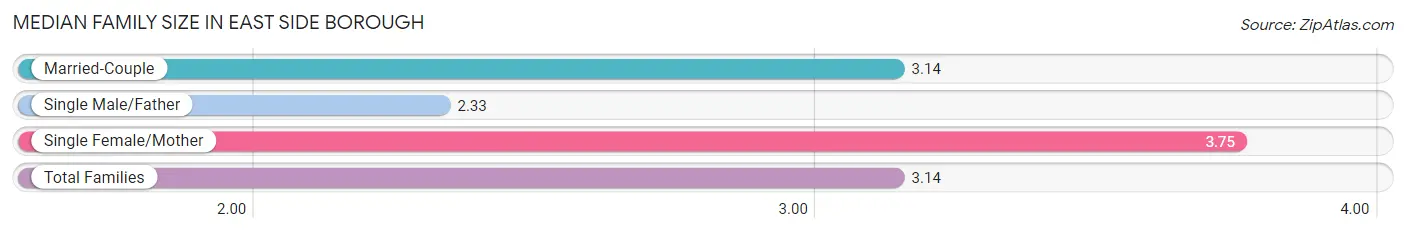
| Family Type | # Families | Family Size |
| Married-Couple | 57 (89.1%) | 3.14 |
| Single Male/Father | 3 (4.7%) | 2.33 |
| Single Female/Mother | 4 (6.2%) | 3.75 |
| Total Families | 64 (100.0%) | 3.14 |
Median Household Size in East Side borough
The median household size in East Side borough is 2.38 persons per household, with single female/mother households (4 | 3.7%) accounting for the largest median household size of 4.5 persons per household. non-family households (45 | 41.3%) represent the smallest median household size with 1.22 persons per household.
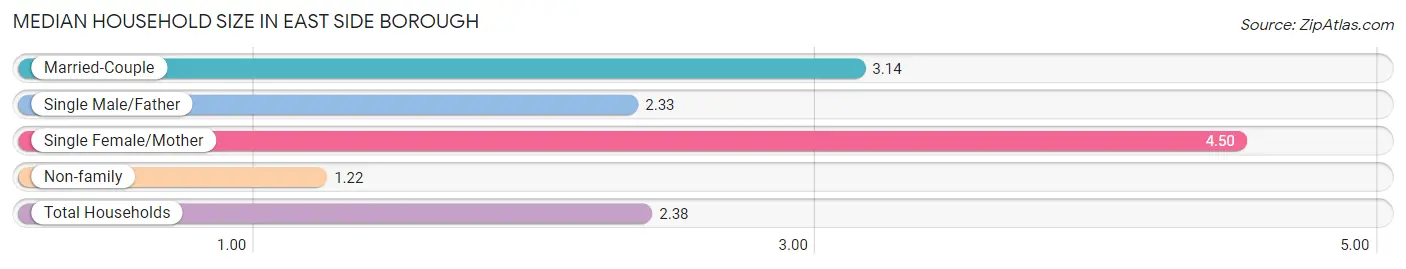
| Household Type | # Households | Household Size |
| Married-Couple | 57 (52.3%) | 3.14 |
| Single Male/Father | 3 (2.8%) | 2.33 |
| Single Female/Mother | 4 (3.7%) | 4.50 |
| Non-family | 45 (41.3%) | 1.22 |
| Total Households | 109 (100.0%) | 2.38 |
Household Size by Marriage Status in East Side borough
Out of a total of 109 households in East Side borough, 64 (58.7%) are family households, while 45 (41.3%) are nonfamily households. The most numerous type of family households are 2-person households, comprising 24, and the most common type of nonfamily households are 1-person households, comprising 38.
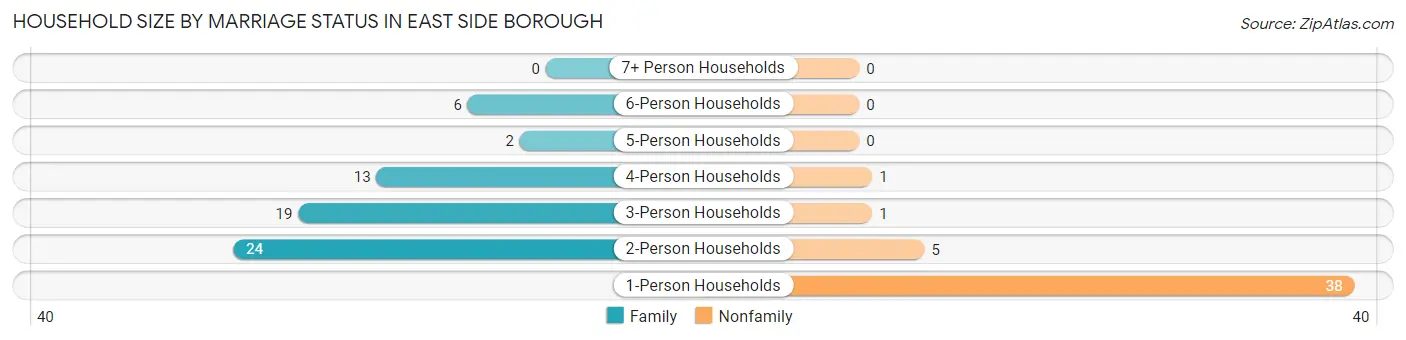
| Household Size | Family Households | Nonfamily Households |
| 1-Person Households | - | 38 (34.9%) |
| 2-Person Households | 24 (22.0%) | 5 (4.6%) |
| 3-Person Households | 19 (17.4%) | 1 (0.9%) |
| 4-Person Households | 13 (11.9%) | 1 (0.9%) |
| 5-Person Households | 2 (1.8%) | 0 (0.0%) |
| 6-Person Households | 6 (5.5%) | 0 (0.0%) |
| 7+ Person Households | 0 (0.0%) | 0 (0.0%) |
| Total | 64 (58.7%) | 45 (41.3%) |
Female Fertility in East Side borough
Fertility by Age in East Side borough
Average fertility rate in East Side borough is 173.0 births per 1,000 women. Women in the age bracket of 20 to 34 years have the highest fertility rate with 391.0 births per 1,000 women. Women in the age bracket of 20 to 34 years acount for 100.0% of all women with births.
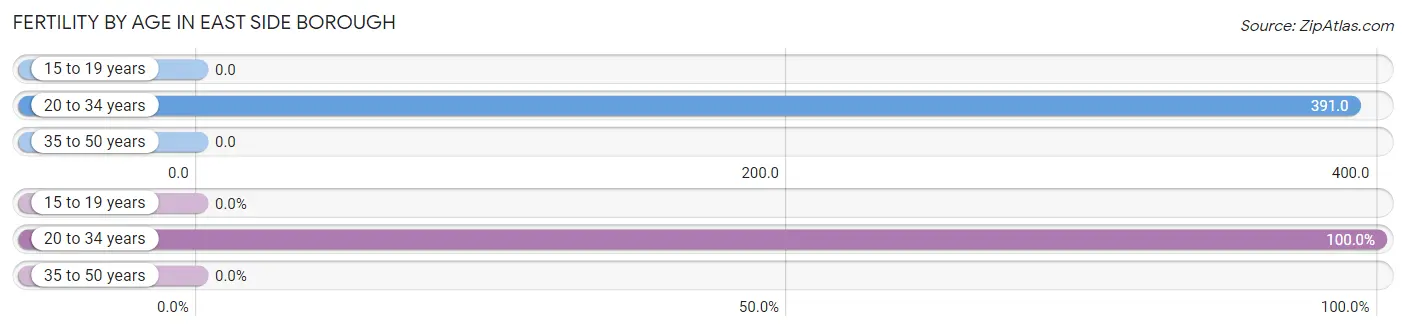
| Age Bracket | Women with Births | Births / 1,000 Women |
| 15 to 19 years | 0 (0.0%) | 0.0 |
| 20 to 34 years | 9 (100.0%) | 391.0 |
| 35 to 50 years | 0 (0.0%) | 0.0 |
| Total | 9 (100.0%) | 173.0 |
Fertility by Age by Marriage Status in East Side borough
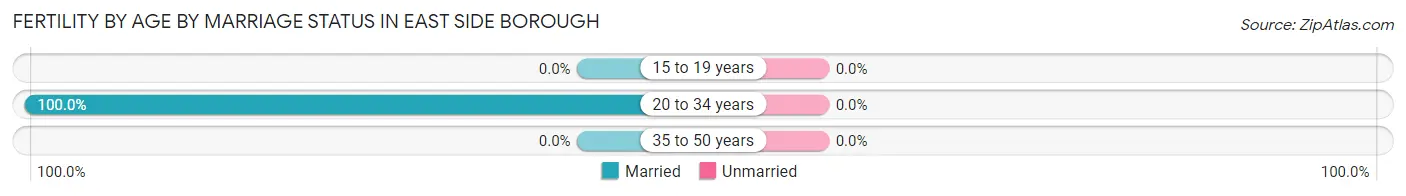
| Age Bracket | Married | Unmarried |
| 15 to 19 years | 0 (0.0%) | 0 (0.0%) |
| 20 to 34 years | 9 (100.0%) | 0 (0.0%) |
| 35 to 50 years | 0 (0.0%) | 0 (0.0%) |
| Total | 9 (100.0%) | 0 (0.0%) |
Fertility by Education in East Side borough
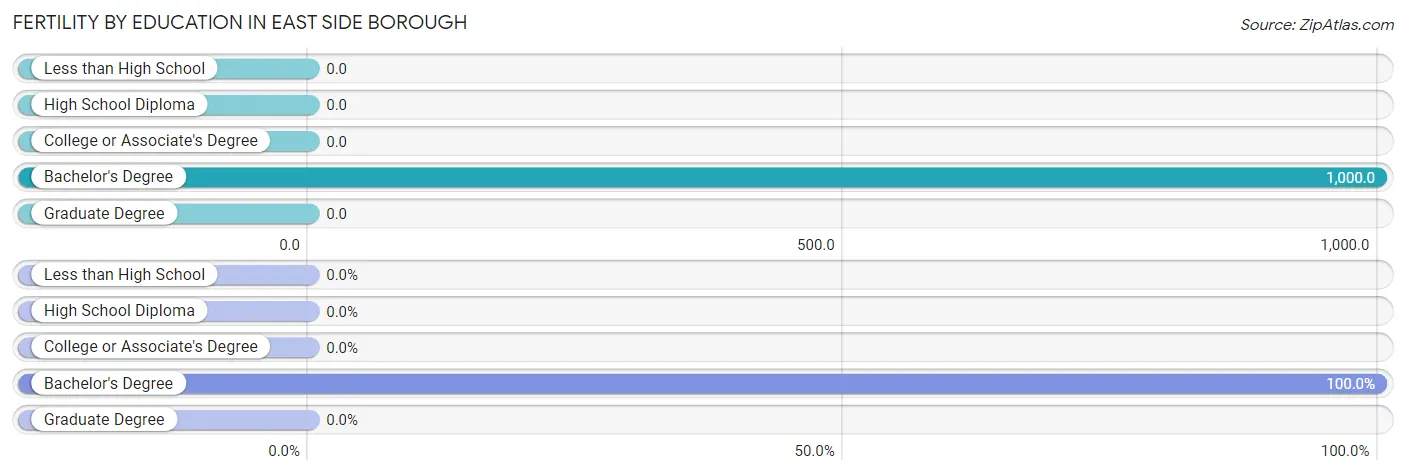
| Educational Attainment | Women with Births | Births / 1,000 Women |
| Less than High School | 0 (0.0%) | 0.0 |
| High School Diploma | 0 (0.0%) | 0.0 |
| College or Associate's Degree | 0 (0.0%) | 0.0 |
| Bachelor's Degree | 9 (100.0%) | 1,000.0 |
| Graduate Degree | 0 (0.0%) | 0.0 |
| Total | 9 (100.0%) | 173.0 |
Fertility by Education by Marriage Status in East Side borough
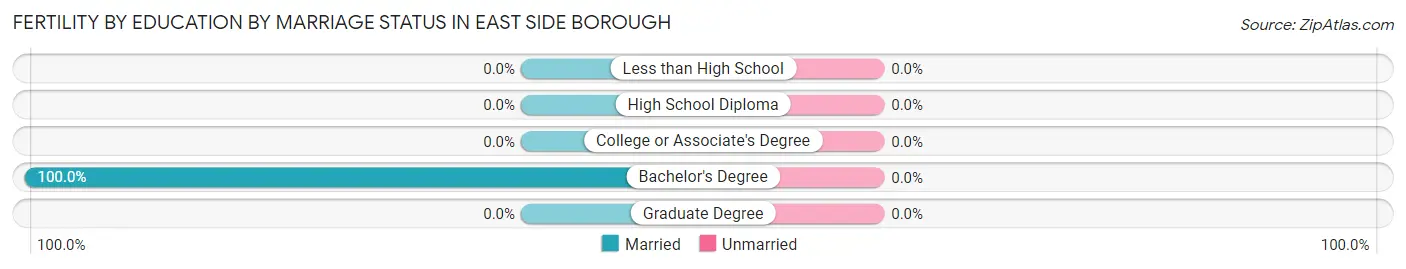
| Educational Attainment | Married | Unmarried |
| Less than High School | 0 (0.0%) | 0 (0.0%) |
| High School Diploma | 0 (0.0%) | 0 (0.0%) |
| College or Associate's Degree | 0 (0.0%) | 0 (0.0%) |
| Bachelor's Degree | 9 (100.0%) | 0 (0.0%) |
| Graduate Degree | 0 (0.0%) | 0 (0.0%) |
| Total | 9 (100.0%) | 0 (0.0%) |
Employment Characteristics in East Side borough
Employment by Class of Employer in East Side borough
Among the 124 employed individuals in East Side borough, private company employees (84 | 67.7%), not-for-profit organizations (15 | 12.1%), and state government employees (12 | 9.7%) make up the most common classes of employment.
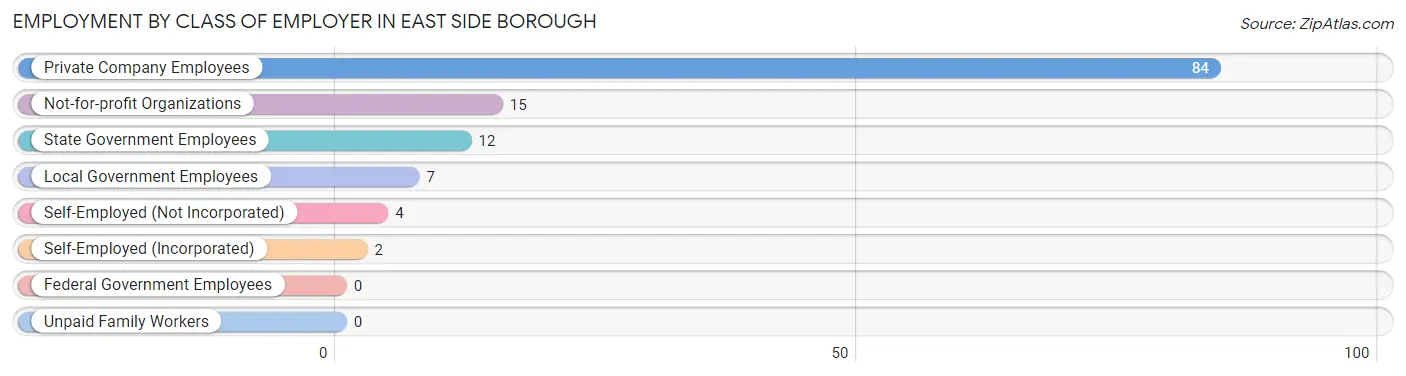
| Employer Class | # Employees | % Employees |
| Private Company Employees | 84 | 67.7% |
| Self-Employed (Incorporated) | 2 | 1.6% |
| Self-Employed (Not Incorporated) | 4 | 3.2% |
| Not-for-profit Organizations | 15 | 12.1% |
| Local Government Employees | 7 | 5.7% |
| State Government Employees | 12 | 9.7% |
| Federal Government Employees | 0 | 0.0% |
| Unpaid Family Workers | 0 | 0.0% |
| Total | 124 | 100.0% |
Employment Status by Age in East Side borough
According to the labor force statistics for East Side borough, out of the total population over 16 years of age (206), 64.1% or 132 individuals are in the labor force, with 4.5% or 6 of them unemployed. The age group with the highest labor force participation rate is 20 to 24 years, with 100.0% or 5 individuals in the labor force. Within the labor force, the 25 to 29 years age range has the highest percentage of unemployed individuals, with 25.0% or 2 of them being unemployed.
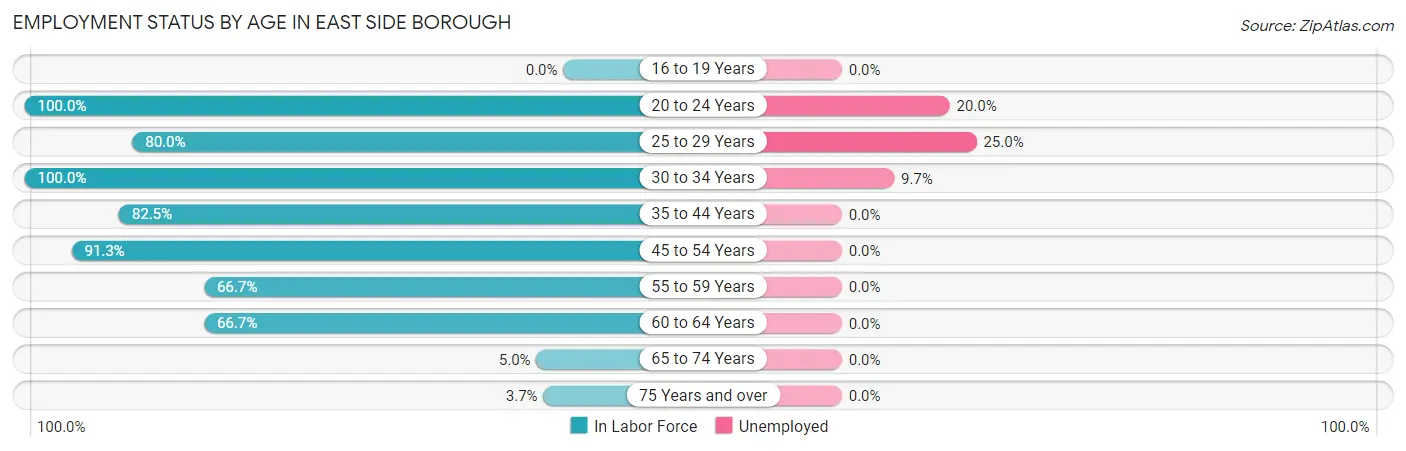
| Age Bracket | In Labor Force | Unemployed |
| 16 to 19 Years | 0 (0.0%) | 0 (0.0%) |
| 20 to 24 Years | 5 (100.0%) | 1 (20.0%) |
| 25 to 29 Years | 8 (80.0%) | 2 (25.0%) |
| 30 to 34 Years | 31 (100.0%) | 3 (9.7%) |
| 35 to 44 Years | 33 (82.5%) | 0 (0.0%) |
| 45 to 54 Years | 21 (91.3%) | 0 (0.0%) |
| 55 to 59 Years | 22 (66.7%) | 0 (0.0%) |
| 60 to 64 Years | 10 (66.7%) | 0 (0.0%) |
| 65 to 74 Years | 1 (5.0%) | 0 (0.0%) |
| 75 Years and over | 1 (3.7%) | 0 (0.0%) |
| Total | 132 (64.1%) | 6 (4.5%) |
Employment Status by Educational Attainment in East Side borough
According to labor force statistics for East Side borough, 82.2% of individuals (125) out of the total population between 25 and 64 years of age (152) are in the labor force, with 4.0% or 5 of them being unemployed. The group with the highest labor force participation rate are those with the educational attainment of less than high school, with 100.0% or 11 individuals in the labor force. Within the labor force, individuals with less than high school education have the highest percentage of unemployment, with 18.2% or 2 of them being unemployed.
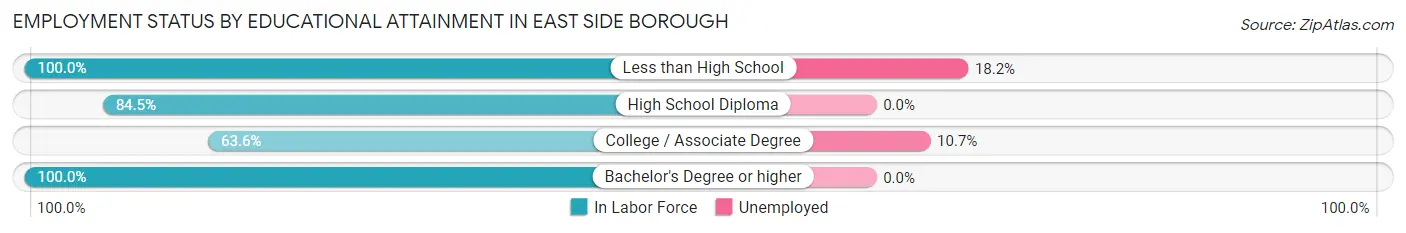
| Educational Attainment | In Labor Force | Unemployed |
| Less than High School | 11 (100.0%) | 2 (18.2%) |
| High School Diploma | 60 (84.5%) | 0 (0.0%) |
| College / Associate Degree | 28 (63.6%) | 5 (10.7%) |
| Bachelor's Degree or higher | 26 (100.0%) | 0 (0.0%) |
| Total | 125 (82.2%) | 6 (4.0%) |
Employment Occupations by Sex in East Side borough
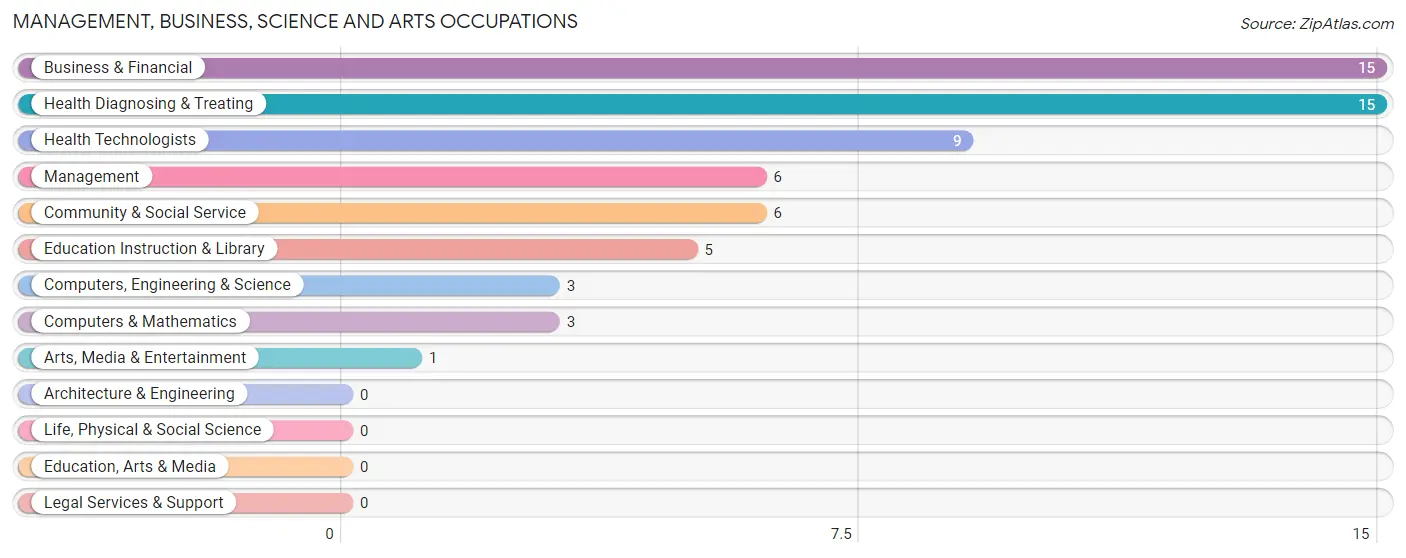
Management, Business, Science and Arts Occupations
The most common Management, Business, Science and Arts occupations in East Side borough are Business & Financial (15 | 11.9%), Health Diagnosing & Treating (15 | 11.9%), Health Technologists (9 | 7.1%), Management (6 | 4.8%), and Community & Social Service (6 | 4.8%).
Management, Business, Science and Arts Occupations by Sex
Within the Management, Business, Science and Arts occupations in East Side borough, the most male-oriented occupations are Computers, Engineering & Science (100.0%), Computers & Mathematics (100.0%), and Business & Financial (80.0%), while the most female-oriented occupations are Community & Social Service (100.0%), Education Instruction & Library (100.0%), and Arts, Media & Entertainment (100.0%).
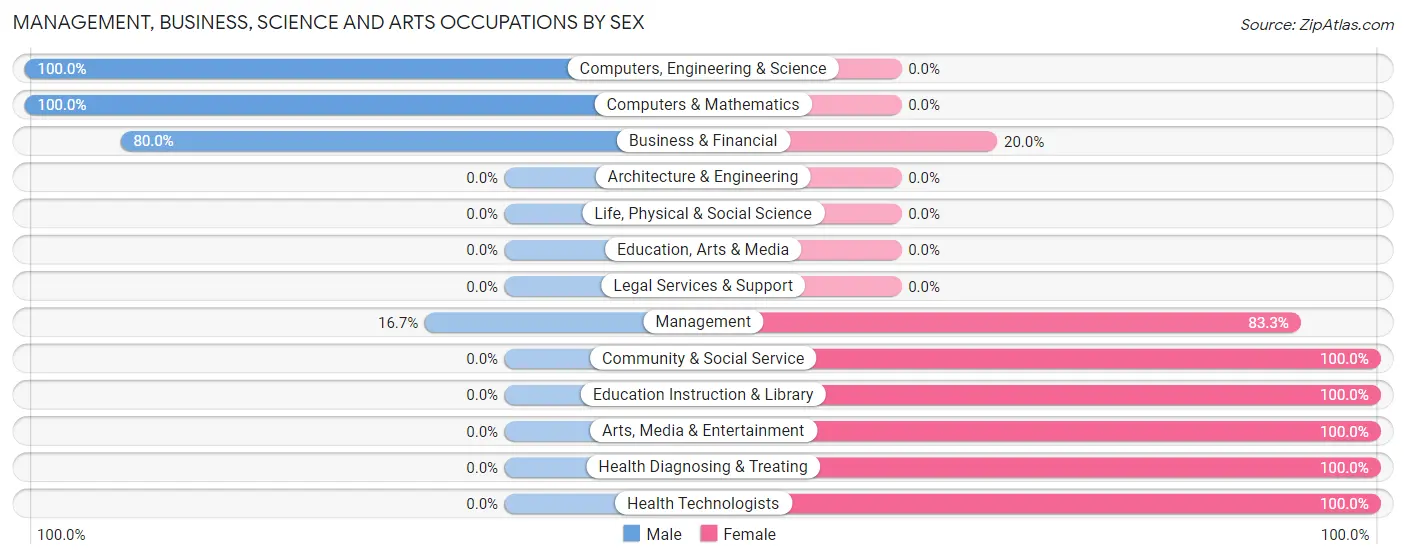
| Occupation | Male | Female |
| Management | 1 (16.7%) | 5 (83.3%) |
| Business & Financial | 12 (80.0%) | 3 (20.0%) |
| Computers, Engineering & Science | 3 (100.0%) | 0 (0.0%) |
| Computers & Mathematics | 3 (100.0%) | 0 (0.0%) |
| Architecture & Engineering | 0 (0.0%) | 0 (0.0%) |
| Life, Physical & Social Science | 0 (0.0%) | 0 (0.0%) |
| Community & Social Service | 0 (0.0%) | 6 (100.0%) |
| Education, Arts & Media | 0 (0.0%) | 0 (0.0%) |
| Legal Services & Support | 0 (0.0%) | 0 (0.0%) |
| Education Instruction & Library | 0 (0.0%) | 5 (100.0%) |
| Arts, Media & Entertainment | 0 (0.0%) | 1 (100.0%) |
| Health Diagnosing & Treating | 0 (0.0%) | 15 (100.0%) |
| Health Technologists | 0 (0.0%) | 9 (100.0%) |
| Total (Category) | 16 (35.6%) | 29 (64.4%) |
| Total (Overall) | 66 (52.4%) | 60 (47.6%) |
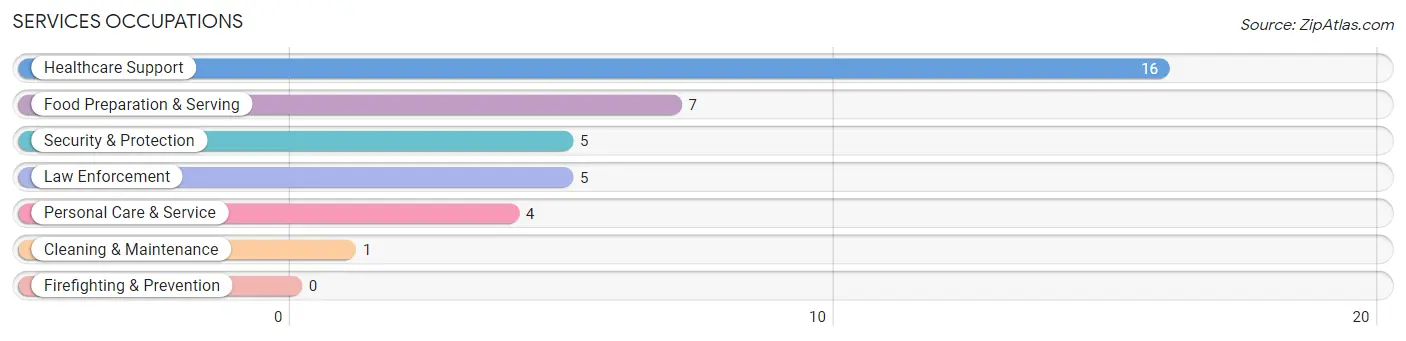
Services Occupations
The most common Services occupations in East Side borough are Healthcare Support (16 | 12.7%), Food Preparation & Serving (7 | 5.6%), Security & Protection (5 | 4.0%), Law Enforcement (5 | 4.0%), and Personal Care & Service (4 | 3.2%).
Services Occupations by Sex
Within the Services occupations in East Side borough, the most male-oriented occupations are Security & Protection (100.0%), Law Enforcement (100.0%), and Cleaning & Maintenance (100.0%), while the most female-oriented occupations are Healthcare Support (100.0%), Personal Care & Service (75.0%), and Food Preparation & Serving (14.3%).
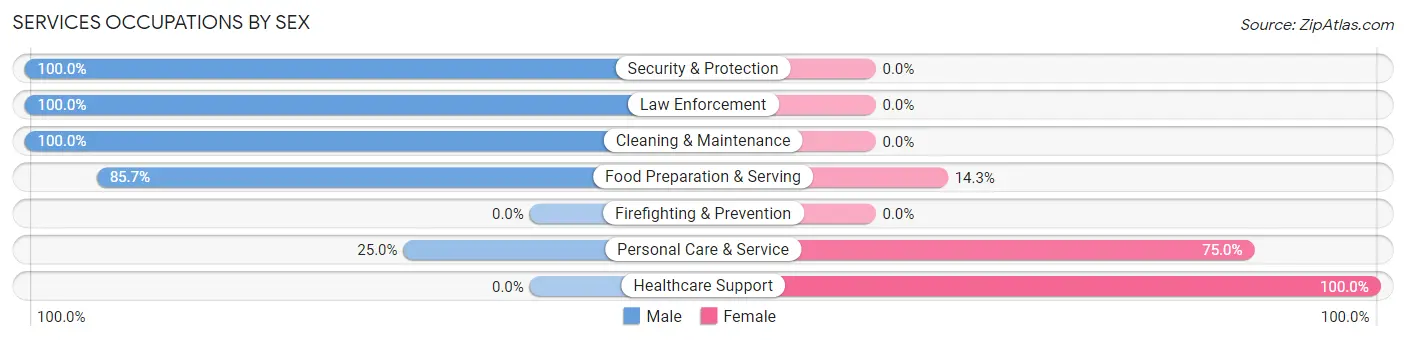
| Occupation | Male | Female |
| Healthcare Support | 0 (0.0%) | 16 (100.0%) |
| Security & Protection | 5 (100.0%) | 0 (0.0%) |
| Firefighting & Prevention | 0 (0.0%) | 0 (0.0%) |
| Law Enforcement | 5 (100.0%) | 0 (0.0%) |
| Food Preparation & Serving | 6 (85.7%) | 1 (14.3%) |
| Cleaning & Maintenance | 1 (100.0%) | 0 (0.0%) |
| Personal Care & Service | 1 (25.0%) | 3 (75.0%) |
| Total (Category) | 13 (39.4%) | 20 (60.6%) |
| Total (Overall) | 66 (52.4%) | 60 (47.6%) |
Sales and Office Occupations
The most common Sales and Office occupations in East Side borough are Sales & Related (7 | 5.6%), and Office & Administration (6 | 4.8%).
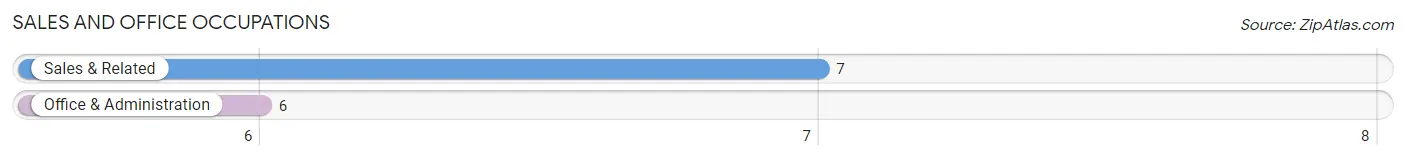
Sales and Office Occupations by Sex
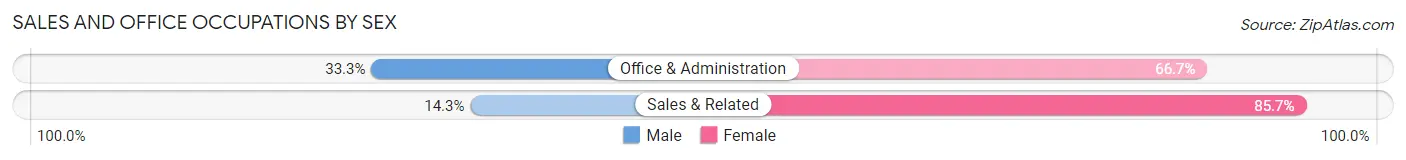
| Occupation | Male | Female |
| Sales & Related | 1 (14.3%) | 6 (85.7%) |
| Office & Administration | 2 (33.3%) | 4 (66.7%) |
| Total (Category) | 3 (23.1%) | 10 (76.9%) |
| Total (Overall) | 66 (52.4%) | 60 (47.6%) |
Natural Resources, Construction and Maintenance Occupations
The most common Natural Resources, Construction and Maintenance occupations in East Side borough are Installation, Maintenance & Repair (11 | 8.7%), and Construction & Extraction (4 | 3.2%).
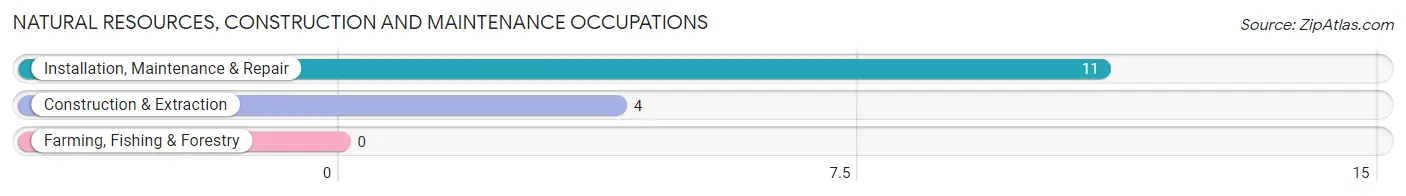
Natural Resources, Construction and Maintenance Occupations by Sex
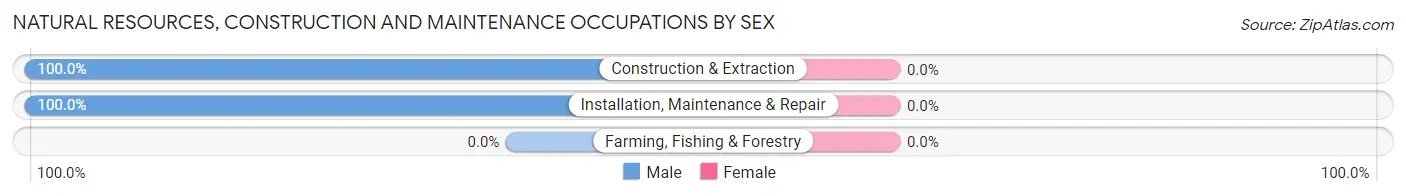
| Occupation | Male | Female |
| Farming, Fishing & Forestry | 0 (0.0%) | 0 (0.0%) |
| Construction & Extraction | 4 (100.0%) | 0 (0.0%) |
| Installation, Maintenance & Repair | 11 (100.0%) | 0 (0.0%) |
| Total (Category) | 15 (100.0%) | 0 (0.0%) |
| Total (Overall) | 66 (52.4%) | 60 (47.6%) |
Production, Transportation and Moving Occupations
The most common Production, Transportation and Moving occupations in East Side borough are Production (10 | 7.9%), Material Moving (8 | 6.4%), and Transportation (2 | 1.6%).
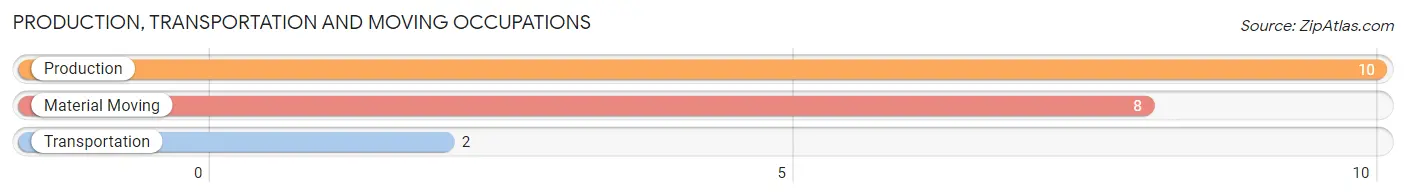
Production, Transportation and Moving Occupations by Sex
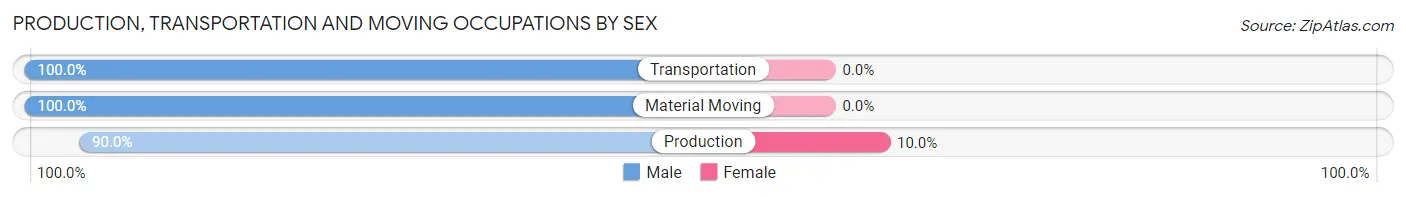
| Occupation | Male | Female |
| Production | 9 (90.0%) | 1 (10.0%) |
| Transportation | 2 (100.0%) | 0 (0.0%) |
| Material Moving | 8 (100.0%) | 0 (0.0%) |
| Total (Category) | 19 (95.0%) | 1 (5.0%) |
| Total (Overall) | 66 (52.4%) | 60 (47.6%) |
Employment Industries by Sex in East Side borough
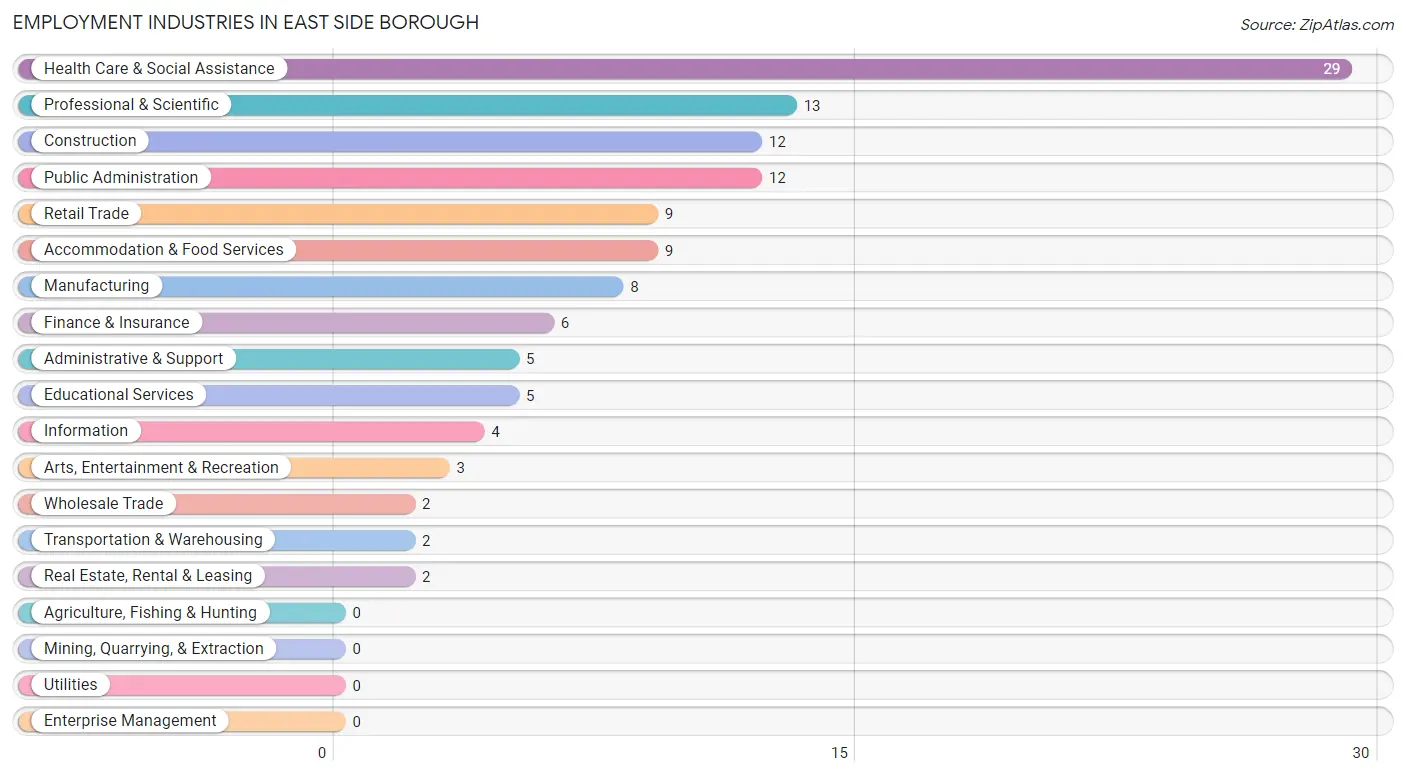
Employment Industries in East Side borough
The major employment industries in East Side borough include Health Care & Social Assistance (29 | 23.0%), Professional & Scientific (13 | 10.3%), Construction (12 | 9.5%), Public Administration (12 | 9.5%), and Retail Trade (9 | 7.1%).
Employment Industries by Sex in East Side borough
The East Side borough industries that see more men than women are Construction (100.0%), Wholesale Trade (100.0%), and Transportation & Warehousing (100.0%), whereas the industries that tend to have a higher number of women are Educational Services (100.0%), Health Care & Social Assistance (100.0%), and Retail Trade (88.9%).
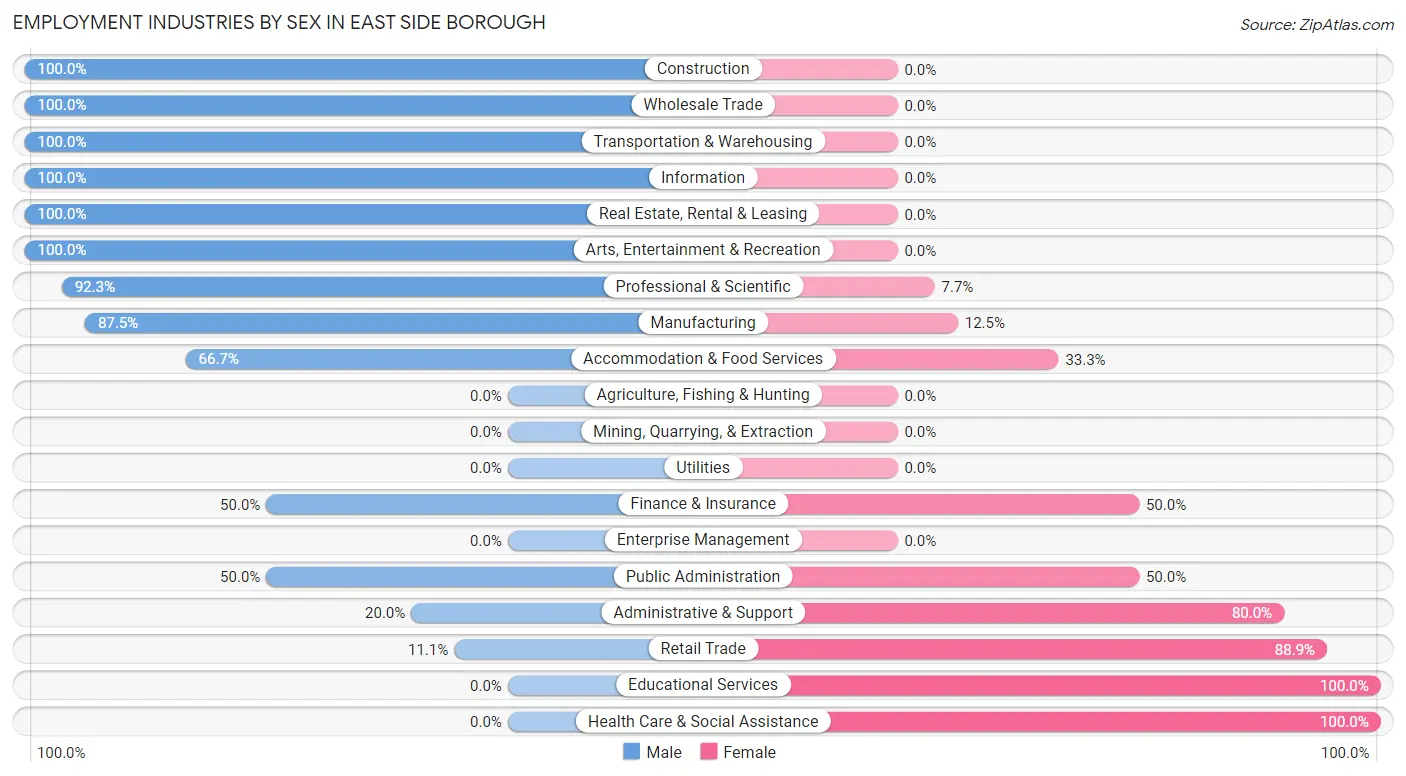
| Industry | Male | Female |
| Agriculture, Fishing & Hunting | 0 (0.0%) | 0 (0.0%) |
| Mining, Quarrying, & Extraction | 0 (0.0%) | 0 (0.0%) |
| Construction | 12 (100.0%) | 0 (0.0%) |
| Manufacturing | 7 (87.5%) | 1 (12.5%) |
| Wholesale Trade | 2 (100.0%) | 0 (0.0%) |
| Retail Trade | 1 (11.1%) | 8 (88.9%) |
| Transportation & Warehousing | 2 (100.0%) | 0 (0.0%) |
| Utilities | 0 (0.0%) | 0 (0.0%) |
| Information | 4 (100.0%) | 0 (0.0%) |
| Finance & Insurance | 3 (50.0%) | 3 (50.0%) |
| Real Estate, Rental & Leasing | 2 (100.0%) | 0 (0.0%) |
| Professional & Scientific | 12 (92.3%) | 1 (7.7%) |
| Enterprise Management | 0 (0.0%) | 0 (0.0%) |
| Administrative & Support | 1 (20.0%) | 4 (80.0%) |
| Educational Services | 0 (0.0%) | 5 (100.0%) |
| Health Care & Social Assistance | 0 (0.0%) | 29 (100.0%) |
| Arts, Entertainment & Recreation | 3 (100.0%) | 0 (0.0%) |
| Accommodation & Food Services | 6 (66.7%) | 3 (33.3%) |
| Public Administration | 6 (50.0%) | 6 (50.0%) |
| Total | 66 (52.4%) | 60 (47.6%) |
Education in East Side borough
School Enrollment in East Side borough
The most common levels of schooling among the 43 students in East Side borough are elementary school (17 | 39.5%), nursery / preschool (13 | 30.2%), and kindergarten (4 | 9.3%).
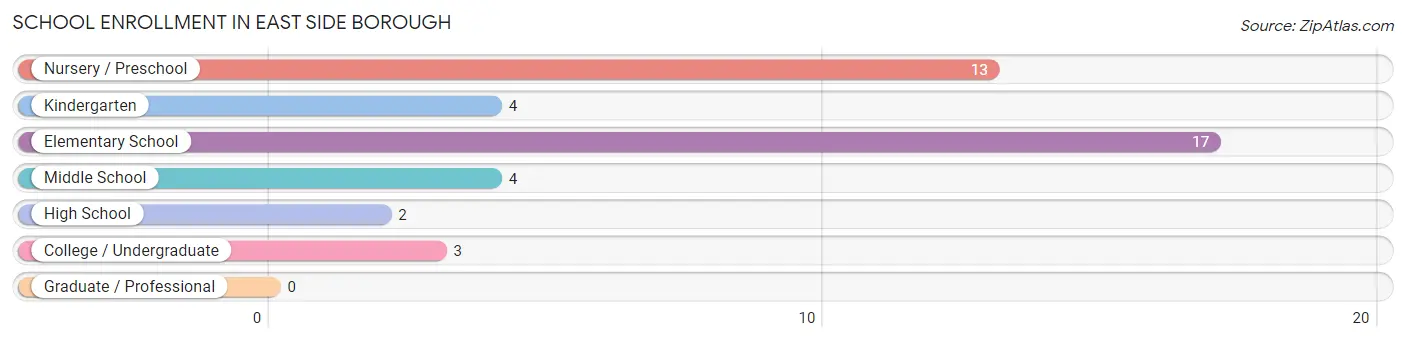
| School Level | # Students | % Students |
| Nursery / Preschool | 13 | 30.2% |
| Kindergarten | 4 | 9.3% |
| Elementary School | 17 | 39.5% |
| Middle School | 4 | 9.3% |
| High School | 2 | 4.6% |
| College / Undergraduate | 3 | 7.0% |
| Graduate / Professional | 0 | 0.0% |
| Total | 43 | 100.0% |
School Enrollment by Age by Funding Source in East Side borough
Out of a total of 43 students who are enrolled in schools in East Side borough, 8 (18.6%) attend a private institution, while the remaining 35 (81.4%) are enrolled in public schools. The age group of 3 to 4 year olds has the highest likelihood of being enrolled in private schools, with 8 (100.0% in the age bracket) enrolled. Conversely, the age group of 5 to 9 year old has the lowest likelihood of being enrolled in a private school, with 24 (100.0% in the age bracket) attending a public institution.
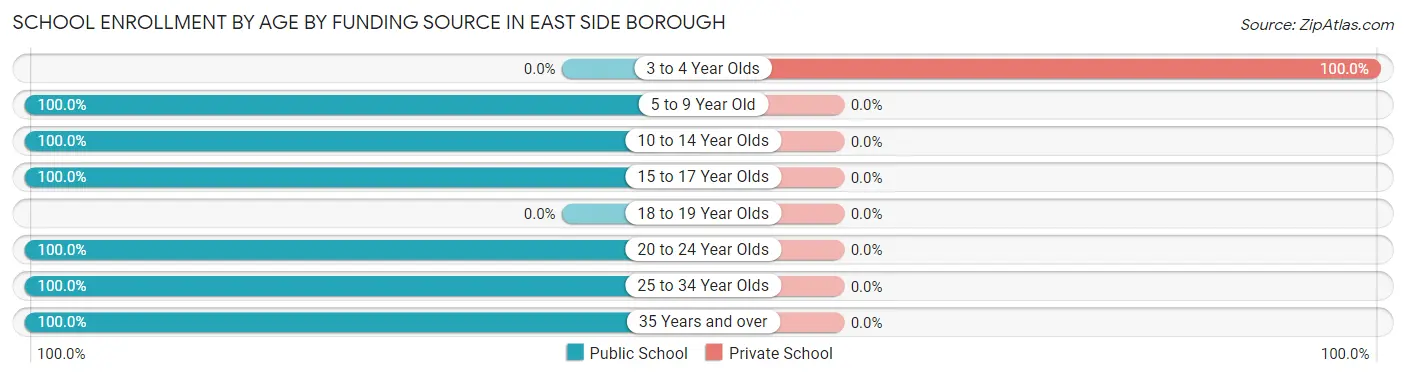
| Age Bracket | Public School | Private School |
| 3 to 4 Year Olds | 0 (0.0%) | 8 (100.0%) |
| 5 to 9 Year Old | 24 (100.0%) | 0 (0.0%) |
| 10 to 14 Year Olds | 6 (100.0%) | 0 (0.0%) |
| 15 to 17 Year Olds | 2 (100.0%) | 0 (0.0%) |
| 18 to 19 Year Olds | 0 (0.0%) | 0 (0.0%) |
| 20 to 24 Year Olds | 1 (100.0%) | 0 (0.0%) |
| 25 to 34 Year Olds | 1 (100.0%) | 0 (0.0%) |
| 35 Years and over | 1 (100.0%) | 0 (0.0%) |
| Total | 35 (81.4%) | 8 (18.6%) |
Educational Attainment by Field of Study in East Side borough
Bio, nature & agricultural (18 | 48.6%), business (7 | 18.9%), computers & mathematics (5 | 13.5%), education (3 | 8.1%), and engineering (1 | 2.7%) are the most common fields of study among 37 individuals in East Side borough who have obtained a bachelor's degree or higher.
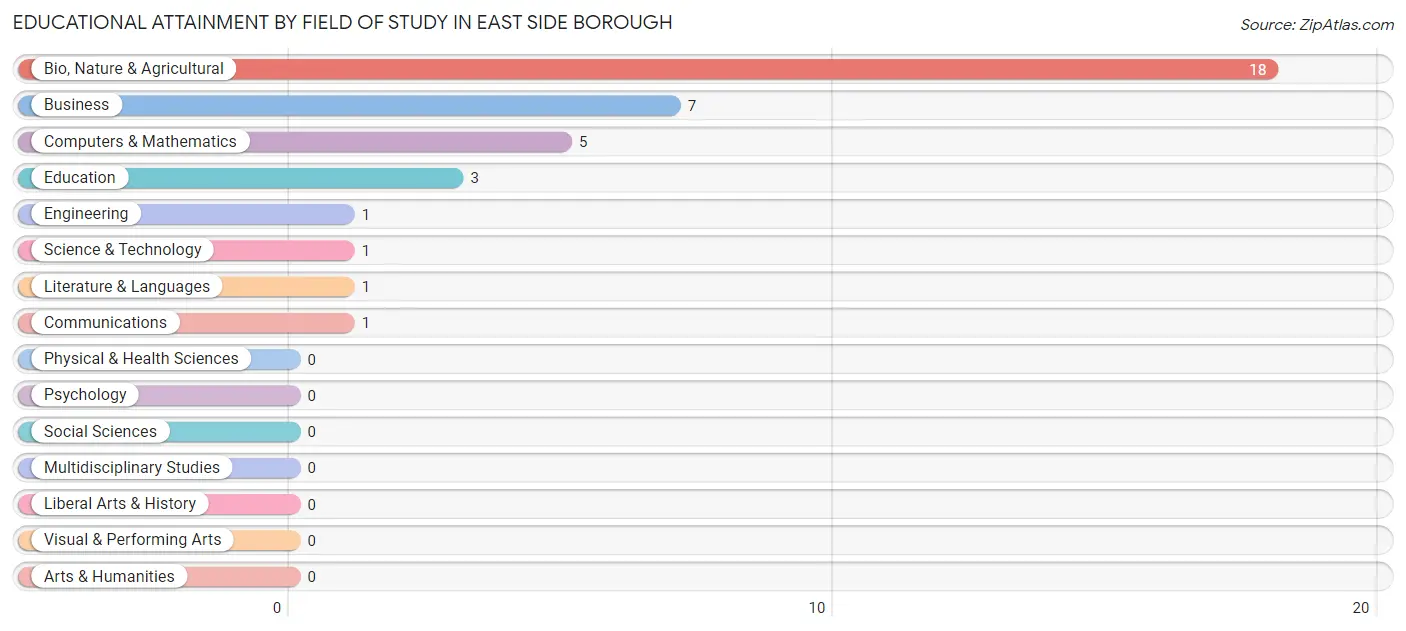
| Field of Study | # Graduates | % Graduates |
| Computers & Mathematics | 5 | 13.5% |
| Bio, Nature & Agricultural | 18 | 48.6% |
| Physical & Health Sciences | 0 | 0.0% |
| Psychology | 0 | 0.0% |
| Social Sciences | 0 | 0.0% |
| Engineering | 1 | 2.7% |
| Multidisciplinary Studies | 0 | 0.0% |
| Science & Technology | 1 | 2.7% |
| Business | 7 | 18.9% |
| Education | 3 | 8.1% |
| Literature & Languages | 1 | 2.7% |
| Liberal Arts & History | 0 | 0.0% |
| Visual & Performing Arts | 0 | 0.0% |
| Communications | 1 | 2.7% |
| Arts & Humanities | 0 | 0.0% |
| Total | 37 | 100.0% |
Transportation & Commute in East Side borough
Vehicle Availability by Sex in East Side borough
The most prevalent vehicle ownership categories in East Side borough are males with 2 vehicles (32, accounting for 50.0%) and females with 2 vehicles (29, making up 53.3%).
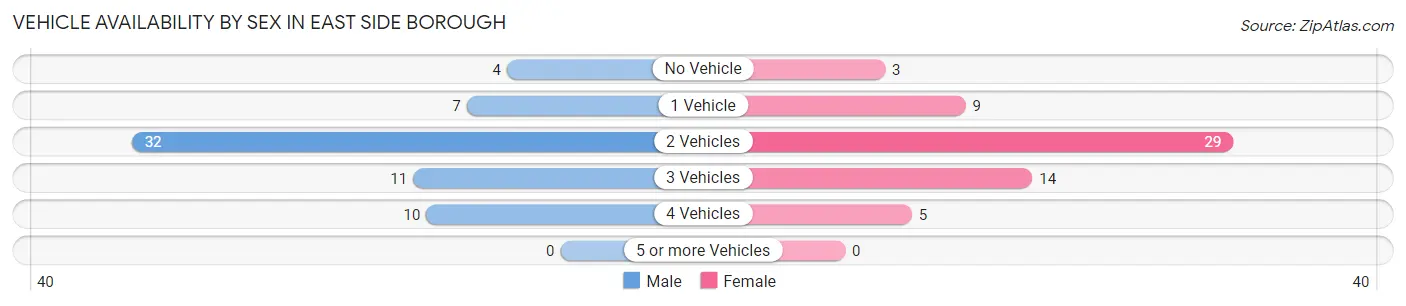
| Vehicles Available | Male | Female |
| No Vehicle | 4 (6.2%) | 3 (5.0%) |
| 1 Vehicle | 7 (10.9%) | 9 (15.0%) |
| 2 Vehicles | 32 (50.0%) | 29 (48.3%) |
| 3 Vehicles | 11 (17.2%) | 14 (23.3%) |
| 4 Vehicles | 10 (15.6%) | 5 (8.3%) |
| 5 or more Vehicles | 0 (0.0%) | 0 (0.0%) |
| Total | 64 (100.0%) | 60 (100.0%) |
Commute Time in East Side borough
The most frequently occuring commute durations in East Side borough are 5 to 9 minutes (27 commuters, 24.8%), 20 to 24 minutes (24 commuters, 22.0%), and 15 to 19 minutes (20 commuters, 18.3%).
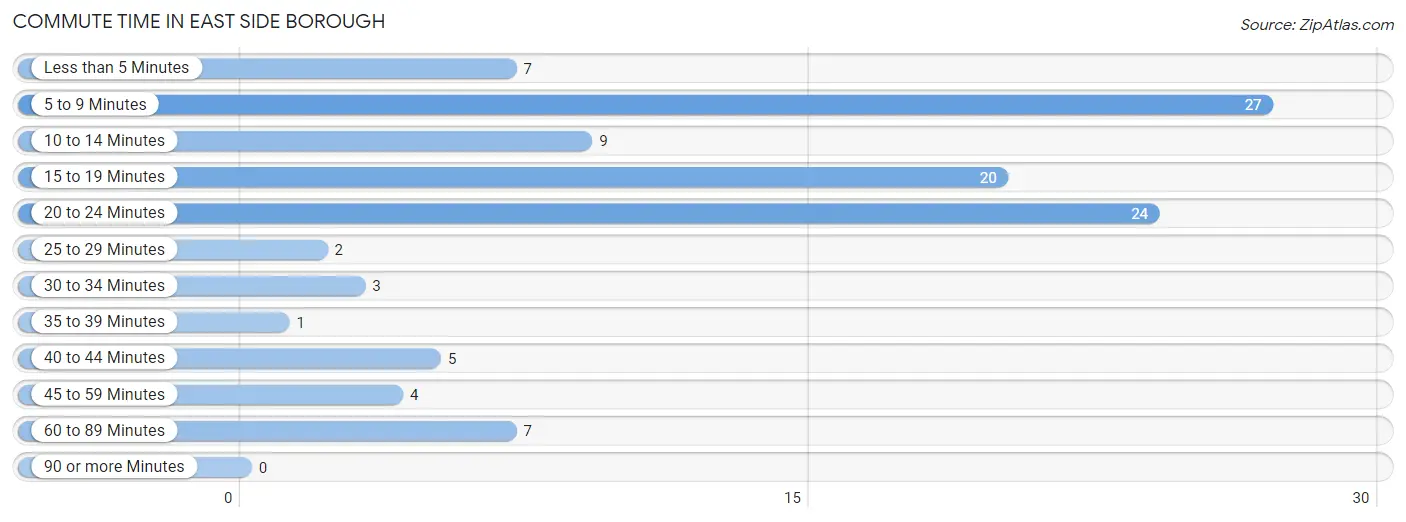
| Commute Time | # Commuters | % Commuters |
| Less than 5 Minutes | 7 | 6.4% |
| 5 to 9 Minutes | 27 | 24.8% |
| 10 to 14 Minutes | 9 | 8.3% |
| 15 to 19 Minutes | 20 | 18.3% |
| 20 to 24 Minutes | 24 | 22.0% |
| 25 to 29 Minutes | 2 | 1.8% |
| 30 to 34 Minutes | 3 | 2.8% |
| 35 to 39 Minutes | 1 | 0.9% |
| 40 to 44 Minutes | 5 | 4.6% |
| 45 to 59 Minutes | 4 | 3.7% |
| 60 to 89 Minutes | 7 | 6.4% |
| 90 or more Minutes | 0 | 0.0% |
Commute Time by Sex in East Side borough
The most common commute times in East Side borough are 5 to 9 minutes (20 commuters, 38.5%) for males and 20 to 24 minutes (14 commuters, 24.6%) for females.
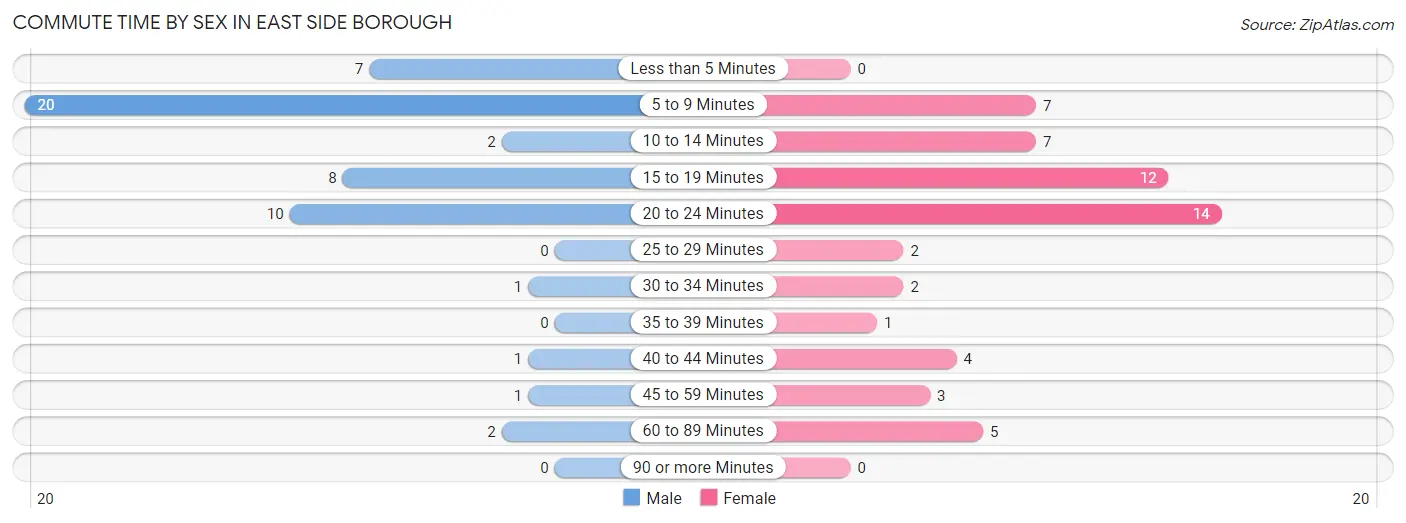
| Commute Time | Male | Female |
| Less than 5 Minutes | 7 (13.5%) | 0 (0.0%) |
| 5 to 9 Minutes | 20 (38.5%) | 7 (12.3%) |
| 10 to 14 Minutes | 2 (3.8%) | 7 (12.3%) |
| 15 to 19 Minutes | 8 (15.4%) | 12 (21.0%) |
| 20 to 24 Minutes | 10 (19.2%) | 14 (24.6%) |
| 25 to 29 Minutes | 0 (0.0%) | 2 (3.5%) |
| 30 to 34 Minutes | 1 (1.9%) | 2 (3.5%) |
| 35 to 39 Minutes | 0 (0.0%) | 1 (1.8%) |
| 40 to 44 Minutes | 1 (1.9%) | 4 (7.0%) |
| 45 to 59 Minutes | 1 (1.9%) | 3 (5.3%) |
| 60 to 89 Minutes | 2 (3.8%) | 5 (8.8%) |
| 90 or more Minutes | 0 (0.0%) | 0 (0.0%) |
Time of Departure to Work by Sex in East Side borough
The most frequent times of departure to work in East Side borough are 6:30 AM to 6:59 AM (21, 40.4%) for males and 6:30 AM to 6:59 AM (20, 35.1%) for females.
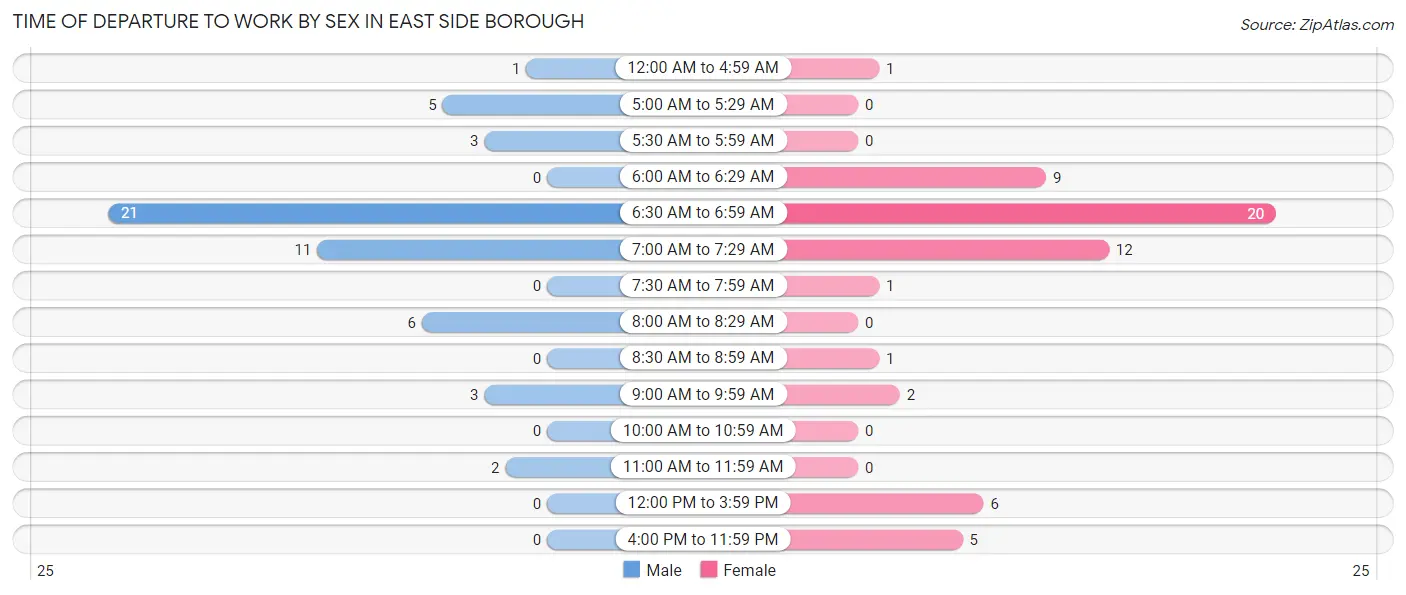
| Time of Departure | Male | Female |
| 12:00 AM to 4:59 AM | 1 (1.9%) | 1 (1.8%) |
| 5:00 AM to 5:29 AM | 5 (9.6%) | 0 (0.0%) |
| 5:30 AM to 5:59 AM | 3 (5.8%) | 0 (0.0%) |
| 6:00 AM to 6:29 AM | 0 (0.0%) | 9 (15.8%) |
| 6:30 AM to 6:59 AM | 21 (40.4%) | 20 (35.1%) |
| 7:00 AM to 7:29 AM | 11 (21.1%) | 12 (21.0%) |
| 7:30 AM to 7:59 AM | 0 (0.0%) | 1 (1.8%) |
| 8:00 AM to 8:29 AM | 6 (11.5%) | 0 (0.0%) |
| 8:30 AM to 8:59 AM | 0 (0.0%) | 1 (1.8%) |
| 9:00 AM to 9:59 AM | 3 (5.8%) | 2 (3.5%) |
| 10:00 AM to 10:59 AM | 0 (0.0%) | 0 (0.0%) |
| 11:00 AM to 11:59 AM | 2 (3.8%) | 0 (0.0%) |
| 12:00 PM to 3:59 PM | 0 (0.0%) | 6 (10.5%) |
| 4:00 PM to 11:59 PM | 0 (0.0%) | 5 (8.8%) |
| Total | 52 (100.0%) | 57 (100.0%) |
Housing Occupancy in East Side borough
Occupancy by Ownership in East Side borough
Of the total 109 dwellings in East Side borough, owner-occupied units account for 97 (89.0%), while renter-occupied units make up 12 (11.0%).
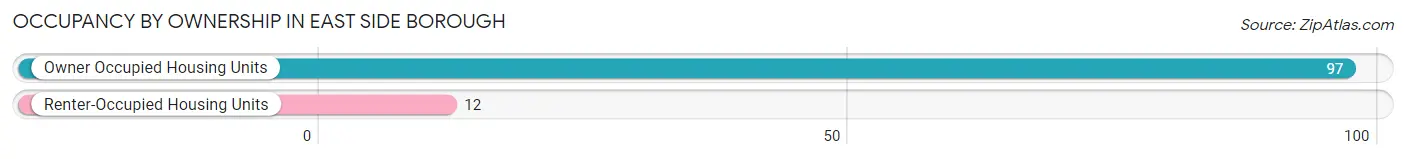
| Occupancy | # Housing Units | % Housing Units |
| Owner Occupied Housing Units | 97 | 89.0% |
| Renter-Occupied Housing Units | 12 | 11.0% |
| Total Occupied Housing Units | 109 | 100.0% |
Occupancy by Household Size in East Side borough
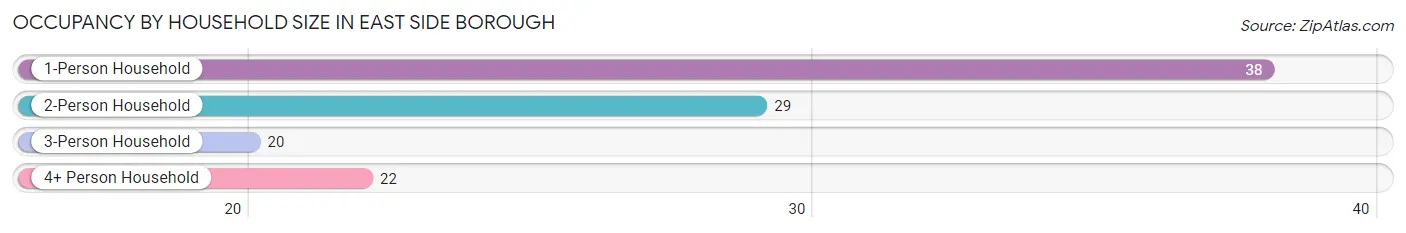
| Household Size | # Housing Units | % Housing Units |
| 1-Person Household | 38 | 34.9% |
| 2-Person Household | 29 | 26.6% |
| 3-Person Household | 20 | 18.3% |
| 4+ Person Household | 22 | 20.2% |
| Total Housing Units | 109 | 100.0% |
Occupancy by Ownership by Household Size in East Side borough
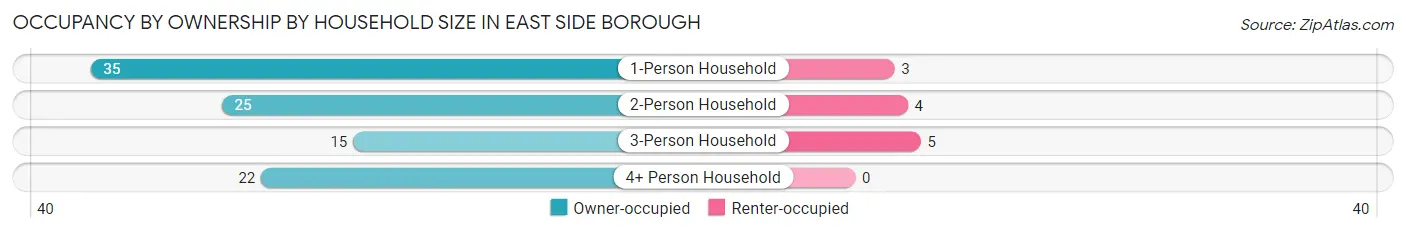
| Household Size | Owner-occupied | Renter-occupied |
| 1-Person Household | 35 (92.1%) | 3 (7.9%) |
| 2-Person Household | 25 (86.2%) | 4 (13.8%) |
| 3-Person Household | 15 (75.0%) | 5 (25.0%) |
| 4+ Person Household | 22 (100.0%) | 0 (0.0%) |
| Total Housing Units | 97 (89.0%) | 12 (11.0%) |
Occupancy by Educational Attainment in East Side borough
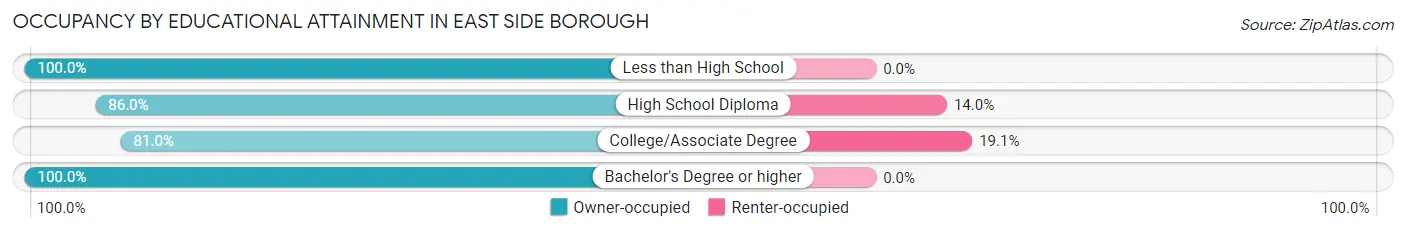
| Household Size | Owner-occupied | Renter-occupied |
| Less than High School | 9 (100.0%) | 0 (0.0%) |
| High School Diploma | 49 (86.0%) | 8 (14.0%) |
| College/Associate Degree | 17 (80.9%) | 4 (19.1%) |
| Bachelor's Degree or higher | 22 (100.0%) | 0 (0.0%) |
Occupancy by Age of Householder in East Side borough
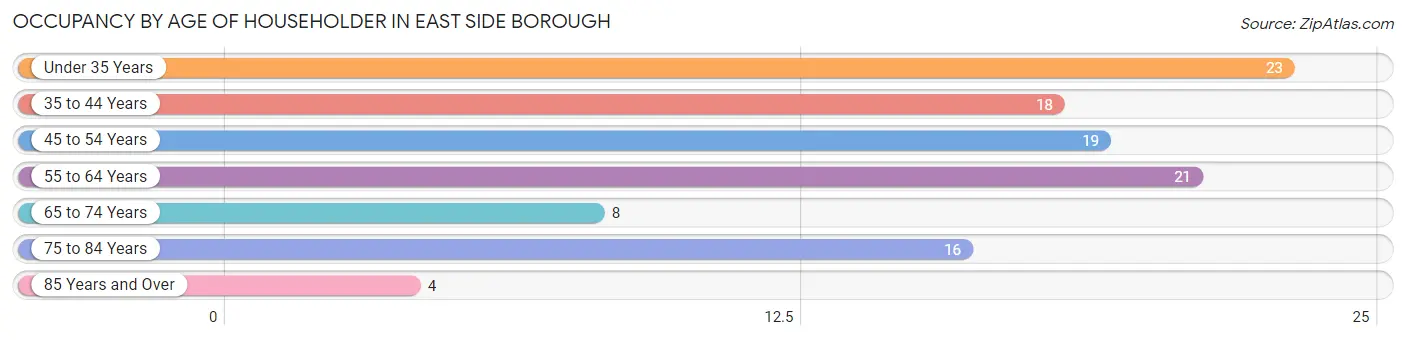
| Age Bracket | # Households | % Households |
| Under 35 Years | 23 | 21.1% |
| 35 to 44 Years | 18 | 16.5% |
| 45 to 54 Years | 19 | 17.4% |
| 55 to 64 Years | 21 | 19.3% |
| 65 to 74 Years | 8 | 7.3% |
| 75 to 84 Years | 16 | 14.7% |
| 85 Years and Over | 4 | 3.7% |
| Total | 109 | 100.0% |
Housing Finances in East Side borough
Median Income by Occupancy in East Side borough
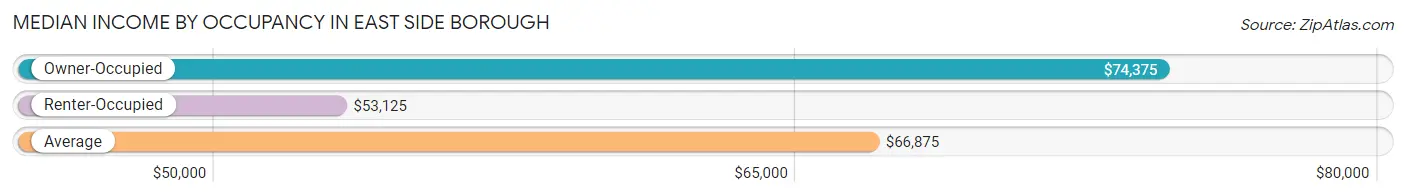
| Occupancy Type | # Households | Median Income |
| Owner-Occupied | 97 (89.0%) | $74,375 |
| Renter-Occupied | 12 (11.0%) | $53,125 |
| Average | 109 (100.0%) | $66,875 |
Occupancy by Householder Income Bracket in East Side borough
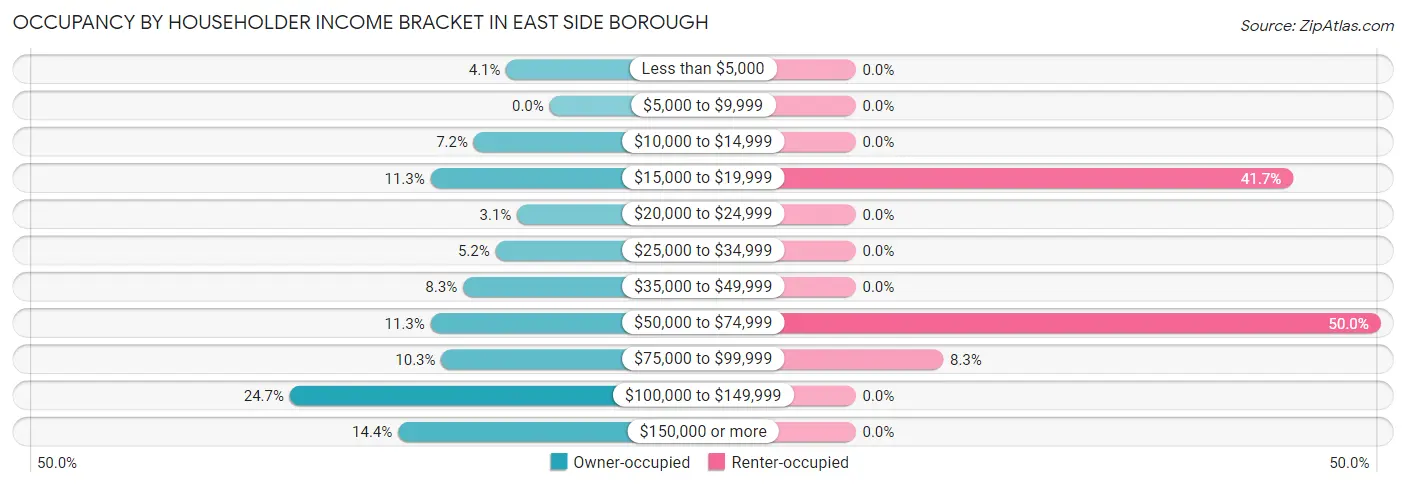
| Income Bracket | Owner-occupied | Renter-occupied |
| Less than $5,000 | 4 (4.1%) | 0 (0.0%) |
| $5,000 to $9,999 | 0 (0.0%) | 0 (0.0%) |
| $10,000 to $14,999 | 7 (7.2%) | 0 (0.0%) |
| $15,000 to $19,999 | 11 (11.3%) | 5 (41.7%) |
| $20,000 to $24,999 | 3 (3.1%) | 0 (0.0%) |
| $25,000 to $34,999 | 5 (5.1%) | 0 (0.0%) |
| $35,000 to $49,999 | 8 (8.3%) | 0 (0.0%) |
| $50,000 to $74,999 | 11 (11.3%) | 6 (50.0%) |
| $75,000 to $99,999 | 10 (10.3%) | 1 (8.3%) |
| $100,000 to $149,999 | 24 (24.7%) | 0 (0.0%) |
| $150,000 or more | 14 (14.4%) | 0 (0.0%) |
| Total | 97 (100.0%) | 12 (100.0%) |
Monthly Housing Cost Tiers in East Side borough
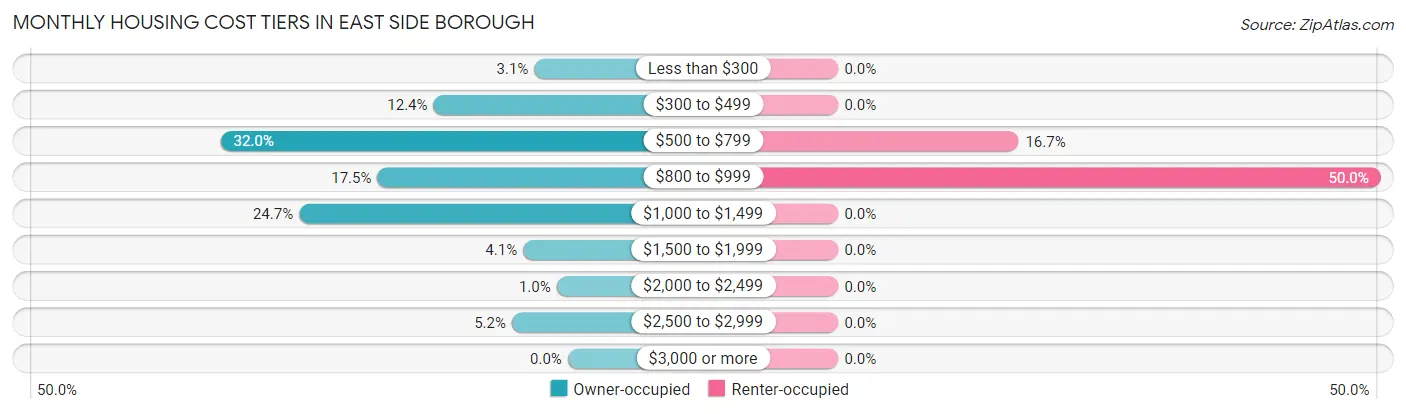
| Monthly Cost | Owner-occupied | Renter-occupied |
| Less than $300 | 3 (3.1%) | 0 (0.0%) |
| $300 to $499 | 12 (12.4%) | 0 (0.0%) |
| $500 to $799 | 31 (32.0%) | 2 (16.7%) |
| $800 to $999 | 17 (17.5%) | 6 (50.0%) |
| $1,000 to $1,499 | 24 (24.7%) | 0 (0.0%) |
| $1,500 to $1,999 | 4 (4.1%) | 0 (0.0%) |
| $2,000 to $2,499 | 1 (1.0%) | 0 (0.0%) |
| $2,500 to $2,999 | 5 (5.1%) | 0 (0.0%) |
| $3,000 or more | 0 (0.0%) | 0 (0.0%) |
| Total | 97 (100.0%) | 12 (100.0%) |
Physical Housing Characteristics in East Side borough
Housing Structures in East Side borough
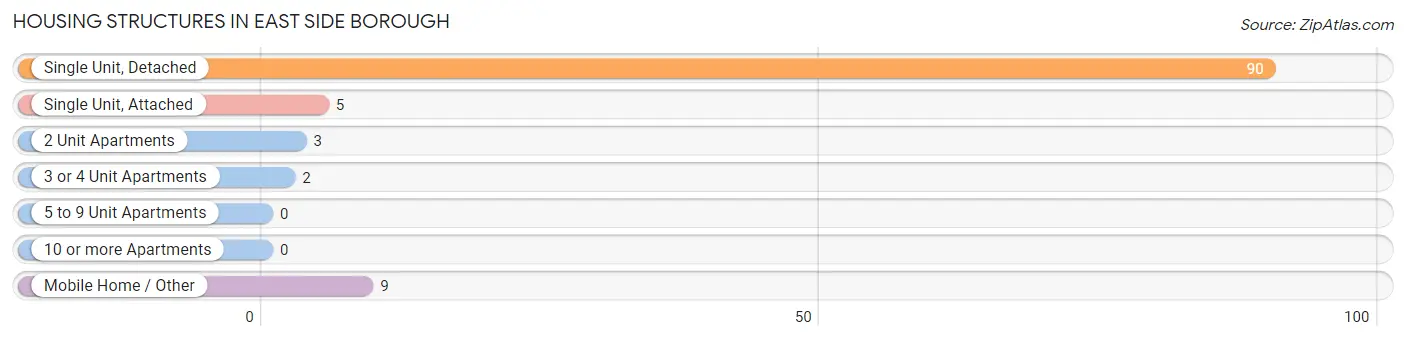
| Structure Type | # Housing Units | % Housing Units |
| Single Unit, Detached | 90 | 82.6% |
| Single Unit, Attached | 5 | 4.6% |
| 2 Unit Apartments | 3 | 2.8% |
| 3 or 4 Unit Apartments | 2 | 1.8% |
| 5 to 9 Unit Apartments | 0 | 0.0% |
| 10 or more Apartments | 0 | 0.0% |
| Mobile Home / Other | 9 | 8.3% |
| Total | 109 | 100.0% |
Housing Structures by Occupancy in East Side borough
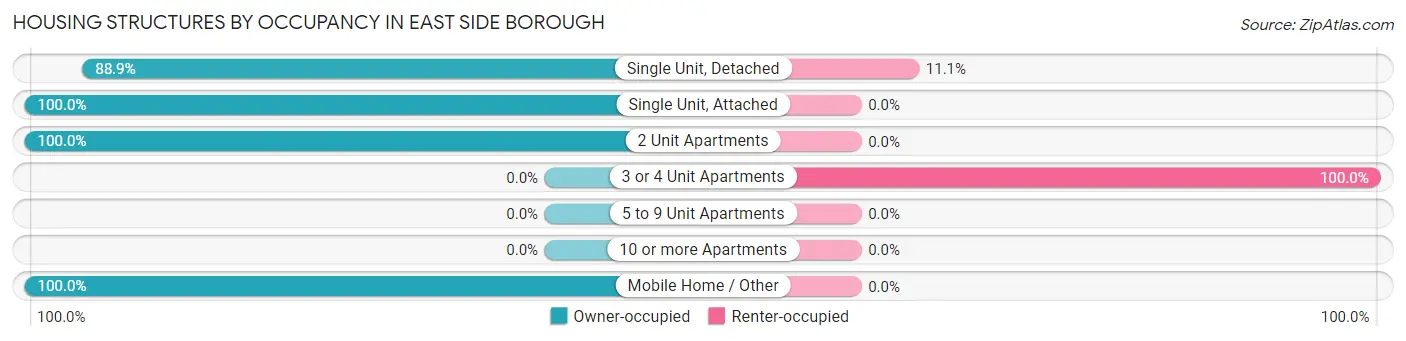
| Structure Type | Owner-occupied | Renter-occupied |
| Single Unit, Detached | 80 (88.9%) | 10 (11.1%) |
| Single Unit, Attached | 5 (100.0%) | 0 (0.0%) |
| 2 Unit Apartments | 3 (100.0%) | 0 (0.0%) |
| 3 or 4 Unit Apartments | 0 (0.0%) | 2 (100.0%) |
| 5 to 9 Unit Apartments | 0 (0.0%) | 0 (0.0%) |
| 10 or more Apartments | 0 (0.0%) | 0 (0.0%) |
| Mobile Home / Other | 9 (100.0%) | 0 (0.0%) |
| Total | 97 (89.0%) | 12 (11.0%) |
Housing Structures by Number of Rooms in East Side borough
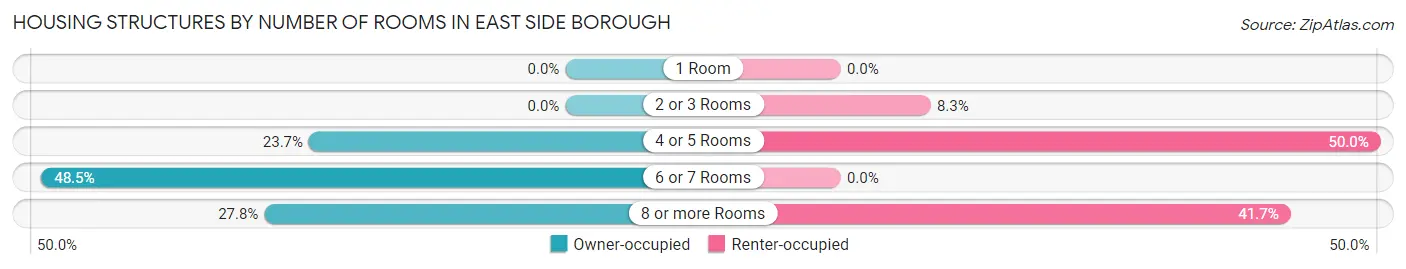
| Number of Rooms | Owner-occupied | Renter-occupied |
| 1 Room | 0 (0.0%) | 0 (0.0%) |
| 2 or 3 Rooms | 0 (0.0%) | 1 (8.3%) |
| 4 or 5 Rooms | 23 (23.7%) | 6 (50.0%) |
| 6 or 7 Rooms | 47 (48.4%) | 0 (0.0%) |
| 8 or more Rooms | 27 (27.8%) | 5 (41.7%) |
| Total | 97 (100.0%) | 12 (100.0%) |
Housing Structure by Heating Type in East Side borough
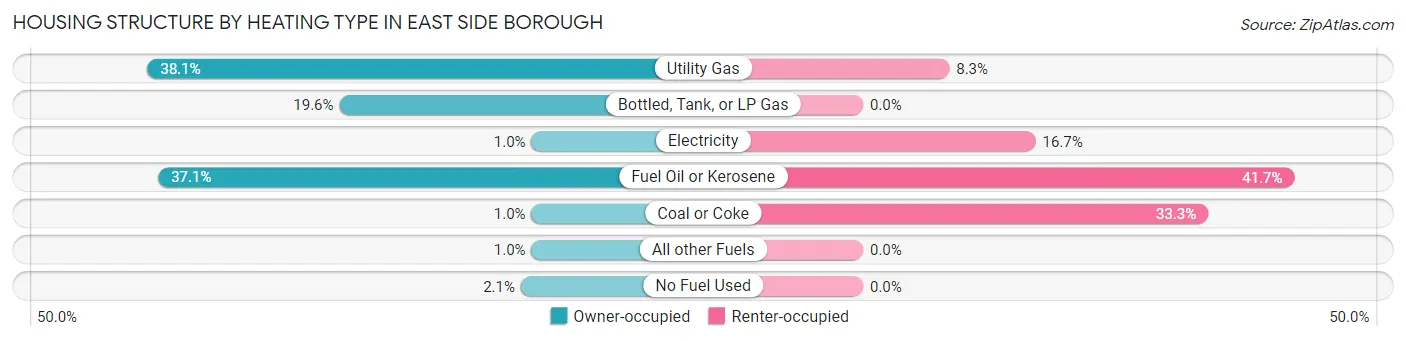
| Heating Type | Owner-occupied | Renter-occupied |
| Utility Gas | 37 (38.1%) | 1 (8.3%) |
| Bottled, Tank, or LP Gas | 19 (19.6%) | 0 (0.0%) |
| Electricity | 1 (1.0%) | 2 (16.7%) |
| Fuel Oil or Kerosene | 36 (37.1%) | 5 (41.7%) |
| Coal or Coke | 1 (1.0%) | 4 (33.3%) |
| All other Fuels | 1 (1.0%) | 0 (0.0%) |
| No Fuel Used | 2 (2.1%) | 0 (0.0%) |
| Total | 97 (100.0%) | 12 (100.0%) |
Household Vehicle Usage in East Side borough
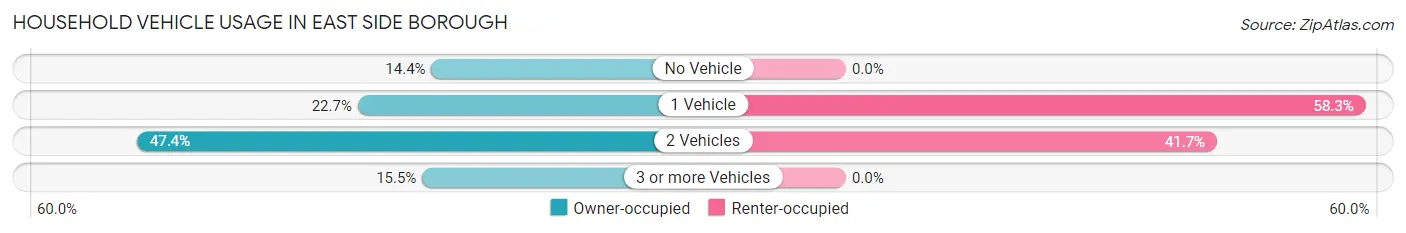
| Vehicles per Household | Owner-occupied | Renter-occupied |
| No Vehicle | 14 (14.4%) | 0 (0.0%) |
| 1 Vehicle | 22 (22.7%) | 7 (58.3%) |
| 2 Vehicles | 46 (47.4%) | 5 (41.7%) |
| 3 or more Vehicles | 15 (15.5%) | 0 (0.0%) |
| Total | 97 (100.0%) | 12 (100.0%) |
Real Estate & Mortgages in East Side borough
Real Estate and Mortgage Overview in East Side borough
| Characteristic | Without Mortgage | With Mortgage |
| Housing Units | 42 | 55 |
| Median Property Value | $106,300 | $122,900 |
| Median Household Income | $31,250 | $11 |
| Monthly Housing Costs | $553 | $0 |
| Real Estate Taxes | $1,500 | $3 |
Property Value by Mortgage Status in East Side borough
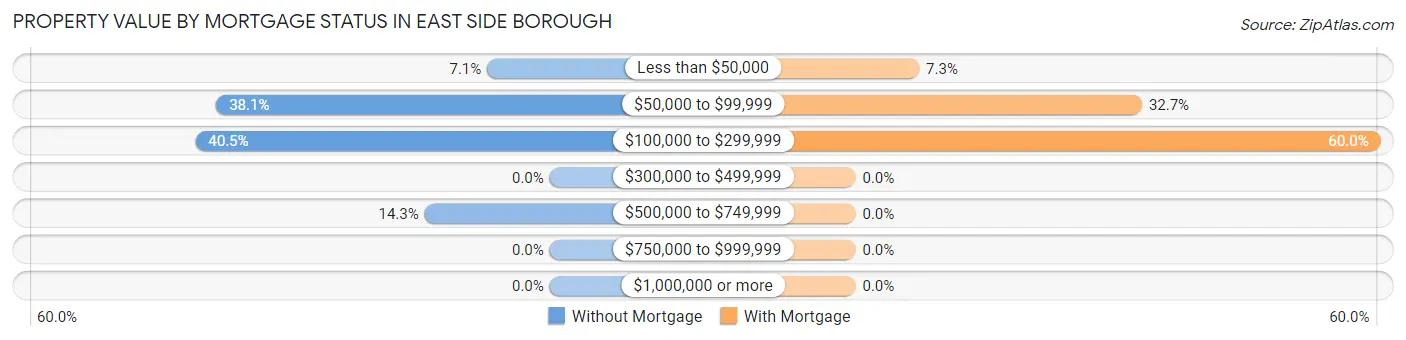
| Property Value | Without Mortgage | With Mortgage |
| Less than $50,000 | 3 (7.1%) | 4 (7.3%) |
| $50,000 to $99,999 | 16 (38.1%) | 18 (32.7%) |
| $100,000 to $299,999 | 17 (40.5%) | 33 (60.0%) |
| $300,000 to $499,999 | 0 (0.0%) | 0 (0.0%) |
| $500,000 to $749,999 | 6 (14.3%) | 0 (0.0%) |
| $750,000 to $999,999 | 0 (0.0%) | 0 (0.0%) |
| $1,000,000 or more | 0 (0.0%) | 0 (0.0%) |
| Total | 42 (100.0%) | 55 (100.0%) |
Household Income by Mortgage Status in East Side borough
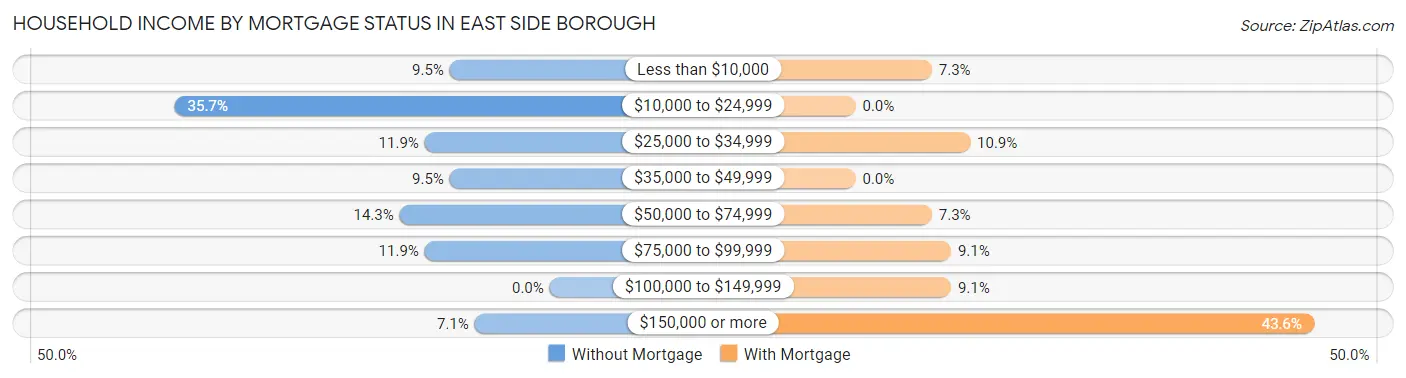
| Household Income | Without Mortgage | With Mortgage |
| Less than $10,000 | 4 (9.5%) | 4 (7.3%) |
| $10,000 to $24,999 | 15 (35.7%) | 0 (0.0%) |
| $25,000 to $34,999 | 5 (11.9%) | 6 (10.9%) |
| $35,000 to $49,999 | 4 (9.5%) | 0 (0.0%) |
| $50,000 to $74,999 | 6 (14.3%) | 4 (7.3%) |
| $75,000 to $99,999 | 5 (11.9%) | 5 (9.1%) |
| $100,000 to $149,999 | 0 (0.0%) | 5 (9.1%) |
| $150,000 or more | 3 (7.1%) | 24 (43.6%) |
| Total | 42 (100.0%) | 55 (100.0%) |
Property Value to Household Income Ratio in East Side borough
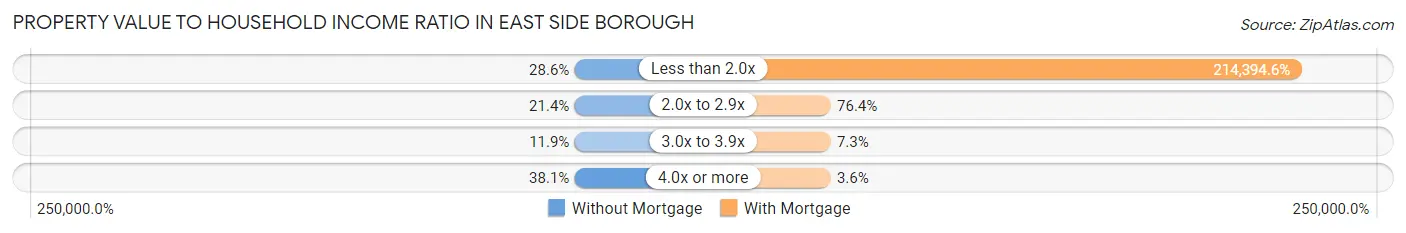
| Value-to-Income Ratio | Without Mortgage | With Mortgage |
| Less than 2.0x | 12 (28.6%) | 117,917 (214,394.5%) |
| 2.0x to 2.9x | 9 (21.4%) | 42 (76.4%) |
| 3.0x to 3.9x | 5 (11.9%) | 4 (7.3%) |
| 4.0x or more | 16 (38.1%) | 2 (3.6%) |
| Total | 42 (100.0%) | 55 (100.0%) |
Real Estate Taxes by Mortgage Status in East Side borough
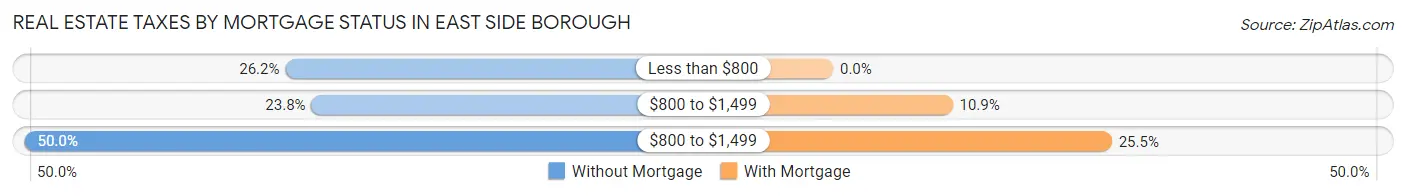
| Property Taxes | Without Mortgage | With Mortgage |
| Less than $800 | 11 (26.2%) | 0 (0.0%) |
| $800 to $1,499 | 10 (23.8%) | 6 (10.9%) |
| $800 to $1,499 | 21 (50.0%) | 14 (25.5%) |
| Total | 42 (100.0%) | 55 (100.0%) |
Health & Disability in East Side borough
Health Insurance Coverage by Age in East Side borough
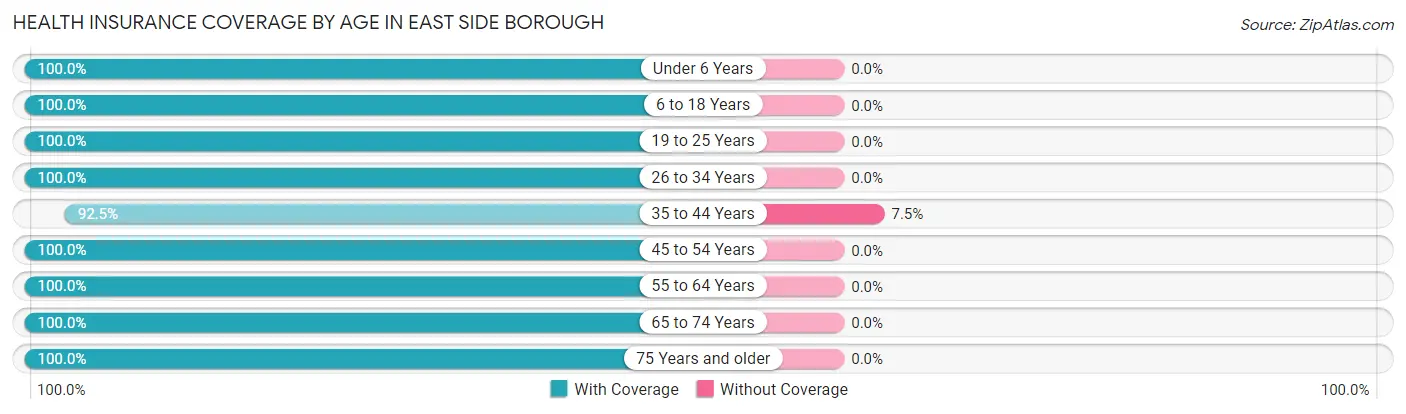
| Age Bracket | With Coverage | Without Coverage |
| Under 6 Years | 29 (100.0%) | 0 (0.0%) |
| 6 to 18 Years | 26 (100.0%) | 0 (0.0%) |
| 19 to 25 Years | 12 (100.0%) | 0 (0.0%) |
| 26 to 34 Years | 34 (100.0%) | 0 (0.0%) |
| 35 to 44 Years | 37 (92.5%) | 3 (7.5%) |
| 45 to 54 Years | 23 (100.0%) | 0 (0.0%) |
| 55 to 64 Years | 48 (100.0%) | 0 (0.0%) |
| 65 to 74 Years | 20 (100.0%) | 0 (0.0%) |
| 75 Years and older | 27 (100.0%) | 0 (0.0%) |
| Total | 256 (98.8%) | 3 (1.2%) |
Health Insurance Coverage by Citizenship Status in East Side borough
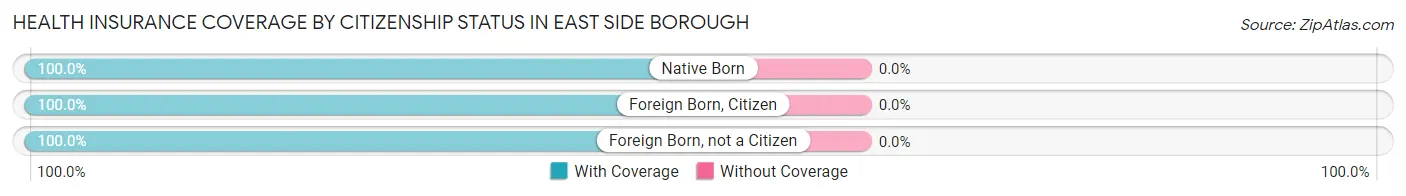
| Citizenship Status | With Coverage | Without Coverage |
| Native Born | 29 (100.0%) | 0 (0.0%) |
| Foreign Born, Citizen | 26 (100.0%) | 0 (0.0%) |
| Foreign Born, not a Citizen | 12 (100.0%) | 0 (0.0%) |
Health Insurance Coverage by Household Income in East Side borough
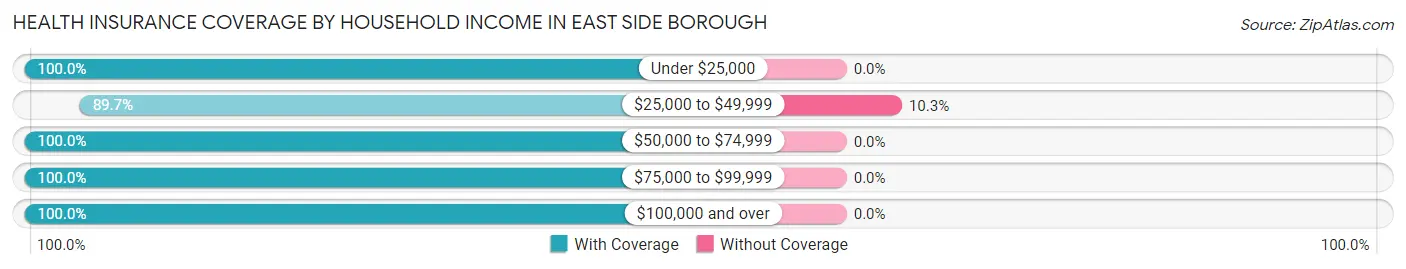
| Household Income | With Coverage | Without Coverage |
| Under $25,000 | 52 (100.0%) | 0 (0.0%) |
| $25,000 to $49,999 | 26 (89.7%) | 3 (10.3%) |
| $50,000 to $74,999 | 25 (100.0%) | 0 (0.0%) |
| $75,000 to $99,999 | 20 (100.0%) | 0 (0.0%) |
| $100,000 and over | 133 (100.0%) | 0 (0.0%) |
Public vs Private Health Insurance Coverage by Age in East Side borough
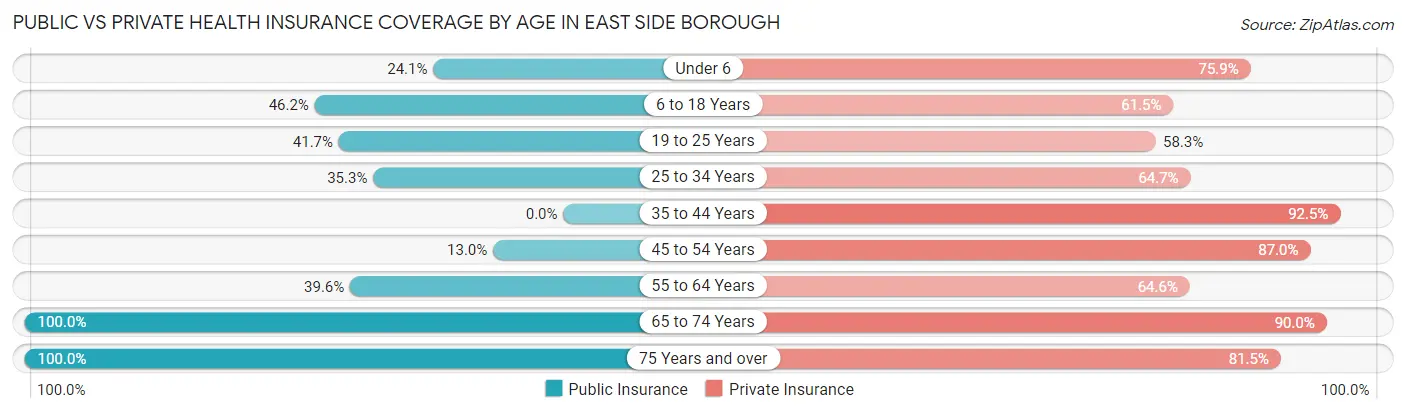
| Age Bracket | Public Insurance | Private Insurance |
| Under 6 | 7 (24.1%) | 22 (75.9%) |
| 6 to 18 Years | 12 (46.2%) | 16 (61.5%) |
| 19 to 25 Years | 5 (41.7%) | 7 (58.3%) |
| 25 to 34 Years | 12 (35.3%) | 22 (64.7%) |
| 35 to 44 Years | 0 (0.0%) | 37 (92.5%) |
| 45 to 54 Years | 3 (13.0%) | 20 (87.0%) |
| 55 to 64 Years | 19 (39.6%) | 31 (64.6%) |
| 65 to 74 Years | 20 (100.0%) | 18 (90.0%) |
| 75 Years and over | 27 (100.0%) | 22 (81.5%) |
| Total | 105 (40.5%) | 195 (75.3%) |
Disability Status by Sex by Age in East Side borough
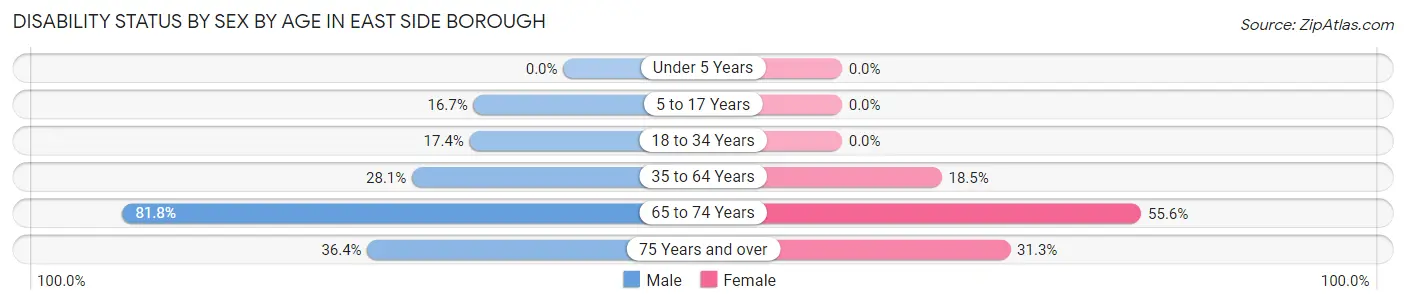
| Age Bracket | Male | Female |
| Under 5 Years | 0 (0.0%) | 0 (0.0%) |
| 5 to 17 Years | 2 (16.7%) | 0 (0.0%) |
| 18 to 34 Years | 4 (17.4%) | 0 (0.0%) |
| 35 to 64 Years | 16 (28.1%) | 10 (18.5%) |
| 65 to 74 Years | 9 (81.8%) | 5 (55.6%) |
| 75 Years and over | 4 (36.4%) | 5 (31.2%) |
Disability Class by Sex by Age in East Side borough
Disability Class: Hearing Difficulty
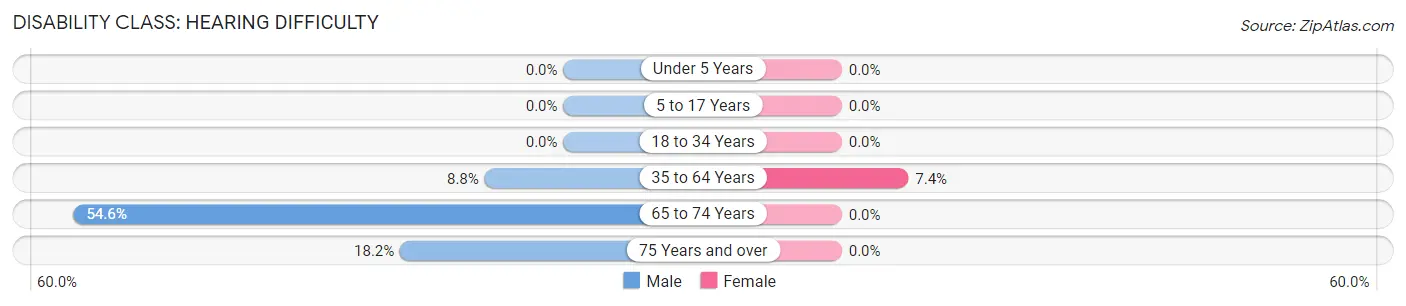
| Age Bracket | Male | Female |
| Under 5 Years | 0 (0.0%) | 0 (0.0%) |
| 5 to 17 Years | 0 (0.0%) | 0 (0.0%) |
| 18 to 34 Years | 0 (0.0%) | 0 (0.0%) |
| 35 to 64 Years | 5 (8.8%) | 4 (7.4%) |
| 65 to 74 Years | 6 (54.5%) | 0 (0.0%) |
| 75 Years and over | 2 (18.2%) | 0 (0.0%) |
Disability Class: Vision Difficulty
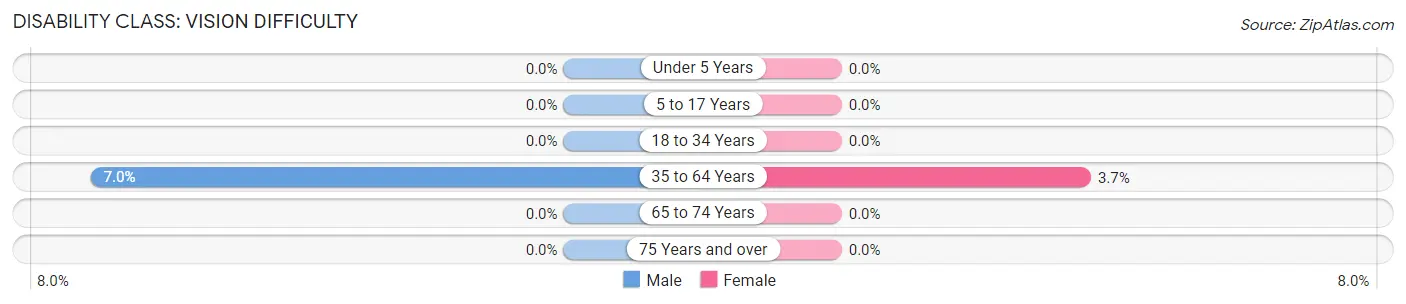
| Age Bracket | Male | Female |
| Under 5 Years | 0 (0.0%) | 0 (0.0%) |
| 5 to 17 Years | 0 (0.0%) | 0 (0.0%) |
| 18 to 34 Years | 0 (0.0%) | 0 (0.0%) |
| 35 to 64 Years | 4 (7.0%) | 2 (3.7%) |
| 65 to 74 Years | 0 (0.0%) | 0 (0.0%) |
| 75 Years and over | 0 (0.0%) | 0 (0.0%) |
Disability Class: Cognitive Difficulty
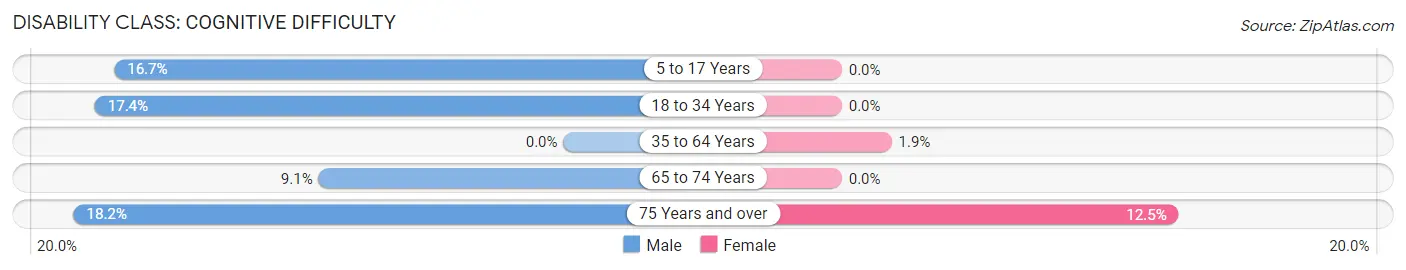
| Age Bracket | Male | Female |
| 5 to 17 Years | 2 (16.7%) | 0 (0.0%) |
| 18 to 34 Years | 4 (17.4%) | 0 (0.0%) |
| 35 to 64 Years | 0 (0.0%) | 1 (1.8%) |
| 65 to 74 Years | 1 (9.1%) | 0 (0.0%) |
| 75 Years and over | 2 (18.2%) | 2 (12.5%) |
Disability Class: Ambulatory Difficulty
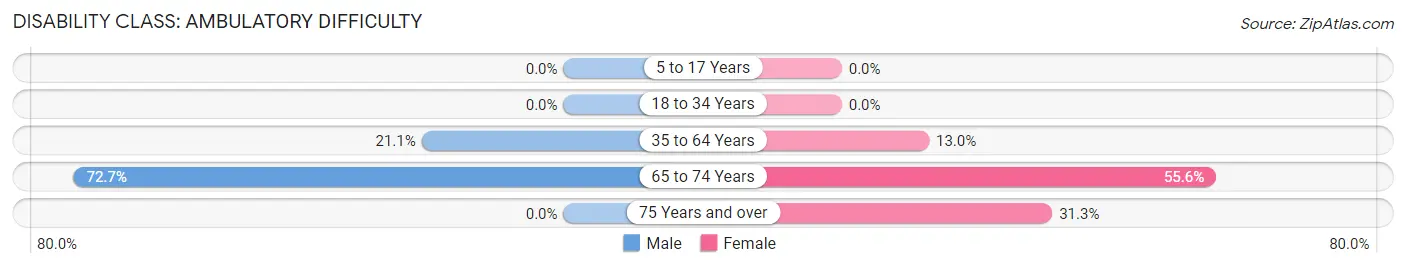
| Age Bracket | Male | Female |
| 5 to 17 Years | 0 (0.0%) | 0 (0.0%) |
| 18 to 34 Years | 0 (0.0%) | 0 (0.0%) |
| 35 to 64 Years | 12 (21.0%) | 7 (13.0%) |
| 65 to 74 Years | 8 (72.7%) | 5 (55.6%) |
| 75 Years and over | 0 (0.0%) | 5 (31.2%) |
Disability Class: Self-Care Difficulty
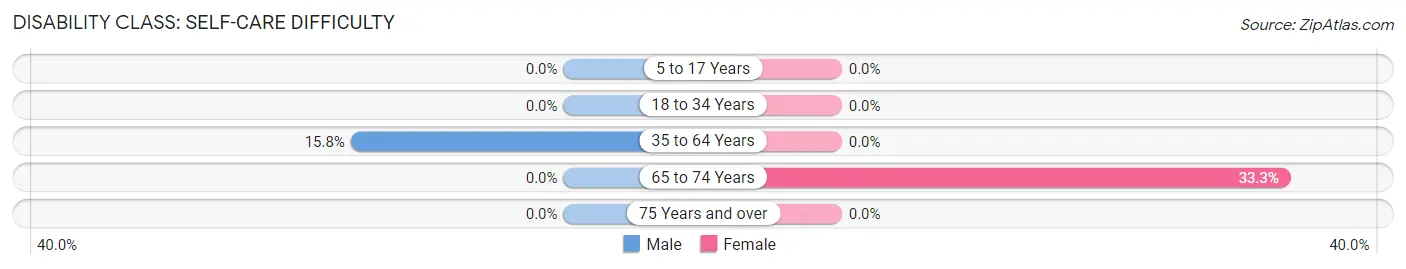
| Age Bracket | Male | Female |
| 5 to 17 Years | 0 (0.0%) | 0 (0.0%) |
| 18 to 34 Years | 0 (0.0%) | 0 (0.0%) |
| 35 to 64 Years | 9 (15.8%) | 0 (0.0%) |
| 65 to 74 Years | 0 (0.0%) | 3 (33.3%) |
| 75 Years and over | 0 (0.0%) | 0 (0.0%) |
Technology Access in East Side borough
Computing Device Access in East Side borough
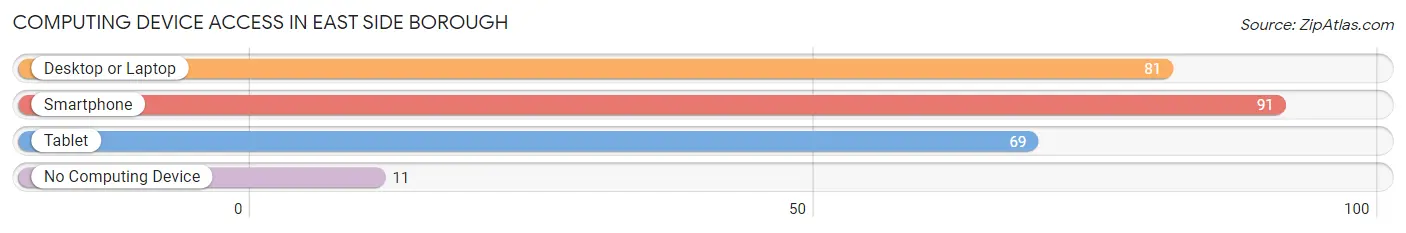
| Device Type | # Households | % Households |
| Desktop or Laptop | 81 | 74.3% |
| Smartphone | 91 | 83.5% |
| Tablet | 69 | 63.3% |
| No Computing Device | 11 | 10.1% |
| Total | 109 | 100.0% |
Internet Access in East Side borough
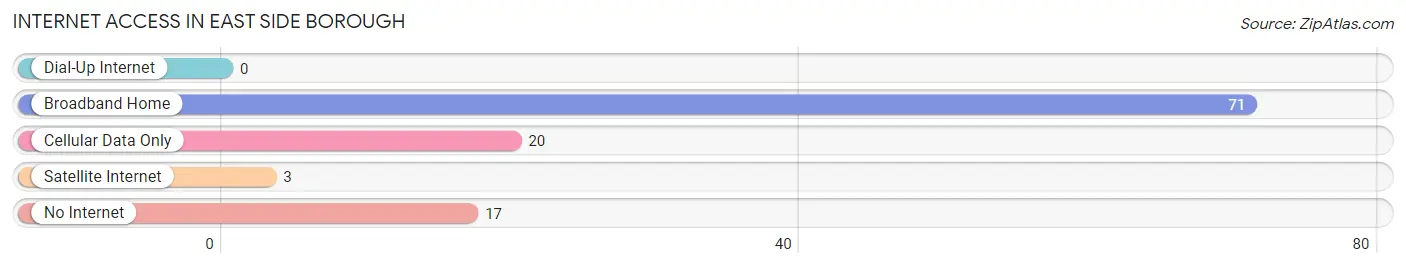
| Internet Type | # Households | % Households |
| Dial-Up Internet | 0 | 0.0% |
| Broadband Home | 71 | 65.1% |
| Cellular Data Only | 20 | 18.3% |
| Satellite Internet | 3 | 2.8% |
| No Internet | 17 | 15.6% |
| Total | 109 | 100.0% |
East Side borough Summary
East Side Borough is a borough located in Allegheny County, Pennsylvania. It is part of the Pittsburgh metropolitan area and is located approximately 10 miles east of downtown Pittsburgh. The borough is bordered by the boroughs of Wilkinsburg, Swissvale, and Rankin, and the townships of Wilkins and Penn Hills. As of the 2010 census, the population of East Side Borough was 8,945.
History
East Side Borough was originally part of Wilkins Township, which was established in 1788. The area was first settled in the late 1700s by German and Scots-Irish immigrants. The area was known as East Wilkinsburg until it was incorporated as a borough in 1894. The borough was named for its location east of Wilkinsburg.
In the late 1800s, East Side Borough was a rural farming community. The area was home to several small businesses, including a grist mill, a saw mill, a brickyard, and a coal mine. The borough also had a trolley line that connected it to Pittsburgh.
In the early 1900s, East Side Borough began to experience rapid growth as Pittsburgh's steel industry expanded. The borough's population increased from 1,000 in 1900 to 8,000 in 1920. During this time, the borough's economy shifted from agriculture to manufacturing. The borough was home to several steel mills, including the East Side Steel Company, which was founded in 1902.
Geography
East Side Borough is located in Allegheny County, Pennsylvania. It is situated in the Monongahela River Valley, approximately 10 miles east of downtown Pittsburgh. The borough is bordered by the boroughs of Wilkinsburg, Swissvale, and Rankin, and the townships of Wilkins and Penn Hills.
The borough has a total area of 1.2 square miles, all of which is land. The borough is located in the Allegheny Plateau region of Pennsylvania and is characterized by rolling hills and valleys. The borough is home to several parks, including East Side Park, which is located along the Monongahela River.
Economy
East Side Borough's economy is largely based on manufacturing. The borough is home to several steel mills, including the East Side Steel Company, which was founded in 1902. The borough is also home to several other manufacturing companies, including a paper mill, a printing company, and a machine shop.
The borough also has a growing service sector, which includes restaurants, retail stores, and professional services. The borough is home to several small businesses, including a grocery store, a hardware store, and a pharmacy.
Demographics
As of the 2010 census, the population of East Side Borough was 8,945. The population is predominantly white (90.2%), with small percentages of African American (4.3%), Asian (2.2%), and Hispanic (2.2%) residents. The median household income is $37,945, and the median age is 39.
The borough is home to several churches, including the East Side Presbyterian Church, which was founded in 1894. The borough also has several schools, including East Side Elementary School, East Side Middle School, and East Side High School.
Common Questions
What is Per Capita Income in East Side borough?
Per Capita income in East Side borough is $35,766.
What is the Median Family Income in East Side borough?
Median Family Income in East Side borough is $81,875.
What is the Median Household income in East Side borough?
Median Household Income in East Side borough is $66,875.
What is Income or Wage Gap in East Side borough?
Income or Wage Gap in East Side borough is 52.3%.
Women in East Side borough earn 47.7 cents for every dollar earned by a man.
What is Inequality or Gini Index in East Side borough?
Inequality or Gini Index in East Side borough is 0.45.
What is the Total Population of East Side borough?
Total Population of East Side borough is 259.
What is the Total Male Population of East Side borough?
Total Male Population of East Side borough is 116.
What is the Total Female Population of East Side borough?
Total Female Population of East Side borough is 143.
What is the Ratio of Males per 100 Females in East Side borough?
There are 81.12 Males per 100 Females in East Side borough.
What is the Ratio of Females per 100 Males in East Side borough?
There are 123.28 Females per 100 Males in East Side borough.
What is the Median Population Age in East Side borough?
Median Population Age in East Side borough is 40.7 Years.
What is the Average Family Size in East Side borough
Average Family Size in East Side borough is 3.1 People.
What is the Average Household Size in East Side borough
Average Household Size in East Side borough is 2.4 People.
How Large is the Labor Force in East Side borough?
There are 132 People in the Labor Forcein in East Side borough.
What is the Percentage of People in the Labor Force in East Side borough?
64.1% of People are in the Labor Force in East Side borough.
What is the Unemployment Rate in East Side borough?
Unemployment Rate in East Side borough is 4.5%.