Zip Codes with the Highest Percentage of Population with a Degree in Computers and Mathematics in Pennsylvania
RELATED REPORTS & OPTIONS
Computers and Mathematics
Pennsylvania
Compare Zip Codes
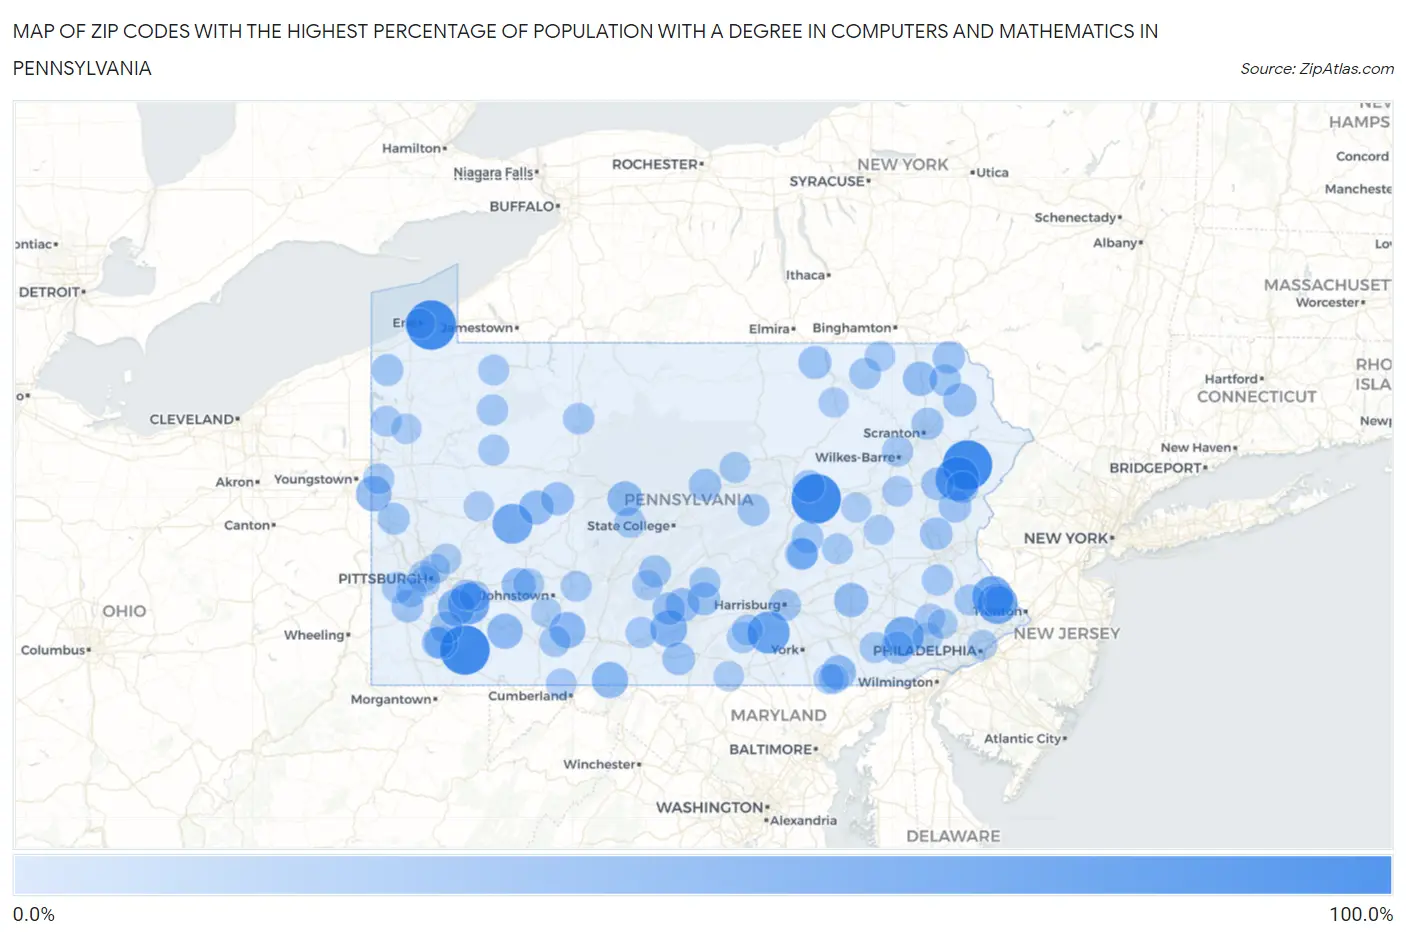
Map of Zip Codes with the Highest Percentage of Population with a Degree in Computers and Mathematics in Pennsylvania
0.0%
100.0%
Zip Codes with the Highest Percentage of Population with a Degree in Computers and Mathematics in Pennsylvania
| Zip Code | % Graduates | vs State | vs National | |
| 1. | 16563 | 100.0% | 4.6%(+95.4)#1 | 4.9%(+95.1)#1 |
| 2. | 15489 | 100.0% | 4.6%(+95.4)#2 | 4.9%(+95.1)#11 |
| 3. | 18323 | 100.0% | 4.6%(+95.4)#3 | 4.9%(+95.1)#17 |
| 4. | 17822 | 100.0% | 4.6%(+95.4)#4 | 4.9%(+95.1)#22 |
| 5. | 18349 | 74.6% | 4.6%(+70.1)#5 | 4.9%(+69.8)#31 |
| 6. | 17323 | 64.3% | 4.6%(+59.7)#6 | 4.9%(+59.4)#42 |
| 7. | 15617 | 60.5% | 4.6%(+56.0)#7 | 4.9%(+55.6)#48 |
| 8. | 18912 | 57.1% | 4.6%(+52.6)#8 | 4.9%(+52.2)#55 |
| 9. | 18980 | 56.8% | 4.6%(+52.2)#9 | 4.9%(+51.9)#56 |
| 10. | 16244 | 54.5% | 4.6%(+50.0)#10 | 4.9%(+49.7)#62 |
| 11. | 19316 | 52.4% | 4.6%(+47.8)#11 | 4.9%(+47.5)#70 |
| 12. | 15660 | 40.0% | 4.6%(+35.4)#12 | 4.9%(+35.1)#133 |
| 13. | 17215 | 40.0% | 4.6%(+35.4)#13 | 4.9%(+35.1)#134 |
| 14. | 17211 | 37.5% | 4.6%(+32.9)#14 | 4.9%(+32.6)#147 |
| 15. | 15924 | 35.8% | 4.6%(+31.3)#15 | 4.9%(+30.9)#162 |
| 16. | 16132 | 34.5% | 4.6%(+29.9)#16 | 4.9%(+29.6)#173 |
| 17. | 15646 | 33.3% | 4.6%(+28.8)#17 | 4.9%(+28.4)#187 |
| 18. | 16876 | 31.2% | 4.6%(+26.7)#18 | 4.9%(+26.4)#209 |
| 19. | 17302 | 29.9% | 4.6%(+25.4)#19 | 4.9%(+25.1)#229 |
| 20. | 17088 | 28.6% | 4.6%(+24.0)#20 | 4.9%(+23.7)#245 |
| 21. | 18823 | 28.6% | 4.6%(+24.0)#21 | 4.9%(+23.7)#247 |
| 22. | 15744 | 28.6% | 4.6%(+24.0)#22 | 4.9%(+23.7)#249 |
| 23. | 15779 | 27.5% | 4.6%(+22.9)#23 | 4.9%(+22.6)#255 |
| 24. | 17213 | 27.2% | 4.6%(+22.6)#24 | 4.9%(+22.3)#261 |
| 25. | 18456 | 25.0% | 4.6%(+20.4)#25 | 4.9%(+20.1)#302 |
| 26. | 15444 | 24.5% | 4.6%(+20.0)#26 | 4.9%(+19.6)#313 |
| 27. | 15715 | 23.8% | 4.6%(+19.3)#27 | 4.9%(+18.9)#337 |
| 28. | 18817 | 23.1% | 4.6%(+18.5)#28 | 4.9%(+18.2)#359 |
| 29. | 17071 | 23.1% | 4.6%(+18.5)#29 | 4.9%(+18.2)#360 |
| 30. | 17252 | 22.0% | 4.6%(+17.5)#30 | 4.9%(+17.1)#392 |
| 31. | 18322 | 21.6% | 4.6%(+17.1)#31 | 4.9%(+16.8)#406 |
| 32. | 18610 | 21.4% | 4.6%(+16.9)#32 | 4.9%(+16.6)#411 |
| 33. | 18086 | 21.3% | 4.6%(+16.8)#33 | 4.9%(+16.4)#419 |
| 34. | 17249 | 21.1% | 4.6%(+16.5)#34 | 4.9%(+16.2)#427 |
| 35. | 19369 | 20.8% | 4.6%(+16.2)#35 | 4.9%(+15.9)#438 |
| 36. | 16826 | 20.2% | 4.6%(+15.7)#36 | 4.9%(+15.3)#455 |
| 37. | 18462 | 20.2% | 4.6%(+15.6)#37 | 4.9%(+15.3)#456 |
| 38. | 17030 | 20.0% | 4.6%(+15.4)#38 | 4.9%(+15.1)#464 |
| 39. | 15432 | 20.0% | 4.6%(+15.4)#39 | 4.9%(+15.1)#466 |
| 40. | 17884 | 20.0% | 4.6%(+15.4)#40 | 4.9%(+15.1)#469 |
| 41. | 18372 | 19.8% | 4.6%(+15.2)#41 | 4.9%(+14.9)#475 |
| 42. | 15363 | 19.5% | 4.6%(+15.0)#42 | 4.9%(+14.6)#484 |
| 43. | 16654 | 19.2% | 4.6%(+14.7)#43 | 4.9%(+14.3)#494 |
| 44. | 16136 | 18.6% | 4.6%(+14.0)#44 | 4.9%(+13.7)#529 |
| 45. | 18519 | 18.5% | 4.6%(+13.9)#45 | 4.9%(+13.6)#536 |
| 46. | 17101 | 18.4% | 4.6%(+13.9)#46 | 4.9%(+13.5)#543 |
| 47. | 17829 | 18.2% | 4.6%(+13.6)#47 | 4.9%(+13.3)#555 |
| 48. | 17867 | 18.2% | 4.6%(+13.6)#48 | 4.9%(+13.3)#556 |
| 49. | 18430 | 17.6% | 4.6%(+13.1)#49 | 4.9%(+12.8)#580 |
| 50. | 16435 | 17.2% | 4.6%(+12.6)#50 | 4.9%(+12.3)#619 |
| 51. | 18845 | 16.7% | 4.6%(+12.1)#51 | 4.9%(+11.8)#646 |
| 52. | 15060 | 16.1% | 4.6%(+11.6)#52 | 4.9%(+11.2)#691 |
| 53. | 15845 | 16.0% | 4.6%(+11.4)#53 | 4.9%(+11.1)#705 |
| 54. | 17324 | 15.4% | 4.6%(+10.9)#54 | 4.9%(+10.5)#750 |
| 55. | 15429 | 15.4% | 4.6%(+10.8)#55 | 4.9%(+10.5)#755 |
| 56. | 18932 | 15.4% | 4.6%(+10.8)#56 | 4.9%(+10.5)#756 |
| 57. | 15560 | 15.4% | 4.6%(+10.8)#57 | 4.9%(+10.5)#758 |
| 58. | 16370 | 15.2% | 4.6%(+10.6)#58 | 4.9%(+10.3)#775 |
| 59. | 16691 | 15.1% | 4.6%(+10.5)#59 | 4.9%(+10.2)#777 |
| 60. | 18070 | 15.0% | 4.6%(+10.4)#60 | 4.9%(+10.1)#790 |
| 61. | 18709 | 14.6% | 4.6%(+10.1)#61 | 4.9%(+9.73)#830 |
| 62. | 17065 | 14.6% | 4.6%(+10.0)#62 | 4.9%(+9.70)#833 |
| 63. | 17048 | 14.4% | 4.6%(+9.82)#63 | 4.9%(+9.48)#855 |
| 64. | 17562 | 14.3% | 4.6%(+9.73)#64 | 4.9%(+9.39)#863 |
| 65. | 15962 | 14.3% | 4.6%(+9.73)#65 | 4.9%(+9.39)#871 |
| 66. | 16143 | 14.2% | 4.6%(+9.68)#66 | 4.9%(+9.33)#888 |
| 67. | 16334 | 13.6% | 4.6%(+9.01)#67 | 4.9%(+8.67)#971 |
| 68. | 16340 | 13.5% | 4.6%(+8.95)#68 | 4.9%(+8.61)#980 |
| 69. | 15634 | 13.5% | 4.6%(+8.93)#69 | 4.9%(+8.59)#985 |
| 70. | 17981 | 13.4% | 4.6%(+8.86)#70 | 4.9%(+8.52)#992 |
| 71. | 17721 | 13.3% | 4.6%(+8.78)#71 | 4.9%(+8.44)#1,004 |
| 72. | 15949 | 13.2% | 4.6%(+8.66)#72 | 4.9%(+8.31)#1,021 |
| 73. | 15204 | 13.2% | 4.6%(+8.62)#73 | 4.9%(+8.28)#1,025 |
| 74. | 17035 | 13.2% | 4.6%(+8.61)#74 | 4.9%(+8.26)#1,030 |
| 75. | 16110 | 13.0% | 4.6%(+8.49)#75 | 4.9%(+8.15)#1,049 |
| 76. | 16677 | 13.0% | 4.6%(+8.49)#76 | 4.9%(+8.15)#1,051 |
| 77. | 15692 | 12.7% | 4.6%(+8.18)#77 | 4.9%(+7.84)#1,086 |
| 78. | 17352 | 12.1% | 4.6%(+7.57)#78 | 4.9%(+7.23)#1,195 |
| 79. | 18818 | 11.8% | 4.6%(+7.25)#79 | 4.9%(+6.91)#1,256 |
| 80. | 15564 | 11.8% | 4.6%(+7.21)#80 | 4.9%(+6.87)#1,274 |
| 81. | 16501 | 11.6% | 4.6%(+7.05)#81 | 4.9%(+6.71)#1,306 |
| 82. | 18224 | 11.6% | 4.6%(+7.00)#82 | 4.9%(+6.66)#1,318 |
| 83. | 15220 | 11.4% | 4.6%(+6.86)#83 | 4.9%(+6.52)#1,344 |
| 84. | 18946 | 11.4% | 4.6%(+6.83)#84 | 4.9%(+6.49)#1,350 |
| 85. | 19475 | 11.3% | 4.6%(+6.71)#85 | 4.9%(+6.37)#1,391 |
| 86. | 16647 | 11.2% | 4.6%(+6.68)#86 | 4.9%(+6.34)#1,396 |
| 87. | 19341 | 11.2% | 4.6%(+6.67)#87 | 4.9%(+6.33)#1,398 |
| 88. | 16130 | 10.9% | 4.6%(+6.38)#88 | 4.9%(+6.04)#1,472 |
| 89. | 15051 | 10.8% | 4.6%(+6.23)#89 | 4.9%(+5.89)#1,505 |
| 90. | 17320 | 10.8% | 4.6%(+6.22)#90 | 4.9%(+5.88)#1,507 |
| 91. | 17952 | 10.7% | 4.6%(+6.16)#91 | 4.9%(+5.82)#1,526 |
| 92. | 15223 | 10.7% | 4.6%(+6.10)#92 | 4.9%(+5.76)#1,536 |
| 93. | 15031 | 10.6% | 4.6%(+6.07)#93 | 4.9%(+5.73)#1,548 |
| 94. | 18833 | 10.6% | 4.6%(+6.03)#94 | 4.9%(+5.69)#1,560 |
| 95. | 17985 | 10.6% | 4.6%(+6.01)#95 | 4.9%(+5.67)#1,564 |
| 96. | 19453 | 10.5% | 4.6%(+5.91)#96 | 4.9%(+5.57)#1,594 |
| 97. | 17321 | 10.5% | 4.6%(+5.90)#97 | 4.9%(+5.56)#1,596 |
| 98. | 15937 | 10.4% | 4.6%(+5.81)#98 | 4.9%(+5.47)#1,623 |
| 99. | 19133 | 10.3% | 4.6%(+5.78)#99 | 4.9%(+5.44)#1,641 |
| 100. | 16218 | 10.3% | 4.6%(+5.72)#100 | 4.9%(+5.38)#1,660 |
Common Questions
What are the Top 10 Zip Codes with the Highest Percentage of Population with a Degree in Computers and Mathematics in Pennsylvania?
Top 10 Zip Codes with the Highest Percentage of Population with a Degree in Computers and Mathematics in Pennsylvania are:
What zip code has the Highest Percentage of Population with a Degree in Computers and Mathematics in Pennsylvania?
16563 has the Highest Percentage of Population with a Degree in Computers and Mathematics in Pennsylvania with 100.0%.
What is the Percentage of Population with a Degree in Computers and Mathematics in the State of Pennsylvania?
Percentage of Population with a Degree in Computers and Mathematics in Pennsylvania is 4.6%.
What is the Percentage of Population with a Degree in Computers and Mathematics in the United States?
Percentage of Population with a Degree in Computers and Mathematics in the United States is 4.9%.