Halfway House, PA Map & Demographics
Halfway House Map
Halfway House Overview
$47,964
PER CAPITA INCOME
$100,625
AVG FAMILY INCOME
$113,097
AVG HOUSEHOLD INCOME
15.1%
WAGE / INCOME GAP [ % ]
84.9¢/ $1
WAGE / INCOME GAP [ $ ]
0.42
INEQUALITY / GINI INDEX
3,317
TOTAL POPULATION
1,717
MALE POPULATION
1,600
FEMALE POPULATION
107.31
MALES / 100 FEMALES
93.19
FEMALES / 100 MALES
37.2
MEDIAN AGE
3.0
AVG FAMILY SIZE
2.8
AVG HOUSEHOLD SIZE
2,159
LABOR FORCE [ PEOPLE ]
80.3%
PERCENT IN LABOR FORCE
12.8%
UNEMPLOYMENT RATE
Income in Halfway House
Income Overview in Halfway House
Per Capita Income in Halfway House is $47,964, while median incomes of families and households are $100,625 and $113,097 respectively.
| Characteristic | Number | Measure |
| Per Capita Income | 3,317 | $47,964 |
| Median Family Income | 1,018 | $100,625 |
| Mean Family Income | 1,018 | $138,988 |
| Median Household Income | 1,203 | $113,097 |
| Mean Household Income | 1,203 | $133,341 |
| Income Deficit | 1,018 | $0 |
| Wage / Income Gap (%) | 3,317 | 15.13% |
| Wage / Income Gap ($) | 3,317 | 84.87¢ per $1 |
| Gini / Inequality Index | 3,317 | 0.42 |
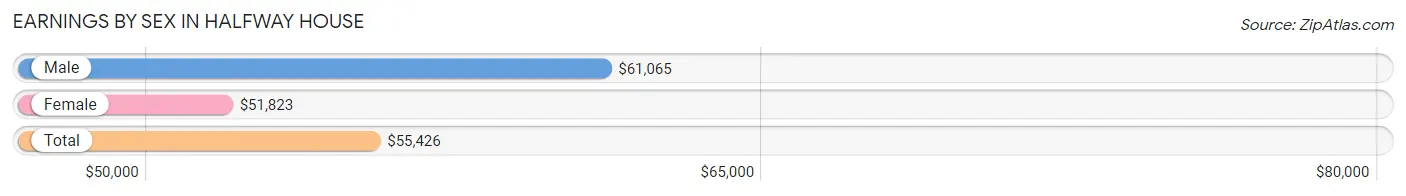
Earnings by Sex in Halfway House
Average Earnings in Halfway House are $55,426, $61,065 for men and $51,823 for women, a difference of 15.1%.
| Sex | Number | Average Earnings |
| Male | 1,041 (52.3%) | $61,065 |
| Female | 949 (47.7%) | $51,823 |
| Total | 1,990 (100.0%) | $55,426 |
Earnings by Sex by Income Bracket in Halfway House
The most common earnings brackets in Halfway House are $100,000+ for men (227 | 21.8%) and $100,000+ for women (148 | 15.6%).
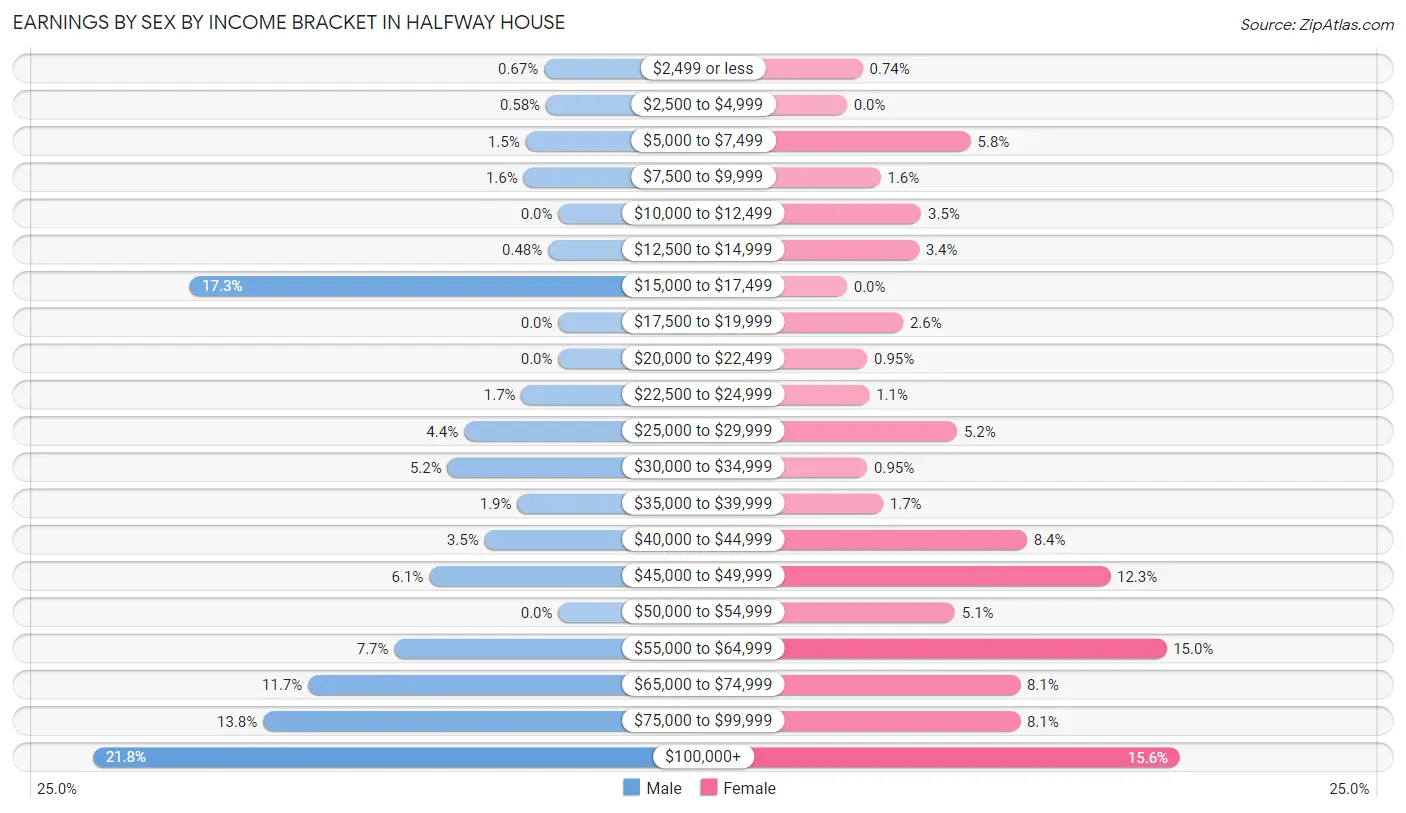
| Income | Male | Female |
| $2,499 or less | 7 (0.7%) | 7 (0.7%) |
| $2,500 to $4,999 | 6 (0.6%) | 0 (0.0%) |
| $5,000 to $7,499 | 16 (1.5%) | 55 (5.8%) |
| $7,500 to $9,999 | 17 (1.6%) | 15 (1.6%) |
| $10,000 to $12,499 | 0 (0.0%) | 33 (3.5%) |
| $12,500 to $14,999 | 5 (0.5%) | 32 (3.4%) |
| $15,000 to $17,499 | 180 (17.3%) | 0 (0.0%) |
| $17,500 to $19,999 | 0 (0.0%) | 25 (2.6%) |
| $20,000 to $22,499 | 0 (0.0%) | 9 (0.9%) |
| $22,500 to $24,999 | 18 (1.7%) | 10 (1.1%) |
| $25,000 to $29,999 | 46 (4.4%) | 49 (5.2%) |
| $30,000 to $34,999 | 54 (5.2%) | 9 (0.9%) |
| $35,000 to $39,999 | 20 (1.9%) | 16 (1.7%) |
| $40,000 to $44,999 | 36 (3.5%) | 80 (8.4%) |
| $45,000 to $49,999 | 63 (6.0%) | 117 (12.3%) |
| $50,000 to $54,999 | 0 (0.0%) | 48 (5.1%) |
| $55,000 to $64,999 | 80 (7.7%) | 142 (15.0%) |
| $65,000 to $74,999 | 122 (11.7%) | 77 (8.1%) |
| $75,000 to $99,999 | 144 (13.8%) | 77 (8.1%) |
| $100,000+ | 227 (21.8%) | 148 (15.6%) |
| Total | 1,041 (100.0%) | 949 (100.0%) |
Earnings by Sex by Educational Attainment in Halfway House
Average earnings in Halfway House are $68,026 for men and $55,773 for women, a difference of 18.0%. Men with an educational attainment of graduate degree enjoy the highest average annual earnings of $96,771, while those with less than high school education earn the least with $68,717. Women with an educational attainment of graduate degree earn the most with the average annual earnings of $91,713, while those with high school diploma education have the smallest earnings of $45,099.
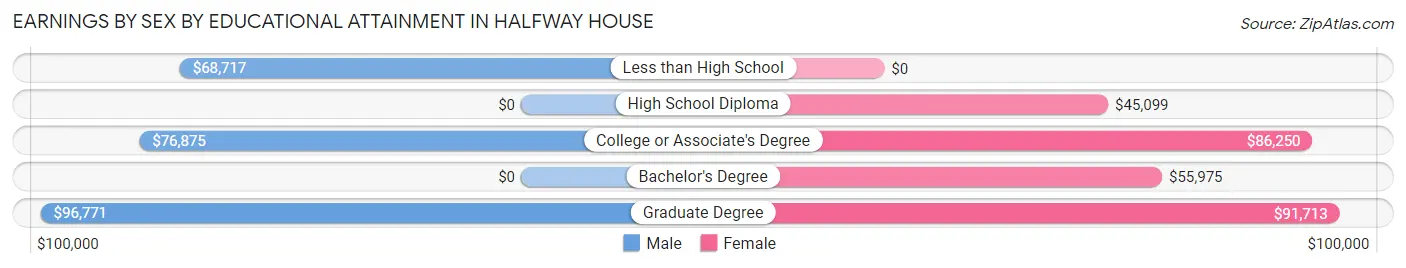
| Educational Attainment | Male Income | Female Income |
| Less than High School | $68,717 | $0 |
| High School Diploma | - | - |
| College or Associate's Degree | $76,875 | $86,250 |
| Bachelor's Degree | - | - |
| Graduate Degree | $96,771 | $91,713 |
| Total | $68,026 | $55,773 |
Family Income in Halfway House
Family Income Brackets in Halfway House
According to the Halfway House family income data, there are 396 families falling into the $50,000 to $74,999 income range, which is the most common income bracket and makes up 38.9% of all families.
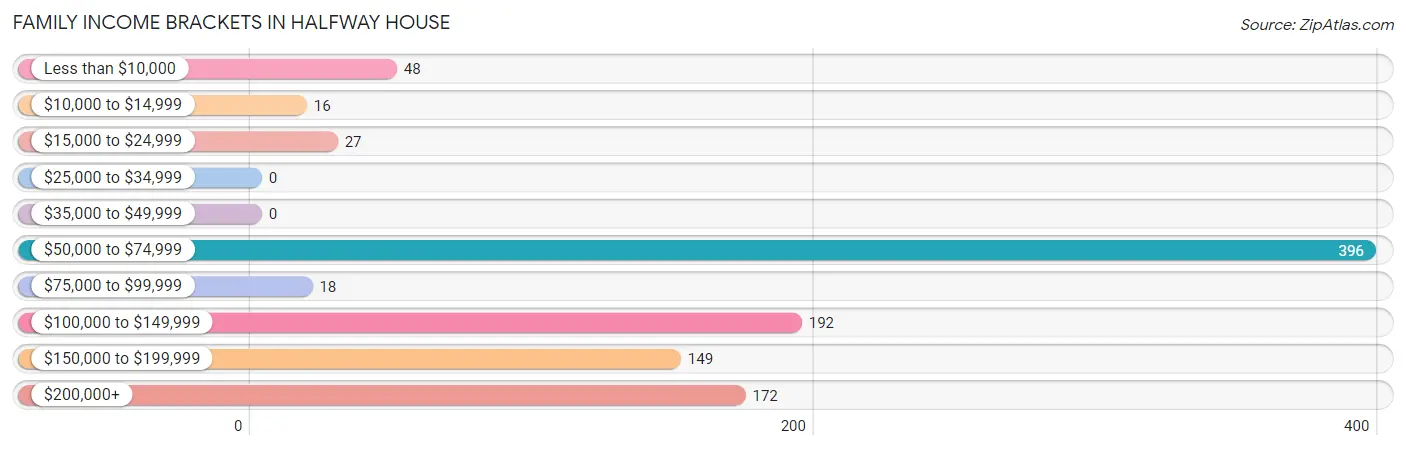
| Income Bracket | # Families | % Families |
| Less than $10,000 | 48 | 4.7% |
| $10,000 to $14,999 | 16 | 1.6% |
| $15,000 to $24,999 | 27 | 2.7% |
| $25,000 to $34,999 | 0 | 0.0% |
| $35,000 to $49,999 | 0 | 0.0% |
| $50,000 to $74,999 | 396 | 38.9% |
| $75,000 to $99,999 | 18 | 1.8% |
| $100,000 to $149,999 | 192 | 18.9% |
| $150,000 to $199,999 | 149 | 14.6% |
| $200,000+ | 172 | 16.9% |
Family Income by Famaliy Size in Halfway House
3-person families (201 | 19.7%) account for the highest median family income in Halfway House with $158,125 per family, while 3-person families (201 | 19.7%) have the highest median income of $52,708 per family member.
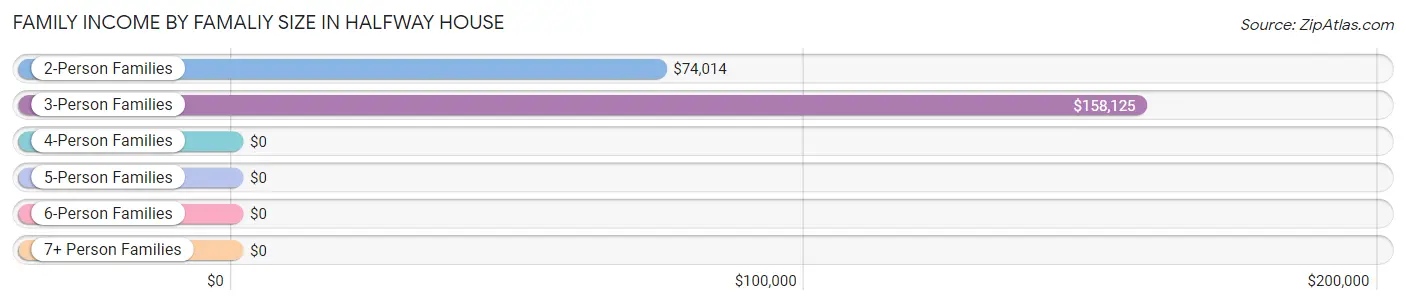
| Income Bracket | # Families | Median Income |
| 2-Person Families | 543 (53.3%) | $74,014 |
| 3-Person Families | 201 (19.7%) | $158,125 |
| 4-Person Families | 138 (13.6%) | $0 |
| 5-Person Families | 63 (6.2%) | $0 |
| 6-Person Families | 25 (2.5%) | $0 |
| 7+ Person Families | 48 (4.7%) | $0 |
| Total | 1,018 (100.0%) | $100,625 |
Family Income by Number of Earners in Halfway House
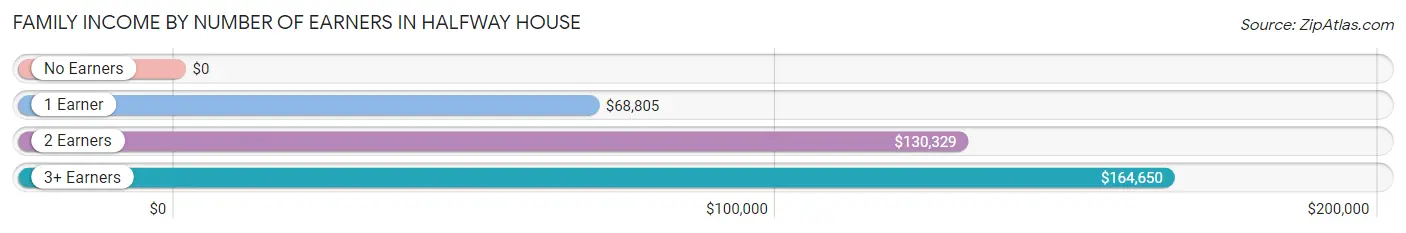
| Number of Earners | # Families | Median Income |
| No Earners | 101 (9.9%) | $0 |
| 1 Earner | 257 (25.3%) | $68,805 |
| 2 Earners | 567 (55.7%) | $130,329 |
| 3+ Earners | 93 (9.1%) | $164,650 |
| Total | 1,018 (100.0%) | $100,625 |
Household Income in Halfway House
Household Income Brackets in Halfway House
With 368 households falling in the category, the $100,000 to $149,999 income range is the most frequent in Halfway House, accounting for 30.6% of all households. In contrast, only 16 households (1.3%) fall into the $10,000 to $14,999 income bracket, making it the least populous group.
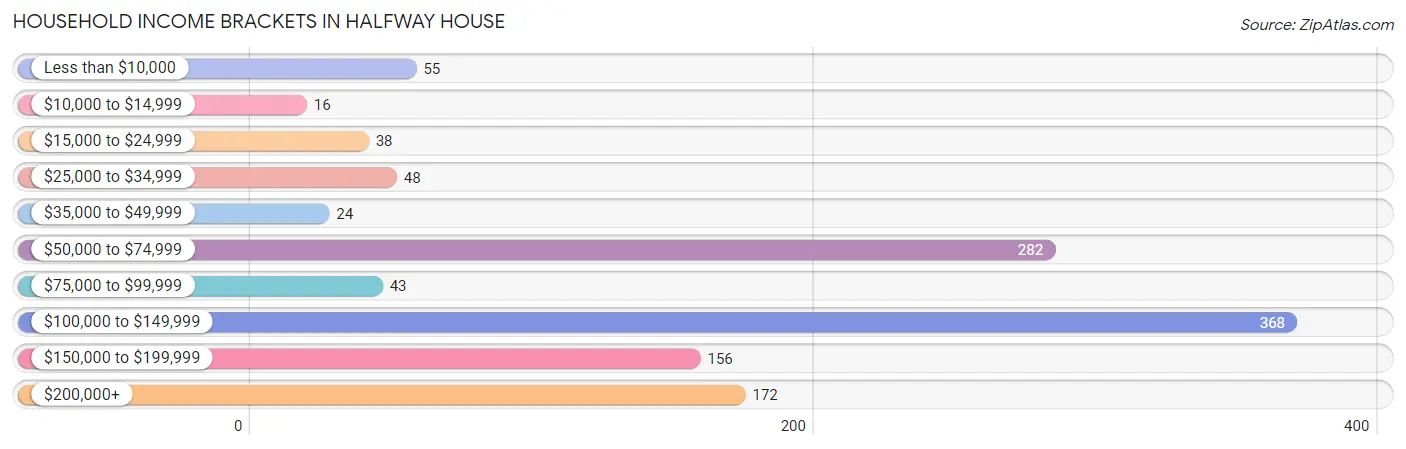
| Income Bracket | # Households | % Households |
| Less than $10,000 | 55 | 4.6% |
| $10,000 to $14,999 | 16 | 1.3% |
| $15,000 to $24,999 | 38 | 3.2% |
| $25,000 to $34,999 | 48 | 4.0% |
| $35,000 to $49,999 | 24 | 2.0% |
| $50,000 to $74,999 | 282 | 23.4% |
| $75,000 to $99,999 | 43 | 3.6% |
| $100,000 to $149,999 | 368 | 30.6% |
| $150,000 to $199,999 | 156 | 13.0% |
| $200,000+ | 172 | 14.3% |
Household Income by Householder Age in Halfway House
The median household income in Halfway House is $113,097, with the highest median household income of $128,913 found in the 45 to 64 years age bracket for the primary householder. A total of 362 households (30.1%) fall into this category. Meanwhile, the 15 to 24 years age bracket for the primary householder has the lowest median household income of $0, with 27 households (2.2%) in this group.
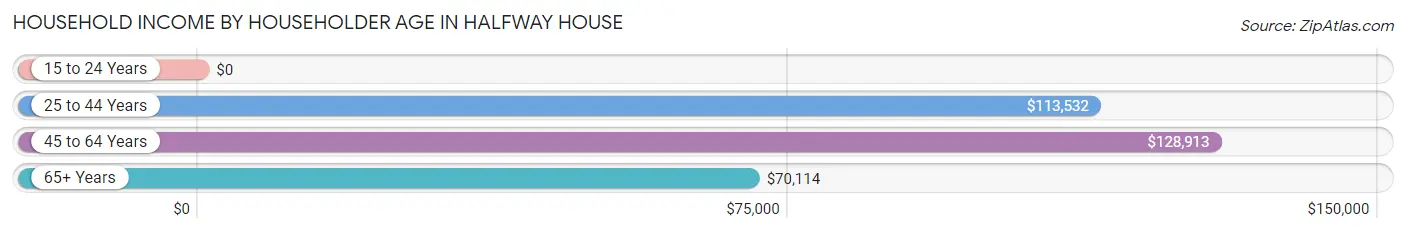
| Income Bracket | # Households | Median Income |
| 15 to 24 Years | 27 (2.2%) | $0 |
| 25 to 44 Years | 583 (48.5%) | $113,532 |
| 45 to 64 Years | 362 (30.1%) | $128,913 |
| 65+ Years | 231 (19.2%) | $70,114 |
| Total | 1,203 (100.0%) | $113,097 |
Poverty in Halfway House
Income Below Poverty by Sex and Age in Halfway House
With 9.4% poverty level for males and 14.4% for females among the residents of Halfway House, 5 year old males and 12 to 14 year old females are the most vulnerable to poverty, with 44 males (100.0%) and 47 females (52.2%) in their respective age groups living below the poverty level.
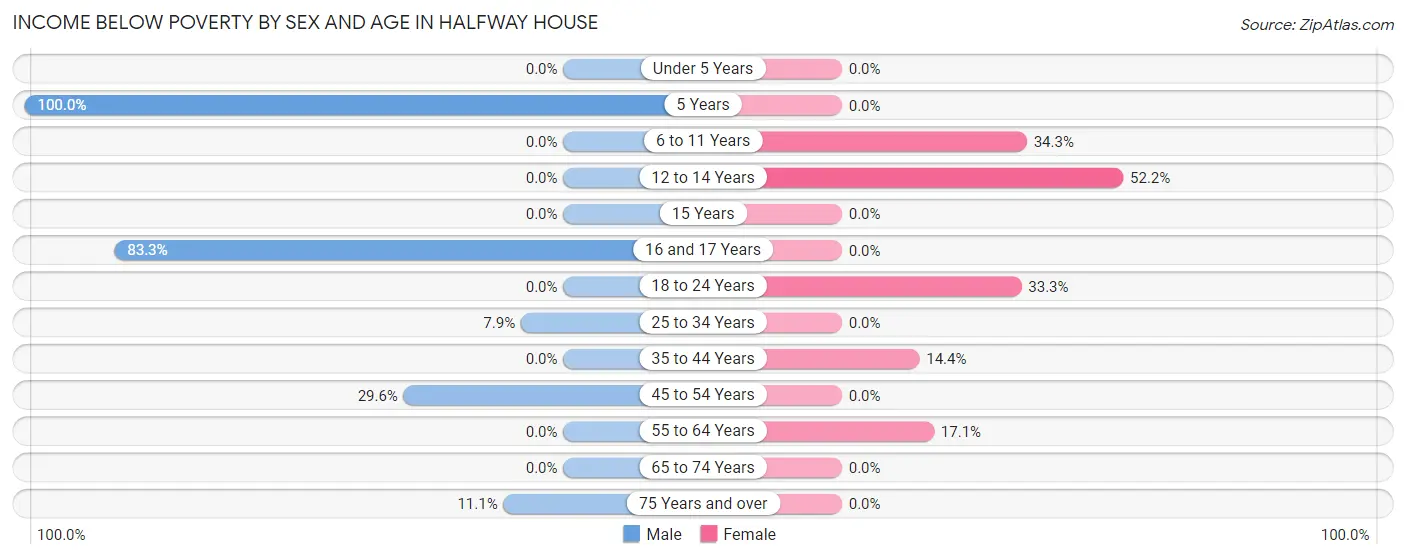
| Age Bracket | Male | Female |
| Under 5 Years | 0 (0.0%) | 0 (0.0%) |
| 5 Years | 44 (100.0%) | 0 (0.0%) |
| 6 to 11 Years | 0 (0.0%) | 46 (34.3%) |
| 12 to 14 Years | 0 (0.0%) | 47 (52.2%) |
| 15 Years | 0 (0.0%) | 0 (0.0%) |
| 16 and 17 Years | 45 (83.3%) | 0 (0.0%) |
| 18 to 24 Years | 0 (0.0%) | 59 (33.3%) |
| 25 to 34 Years | 18 (7.9%) | 0 (0.0%) |
| 35 to 44 Years | 0 (0.0%) | 45 (14.4%) |
| 45 to 54 Years | 48 (29.6%) | 0 (0.0%) |
| 55 to 64 Years | 0 (0.0%) | 33 (17.1%) |
| 65 to 74 Years | 0 (0.0%) | 0 (0.0%) |
| 75 Years and over | 7 (11.1%) | 0 (0.0%) |
| Total | 162 (9.4%) | 230 (14.4%) |
Income Above Poverty by Sex and Age in Halfway House
According to the poverty statistics in Halfway House, males aged under 5 years and females aged under 5 years are the age groups that are most secure financially, with 100.0% of males and 100.0% of females in these age groups living above the poverty line.
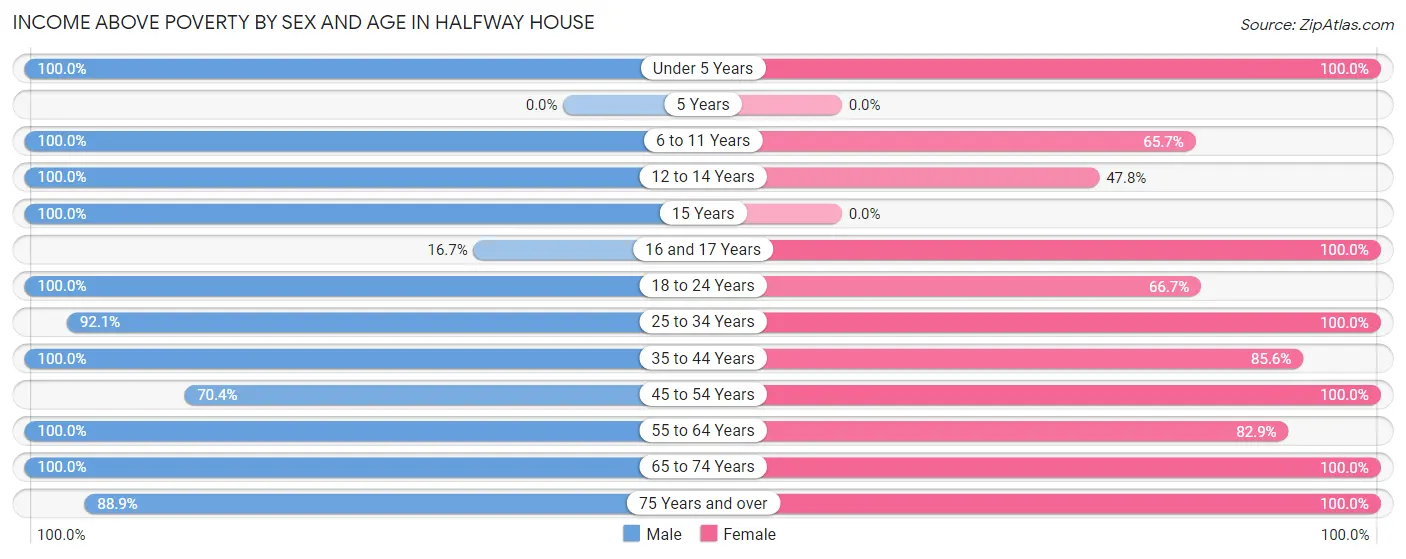
| Age Bracket | Male | Female |
| Under 5 Years | 107 (100.0%) | 19 (100.0%) |
| 5 Years | 0 (0.0%) | 0 (0.0%) |
| 6 to 11 Years | 91 (100.0%) | 88 (65.7%) |
| 12 to 14 Years | 88 (100.0%) | 43 (47.8%) |
| 15 Years | 55 (100.0%) | 0 (0.0%) |
| 16 and 17 Years | 9 (16.7%) | 28 (100.0%) |
| 18 to 24 Years | 135 (100.0%) | 118 (66.7%) |
| 25 to 34 Years | 211 (92.1%) | 293 (100.0%) |
| 35 to 44 Years | 459 (100.0%) | 268 (85.6%) |
| 45 to 54 Years | 114 (70.4%) | 161 (100.0%) |
| 55 to 64 Years | 112 (100.0%) | 160 (82.9%) |
| 65 to 74 Years | 118 (100.0%) | 95 (100.0%) |
| 75 Years and over | 56 (88.9%) | 93 (100.0%) |
| Total | 1,555 (90.6%) | 1,366 (85.6%) |
Income Below Poverty Among Married-Couple Families in Halfway House
The poverty statistics for married-couple families in Halfway House show that 6.0% or 48 of the total 801 families live below the poverty line. Families with 3 or 4 children have the highest poverty rate of 58.5%, comprising of 48 families. On the other hand, families with no children have the lowest poverty rate of 0.0%, which includes 0 families.
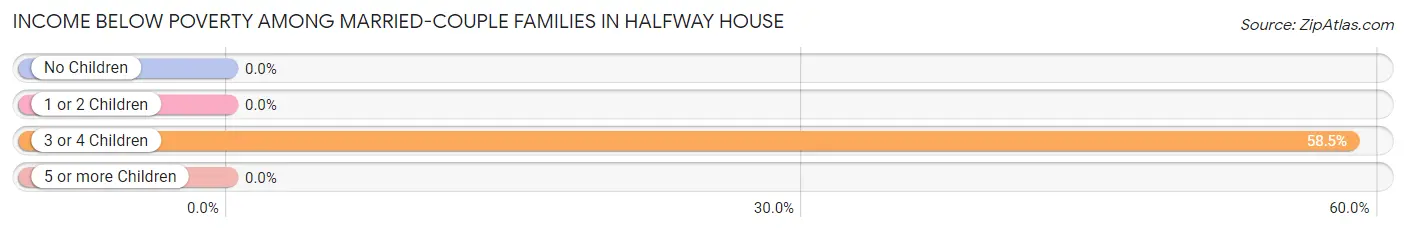
| Children | Above Poverty | Below Poverty |
| No Children | 507 (100.0%) | 0 (0.0%) |
| 1 or 2 Children | 212 (100.0%) | 0 (0.0%) |
| 3 or 4 Children | 34 (41.5%) | 48 (58.5%) |
| 5 or more Children | 0 (0.0%) | 0 (0.0%) |
| Total | 753 (94.0%) | 48 (6.0%) |
Income Below Poverty Among Single-Parent Households in Halfway House
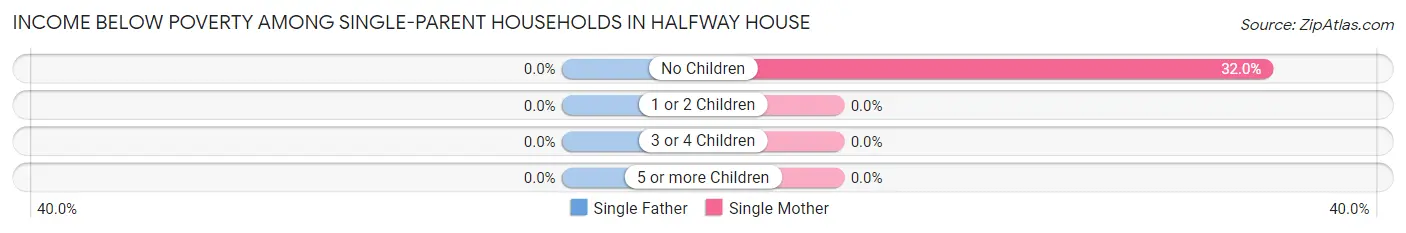
| Children | Single Father | Single Mother |
| No Children | 0 (0.0%) | 16 (32.0%) |
| 1 or 2 Children | 0 (0.0%) | 0 (0.0%) |
| 3 or 4 Children | 0 (0.0%) | 0 (0.0%) |
| 5 or more Children | 0 (0.0%) | 0 (0.0%) |
| Total | 0 (0.0%) | 16 (15.5%) |
Income Below Poverty Among Married-Couple vs Single-Parent Households in Halfway House
The poverty data for Halfway House shows that 48 of the married-couple family households (6.0%) and 16 of the single-parent households (7.4%) are living below the poverty level. Within the married-couple family households, those with 3 or 4 children have the highest poverty rate, with 48 households (58.5%) falling below the poverty line. Among the single-parent households, those with no children have the highest poverty rate, with 16 household (32.0%) living below poverty.
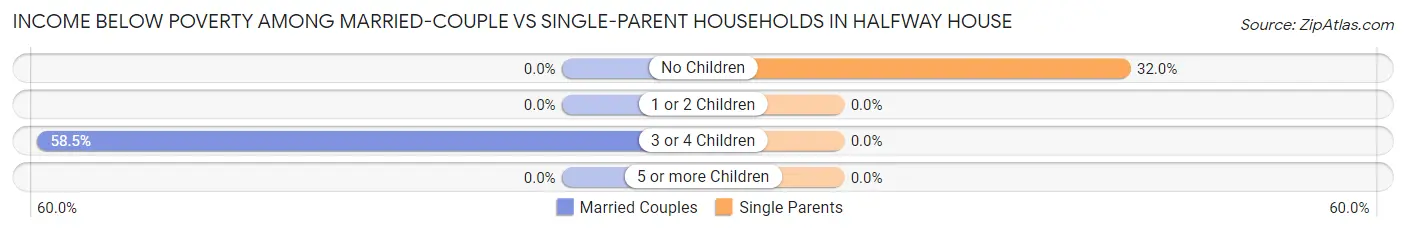
| Children | Married-Couple Families | Single-Parent Households |
| No Children | 0 (0.0%) | 16 (32.0%) |
| 1 or 2 Children | 0 (0.0%) | 0 (0.0%) |
| 3 or 4 Children | 48 (58.5%) | 0 (0.0%) |
| 5 or more Children | 0 (0.0%) | 0 (0.0%) |
| Total | 48 (6.0%) | 16 (7.4%) |
Race in Halfway House
The most populous races in Halfway House are White / Caucasian (2,789 | 84.1%), Two or more Races (270 | 8.1%), and Black / African American (179 | 5.4%).
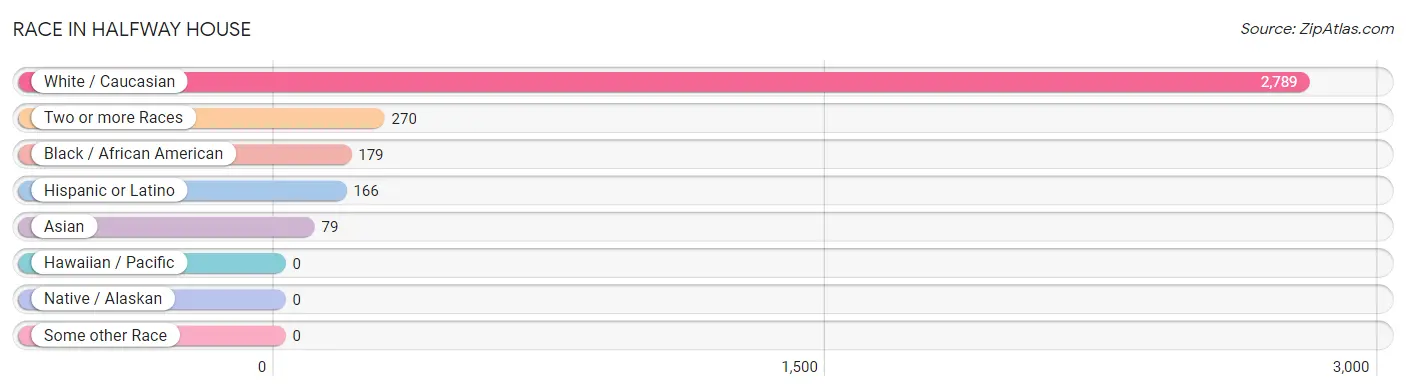
| Race | # Population | % Population |
| Asian | 79 | 2.4% |
| Black / African American | 179 | 5.4% |
| Hawaiian / Pacific | 0 | 0.0% |
| Hispanic or Latino | 166 | 5.0% |
| Native / Alaskan | 0 | 0.0% |
| White / Caucasian | 2,789 | 84.1% |
| Two or more Races | 270 | 8.1% |
| Some other Race | 0 | 0.0% |
| Total | 3,317 | 100.0% |
Ancestry in Halfway House
The most populous ancestries reported in Halfway House are German (660 | 19.9%), Polish (427 | 12.9%), Italian (424 | 12.8%), Irish (361 | 10.9%), and Arab (289 | 8.7%), together accounting for 65.1% of all Halfway House residents.
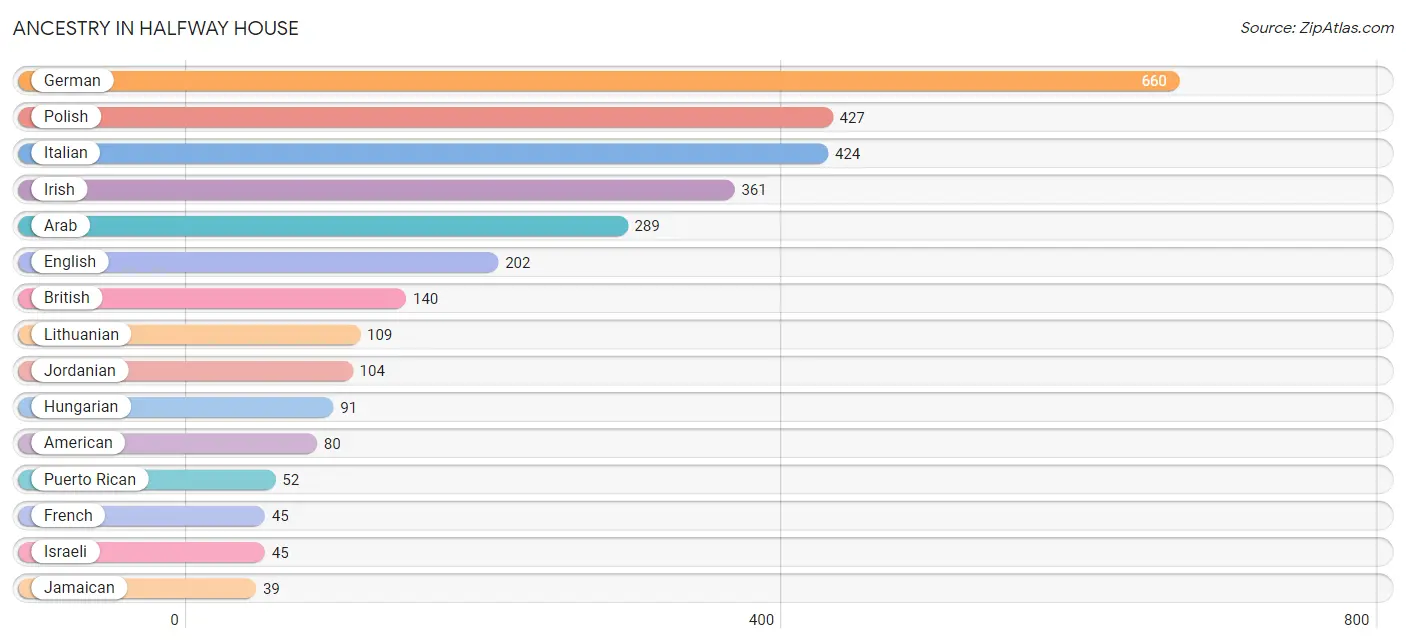
| Ancestry | # Population | % Population |
| African | 9 | 0.3% |
| American | 80 | 2.4% |
| Arab | 289 | 8.7% |
| Austrian | 8 | 0.2% |
| British | 140 | 4.2% |
| Czechoslovakian | 37 | 1.1% |
| Eastern European | 10 | 0.3% |
| English | 202 | 6.1% |
| European | 35 | 1.1% |
| Finnish | 29 | 0.9% |
| French | 45 | 1.4% |
| French Canadian | 7 | 0.2% |
| German | 660 | 19.9% |
| Hungarian | 91 | 2.7% |
| Irish | 361 | 10.9% |
| Israeli | 45 | 1.4% |
| Italian | 424 | 12.8% |
| Jamaican | 39 | 1.2% |
| Jordanian | 104 | 3.1% |
| Korean | 29 | 0.9% |
| Lithuanian | 109 | 3.3% |
| Norwegian | 5 | 0.2% |
| Pennsylvania German | 33 | 1.0% |
| Polish | 427 | 12.9% |
| Puerto Rican | 52 | 1.6% |
| Scotch-Irish | 33 | 1.0% |
| Slovak | 10 | 0.3% |
| Sri Lankan | 11 | 0.3% |
| Subsaharan African | 9 | 0.3% |
| Swiss | 9 | 0.3% |
| Thai | 39 | 1.2% |
| Welsh | 35 | 1.1% | View All 32 Rows |
Immigrants in Halfway House
The most numerous immigrant groups reported in Halfway House came from Asia (266 | 8.0%), Western Asia (197 | 5.9%), Jordan (104 | 3.1%), South Eastern Asia (60 | 1.8%), and Kuwait (48 | 1.5%), together accounting for 20.4% of all Halfway House residents.
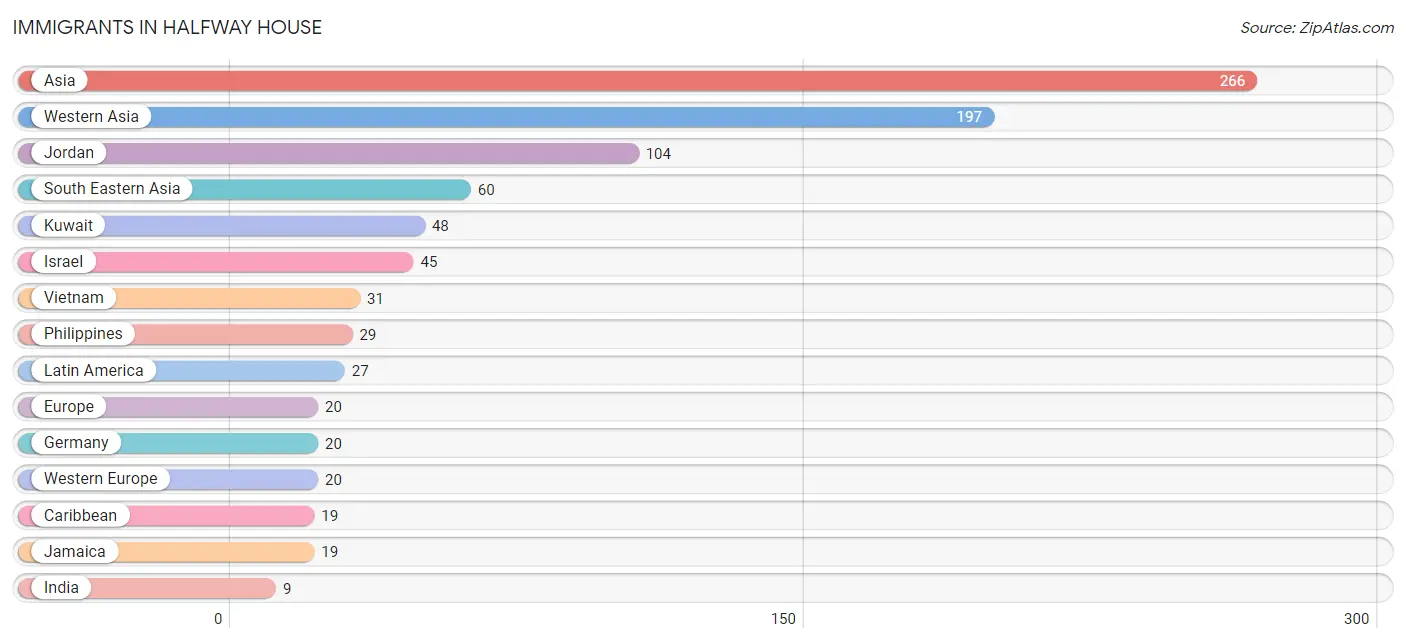
| Immigration Origin | # Population | % Population |
| Asia | 266 | 8.0% |
| Caribbean | 19 | 0.6% |
| Europe | 20 | 0.6% |
| Germany | 20 | 0.6% |
| India | 9 | 0.3% |
| Israel | 45 | 1.4% |
| Jamaica | 19 | 0.6% |
| Jordan | 104 | 3.1% |
| Kuwait | 48 | 1.5% |
| Latin America | 27 | 0.8% |
| Philippines | 29 | 0.9% |
| South America | 8 | 0.2% |
| South Central Asia | 9 | 0.3% |
| South Eastern Asia | 60 | 1.8% |
| Uruguay | 8 | 0.2% |
| Vietnam | 31 | 0.9% |
| Western Asia | 197 | 5.9% |
| Western Europe | 20 | 0.6% | View All 18 Rows |
Sex and Age in Halfway House
Sex and Age in Halfway House
The most populous age groups in Halfway House are 40 to 44 Years (328 | 19.1%) for men and 35 to 39 Years (228 | 14.2%) for women.
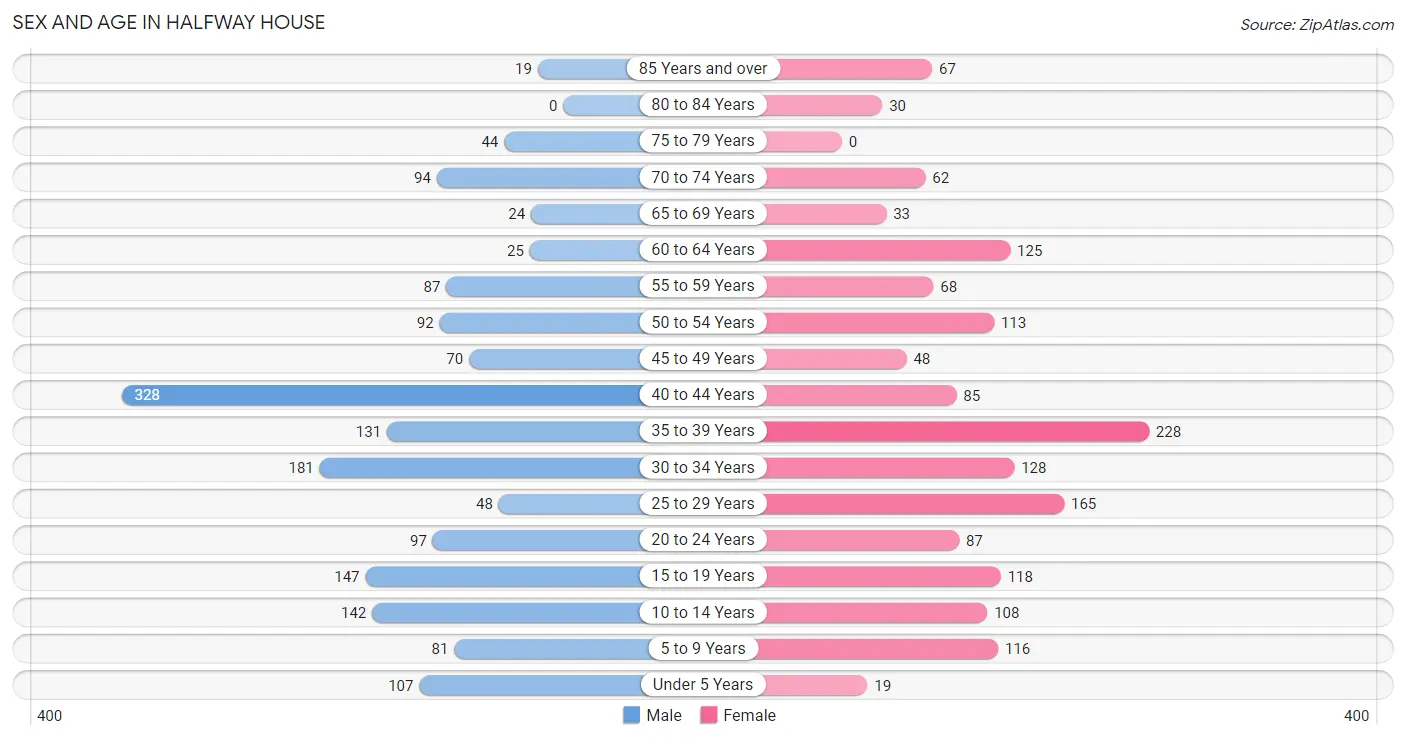
| Age Bracket | Male | Female |
| Under 5 Years | 107 (6.2%) | 19 (1.2%) |
| 5 to 9 Years | 81 (4.7%) | 116 (7.2%) |
| 10 to 14 Years | 142 (8.3%) | 108 (6.8%) |
| 15 to 19 Years | 147 (8.6%) | 118 (7.4%) |
| 20 to 24 Years | 97 (5.7%) | 87 (5.4%) |
| 25 to 29 Years | 48 (2.8%) | 165 (10.3%) |
| 30 to 34 Years | 181 (10.5%) | 128 (8.0%) |
| 35 to 39 Years | 131 (7.6%) | 228 (14.2%) |
| 40 to 44 Years | 328 (19.1%) | 85 (5.3%) |
| 45 to 49 Years | 70 (4.1%) | 48 (3.0%) |
| 50 to 54 Years | 92 (5.4%) | 113 (7.1%) |
| 55 to 59 Years | 87 (5.1%) | 68 (4.3%) |
| 60 to 64 Years | 25 (1.5%) | 125 (7.8%) |
| 65 to 69 Years | 24 (1.4%) | 33 (2.1%) |
| 70 to 74 Years | 94 (5.5%) | 62 (3.9%) |
| 75 to 79 Years | 44 (2.6%) | 0 (0.0%) |
| 80 to 84 Years | 0 (0.0%) | 30 (1.9%) |
| 85 Years and over | 19 (1.1%) | 67 (4.2%) |
| Total | 1,717 (100.0%) | 1,600 (100.0%) |
Families and Households in Halfway House
Median Family Size in Halfway House
The median family size in Halfway House is 2.97 persons per family, with single female/mother families (103 | 10.1%) accounting for the largest median family size of 3.24 persons per family. On the other hand, single male/father families (114 | 11.2%) represent the smallest median family size with 1.46 persons per family.
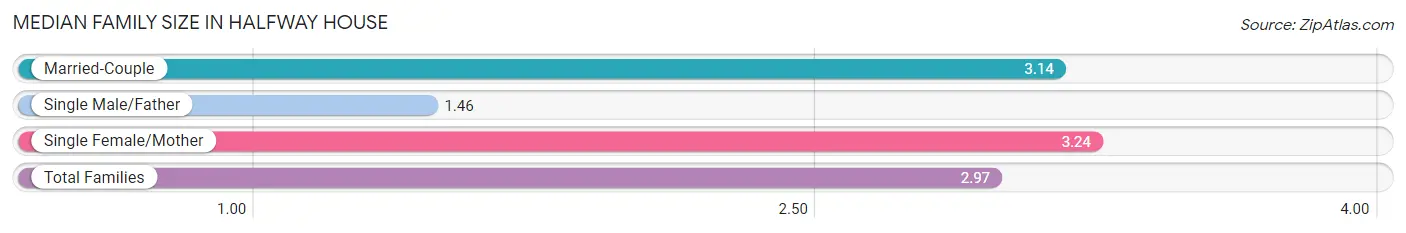
| Family Type | # Families | Family Size |
| Married-Couple | 801 (78.7%) | 3.14 |
| Single Male/Father | 114 (11.2%) | 1.46 |
| Single Female/Mother | 103 (10.1%) | 3.24 |
| Total Families | 1,018 (100.0%) | 2.97 |
Median Household Size in Halfway House
The median household size in Halfway House is 2.75 persons per household, with single female/mother households (103 | 8.6%) accounting for the largest median household size of 3.24 persons per household. non-family households (185 | 15.4%) represent the smallest median household size with 1.13 persons per household.
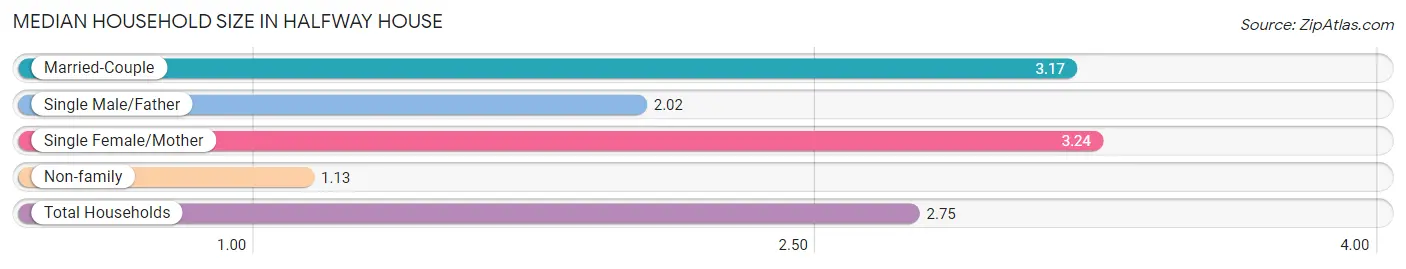
| Household Type | # Households | Household Size |
| Married-Couple | 801 (66.6%) | 3.17 |
| Single Male/Father | 114 (9.5%) | 2.02 |
| Single Female/Mother | 103 (8.6%) | 3.24 |
| Non-family | 185 (15.4%) | 1.13 |
| Total Households | 1,203 (100.0%) | 2.75 |
Household Size by Marriage Status in Halfway House
Out of a total of 1,203 households in Halfway House, 1,018 (84.6%) are family households, while 185 (15.4%) are nonfamily households. The most numerous type of family households are 2-person households, comprising 429, and the most common type of nonfamily households are 1-person households, comprising 160.
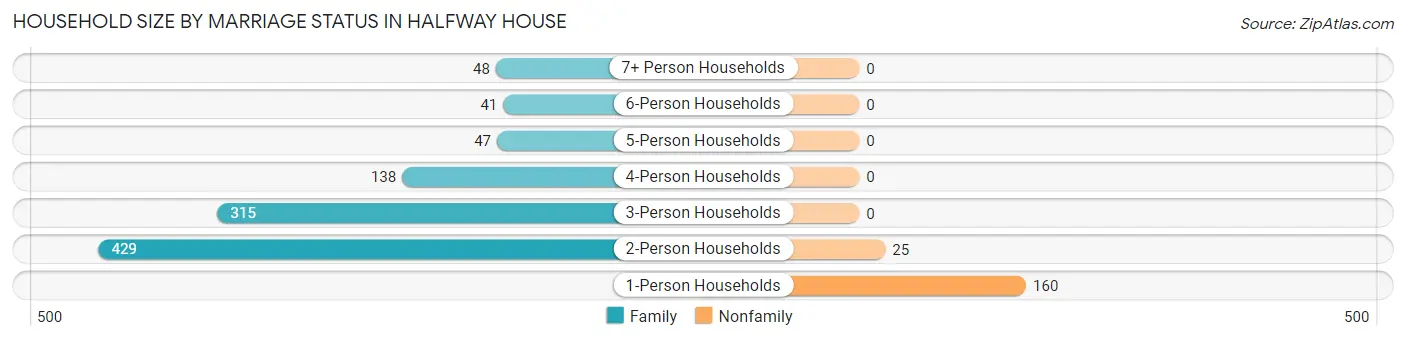
| Household Size | Family Households | Nonfamily Households |
| 1-Person Households | - | 160 (13.3%) |
| 2-Person Households | 429 (35.7%) | 25 (2.1%) |
| 3-Person Households | 315 (26.2%) | 0 (0.0%) |
| 4-Person Households | 138 (11.5%) | 0 (0.0%) |
| 5-Person Households | 47 (3.9%) | 0 (0.0%) |
| 6-Person Households | 41 (3.4%) | 0 (0.0%) |
| 7+ Person Households | 48 (4.0%) | 0 (0.0%) |
| Total | 1,018 (84.6%) | 185 (15.4%) |
Female Fertility in Halfway House
Fertility by Age in Halfway House
| Age Bracket | Women with Births | Births / 1,000 Women |
| 15 to 19 years | 0 (0.0%) | 0.0 |
| 20 to 34 years | 0 (0.0%) | 0.0 |
| 35 to 50 years | 0 (0.0%) | 0.0 |
| Total | 0 (0.0%) | 0.0 |
Fertility by Age by Marriage Status in Halfway House
| Age Bracket | Married | Unmarried |
| 15 to 19 years | 0 (0.0%) | 0 (0.0%) |
| 20 to 34 years | 0 (0.0%) | 0 (0.0%) |
| 35 to 50 years | 0 (0.0%) | 0 (0.0%) |
| Total | 0 (0.0%) | 0 (0.0%) |
Fertility by Education in Halfway House
| Educational Attainment | Women with Births | Births / 1,000 Women |
| Less than High School | 0 (0.0%) | 0.0 |
| High School Diploma | 0 (0.0%) | 0.0 |
| College or Associate's Degree | 0 (0.0%) | 0.0 |
| Bachelor's Degree | 0 (0.0%) | 0.0 |
| Graduate Degree | 0 (0.0%) | 0.0 |
| Total | 0 (0.0%) | 0.0 |
Fertility by Education by Marriage Status in Halfway House
| Educational Attainment | Married | Unmarried |
| Less than High School | 0 (0.0%) | 0 (0.0%) |
| High School Diploma | 0 (0.0%) | 0 (0.0%) |
| College or Associate's Degree | 0 (0.0%) | 0 (0.0%) |
| Bachelor's Degree | 0 (0.0%) | 0 (0.0%) |
| Graduate Degree | 0 (0.0%) | 0 (0.0%) |
| Total | 0 (0.0%) | 0 (0.0%) |
Employment Characteristics in Halfway House
Employment by Class of Employer in Halfway House
Among the 1,883 employed individuals in Halfway House, private company employees (1,329 | 70.6%), not-for-profit organizations (213 | 11.3%), and self-employed (not incorporated) (188 | 10.0%) make up the most common classes of employment.
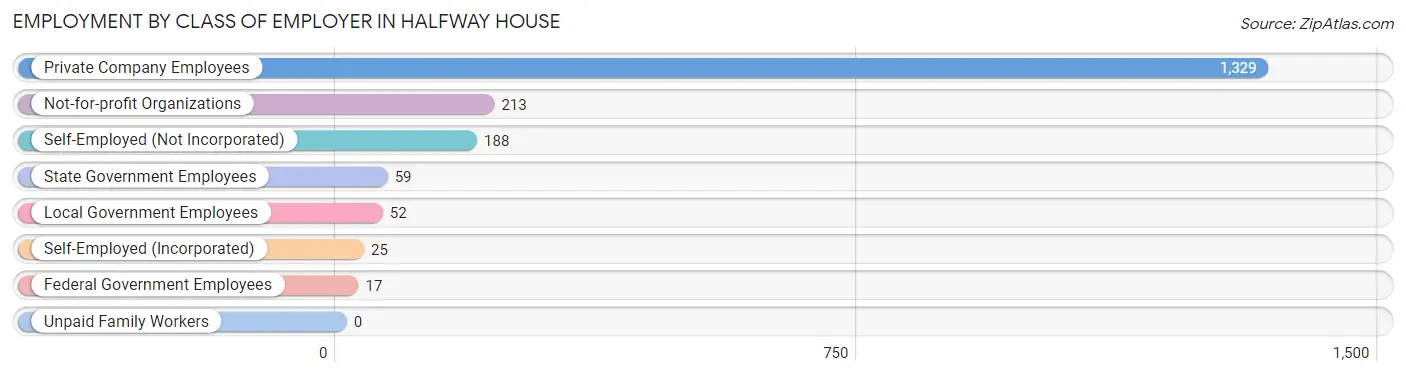
| Employer Class | # Employees | % Employees |
| Private Company Employees | 1,329 | 70.6% |
| Self-Employed (Incorporated) | 25 | 1.3% |
| Self-Employed (Not Incorporated) | 188 | 10.0% |
| Not-for-profit Organizations | 213 | 11.3% |
| Local Government Employees | 52 | 2.8% |
| State Government Employees | 59 | 3.1% |
| Federal Government Employees | 17 | 0.9% |
| Unpaid Family Workers | 0 | 0.0% |
| Total | 1,883 | 100.0% |
Employment Status by Age in Halfway House
According to the labor force statistics for Halfway House, out of the total population over 16 years of age (2,689), 80.3% or 2,159 individuals are in the labor force, with 12.8% or 276 of them unemployed. The age group with the highest labor force participation rate is 25 to 29 years, with 96.2% or 205 individuals in the labor force. Within the labor force, the 16 to 19 years age range has the highest percentage of unemployed individuals, with 66.2% or 104 of them being unemployed.
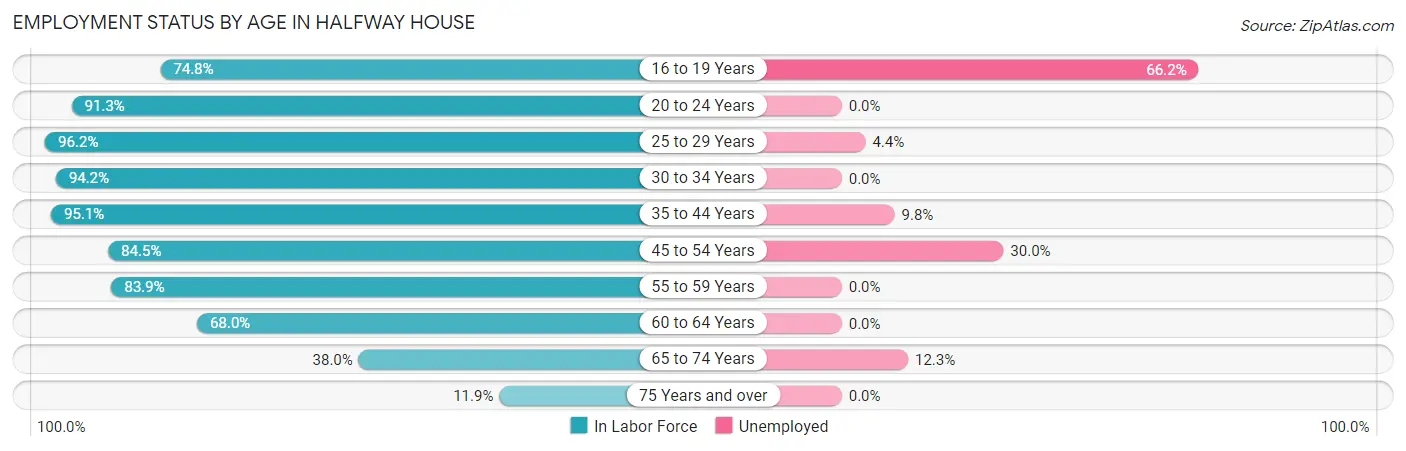
| Age Bracket | In Labor Force | Unemployed |
| 16 to 19 Years | 157 (74.8%) | 104 (66.2%) |
| 20 to 24 Years | 168 (91.3%) | 0 (0.0%) |
| 25 to 29 Years | 205 (96.2%) | 9 (4.4%) |
| 30 to 34 Years | 291 (94.2%) | 0 (0.0%) |
| 35 to 44 Years | 734 (95.1%) | 72 (9.8%) |
| 45 to 54 Years | 273 (84.5%) | 82 (30.0%) |
| 55 to 59 Years | 130 (83.9%) | 0 (0.0%) |
| 60 to 64 Years | 102 (68.0%) | 0 (0.0%) |
| 65 to 74 Years | 81 (38.0%) | 10 (12.3%) |
| 75 Years and over | 19 (11.9%) | 0 (0.0%) |
| Total | 2,159 (80.3%) | 276 (12.8%) |
Employment Status by Educational Attainment in Halfway House
According to labor force statistics for Halfway House, 90.3% of individuals (1,736) out of the total population between 25 and 64 years of age (1,922) are in the labor force, with 9.4% or 163 of them being unemployed. The group with the highest labor force participation rate are those with the educational attainment of bachelor's degree or higher, with 94.8% or 833 individuals in the labor force. Within the labor force, individuals with high school diploma education have the highest percentage of unemployment, with 27.5% or 120 of them being unemployed.
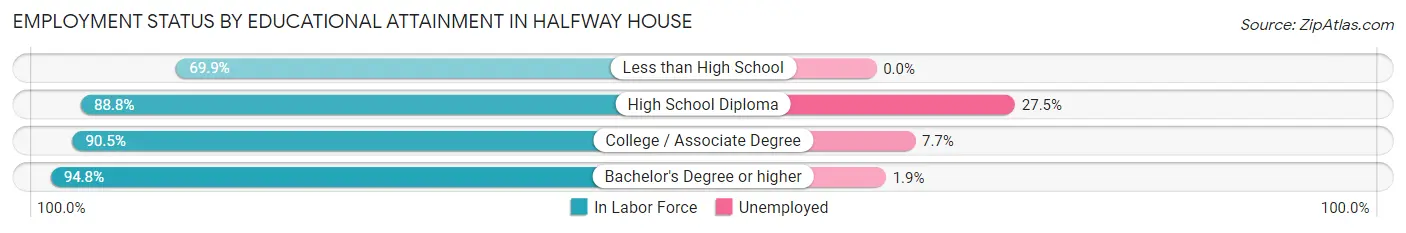
| Educational Attainment | In Labor Force | Unemployed |
| Less than High School | 114 (69.9%) | 0 (0.0%) |
| High School Diploma | 436 (88.8%) | 135 (27.5%) |
| College / Associate Degree | 352 (90.5%) | 30 (7.7%) |
| Bachelor's Degree or higher | 833 (94.8%) | 17 (1.9%) |
| Total | 1,736 (90.3%) | 181 (9.4%) |
Employment Occupations by Sex in Halfway House
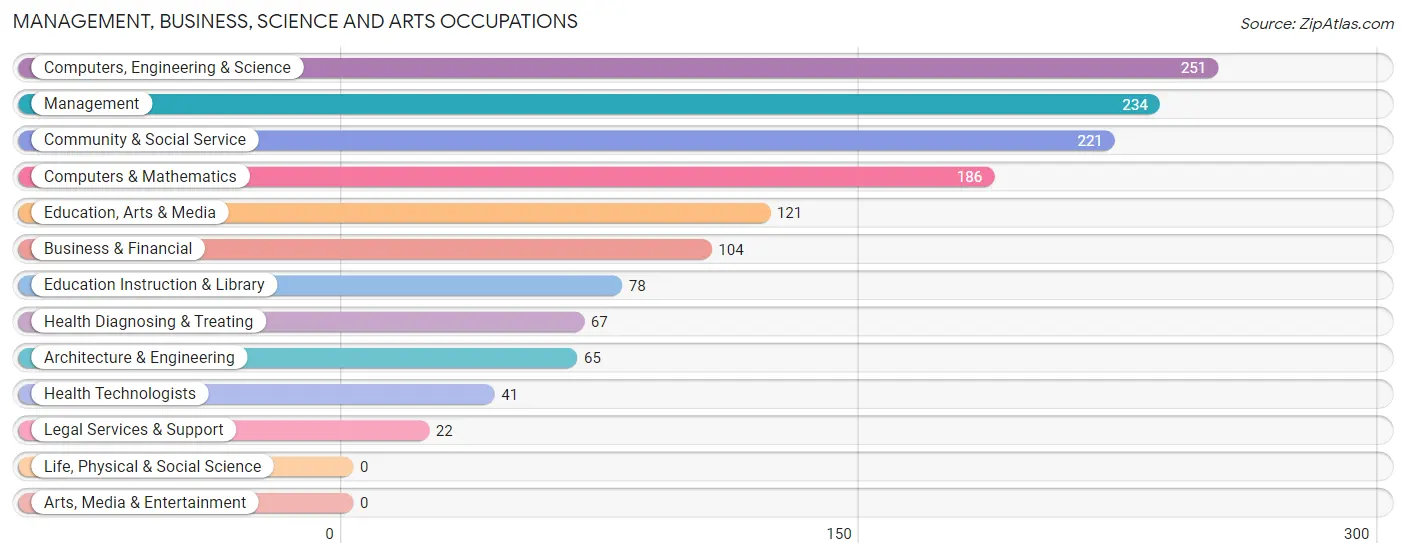
Management, Business, Science and Arts Occupations
The most common Management, Business, Science and Arts occupations in Halfway House are Computers, Engineering & Science (251 | 13.3%), Management (234 | 12.4%), Community & Social Service (221 | 11.7%), Computers & Mathematics (186 | 9.9%), and Education, Arts & Media (121 | 6.4%).
Management, Business, Science and Arts Occupations by Sex
Within the Management, Business, Science and Arts occupations in Halfway House, the most male-oriented occupations are Computers & Mathematics (95.2%), Computers, Engineering & Science (91.6%), and Architecture & Engineering (81.5%), while the most female-oriented occupations are Legal Services & Support (100.0%), Health Diagnosing & Treating (100.0%), and Health Technologists (100.0%).
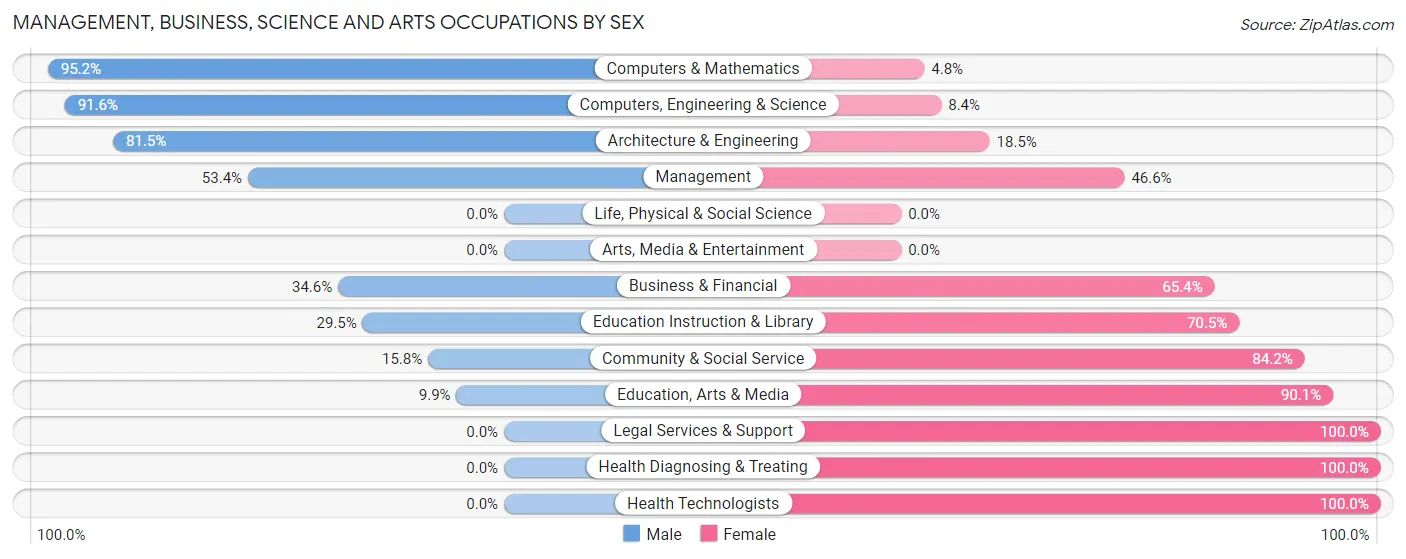
| Occupation | Male | Female |
| Management | 125 (53.4%) | 109 (46.6%) |
| Business & Financial | 36 (34.6%) | 68 (65.4%) |
| Computers, Engineering & Science | 230 (91.6%) | 21 (8.4%) |
| Computers & Mathematics | 177 (95.2%) | 9 (4.8%) |
| Architecture & Engineering | 53 (81.5%) | 12 (18.5%) |
| Life, Physical & Social Science | 0 (0.0%) | 0 (0.0%) |
| Community & Social Service | 35 (15.8%) | 186 (84.2%) |
| Education, Arts & Media | 12 (9.9%) | 109 (90.1%) |
| Legal Services & Support | 0 (0.0%) | 22 (100.0%) |
| Education Instruction & Library | 23 (29.5%) | 55 (70.5%) |
| Arts, Media & Entertainment | 0 (0.0%) | 0 (0.0%) |
| Health Diagnosing & Treating | 0 (0.0%) | 67 (100.0%) |
| Health Technologists | 0 (0.0%) | 41 (100.0%) |
| Total (Category) | 426 (48.6%) | 451 (51.4%) |
| Total (Overall) | 955 (50.7%) | 928 (49.3%) |
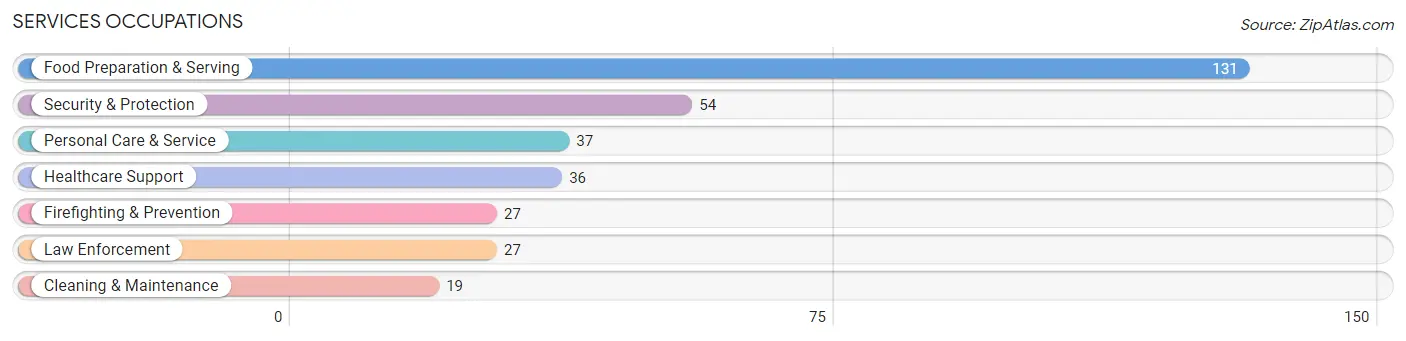
Services Occupations
The most common Services occupations in Halfway House are Food Preparation & Serving (131 | 7.0%), Security & Protection (54 | 2.9%), Personal Care & Service (37 | 2.0%), Healthcare Support (36 | 1.9%), and Firefighting & Prevention (27 | 1.4%).
Services Occupations by Sex
Within the Services occupations in Halfway House, the most male-oriented occupations are Law Enforcement (100.0%), Cleaning & Maintenance (100.0%), and Healthcare Support (50.0%), while the most female-oriented occupations are Firefighting & Prevention (100.0%), Food Preparation & Serving (83.2%), and Personal Care & Service (51.3%).
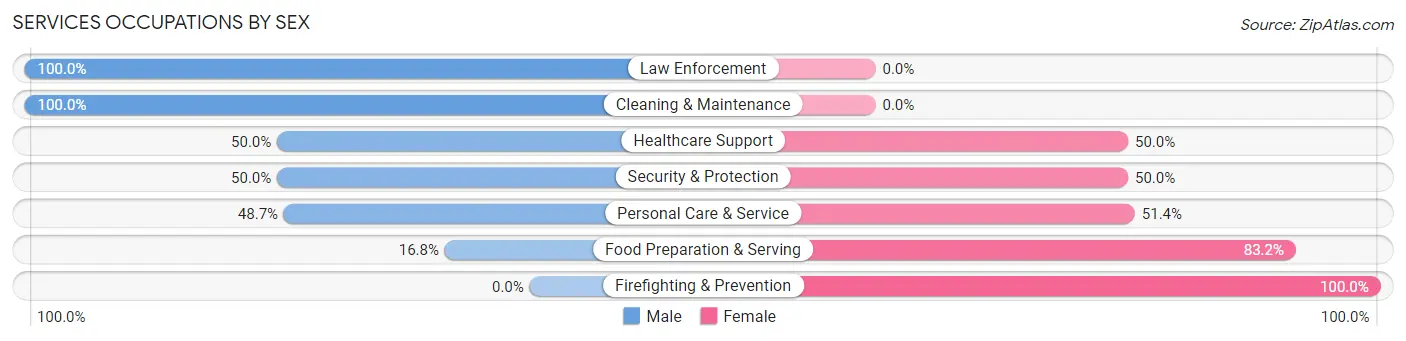
| Occupation | Male | Female |
| Healthcare Support | 18 (50.0%) | 18 (50.0%) |
| Security & Protection | 27 (50.0%) | 27 (50.0%) |
| Firefighting & Prevention | 0 (0.0%) | 27 (100.0%) |
| Law Enforcement | 27 (100.0%) | 0 (0.0%) |
| Food Preparation & Serving | 22 (16.8%) | 109 (83.2%) |
| Cleaning & Maintenance | 19 (100.0%) | 0 (0.0%) |
| Personal Care & Service | 18 (48.6%) | 19 (51.3%) |
| Total (Category) | 104 (37.6%) | 173 (62.5%) |
| Total (Overall) | 955 (50.7%) | 928 (49.3%) |
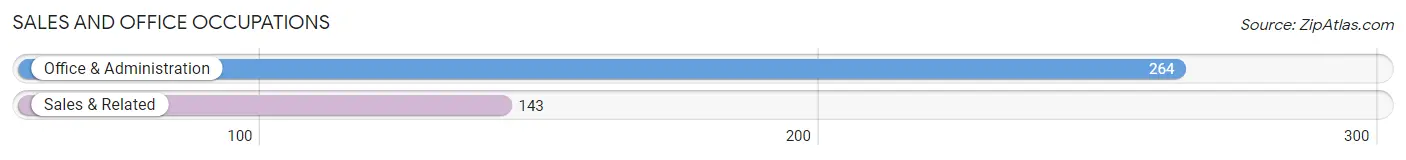
Sales and Office Occupations
The most common Sales and Office occupations in Halfway House are Office & Administration (264 | 14.0%), and Sales & Related (143 | 7.6%).
Sales and Office Occupations by Sex
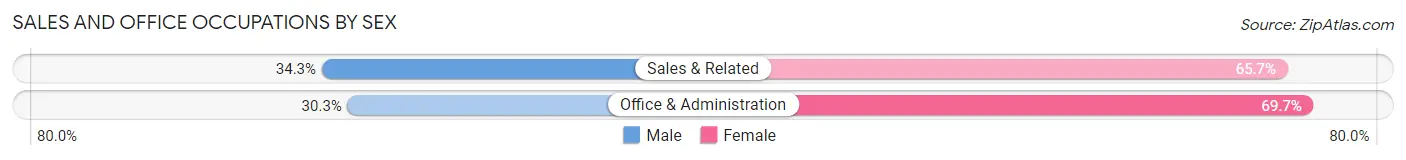
| Occupation | Male | Female |
| Sales & Related | 49 (34.3%) | 94 (65.7%) |
| Office & Administration | 80 (30.3%) | 184 (69.7%) |
| Total (Category) | 129 (31.7%) | 278 (68.3%) |
| Total (Overall) | 955 (50.7%) | 928 (49.3%) |
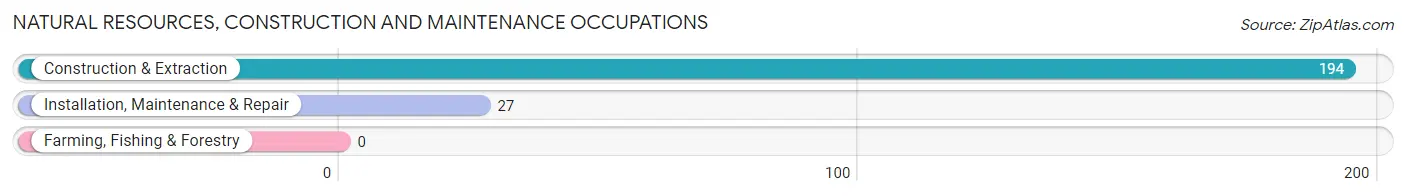
Natural Resources, Construction and Maintenance Occupations
The most common Natural Resources, Construction and Maintenance occupations in Halfway House are Construction & Extraction (194 | 10.3%), and Installation, Maintenance & Repair (27 | 1.4%).
Natural Resources, Construction and Maintenance Occupations by Sex
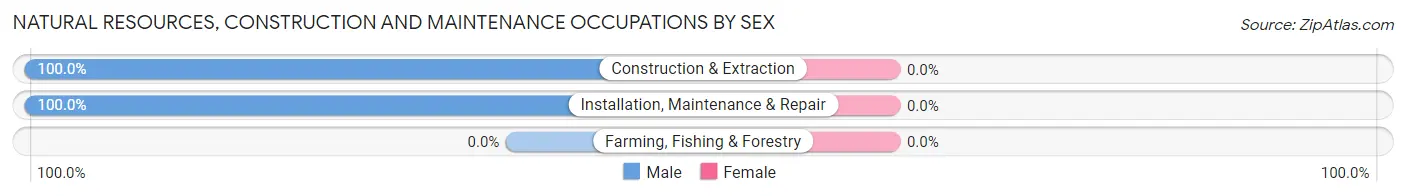
| Occupation | Male | Female |
| Farming, Fishing & Forestry | 0 (0.0%) | 0 (0.0%) |
| Construction & Extraction | 194 (100.0%) | 0 (0.0%) |
| Installation, Maintenance & Repair | 27 (100.0%) | 0 (0.0%) |
| Total (Category) | 221 (100.0%) | 0 (0.0%) |
| Total (Overall) | 955 (50.7%) | 928 (49.3%) |
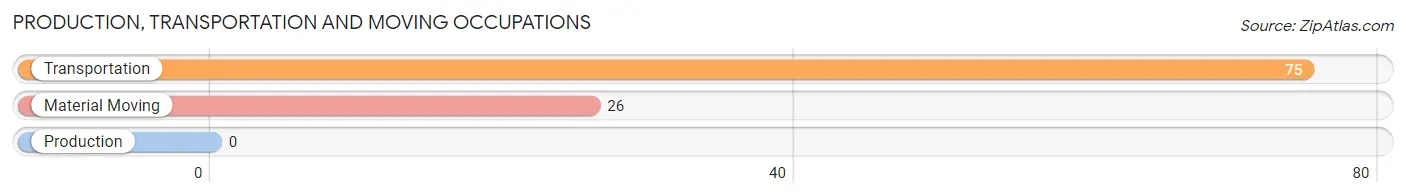
Production, Transportation and Moving Occupations
The most common Production, Transportation and Moving occupations in Halfway House are Transportation (75 | 4.0%), and Material Moving (26 | 1.4%).
Production, Transportation and Moving Occupations by Sex
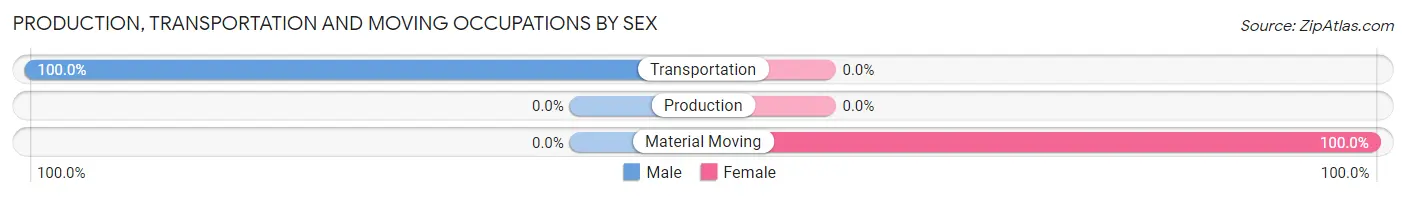
| Occupation | Male | Female |
| Production | 0 (0.0%) | 0 (0.0%) |
| Transportation | 75 (100.0%) | 0 (0.0%) |
| Material Moving | 0 (0.0%) | 26 (100.0%) |
| Total (Category) | 75 (74.3%) | 26 (25.7%) |
| Total (Overall) | 955 (50.7%) | 928 (49.3%) |
Employment Industries by Sex in Halfway House
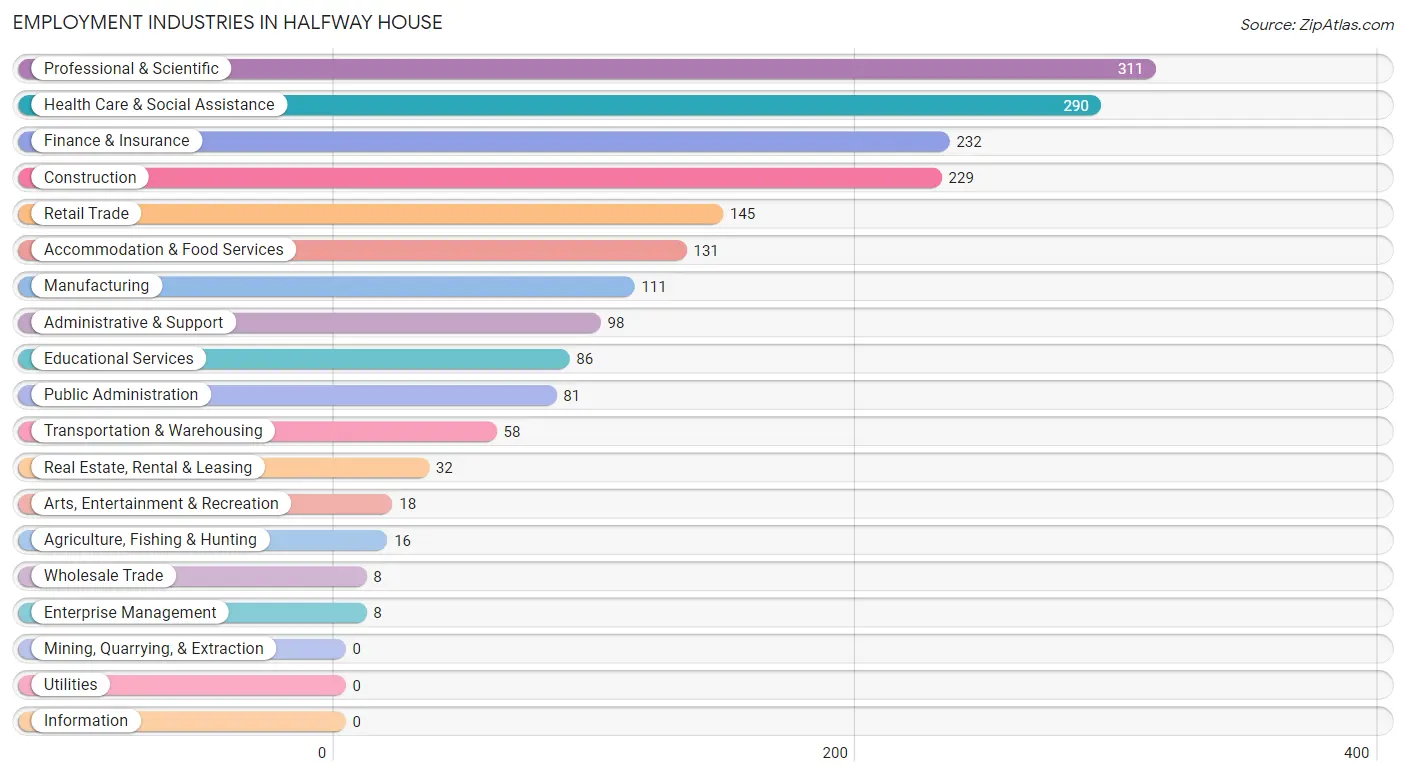
Employment Industries in Halfway House
The major employment industries in Halfway House include Professional & Scientific (311 | 16.5%), Health Care & Social Assistance (290 | 15.4%), Finance & Insurance (232 | 12.3%), Construction (229 | 12.2%), and Retail Trade (145 | 7.7%).
Employment Industries by Sex in Halfway House
The Halfway House industries that see more men than women are Agriculture, Fishing & Hunting (100.0%), Wholesale Trade (100.0%), and Transportation & Warehousing (100.0%), whereas the industries that tend to have a higher number of women are Enterprise Management (100.0%), Health Care & Social Assistance (88.3%), and Accommodation & Food Services (83.2%).
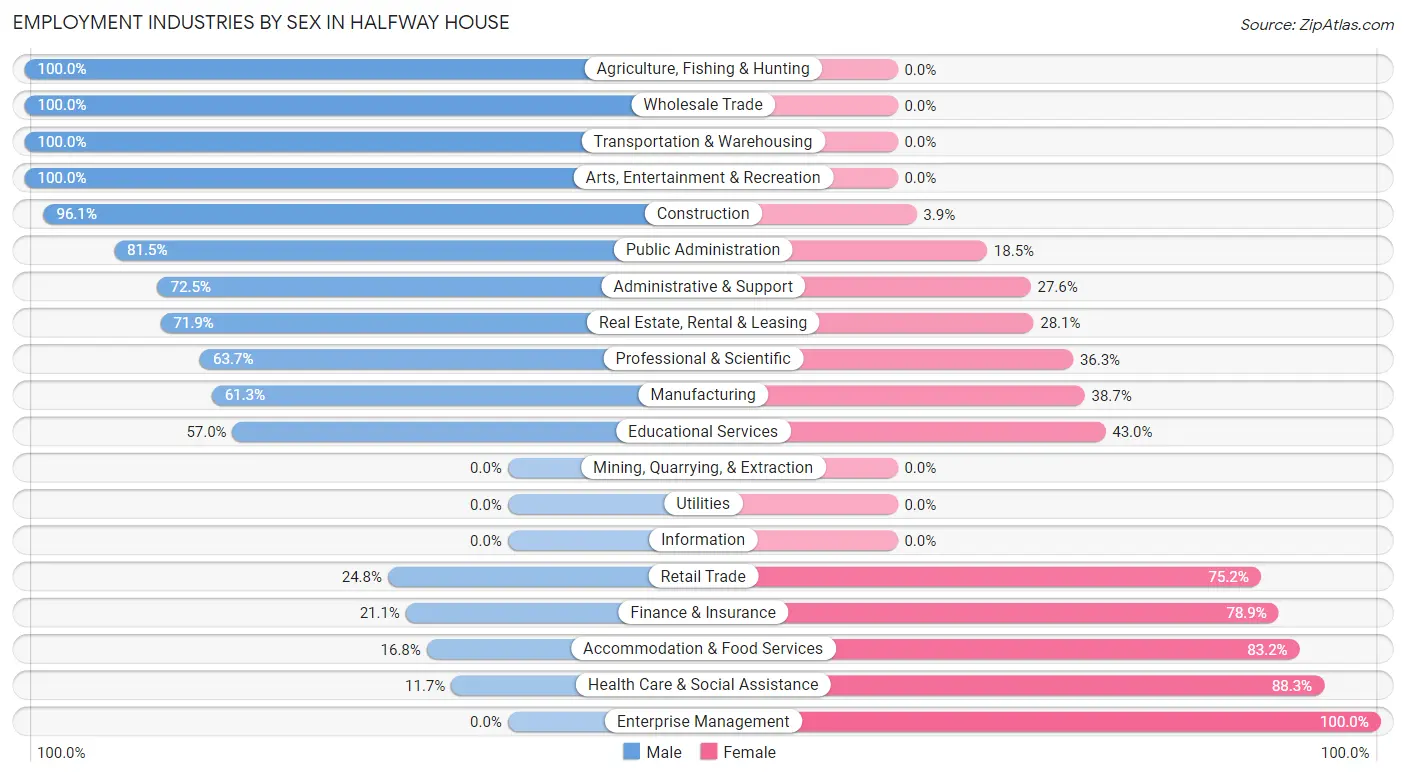
| Industry | Male | Female |
| Agriculture, Fishing & Hunting | 16 (100.0%) | 0 (0.0%) |
| Mining, Quarrying, & Extraction | 0 (0.0%) | 0 (0.0%) |
| Construction | 220 (96.1%) | 9 (3.9%) |
| Manufacturing | 68 (61.3%) | 43 (38.7%) |
| Wholesale Trade | 8 (100.0%) | 0 (0.0%) |
| Retail Trade | 36 (24.8%) | 109 (75.2%) |
| Transportation & Warehousing | 58 (100.0%) | 0 (0.0%) |
| Utilities | 0 (0.0%) | 0 (0.0%) |
| Information | 0 (0.0%) | 0 (0.0%) |
| Finance & Insurance | 49 (21.1%) | 183 (78.9%) |
| Real Estate, Rental & Leasing | 23 (71.9%) | 9 (28.1%) |
| Professional & Scientific | 198 (63.7%) | 113 (36.3%) |
| Enterprise Management | 0 (0.0%) | 8 (100.0%) |
| Administrative & Support | 71 (72.5%) | 27 (27.6%) |
| Educational Services | 49 (57.0%) | 37 (43.0%) |
| Health Care & Social Assistance | 34 (11.7%) | 256 (88.3%) |
| Arts, Entertainment & Recreation | 18 (100.0%) | 0 (0.0%) |
| Accommodation & Food Services | 22 (16.8%) | 109 (83.2%) |
| Public Administration | 66 (81.5%) | 15 (18.5%) |
| Total | 955 (50.7%) | 928 (49.3%) |
Education in Halfway House
School Enrollment in Halfway House
The most common levels of schooling among the 829 students in Halfway House are middle school (237 | 28.6%), college / undergraduate (190 | 22.9%), and high school (156 | 18.8%).
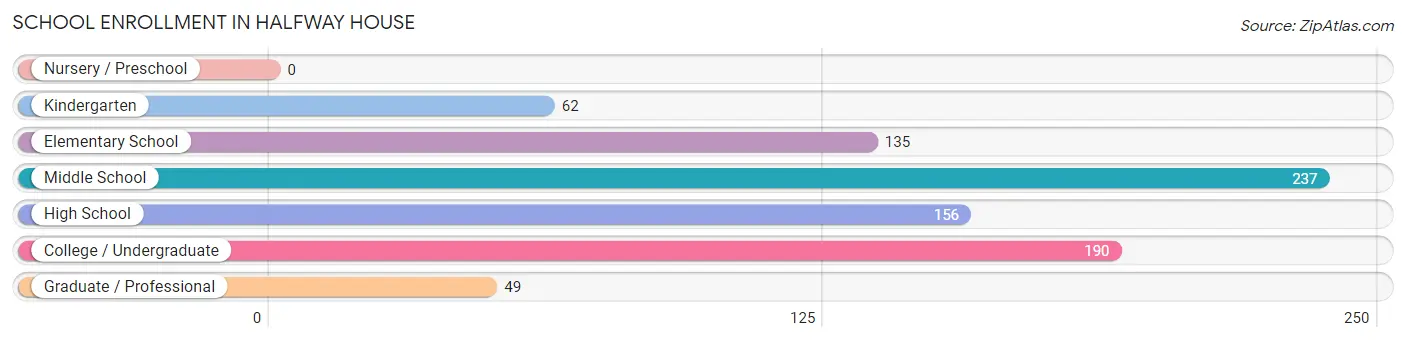
| School Level | # Students | % Students |
| Nursery / Preschool | 0 | 0.0% |
| Kindergarten | 62 | 7.5% |
| Elementary School | 135 | 16.3% |
| Middle School | 237 | 28.6% |
| High School | 156 | 18.8% |
| College / Undergraduate | 190 | 22.9% |
| Graduate / Professional | 49 | 5.9% |
| Total | 829 | 100.0% |
School Enrollment by Age by Funding Source in Halfway House
Out of a total of 829 students who are enrolled in schools in Halfway House, 40 (4.8%) attend a private institution, while the remaining 789 (95.2%) are enrolled in public schools. The age group of 25 to 34 year olds has the highest likelihood of being enrolled in private schools, with 24 (54.5% in the age bracket) enrolled. Conversely, the age group of 5 to 9 year old has the lowest likelihood of being enrolled in a private school, with 197 (100.0% in the age bracket) attending a public institution.
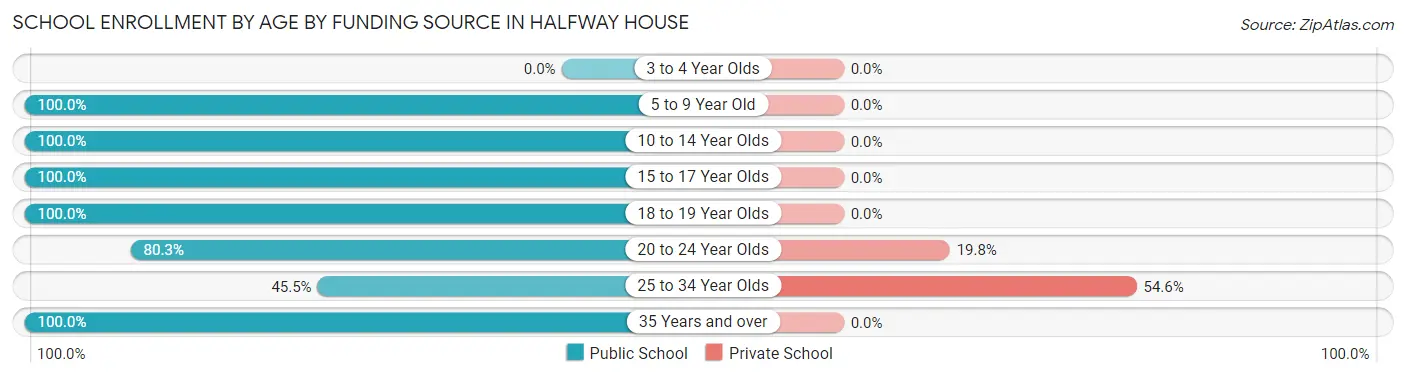
| Age Bracket | Public School | Private School |
| 3 to 4 Year Olds | 0 (0.0%) | 0 (0.0%) |
| 5 to 9 Year Old | 197 (100.0%) | 0 (0.0%) |
| 10 to 14 Year Olds | 250 (100.0%) | 0 (0.0%) |
| 15 to 17 Year Olds | 137 (100.0%) | 0 (0.0%) |
| 18 to 19 Year Olds | 96 (100.0%) | 0 (0.0%) |
| 20 to 24 Year Olds | 65 (80.2%) | 16 (19.8%) |
| 25 to 34 Year Olds | 20 (45.5%) | 24 (54.5%) |
| 35 Years and over | 24 (100.0%) | 0 (0.0%) |
| Total | 789 (95.2%) | 40 (4.8%) |
Educational Attainment by Field of Study in Halfway House
Computers & mathematics (211 | 21.5%), business (130 | 13.3%), communications (122 | 12.5%), arts & humanities (120 | 12.3%), and visual & performing arts (87 | 8.9%) are the most common fields of study among 979 individuals in Halfway House who have obtained a bachelor's degree or higher.
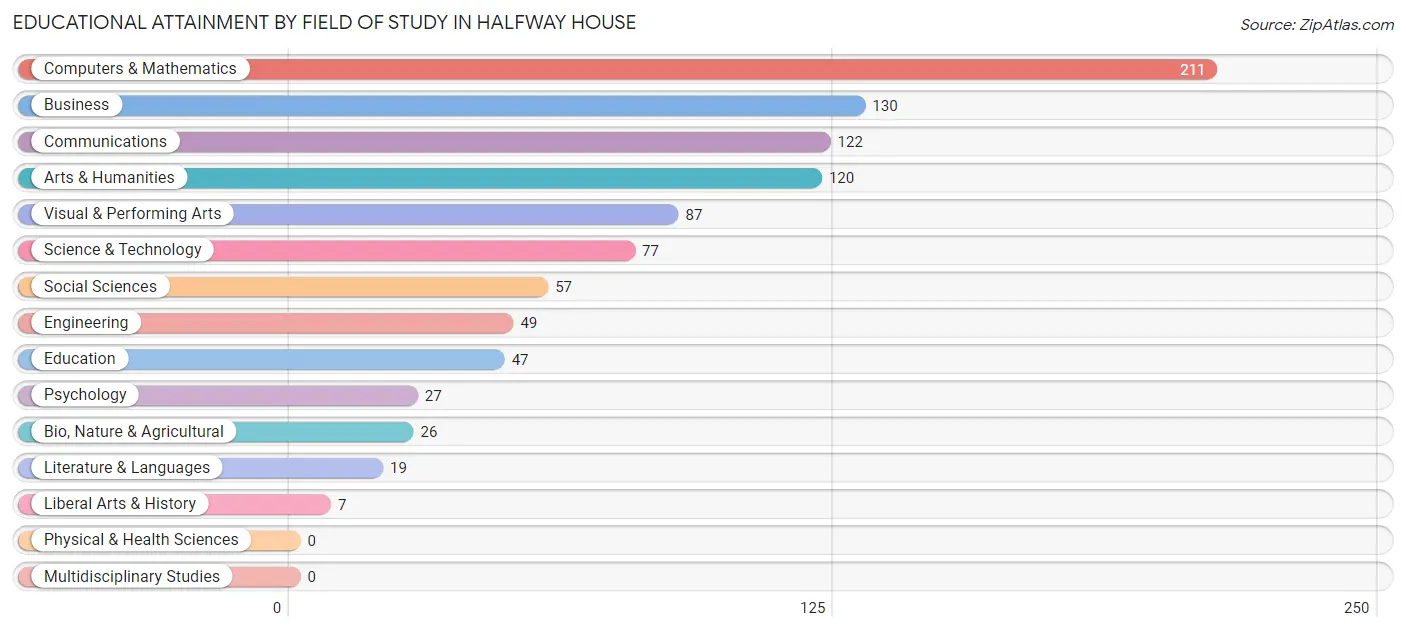
| Field of Study | # Graduates | % Graduates |
| Computers & Mathematics | 211 | 21.5% |
| Bio, Nature & Agricultural | 26 | 2.7% |
| Physical & Health Sciences | 0 | 0.0% |
| Psychology | 27 | 2.8% |
| Social Sciences | 57 | 5.8% |
| Engineering | 49 | 5.0% |
| Multidisciplinary Studies | 0 | 0.0% |
| Science & Technology | 77 | 7.9% |
| Business | 130 | 13.3% |
| Education | 47 | 4.8% |
| Literature & Languages | 19 | 1.9% |
| Liberal Arts & History | 7 | 0.7% |
| Visual & Performing Arts | 87 | 8.9% |
| Communications | 122 | 12.5% |
| Arts & Humanities | 120 | 12.3% |
| Total | 979 | 100.0% |
Transportation & Commute in Halfway House
Vehicle Availability by Sex in Halfway House
The most prevalent vehicle ownership categories in Halfway House are males with 2 vehicles (642, accounting for 67.2%) and females with 2 vehicles (533, making up 69.2%).
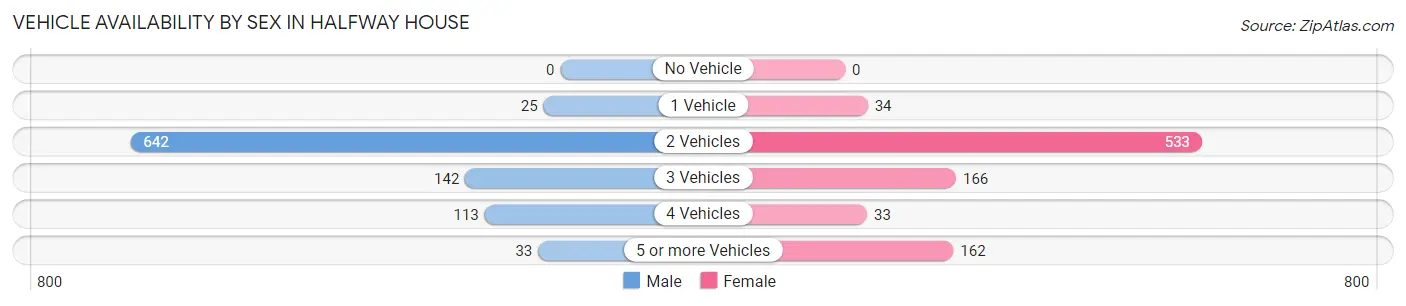
| Vehicles Available | Male | Female |
| No Vehicle | 0 (0.0%) | 0 (0.0%) |
| 1 Vehicle | 25 (2.6%) | 34 (3.7%) |
| 2 Vehicles | 642 (67.2%) | 533 (57.4%) |
| 3 Vehicles | 142 (14.9%) | 166 (17.9%) |
| 4 Vehicles | 113 (11.8%) | 33 (3.6%) |
| 5 or more Vehicles | 33 (3.5%) | 162 (17.5%) |
| Total | 955 (100.0%) | 928 (100.0%) |
Commute Time in Halfway House
The most frequently occuring commute durations in Halfway House are 45 to 59 minutes (286 commuters, 21.1%), 35 to 39 minutes (226 commuters, 16.7%), and 60 to 89 minutes (220 commuters, 16.2%).
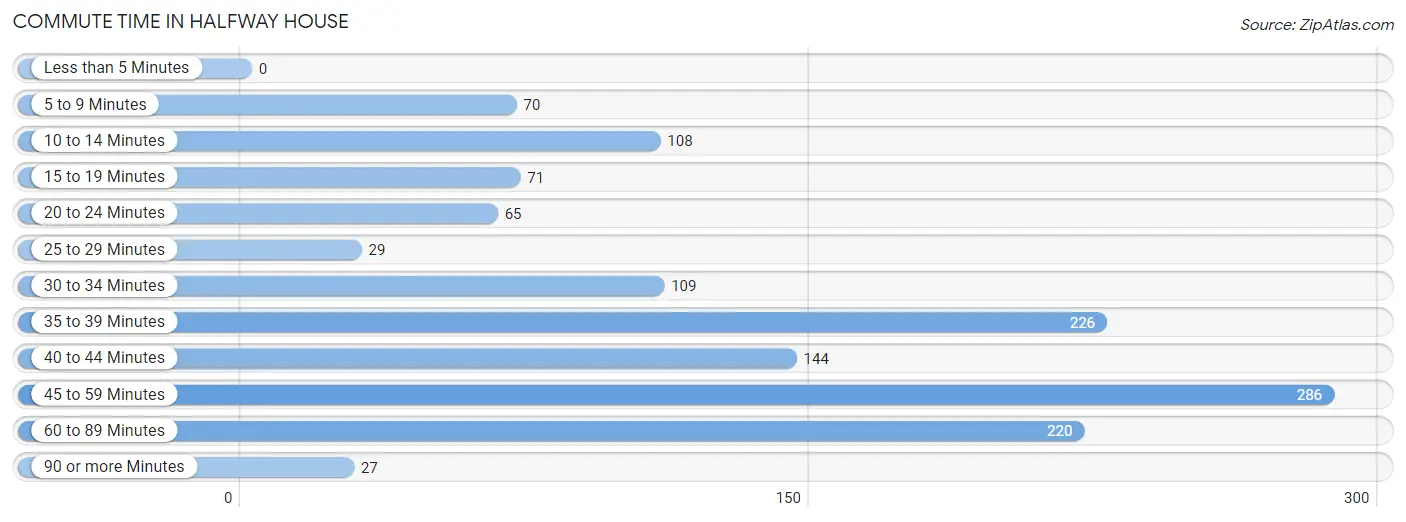
| Commute Time | # Commuters | % Commuters |
| Less than 5 Minutes | 0 | 0.0% |
| 5 to 9 Minutes | 70 | 5.2% |
| 10 to 14 Minutes | 108 | 8.0% |
| 15 to 19 Minutes | 71 | 5.2% |
| 20 to 24 Minutes | 65 | 4.8% |
| 25 to 29 Minutes | 29 | 2.1% |
| 30 to 34 Minutes | 109 | 8.0% |
| 35 to 39 Minutes | 226 | 16.7% |
| 40 to 44 Minutes | 144 | 10.6% |
| 45 to 59 Minutes | 286 | 21.1% |
| 60 to 89 Minutes | 220 | 16.2% |
| 90 or more Minutes | 27 | 2.0% |
Commute Time by Sex in Halfway House
The most common commute times in Halfway House are 40 to 44 minutes (120 commuters, 20.1%) for males and 45 to 59 minutes (191 commuters, 25.2%) for females.
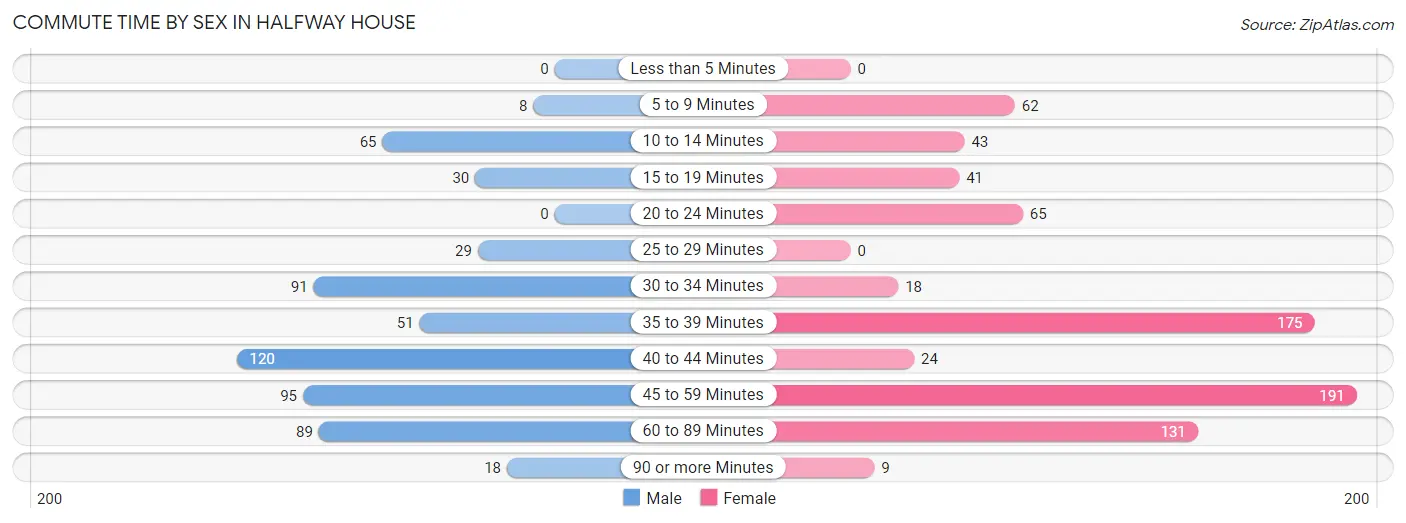
| Commute Time | Male | Female |
| Less than 5 Minutes | 0 (0.0%) | 0 (0.0%) |
| 5 to 9 Minutes | 8 (1.3%) | 62 (8.2%) |
| 10 to 14 Minutes | 65 (10.9%) | 43 (5.7%) |
| 15 to 19 Minutes | 30 (5.0%) | 41 (5.4%) |
| 20 to 24 Minutes | 0 (0.0%) | 65 (8.6%) |
| 25 to 29 Minutes | 29 (4.9%) | 0 (0.0%) |
| 30 to 34 Minutes | 91 (15.3%) | 18 (2.4%) |
| 35 to 39 Minutes | 51 (8.6%) | 175 (23.1%) |
| 40 to 44 Minutes | 120 (20.1%) | 24 (3.2%) |
| 45 to 59 Minutes | 95 (15.9%) | 191 (25.2%) |
| 60 to 89 Minutes | 89 (14.9%) | 131 (17.3%) |
| 90 or more Minutes | 18 (3.0%) | 9 (1.2%) |
Time of Departure to Work by Sex in Halfway House
The most frequent times of departure to work in Halfway House are 7:00 AM to 7:29 AM (105, 17.6%) for males and 7:00 AM to 7:29 AM (250, 32.9%) for females.
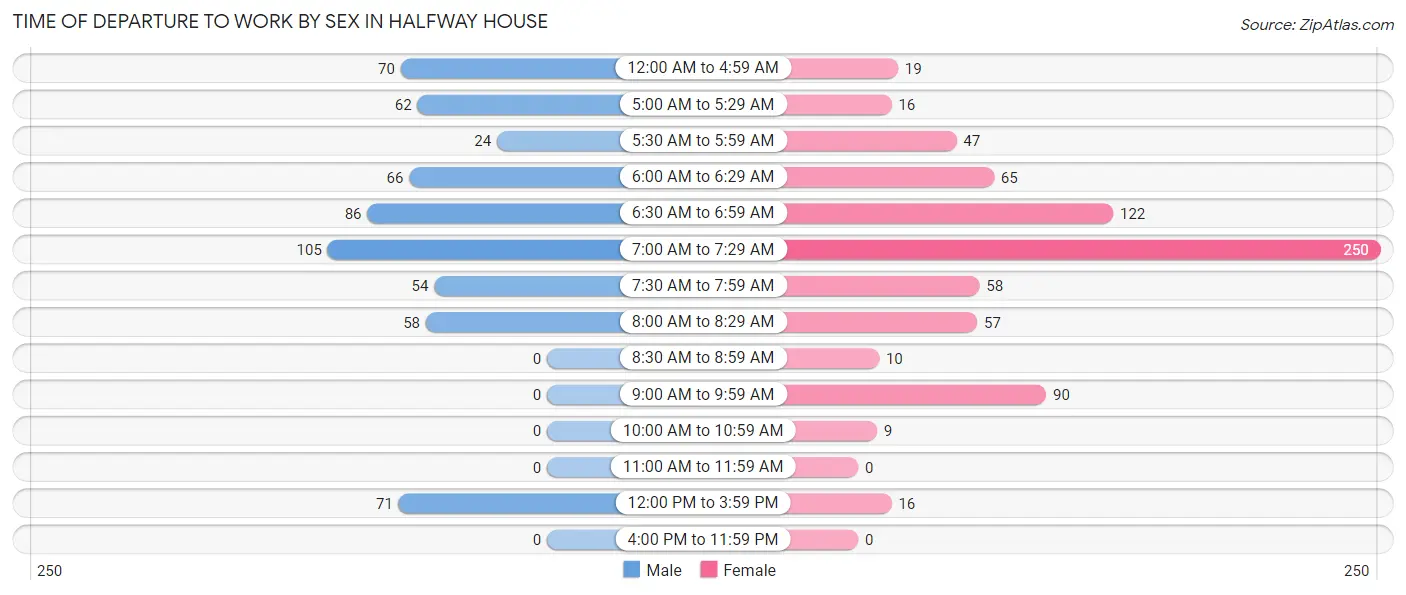
| Time of Departure | Male | Female |
| 12:00 AM to 4:59 AM | 70 (11.7%) | 19 (2.5%) |
| 5:00 AM to 5:29 AM | 62 (10.4%) | 16 (2.1%) |
| 5:30 AM to 5:59 AM | 24 (4.0%) | 47 (6.2%) |
| 6:00 AM to 6:29 AM | 66 (11.1%) | 65 (8.6%) |
| 6:30 AM to 6:59 AM | 86 (14.4%) | 122 (16.1%) |
| 7:00 AM to 7:29 AM | 105 (17.6%) | 250 (32.9%) |
| 7:30 AM to 7:59 AM | 54 (9.1%) | 58 (7.6%) |
| 8:00 AM to 8:29 AM | 58 (9.7%) | 57 (7.5%) |
| 8:30 AM to 8:59 AM | 0 (0.0%) | 10 (1.3%) |
| 9:00 AM to 9:59 AM | 0 (0.0%) | 90 (11.9%) |
| 10:00 AM to 10:59 AM | 0 (0.0%) | 9 (1.2%) |
| 11:00 AM to 11:59 AM | 0 (0.0%) | 0 (0.0%) |
| 12:00 PM to 3:59 PM | 71 (11.9%) | 16 (2.1%) |
| 4:00 PM to 11:59 PM | 0 (0.0%) | 0 (0.0%) |
| Total | 596 (100.0%) | 759 (100.0%) |
Housing Occupancy in Halfway House
Occupancy by Ownership in Halfway House
Of the total 1,203 dwellings in Halfway House, owner-occupied units account for 998 (83.0%), while renter-occupied units make up 205 (17.0%).
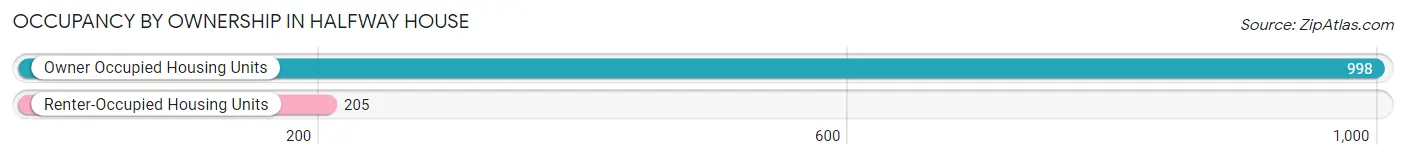
| Occupancy | # Housing Units | % Housing Units |
| Owner Occupied Housing Units | 998 | 83.0% |
| Renter-Occupied Housing Units | 205 | 17.0% |
| Total Occupied Housing Units | 1,203 | 100.0% |
Occupancy by Household Size in Halfway House
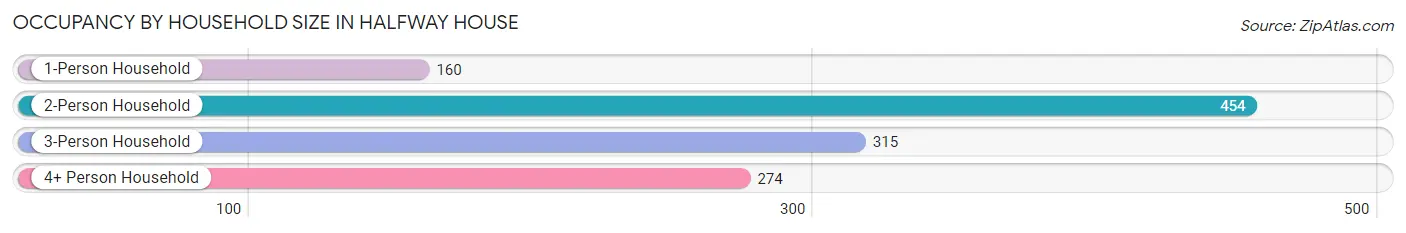
| Household Size | # Housing Units | % Housing Units |
| 1-Person Household | 160 | 13.3% |
| 2-Person Household | 454 | 37.7% |
| 3-Person Household | 315 | 26.2% |
| 4+ Person Household | 274 | 22.8% |
| Total Housing Units | 1,203 | 100.0% |
Occupancy by Ownership by Household Size in Halfway House
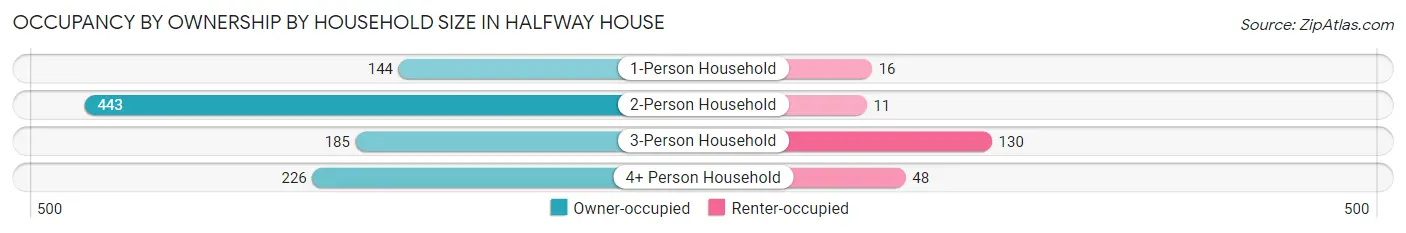
| Household Size | Owner-occupied | Renter-occupied |
| 1-Person Household | 144 (90.0%) | 16 (10.0%) |
| 2-Person Household | 443 (97.6%) | 11 (2.4%) |
| 3-Person Household | 185 (58.7%) | 130 (41.3%) |
| 4+ Person Household | 226 (82.5%) | 48 (17.5%) |
| Total Housing Units | 998 (83.0%) | 205 (17.0%) |
Occupancy by Educational Attainment in Halfway House
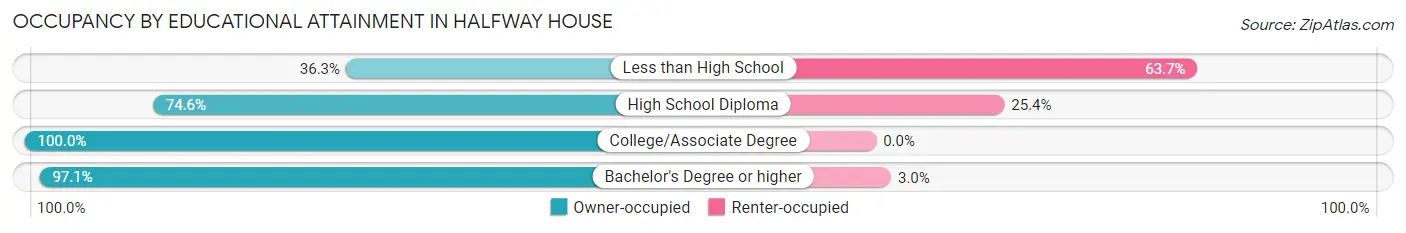
| Household Size | Owner-occupied | Renter-occupied |
| Less than High School | 65 (36.3%) | 114 (63.7%) |
| High School Diploma | 220 (74.6%) | 75 (25.4%) |
| College/Associate Degree | 187 (100.0%) | 0 (0.0%) |
| Bachelor's Degree or higher | 526 (97.1%) | 16 (2.9%) |
Occupancy by Age of Householder in Halfway House
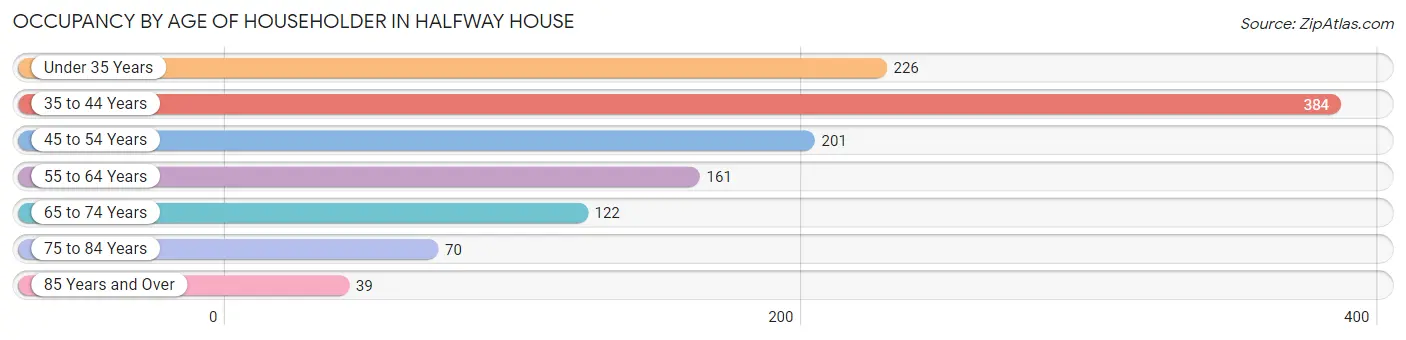
| Age Bracket | # Households | % Households |
| Under 35 Years | 226 | 18.8% |
| 35 to 44 Years | 384 | 31.9% |
| 45 to 54 Years | 201 | 16.7% |
| 55 to 64 Years | 161 | 13.4% |
| 65 to 74 Years | 122 | 10.1% |
| 75 to 84 Years | 70 | 5.8% |
| 85 Years and Over | 39 | 3.2% |
| Total | 1,203 | 100.0% |
Housing Finances in Halfway House
Median Income by Occupancy in Halfway House
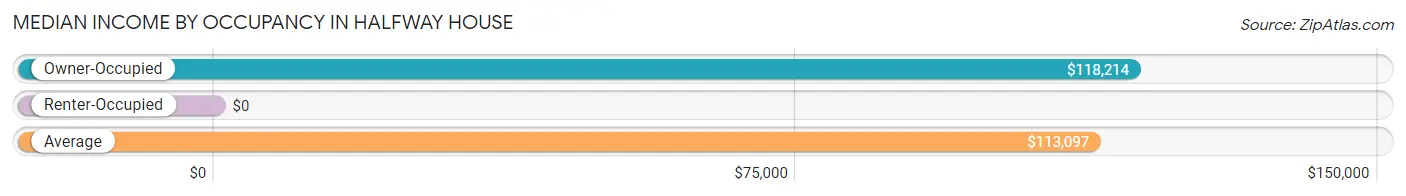
| Occupancy Type | # Households | Median Income |
| Owner-Occupied | 998 (83.0%) | $118,214 |
| Renter-Occupied | 205 (17.0%) | $0 |
| Average | 1,203 (100.0%) | $113,097 |
Occupancy by Householder Income Bracket in Halfway House
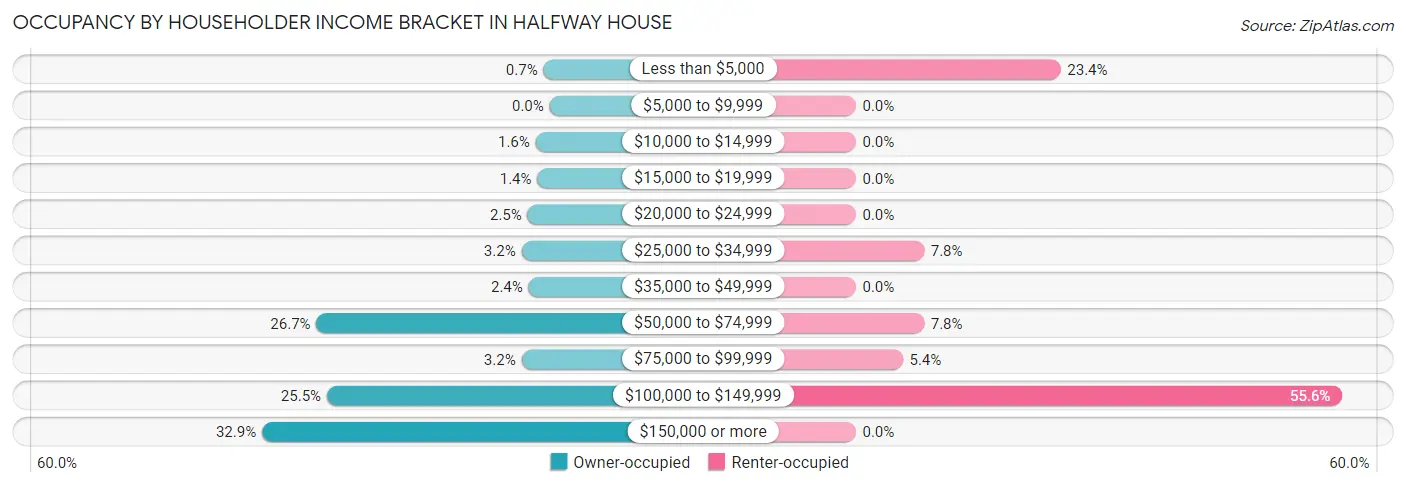
| Income Bracket | Owner-occupied | Renter-occupied |
| Less than $5,000 | 7 (0.7%) | 48 (23.4%) |
| $5,000 to $9,999 | 0 (0.0%) | 0 (0.0%) |
| $10,000 to $14,999 | 16 (1.6%) | 0 (0.0%) |
| $15,000 to $19,999 | 14 (1.4%) | 0 (0.0%) |
| $20,000 to $24,999 | 25 (2.5%) | 0 (0.0%) |
| $25,000 to $34,999 | 32 (3.2%) | 16 (7.8%) |
| $35,000 to $49,999 | 24 (2.4%) | 0 (0.0%) |
| $50,000 to $74,999 | 266 (26.7%) | 16 (7.8%) |
| $75,000 to $99,999 | 32 (3.2%) | 11 (5.4%) |
| $100,000 to $149,999 | 254 (25.5%) | 114 (55.6%) |
| $150,000 or more | 328 (32.9%) | 0 (0.0%) |
| Total | 998 (100.0%) | 205 (100.0%) |
Monthly Housing Cost Tiers in Halfway House
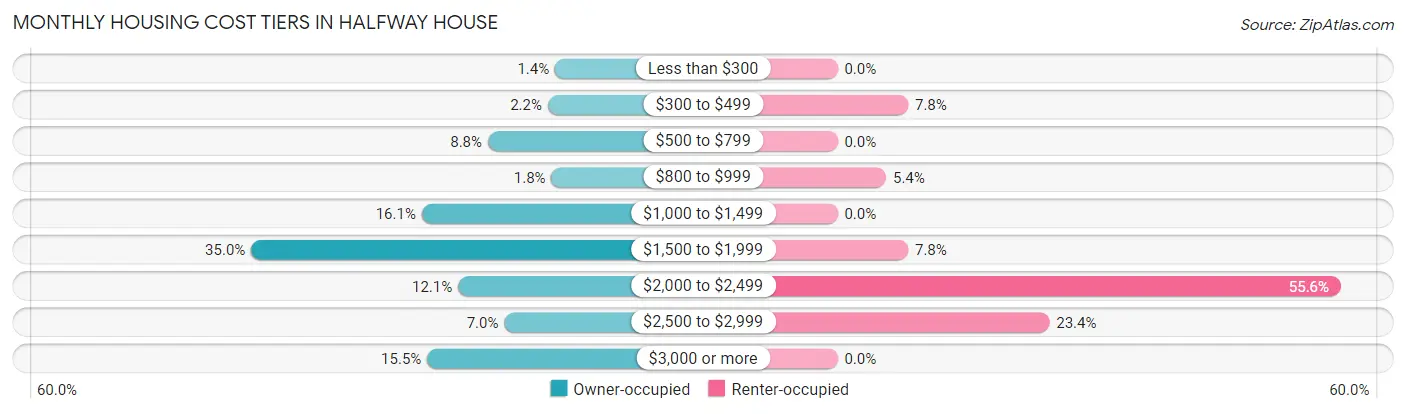
| Monthly Cost | Owner-occupied | Renter-occupied |
| Less than $300 | 14 (1.4%) | 0 (0.0%) |
| $300 to $499 | 22 (2.2%) | 16 (7.8%) |
| $500 to $799 | 88 (8.8%) | 0 (0.0%) |
| $800 to $999 | 18 (1.8%) | 11 (5.4%) |
| $1,000 to $1,499 | 161 (16.1%) | 0 (0.0%) |
| $1,500 to $1,999 | 349 (35.0%) | 16 (7.8%) |
| $2,000 to $2,499 | 121 (12.1%) | 114 (55.6%) |
| $2,500 to $2,999 | 70 (7.0%) | 48 (23.4%) |
| $3,000 or more | 155 (15.5%) | 0 (0.0%) |
| Total | 998 (100.0%) | 205 (100.0%) |
Physical Housing Characteristics in Halfway House
Housing Structures in Halfway House
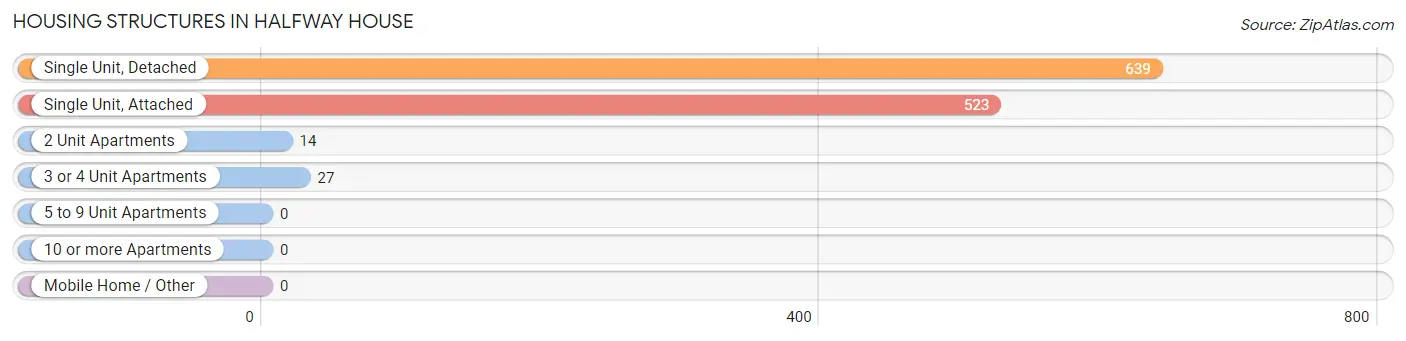
| Structure Type | # Housing Units | % Housing Units |
| Single Unit, Detached | 639 | 53.1% |
| Single Unit, Attached | 523 | 43.5% |
| 2 Unit Apartments | 14 | 1.2% |
| 3 or 4 Unit Apartments | 27 | 2.2% |
| 5 to 9 Unit Apartments | 0 | 0.0% |
| 10 or more Apartments | 0 | 0.0% |
| Mobile Home / Other | 0 | 0.0% |
| Total | 1,203 | 100.0% |
Housing Structures by Occupancy in Halfway House
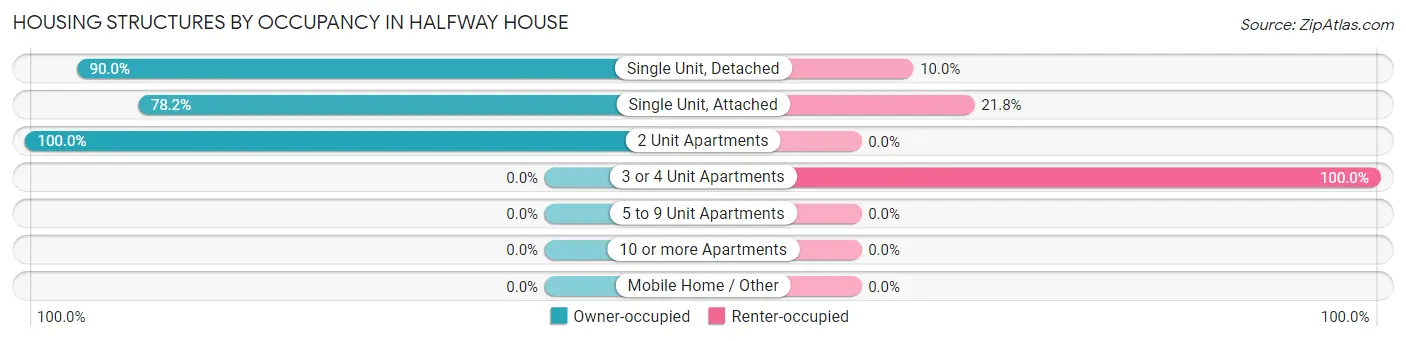
| Structure Type | Owner-occupied | Renter-occupied |
| Single Unit, Detached | 575 (90.0%) | 64 (10.0%) |
| Single Unit, Attached | 409 (78.2%) | 114 (21.8%) |
| 2 Unit Apartments | 14 (100.0%) | 0 (0.0%) |
| 3 or 4 Unit Apartments | 0 (0.0%) | 27 (100.0%) |
| 5 to 9 Unit Apartments | 0 (0.0%) | 0 (0.0%) |
| 10 or more Apartments | 0 (0.0%) | 0 (0.0%) |
| Mobile Home / Other | 0 (0.0%) | 0 (0.0%) |
| Total | 998 (83.0%) | 205 (17.0%) |
Housing Structures by Number of Rooms in Halfway House
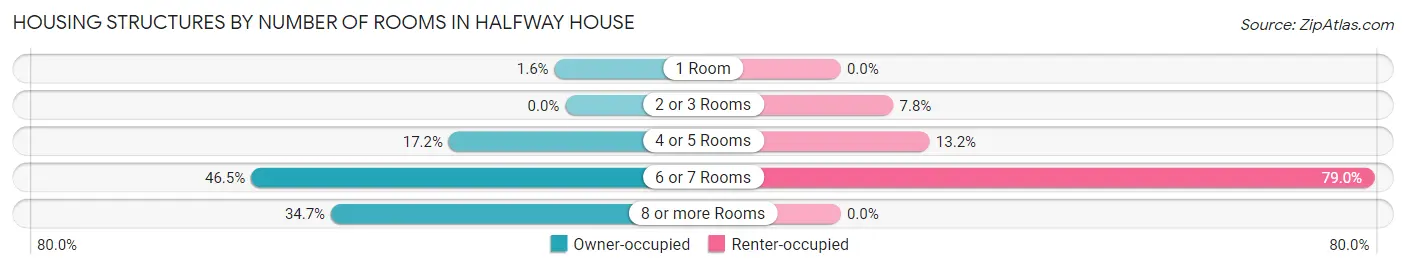
| Number of Rooms | Owner-occupied | Renter-occupied |
| 1 Room | 16 (1.6%) | 0 (0.0%) |
| 2 or 3 Rooms | 0 (0.0%) | 16 (7.8%) |
| 4 or 5 Rooms | 172 (17.2%) | 27 (13.2%) |
| 6 or 7 Rooms | 464 (46.5%) | 162 (79.0%) |
| 8 or more Rooms | 346 (34.7%) | 0 (0.0%) |
| Total | 998 (100.0%) | 205 (100.0%) |
Housing Structure by Heating Type in Halfway House
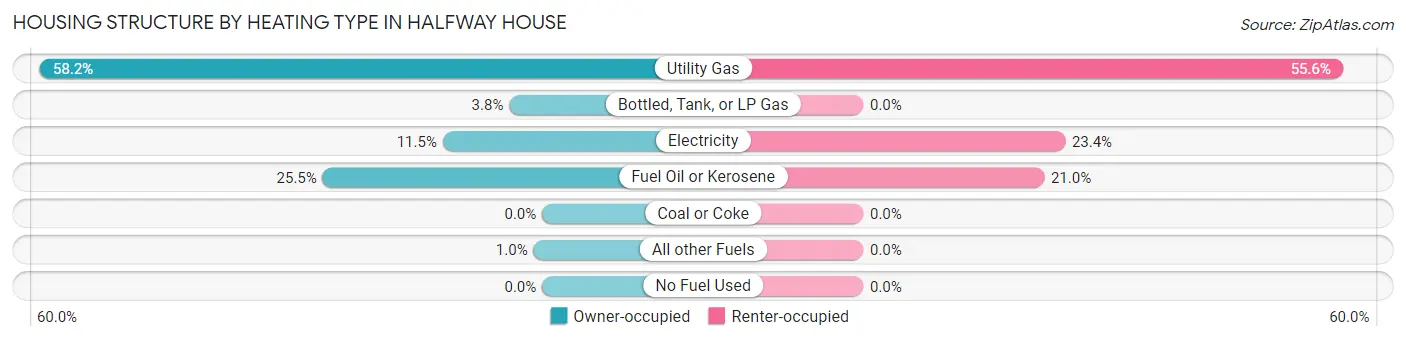
| Heating Type | Owner-occupied | Renter-occupied |
| Utility Gas | 581 (58.2%) | 114 (55.6%) |
| Bottled, Tank, or LP Gas | 38 (3.8%) | 0 (0.0%) |
| Electricity | 115 (11.5%) | 48 (23.4%) |
| Fuel Oil or Kerosene | 254 (25.5%) | 43 (21.0%) |
| Coal or Coke | 0 (0.0%) | 0 (0.0%) |
| All other Fuels | 10 (1.0%) | 0 (0.0%) |
| No Fuel Used | 0 (0.0%) | 0 (0.0%) |
| Total | 998 (100.0%) | 205 (100.0%) |
Household Vehicle Usage in Halfway House
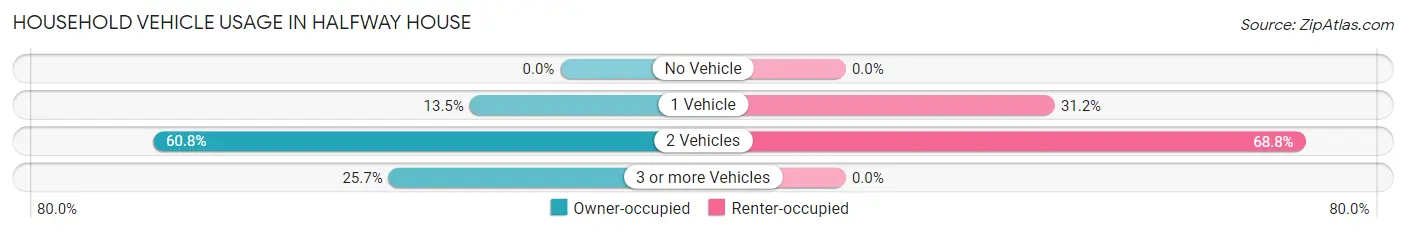
| Vehicles per Household | Owner-occupied | Renter-occupied |
| No Vehicle | 0 (0.0%) | 0 (0.0%) |
| 1 Vehicle | 135 (13.5%) | 64 (31.2%) |
| 2 Vehicles | 607 (60.8%) | 141 (68.8%) |
| 3 or more Vehicles | 256 (25.7%) | 0 (0.0%) |
| Total | 998 (100.0%) | 205 (100.0%) |
Real Estate & Mortgages in Halfway House
Real Estate and Mortgage Overview in Halfway House
| Characteristic | Without Mortgage | With Mortgage |
| Housing Units | 196 | 802 |
| Median Property Value | $237,800 | $265,100 |
| Median Household Income | - | - |
| Monthly Housing Costs | $680 | $155 |
| Real Estate Taxes | $5,000 | $8 |
Property Value by Mortgage Status in Halfway House
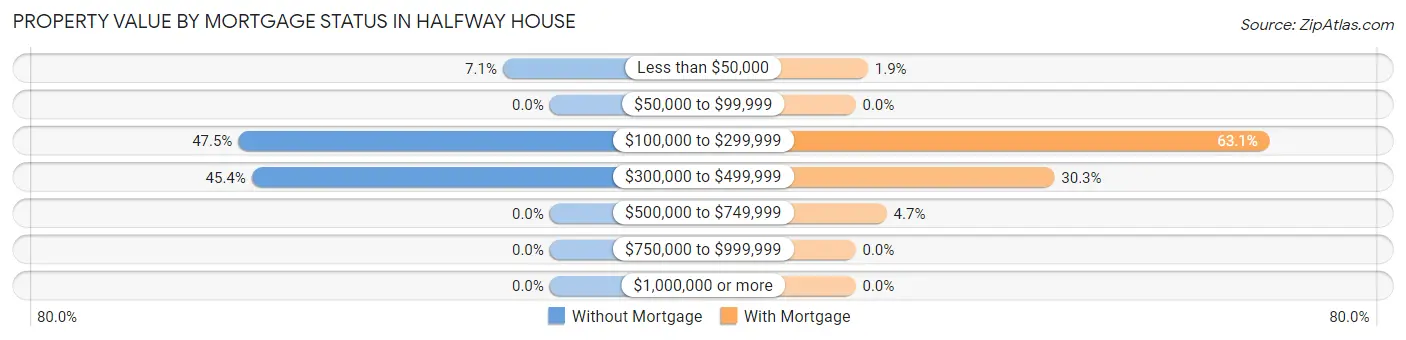
| Property Value | Without Mortgage | With Mortgage |
| Less than $50,000 | 14 (7.1%) | 15 (1.9%) |
| $50,000 to $99,999 | 0 (0.0%) | 0 (0.0%) |
| $100,000 to $299,999 | 93 (47.4%) | 506 (63.1%) |
| $300,000 to $499,999 | 89 (45.4%) | 243 (30.3%) |
| $500,000 to $749,999 | 0 (0.0%) | 38 (4.7%) |
| $750,000 to $999,999 | 0 (0.0%) | 0 (0.0%) |
| $1,000,000 or more | 0 (0.0%) | 0 (0.0%) |
| Total | 196 (100.0%) | 802 (100.0%) |
Household Income by Mortgage Status in Halfway House
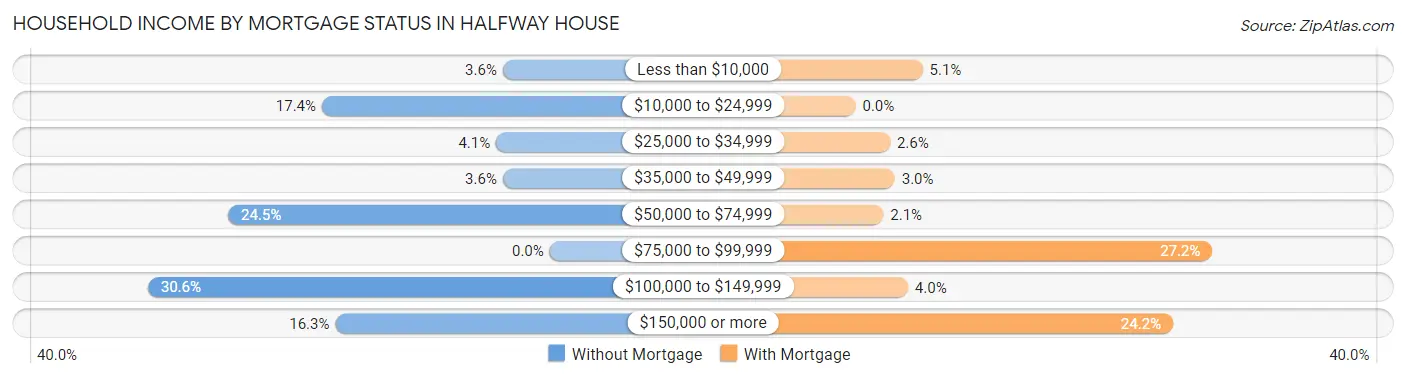
| Household Income | Without Mortgage | With Mortgage |
| Less than $10,000 | 7 (3.6%) | 41 (5.1%) |
| $10,000 to $24,999 | 34 (17.3%) | 0 (0.0%) |
| $25,000 to $34,999 | 8 (4.1%) | 21 (2.6%) |
| $35,000 to $49,999 | 7 (3.6%) | 24 (3.0%) |
| $50,000 to $74,999 | 48 (24.5%) | 17 (2.1%) |
| $75,000 to $99,999 | 0 (0.0%) | 218 (27.2%) |
| $100,000 to $149,999 | 60 (30.6%) | 32 (4.0%) |
| $150,000 or more | 32 (16.3%) | 194 (24.2%) |
| Total | 196 (100.0%) | 802 (100.0%) |
Property Value to Household Income Ratio in Halfway House
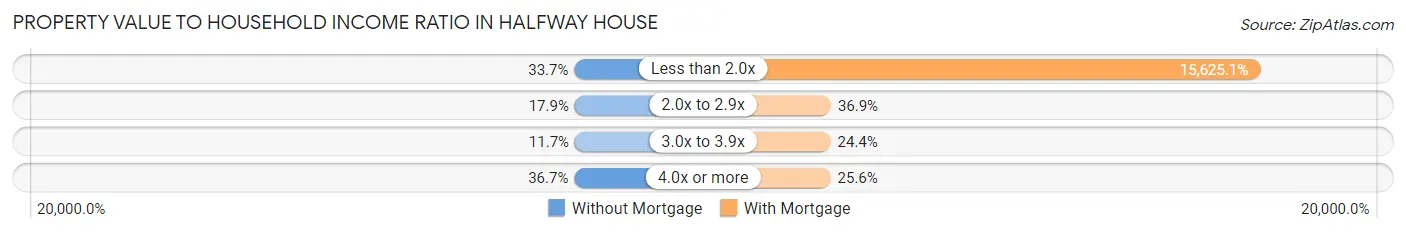
| Value-to-Income Ratio | Without Mortgage | With Mortgage |
| Less than 2.0x | 66 (33.7%) | 125,313 (15,625.1%) |
| 2.0x to 2.9x | 35 (17.9%) | 296 (36.9%) |
| 3.0x to 3.9x | 23 (11.7%) | 196 (24.4%) |
| 4.0x or more | 72 (36.7%) | 205 (25.6%) |
| Total | 196 (100.0%) | 802 (100.0%) |
Real Estate Taxes by Mortgage Status in Halfway House
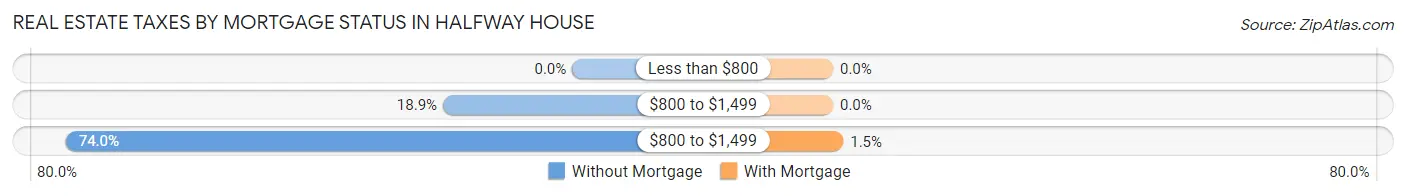
| Property Taxes | Without Mortgage | With Mortgage |
| Less than $800 | 0 (0.0%) | 0 (0.0%) |
| $800 to $1,499 | 37 (18.9%) | 0 (0.0%) |
| $800 to $1,499 | 145 (74.0%) | 12 (1.5%) |
| Total | 196 (100.0%) | 802 (100.0%) |
Health & Disability in Halfway House
Health Insurance Coverage by Age in Halfway House
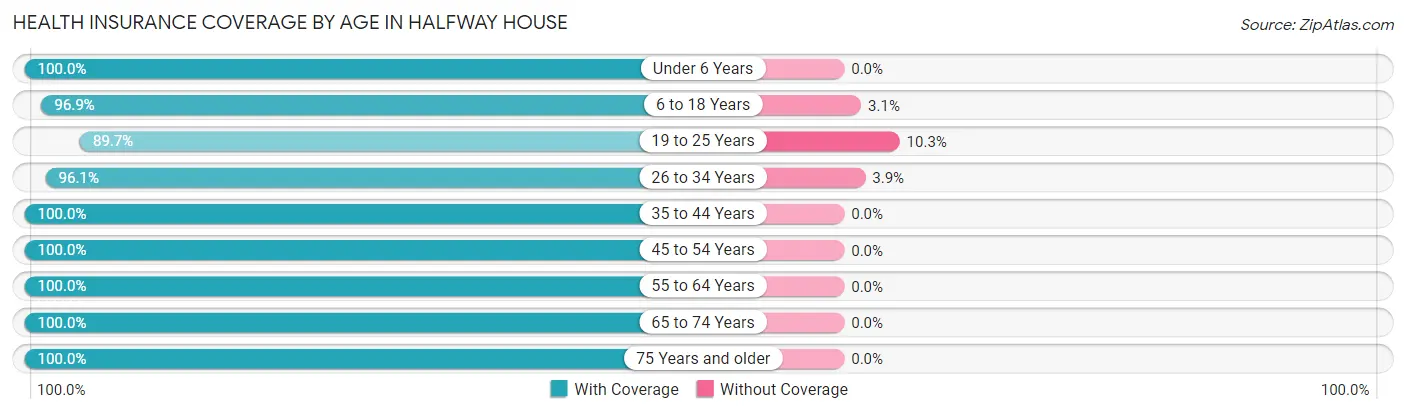
| Age Bracket | With Coverage | Without Coverage |
| Under 6 Years | 170 (100.0%) | 0 (0.0%) |
| 6 to 18 Years | 586 (96.9%) | 19 (3.1%) |
| 19 to 25 Years | 278 (89.7%) | 32 (10.3%) |
| 26 to 34 Years | 441 (96.1%) | 18 (3.9%) |
| 35 to 44 Years | 772 (100.0%) | 0 (0.0%) |
| 45 to 54 Years | 323 (100.0%) | 0 (0.0%) |
| 55 to 64 Years | 305 (100.0%) | 0 (0.0%) |
| 65 to 74 Years | 213 (100.0%) | 0 (0.0%) |
| 75 Years and older | 156 (100.0%) | 0 (0.0%) |
| Total | 3,244 (97.9%) | 69 (2.1%) |
Health Insurance Coverage by Citizenship Status in Halfway House
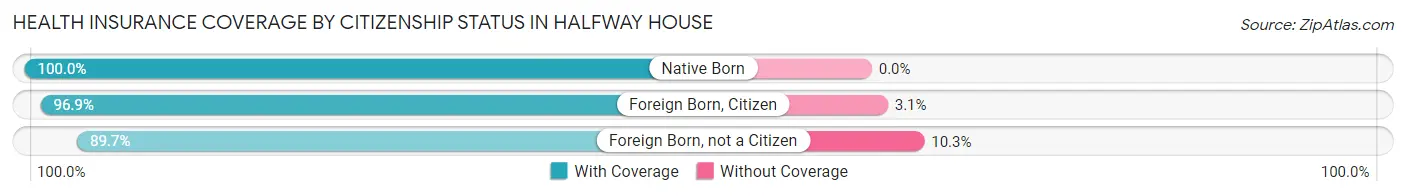
| Citizenship Status | With Coverage | Without Coverage |
| Native Born | 170 (100.0%) | 0 (0.0%) |
| Foreign Born, Citizen | 586 (96.9%) | 19 (3.1%) |
| Foreign Born, not a Citizen | 278 (89.7%) | 32 (10.3%) |
Health Insurance Coverage by Household Income in Halfway House
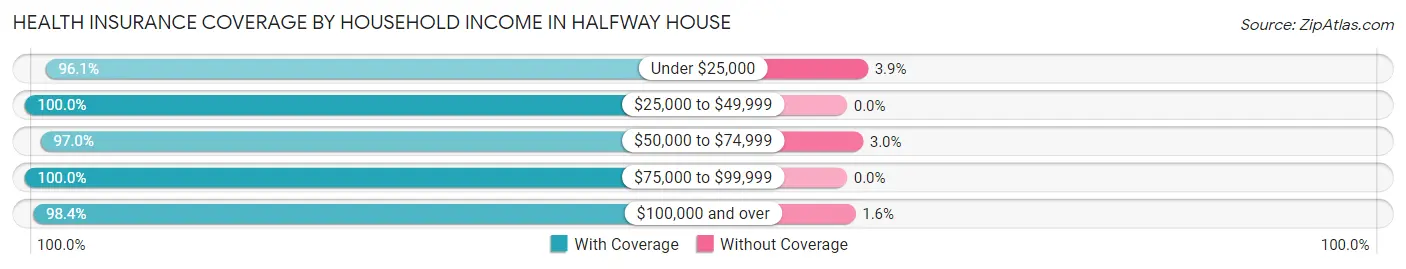
| Household Income | With Coverage | Without Coverage |
| Under $25,000 | 441 (96.1%) | 18 (3.9%) |
| $25,000 to $49,999 | 76 (100.0%) | 0 (0.0%) |
| $50,000 to $74,999 | 617 (97.0%) | 19 (3.0%) |
| $75,000 to $99,999 | 128 (100.0%) | 0 (0.0%) |
| $100,000 and over | 1,978 (98.4%) | 32 (1.6%) |
Public vs Private Health Insurance Coverage by Age in Halfway House
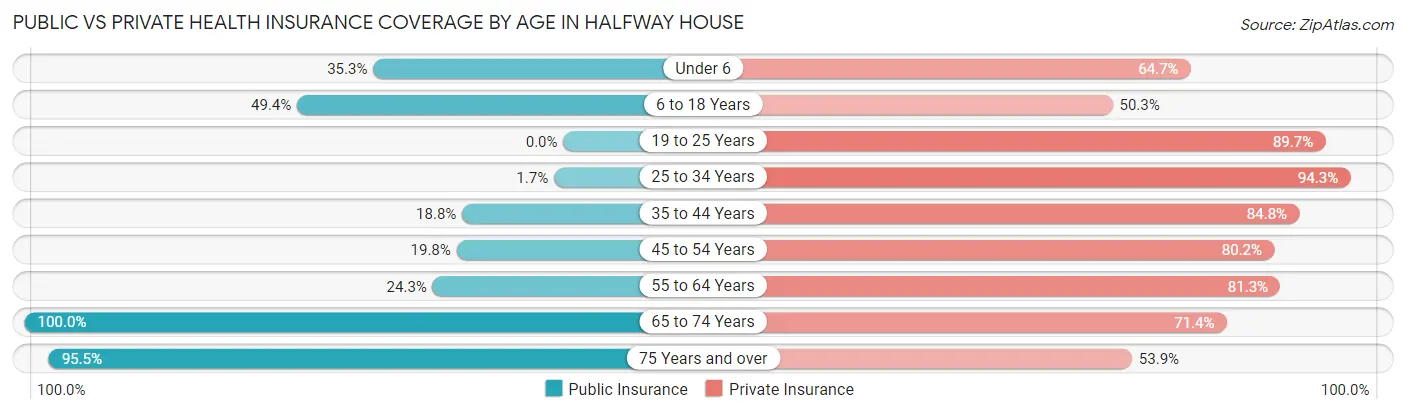
| Age Bracket | Public Insurance | Private Insurance |
| Under 6 | 60 (35.3%) | 110 (64.7%) |
| 6 to 18 Years | 299 (49.4%) | 304 (50.2%) |
| 19 to 25 Years | 0 (0.0%) | 278 (89.7%) |
| 25 to 34 Years | 8 (1.7%) | 433 (94.3%) |
| 35 to 44 Years | 145 (18.8%) | 655 (84.8%) |
| 45 to 54 Years | 64 (19.8%) | 259 (80.2%) |
| 55 to 64 Years | 74 (24.3%) | 248 (81.3%) |
| 65 to 74 Years | 213 (100.0%) | 152 (71.4%) |
| 75 Years and over | 149 (95.5%) | 84 (53.8%) |
| Total | 1,012 (30.5%) | 2,523 (76.1%) |
Disability Status by Sex by Age in Halfway House
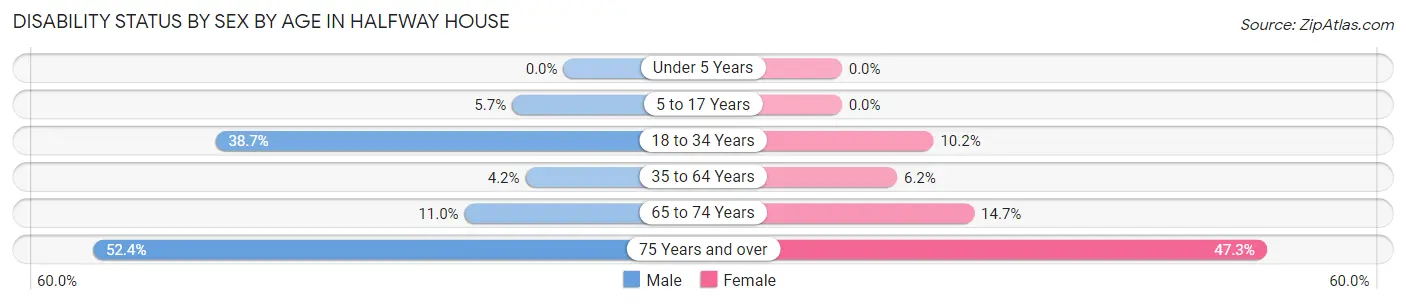
| Age Bracket | Male | Female |
| Under 5 Years | 0 (0.0%) | 0 (0.0%) |
| 5 to 17 Years | 19 (5.7%) | 0 (0.0%) |
| 18 to 34 Years | 141 (38.7%) | 48 (10.2%) |
| 35 to 64 Years | 31 (4.2%) | 41 (6.1%) |
| 65 to 74 Years | 13 (11.0%) | 14 (14.7%) |
| 75 Years and over | 33 (52.4%) | 44 (47.3%) |
Disability Class by Sex by Age in Halfway House
Disability Class: Hearing Difficulty
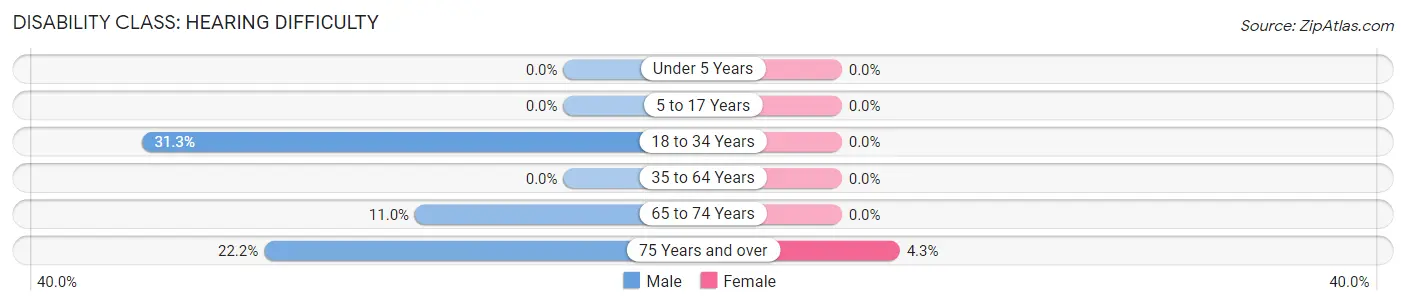
| Age Bracket | Male | Female |
| Under 5 Years | 0 (0.0%) | 0 (0.0%) |
| 5 to 17 Years | 0 (0.0%) | 0 (0.0%) |
| 18 to 34 Years | 114 (31.3%) | 0 (0.0%) |
| 35 to 64 Years | 0 (0.0%) | 0 (0.0%) |
| 65 to 74 Years | 13 (11.0%) | 0 (0.0%) |
| 75 Years and over | 14 (22.2%) | 4 (4.3%) |
Disability Class: Vision Difficulty
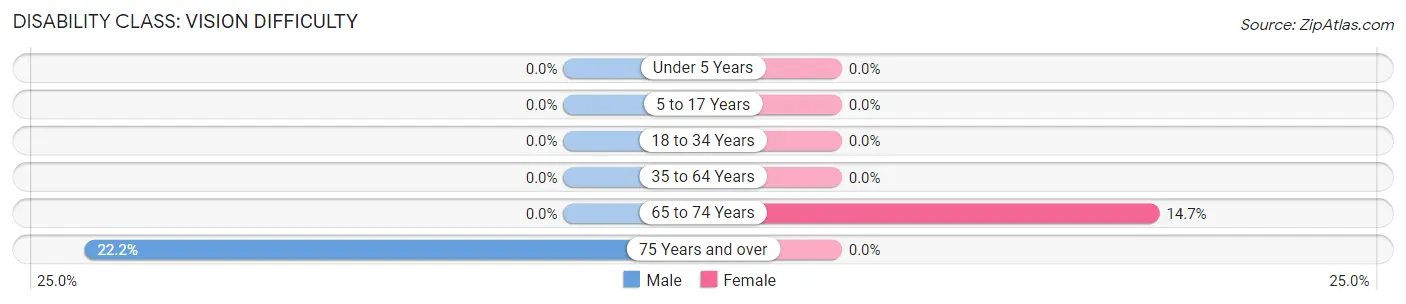
| Age Bracket | Male | Female |
| Under 5 Years | 0 (0.0%) | 0 (0.0%) |
| 5 to 17 Years | 0 (0.0%) | 0 (0.0%) |
| 18 to 34 Years | 0 (0.0%) | 0 (0.0%) |
| 35 to 64 Years | 0 (0.0%) | 0 (0.0%) |
| 65 to 74 Years | 0 (0.0%) | 14 (14.7%) |
| 75 Years and over | 14 (22.2%) | 0 (0.0%) |
Disability Class: Cognitive Difficulty
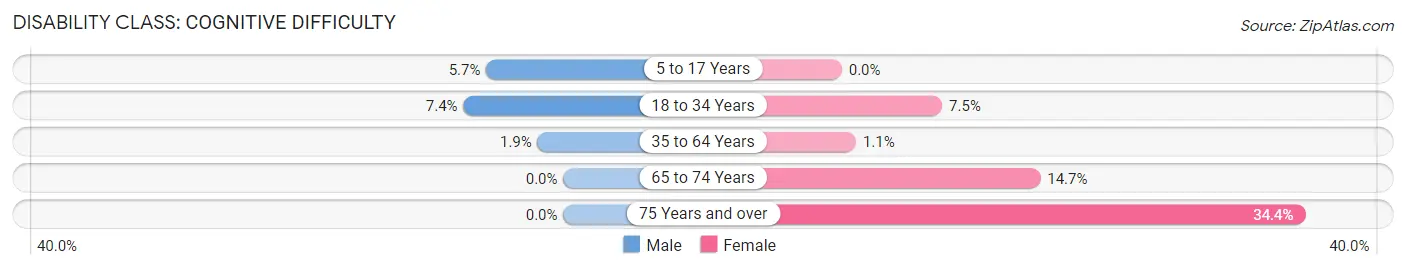
| Age Bracket | Male | Female |
| 5 to 17 Years | 19 (5.7%) | 0 (0.0%) |
| 18 to 34 Years | 27 (7.4%) | 35 (7.4%) |
| 35 to 64 Years | 14 (1.9%) | 7 (1.1%) |
| 65 to 74 Years | 0 (0.0%) | 14 (14.7%) |
| 75 Years and over | 0 (0.0%) | 32 (34.4%) |
Disability Class: Ambulatory Difficulty
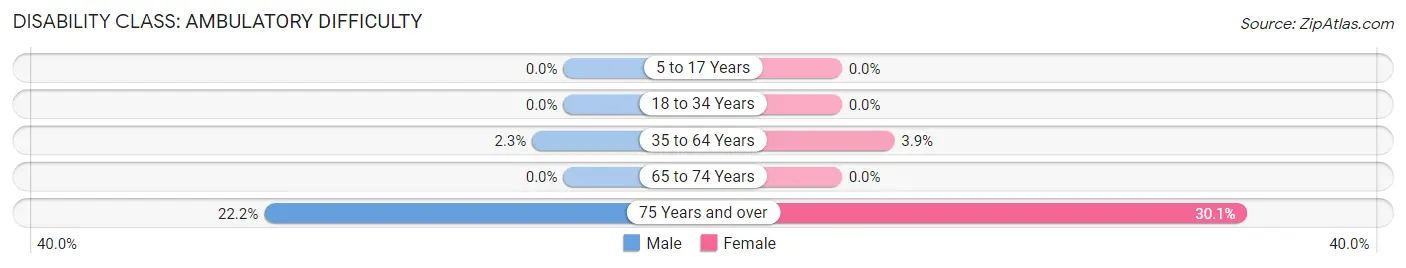
| Age Bracket | Male | Female |
| 5 to 17 Years | 0 (0.0%) | 0 (0.0%) |
| 18 to 34 Years | 0 (0.0%) | 0 (0.0%) |
| 35 to 64 Years | 17 (2.3%) | 26 (3.9%) |
| 65 to 74 Years | 0 (0.0%) | 0 (0.0%) |
| 75 Years and over | 14 (22.2%) | 28 (30.1%) |
Disability Class: Self-Care Difficulty
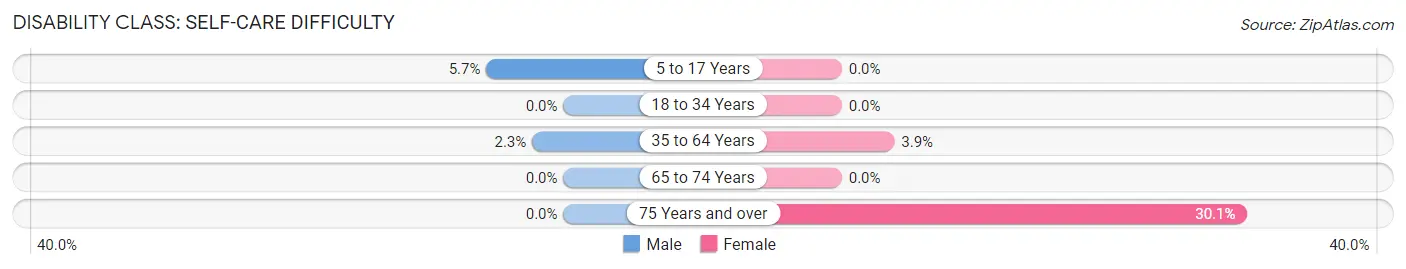
| Age Bracket | Male | Female |
| 5 to 17 Years | 19 (5.7%) | 0 (0.0%) |
| 18 to 34 Years | 0 (0.0%) | 0 (0.0%) |
| 35 to 64 Years | 17 (2.3%) | 26 (3.9%) |
| 65 to 74 Years | 0 (0.0%) | 0 (0.0%) |
| 75 Years and over | 0 (0.0%) | 28 (30.1%) |
Technology Access in Halfway House
Computing Device Access in Halfway House
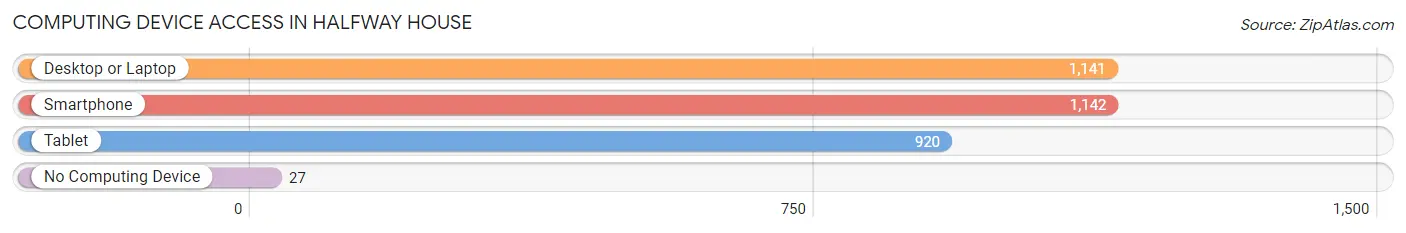
| Device Type | # Households | % Households |
| Desktop or Laptop | 1,141 | 94.9% |
| Smartphone | 1,142 | 94.9% |
| Tablet | 920 | 76.5% |
| No Computing Device | 27 | 2.2% |
| Total | 1,203 | 100.0% |
Internet Access in Halfway House
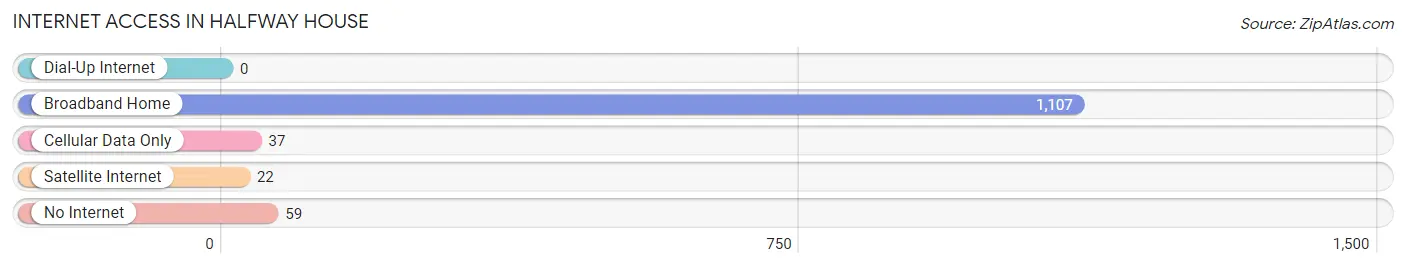
| Internet Type | # Households | % Households |
| Dial-Up Internet | 0 | 0.0% |
| Broadband Home | 1,107 | 92.0% |
| Cellular Data Only | 37 | 3.1% |
| Satellite Internet | 22 | 1.8% |
| No Internet | 59 | 4.9% |
| Total | 1,203 | 100.0% |
Halfway House Summary
Halfway House, Pennsylvania is a small unincorporated community located in the western part of the state, in the borough of East Stroudsburg. It is situated in the Pocono Mountains region of the state, and is part of Monroe County. The population of Halfway House was estimated to be around 1,000 people in 2000.
History
The area that is now known as Halfway House was first settled in the late 1700s by German immigrants. The area was originally known as “Halfway” because it was located halfway between Stroudsburg and East Stroudsburg. The name was later changed to Halfway House when a tavern was built in the area in the early 1800s. The tavern served as a rest stop for travelers and was a popular spot for locals to gather and socialize.
The area remained largely rural until the late 1800s when the railroad was built through the area. This allowed for the development of the area and the growth of the community. The railroad also allowed for the development of the tourism industry in the area, which is still a major part of the local economy today.
Geography
Halfway House is located in the western part of Pennsylvania, in the Pocono Mountains region. It is situated in the borough of East Stroudsburg, in Monroe County. The area is surrounded by forests and mountains, and is known for its scenic beauty. The area is also home to several lakes, including Lake Wallenpaupack, which is a popular destination for fishing and boating.
The climate in Halfway House is typical of the region, with cold winters and warm summers. The average temperature in the winter is around 25 degrees Fahrenheit, and the average temperature in the summer is around 75 degrees Fahrenheit.
Economy
The economy of Halfway House is largely based on tourism. The area is known for its scenic beauty and outdoor activities, and is a popular destination for visitors from all over the country. The area is also home to several resorts and hotels, which provide employment for many of the local residents.
In addition to tourism, the area is also home to several small businesses, including restaurants, shops, and other services. The area is also home to several farms, which provide produce and other goods to the local community.
Demographics
The population of Halfway House was estimated to be around 1,000 people in 2000. The majority of the population is white, with a small percentage of African Americans and other races. The median household income in the area is around $50,000, and the median age is around 40 years old. The area is also home to a large number of retirees, as well as a growing number of young professionals.
Common Questions
What is Per Capita Income in Halfway House?
Per Capita income in Halfway House is $47,964.
What is the Median Family Income in Halfway House?
Median Family Income in Halfway House is $100,625.
What is the Median Household income in Halfway House?
Median Household Income in Halfway House is $113,097.
What is Income or Wage Gap in Halfway House?
Income or Wage Gap in Halfway House is 15.1%.
Women in Halfway House earn 84.9 cents for every dollar earned by a man.
What is Inequality or Gini Index in Halfway House?
Inequality or Gini Index in Halfway House is 0.42.
What is the Total Population of Halfway House?
Total Population of Halfway House is 3,317.
What is the Total Male Population of Halfway House?
Total Male Population of Halfway House is 1,717.
What is the Total Female Population of Halfway House?
Total Female Population of Halfway House is 1,600.
What is the Ratio of Males per 100 Females in Halfway House?
There are 107.31 Males per 100 Females in Halfway House.
What is the Ratio of Females per 100 Males in Halfway House?
There are 93.19 Females per 100 Males in Halfway House.
What is the Median Population Age in Halfway House?
Median Population Age in Halfway House is 37.2 Years.
What is the Average Family Size in Halfway House
Average Family Size in Halfway House is 3.0 People.
What is the Average Household Size in Halfway House
Average Household Size in Halfway House is 2.8 People.
How Large is the Labor Force in Halfway House?
There are 2,159 People in the Labor Forcein in Halfway House.
What is the Percentage of People in the Labor Force in Halfway House?
80.3% of People are in the Labor Force in Halfway House.
What is the Unemployment Rate in Halfway House?
Unemployment Rate in Halfway House is 12.8%.