Southview, PA Map & Demographics
Southview Map
Southview Overview
$32,753
PER CAPITA INCOME
0.40
INEQUALITY / GINI INDEX
364
TOTAL POPULATION
128
MALE POPULATION
236
FEMALE POPULATION
54.24
MALES / 100 FEMALES
184.38
FEMALES / 100 MALES
41.6
MEDIAN AGE
2.9
AVG FAMILY SIZE
2.9
AVG HOUSEHOLD SIZE
199
LABOR FORCE [ PEOPLE ]
64.2%
PERCENT IN LABOR FORCE
13.1%
UNEMPLOYMENT RATE
Southview Zip Codes
Southview Area Codes
Income in Southview
Income Overview in Southview
| Characteristic | Number | Measure |
| Per Capita Income | 364 | $32,753 |
| Median Family Income | 113 | $0 |
| Mean Family Income | 113 | $91,699 |
| Median Household Income | 124 | $0 |
| Mean Household Income | 124 | $96,181 |
| Income Deficit | 113 | $0 |
| Wage / Income Gap (%) | 364 | 0.00% |
| Wage / Income Gap ($) | 364 | 100.00¢ per $1 |
| Gini / Inequality Index | 364 | 0.40 |
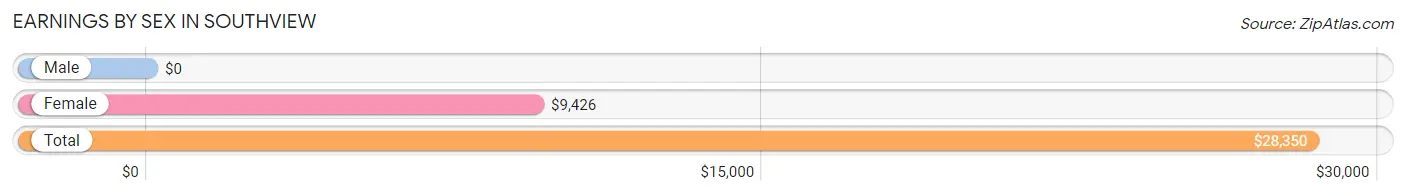
Earnings by Sex in Southview
| Sex | Number | Average Earnings |
| Male | 91 (39.1%) | $0 |
| Female | 142 (60.9%) | $9,426 |
| Total | 233 (100.0%) | $28,350 |
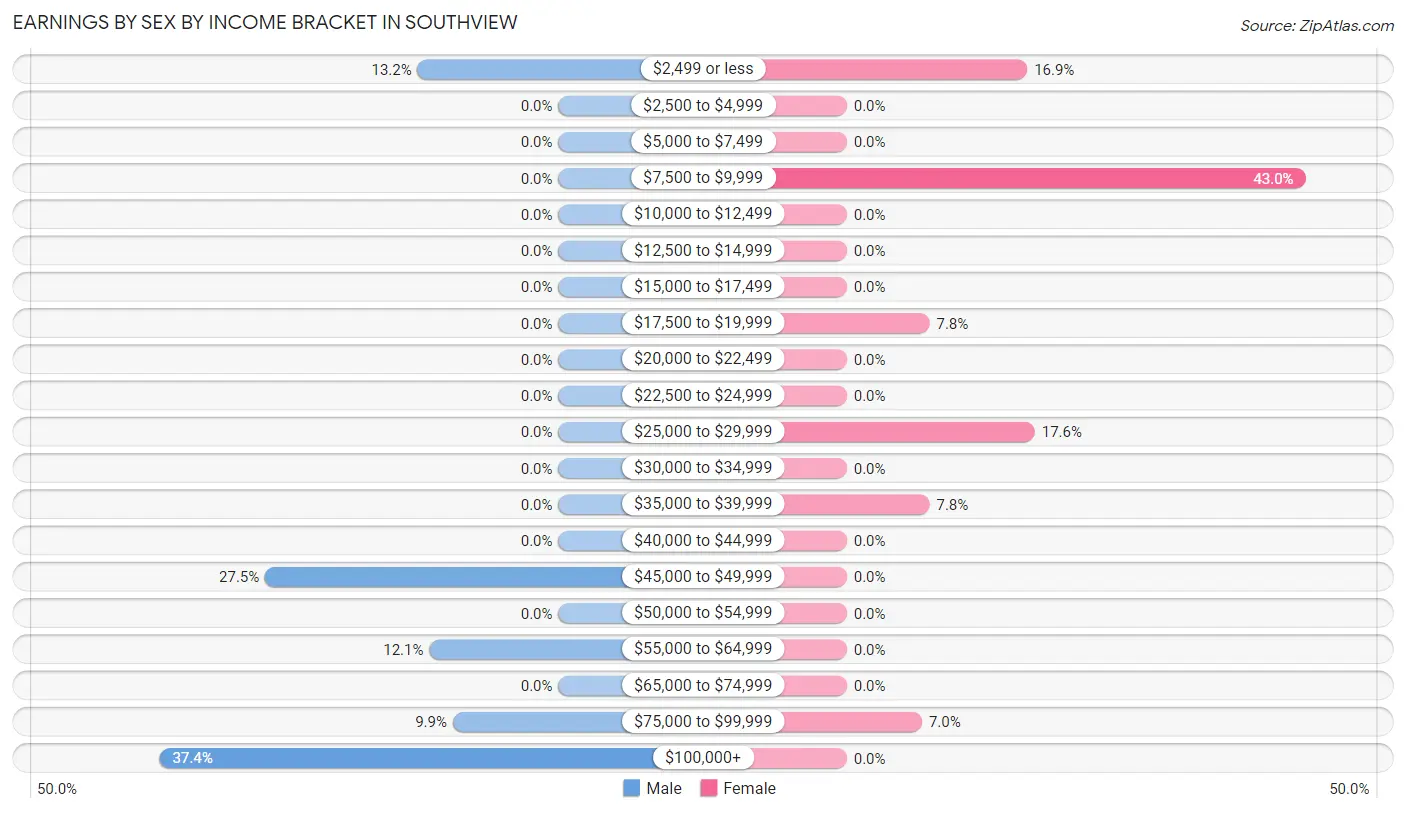
Earnings by Sex by Income Bracket in Southview
The most common earnings brackets in Southview are $100,000+ for men (34 | 37.4%) and $7,500 to $9,999 for women (61 | 43.0%).
| Income | Male | Female |
| $2,499 or less | 12 (13.2%) | 24 (16.9%) |
| $2,500 to $4,999 | 0 (0.0%) | 0 (0.0%) |
| $5,000 to $7,499 | 0 (0.0%) | 0 (0.0%) |
| $7,500 to $9,999 | 0 (0.0%) | 61 (43.0%) |
| $10,000 to $12,499 | 0 (0.0%) | 0 (0.0%) |
| $12,500 to $14,999 | 0 (0.0%) | 0 (0.0%) |
| $15,000 to $17,499 | 0 (0.0%) | 0 (0.0%) |
| $17,500 to $19,999 | 0 (0.0%) | 11 (7.7%) |
| $20,000 to $22,499 | 0 (0.0%) | 0 (0.0%) |
| $22,500 to $24,999 | 0 (0.0%) | 0 (0.0%) |
| $25,000 to $29,999 | 0 (0.0%) | 25 (17.6%) |
| $30,000 to $34,999 | 0 (0.0%) | 0 (0.0%) |
| $35,000 to $39,999 | 0 (0.0%) | 11 (7.7%) |
| $40,000 to $44,999 | 0 (0.0%) | 0 (0.0%) |
| $45,000 to $49,999 | 25 (27.5%) | 0 (0.0%) |
| $50,000 to $54,999 | 0 (0.0%) | 0 (0.0%) |
| $55,000 to $64,999 | 11 (12.1%) | 0 (0.0%) |
| $65,000 to $74,999 | 0 (0.0%) | 0 (0.0%) |
| $75,000 to $99,999 | 9 (9.9%) | 10 (7.0%) |
| $100,000+ | 34 (37.4%) | 0 (0.0%) |
| Total | 91 (100.0%) | 142 (100.0%) |
Earnings by Sex by Educational Attainment in Southview
| Educational Attainment | Male Income | Female Income |
| Less than High School | - | - |
| High School Diploma | - | - |
| College or Associate's Degree | - | - |
| Bachelor's Degree | - | - |
| Graduate Degree | - | - |
| Total | $88,472 | $19,773 |
Family Income in Southview
Family Income Brackets in Southview
According to the Southview family income data, there are 32 families falling into the $25,000 to $34,999 income range, which is the most common income bracket and makes up 28.3% of all families.
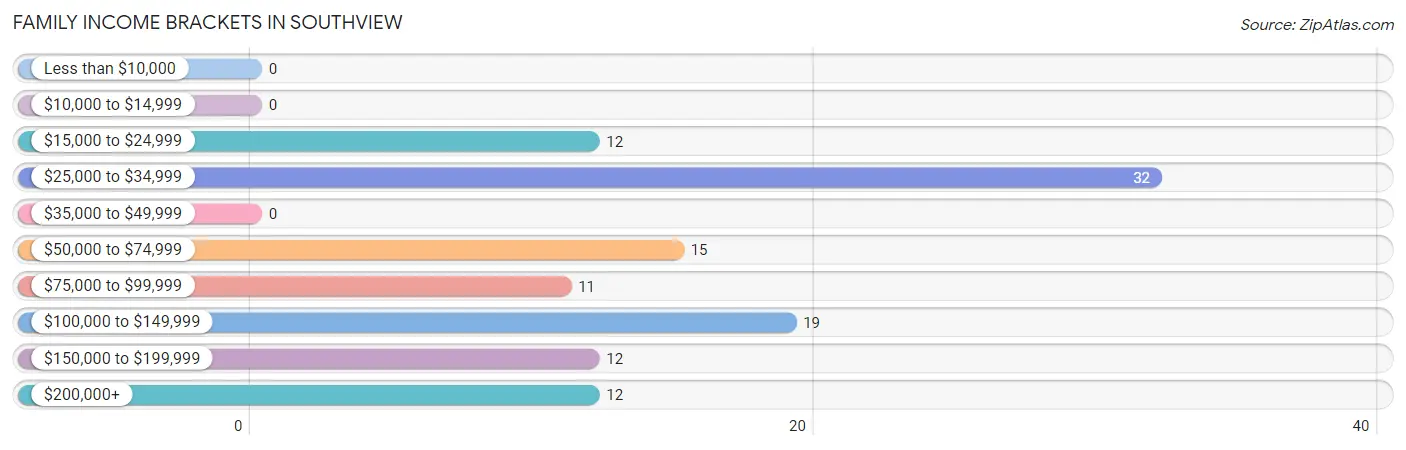
| Income Bracket | # Families | % Families |
| Less than $10,000 | 0 | 0.0% |
| $10,000 to $14,999 | 0 | 0.0% |
| $15,000 to $24,999 | 12 | 10.6% |
| $25,000 to $34,999 | 32 | 28.3% |
| $35,000 to $49,999 | 0 | 0.0% |
| $50,000 to $74,999 | 15 | 13.3% |
| $75,000 to $99,999 | 11 | 9.7% |
| $100,000 to $149,999 | 19 | 16.8% |
| $150,000 to $199,999 | 12 | 10.6% |
| $200,000+ | 12 | 10.6% |
Family Income by Famaliy Size in Southview
| Income Bracket | # Families | Median Income |
| 2-Person Families | 35 (31.0%) | $0 |
| 3-Person Families | 57 (50.4%) | $0 |
| 4-Person Families | 21 (18.6%) | $0 |
| 5-Person Families | 0 (0.0%) | $0 |
| 6-Person Families | 0 (0.0%) | $0 |
| 7+ Person Families | 0 (0.0%) | $0 |
| Total | 113 (100.0%) | $0 |
Family Income by Number of Earners in Southview
| Number of Earners | # Families | Median Income |
| No Earners | 12 (10.6%) | $0 |
| 1 Earner | 43 (38.1%) | $0 |
| 2 Earners | 37 (32.7%) | $0 |
| 3+ Earners | 21 (18.6%) | $0 |
| Total | 113 (100.0%) | $0 |
Household Income in Southview
Household Income Brackets in Southview
With 32 households falling in the category, the $25,000 to $34,999 income range is the most frequent in Southview, accounting for 25.8% of all households.
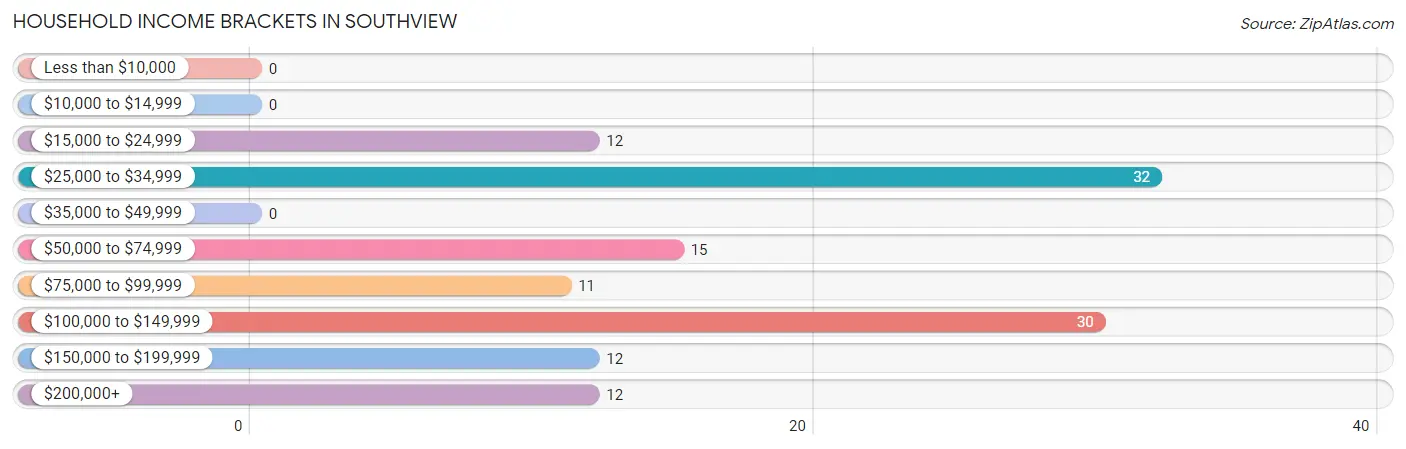
| Income Bracket | # Households | % Households |
| Less than $10,000 | 0 | 0.0% |
| $10,000 to $14,999 | 0 | 0.0% |
| $15,000 to $24,999 | 12 | 9.7% |
| $25,000 to $34,999 | 32 | 25.8% |
| $35,000 to $49,999 | 0 | 0.0% |
| $50,000 to $74,999 | 15 | 12.1% |
| $75,000 to $99,999 | 11 | 8.9% |
| $100,000 to $149,999 | 30 | 24.2% |
| $150,000 to $199,999 | 12 | 9.7% |
| $200,000+ | 12 | 9.7% |
Household Income by Householder Age in Southview
The median household income in Southview is $0, with the highest median household income of $125,556 found in the 25 to 44 years age bracket for the primary householder. A total of 34 households (27.4%) fall into this category.
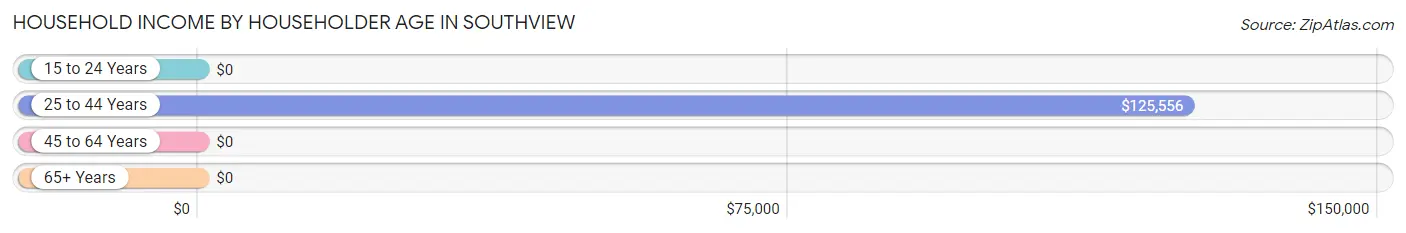
| Income Bracket | # Households | Median Income |
| 15 to 24 Years | 0 (0.0%) | $0 |
| 25 to 44 Years | 34 (27.4%) | $125,556 |
| 45 to 64 Years | 78 (62.9%) | $0 |
| 65+ Years | 12 (9.7%) | $0 |
| Total | 124 (100.0%) | $0 |
Poverty in Southview
Income Below Poverty by Sex and Age in Southview
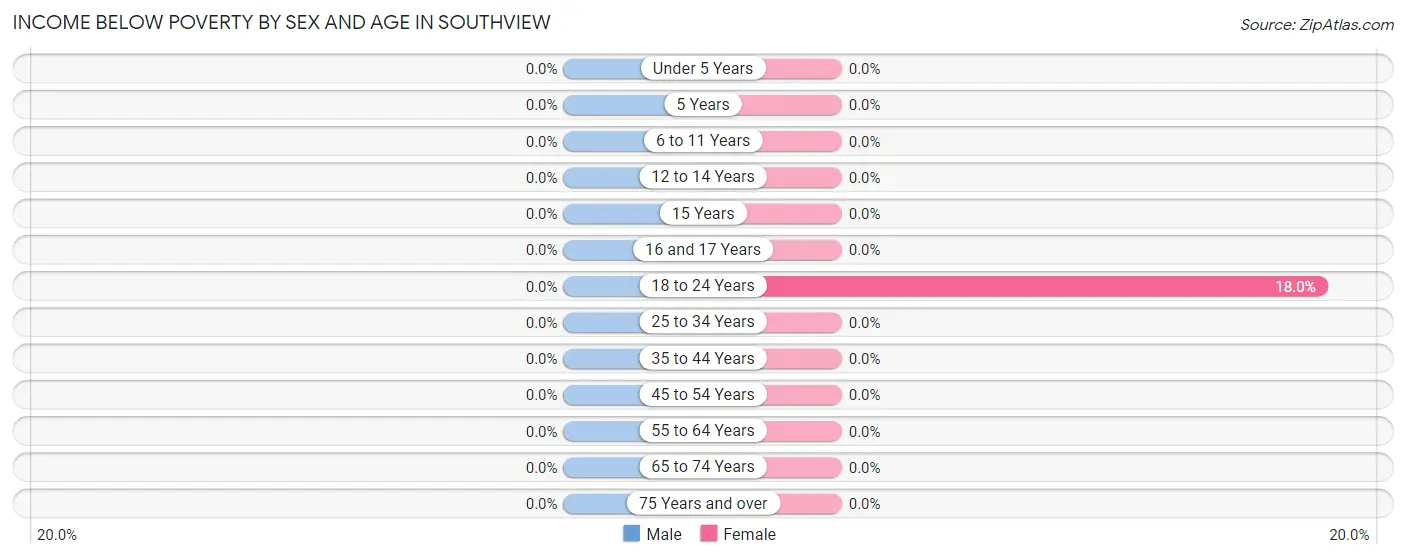
| Age Bracket | Male | Female |
| Under 5 Years | 0 (0.0%) | 0 (0.0%) |
| 5 Years | 0 (0.0%) | 0 (0.0%) |
| 6 to 11 Years | 0 (0.0%) | 0 (0.0%) |
| 12 to 14 Years | 0 (0.0%) | 0 (0.0%) |
| 15 Years | 0 (0.0%) | 0 (0.0%) |
| 16 and 17 Years | 0 (0.0%) | 0 (0.0%) |
| 18 to 24 Years | 0 (0.0%) | 11 (18.0%) |
| 25 to 34 Years | 0 (0.0%) | 0 (0.0%) |
| 35 to 44 Years | 0 (0.0%) | 0 (0.0%) |
| 45 to 54 Years | 0 (0.0%) | 0 (0.0%) |
| 55 to 64 Years | 0 (0.0%) | 0 (0.0%) |
| 65 to 74 Years | 0 (0.0%) | 0 (0.0%) |
| 75 Years and over | 0 (0.0%) | 0 (0.0%) |
| Total | 0 (0.0%) | 11 (4.7%) |
Income Above Poverty by Sex and Age in Southview
According to the poverty statistics in Southview, males aged under 5 years and females aged 12 to 14 years are the age groups that are most secure financially, with 100.0% of males and 100.0% of females in these age groups living above the poverty line.
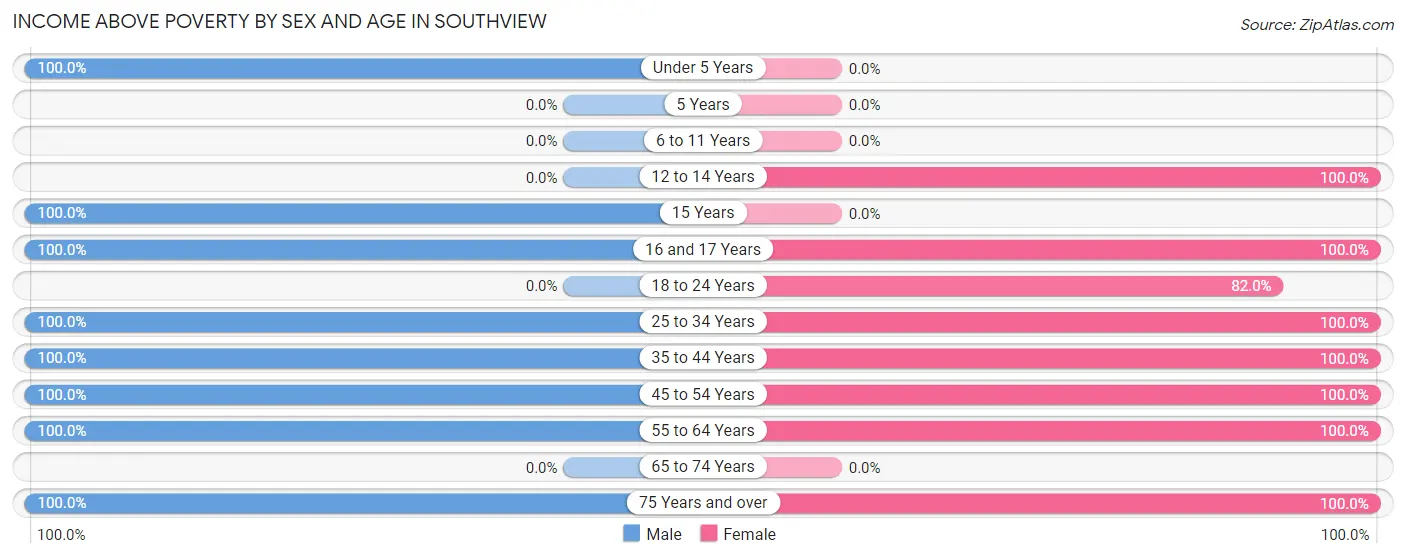
| Age Bracket | Male | Female |
| Under 5 Years | 13 (100.0%) | 0 (0.0%) |
| 5 Years | 0 (0.0%) | 0 (0.0%) |
| 6 to 11 Years | 0 (0.0%) | 0 (0.0%) |
| 12 to 14 Years | 0 (0.0%) | 29 (100.0%) |
| 15 Years | 12 (100.0%) | 0 (0.0%) |
| 16 and 17 Years | 12 (100.0%) | 13 (100.0%) |
| 18 to 24 Years | 0 (0.0%) | 50 (82.0%) |
| 25 to 34 Years | 15 (100.0%) | 15 (100.0%) |
| 35 to 44 Years | 19 (100.0%) | 19 (100.0%) |
| 45 to 54 Years | 12 (100.0%) | 54 (100.0%) |
| 55 to 64 Years | 33 (100.0%) | 23 (100.0%) |
| 65 to 74 Years | 0 (0.0%) | 0 (0.0%) |
| 75 Years and over | 12 (100.0%) | 22 (100.0%) |
| Total | 128 (100.0%) | 225 (95.3%) |
Income Below Poverty Among Married-Couple Families in Southview
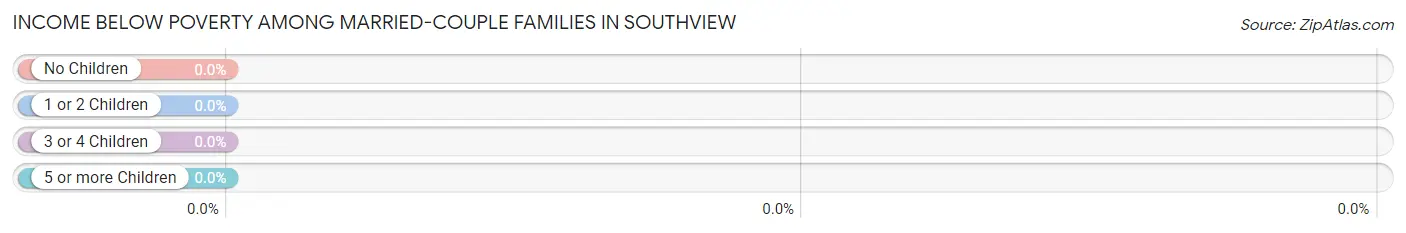
| Children | Above Poverty | Below Poverty |
| No Children | 35 (100.0%) | 0 (0.0%) |
| 1 or 2 Children | 46 (100.0%) | 0 (0.0%) |
| 3 or 4 Children | 0 (0.0%) | 0 (0.0%) |
| 5 or more Children | 0 (0.0%) | 0 (0.0%) |
| Total | 81 (100.0%) | 0 (0.0%) |
Income Below Poverty Among Single-Parent Households in Southview
| Children | Single Father | Single Mother |
| No Children | 0 (0.0%) | 0 (0.0%) |
| 1 or 2 Children | 0 (0.0%) | 0 (0.0%) |
| 3 or 4 Children | 0 (0.0%) | 0 (0.0%) |
| 5 or more Children | 0 (0.0%) | 0 (0.0%) |
| Total | 0 (0.0%) | 0 (0.0%) |
Income Below Poverty Among Married-Couple vs Single-Parent Households in Southview
| Children | Married-Couple Families | Single-Parent Households |
| No Children | 0 (0.0%) | 0 (0.0%) |
| 1 or 2 Children | 0 (0.0%) | 0 (0.0%) |
| 3 or 4 Children | 0 (0.0%) | 0 (0.0%) |
| 5 or more Children | 0 (0.0%) | 0 (0.0%) |
| Total | 0 (0.0%) | 0 (0.0%) |
Race in Southview
The most populous races in Southview are White / Caucasian (353 | 97.0%), Hispanic or Latino (11 | 3.0%), and Some other Race (11 | 3.0%).
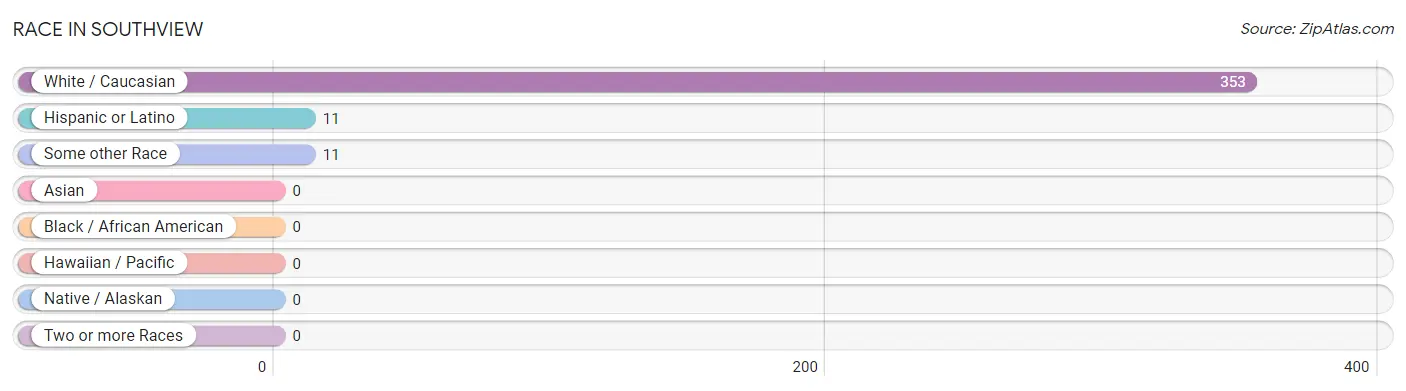
| Race | # Population | % Population |
| Asian | 0 | 0.0% |
| Black / African American | 0 | 0.0% |
| Hawaiian / Pacific | 0 | 0.0% |
| Hispanic or Latino | 11 | 3.0% |
| Native / Alaskan | 0 | 0.0% |
| White / Caucasian | 353 | 97.0% |
| Two or more Races | 0 | 0.0% |
| Some other Race | 11 | 3.0% |
| Total | 364 | 100.0% |
Ancestry in Southview
The most populous ancestries reported in Southview are Scotch-Irish (98 | 26.9%), German (83 | 22.8%), Irish (33 | 9.1%), Polish (23 | 6.3%), and Italian (22 | 6.0%), together accounting for 71.2% of all Southview residents.
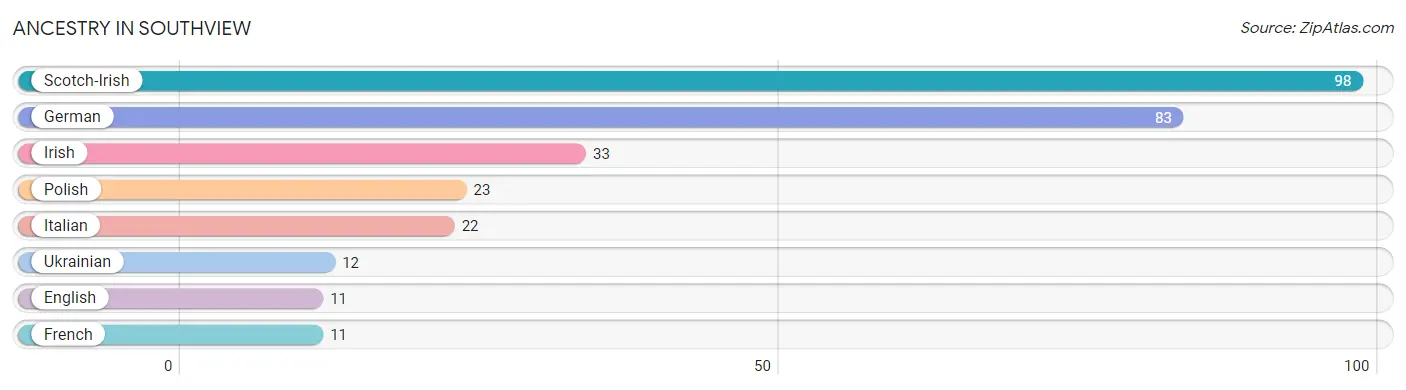
| Ancestry | # Population | % Population |
| English | 11 | 3.0% |
| French | 11 | 3.0% |
| German | 83 | 22.8% |
| Irish | 33 | 9.1% |
| Italian | 22 | 6.0% |
| Polish | 23 | 6.3% |
| Scotch-Irish | 98 | 26.9% |
| Ukrainian | 12 | 3.3% | View All 8 Rows |
Immigrants in Southview

| Immigration Origin | # Population | % Population | View All 0 Rows |
Sex and Age in Southview
Sex and Age in Southview
The most populous age groups in Southview are 60 to 64 Years (33 | 25.8%) for men and 20 to 24 Years (61 | 25.9%) for women.
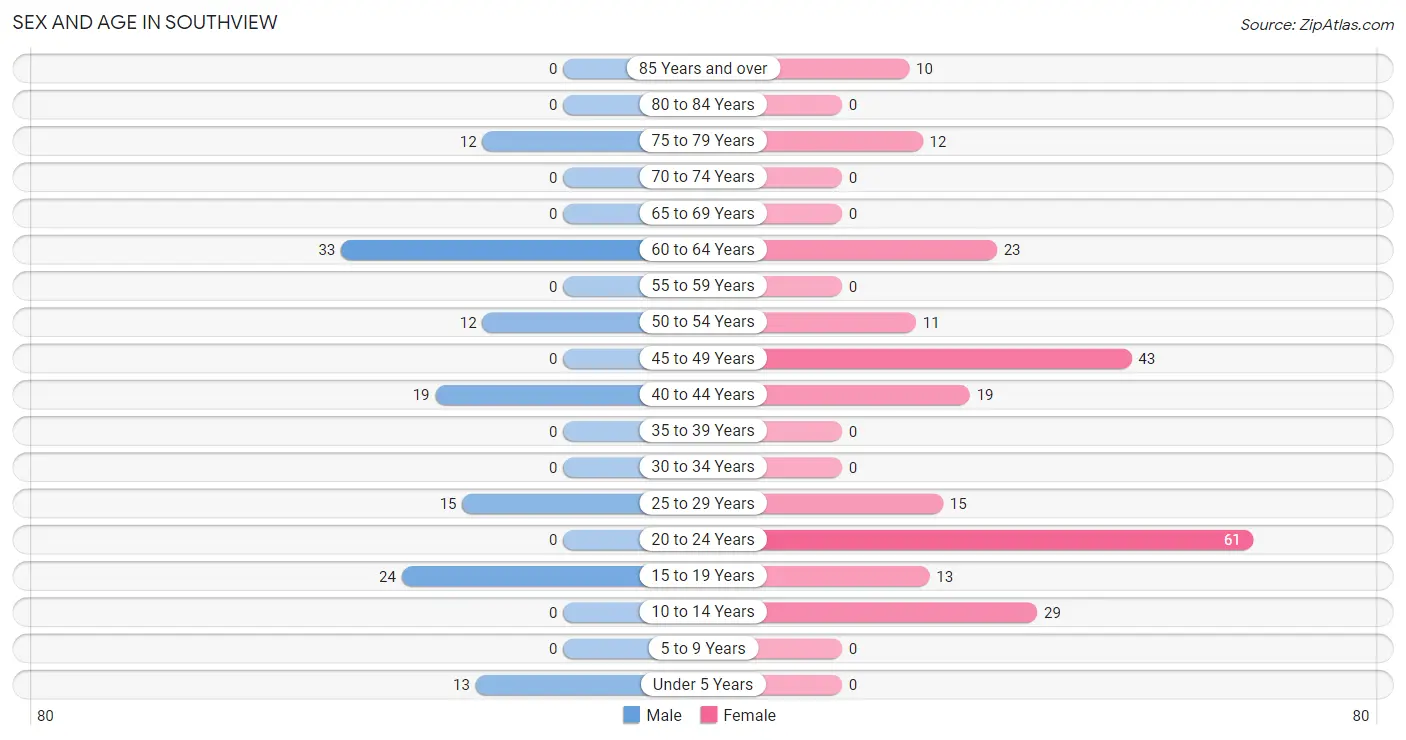
| Age Bracket | Male | Female |
| Under 5 Years | 13 (10.2%) | 0 (0.0%) |
| 5 to 9 Years | 0 (0.0%) | 0 (0.0%) |
| 10 to 14 Years | 0 (0.0%) | 29 (12.3%) |
| 15 to 19 Years | 24 (18.8%) | 13 (5.5%) |
| 20 to 24 Years | 0 (0.0%) | 61 (25.9%) |
| 25 to 29 Years | 15 (11.7%) | 15 (6.4%) |
| 30 to 34 Years | 0 (0.0%) | 0 (0.0%) |
| 35 to 39 Years | 0 (0.0%) | 0 (0.0%) |
| 40 to 44 Years | 19 (14.8%) | 19 (8.1%) |
| 45 to 49 Years | 0 (0.0%) | 43 (18.2%) |
| 50 to 54 Years | 12 (9.4%) | 11 (4.7%) |
| 55 to 59 Years | 0 (0.0%) | 0 (0.0%) |
| 60 to 64 Years | 33 (25.8%) | 23 (9.8%) |
| 65 to 69 Years | 0 (0.0%) | 0 (0.0%) |
| 70 to 74 Years | 0 (0.0%) | 0 (0.0%) |
| 75 to 79 Years | 12 (9.4%) | 12 (5.1%) |
| 80 to 84 Years | 0 (0.0%) | 0 (0.0%) |
| 85 Years and over | 0 (0.0%) | 10 (4.2%) |
| Total | 128 (100.0%) | 236 (100.0%) |
Families and Households in Southview
Median Family Size in Southview
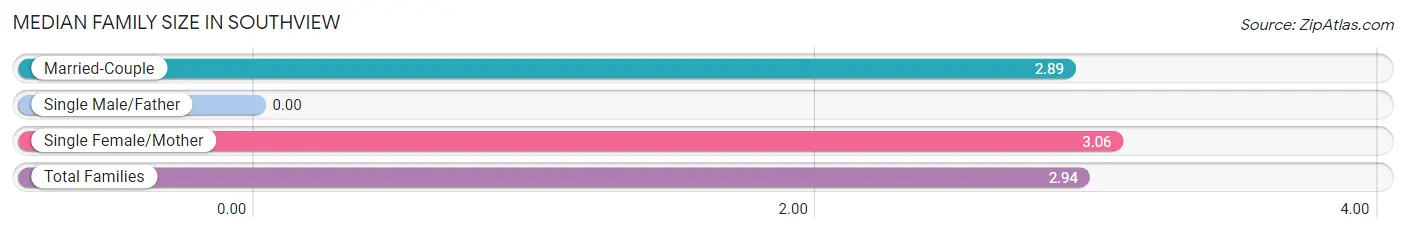
| Family Type | # Families | Family Size |
| Married-Couple | 81 (71.7%) | 2.89 |
| Single Male/Father | 0 (0.0%) | - |
| Single Female/Mother | 32 (28.3%) | 3.06 |
| Total Families | 113 (100.0%) | 2.94 |
Median Household Size in Southview
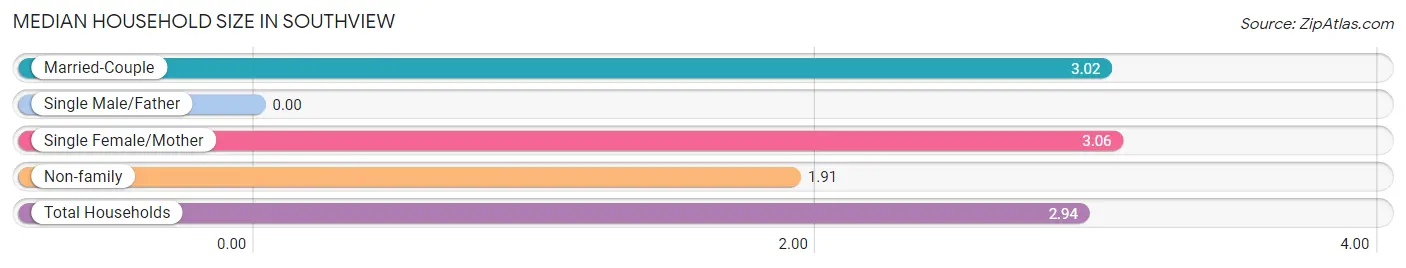
| Household Type | # Households | Household Size |
| Married-Couple | 81 (65.3%) | 3.02 |
| Single Male/Father | 0 (0.0%) | - |
| Single Female/Mother | 32 (25.8%) | 3.06 |
| Non-family | 11 (8.9%) | 1.91 |
| Total Households | 124 (100.0%) | 2.94 |
Household Size by Marriage Status in Southview
Out of a total of 124 households in Southview, 113 (91.1%) are family households, while 11 (8.9%) are nonfamily households. The most numerous type of family households are 3-person households, comprising 57, and the most common type of nonfamily households are 2-person households, comprising 11.
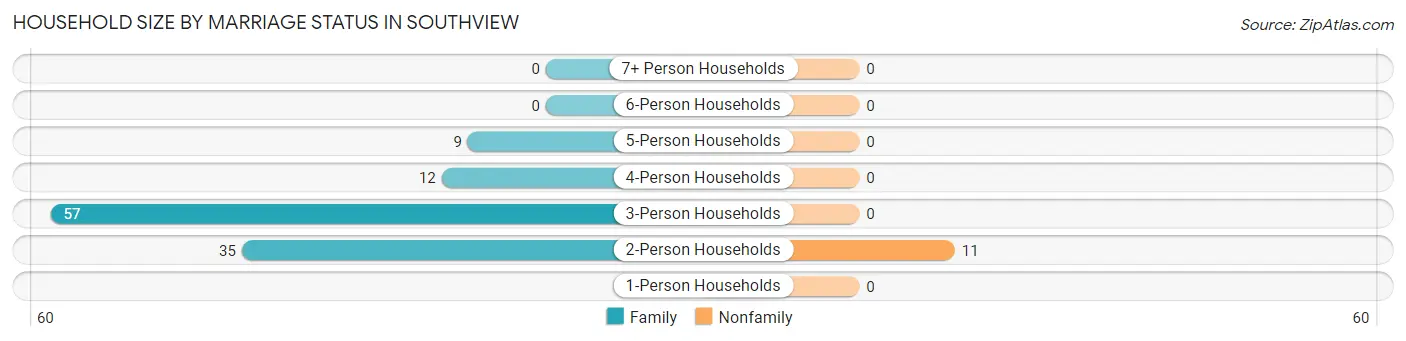
| Household Size | Family Households | Nonfamily Households |
| 1-Person Households | - | 0 (0.0%) |
| 2-Person Households | 35 (28.2%) | 11 (8.9%) |
| 3-Person Households | 57 (46.0%) | 0 (0.0%) |
| 4-Person Households | 12 (9.7%) | 0 (0.0%) |
| 5-Person Households | 9 (7.3%) | 0 (0.0%) |
| 6-Person Households | 0 (0.0%) | 0 (0.0%) |
| 7+ Person Households | 0 (0.0%) | 0 (0.0%) |
| Total | 113 (91.1%) | 11 (8.9%) |
Female Fertility in Southview
Fertility by Age in Southview
Average fertility rate in Southview is 99.0 births per 1,000 women. Women in the age bracket of 20 to 34 years have the highest fertility rate with 197.0 births per 1,000 women. Women in the age bracket of 20 to 34 years acount for 100.0% of all women with births.
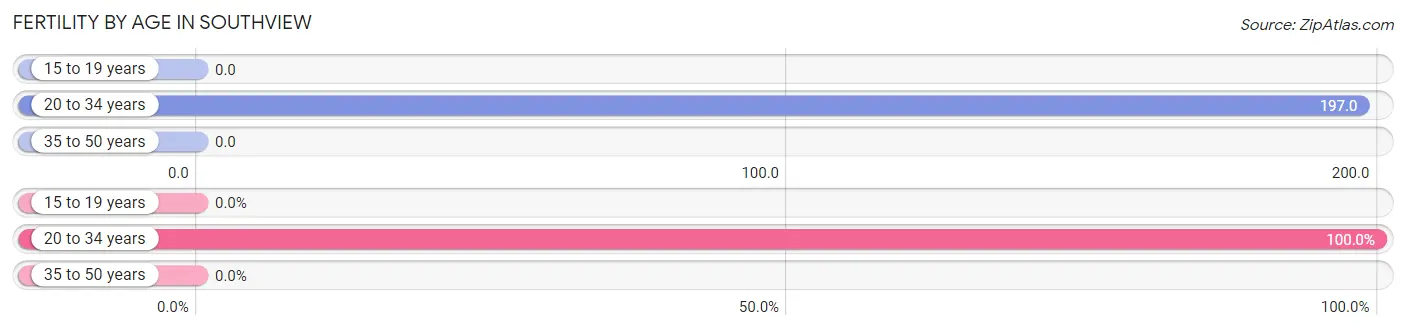
| Age Bracket | Women with Births | Births / 1,000 Women |
| 15 to 19 years | 0 (0.0%) | 0.0 |
| 20 to 34 years | 15 (100.0%) | 197.0 |
| 35 to 50 years | 0 (0.0%) | 0.0 |
| Total | 15 (100.0%) | 99.0 |
Fertility by Age by Marriage Status in Southview
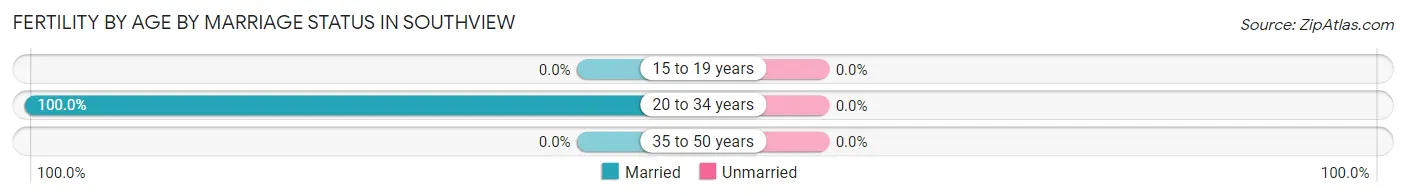
| Age Bracket | Married | Unmarried |
| 15 to 19 years | 0 (0.0%) | 0 (0.0%) |
| 20 to 34 years | 15 (100.0%) | 0 (0.0%) |
| 35 to 50 years | 0 (0.0%) | 0 (0.0%) |
| Total | 15 (100.0%) | 0 (0.0%) |
Fertility by Education in Southview
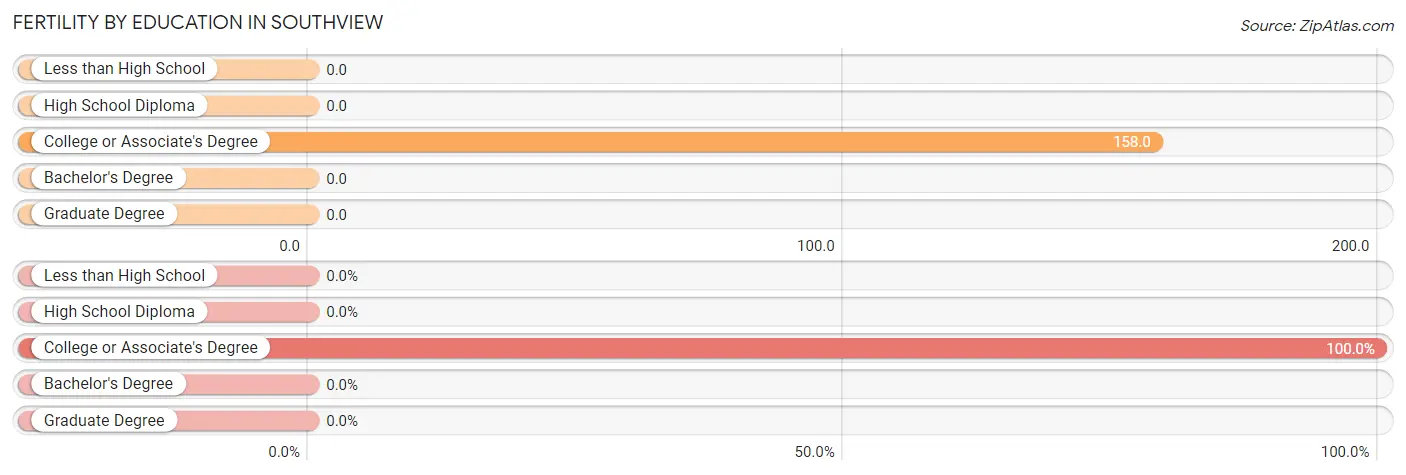
| Educational Attainment | Women with Births | Births / 1,000 Women |
| Less than High School | 0 (0.0%) | 0.0 |
| High School Diploma | 0 (0.0%) | 0.0 |
| College or Associate's Degree | 15 (100.0%) | 158.0 |
| Bachelor's Degree | 0 (0.0%) | 0.0 |
| Graduate Degree | 0 (0.0%) | 0.0 |
| Total | 15 (100.0%) | 99.0 |
Fertility by Education by Marriage Status in Southview
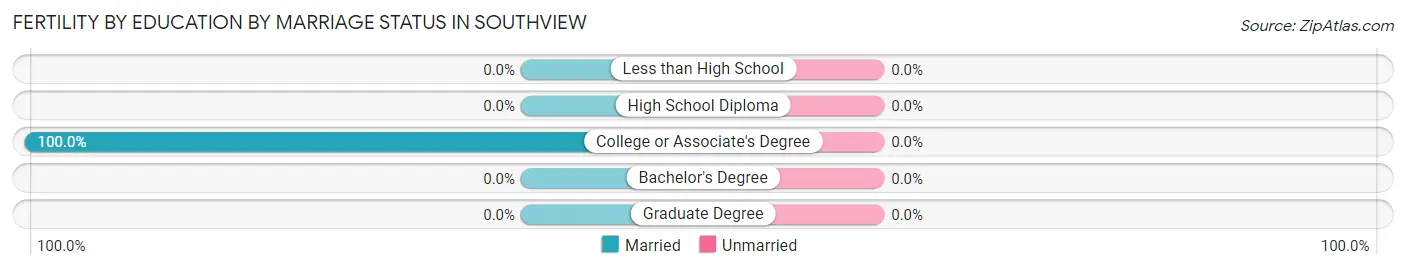
| Educational Attainment | Married | Unmarried |
| Less than High School | 0 (0.0%) | 0 (0.0%) |
| High School Diploma | 0 (0.0%) | 0 (0.0%) |
| College or Associate's Degree | 15 (100.0%) | 0 (0.0%) |
| Bachelor's Degree | 0 (0.0%) | 0 (0.0%) |
| Graduate Degree | 0 (0.0%) | 0 (0.0%) |
| Total | 15 (100.0%) | 0 (0.0%) |
Employment Characteristics in Southview
Employment by Class of Employer in Southview
Among the 173 employed individuals in Southview, private company employees (77 | 44.5%), self-employed (not incorporated) (37 | 21.4%), and self-employed (incorporated) (35 | 20.2%) make up the most common classes of employment.
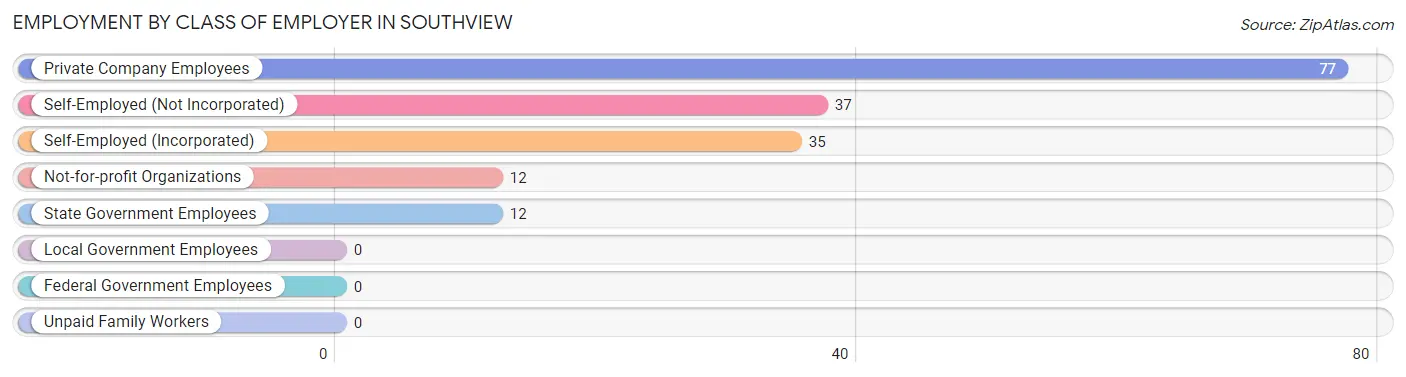
| Employer Class | # Employees | % Employees |
| Private Company Employees | 77 | 44.5% |
| Self-Employed (Incorporated) | 35 | 20.2% |
| Self-Employed (Not Incorporated) | 37 | 21.4% |
| Not-for-profit Organizations | 12 | 6.9% |
| Local Government Employees | 0 | 0.0% |
| State Government Employees | 12 | 6.9% |
| Federal Government Employees | 0 | 0.0% |
| Unpaid Family Workers | 0 | 0.0% |
| Total | 173 | 100.0% |
Employment Status by Age in Southview
According to the labor force statistics for Southview, out of the total population over 16 years of age (310), 64.2% or 199 individuals are in the labor force, with 13.1% or 26 of them unemployed. The age group with the highest labor force participation rate is 25 to 29 years, with 100.0% or 30 individuals in the labor force. Within the labor force, the 25 to 29 years age range has the highest percentage of unemployed individuals, with 50.0% or 15 of them being unemployed.
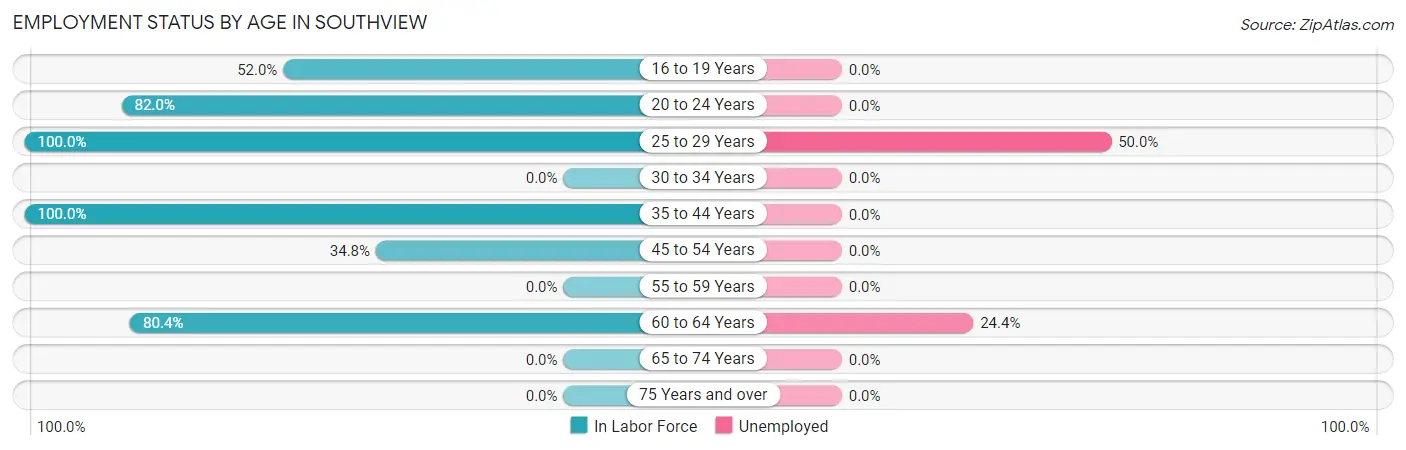
| Age Bracket | In Labor Force | Unemployed |
| 16 to 19 Years | 13 (52.0%) | 0 (0.0%) |
| 20 to 24 Years | 50 (82.0%) | 0 (0.0%) |
| 25 to 29 Years | 30 (100.0%) | 15 (50.0%) |
| 30 to 34 Years | 0 (0.0%) | 0 (0.0%) |
| 35 to 44 Years | 38 (100.0%) | 0 (0.0%) |
| 45 to 54 Years | 23 (34.8%) | 0 (0.0%) |
| 55 to 59 Years | 0 (0.0%) | 0 (0.0%) |
| 60 to 64 Years | 45 (80.4%) | 11 (24.4%) |
| 65 to 74 Years | 0 (0.0%) | 0 (0.0%) |
| 75 Years and over | 0 (0.0%) | 0 (0.0%) |
| Total | 199 (64.2%) | 26 (13.1%) |
Employment Status by Educational Attainment in Southview
According to labor force statistics for Southview, 71.6% of individuals (136) out of the total population between 25 and 64 years of age (190) are in the labor force, with 19.1% or 26 of them being unemployed. The group with the highest labor force participation rate are those with the educational attainment of high school diploma, with 100.0% or 49 individuals in the labor force. Within the labor force, individuals with college / associate degree education have the highest percentage of unemployment, with 28.3% or 15 of them being unemployed.
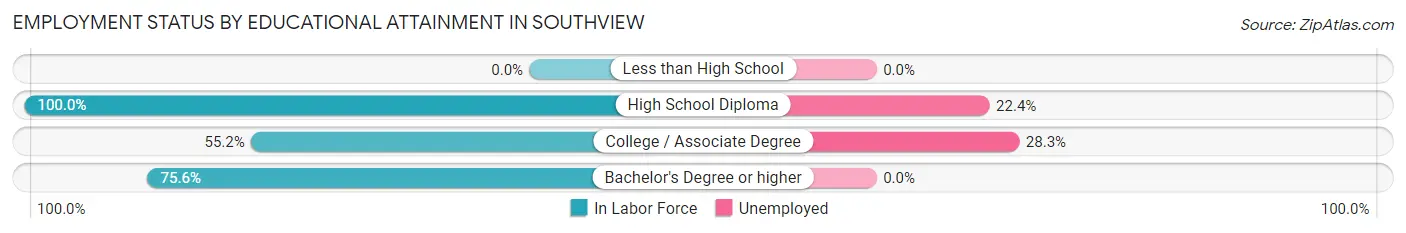
| Educational Attainment | In Labor Force | Unemployed |
| Less than High School | 0 (0.0%) | 0 (0.0%) |
| High School Diploma | 49 (100.0%) | 11 (22.4%) |
| College / Associate Degree | 53 (55.2%) | 27 (28.3%) |
| Bachelor's Degree or higher | 34 (75.6%) | 0 (0.0%) |
| Total | 136 (71.6%) | 36 (19.1%) |
Employment Occupations by Sex in Southview
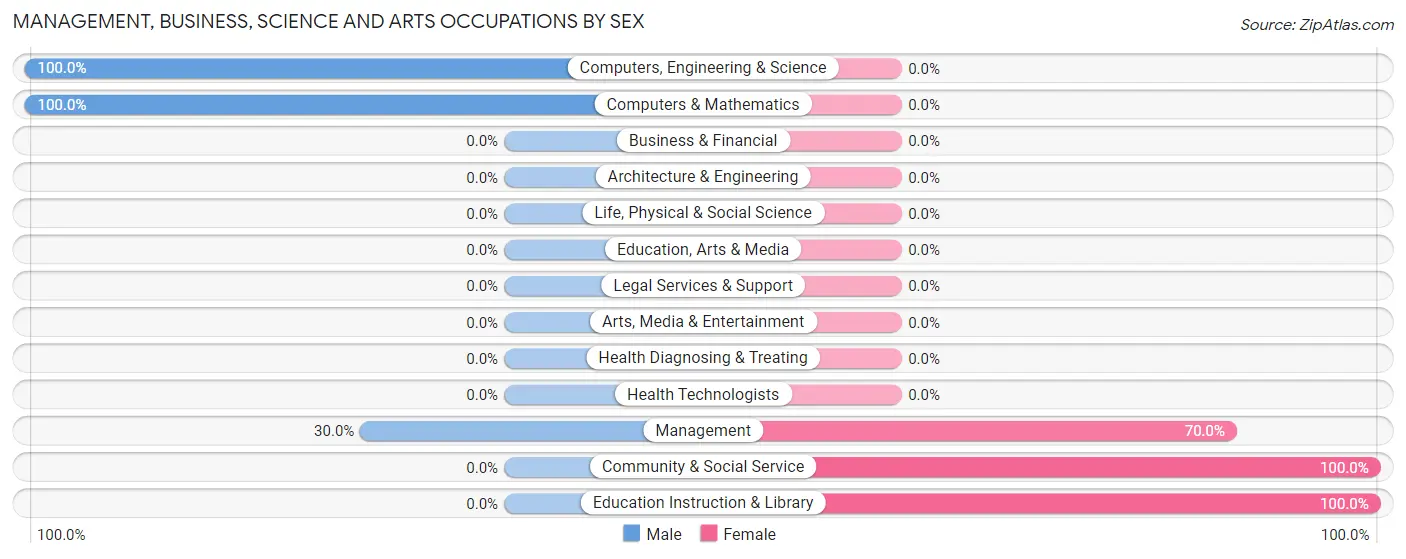
Management, Business, Science and Arts Occupations
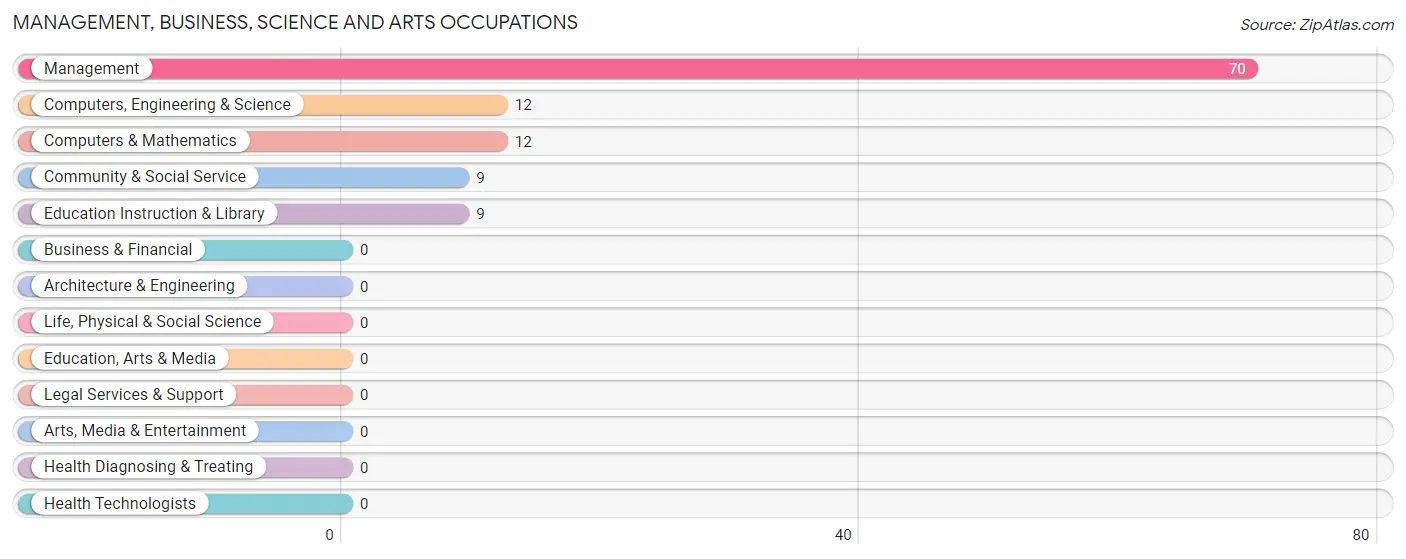
The most common Management, Business, Science and Arts occupations in Southview are Management (70 | 40.5%), Computers, Engineering & Science (12 | 6.9%), Computers & Mathematics (12 | 6.9%), Community & Social Service (9 | 5.2%), and Education Instruction & Library (9 | 5.2%).
Management, Business, Science and Arts Occupations by Sex
Within the Management, Business, Science and Arts occupations in Southview, the most male-oriented occupations are Computers, Engineering & Science (100.0%), Computers & Mathematics (100.0%), and Management (30.0%), while the most female-oriented occupations are Community & Social Service (100.0%), Education Instruction & Library (100.0%), and Management (70.0%).
| Occupation | Male | Female |
| Management | 21 (30.0%) | 49 (70.0%) |
| Business & Financial | 0 (0.0%) | 0 (0.0%) |
| Computers, Engineering & Science | 12 (100.0%) | 0 (0.0%) |
| Computers & Mathematics | 12 (100.0%) | 0 (0.0%) |
| Architecture & Engineering | 0 (0.0%) | 0 (0.0%) |
| Life, Physical & Social Science | 0 (0.0%) | 0 (0.0%) |
| Community & Social Service | 0 (0.0%) | 9 (100.0%) |
| Education, Arts & Media | 0 (0.0%) | 0 (0.0%) |
| Legal Services & Support | 0 (0.0%) | 0 (0.0%) |
| Education Instruction & Library | 0 (0.0%) | 9 (100.0%) |
| Arts, Media & Entertainment | 0 (0.0%) | 0 (0.0%) |
| Health Diagnosing & Treating | 0 (0.0%) | 0 (0.0%) |
| Health Technologists | 0 (0.0%) | 0 (0.0%) |
| Total (Category) | 33 (36.3%) | 58 (63.7%) |
| Total (Overall) | 68 (39.3%) | 105 (60.7%) |
Services Occupations
Services Occupations by Sex
| Occupation | Male | Female |
| Healthcare Support | 0 (0.0%) | 0 (0.0%) |
| Security & Protection | 0 (0.0%) | 0 (0.0%) |
| Firefighting & Prevention | 0 (0.0%) | 0 (0.0%) |
| Law Enforcement | 0 (0.0%) | 0 (0.0%) |
| Food Preparation & Serving | 0 (0.0%) | 0 (0.0%) |
| Cleaning & Maintenance | 0 (0.0%) | 0 (0.0%) |
| Personal Care & Service | 0 (0.0%) | 0 (0.0%) |
| Total (Category) | 0 (0.0%) | 0 (0.0%) |
| Total (Overall) | 68 (39.3%) | 105 (60.7%) |
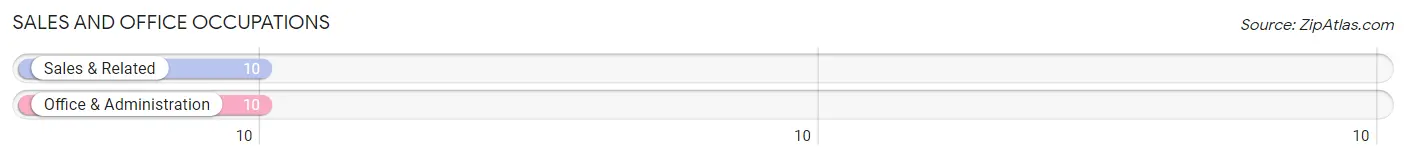
Sales and Office Occupations
The most common Sales and Office occupations in Southview are Sales & Related (10 | 5.8%), and Office & Administration (10 | 5.8%).
Sales and Office Occupations by Sex
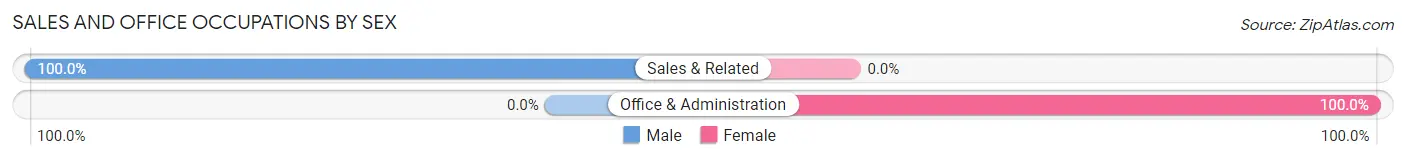
| Occupation | Male | Female |
| Sales & Related | 10 (100.0%) | 0 (0.0%) |
| Office & Administration | 0 (0.0%) | 10 (100.0%) |
| Total (Category) | 10 (50.0%) | 10 (50.0%) |
| Total (Overall) | 68 (39.3%) | 105 (60.7%) |
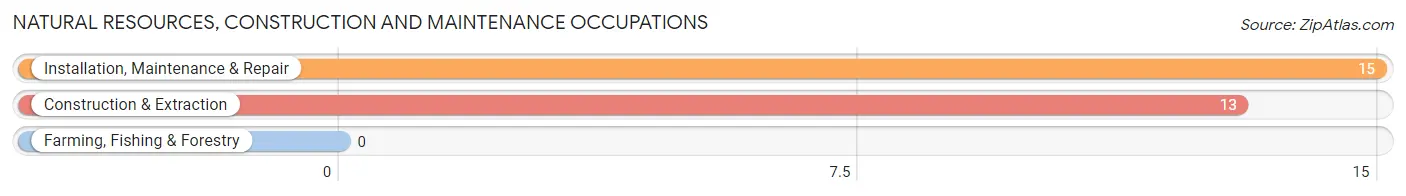
Natural Resources, Construction and Maintenance Occupations
The most common Natural Resources, Construction and Maintenance occupations in Southview are Installation, Maintenance & Repair (15 | 8.7%), and Construction & Extraction (13 | 7.5%).
Natural Resources, Construction and Maintenance Occupations by Sex
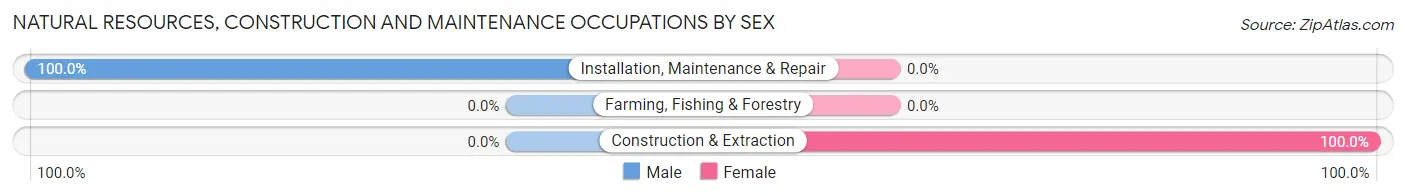
| Occupation | Male | Female |
| Farming, Fishing & Forestry | 0 (0.0%) | 0 (0.0%) |
| Construction & Extraction | 0 (0.0%) | 13 (100.0%) |
| Installation, Maintenance & Repair | 15 (100.0%) | 0 (0.0%) |
| Total (Category) | 15 (53.6%) | 13 (46.4%) |
| Total (Overall) | 68 (39.3%) | 105 (60.7%) |
Production, Transportation and Moving Occupations
The most common Production, Transportation and Moving occupations in Southview are Material Moving (23 | 13.3%), and Production (11 | 6.4%).
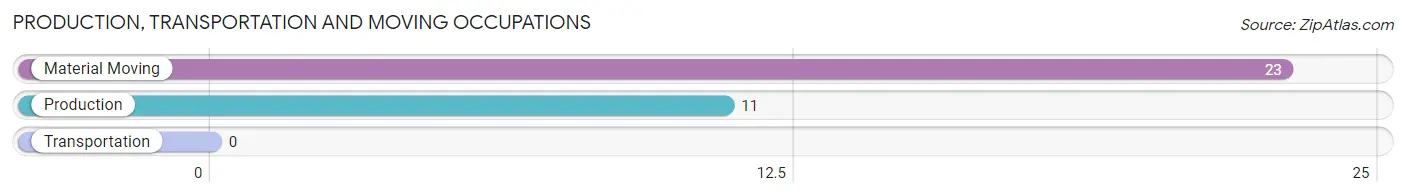
Production, Transportation and Moving Occupations by Sex
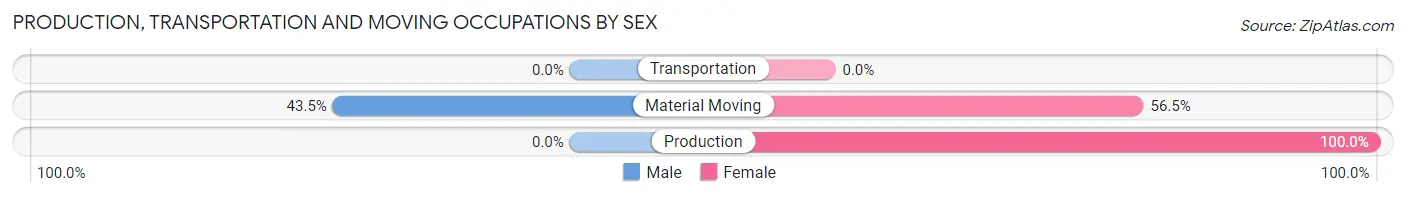
| Occupation | Male | Female |
| Production | 0 (0.0%) | 11 (100.0%) |
| Transportation | 0 (0.0%) | 0 (0.0%) |
| Material Moving | 10 (43.5%) | 13 (56.5%) |
| Total (Category) | 10 (29.4%) | 24 (70.6%) |
| Total (Overall) | 68 (39.3%) | 105 (60.7%) |
Employment Industries by Sex in Southview
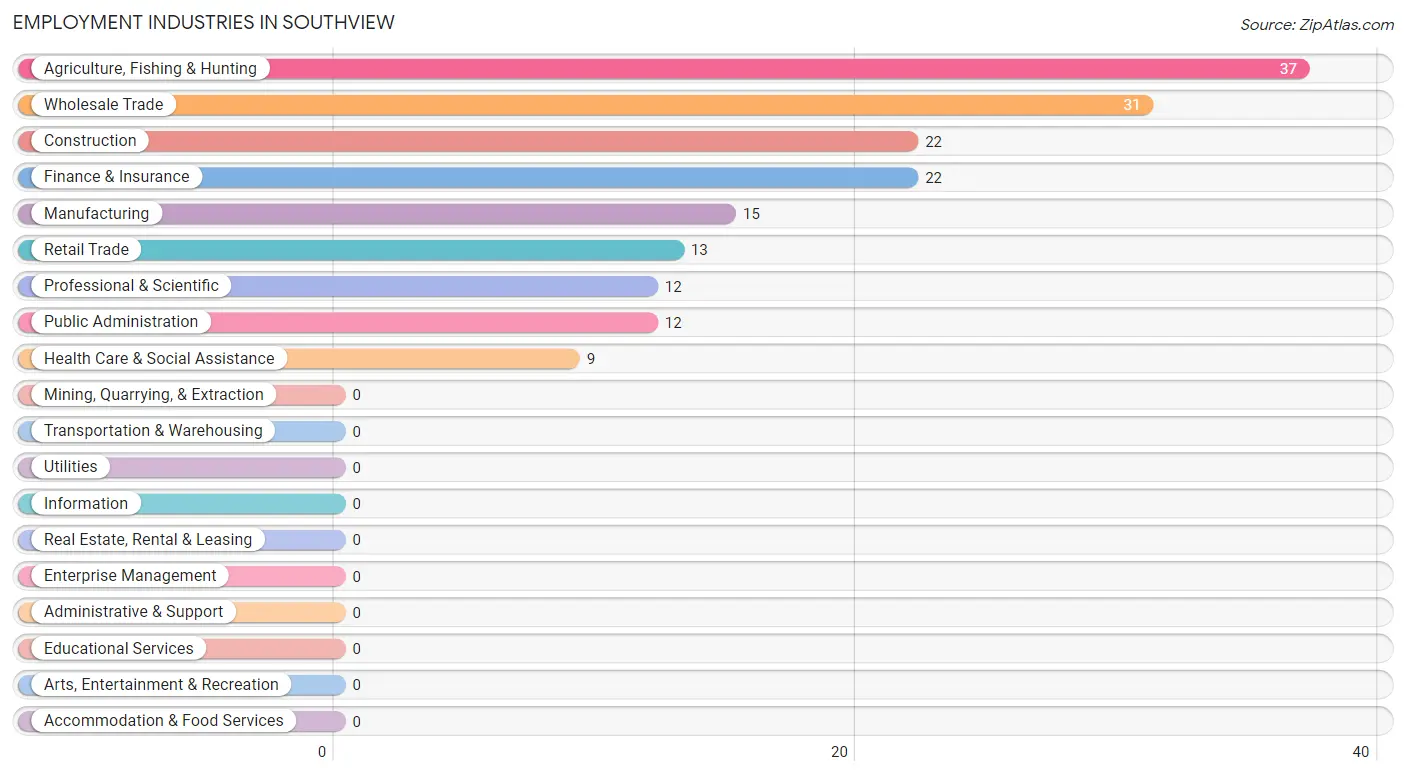
Employment Industries in Southview
The major employment industries in Southview include Agriculture, Fishing & Hunting (37 | 21.4%), Wholesale Trade (31 | 17.9%), Construction (22 | 12.7%), Finance & Insurance (22 | 12.7%), and Manufacturing (15 | 8.7%).
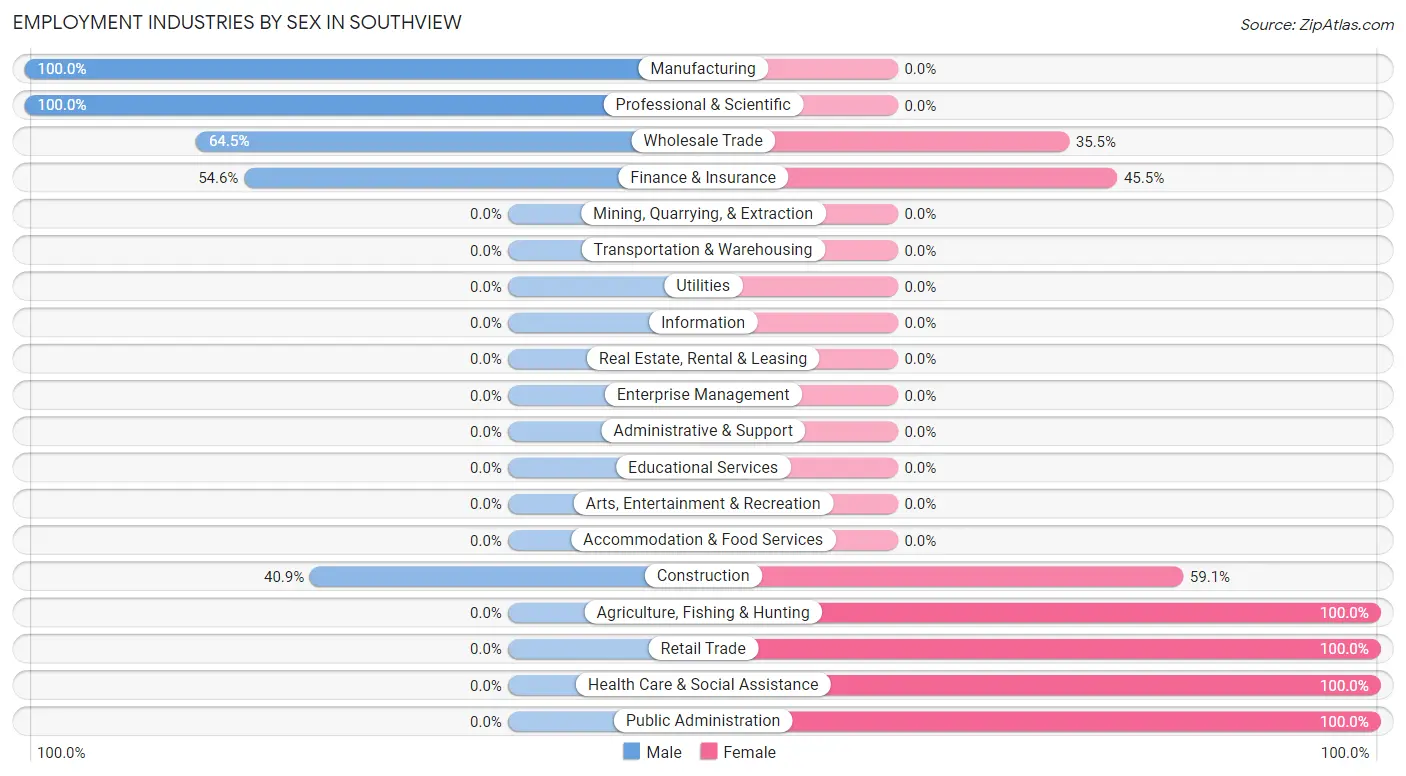
Employment Industries by Sex in Southview
The Southview industries that see more men than women are Manufacturing (100.0%), Professional & Scientific (100.0%), and Wholesale Trade (64.5%), whereas the industries that tend to have a higher number of women are Agriculture, Fishing & Hunting (100.0%), Retail Trade (100.0%), and Health Care & Social Assistance (100.0%).
| Industry | Male | Female |
| Agriculture, Fishing & Hunting | 0 (0.0%) | 37 (100.0%) |
| Mining, Quarrying, & Extraction | 0 (0.0%) | 0 (0.0%) |
| Construction | 9 (40.9%) | 13 (59.1%) |
| Manufacturing | 15 (100.0%) | 0 (0.0%) |
| Wholesale Trade | 20 (64.5%) | 11 (35.5%) |
| Retail Trade | 0 (0.0%) | 13 (100.0%) |
| Transportation & Warehousing | 0 (0.0%) | 0 (0.0%) |
| Utilities | 0 (0.0%) | 0 (0.0%) |
| Information | 0 (0.0%) | 0 (0.0%) |
| Finance & Insurance | 12 (54.5%) | 10 (45.5%) |
| Real Estate, Rental & Leasing | 0 (0.0%) | 0 (0.0%) |
| Professional & Scientific | 12 (100.0%) | 0 (0.0%) |
| Enterprise Management | 0 (0.0%) | 0 (0.0%) |
| Administrative & Support | 0 (0.0%) | 0 (0.0%) |
| Educational Services | 0 (0.0%) | 0 (0.0%) |
| Health Care & Social Assistance | 0 (0.0%) | 9 (100.0%) |
| Arts, Entertainment & Recreation | 0 (0.0%) | 0 (0.0%) |
| Accommodation & Food Services | 0 (0.0%) | 0 (0.0%) |
| Public Administration | 0 (0.0%) | 12 (100.0%) |
| Total | 68 (39.3%) | 105 (60.7%) |
Education in Southview
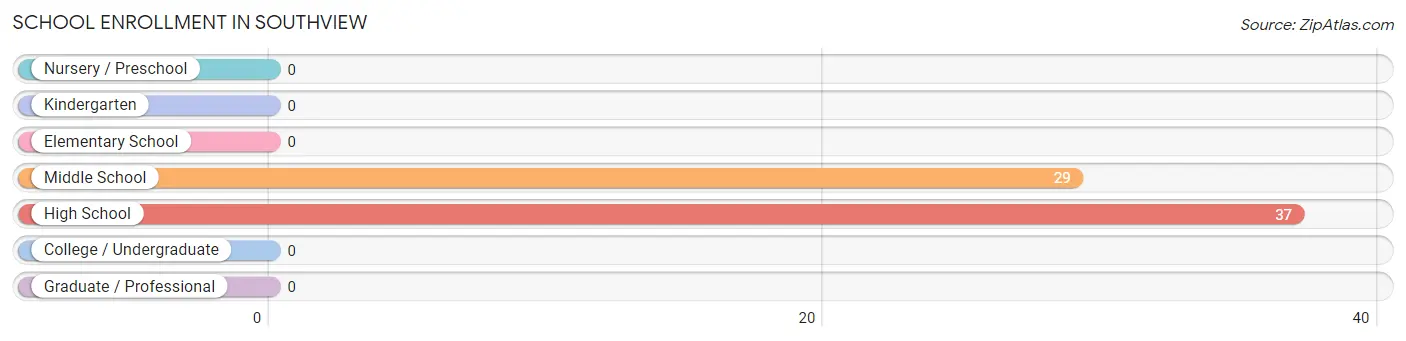
School Enrollment in Southview
The most common levels of schooling among the 66 students in Southview are high school (37 | 56.1%), and middle school (29 | 43.9%).
| School Level | # Students | % Students |
| Nursery / Preschool | 0 | 0.0% |
| Kindergarten | 0 | 0.0% |
| Elementary School | 0 | 0.0% |
| Middle School | 29 | 43.9% |
| High School | 37 | 56.1% |
| College / Undergraduate | 0 | 0.0% |
| Graduate / Professional | 0 | 0.0% |
| Total | 66 | 100.0% |
School Enrollment by Age by Funding Source in Southview
Out of a total of 66 students who are enrolled in schools in Southview, 25 (37.9%) attend a private institution, while the remaining 41 (62.1%) are enrolled in public schools. The age group of 15 to 17 year olds has the highest likelihood of being enrolled in private schools, with 25 (67.6% in the age bracket) enrolled. Conversely, the age group of 10 to 14 year olds has the lowest likelihood of being enrolled in a private school, with 29 (100.0% in the age bracket) attending a public institution.
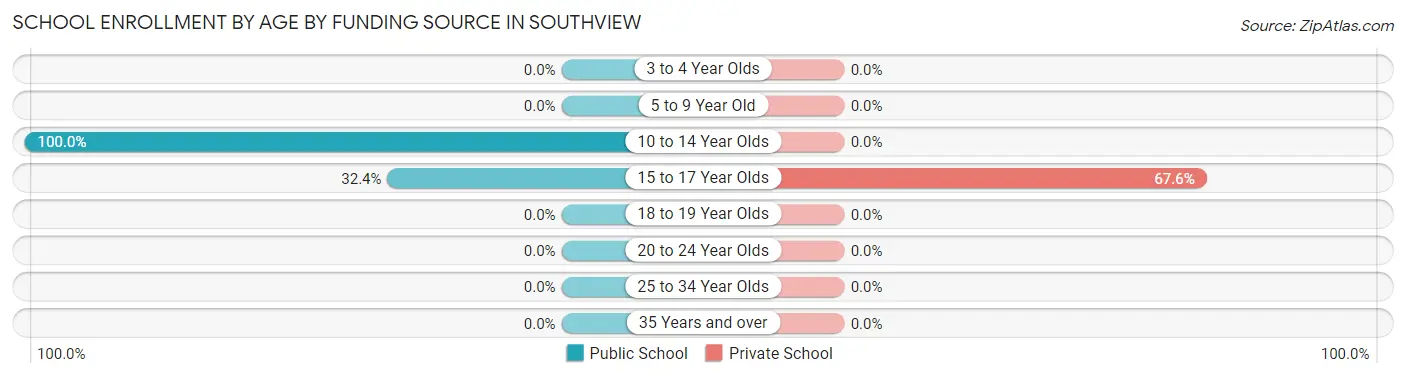
| Age Bracket | Public School | Private School |
| 3 to 4 Year Olds | 0 (0.0%) | 0 (0.0%) |
| 5 to 9 Year Old | 0 (0.0%) | 0 (0.0%) |
| 10 to 14 Year Olds | 29 (100.0%) | 0 (0.0%) |
| 15 to 17 Year Olds | 12 (32.4%) | 25 (67.6%) |
| 18 to 19 Year Olds | 0 (0.0%) | 0 (0.0%) |
| 20 to 24 Year Olds | 0 (0.0%) | 0 (0.0%) |
| 25 to 34 Year Olds | 0 (0.0%) | 0 (0.0%) |
| 35 Years and over | 0 (0.0%) | 0 (0.0%) |
| Total | 41 (62.1%) | 25 (37.9%) |
Educational Attainment by Field of Study in Southview
Computers & mathematics (23 | 51.1%), business (12 | 26.7%), and communications (10 | 22.2%) are the most common fields of study among 45 individuals in Southview who have obtained a bachelor's degree or higher.
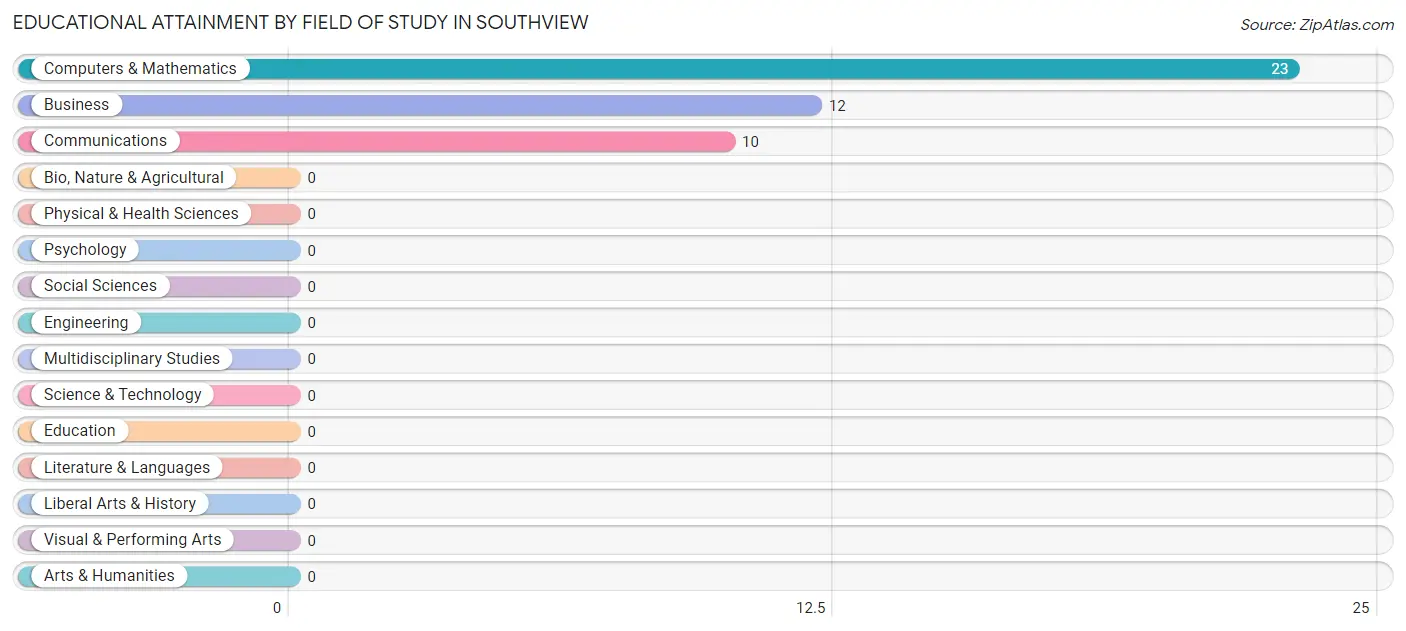
| Field of Study | # Graduates | % Graduates |
| Computers & Mathematics | 23 | 51.1% |
| Bio, Nature & Agricultural | 0 | 0.0% |
| Physical & Health Sciences | 0 | 0.0% |
| Psychology | 0 | 0.0% |
| Social Sciences | 0 | 0.0% |
| Engineering | 0 | 0.0% |
| Multidisciplinary Studies | 0 | 0.0% |
| Science & Technology | 0 | 0.0% |
| Business | 12 | 26.7% |
| Education | 0 | 0.0% |
| Literature & Languages | 0 | 0.0% |
| Liberal Arts & History | 0 | 0.0% |
| Visual & Performing Arts | 0 | 0.0% |
| Communications | 10 | 22.2% |
| Arts & Humanities | 0 | 0.0% |
| Total | 45 | 100.0% |
Transportation & Commute in Southview
Vehicle Availability by Sex in Southview
The most prevalent vehicle ownership categories in Southview are males with 2 vehicles (56, accounting for 82.4%) and females with 2 vehicles (105, making up 53.3%).
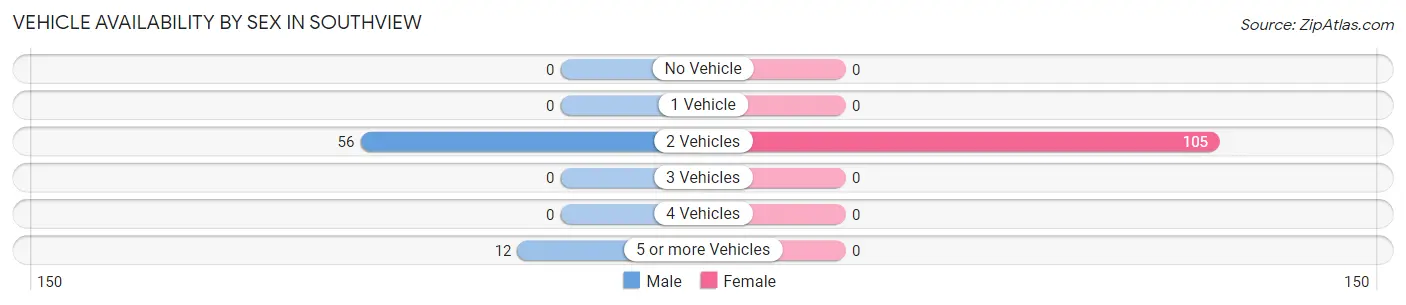
| Vehicles Available | Male | Female |
| No Vehicle | 0 (0.0%) | 0 (0.0%) |
| 1 Vehicle | 0 (0.0%) | 0 (0.0%) |
| 2 Vehicles | 56 (82.4%) | 105 (100.0%) |
| 3 Vehicles | 0 (0.0%) | 0 (0.0%) |
| 4 Vehicles | 0 (0.0%) | 0 (0.0%) |
| 5 or more Vehicles | 12 (17.6%) | 0 (0.0%) |
| Total | 68 (100.0%) | 105 (100.0%) |
Commute Time in Southview
The most frequently occuring commute durations in Southview are 45 to 59 minutes (46 commuters, 26.6%), 15 to 19 minutes (33 commuters, 19.1%), and 30 to 34 minutes (25 commuters, 14.4%).
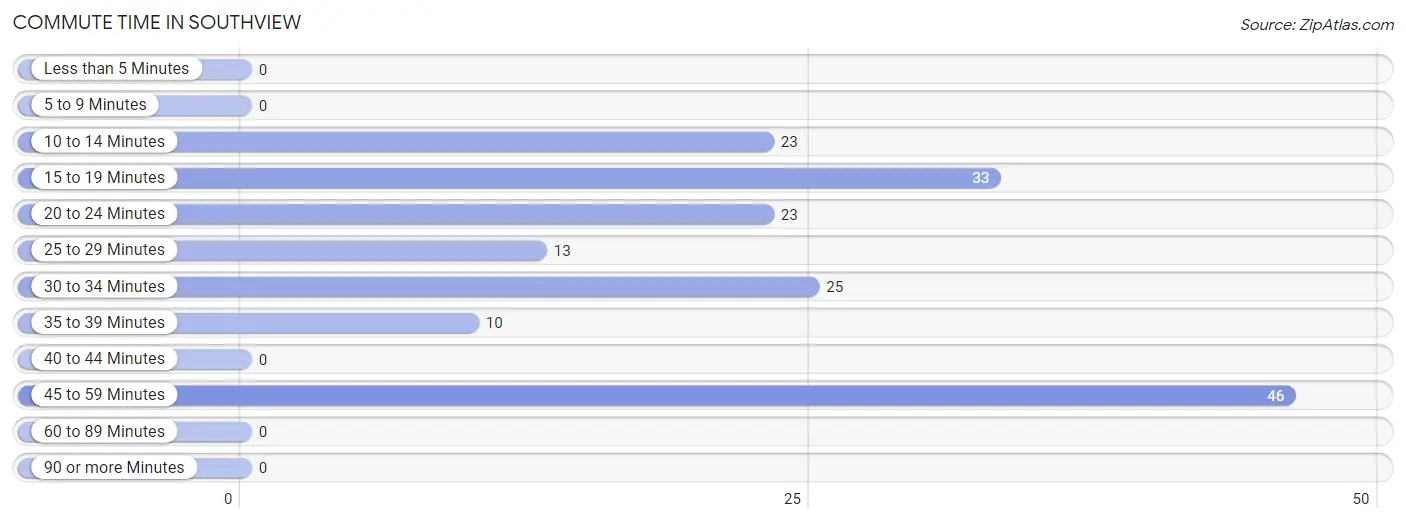
| Commute Time | # Commuters | % Commuters |
| Less than 5 Minutes | 0 | 0.0% |
| 5 to 9 Minutes | 0 | 0.0% |
| 10 to 14 Minutes | 23 | 13.3% |
| 15 to 19 Minutes | 33 | 19.1% |
| 20 to 24 Minutes | 23 | 13.3% |
| 25 to 29 Minutes | 13 | 7.5% |
| 30 to 34 Minutes | 25 | 14.4% |
| 35 to 39 Minutes | 10 | 5.8% |
| 40 to 44 Minutes | 0 | 0.0% |
| 45 to 59 Minutes | 46 | 26.6% |
| 60 to 89 Minutes | 0 | 0.0% |
| 90 or more Minutes | 0 | 0.0% |
Commute Time by Sex in Southview
The most common commute times in Southview are 30 to 34 minutes (25 commuters, 36.8%) for males and 45 to 59 minutes (46 commuters, 43.8%) for females.
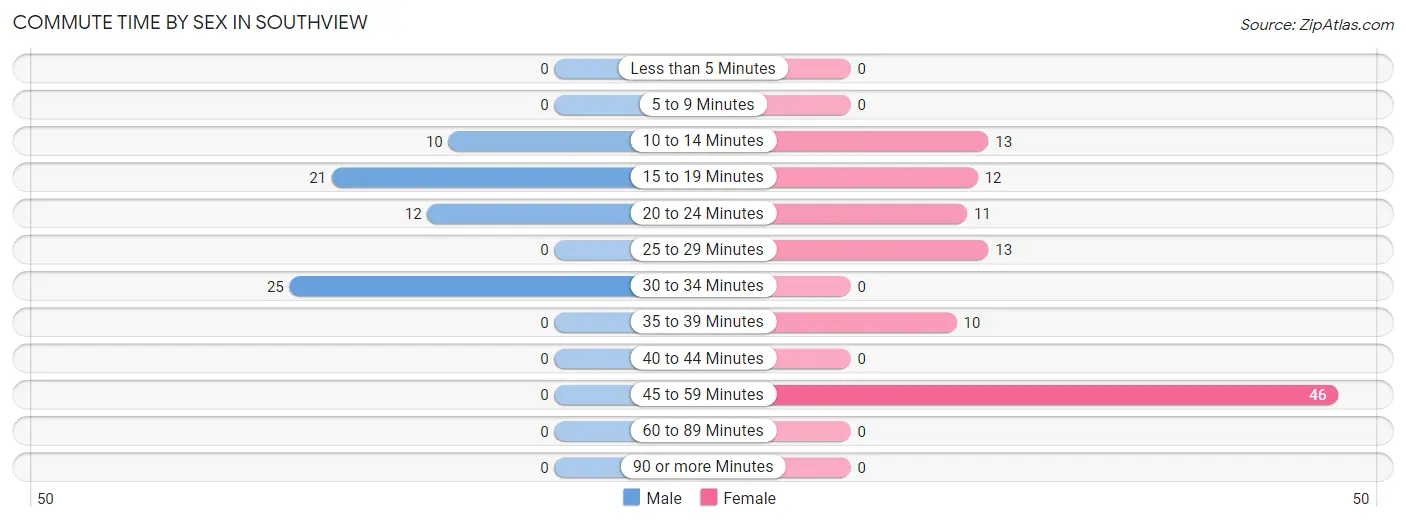
| Commute Time | Male | Female |
| Less than 5 Minutes | 0 (0.0%) | 0 (0.0%) |
| 5 to 9 Minutes | 0 (0.0%) | 0 (0.0%) |
| 10 to 14 Minutes | 10 (14.7%) | 13 (12.4%) |
| 15 to 19 Minutes | 21 (30.9%) | 12 (11.4%) |
| 20 to 24 Minutes | 12 (17.6%) | 11 (10.5%) |
| 25 to 29 Minutes | 0 (0.0%) | 13 (12.4%) |
| 30 to 34 Minutes | 25 (36.8%) | 0 (0.0%) |
| 35 to 39 Minutes | 0 (0.0%) | 10 (9.5%) |
| 40 to 44 Minutes | 0 (0.0%) | 0 (0.0%) |
| 45 to 59 Minutes | 0 (0.0%) | 46 (43.8%) |
| 60 to 89 Minutes | 0 (0.0%) | 0 (0.0%) |
| 90 or more Minutes | 0 (0.0%) | 0 (0.0%) |
Time of Departure to Work by Sex in Southview
The most frequent times of departure to work in Southview are 7:30 AM to 7:59 AM (33, 48.5%) for males and 6:00 AM to 6:29 AM (37, 35.2%) for females.
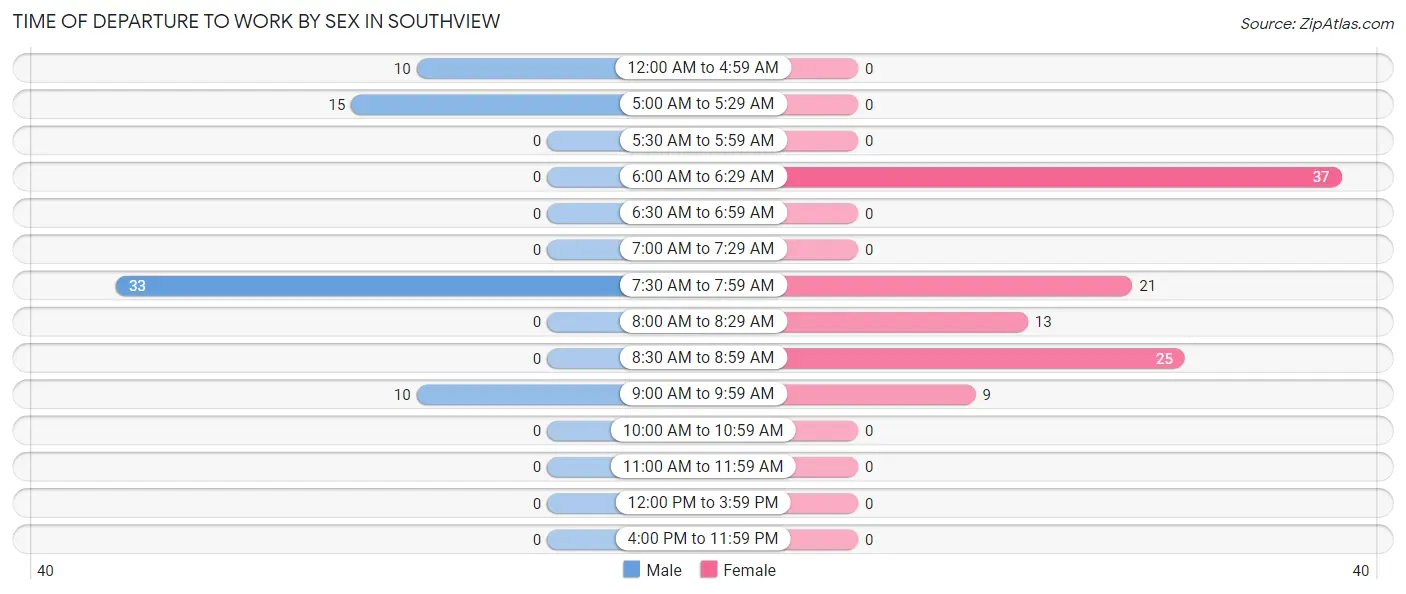
| Time of Departure | Male | Female |
| 12:00 AM to 4:59 AM | 10 (14.7%) | 0 (0.0%) |
| 5:00 AM to 5:29 AM | 15 (22.1%) | 0 (0.0%) |
| 5:30 AM to 5:59 AM | 0 (0.0%) | 0 (0.0%) |
| 6:00 AM to 6:29 AM | 0 (0.0%) | 37 (35.2%) |
| 6:30 AM to 6:59 AM | 0 (0.0%) | 0 (0.0%) |
| 7:00 AM to 7:29 AM | 0 (0.0%) | 0 (0.0%) |
| 7:30 AM to 7:59 AM | 33 (48.5%) | 21 (20.0%) |
| 8:00 AM to 8:29 AM | 0 (0.0%) | 13 (12.4%) |
| 8:30 AM to 8:59 AM | 0 (0.0%) | 25 (23.8%) |
| 9:00 AM to 9:59 AM | 10 (14.7%) | 9 (8.6%) |
| 10:00 AM to 10:59 AM | 0 (0.0%) | 0 (0.0%) |
| 11:00 AM to 11:59 AM | 0 (0.0%) | 0 (0.0%) |
| 12:00 PM to 3:59 PM | 0 (0.0%) | 0 (0.0%) |
| 4:00 PM to 11:59 PM | 0 (0.0%) | 0 (0.0%) |
| Total | 68 (100.0%) | 105 (100.0%) |
Housing Occupancy in Southview
Occupancy by Ownership in Southview
Of the total 124 dwellings in Southview, owner-occupied units account for 92 (74.2%), while renter-occupied units make up 32 (25.8%).
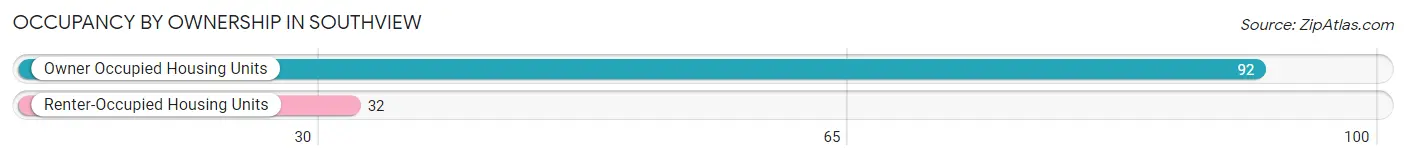
| Occupancy | # Housing Units | % Housing Units |
| Owner Occupied Housing Units | 92 | 74.2% |
| Renter-Occupied Housing Units | 32 | 25.8% |
| Total Occupied Housing Units | 124 | 100.0% |
Occupancy by Household Size in Southview
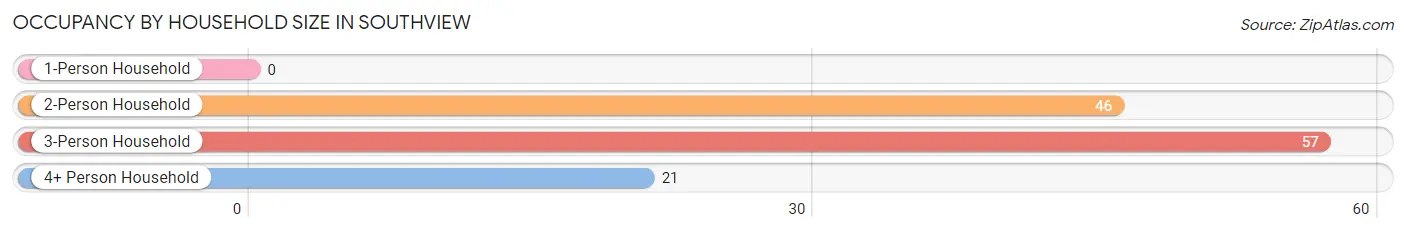
| Household Size | # Housing Units | % Housing Units |
| 1-Person Household | 0 | 0.0% |
| 2-Person Household | 46 | 37.1% |
| 3-Person Household | 57 | 46.0% |
| 4+ Person Household | 21 | 16.9% |
| Total Housing Units | 124 | 100.0% |
Occupancy by Ownership by Household Size in Southview
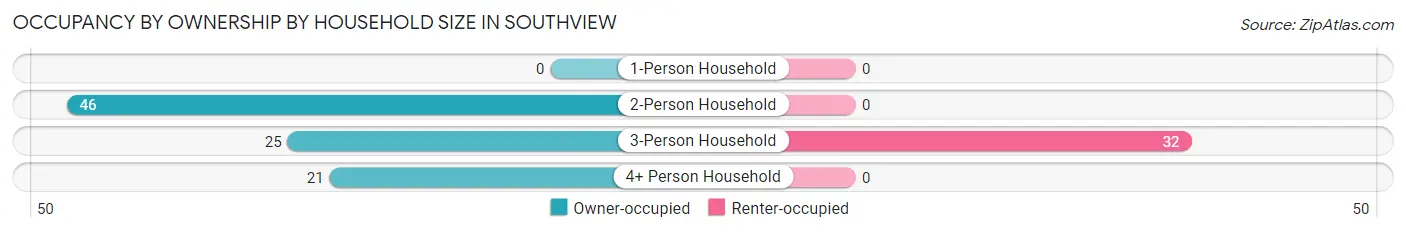
| Household Size | Owner-occupied | Renter-occupied |
| 1-Person Household | 0 (0.0%) | 0 (0.0%) |
| 2-Person Household | 46 (100.0%) | 0 (0.0%) |
| 3-Person Household | 25 (43.9%) | 32 (56.1%) |
| 4+ Person Household | 21 (100.0%) | 0 (0.0%) |
| Total Housing Units | 92 (74.2%) | 32 (25.8%) |
Occupancy by Educational Attainment in Southview
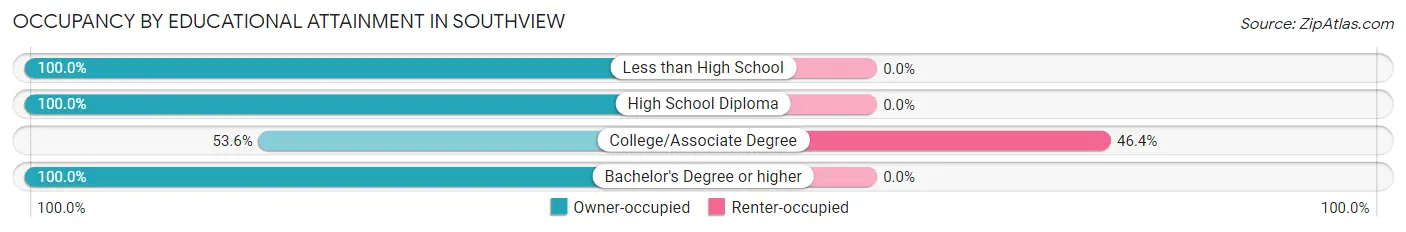
| Household Size | Owner-occupied | Renter-occupied |
| Less than High School | 12 (100.0%) | 0 (0.0%) |
| High School Diploma | 9 (100.0%) | 0 (0.0%) |
| College/Associate Degree | 37 (53.6%) | 32 (46.4%) |
| Bachelor's Degree or higher | 34 (100.0%) | 0 (0.0%) |
Occupancy by Age of Householder in Southview
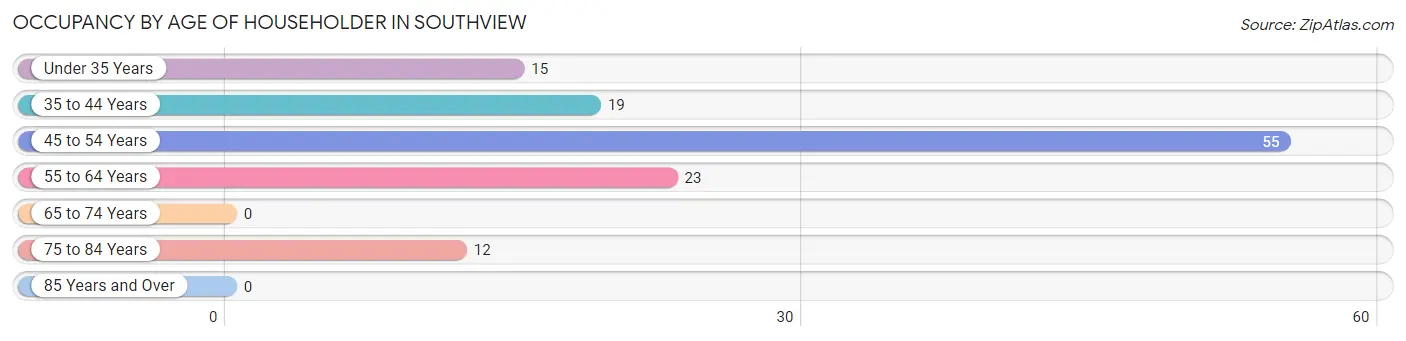
| Age Bracket | # Households | % Households |
| Under 35 Years | 15 | 12.1% |
| 35 to 44 Years | 19 | 15.3% |
| 45 to 54 Years | 55 | 44.4% |
| 55 to 64 Years | 23 | 18.5% |
| 65 to 74 Years | 0 | 0.0% |
| 75 to 84 Years | 12 | 9.7% |
| 85 Years and Over | 0 | 0.0% |
| Total | 124 | 100.0% |
Housing Finances in Southview
Median Income by Occupancy in Southview
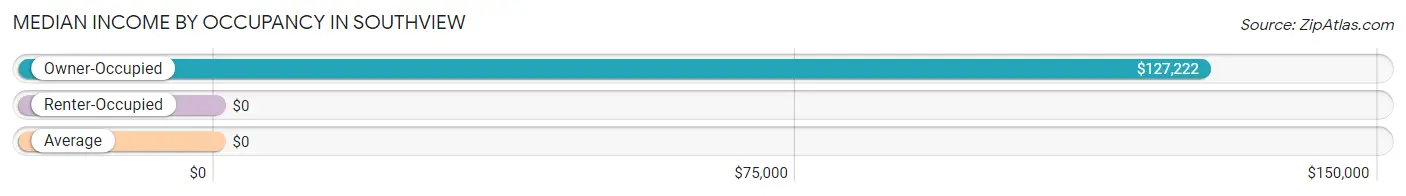
| Occupancy Type | # Households | Median Income |
| Owner-Occupied | 92 (74.2%) | $127,222 |
| Renter-Occupied | 32 (25.8%) | $0 |
| Average | 124 (100.0%) | $0 |
Occupancy by Householder Income Bracket in Southview
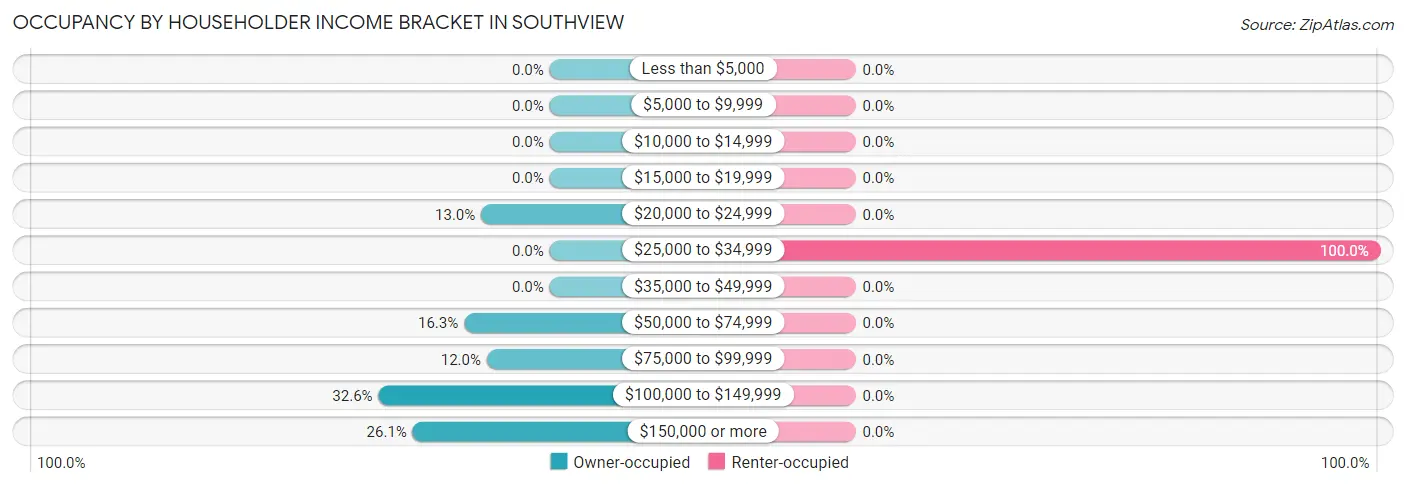
| Income Bracket | Owner-occupied | Renter-occupied |
| Less than $5,000 | 0 (0.0%) | 0 (0.0%) |
| $5,000 to $9,999 | 0 (0.0%) | 0 (0.0%) |
| $10,000 to $14,999 | 0 (0.0%) | 0 (0.0%) |
| $15,000 to $19,999 | 0 (0.0%) | 0 (0.0%) |
| $20,000 to $24,999 | 12 (13.0%) | 0 (0.0%) |
| $25,000 to $34,999 | 0 (0.0%) | 32 (100.0%) |
| $35,000 to $49,999 | 0 (0.0%) | 0 (0.0%) |
| $50,000 to $74,999 | 15 (16.3%) | 0 (0.0%) |
| $75,000 to $99,999 | 11 (12.0%) | 0 (0.0%) |
| $100,000 to $149,999 | 30 (32.6%) | 0 (0.0%) |
| $150,000 or more | 24 (26.1%) | 0 (0.0%) |
| Total | 92 (100.0%) | 32 (100.0%) |
Monthly Housing Cost Tiers in Southview
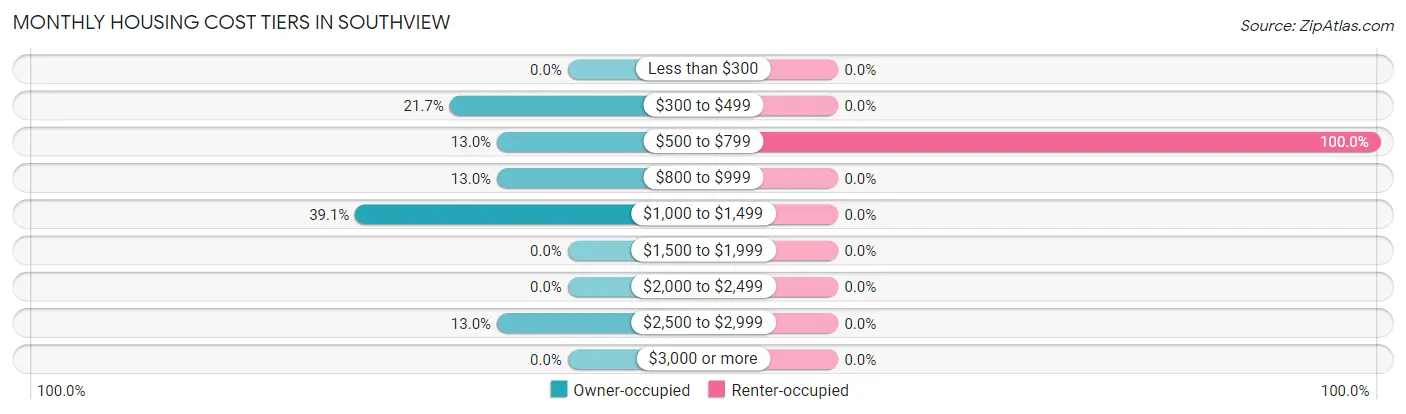
| Monthly Cost | Owner-occupied | Renter-occupied |
| Less than $300 | 0 (0.0%) | 0 (0.0%) |
| $300 to $499 | 20 (21.7%) | 0 (0.0%) |
| $500 to $799 | 12 (13.0%) | 32 (100.0%) |
| $800 to $999 | 12 (13.0%) | 0 (0.0%) |
| $1,000 to $1,499 | 36 (39.1%) | 0 (0.0%) |
| $1,500 to $1,999 | 0 (0.0%) | 0 (0.0%) |
| $2,000 to $2,499 | 0 (0.0%) | 0 (0.0%) |
| $2,500 to $2,999 | 12 (13.0%) | 0 (0.0%) |
| $3,000 or more | 0 (0.0%) | 0 (0.0%) |
| Total | 92 (100.0%) | 32 (100.0%) |
Physical Housing Characteristics in Southview
Housing Structures in Southview
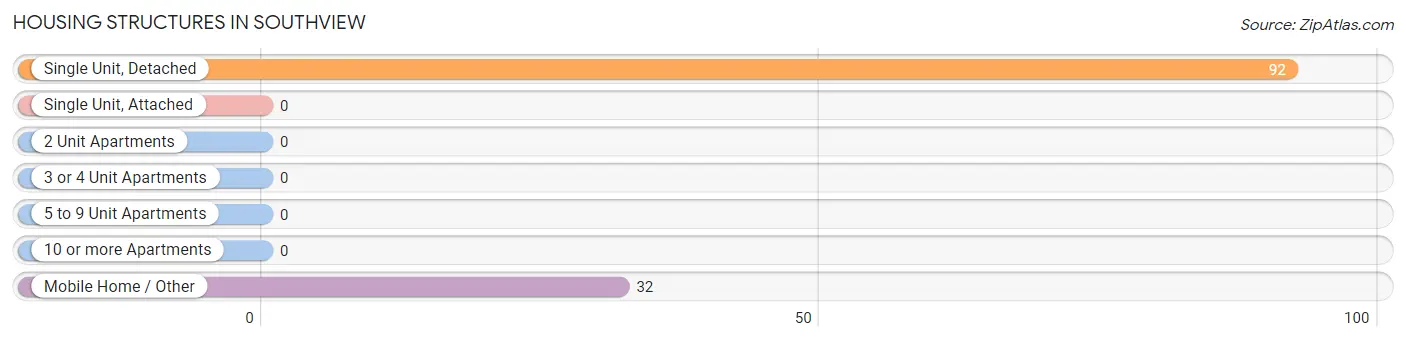
| Structure Type | # Housing Units | % Housing Units |
| Single Unit, Detached | 92 | 74.2% |
| Single Unit, Attached | 0 | 0.0% |
| 2 Unit Apartments | 0 | 0.0% |
| 3 or 4 Unit Apartments | 0 | 0.0% |
| 5 to 9 Unit Apartments | 0 | 0.0% |
| 10 or more Apartments | 0 | 0.0% |
| Mobile Home / Other | 32 | 25.8% |
| Total | 124 | 100.0% |
Housing Structures by Occupancy in Southview
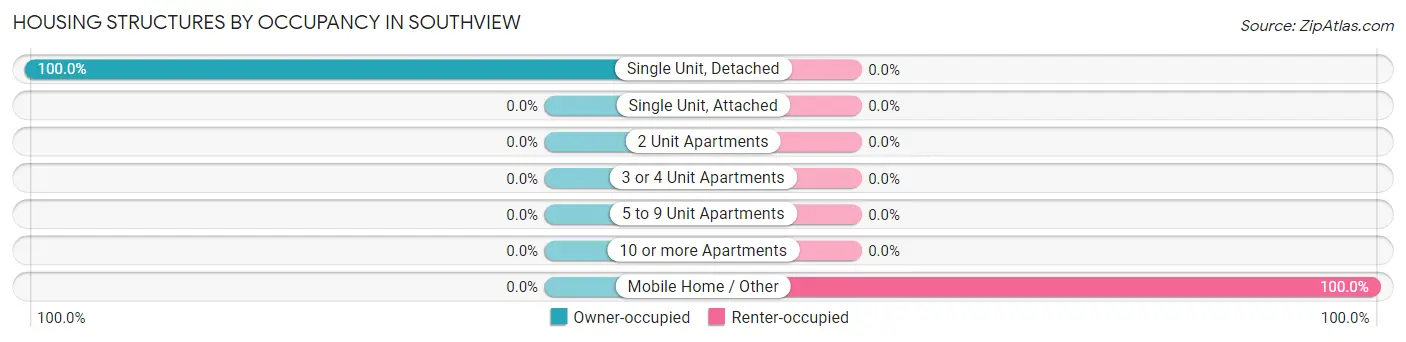
| Structure Type | Owner-occupied | Renter-occupied |
| Single Unit, Detached | 92 (100.0%) | 0 (0.0%) |
| Single Unit, Attached | 0 (0.0%) | 0 (0.0%) |
| 2 Unit Apartments | 0 (0.0%) | 0 (0.0%) |
| 3 or 4 Unit Apartments | 0 (0.0%) | 0 (0.0%) |
| 5 to 9 Unit Apartments | 0 (0.0%) | 0 (0.0%) |
| 10 or more Apartments | 0 (0.0%) | 0 (0.0%) |
| Mobile Home / Other | 0 (0.0%) | 32 (100.0%) |
| Total | 92 (74.2%) | 32 (25.8%) |
Housing Structures by Number of Rooms in Southview
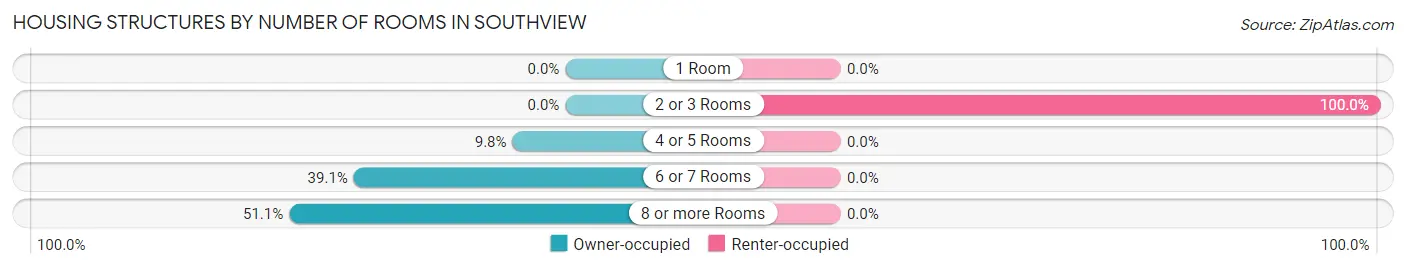
| Number of Rooms | Owner-occupied | Renter-occupied |
| 1 Room | 0 (0.0%) | 0 (0.0%) |
| 2 or 3 Rooms | 0 (0.0%) | 32 (100.0%) |
| 4 or 5 Rooms | 9 (9.8%) | 0 (0.0%) |
| 6 or 7 Rooms | 36 (39.1%) | 0 (0.0%) |
| 8 or more Rooms | 47 (51.1%) | 0 (0.0%) |
| Total | 92 (100.0%) | 32 (100.0%) |
Housing Structure by Heating Type in Southview
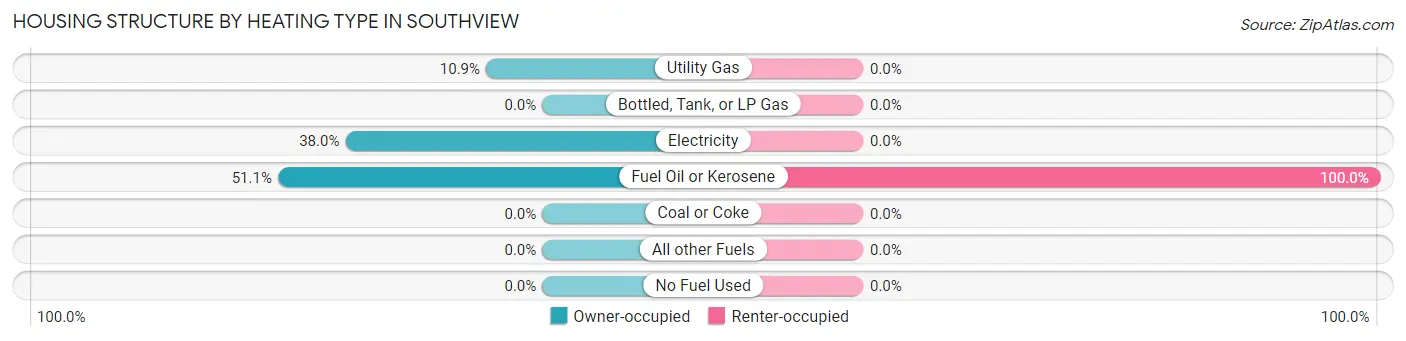
| Heating Type | Owner-occupied | Renter-occupied |
| Utility Gas | 10 (10.9%) | 0 (0.0%) |
| Bottled, Tank, or LP Gas | 0 (0.0%) | 0 (0.0%) |
| Electricity | 35 (38.0%) | 0 (0.0%) |
| Fuel Oil or Kerosene | 47 (51.1%) | 32 (100.0%) |
| Coal or Coke | 0 (0.0%) | 0 (0.0%) |
| All other Fuels | 0 (0.0%) | 0 (0.0%) |
| No Fuel Used | 0 (0.0%) | 0 (0.0%) |
| Total | 92 (100.0%) | 32 (100.0%) |
Household Vehicle Usage in Southview
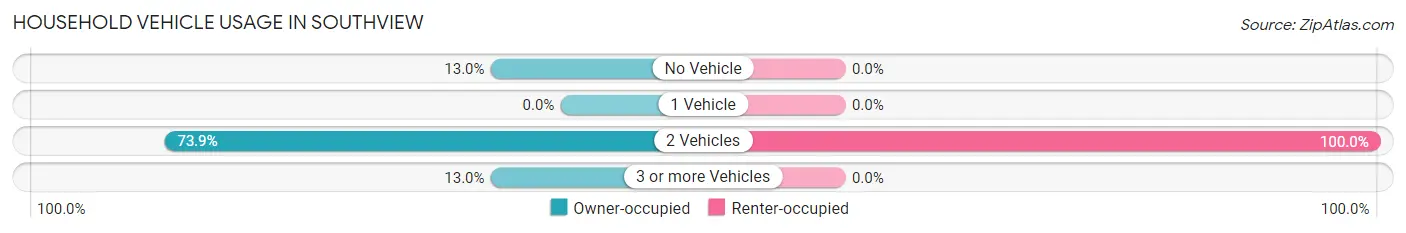
| Vehicles per Household | Owner-occupied | Renter-occupied |
| No Vehicle | 12 (13.0%) | 0 (0.0%) |
| 1 Vehicle | 0 (0.0%) | 0 (0.0%) |
| 2 Vehicles | 68 (73.9%) | 32 (100.0%) |
| 3 or more Vehicles | 12 (13.0%) | 0 (0.0%) |
| Total | 92 (100.0%) | 32 (100.0%) |
Real Estate & Mortgages in Southview
Real Estate and Mortgage Overview in Southview
| Characteristic | Without Mortgage | With Mortgage |
| Housing Units | 32 | 60 |
| Median Property Value | $188,900 | $0 |
| Median Household Income | - | - |
| Monthly Housing Costs | $456 | $0 |
| Real Estate Taxes | - | - |
Property Value by Mortgage Status in Southview
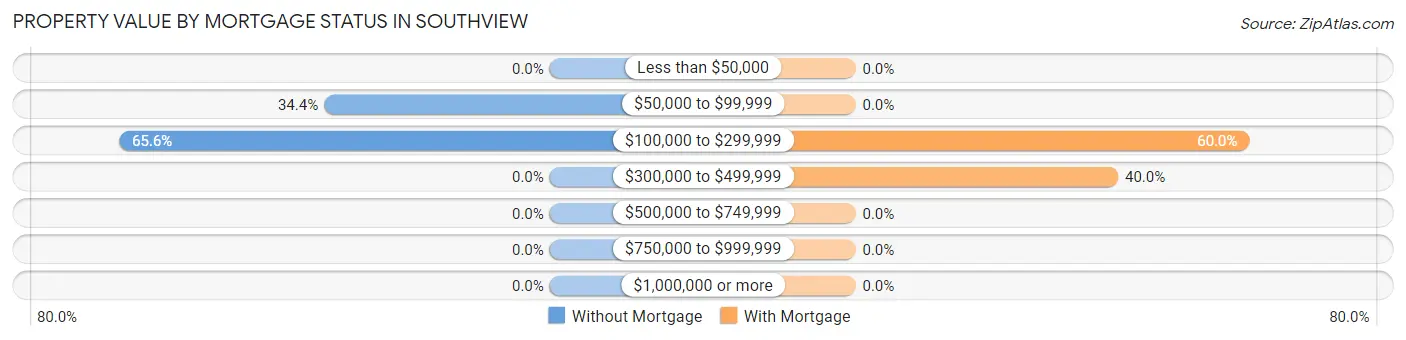
| Property Value | Without Mortgage | With Mortgage |
| Less than $50,000 | 0 (0.0%) | 0 (0.0%) |
| $50,000 to $99,999 | 11 (34.4%) | 0 (0.0%) |
| $100,000 to $299,999 | 21 (65.6%) | 36 (60.0%) |
| $300,000 to $499,999 | 0 (0.0%) | 24 (40.0%) |
| $500,000 to $749,999 | 0 (0.0%) | 0 (0.0%) |
| $750,000 to $999,999 | 0 (0.0%) | 0 (0.0%) |
| $1,000,000 or more | 0 (0.0%) | 0 (0.0%) |
| Total | 32 (100.0%) | 60 (100.0%) |
Household Income by Mortgage Status in Southview
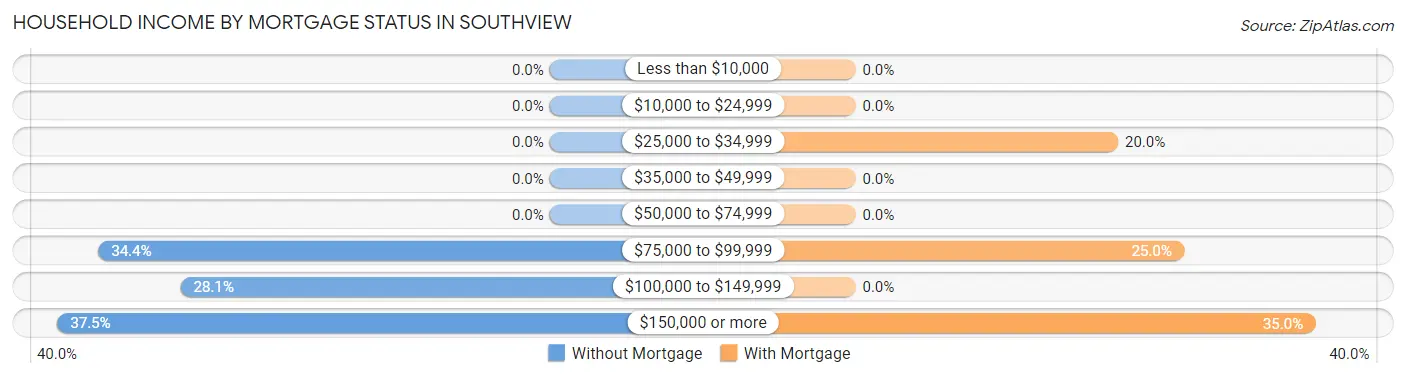
| Household Income | Without Mortgage | With Mortgage |
| Less than $10,000 | 0 (0.0%) | 0 (0.0%) |
| $10,000 to $24,999 | 0 (0.0%) | 0 (0.0%) |
| $25,000 to $34,999 | 0 (0.0%) | 12 (20.0%) |
| $35,000 to $49,999 | 0 (0.0%) | 0 (0.0%) |
| $50,000 to $74,999 | 0 (0.0%) | 0 (0.0%) |
| $75,000 to $99,999 | 11 (34.4%) | 15 (25.0%) |
| $100,000 to $149,999 | 9 (28.1%) | 0 (0.0%) |
| $150,000 or more | 12 (37.5%) | 21 (35.0%) |
| Total | 32 (100.0%) | 60 (100.0%) |
Property Value to Household Income Ratio in Southview
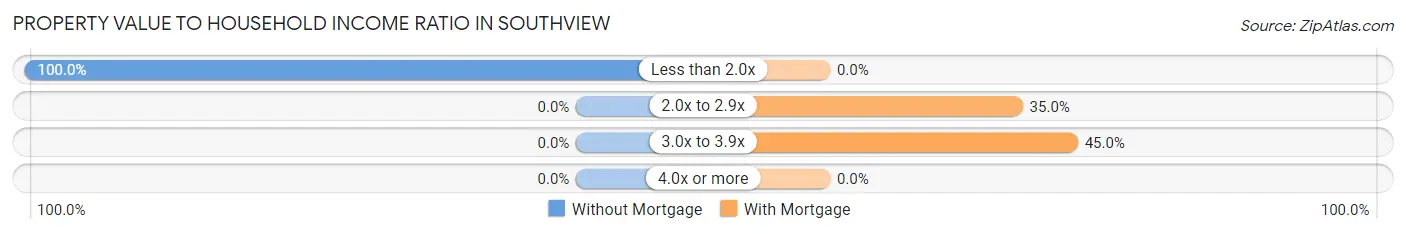
| Value-to-Income Ratio | Without Mortgage | With Mortgage |
| Less than 2.0x | 32 (100.0%) | 0 (0.0%) |
| 2.0x to 2.9x | 0 (0.0%) | 21 (35.0%) |
| 3.0x to 3.9x | 0 (0.0%) | 27 (45.0%) |
| 4.0x or more | 0 (0.0%) | 0 (0.0%) |
| Total | 32 (100.0%) | 60 (100.0%) |
Real Estate Taxes by Mortgage Status in Southview
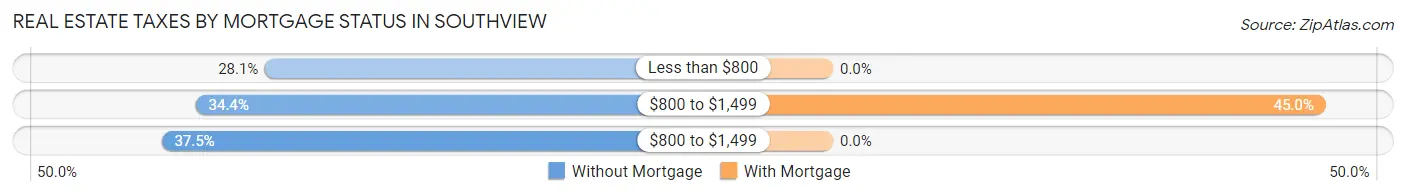
| Property Taxes | Without Mortgage | With Mortgage |
| Less than $800 | 9 (28.1%) | 0 (0.0%) |
| $800 to $1,499 | 11 (34.4%) | 27 (45.0%) |
| $800 to $1,499 | 12 (37.5%) | 0 (0.0%) |
| Total | 32 (100.0%) | 60 (100.0%) |
Health & Disability in Southview
Health Insurance Coverage by Age in Southview
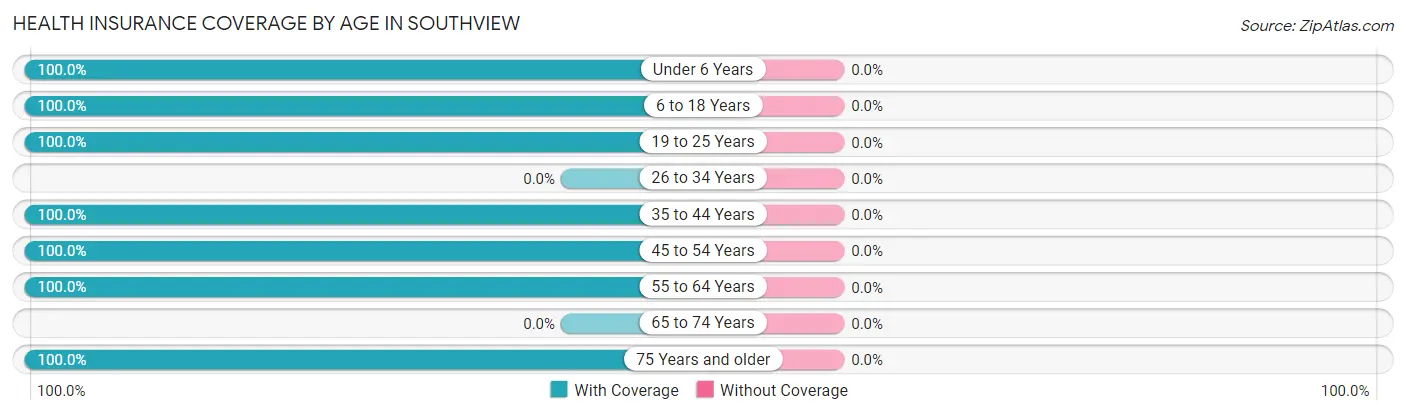
| Age Bracket | With Coverage | Without Coverage |
| Under 6 Years | 13 (100.0%) | 0 (0.0%) |
| 6 to 18 Years | 66 (100.0%) | 0 (0.0%) |
| 19 to 25 Years | 91 (100.0%) | 0 (0.0%) |
| 26 to 34 Years | 0 (0.0%) | 0 (0.0%) |
| 35 to 44 Years | 38 (100.0%) | 0 (0.0%) |
| 45 to 54 Years | 66 (100.0%) | 0 (0.0%) |
| 55 to 64 Years | 56 (100.0%) | 0 (0.0%) |
| 65 to 74 Years | 0 (0.0%) | 0 (0.0%) |
| 75 Years and older | 34 (100.0%) | 0 (0.0%) |
| Total | 364 (100.0%) | 0 (0.0%) |
Health Insurance Coverage by Citizenship Status in Southview
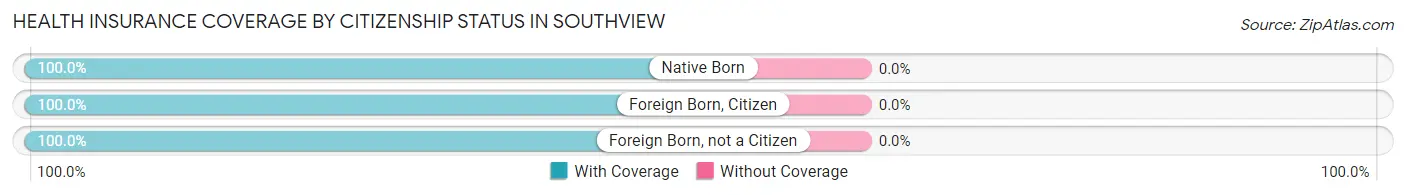
| Citizenship Status | With Coverage | Without Coverage |
| Native Born | 13 (100.0%) | 0 (0.0%) |
| Foreign Born, Citizen | 66 (100.0%) | 0 (0.0%) |
| Foreign Born, not a Citizen | 91 (100.0%) | 0 (0.0%) |
Health Insurance Coverage by Household Income in Southview
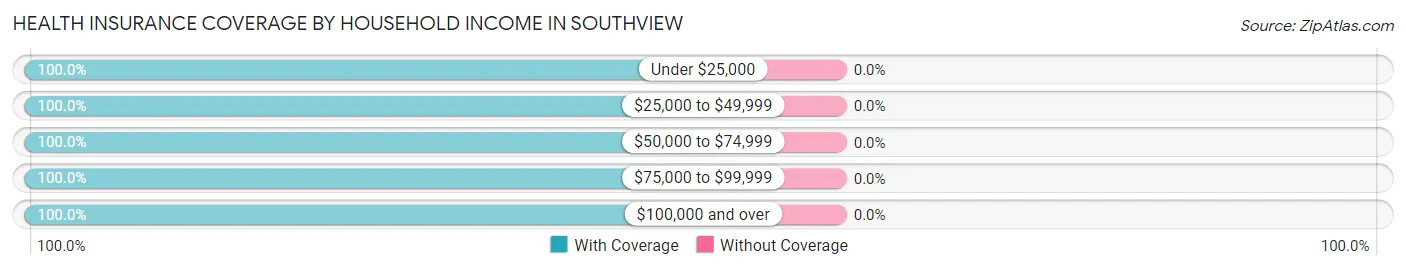
| Household Income | With Coverage | Without Coverage |
| Under $25,000 | 24 (100.0%) | 0 (0.0%) |
| $25,000 to $49,999 | 98 (100.0%) | 0 (0.0%) |
| $50,000 to $74,999 | 43 (100.0%) | 0 (0.0%) |
| $75,000 to $99,999 | 22 (100.0%) | 0 (0.0%) |
| $100,000 and over | 177 (100.0%) | 0 (0.0%) |
Public vs Private Health Insurance Coverage by Age in Southview
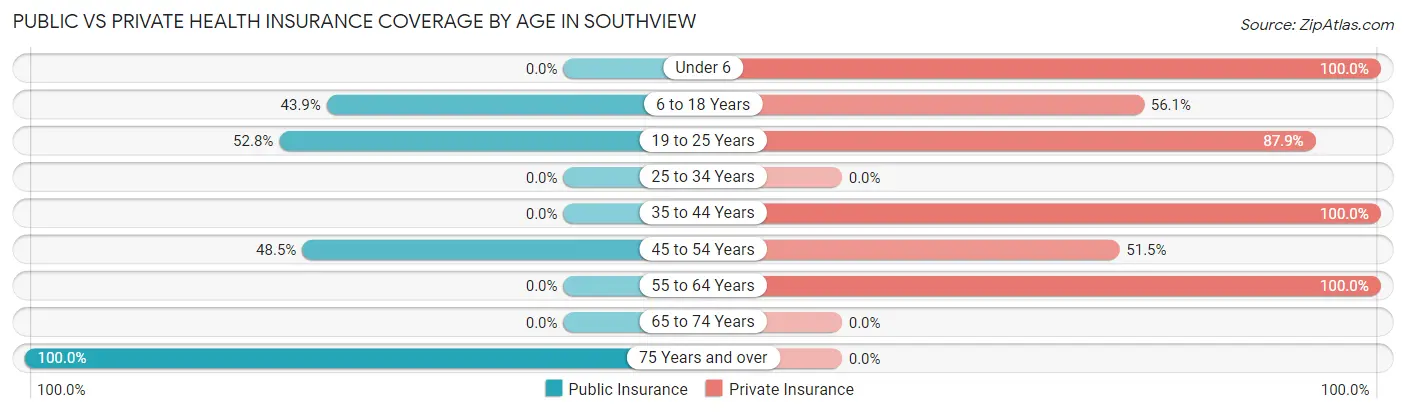
| Age Bracket | Public Insurance | Private Insurance |
| Under 6 | 0 (0.0%) | 13 (100.0%) |
| 6 to 18 Years | 29 (43.9%) | 37 (56.1%) |
| 19 to 25 Years | 48 (52.7%) | 80 (87.9%) |
| 25 to 34 Years | 0 (0.0%) | 0 (0.0%) |
| 35 to 44 Years | 0 (0.0%) | 38 (100.0%) |
| 45 to 54 Years | 32 (48.5%) | 34 (51.5%) |
| 55 to 64 Years | 0 (0.0%) | 56 (100.0%) |
| 65 to 74 Years | 0 (0.0%) | 0 (0.0%) |
| 75 Years and over | 34 (100.0%) | 0 (0.0%) |
| Total | 143 (39.3%) | 258 (70.9%) |
Disability Status by Sex by Age in Southview
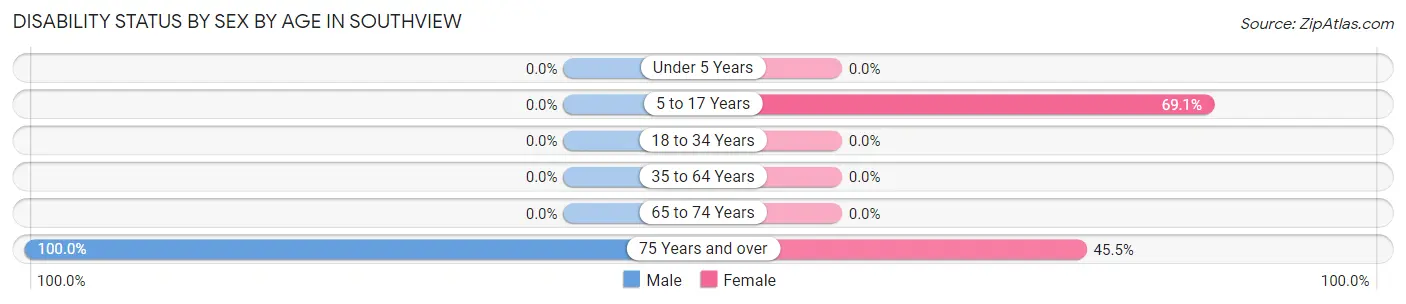
| Age Bracket | Male | Female |
| Under 5 Years | 0 (0.0%) | 0 (0.0%) |
| 5 to 17 Years | 0 (0.0%) | 29 (69.1%) |
| 18 to 34 Years | 0 (0.0%) | 0 (0.0%) |
| 35 to 64 Years | 0 (0.0%) | 0 (0.0%) |
| 65 to 74 Years | 0 (0.0%) | 0 (0.0%) |
| 75 Years and over | 12 (100.0%) | 10 (45.5%) |
Disability Class by Sex by Age in Southview
Disability Class: Hearing Difficulty
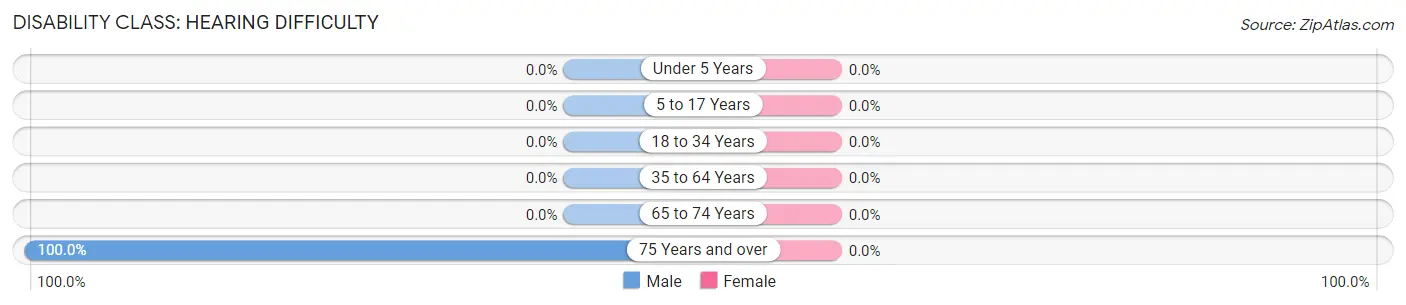
| Age Bracket | Male | Female |
| Under 5 Years | 0 (0.0%) | 0 (0.0%) |
| 5 to 17 Years | 0 (0.0%) | 0 (0.0%) |
| 18 to 34 Years | 0 (0.0%) | 0 (0.0%) |
| 35 to 64 Years | 0 (0.0%) | 0 (0.0%) |
| 65 to 74 Years | 0 (0.0%) | 0 (0.0%) |
| 75 Years and over | 12 (100.0%) | 0 (0.0%) |
Disability Class: Vision Difficulty
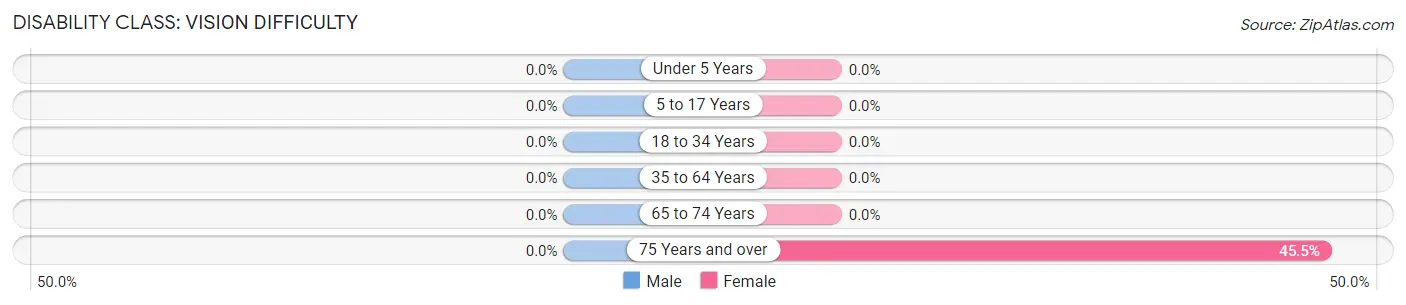
| Age Bracket | Male | Female |
| Under 5 Years | 0 (0.0%) | 0 (0.0%) |
| 5 to 17 Years | 0 (0.0%) | 0 (0.0%) |
| 18 to 34 Years | 0 (0.0%) | 0 (0.0%) |
| 35 to 64 Years | 0 (0.0%) | 0 (0.0%) |
| 65 to 74 Years | 0 (0.0%) | 0 (0.0%) |
| 75 Years and over | 0 (0.0%) | 10 (45.5%) |
Disability Class: Cognitive Difficulty
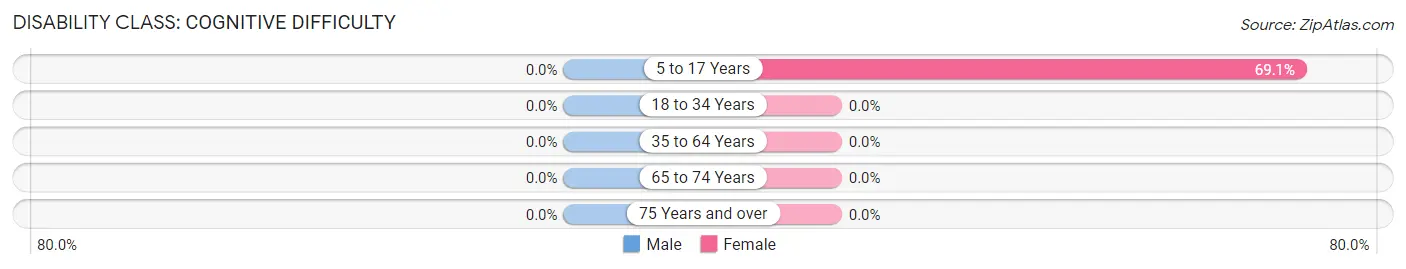
| Age Bracket | Male | Female |
| 5 to 17 Years | 0 (0.0%) | 29 (69.1%) |
| 18 to 34 Years | 0 (0.0%) | 0 (0.0%) |
| 35 to 64 Years | 0 (0.0%) | 0 (0.0%) |
| 65 to 74 Years | 0 (0.0%) | 0 (0.0%) |
| 75 Years and over | 0 (0.0%) | 0 (0.0%) |
Disability Class: Ambulatory Difficulty
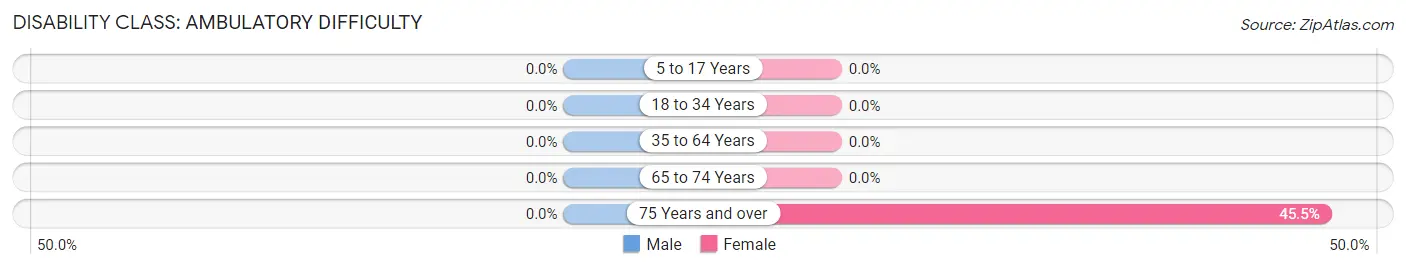
| Age Bracket | Male | Female |
| 5 to 17 Years | 0 (0.0%) | 0 (0.0%) |
| 18 to 34 Years | 0 (0.0%) | 0 (0.0%) |
| 35 to 64 Years | 0 (0.0%) | 0 (0.0%) |
| 65 to 74 Years | 0 (0.0%) | 0 (0.0%) |
| 75 Years and over | 0 (0.0%) | 10 (45.5%) |
Disability Class: Self-Care Difficulty
| Age Bracket | Male | Female |
| 5 to 17 Years | 0 (0.0%) | 0 (0.0%) |
| 18 to 34 Years | 0 (0.0%) | 0 (0.0%) |
| 35 to 64 Years | 0 (0.0%) | 0 (0.0%) |
| 65 to 74 Years | 0 (0.0%) | 0 (0.0%) |
| 75 Years and over | 0 (0.0%) | 0 (0.0%) |
Technology Access in Southview
Computing Device Access in Southview
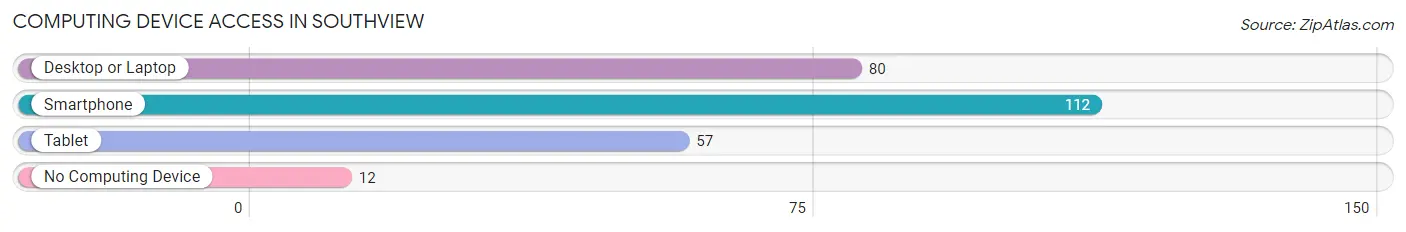
| Device Type | # Households | % Households |
| Desktop or Laptop | 80 | 64.5% |
| Smartphone | 112 | 90.3% |
| Tablet | 57 | 46.0% |
| No Computing Device | 12 | 9.7% |
| Total | 124 | 100.0% |
Internet Access in Southview
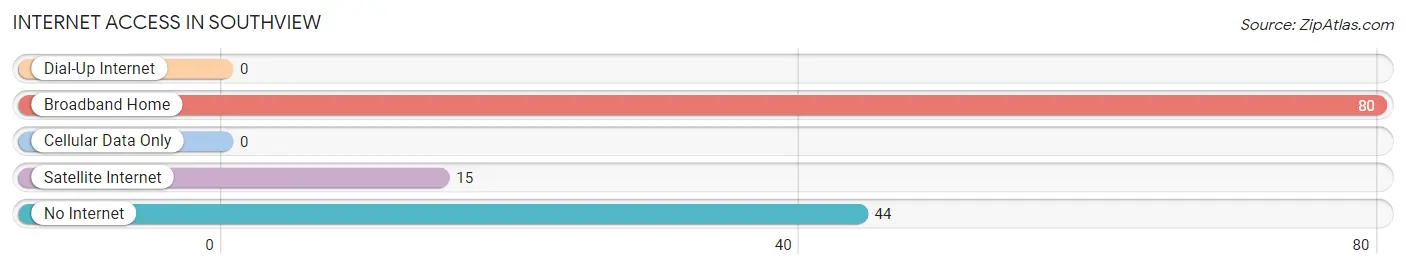
| Internet Type | # Households | % Households |
| Dial-Up Internet | 0 | 0.0% |
| Broadband Home | 80 | 64.5% |
| Cellular Data Only | 0 | 0.0% |
| Satellite Internet | 15 | 12.1% |
| No Internet | 44 | 35.5% |
| Total | 124 | 100.0% |
Southview Summary
History
Southview is a small borough located in Allegheny County, Pennsylvania. It is situated in the South Hills of Pittsburgh, approximately 10 miles south of the city. The area was first settled in the late 1700s by German immigrants, who established a small farming community. The area was known as “Southview” by the early 1800s, and the first post office was established in 1845.
The borough was officially incorporated in 1872, and the population grew steadily over the next several decades. By the early 1900s, Southview had become a thriving industrial center, with several factories and mills located in the area. The borough was also home to a number of small businesses, including a grocery store, a hardware store, and a blacksmith shop.
The borough continued to grow throughout the 20th century, and by the year 2000, the population had reached nearly 4,000. The borough is now home to a variety of businesses, including restaurants, retail stores, and professional services.
Geography
Southview is located in the South Hills of Pittsburgh, approximately 10 miles south of the city. The borough is situated in a valley, surrounded by hills and mountains. The area is known for its rolling hills and lush forests, and is home to a variety of wildlife, including deer, foxes, and wild turkeys.
The borough is located along the Monongahela River, and is home to several parks and recreational areas. The most popular park in the area is Southview Park, which features a playground, picnic areas, and a walking trail.
Economy
Southview’s economy is largely based on the service industry, with a variety of restaurants, retail stores, and professional services located in the borough. The area is also home to a number of manufacturing and industrial businesses, including a steel mill and a paper mill.
The borough is also home to a number of small businesses, including a grocery store, a hardware store, and a blacksmith shop. The borough is also home to a number of professional services, including doctors, lawyers, and accountants.
Demographics
As of the 2010 census, the population of Southview was 3,945. The racial makeup of the borough was 94.3% White, 2.7% African American, 0.3% Native American, 0.7% Asian, and 1.9% from other races. Hispanic or Latino of any race were 1.3% of the population.
The median household income in Southview was $45,938, and the median family income was $54,938. The per capita income was $22,938. About 8.3% of families and 10.2% of the population were below the poverty line, including 14.3% of those under age 18 and 6.2% of those age 65 or over.
Common Questions
What is Per Capita Income in Southview?
Per Capita income in Southview is $32,753.
What is Inequality or Gini Index in Southview?
Inequality or Gini Index in Southview is 0.40.
What is the Total Population of Southview?
Total Population of Southview is 364.
What is the Total Male Population of Southview?
Total Male Population of Southview is 128.
What is the Total Female Population of Southview?
Total Female Population of Southview is 236.
What is the Ratio of Males per 100 Females in Southview?
There are 54.24 Males per 100 Females in Southview.
What is the Ratio of Females per 100 Males in Southview?
There are 184.38 Females per 100 Males in Southview.
What is the Median Population Age in Southview?
Median Population Age in Southview is 41.6 Years.
What is the Average Family Size in Southview
Average Family Size in Southview is 2.9 People.
What is the Average Household Size in Southview
Average Household Size in Southview is 2.9 People.
How Large is the Labor Force in Southview?
There are 199 People in the Labor Forcein in Southview.
What is the Percentage of People in the Labor Force in Southview?
64.2% of People are in the Labor Force in Southview.
What is the Unemployment Rate in Southview?
Unemployment Rate in Southview is 13.1%.