Brookville, NY Map & Demographics
Brookville Map
Brookville Overview
$157,836
PER CAPITA INCOME
$250,001
AVG FAMILY INCOME
$250,001
AVG HOUSEHOLD INCOME
92.8%
WAGE / INCOME GAP [ % ]
7.2¢/ $1
WAGE / INCOME GAP [ $ ]
0.44
INEQUALITY / GINI INDEX
2,988
TOTAL POPULATION
1,492
MALE POPULATION
1,496
FEMALE POPULATION
99.73
MALES / 100 FEMALES
100.27
FEMALES / 100 MALES
24.7
MEDIAN AGE
2.6
AVG FAMILY SIZE
2.7
AVG HOUSEHOLD SIZE
1,538
LABOR FORCE [ PEOPLE ]
59.7%
PERCENT IN LABOR FORCE
5.7%
UNEMPLOYMENT RATE
Income in Brookville
Income Overview in Brookville
Per Capita Income in Brookville is $157,836, while median incomes of families and households are $250,001 and $250,001 respectively.
| Characteristic | Number | Measure |
| Per Capita Income | 2,988 | $157,836 |
| Median Family Income | 732 | $250,001 |
| Mean Family Income | 732 | $630,683 |
| Median Household Income | 764 | $250,001 |
| Mean Household Income | 764 | $617,235 |
| Income Deficit | 732 | $0 |
| Wage / Income Gap (%) | 2,988 | 92.84% |
| Wage / Income Gap ($) | 2,988 | 7.16¢ per $1 |
| Gini / Inequality Index | 2,988 | 0.44 |
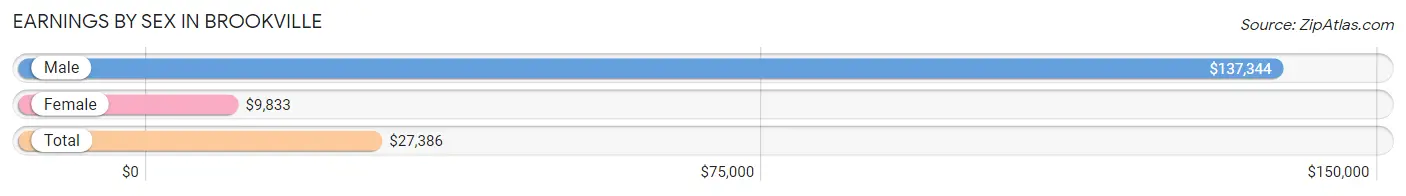
Earnings by Sex in Brookville
Average Earnings in Brookville are $27,386, $137,344 for men and $9,833 for women, a difference of 92.8%.
| Sex | Number | Average Earnings |
| Male | 969 (51.1%) | $137,344 |
| Female | 928 (48.9%) | $9,833 |
| Total | 1,897 (100.0%) | $27,386 |
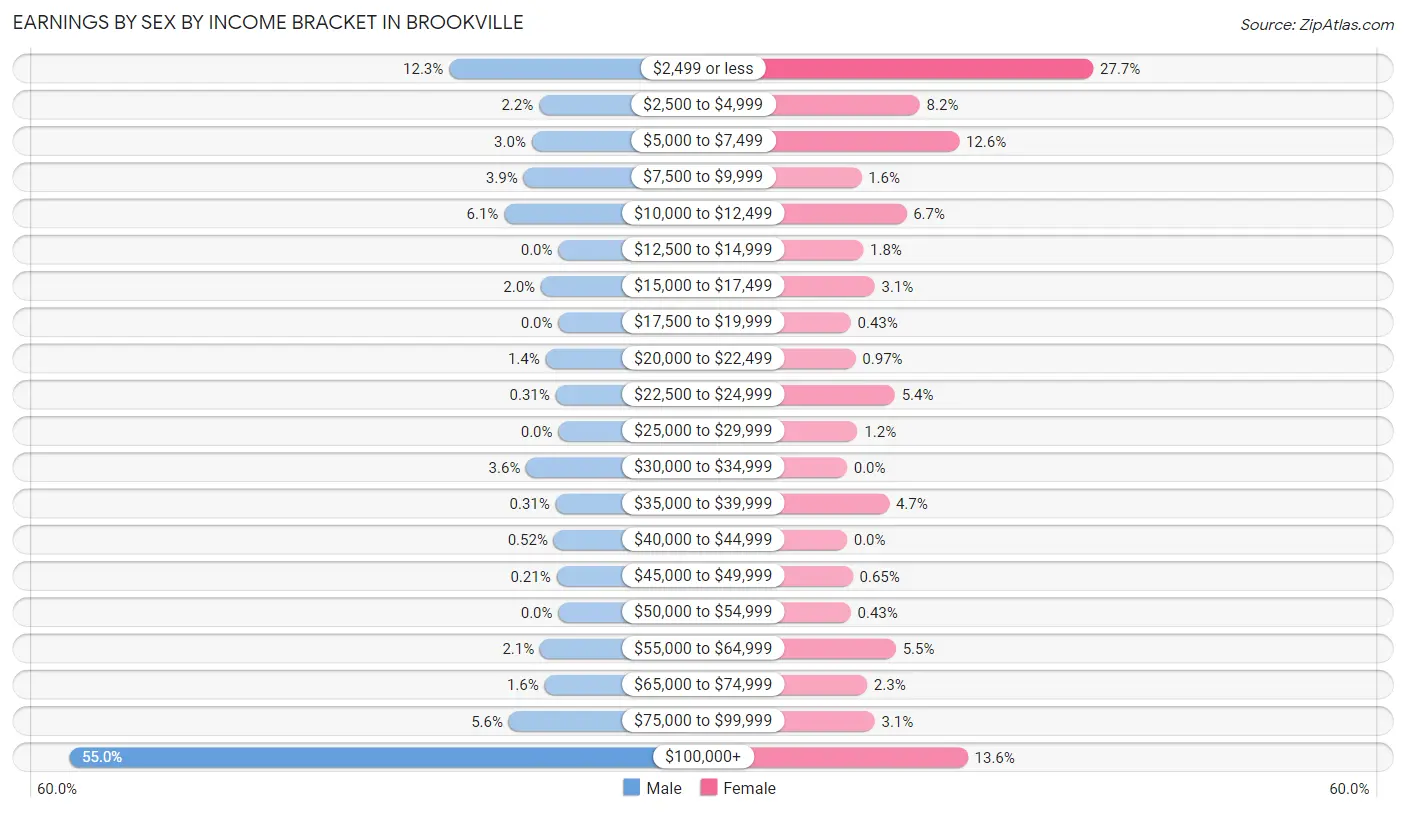
Earnings by Sex by Income Bracket in Brookville
The most common earnings brackets in Brookville are $100,000+ for men (533 | 55.0%) and $2,499 or less for women (257 | 27.7%).
| Income | Male | Female |
| $2,499 or less | 119 (12.3%) | 257 (27.7%) |
| $2,500 to $4,999 | 21 (2.2%) | 76 (8.2%) |
| $5,000 to $7,499 | 29 (3.0%) | 117 (12.6%) |
| $7,500 to $9,999 | 38 (3.9%) | 15 (1.6%) |
| $10,000 to $12,499 | 59 (6.1%) | 62 (6.7%) |
| $12,500 to $14,999 | 0 (0.0%) | 17 (1.8%) |
| $15,000 to $17,499 | 19 (2.0%) | 29 (3.1%) |
| $17,500 to $19,999 | 0 (0.0%) | 4 (0.4%) |
| $20,000 to $22,499 | 14 (1.4%) | 9 (1.0%) |
| $22,500 to $24,999 | 3 (0.3%) | 50 (5.4%) |
| $25,000 to $29,999 | 0 (0.0%) | 11 (1.2%) |
| $30,000 to $34,999 | 35 (3.6%) | 0 (0.0%) |
| $35,000 to $39,999 | 3 (0.3%) | 44 (4.7%) |
| $40,000 to $44,999 | 5 (0.5%) | 0 (0.0%) |
| $45,000 to $49,999 | 2 (0.2%) | 6 (0.6%) |
| $50,000 to $54,999 | 0 (0.0%) | 4 (0.4%) |
| $55,000 to $64,999 | 20 (2.1%) | 51 (5.5%) |
| $65,000 to $74,999 | 15 (1.5%) | 21 (2.3%) |
| $75,000 to $99,999 | 54 (5.6%) | 29 (3.1%) |
| $100,000+ | 533 (55.0%) | 126 (13.6%) |
| Total | 969 (100.0%) | 928 (100.0%) |
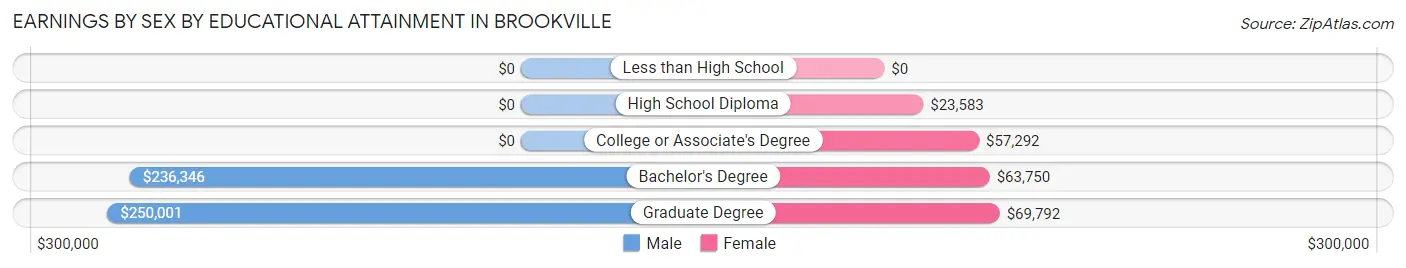
Earnings by Sex by Educational Attainment in Brookville
Average earnings in Brookville are $250,001 for men and $57,381 for women, a difference of 77.0%. Men with an educational attainment of graduate degree enjoy the highest average annual earnings of $250,001, while those with bachelor's degree education earn the least with $236,346. Women with an educational attainment of graduate degree earn the most with the average annual earnings of $69,792, while those with high school diploma education have the smallest earnings of $23,583.
| Educational Attainment | Male Income | Female Income |
| Less than High School | - | - |
| High School Diploma | - | - |
| College or Associate's Degree | - | - |
| Bachelor's Degree | $236,346 | $63,750 |
| Graduate Degree | $250,001 | $69,792 |
| Total | $250,001 | $57,381 |
Family Income in Brookville
Family Income Brackets in Brookville
According to the Brookville family income data, there are 522 families falling into the $200,000+ income range, which is the most common income bracket and makes up 71.3% of all families.
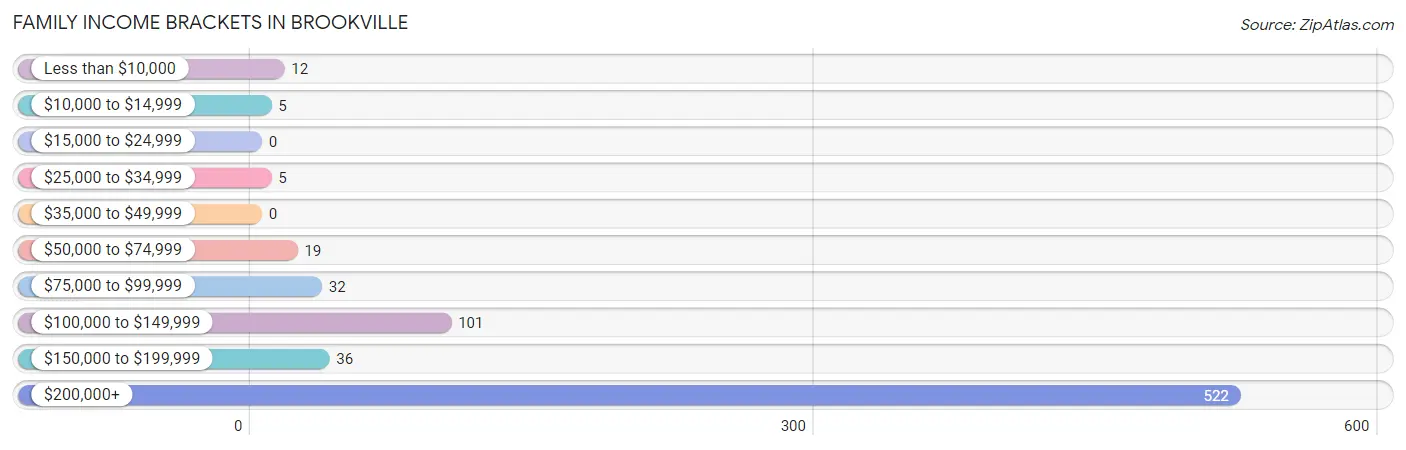
| Income Bracket | # Families | % Families |
| Less than $10,000 | 12 | 1.6% |
| $10,000 to $14,999 | 5 | 0.7% |
| $15,000 to $24,999 | 0 | 0.0% |
| $25,000 to $34,999 | 5 | 0.7% |
| $35,000 to $49,999 | 0 | 0.0% |
| $50,000 to $74,999 | 19 | 2.6% |
| $75,000 to $99,999 | 32 | 4.4% |
| $100,000 to $149,999 | 101 | 13.8% |
| $150,000 to $199,999 | 36 | 4.9% |
| $200,000+ | 522 | 71.3% |
Family Income by Famaliy Size in Brookville
3-person families (141 | 19.3%) account for the highest median family income in Brookville with $250,001 per family, while 2-person families (225 | 30.7%) have the highest median income of $109,554 per family member.
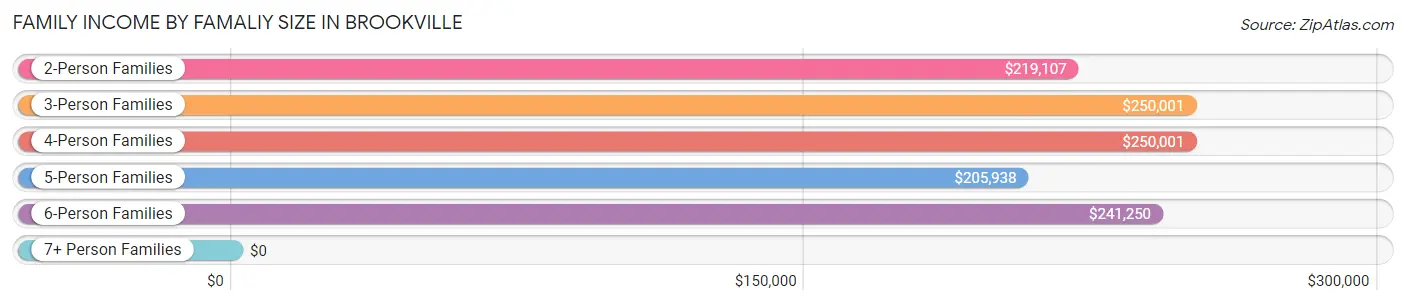
| Income Bracket | # Families | Median Income |
| 2-Person Families | 225 (30.7%) | $219,107 |
| 3-Person Families | 141 (19.3%) | $250,001 |
| 4-Person Families | 300 (41.0%) | $250,001 |
| 5-Person Families | 35 (4.8%) | $205,938 |
| 6-Person Families | 25 (3.4%) | $241,250 |
| 7+ Person Families | 6 (0.8%) | $0 |
| Total | 732 (100.0%) | $250,001 |
Family Income by Number of Earners in Brookville
The median family income in Brookville is $250,001, with families comprising 2 earners (441) having the highest median family income of $250,001, while families with no earners (39) have the lowest median family income of $109,750, accounting for 60.3% and 5.3% of families, respectively.
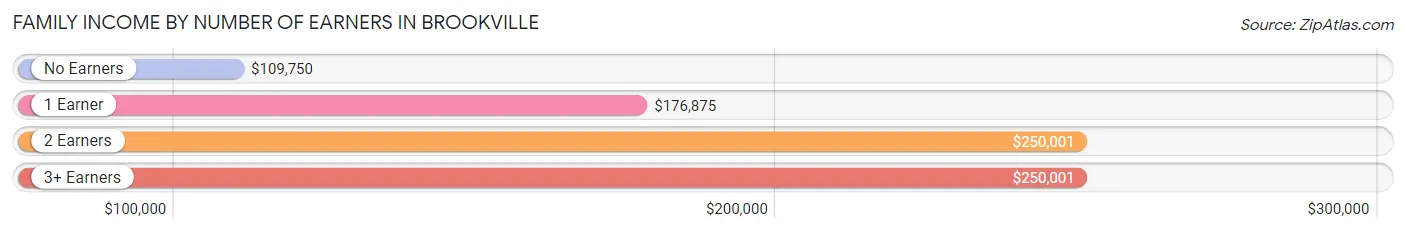
| Number of Earners | # Families | Median Income |
| No Earners | 39 (5.3%) | $109,750 |
| 1 Earner | 205 (28.0%) | $176,875 |
| 2 Earners | 441 (60.3%) | $250,001 |
| 3+ Earners | 47 (6.4%) | $250,001 |
| Total | 732 (100.0%) | $250,001 |
Household Income in Brookville
Household Income Brackets in Brookville
With 549 households falling in the category, the $200,000+ income range is the most frequent in Brookville, accounting for 71.9% of all households.
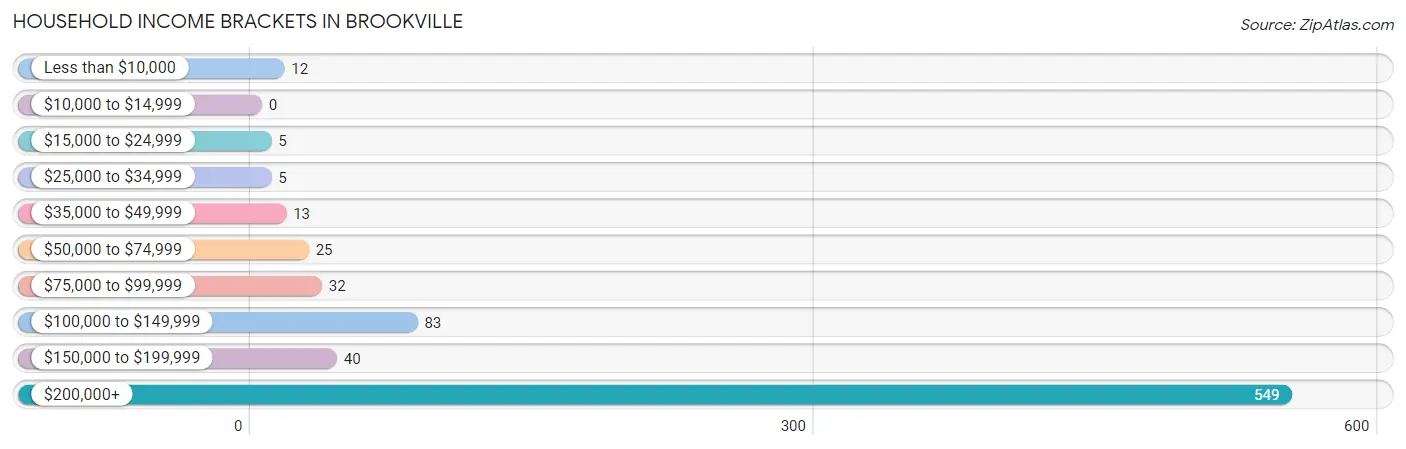
| Income Bracket | # Households | % Households |
| Less than $10,000 | 12 | 1.6% |
| $10,000 to $14,999 | 0 | 0.0% |
| $15,000 to $24,999 | 5 | 0.7% |
| $25,000 to $34,999 | 5 | 0.7% |
| $35,000 to $49,999 | 13 | 1.7% |
| $50,000 to $74,999 | 25 | 3.3% |
| $75,000 to $99,999 | 32 | 4.2% |
| $100,000 to $149,999 | 83 | 10.9% |
| $150,000 to $199,999 | 40 | 5.2% |
| $200,000+ | 549 | 71.9% |
Household Income by Householder Age in Brookville
The median household income in Brookville is $250,001, with the highest median household income of $250,001 found in the 45 to 64 years age bracket for the primary householder. A total of 471 households (61.7%) fall into this category. Meanwhile, the 15 to 24 years age bracket for the primary householder has the lowest median household income of $0, with 3 households (0.4%) in this group.
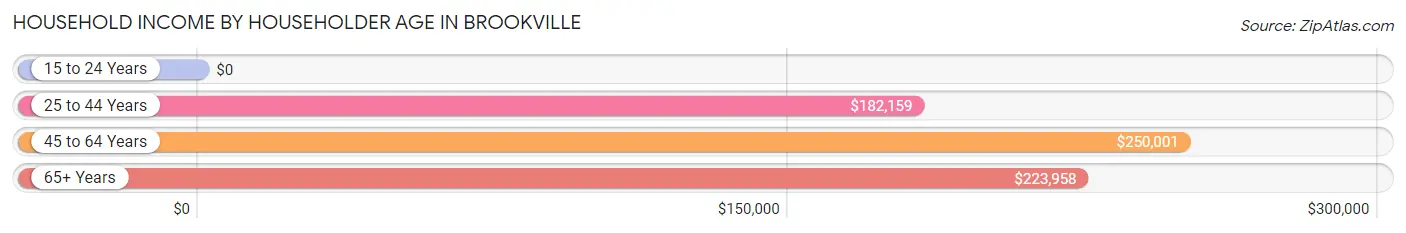
| Income Bracket | # Households | Median Income |
| 15 to 24 Years | 3 (0.4%) | $0 |
| 25 to 44 Years | 113 (14.8%) | $182,159 |
| 45 to 64 Years | 471 (61.7%) | $250,001 |
| 65+ Years | 177 (23.2%) | $223,958 |
| Total | 764 (100.0%) | $250,001 |
Poverty in Brookville
Income Below Poverty by Sex and Age in Brookville
With 2.5% poverty level for males and 6.7% for females among the residents of Brookville, 6 to 11 year old males and 16 and 17 year old females are the most vulnerable to poverty, with 11 males (14.1%) and 36 females (58.1%) in their respective age groups living below the poverty level.
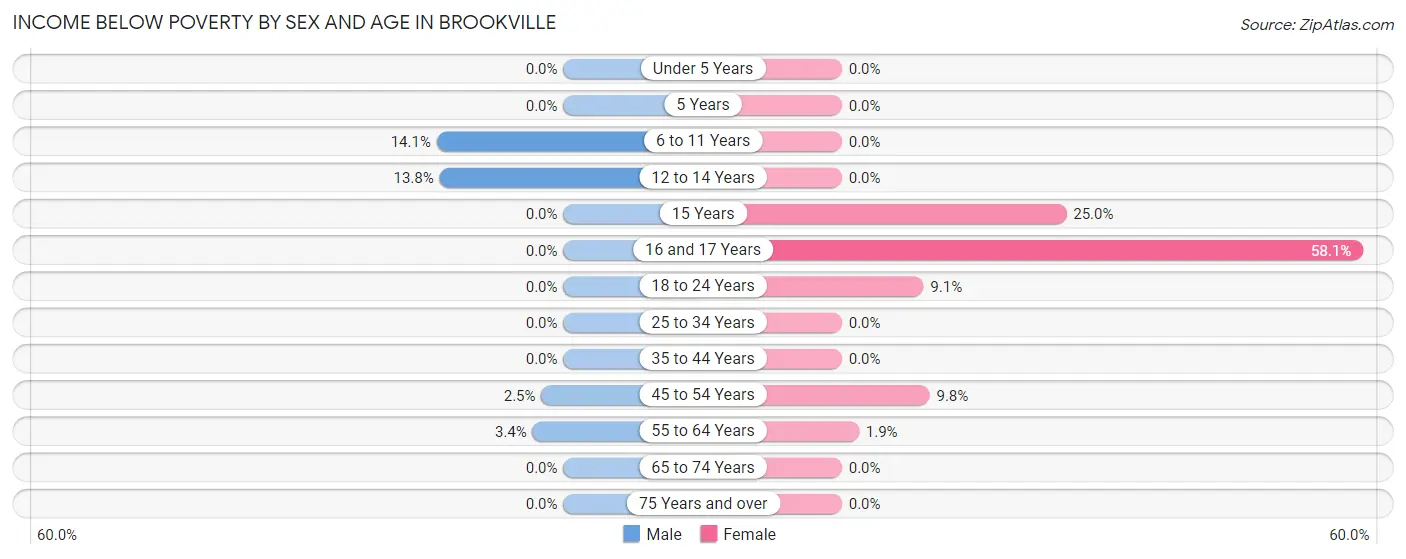
| Age Bracket | Male | Female |
| Under 5 Years | 0 (0.0%) | 0 (0.0%) |
| 5 Years | 0 (0.0%) | 0 (0.0%) |
| 6 to 11 Years | 11 (14.1%) | 0 (0.0%) |
| 12 to 14 Years | 4 (13.8%) | 0 (0.0%) |
| 15 Years | 0 (0.0%) | 7 (25.0%) |
| 16 and 17 Years | 0 (0.0%) | 36 (58.1%) |
| 18 to 24 Years | 0 (0.0%) | 5 (9.1%) |
| 25 to 34 Years | 0 (0.0%) | 0 (0.0%) |
| 35 to 44 Years | 0 (0.0%) | 0 (0.0%) |
| 45 to 54 Years | 8 (2.5%) | 13 (9.8%) |
| 55 to 64 Years | 4 (3.4%) | 4 (1.9%) |
| 65 to 74 Years | 0 (0.0%) | 0 (0.0%) |
| 75 Years and over | 0 (0.0%) | 0 (0.0%) |
| Total | 27 (2.5%) | 65 (6.7%) |
Income Above Poverty by Sex and Age in Brookville
According to the poverty statistics in Brookville, males aged under 5 years and females aged under 5 years are the age groups that are most secure financially, with 100.0% of males and 100.0% of females in these age groups living above the poverty line.
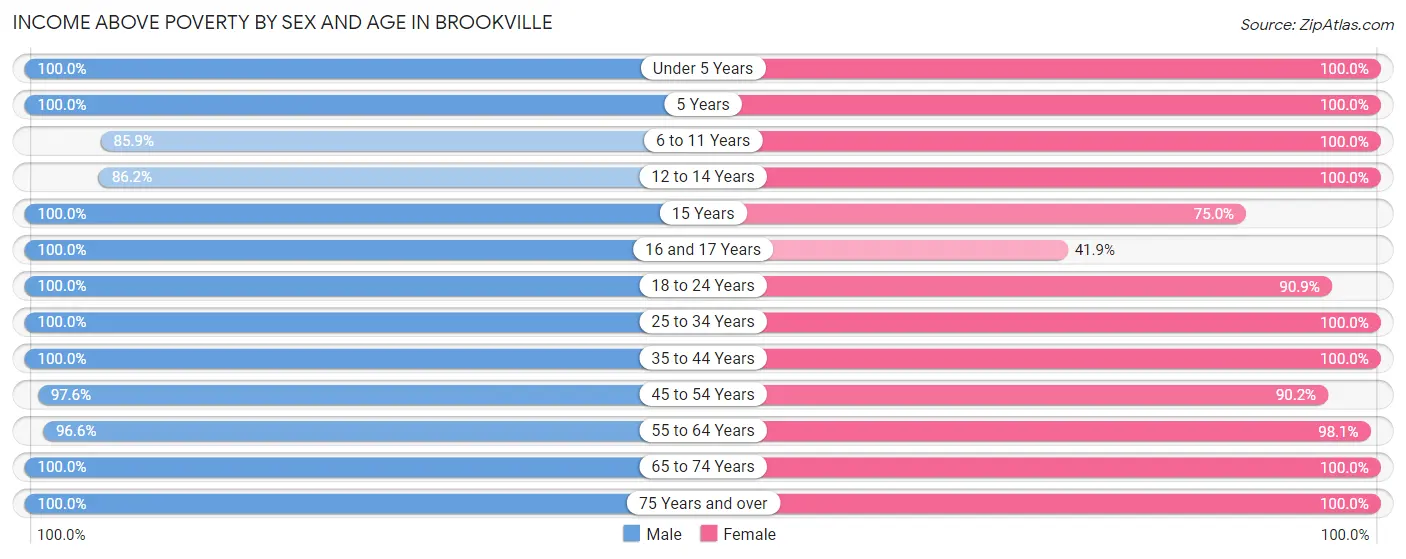
| Age Bracket | Male | Female |
| Under 5 Years | 77 (100.0%) | 30 (100.0%) |
| 5 Years | 54 (100.0%) | 4 (100.0%) |
| 6 to 11 Years | 67 (85.9%) | 62 (100.0%) |
| 12 to 14 Years | 25 (86.2%) | 40 (100.0%) |
| 15 Years | 9 (100.0%) | 21 (75.0%) |
| 16 and 17 Years | 25 (100.0%) | 26 (41.9%) |
| 18 to 24 Years | 45 (100.0%) | 50 (90.9%) |
| 25 to 34 Years | 71 (100.0%) | 63 (100.0%) |
| 35 to 44 Years | 96 (100.0%) | 126 (100.0%) |
| 45 to 54 Years | 319 (97.6%) | 120 (90.2%) |
| 55 to 64 Years | 113 (96.6%) | 207 (98.1%) |
| 65 to 74 Years | 109 (100.0%) | 93 (100.0%) |
| 75 Years and over | 56 (100.0%) | 57 (100.0%) |
| Total | 1,066 (97.5%) | 899 (93.3%) |
Income Below Poverty Among Married-Couple Families in Brookville
The poverty statistics for married-couple families in Brookville show that 1.7% or 12 of the total 695 families live below the poverty line. Families with 1 or 2 children have the highest poverty rate of 2.1%, comprising of 8 families. On the other hand, families with 3 or 4 children have the lowest poverty rate of 0.0%, which includes 0 families.
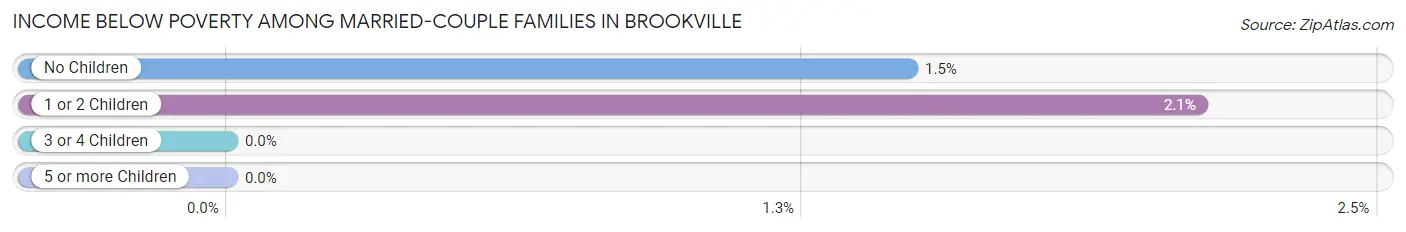
| Children | Above Poverty | Below Poverty |
| No Children | 267 (98.5%) | 4 (1.5%) |
| 1 or 2 Children | 371 (97.9%) | 8 (2.1%) |
| 3 or 4 Children | 45 (100.0%) | 0 (0.0%) |
| 5 or more Children | 0 (0.0%) | 0 (0.0%) |
| Total | 683 (98.3%) | 12 (1.7%) |
Income Below Poverty Among Single-Parent Households in Brookville
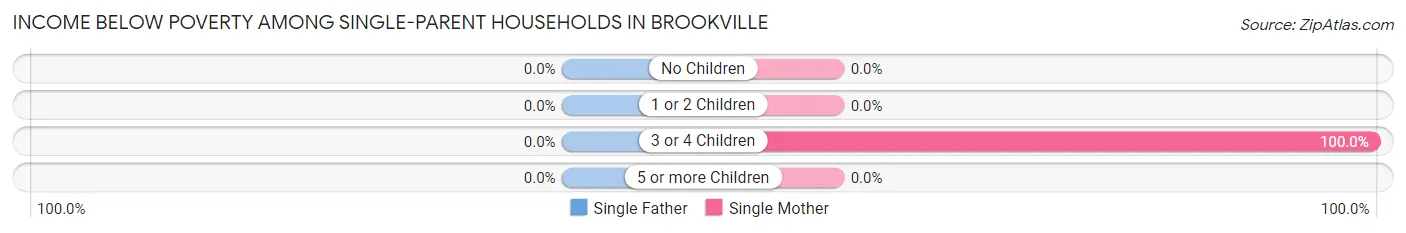
| Children | Single Father | Single Mother |
| No Children | 0 (0.0%) | 0 (0.0%) |
| 1 or 2 Children | 0 (0.0%) | 0 (0.0%) |
| 3 or 4 Children | 0 (0.0%) | 5 (100.0%) |
| 5 or more Children | 0 (0.0%) | 0 (0.0%) |
| Total | 0 (0.0%) | 5 (15.6%) |
Income Below Poverty Among Married-Couple vs Single-Parent Households in Brookville
The poverty data for Brookville shows that 12 of the married-couple family households (1.7%) and 5 of the single-parent households (13.5%) are living below the poverty level. Within the married-couple family households, those with 1 or 2 children have the highest poverty rate, with 8 households (2.1%) falling below the poverty line. Among the single-parent households, those with 3 or 4 children have the highest poverty rate, with 5 household (100.0%) living below poverty.
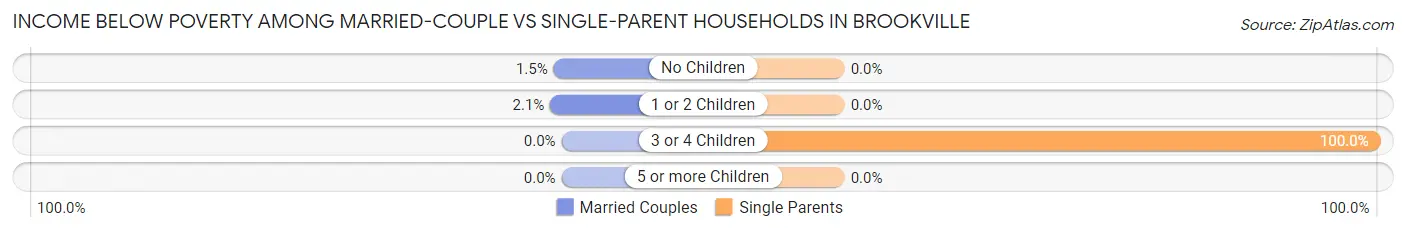
| Children | Married-Couple Families | Single-Parent Households |
| No Children | 4 (1.5%) | 0 (0.0%) |
| 1 or 2 Children | 8 (2.1%) | 0 (0.0%) |
| 3 or 4 Children | 0 (0.0%) | 5 (100.0%) |
| 5 or more Children | 0 (0.0%) | 0 (0.0%) |
| Total | 12 (1.7%) | 5 (13.5%) |
Race in Brookville
The most populous races in Brookville are White / Caucasian (2,102 | 70.4%), Asian (506 | 16.9%), and Hispanic or Latino (270 | 9.0%).
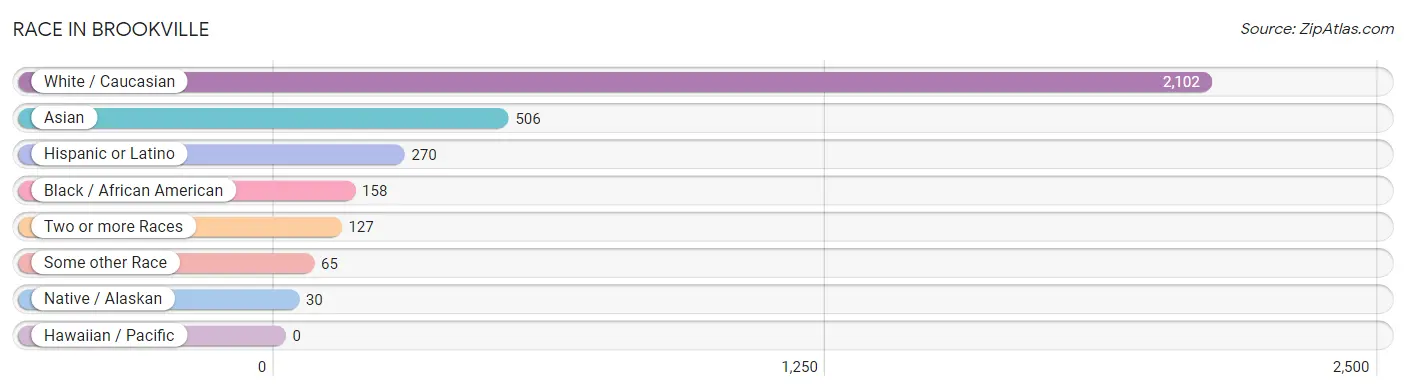
| Race | # Population | % Population |
| Asian | 506 | 16.9% |
| Black / African American | 158 | 5.3% |
| Hawaiian / Pacific | 0 | 0.0% |
| Hispanic or Latino | 270 | 9.0% |
| Native / Alaskan | 30 | 1.0% |
| White / Caucasian | 2,102 | 70.4% |
| Two or more Races | 127 | 4.3% |
| Some other Race | 65 | 2.2% |
| Total | 2,988 | 100.0% |
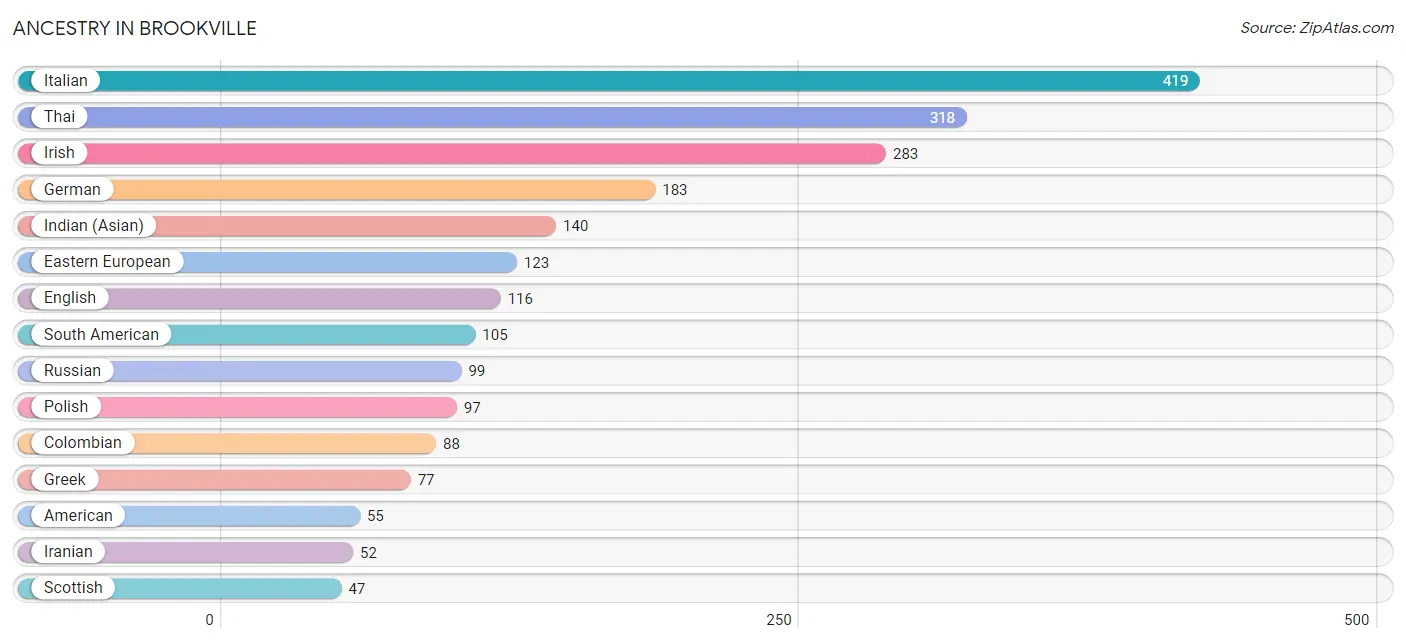
Ancestry in Brookville
The most populous ancestries reported in Brookville are Italian (419 | 14.0%), Thai (318 | 10.6%), Irish (283 | 9.5%), German (183 | 6.1%), and Indian (Asian) (140 | 4.7%), together accounting for 44.9% of all Brookville residents.
| Ancestry | # Population | % Population |
| African | 19 | 0.6% |
| American | 55 | 1.8% |
| Arab | 18 | 0.6% |
| Argentinean | 11 | 0.4% |
| Armenian | 6 | 0.2% |
| Australian | 5 | 0.2% |
| Austrian | 24 | 0.8% |
| Bhutanese | 5 | 0.2% |
| British West Indian | 5 | 0.2% |
| Burmese | 42 | 1.4% |
| Canadian | 11 | 0.4% |
| Central American | 26 | 0.9% |
| Cherokee | 28 | 0.9% |
| Choctaw | 17 | 0.6% |
| Colombian | 88 | 2.9% |
| Comanche | 17 | 0.6% |
| Cree | 30 | 1.0% |
| Cuban | 23 | 0.8% |
| Czech | 9 | 0.3% |
| Delaware | 6 | 0.2% |
| Dominican | 33 | 1.1% |
| Dutch | 14 | 0.5% |
| Eastern European | 123 | 4.1% |
| English | 116 | 3.9% |
| European | 28 | 0.9% |
| Finnish | 10 | 0.3% |
| French | 36 | 1.2% |
| French Canadian | 21 | 0.7% |
| German | 183 | 6.1% |
| Greek | 77 | 2.6% |
| Guatemalan | 10 | 0.3% |
| Guyanese | 5 | 0.2% |
| Haitian | 8 | 0.3% |
| Honduran | 8 | 0.3% |
| Hungarian | 12 | 0.4% |
| Indian (Asian) | 140 | 4.7% |
| Iranian | 52 | 1.7% |
| Irish | 283 | 9.5% |
| Israeli | 3 | 0.1% |
| Italian | 419 | 14.0% |
| Jamaican | 23 | 0.8% |
| Lebanese | 8 | 0.3% |
| Lithuanian | 17 | 0.6% |
| Macedonian | 7 | 0.2% |
| Mexican | 13 | 0.4% |
| Moroccan | 10 | 0.3% |
| Norwegian | 5 | 0.2% |
| Panamanian | 8 | 0.3% |
| Peruvian | 6 | 0.2% |
| Polish | 97 | 3.3% |
| Puerto Rican | 43 | 1.4% |
| Romanian | 16 | 0.5% |
| Russian | 99 | 3.3% |
| Scottish | 47 | 1.6% |
| Seminole | 18 | 0.6% |
| Sierra Leonean | 11 | 0.4% |
| South American | 105 | 3.5% |
| Spaniard | 23 | 0.8% |
| Subsaharan African | 19 | 0.6% |
| Swedish | 13 | 0.4% |
| Syrian | 4 | 0.1% |
| Thai | 318 | 10.6% |
| Trinidadian and Tobagonian | 7 | 0.2% |
| Ukrainian | 23 | 0.8% |
| Vietnamese | 21 | 0.7% |
| West Indian | 5 | 0.2% | View All 66 Rows |
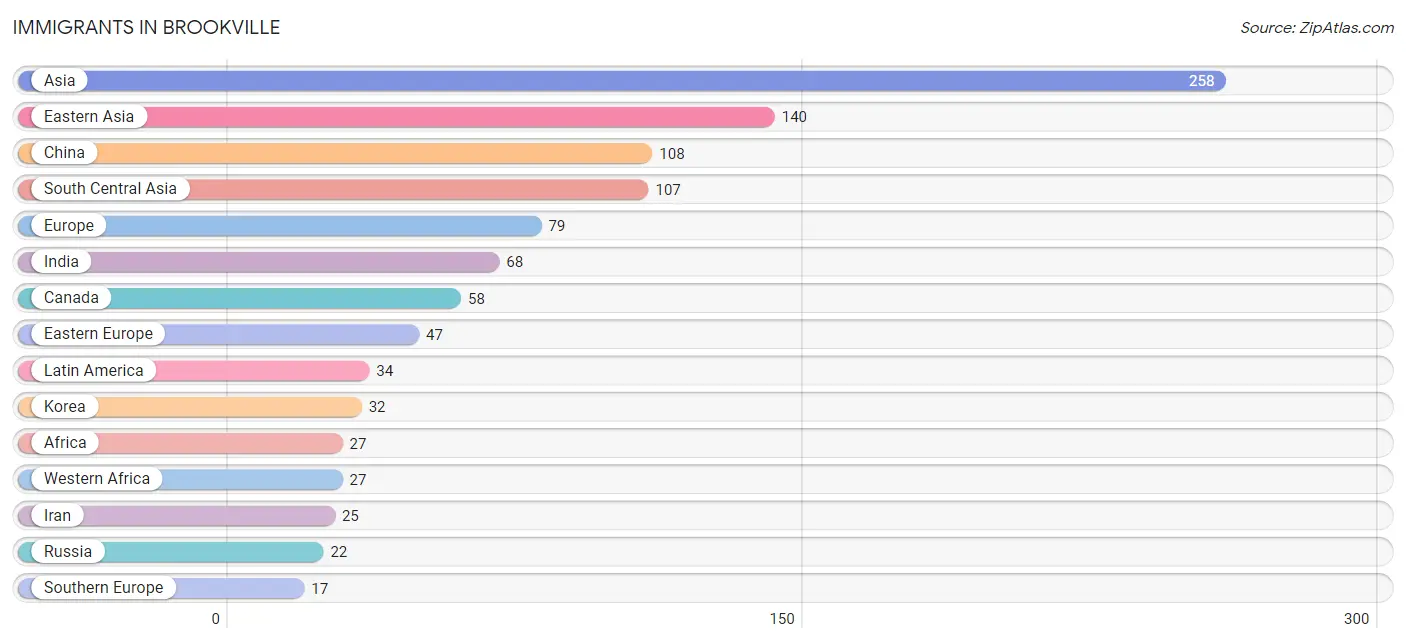
Immigrants in Brookville
The most numerous immigrant groups reported in Brookville came from Asia (258 | 8.6%), Eastern Asia (140 | 4.7%), China (108 | 3.6%), South Central Asia (107 | 3.6%), and Europe (79 | 2.6%), together accounting for 23.1% of all Brookville residents.
| Immigration Origin | # Population | % Population |
| Africa | 27 | 0.9% |
| Asia | 258 | 8.6% |
| Australia | 5 | 0.2% |
| Bulgaria | 3 | 0.1% |
| Canada | 58 | 1.9% |
| Caribbean | 16 | 0.5% |
| Central America | 11 | 0.4% |
| China | 108 | 3.6% |
| Czechoslovakia | 5 | 0.2% |
| Dominican Republic | 7 | 0.2% |
| Eastern Asia | 140 | 4.7% |
| Eastern Europe | 47 | 1.6% |
| Europe | 79 | 2.6% |
| France | 11 | 0.4% |
| Germany | 4 | 0.1% |
| Greece | 3 | 0.1% |
| Guatemala | 4 | 0.1% |
| Hungary | 3 | 0.1% |
| India | 68 | 2.3% |
| Iran | 25 | 0.8% |
| Israel | 3 | 0.1% |
| Italy | 14 | 0.5% |
| Jamaica | 4 | 0.1% |
| Korea | 32 | 1.1% |
| Latin America | 34 | 1.1% |
| Lebanon | 8 | 0.3% |
| Mexico | 7 | 0.2% |
| Nigeria | 16 | 0.5% |
| Oceania | 5 | 0.2% |
| Pakistan | 14 | 0.5% |
| Peru | 7 | 0.2% |
| Poland | 4 | 0.1% |
| Russia | 22 | 0.7% |
| Sierra Leone | 11 | 0.4% |
| South America | 7 | 0.2% |
| South Central Asia | 107 | 3.6% |
| Southern Europe | 17 | 0.6% |
| Taiwan | 15 | 0.5% |
| Ukraine | 3 | 0.1% |
| Western Africa | 27 | 0.9% |
| Western Asia | 11 | 0.4% |
| Western Europe | 15 | 0.5% | View All 42 Rows |
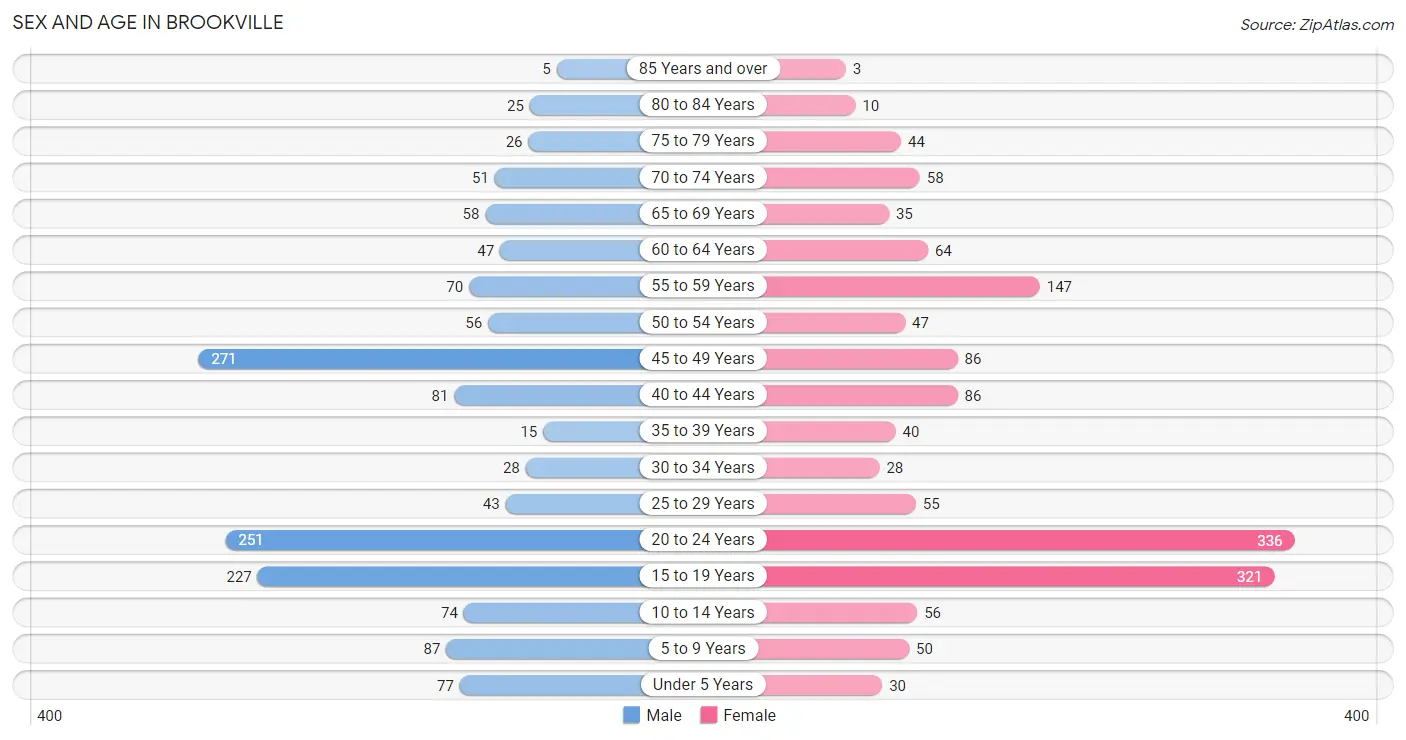
Sex and Age in Brookville
Sex and Age in Brookville
The most populous age groups in Brookville are 45 to 49 Years (271 | 18.2%) for men and 20 to 24 Years (336 | 22.5%) for women.
| Age Bracket | Male | Female |
| Under 5 Years | 77 (5.2%) | 30 (2.0%) |
| 5 to 9 Years | 87 (5.8%) | 50 (3.3%) |
| 10 to 14 Years | 74 (5.0%) | 56 (3.7%) |
| 15 to 19 Years | 227 (15.2%) | 321 (21.5%) |
| 20 to 24 Years | 251 (16.8%) | 336 (22.5%) |
| 25 to 29 Years | 43 (2.9%) | 55 (3.7%) |
| 30 to 34 Years | 28 (1.9%) | 28 (1.9%) |
| 35 to 39 Years | 15 (1.0%) | 40 (2.7%) |
| 40 to 44 Years | 81 (5.4%) | 86 (5.8%) |
| 45 to 49 Years | 271 (18.2%) | 86 (5.8%) |
| 50 to 54 Years | 56 (3.7%) | 47 (3.1%) |
| 55 to 59 Years | 70 (4.7%) | 147 (9.8%) |
| 60 to 64 Years | 47 (3.2%) | 64 (4.3%) |
| 65 to 69 Years | 58 (3.9%) | 35 (2.3%) |
| 70 to 74 Years | 51 (3.4%) | 58 (3.9%) |
| 75 to 79 Years | 26 (1.7%) | 44 (2.9%) |
| 80 to 84 Years | 25 (1.7%) | 10 (0.7%) |
| 85 Years and over | 5 (0.3%) | 3 (0.2%) |
| Total | 1,492 (100.0%) | 1,496 (100.0%) |
Families and Households in Brookville
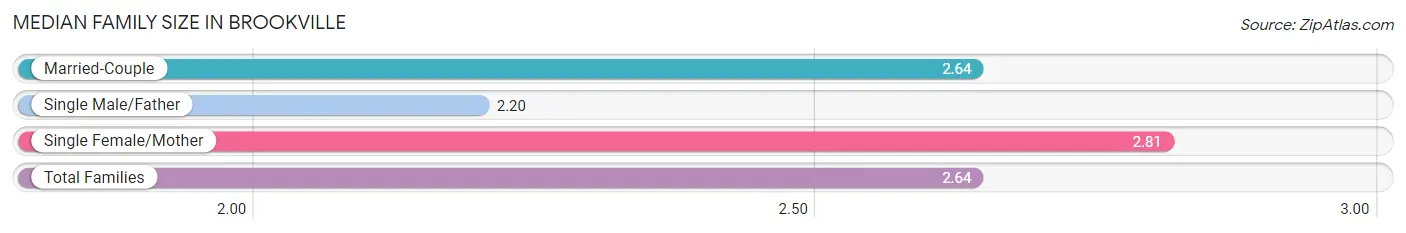
Median Family Size in Brookville
The median family size in Brookville is 2.64 persons per family, with single female/mother families (32 | 4.4%) accounting for the largest median family size of 2.81 persons per family. On the other hand, single male/father families (5 | 0.7%) represent the smallest median family size with 2.20 persons per family.
| Family Type | # Families | Family Size |
| Married-Couple | 695 (95.0%) | 2.64 |
| Single Male/Father | 5 (0.7%) | 2.20 |
| Single Female/Mother | 32 (4.4%) | 2.81 |
| Total Families | 732 (100.0%) | 2.64 |
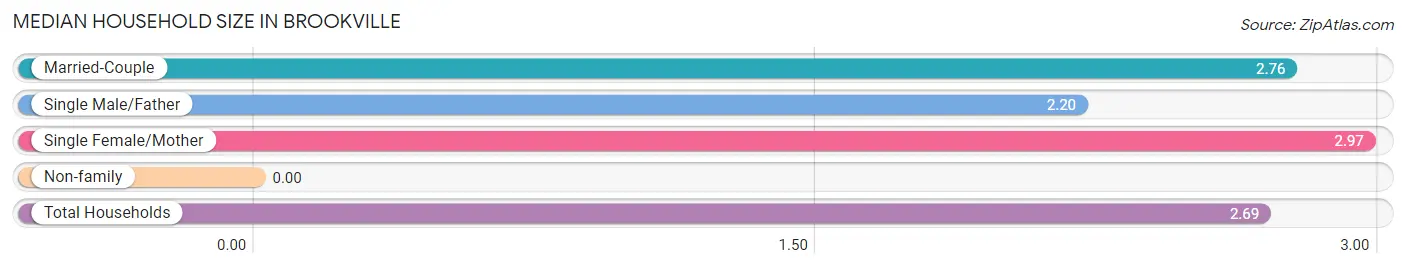
Median Household Size in Brookville
| Household Type | # Households | Household Size |
| Married-Couple | 695 (91.0%) | 2.76 |
| Single Male/Father | 5 (0.6%) | 2.20 |
| Single Female/Mother | 32 (4.2%) | 2.97 |
| Non-family | 32 (4.2%) | - |
| Total Households | 764 (100.0%) | 2.69 |
Household Size by Marriage Status in Brookville
Out of a total of 764 households in Brookville, 732 (95.8%) are family households, while 32 (4.2%) are nonfamily households. The most numerous type of family households are 4-person households, comprising 298, and the most common type of nonfamily households are 1-person households, comprising 32.
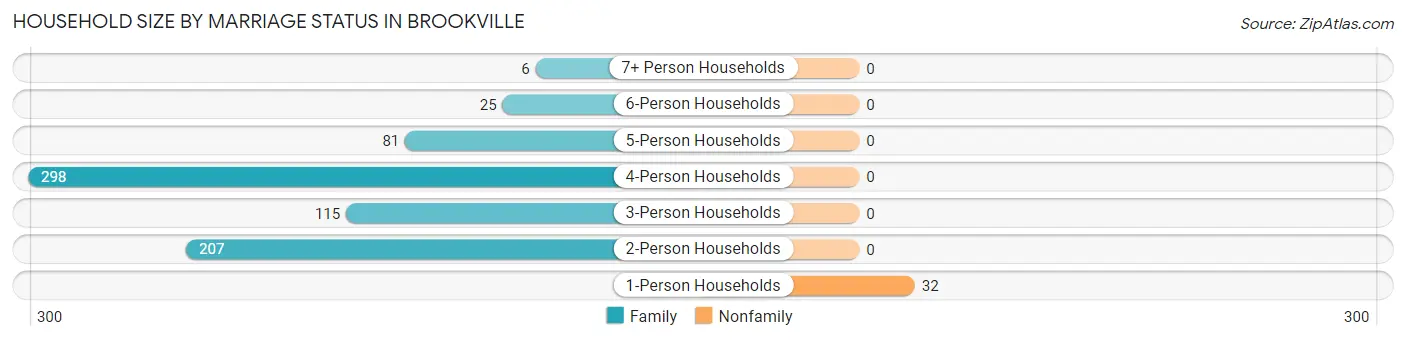
| Household Size | Family Households | Nonfamily Households |
| 1-Person Households | - | 32 (4.2%) |
| 2-Person Households | 207 (27.1%) | 0 (0.0%) |
| 3-Person Households | 115 (15.0%) | 0 (0.0%) |
| 4-Person Households | 298 (39.0%) | 0 (0.0%) |
| 5-Person Households | 81 (10.6%) | 0 (0.0%) |
| 6-Person Households | 25 (3.3%) | 0 (0.0%) |
| 7+ Person Households | 6 (0.8%) | 0 (0.0%) |
| Total | 732 (95.8%) | 32 (4.2%) |
Female Fertility in Brookville
Fertility by Age in Brookville
Average fertility rate in Brookville is 20.0 births per 1,000 women. Women in the age bracket of 20 to 34 years have the highest fertility rate with 33.0 births per 1,000 women. Women in the age bracket of 20 to 34 years acount for 73.7% of all women with births.
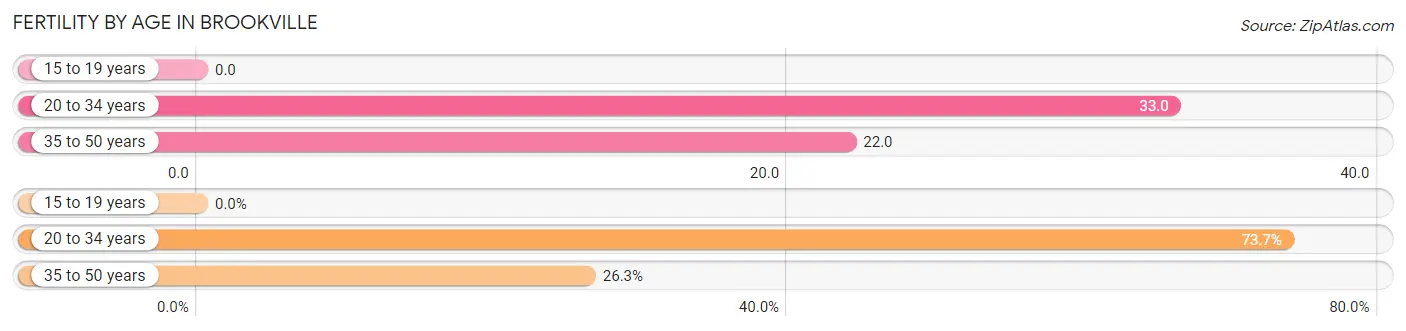
| Age Bracket | Women with Births | Births / 1,000 Women |
| 15 to 19 years | 0 (0.0%) | 0.0 |
| 20 to 34 years | 14 (73.7%) | 33.0 |
| 35 to 50 years | 5 (26.3%) | 22.0 |
| Total | 19 (100.0%) | 20.0 |
Fertility by Age by Marriage Status in Brookville
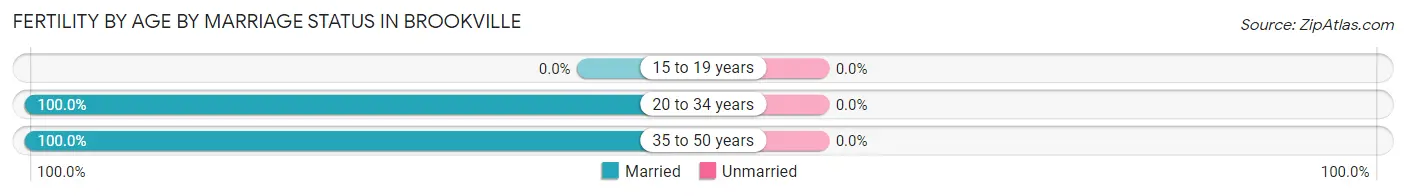
| Age Bracket | Married | Unmarried |
| 15 to 19 years | 0 (0.0%) | 0 (0.0%) |
| 20 to 34 years | 14 (100.0%) | 0 (0.0%) |
| 35 to 50 years | 5 (100.0%) | 0 (0.0%) |
| Total | 19 (100.0%) | 0 (0.0%) |
Fertility by Education in Brookville
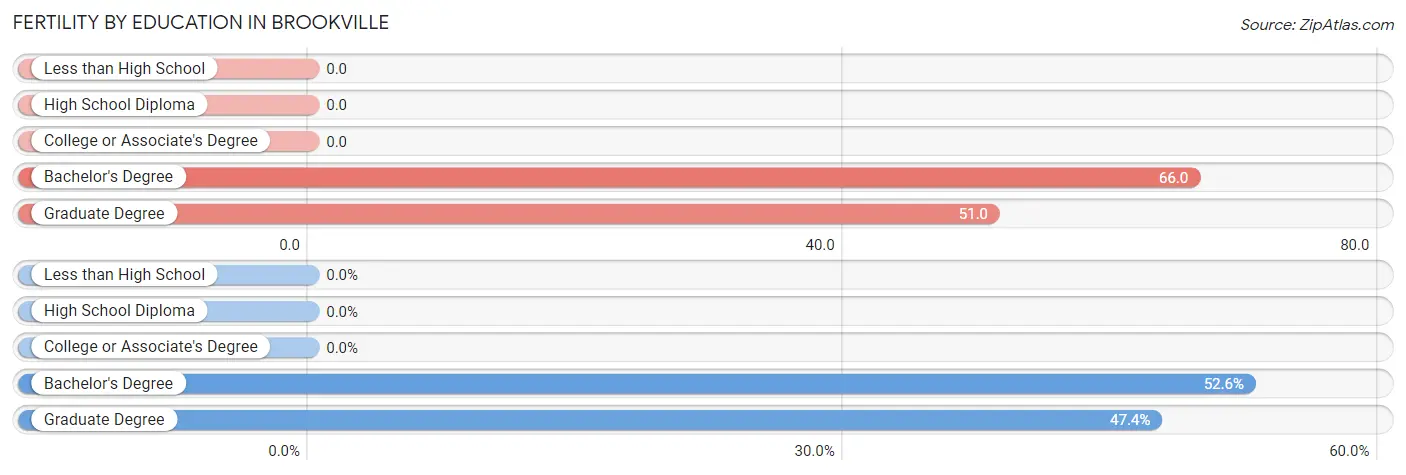
| Educational Attainment | Women with Births | Births / 1,000 Women |
| Less than High School | 0 (0.0%) | 0.0 |
| High School Diploma | 0 (0.0%) | 0.0 |
| College or Associate's Degree | 0 (0.0%) | 0.0 |
| Bachelor's Degree | 10 (52.6%) | 66.0 |
| Graduate Degree | 9 (47.4%) | 51.0 |
| Total | 19 (100.0%) | 20.0 |
Fertility by Education by Marriage Status in Brookville
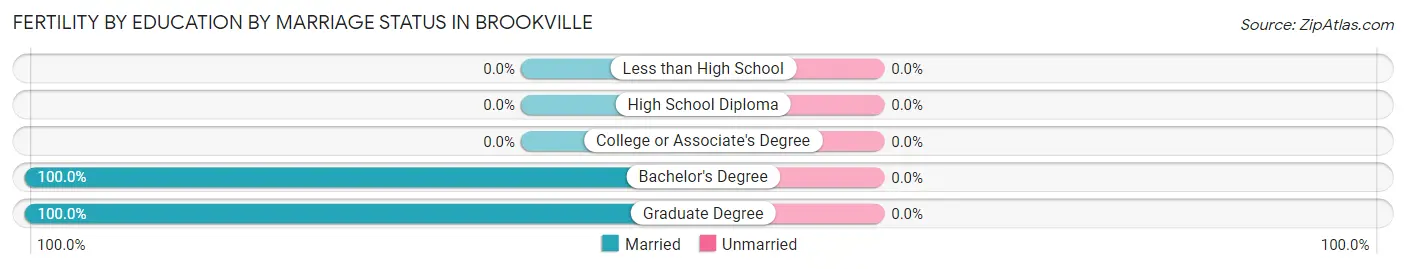
| Educational Attainment | Married | Unmarried |
| Less than High School | 0 (0.0%) | 0 (0.0%) |
| High School Diploma | 0 (0.0%) | 0 (0.0%) |
| College or Associate's Degree | 0 (0.0%) | 0 (0.0%) |
| Bachelor's Degree | 10 (100.0%) | 0 (0.0%) |
| Graduate Degree | 9 (100.0%) | 0 (0.0%) |
| Total | 19 (100.0%) | 0 (0.0%) |
Employment Characteristics in Brookville
Employment by Class of Employer in Brookville
Among the 1,435 employed individuals in Brookville, private company employees (666 | 46.4%), self-employed (incorporated) (338 | 23.5%), and local government employees (150 | 10.4%) make up the most common classes of employment.
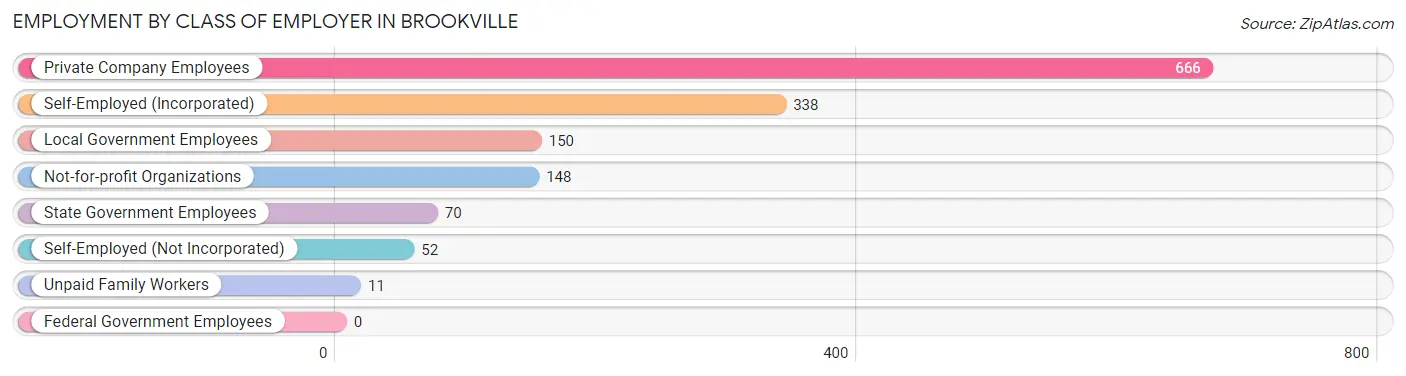
| Employer Class | # Employees | % Employees |
| Private Company Employees | 666 | 46.4% |
| Self-Employed (Incorporated) | 338 | 23.5% |
| Self-Employed (Not Incorporated) | 52 | 3.6% |
| Not-for-profit Organizations | 148 | 10.3% |
| Local Government Employees | 150 | 10.4% |
| State Government Employees | 70 | 4.9% |
| Federal Government Employees | 0 | 0.0% |
| Unpaid Family Workers | 11 | 0.8% |
| Total | 1,435 | 100.0% |
Employment Status by Age in Brookville
According to the labor force statistics for Brookville, out of the total population over 16 years of age (2,577), 59.7% or 1,538 individuals are in the labor force, with 5.7% or 88 of them unemployed. The age group with the highest labor force participation rate is 45 to 54 years, with 90.9% or 418 individuals in the labor force. Within the labor force, the 16 to 19 years age range has the highest percentage of unemployed individuals, with 26.0% or 45 of them being unemployed.
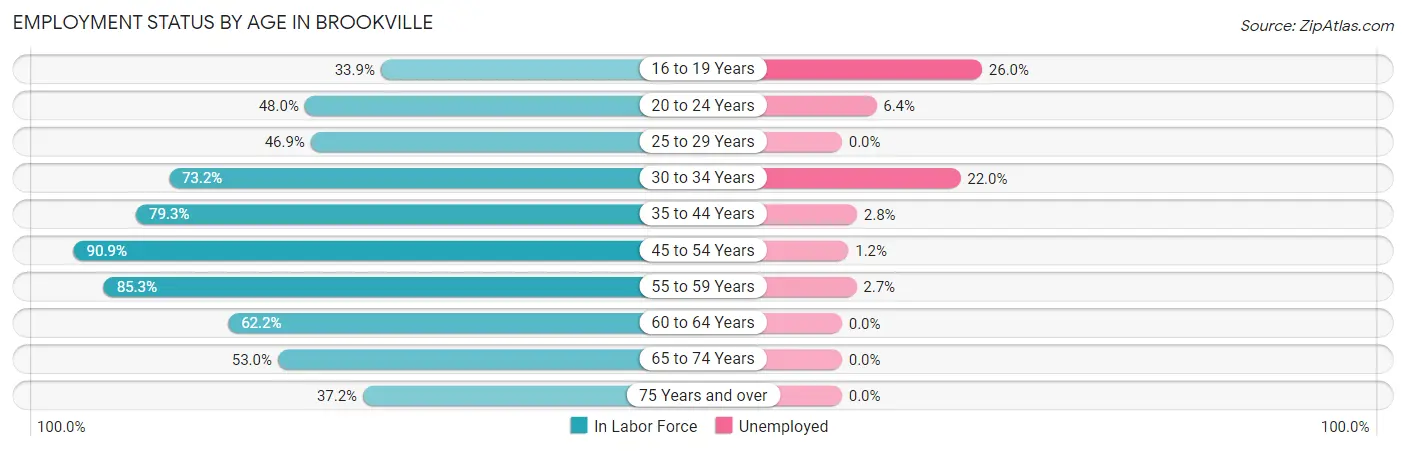
| Age Bracket | In Labor Force | Unemployed |
| 16 to 19 Years | 173 (33.9%) | 45 (26.0%) |
| 20 to 24 Years | 282 (48.0%) | 18 (6.4%) |
| 25 to 29 Years | 46 (46.9%) | 0 (0.0%) |
| 30 to 34 Years | 41 (73.2%) | 9 (22.0%) |
| 35 to 44 Years | 176 (79.3%) | 5 (2.8%) |
| 45 to 54 Years | 418 (90.9%) | 5 (1.2%) |
| 55 to 59 Years | 185 (85.3%) | 5 (2.7%) |
| 60 to 64 Years | 69 (62.2%) | 0 (0.0%) |
| 65 to 74 Years | 107 (53.0%) | 0 (0.0%) |
| 75 Years and over | 42 (37.2%) | 0 (0.0%) |
| Total | 1,538 (59.7%) | 88 (5.7%) |
Employment Status by Educational Attainment in Brookville
According to labor force statistics for Brookville, 80.3% of individuals (935) out of the total population between 25 and 64 years of age (1,164) are in the labor force, with 2.6% or 24 of them being unemployed. The group with the highest labor force participation rate are those with the educational attainment of bachelor's degree or higher, with 83.5% or 807 individuals in the labor force. Within the labor force, individuals with bachelor's degree or higher education have the highest percentage of unemployment, with 3.0% or 24 of them being unemployed.
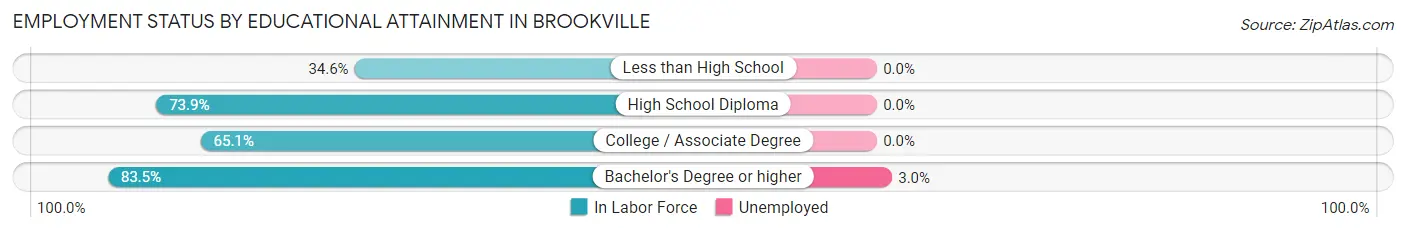
| Educational Attainment | In Labor Force | Unemployed |
| Less than High School | 9 (34.6%) | 0 (0.0%) |
| High School Diploma | 65 (73.9%) | 0 (0.0%) |
| College / Associate Degree | 54 (65.1%) | 0 (0.0%) |
| Bachelor's Degree or higher | 807 (83.5%) | 29 (3.0%) |
| Total | 935 (80.3%) | 30 (2.6%) |
Employment Occupations by Sex in Brookville
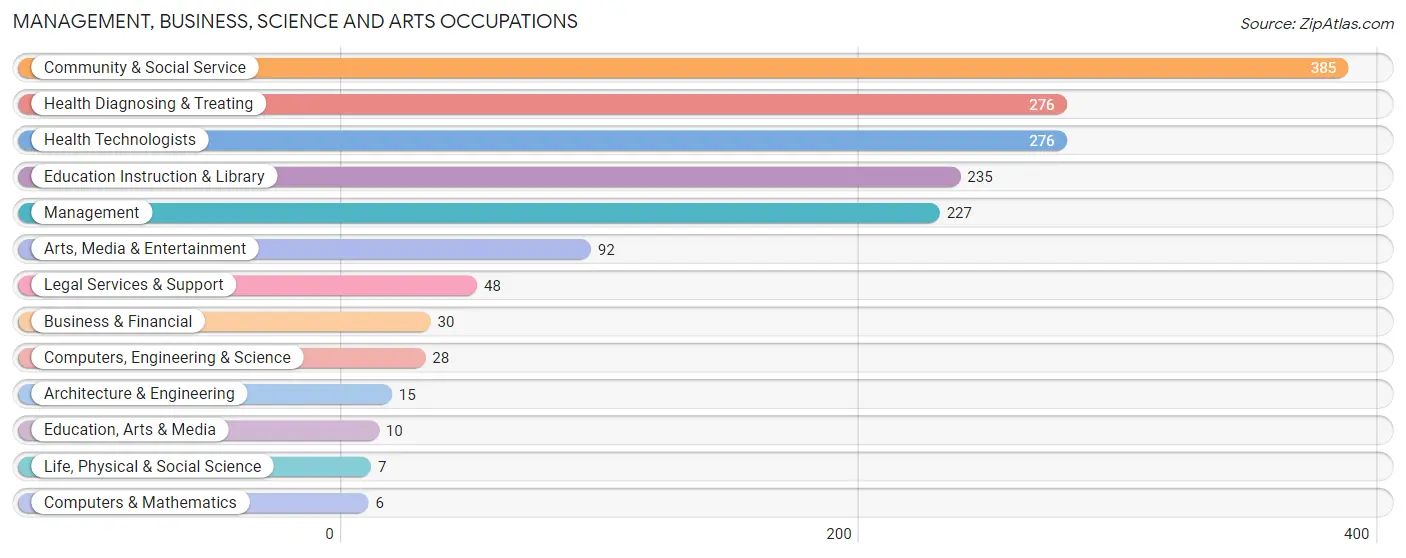
Management, Business, Science and Arts Occupations
The most common Management, Business, Science and Arts occupations in Brookville are Community & Social Service (385 | 26.5%), Health Diagnosing & Treating (276 | 19.0%), Health Technologists (276 | 19.0%), Education Instruction & Library (235 | 16.2%), and Management (227 | 15.6%).
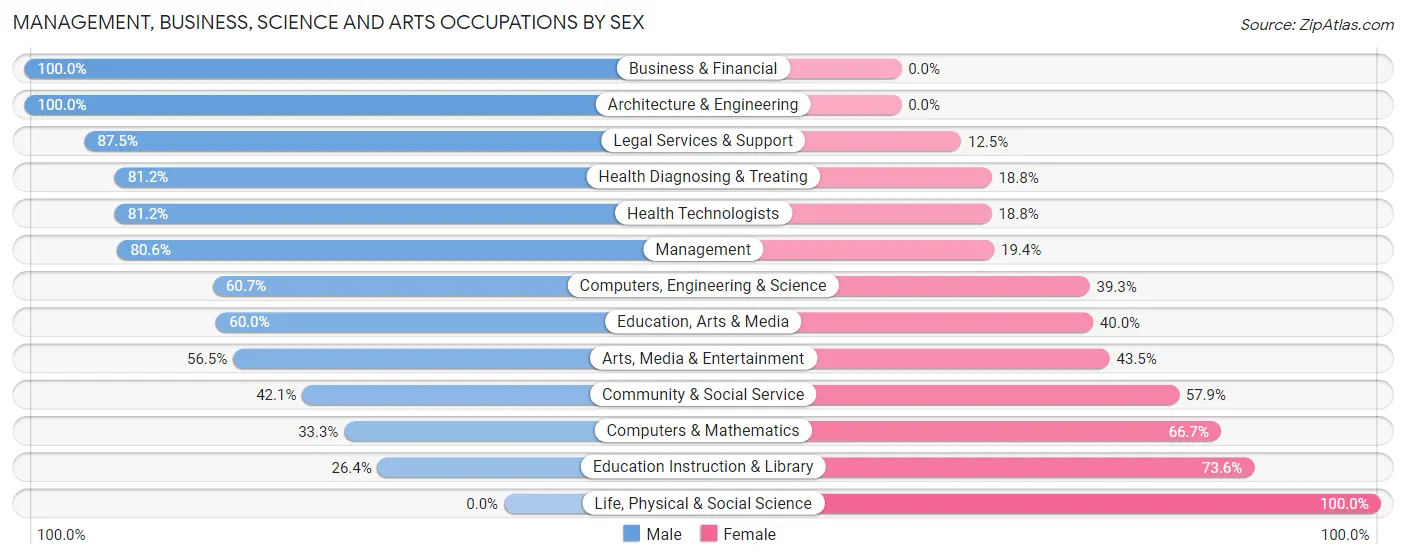
Management, Business, Science and Arts Occupations by Sex
Within the Management, Business, Science and Arts occupations in Brookville, the most male-oriented occupations are Business & Financial (100.0%), Architecture & Engineering (100.0%), and Legal Services & Support (87.5%), while the most female-oriented occupations are Life, Physical & Social Science (100.0%), Education Instruction & Library (73.6%), and Computers & Mathematics (66.7%).
| Occupation | Male | Female |
| Management | 183 (80.6%) | 44 (19.4%) |
| Business & Financial | 30 (100.0%) | 0 (0.0%) |
| Computers, Engineering & Science | 17 (60.7%) | 11 (39.3%) |
| Computers & Mathematics | 2 (33.3%) | 4 (66.7%) |
| Architecture & Engineering | 15 (100.0%) | 0 (0.0%) |
| Life, Physical & Social Science | 0 (0.0%) | 7 (100.0%) |
| Community & Social Service | 162 (42.1%) | 223 (57.9%) |
| Education, Arts & Media | 6 (60.0%) | 4 (40.0%) |
| Legal Services & Support | 42 (87.5%) | 6 (12.5%) |
| Education Instruction & Library | 62 (26.4%) | 173 (73.6%) |
| Arts, Media & Entertainment | 52 (56.5%) | 40 (43.5%) |
| Health Diagnosing & Treating | 224 (81.2%) | 52 (18.8%) |
| Health Technologists | 224 (81.2%) | 52 (18.8%) |
| Total (Category) | 616 (65.1%) | 330 (34.9%) |
| Total (Overall) | 810 (55.8%) | 642 (44.2%) |
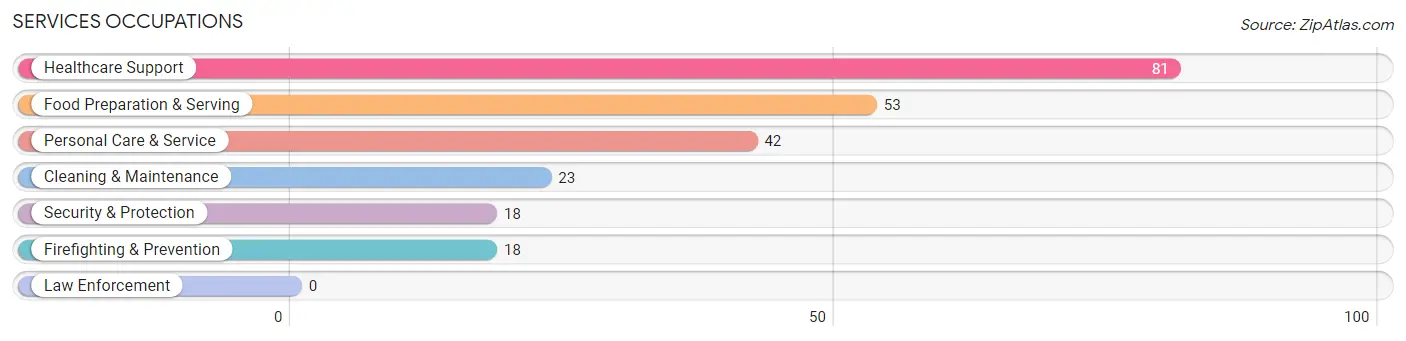
Services Occupations
The most common Services occupations in Brookville are Healthcare Support (81 | 5.6%), Food Preparation & Serving (53 | 3.6%), Personal Care & Service (42 | 2.9%), Cleaning & Maintenance (23 | 1.6%), and Security & Protection (18 | 1.2%).
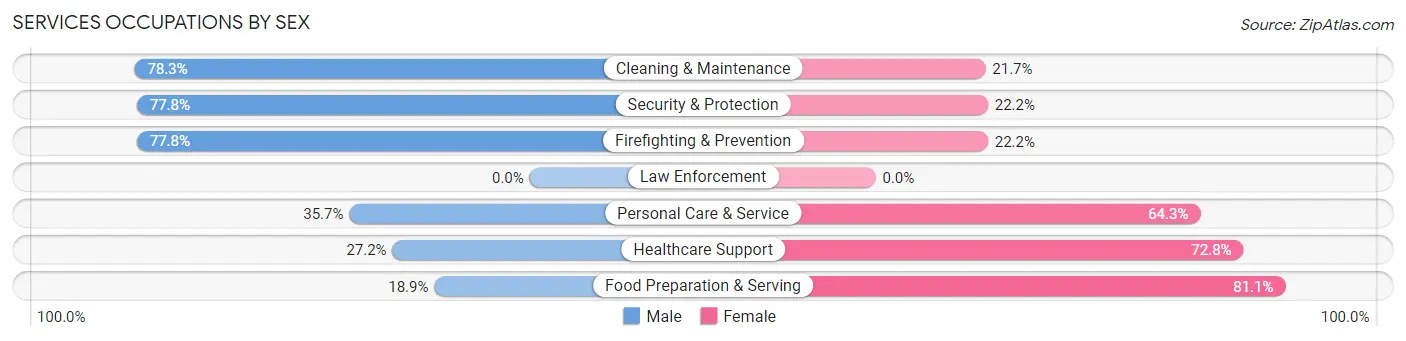
Services Occupations by Sex
Within the Services occupations in Brookville, the most male-oriented occupations are Cleaning & Maintenance (78.3%), Security & Protection (77.8%), and Firefighting & Prevention (77.8%), while the most female-oriented occupations are Food Preparation & Serving (81.1%), Healthcare Support (72.8%), and Personal Care & Service (64.3%).
| Occupation | Male | Female |
| Healthcare Support | 22 (27.2%) | 59 (72.8%) |
| Security & Protection | 14 (77.8%) | 4 (22.2%) |
| Firefighting & Prevention | 14 (77.8%) | 4 (22.2%) |
| Law Enforcement | 0 (0.0%) | 0 (0.0%) |
| Food Preparation & Serving | 10 (18.9%) | 43 (81.1%) |
| Cleaning & Maintenance | 18 (78.3%) | 5 (21.7%) |
| Personal Care & Service | 15 (35.7%) | 27 (64.3%) |
| Total (Category) | 79 (36.4%) | 138 (63.6%) |
| Total (Overall) | 810 (55.8%) | 642 (44.2%) |
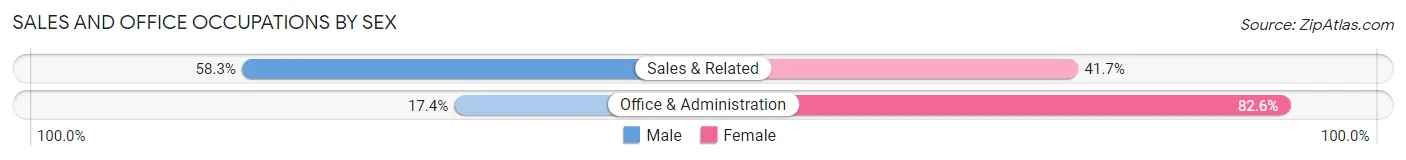
Sales and Office Occupations
The most common Sales and Office occupations in Brookville are Office & Administration (132 | 9.1%), and Sales & Related (115 | 7.9%).

Sales and Office Occupations by Sex
| Occupation | Male | Female |
| Sales & Related | 67 (58.3%) | 48 (41.7%) |
| Office & Administration | 23 (17.4%) | 109 (82.6%) |
| Total (Category) | 90 (36.4%) | 157 (63.6%) |
| Total (Overall) | 810 (55.8%) | 642 (44.2%) |
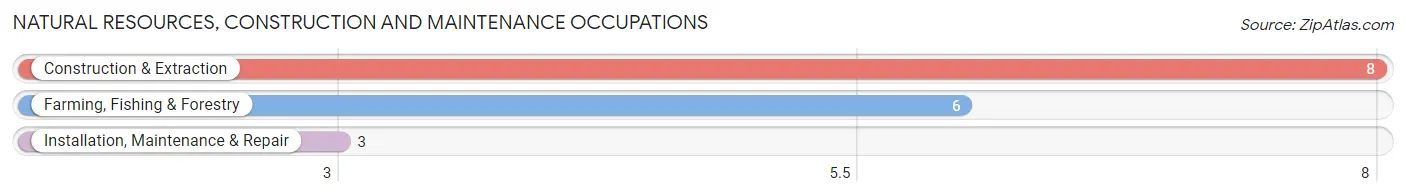
Natural Resources, Construction and Maintenance Occupations
The most common Natural Resources, Construction and Maintenance occupations in Brookville are Construction & Extraction (8 | 0.5%), Farming, Fishing & Forestry (6 | 0.4%), and Installation, Maintenance & Repair (3 | 0.2%).
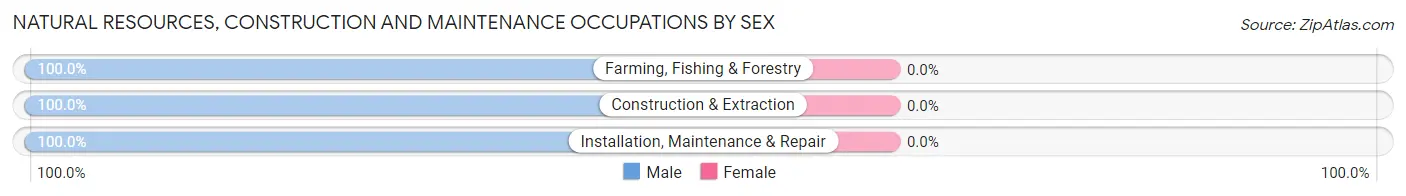
Natural Resources, Construction and Maintenance Occupations by Sex
| Occupation | Male | Female |
| Farming, Fishing & Forestry | 6 (100.0%) | 0 (0.0%) |
| Construction & Extraction | 8 (100.0%) | 0 (0.0%) |
| Installation, Maintenance & Repair | 3 (100.0%) | 0 (0.0%) |
| Total (Category) | 17 (100.0%) | 0 (0.0%) |
| Total (Overall) | 810 (55.8%) | 642 (44.2%) |
Production, Transportation and Moving Occupations
The most common Production, Transportation and Moving occupations in Brookville are Production (15 | 1.0%), and Material Moving (10 | 0.7%).
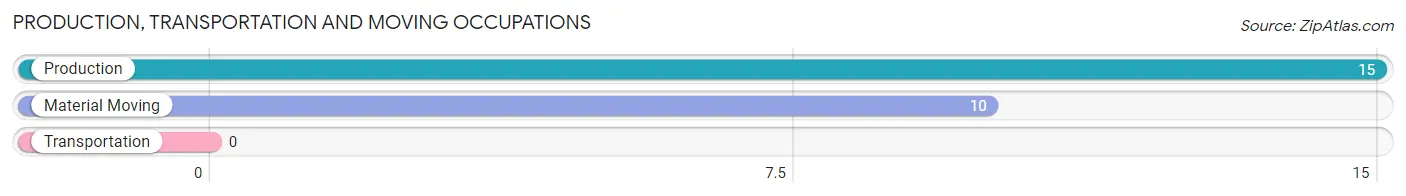
Production, Transportation and Moving Occupations by Sex
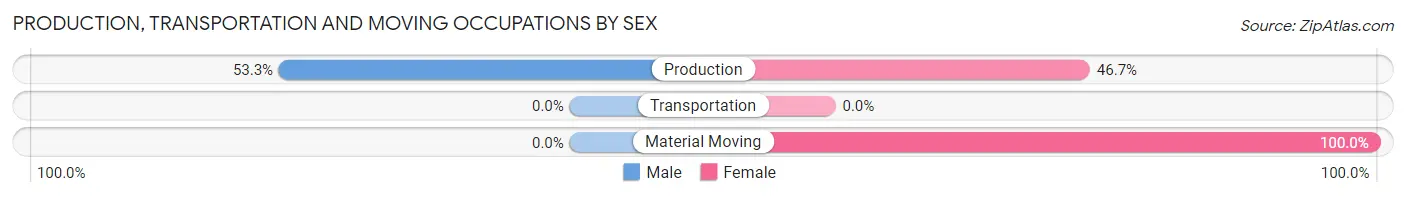
| Occupation | Male | Female |
| Production | 8 (53.3%) | 7 (46.7%) |
| Transportation | 0 (0.0%) | 0 (0.0%) |
| Material Moving | 0 (0.0%) | 10 (100.0%) |
| Total (Category) | 8 (32.0%) | 17 (68.0%) |
| Total (Overall) | 810 (55.8%) | 642 (44.2%) |
Employment Industries by Sex in Brookville
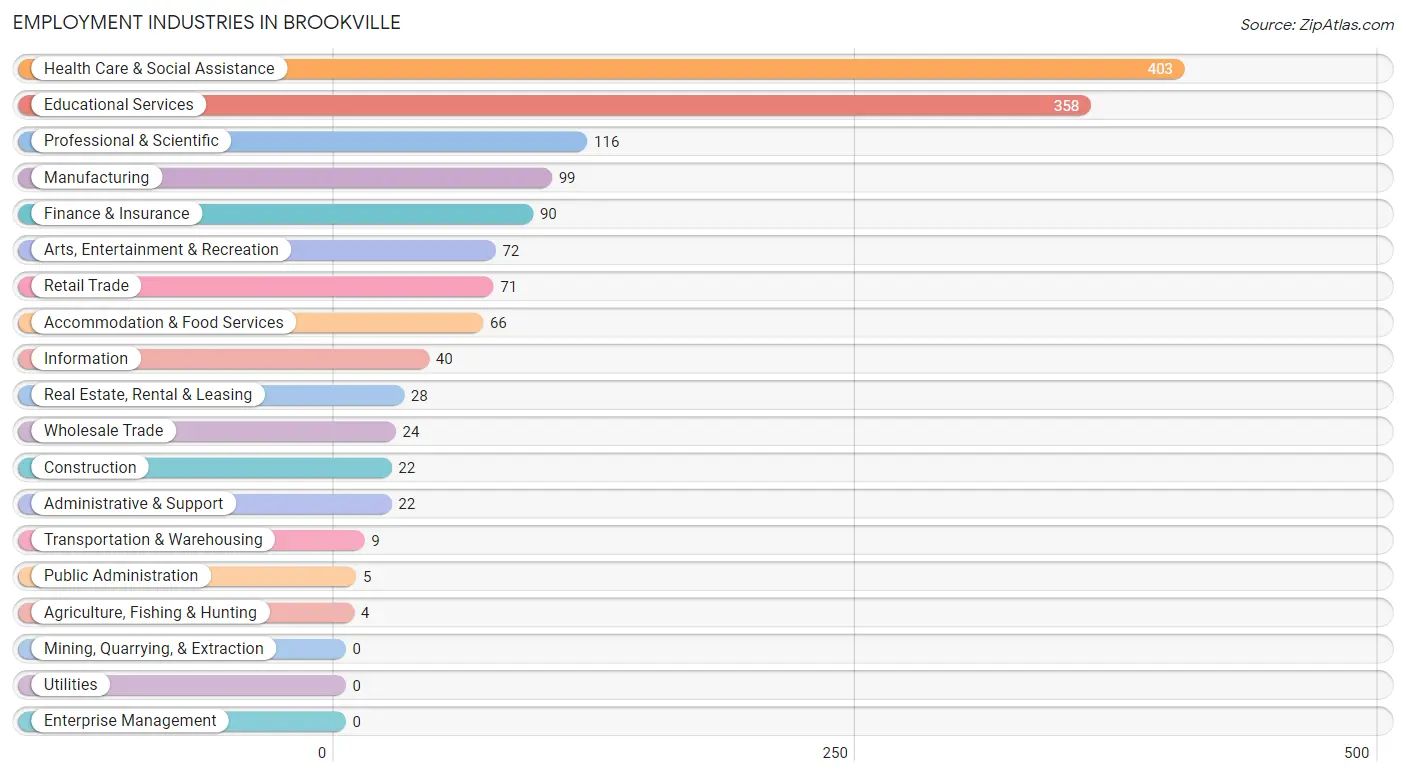
Employment Industries in Brookville
The major employment industries in Brookville include Health Care & Social Assistance (403 | 27.8%), Educational Services (358 | 24.7%), Professional & Scientific (116 | 8.0%), Manufacturing (99 | 6.8%), and Finance & Insurance (90 | 6.2%).
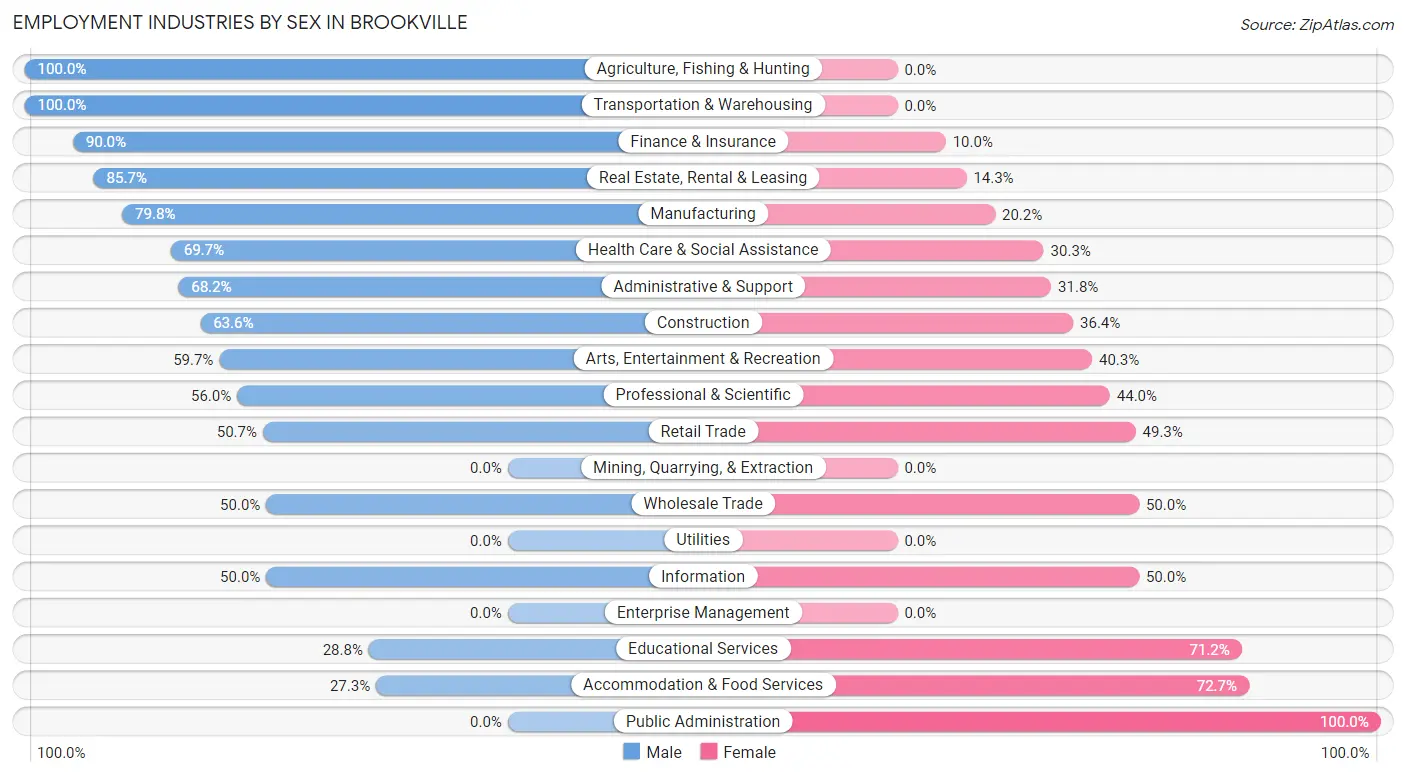
Employment Industries by Sex in Brookville
The Brookville industries that see more men than women are Agriculture, Fishing & Hunting (100.0%), Transportation & Warehousing (100.0%), and Finance & Insurance (90.0%), whereas the industries that tend to have a higher number of women are Public Administration (100.0%), Accommodation & Food Services (72.7%), and Educational Services (71.2%).
| Industry | Male | Female |
| Agriculture, Fishing & Hunting | 4 (100.0%) | 0 (0.0%) |
| Mining, Quarrying, & Extraction | 0 (0.0%) | 0 (0.0%) |
| Construction | 14 (63.6%) | 8 (36.4%) |
| Manufacturing | 79 (79.8%) | 20 (20.2%) |
| Wholesale Trade | 12 (50.0%) | 12 (50.0%) |
| Retail Trade | 36 (50.7%) | 35 (49.3%) |
| Transportation & Warehousing | 9 (100.0%) | 0 (0.0%) |
| Utilities | 0 (0.0%) | 0 (0.0%) |
| Information | 20 (50.0%) | 20 (50.0%) |
| Finance & Insurance | 81 (90.0%) | 9 (10.0%) |
| Real Estate, Rental & Leasing | 24 (85.7%) | 4 (14.3%) |
| Professional & Scientific | 65 (56.0%) | 51 (44.0%) |
| Enterprise Management | 0 (0.0%) | 0 (0.0%) |
| Administrative & Support | 15 (68.2%) | 7 (31.8%) |
| Educational Services | 103 (28.8%) | 255 (71.2%) |
| Health Care & Social Assistance | 281 (69.7%) | 122 (30.3%) |
| Arts, Entertainment & Recreation | 43 (59.7%) | 29 (40.3%) |
| Accommodation & Food Services | 18 (27.3%) | 48 (72.7%) |
| Public Administration | 0 (0.0%) | 5 (100.0%) |
| Total | 810 (55.8%) | 642 (44.2%) |
Education in Brookville
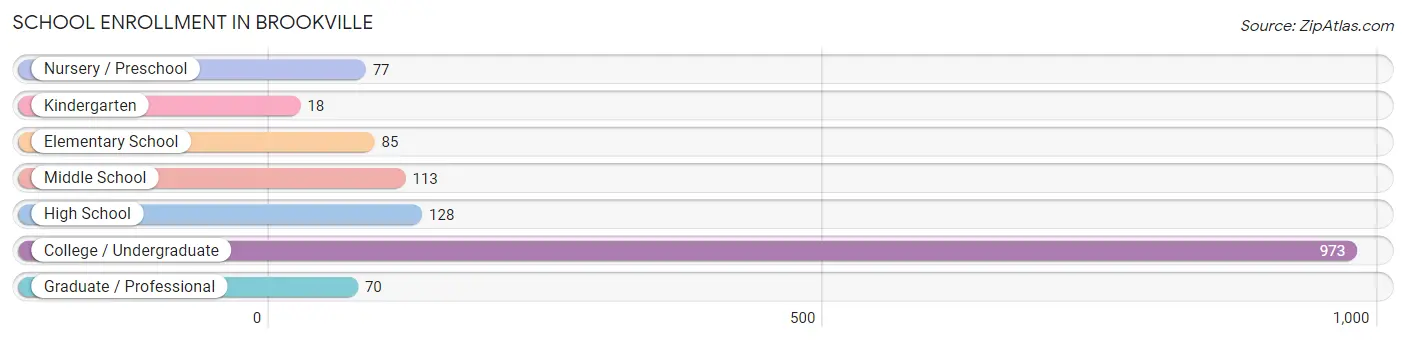
School Enrollment in Brookville
The most common levels of schooling among the 1,464 students in Brookville are college / undergraduate (973 | 66.5%), high school (128 | 8.7%), and middle school (113 | 7.7%).
| School Level | # Students | % Students |
| Nursery / Preschool | 77 | 5.3% |
| Kindergarten | 18 | 1.2% |
| Elementary School | 85 | 5.8% |
| Middle School | 113 | 7.7% |
| High School | 128 | 8.7% |
| College / Undergraduate | 973 | 66.5% |
| Graduate / Professional | 70 | 4.8% |
| Total | 1,464 | 100.0% |
School Enrollment by Age by Funding Source in Brookville
Out of a total of 1,464 students who are enrolled in schools in Brookville, 959 (65.5%) attend a private institution, while the remaining 505 (34.5%) are enrolled in public schools. The age group of 35 years and over has the highest likelihood of being enrolled in private schools, with 23 (100.0% in the age bracket) enrolled. Conversely, the age group of 15 to 17 year olds has the lowest likelihood of being enrolled in a private school, with 98 (74.2% in the age bracket) attending a public institution.
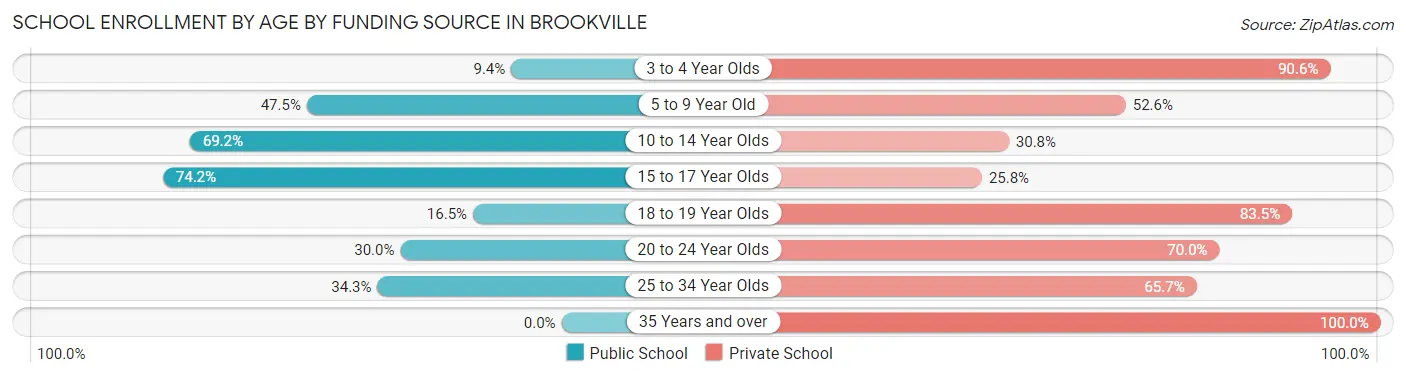
| Age Bracket | Public School | Private School |
| 3 to 4 Year Olds | 3 (9.4%) | 29 (90.6%) |
| 5 to 9 Year Old | 65 (47.4%) | 72 (52.5%) |
| 10 to 14 Year Olds | 90 (69.2%) | 40 (30.8%) |
| 15 to 17 Year Olds | 98 (74.2%) | 34 (25.8%) |
| 18 to 19 Year Olds | 68 (16.5%) | 344 (83.5%) |
| 20 to 24 Year Olds | 169 (30.0%) | 394 (70.0%) |
| 25 to 34 Year Olds | 12 (34.3%) | 23 (65.7%) |
| 35 Years and over | 0 (0.0%) | 23 (100.0%) |
| Total | 505 (34.5%) | 959 (65.5%) |
Educational Attainment by Field of Study in Brookville
Business (286 | 23.1%), bio, nature & agricultural (252 | 20.4%), social sciences (107 | 8.6%), science & technology (102 | 8.2%), and psychology (89 | 7.2%) are the most common fields of study among 1,238 individuals in Brookville who have obtained a bachelor's degree or higher.
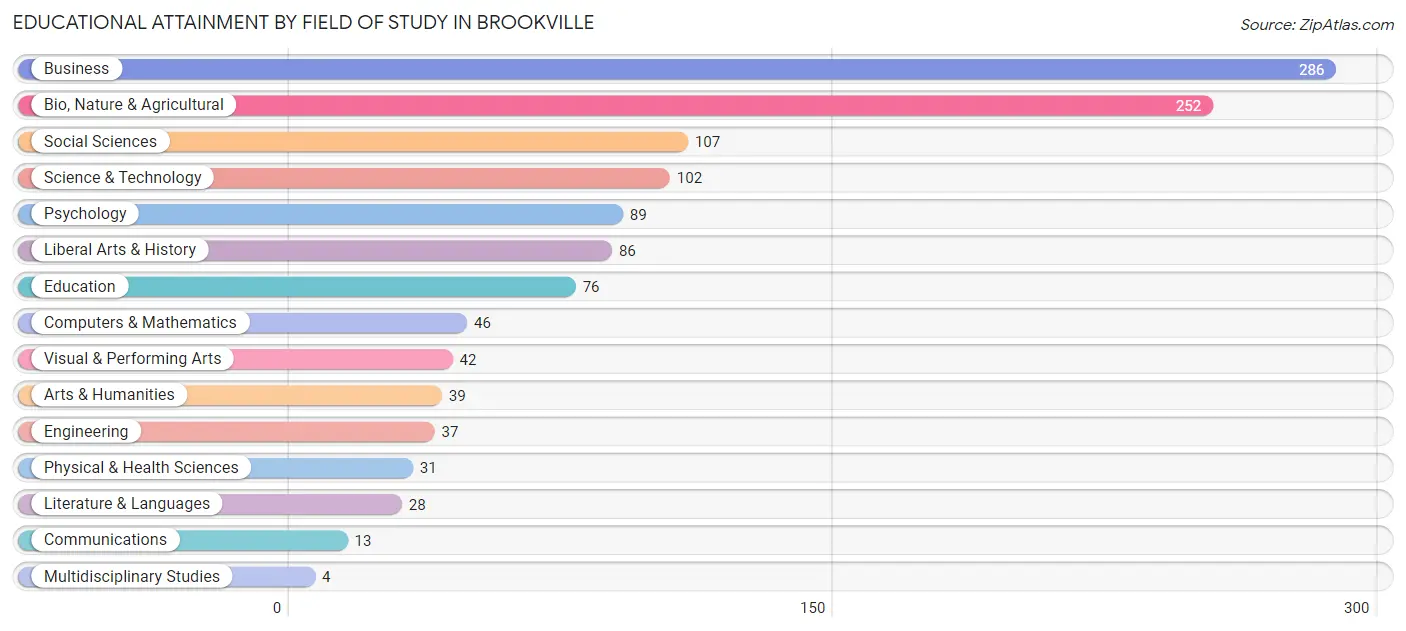
| Field of Study | # Graduates | % Graduates |
| Computers & Mathematics | 46 | 3.7% |
| Bio, Nature & Agricultural | 252 | 20.4% |
| Physical & Health Sciences | 31 | 2.5% |
| Psychology | 89 | 7.2% |
| Social Sciences | 107 | 8.6% |
| Engineering | 37 | 3.0% |
| Multidisciplinary Studies | 4 | 0.3% |
| Science & Technology | 102 | 8.2% |
| Business | 286 | 23.1% |
| Education | 76 | 6.1% |
| Literature & Languages | 28 | 2.3% |
| Liberal Arts & History | 86 | 7.0% |
| Visual & Performing Arts | 42 | 3.4% |
| Communications | 13 | 1.1% |
| Arts & Humanities | 39 | 3.2% |
| Total | 1,238 | 100.0% |
Transportation & Commute in Brookville
Vehicle Availability by Sex in Brookville
The most prevalent vehicle ownership categories in Brookville are males with 3 vehicles (339, accounting for 50.1%) and females with 3 vehicles (191, making up 82.9%).
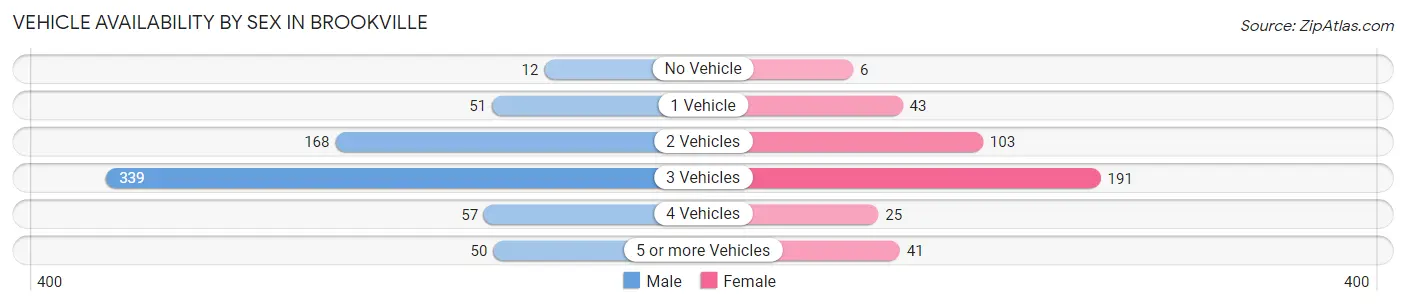
| Vehicles Available | Male | Female |
| No Vehicle | 12 (1.8%) | 6 (1.5%) |
| 1 Vehicle | 51 (7.5%) | 43 (10.5%) |
| 2 Vehicles | 168 (24.8%) | 103 (25.2%) |
| 3 Vehicles | 339 (50.1%) | 191 (46.7%) |
| 4 Vehicles | 57 (8.4%) | 25 (6.1%) |
| 5 or more Vehicles | 50 (7.4%) | 41 (10.0%) |
| Total | 677 (100.0%) | 409 (100.0%) |
Commute Time in Brookville
The most frequently occuring commute durations in Brookville are 25 to 29 minutes (255 commuters, 21.8%), 10 to 14 minutes (188 commuters, 16.0%), and 20 to 24 minutes (146 commuters, 12.5%).
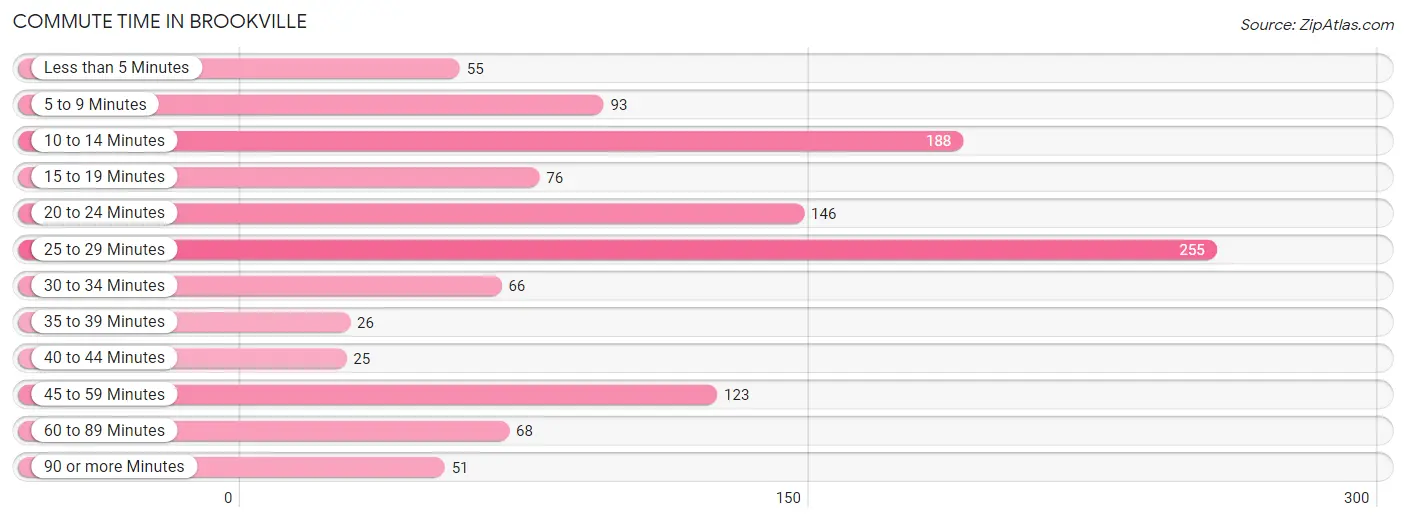
| Commute Time | # Commuters | % Commuters |
| Less than 5 Minutes | 55 | 4.7% |
| 5 to 9 Minutes | 93 | 7.9% |
| 10 to 14 Minutes | 188 | 16.0% |
| 15 to 19 Minutes | 76 | 6.5% |
| 20 to 24 Minutes | 146 | 12.5% |
| 25 to 29 Minutes | 255 | 21.8% |
| 30 to 34 Minutes | 66 | 5.6% |
| 35 to 39 Minutes | 26 | 2.2% |
| 40 to 44 Minutes | 25 | 2.1% |
| 45 to 59 Minutes | 123 | 10.5% |
| 60 to 89 Minutes | 68 | 5.8% |
| 90 or more Minutes | 51 | 4.3% |
Commute Time by Sex in Brookville
The most common commute times in Brookville are 25 to 29 minutes (221 commuters, 33.1%) for males and 20 to 24 minutes (104 commuters, 20.6%) for females.
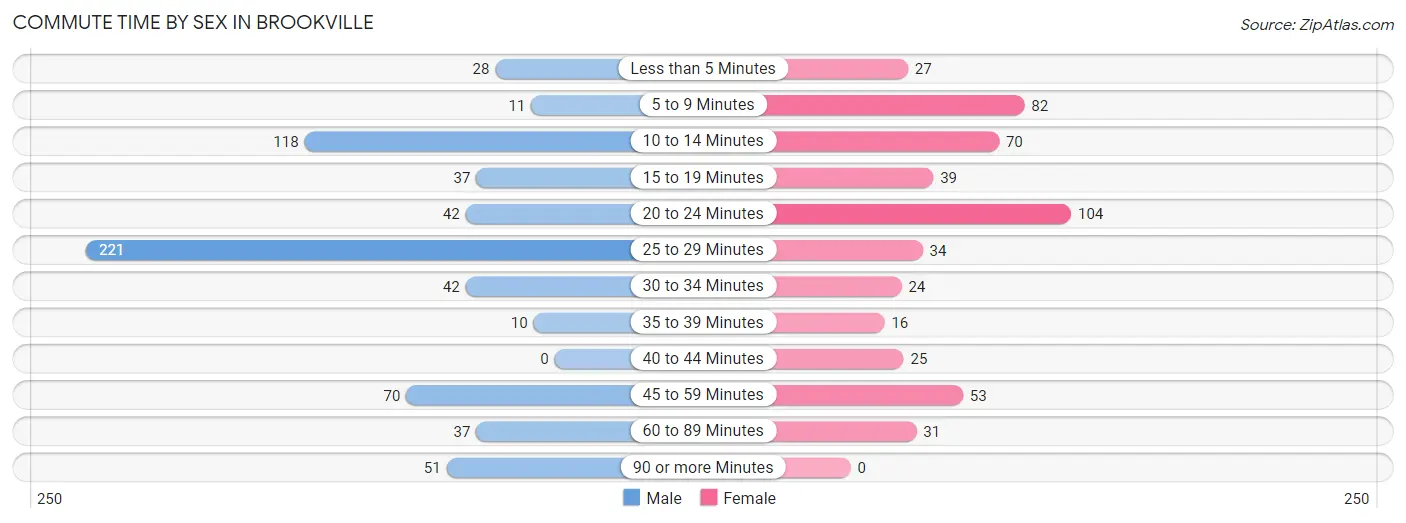
| Commute Time | Male | Female |
| Less than 5 Minutes | 28 (4.2%) | 27 (5.3%) |
| 5 to 9 Minutes | 11 (1.7%) | 82 (16.2%) |
| 10 to 14 Minutes | 118 (17.7%) | 70 (13.9%) |
| 15 to 19 Minutes | 37 (5.6%) | 39 (7.7%) |
| 20 to 24 Minutes | 42 (6.3%) | 104 (20.6%) |
| 25 to 29 Minutes | 221 (33.1%) | 34 (6.7%) |
| 30 to 34 Minutes | 42 (6.3%) | 24 (4.8%) |
| 35 to 39 Minutes | 10 (1.5%) | 16 (3.2%) |
| 40 to 44 Minutes | 0 (0.0%) | 25 (5.0%) |
| 45 to 59 Minutes | 70 (10.5%) | 53 (10.5%) |
| 60 to 89 Minutes | 37 (5.6%) | 31 (6.1%) |
| 90 or more Minutes | 51 (7.6%) | 0 (0.0%) |
Time of Departure to Work by Sex in Brookville
The most frequent times of departure to work in Brookville are 8:30 AM to 8:59 AM (228, 34.2%) for males and 7:30 AM to 7:59 AM (96, 19.0%) for females.
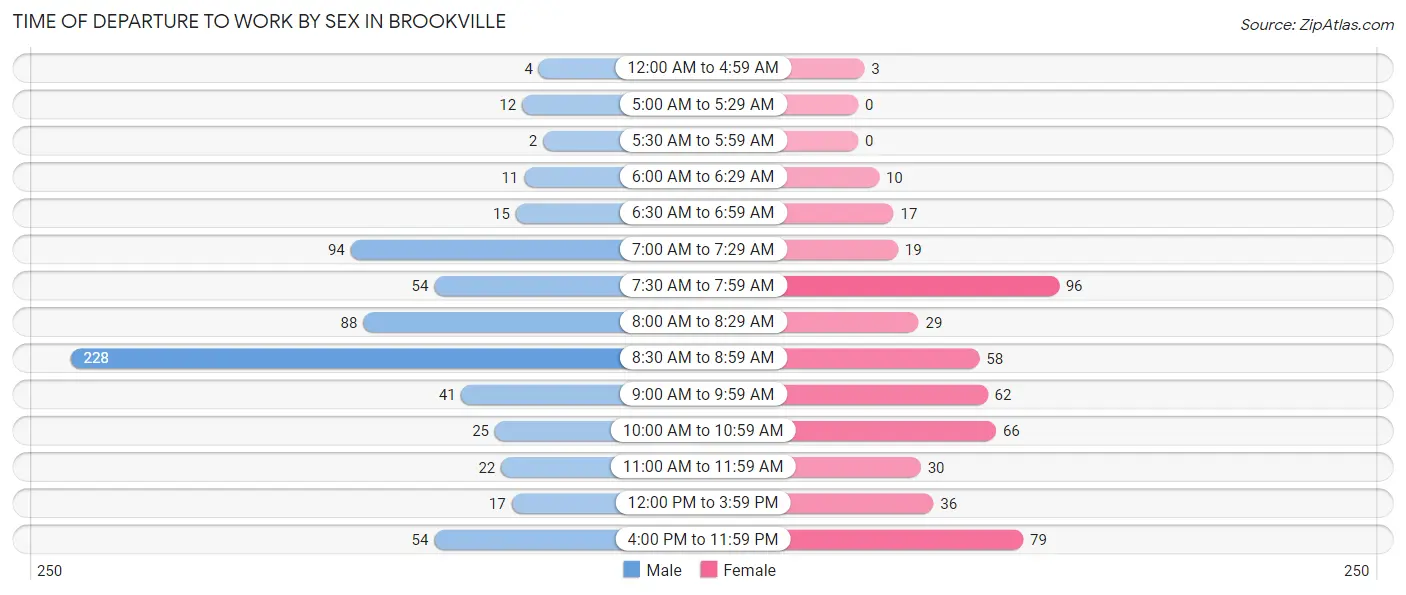
| Time of Departure | Male | Female |
| 12:00 AM to 4:59 AM | 4 (0.6%) | 3 (0.6%) |
| 5:00 AM to 5:29 AM | 12 (1.8%) | 0 (0.0%) |
| 5:30 AM to 5:59 AM | 2 (0.3%) | 0 (0.0%) |
| 6:00 AM to 6:29 AM | 11 (1.7%) | 10 (2.0%) |
| 6:30 AM to 6:59 AM | 15 (2.2%) | 17 (3.4%) |
| 7:00 AM to 7:29 AM | 94 (14.1%) | 19 (3.8%) |
| 7:30 AM to 7:59 AM | 54 (8.1%) | 96 (19.0%) |
| 8:00 AM to 8:29 AM | 88 (13.2%) | 29 (5.7%) |
| 8:30 AM to 8:59 AM | 228 (34.2%) | 58 (11.5%) |
| 9:00 AM to 9:59 AM | 41 (6.1%) | 62 (12.3%) |
| 10:00 AM to 10:59 AM | 25 (3.7%) | 66 (13.1%) |
| 11:00 AM to 11:59 AM | 22 (3.3%) | 30 (5.9%) |
| 12:00 PM to 3:59 PM | 17 (2.5%) | 36 (7.1%) |
| 4:00 PM to 11:59 PM | 54 (8.1%) | 79 (15.6%) |
| Total | 667 (100.0%) | 505 (100.0%) |
Housing Occupancy in Brookville
Occupancy by Ownership in Brookville
Of the total 764 dwellings in Brookville, owner-occupied units account for 695 (91.0%), while renter-occupied units make up 69 (9.0%).
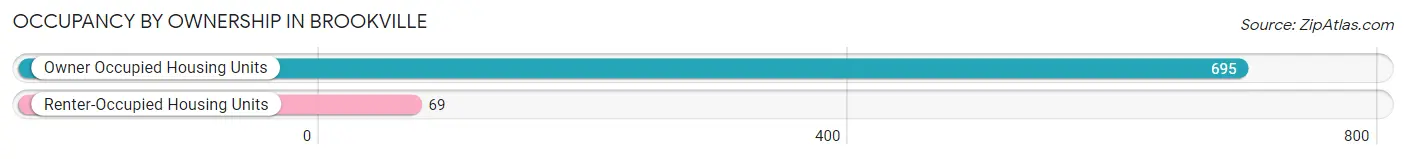
| Occupancy | # Housing Units | % Housing Units |
| Owner Occupied Housing Units | 695 | 91.0% |
| Renter-Occupied Housing Units | 69 | 9.0% |
| Total Occupied Housing Units | 764 | 100.0% |
Occupancy by Household Size in Brookville
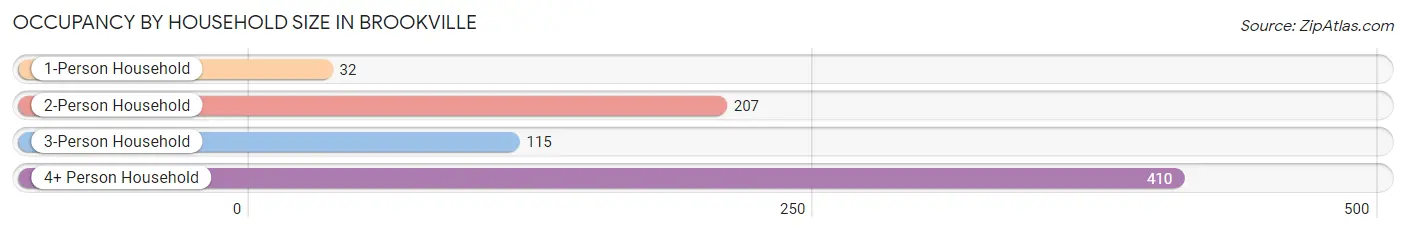
| Household Size | # Housing Units | % Housing Units |
| 1-Person Household | 32 | 4.2% |
| 2-Person Household | 207 | 27.1% |
| 3-Person Household | 115 | 15.0% |
| 4+ Person Household | 410 | 53.7% |
| Total Housing Units | 764 | 100.0% |
Occupancy by Ownership by Household Size in Brookville
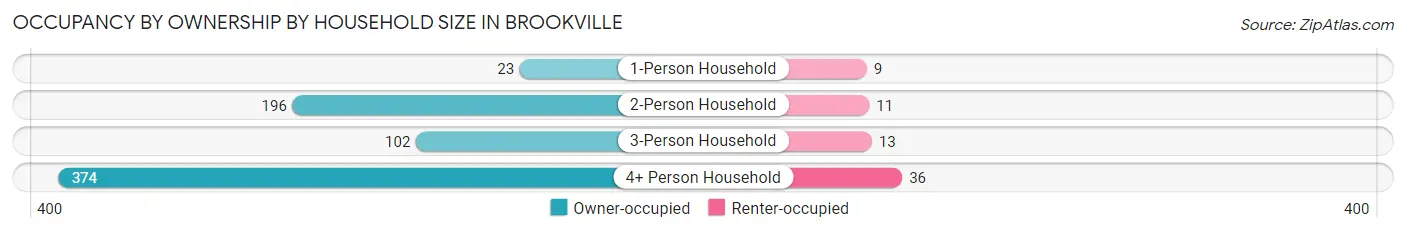
| Household Size | Owner-occupied | Renter-occupied |
| 1-Person Household | 23 (71.9%) | 9 (28.1%) |
| 2-Person Household | 196 (94.7%) | 11 (5.3%) |
| 3-Person Household | 102 (88.7%) | 13 (11.3%) |
| 4+ Person Household | 374 (91.2%) | 36 (8.8%) |
| Total Housing Units | 695 (91.0%) | 69 (9.0%) |
Occupancy by Educational Attainment in Brookville
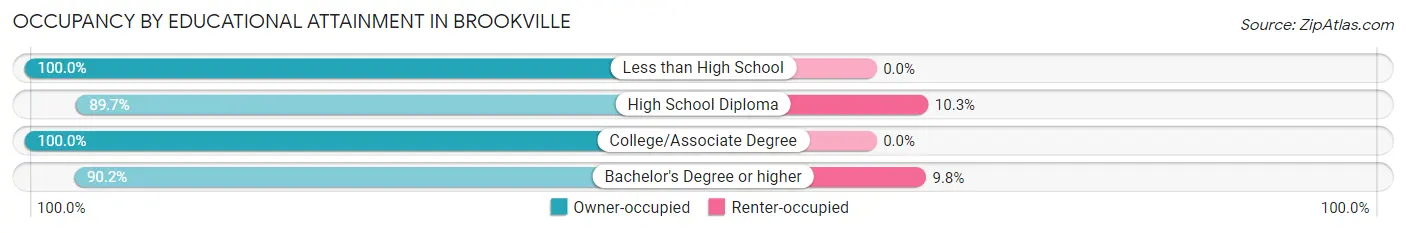
| Household Size | Owner-occupied | Renter-occupied |
| Less than High School | 10 (100.0%) | 0 (0.0%) |
| High School Diploma | 35 (89.7%) | 4 (10.3%) |
| College/Associate Degree | 51 (100.0%) | 0 (0.0%) |
| Bachelor's Degree or higher | 599 (90.2%) | 65 (9.8%) |
Occupancy by Age of Householder in Brookville
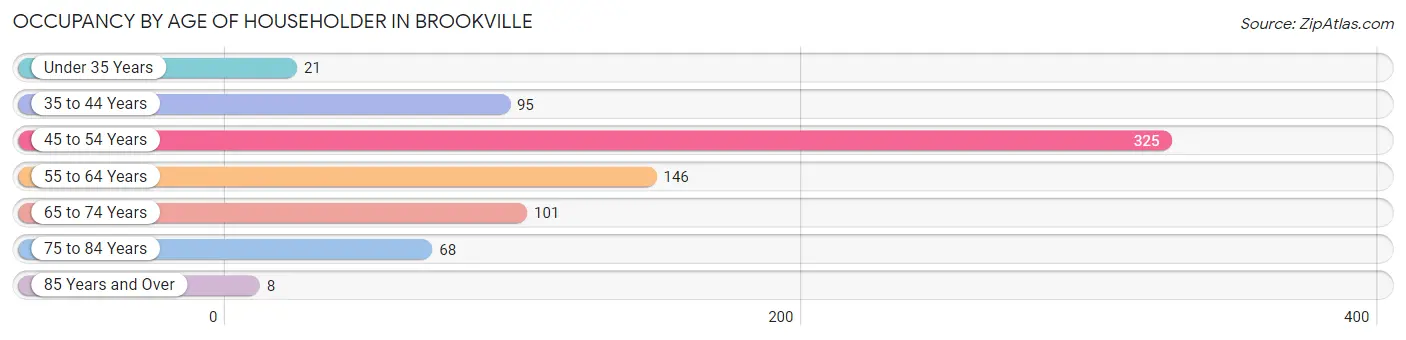
| Age Bracket | # Households | % Households |
| Under 35 Years | 21 | 2.8% |
| 35 to 44 Years | 95 | 12.4% |
| 45 to 54 Years | 325 | 42.5% |
| 55 to 64 Years | 146 | 19.1% |
| 65 to 74 Years | 101 | 13.2% |
| 75 to 84 Years | 68 | 8.9% |
| 85 Years and Over | 8 | 1.1% |
| Total | 764 | 100.0% |
Housing Finances in Brookville
Median Income by Occupancy in Brookville
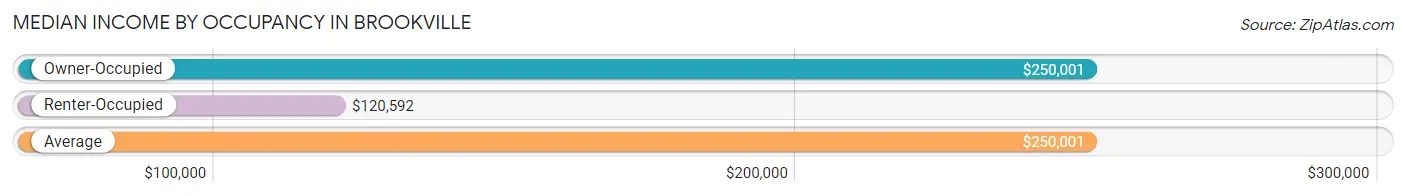
| Occupancy Type | # Households | Median Income |
| Owner-Occupied | 695 (91.0%) | $250,001 |
| Renter-Occupied | 69 (9.0%) | $120,592 |
| Average | 764 (100.0%) | $250,001 |
Occupancy by Householder Income Bracket in Brookville
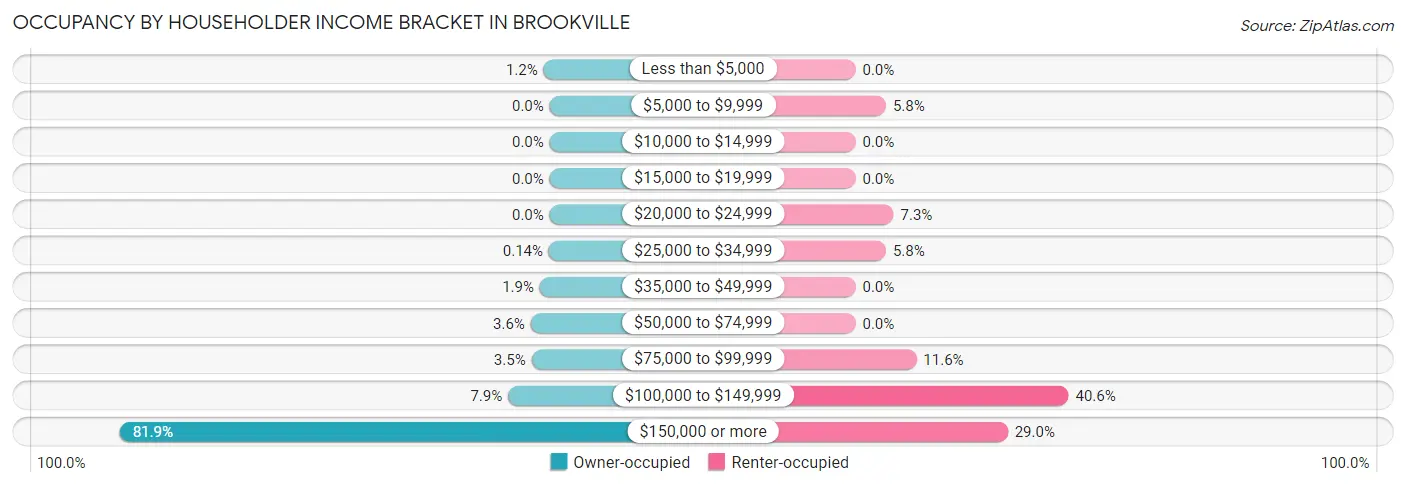
| Income Bracket | Owner-occupied | Renter-occupied |
| Less than $5,000 | 8 (1.1%) | 0 (0.0%) |
| $5,000 to $9,999 | 0 (0.0%) | 4 (5.8%) |
| $10,000 to $14,999 | 0 (0.0%) | 0 (0.0%) |
| $15,000 to $19,999 | 0 (0.0%) | 0 (0.0%) |
| $20,000 to $24,999 | 0 (0.0%) | 5 (7.2%) |
| $25,000 to $34,999 | 1 (0.1%) | 4 (5.8%) |
| $35,000 to $49,999 | 13 (1.9%) | 0 (0.0%) |
| $50,000 to $74,999 | 25 (3.6%) | 0 (0.0%) |
| $75,000 to $99,999 | 24 (3.5%) | 8 (11.6%) |
| $100,000 to $149,999 | 55 (7.9%) | 28 (40.6%) |
| $150,000 or more | 569 (81.9%) | 20 (29.0%) |
| Total | 695 (100.0%) | 69 (100.0%) |
Monthly Housing Cost Tiers in Brookville
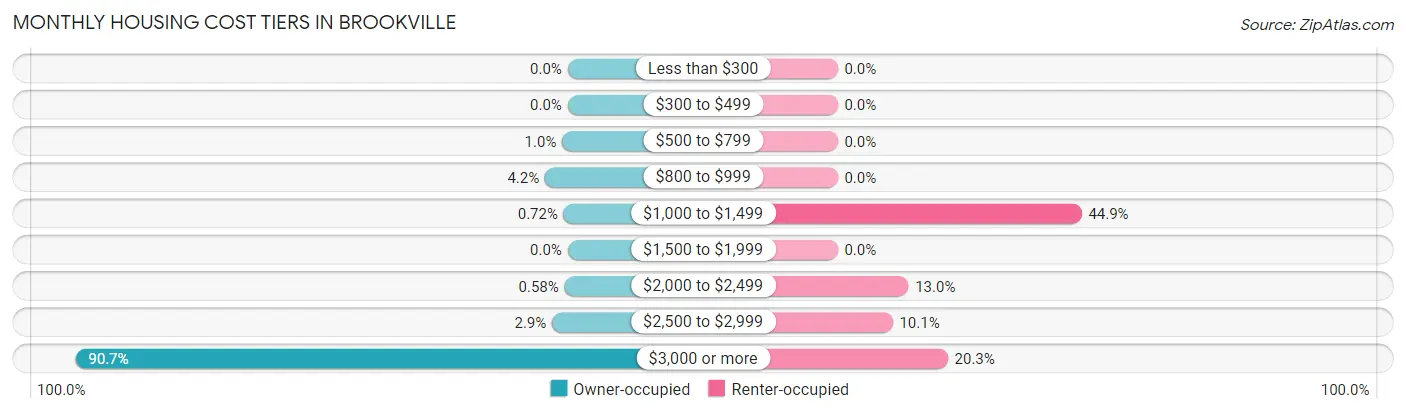
| Monthly Cost | Owner-occupied | Renter-occupied |
| Less than $300 | 0 (0.0%) | 0 (0.0%) |
| $300 to $499 | 0 (0.0%) | 0 (0.0%) |
| $500 to $799 | 7 (1.0%) | 0 (0.0%) |
| $800 to $999 | 29 (4.2%) | 0 (0.0%) |
| $1,000 to $1,499 | 5 (0.7%) | 31 (44.9%) |
| $1,500 to $1,999 | 0 (0.0%) | 0 (0.0%) |
| $2,000 to $2,499 | 4 (0.6%) | 9 (13.0%) |
| $2,500 to $2,999 | 20 (2.9%) | 7 (10.1%) |
| $3,000 or more | 630 (90.6%) | 14 (20.3%) |
| Total | 695 (100.0%) | 69 (100.0%) |
Physical Housing Characteristics in Brookville
Housing Structures in Brookville
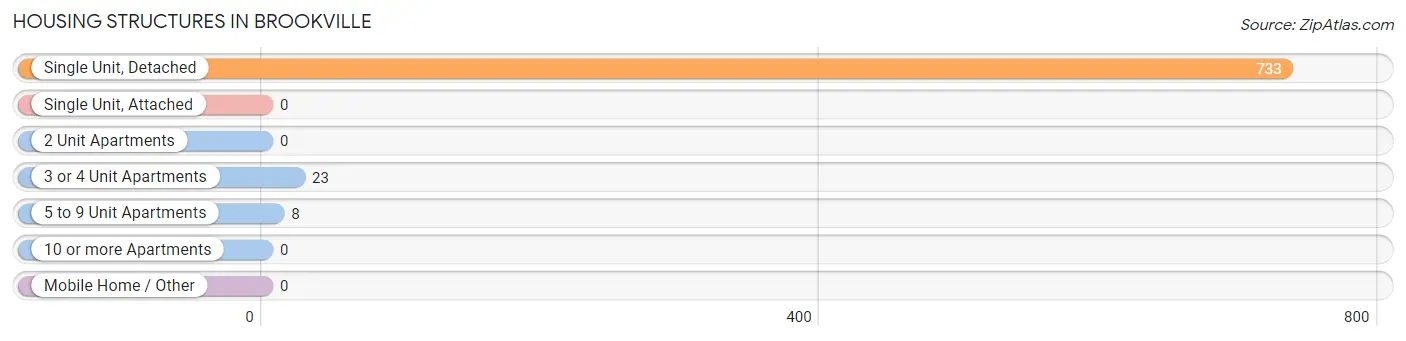
| Structure Type | # Housing Units | % Housing Units |
| Single Unit, Detached | 733 | 95.9% |
| Single Unit, Attached | 0 | 0.0% |
| 2 Unit Apartments | 0 | 0.0% |
| 3 or 4 Unit Apartments | 23 | 3.0% |
| 5 to 9 Unit Apartments | 8 | 1.1% |
| 10 or more Apartments | 0 | 0.0% |
| Mobile Home / Other | 0 | 0.0% |
| Total | 764 | 100.0% |
Housing Structures by Occupancy in Brookville
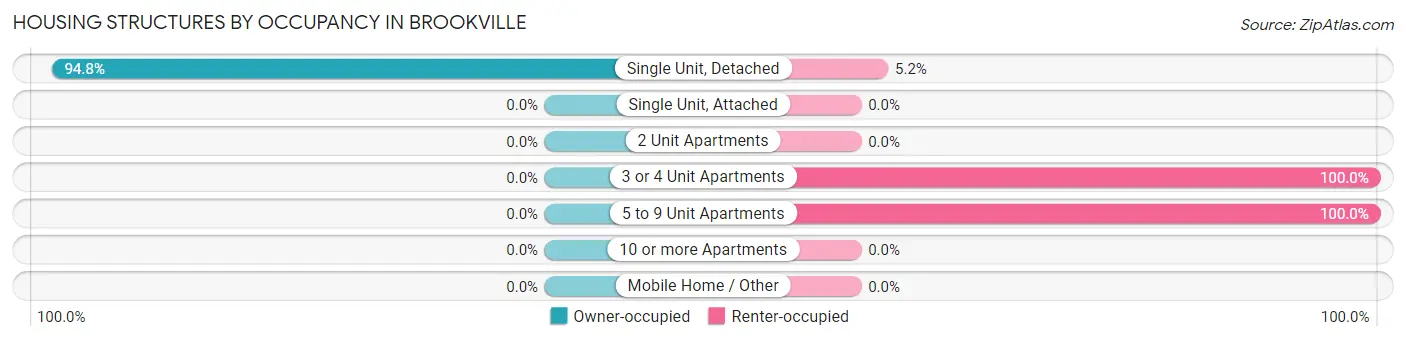
| Structure Type | Owner-occupied | Renter-occupied |
| Single Unit, Detached | 695 (94.8%) | 38 (5.2%) |
| Single Unit, Attached | 0 (0.0%) | 0 (0.0%) |
| 2 Unit Apartments | 0 (0.0%) | 0 (0.0%) |
| 3 or 4 Unit Apartments | 0 (0.0%) | 23 (100.0%) |
| 5 to 9 Unit Apartments | 0 (0.0%) | 8 (100.0%) |
| 10 or more Apartments | 0 (0.0%) | 0 (0.0%) |
| Mobile Home / Other | 0 (0.0%) | 0 (0.0%) |
| Total | 695 (91.0%) | 69 (9.0%) |
Housing Structures by Number of Rooms in Brookville
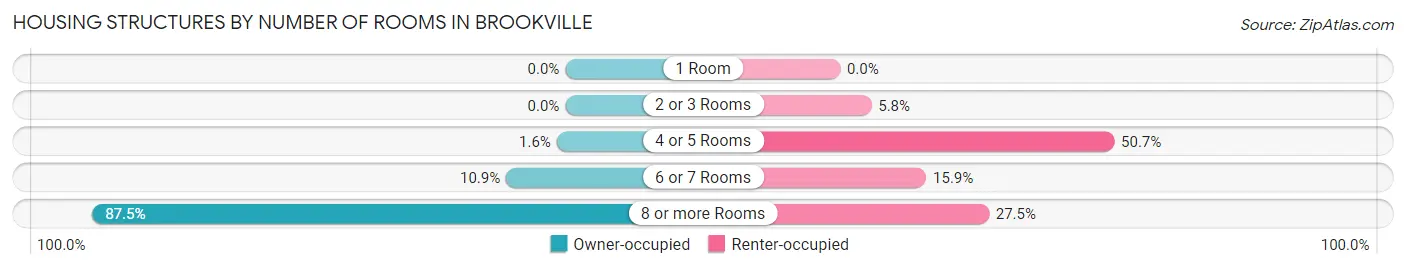
| Number of Rooms | Owner-occupied | Renter-occupied |
| 1 Room | 0 (0.0%) | 0 (0.0%) |
| 2 or 3 Rooms | 0 (0.0%) | 4 (5.8%) |
| 4 or 5 Rooms | 11 (1.6%) | 35 (50.7%) |
| 6 or 7 Rooms | 76 (10.9%) | 11 (15.9%) |
| 8 or more Rooms | 608 (87.5%) | 19 (27.5%) |
| Total | 695 (100.0%) | 69 (100.0%) |
Housing Structure by Heating Type in Brookville
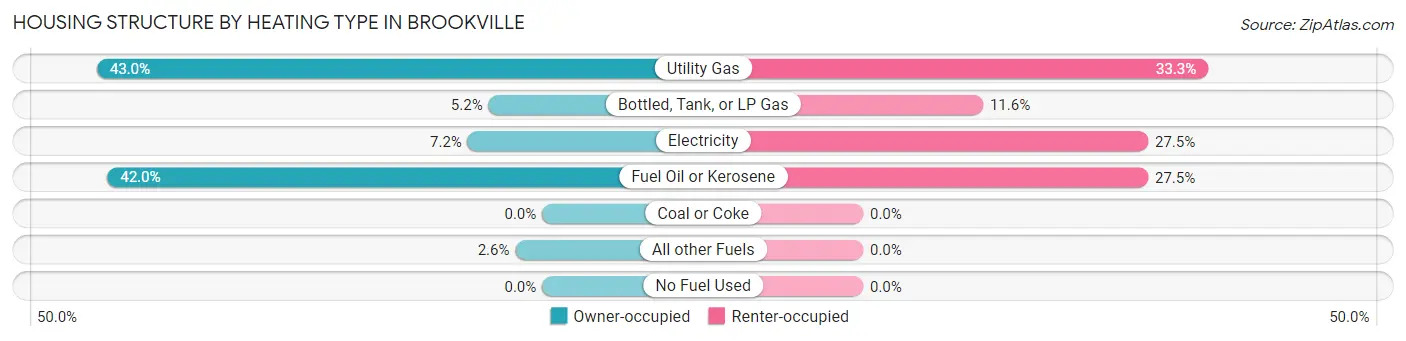
| Heating Type | Owner-occupied | Renter-occupied |
| Utility Gas | 299 (43.0%) | 23 (33.3%) |
| Bottled, Tank, or LP Gas | 36 (5.2%) | 8 (11.6%) |
| Electricity | 50 (7.2%) | 19 (27.5%) |
| Fuel Oil or Kerosene | 292 (42.0%) | 19 (27.5%) |
| Coal or Coke | 0 (0.0%) | 0 (0.0%) |
| All other Fuels | 18 (2.6%) | 0 (0.0%) |
| No Fuel Used | 0 (0.0%) | 0 (0.0%) |
| Total | 695 (100.0%) | 69 (100.0%) |
Household Vehicle Usage in Brookville
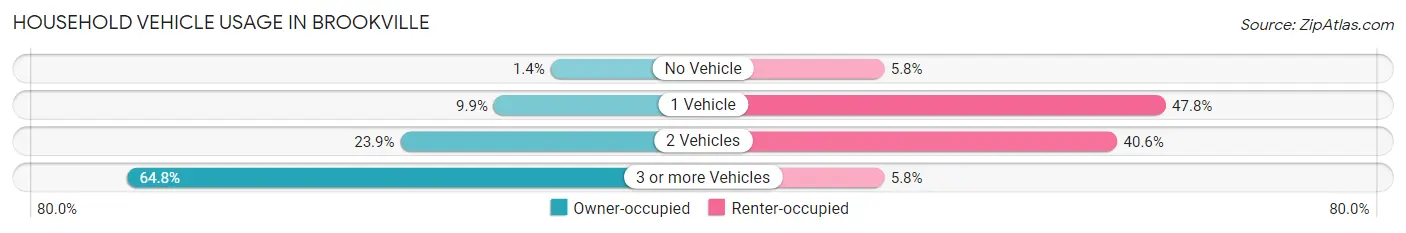
| Vehicles per Household | Owner-occupied | Renter-occupied |
| No Vehicle | 10 (1.4%) | 4 (5.8%) |
| 1 Vehicle | 69 (9.9%) | 33 (47.8%) |
| 2 Vehicles | 166 (23.9%) | 28 (40.6%) |
| 3 or more Vehicles | 450 (64.7%) | 4 (5.8%) |
| Total | 695 (100.0%) | 69 (100.0%) |
Real Estate & Mortgages in Brookville
Real Estate and Mortgage Overview in Brookville
| Characteristic | Without Mortgage | With Mortgage |
| Housing Units | 385 | 310 |
| Median Property Value | $2,000,001 | $1,986,500 |
| Median Household Income | $250,001 | $245 |
| Monthly Housing Costs | $1,501 | $306 |
| Real Estate Taxes | $10,001 | $0 |
Property Value by Mortgage Status in Brookville
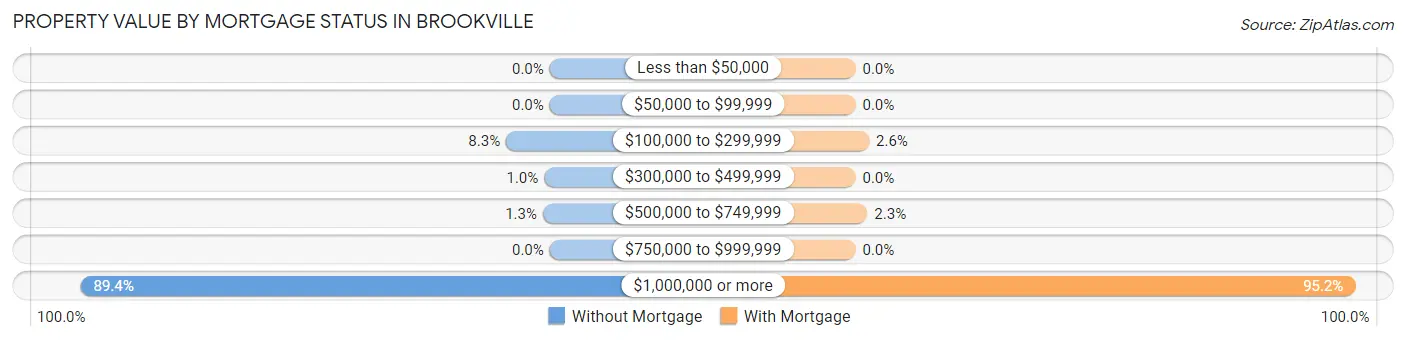
| Property Value | Without Mortgage | With Mortgage |
| Less than $50,000 | 0 (0.0%) | 0 (0.0%) |
| $50,000 to $99,999 | 0 (0.0%) | 0 (0.0%) |
| $100,000 to $299,999 | 32 (8.3%) | 8 (2.6%) |
| $300,000 to $499,999 | 4 (1.0%) | 0 (0.0%) |
| $500,000 to $749,999 | 5 (1.3%) | 7 (2.3%) |
| $750,000 to $999,999 | 0 (0.0%) | 0 (0.0%) |
| $1,000,000 or more | 344 (89.3%) | 295 (95.2%) |
| Total | 385 (100.0%) | 310 (100.0%) |
Household Income by Mortgage Status in Brookville
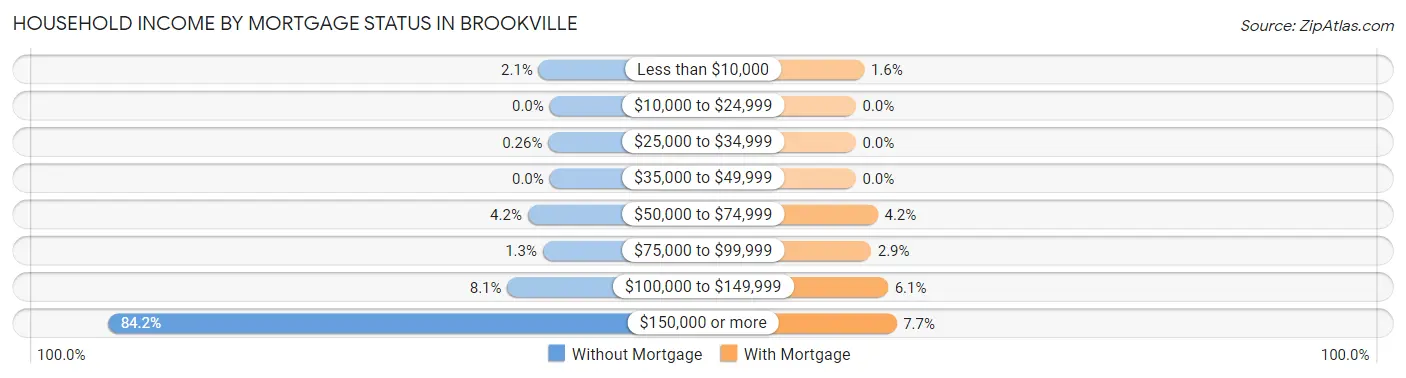
| Household Income | Without Mortgage | With Mortgage |
| Less than $10,000 | 8 (2.1%) | 5 (1.6%) |
| $10,000 to $24,999 | 0 (0.0%) | 0 (0.0%) |
| $25,000 to $34,999 | 1 (0.3%) | 0 (0.0%) |
| $35,000 to $49,999 | 0 (0.0%) | 0 (0.0%) |
| $50,000 to $74,999 | 16 (4.2%) | 13 (4.2%) |
| $75,000 to $99,999 | 5 (1.3%) | 9 (2.9%) |
| $100,000 to $149,999 | 31 (8.1%) | 19 (6.1%) |
| $150,000 or more | 324 (84.2%) | 24 (7.7%) |
| Total | 385 (100.0%) | 310 (100.0%) |
Property Value to Household Income Ratio in Brookville
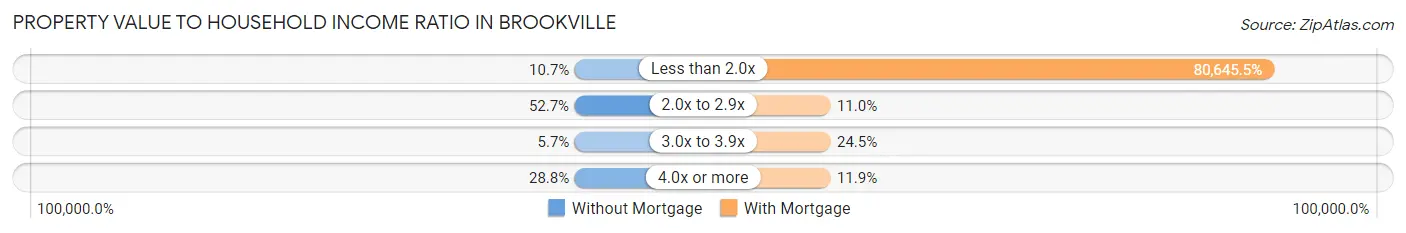
| Value-to-Income Ratio | Without Mortgage | With Mortgage |
| Less than 2.0x | 41 (10.6%) | 250,001 (80,645.5%) |
| 2.0x to 2.9x | 203 (52.7%) | 34 (11.0%) |
| 3.0x to 3.9x | 22 (5.7%) | 76 (24.5%) |
| 4.0x or more | 111 (28.8%) | 37 (11.9%) |
| Total | 385 (100.0%) | 310 (100.0%) |
Real Estate Taxes by Mortgage Status in Brookville
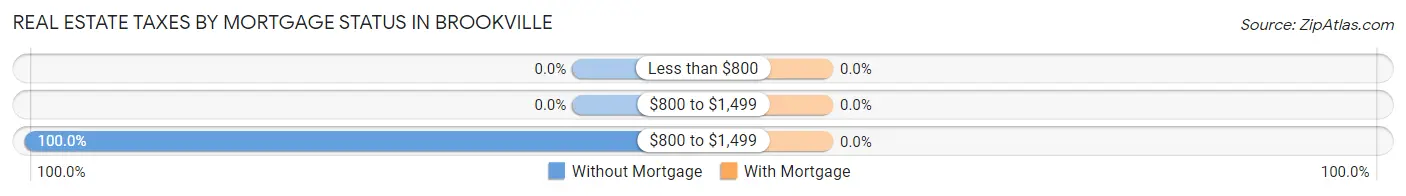
| Property Taxes | Without Mortgage | With Mortgage |
| Less than $800 | 0 (0.0%) | 0 (0.0%) |
| $800 to $1,499 | 0 (0.0%) | 0 (0.0%) |
| $800 to $1,499 | 385 (100.0%) | 0 (0.0%) |
| Total | 385 (100.0%) | 310 (100.0%) |
Health & Disability in Brookville
Health Insurance Coverage by Age in Brookville
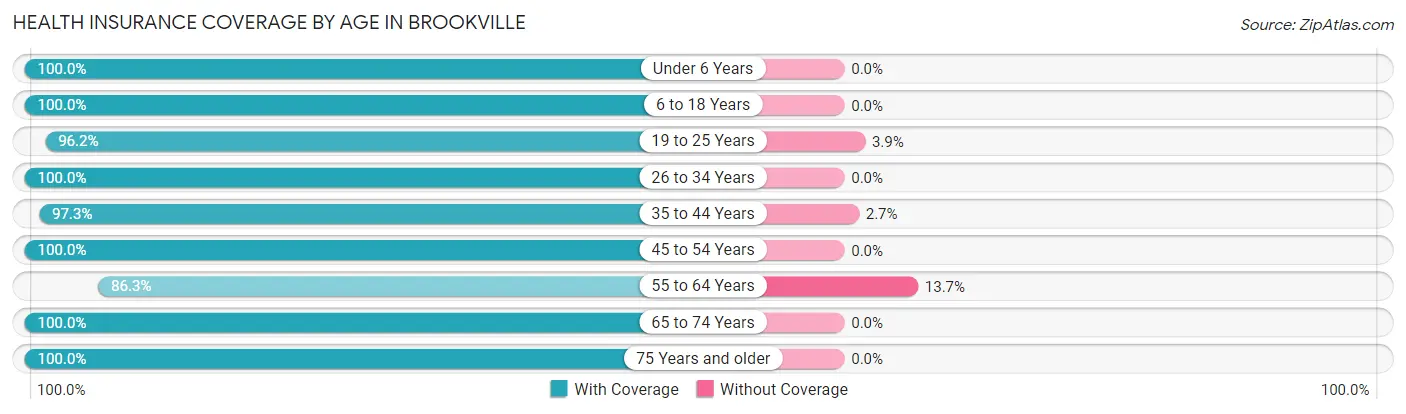
| Age Bracket | With Coverage | Without Coverage |
| Under 6 Years | 165 (100.0%) | 0 (0.0%) |
| 6 to 18 Years | 482 (100.0%) | 0 (0.0%) |
| 19 to 25 Years | 850 (96.2%) | 34 (3.8%) |
| 26 to 34 Years | 132 (100.0%) | 0 (0.0%) |
| 35 to 44 Years | 216 (97.3%) | 6 (2.7%) |
| 45 to 54 Years | 460 (100.0%) | 0 (0.0%) |
| 55 to 64 Years | 283 (86.3%) | 45 (13.7%) |
| 65 to 74 Years | 202 (100.0%) | 0 (0.0%) |
| 75 Years and older | 113 (100.0%) | 0 (0.0%) |
| Total | 2,903 (97.2%) | 85 (2.8%) |
Health Insurance Coverage by Citizenship Status in Brookville
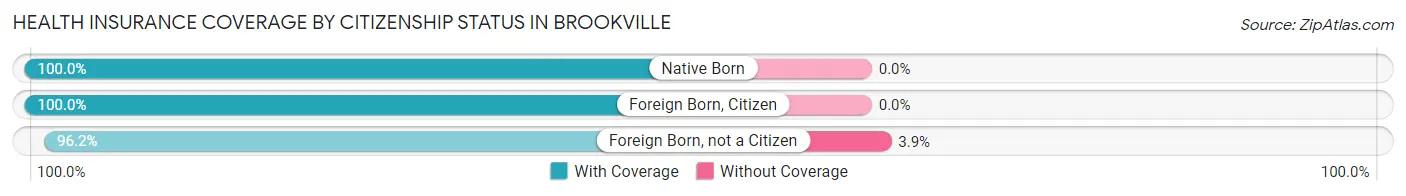
| Citizenship Status | With Coverage | Without Coverage |
| Native Born | 165 (100.0%) | 0 (0.0%) |
| Foreign Born, Citizen | 482 (100.0%) | 0 (0.0%) |
| Foreign Born, not a Citizen | 850 (96.2%) | 34 (3.8%) |
Health Insurance Coverage by Household Income in Brookville
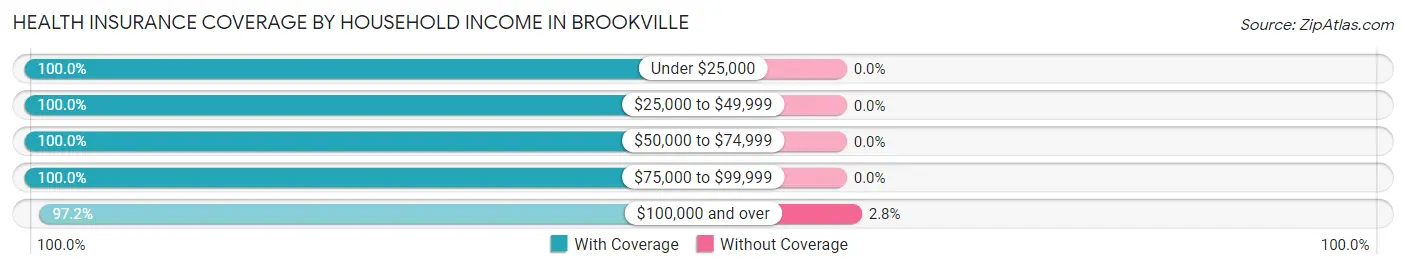
| Household Income | With Coverage | Without Coverage |
| Under $25,000 | 48 (100.0%) | 0 (0.0%) |
| $25,000 to $49,999 | 44 (100.0%) | 0 (0.0%) |
| $50,000 to $74,999 | 56 (100.0%) | 0 (0.0%) |
| $75,000 to $99,999 | 97 (100.0%) | 0 (0.0%) |
| $100,000 and over | 1,761 (97.2%) | 51 (2.8%) |
Public vs Private Health Insurance Coverage by Age in Brookville
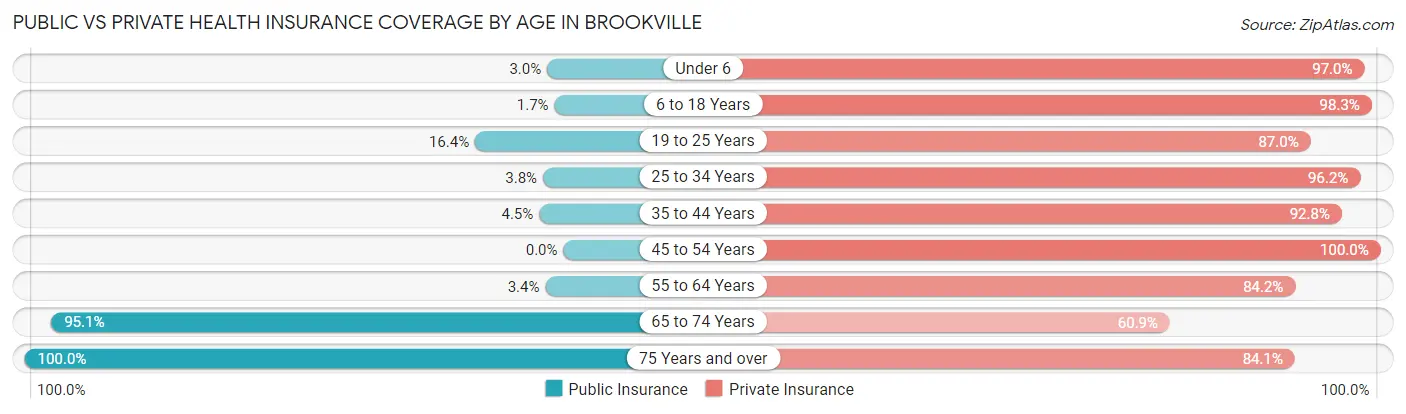
| Age Bracket | Public Insurance | Private Insurance |
| Under 6 | 5 (3.0%) | 160 (97.0%) |
| 6 to 18 Years | 8 (1.7%) | 474 (98.3%) |
| 19 to 25 Years | 145 (16.4%) | 769 (87.0%) |
| 25 to 34 Years | 5 (3.8%) | 127 (96.2%) |
| 35 to 44 Years | 10 (4.5%) | 206 (92.8%) |
| 45 to 54 Years | 0 (0.0%) | 460 (100.0%) |
| 55 to 64 Years | 11 (3.4%) | 276 (84.2%) |
| 65 to 74 Years | 192 (95.1%) | 123 (60.9%) |
| 75 Years and over | 113 (100.0%) | 95 (84.1%) |
| Total | 489 (16.4%) | 2,690 (90.0%) |
Disability Status by Sex by Age in Brookville
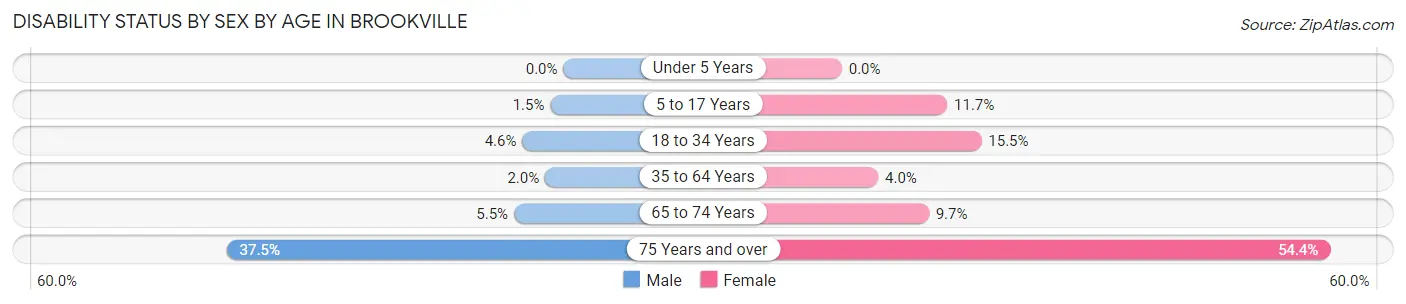
| Age Bracket | Male | Female |
| Under 5 Years | 0 (0.0%) | 0 (0.0%) |
| 5 to 17 Years | 3 (1.5%) | 23 (11.7%) |
| 18 to 34 Years | 23 (4.6%) | 101 (15.5%) |
| 35 to 64 Years | 11 (2.0%) | 19 (4.0%) |
| 65 to 74 Years | 6 (5.5%) | 9 (9.7%) |
| 75 Years and over | 21 (37.5%) | 31 (54.4%) |
Disability Class by Sex by Age in Brookville
Disability Class: Hearing Difficulty
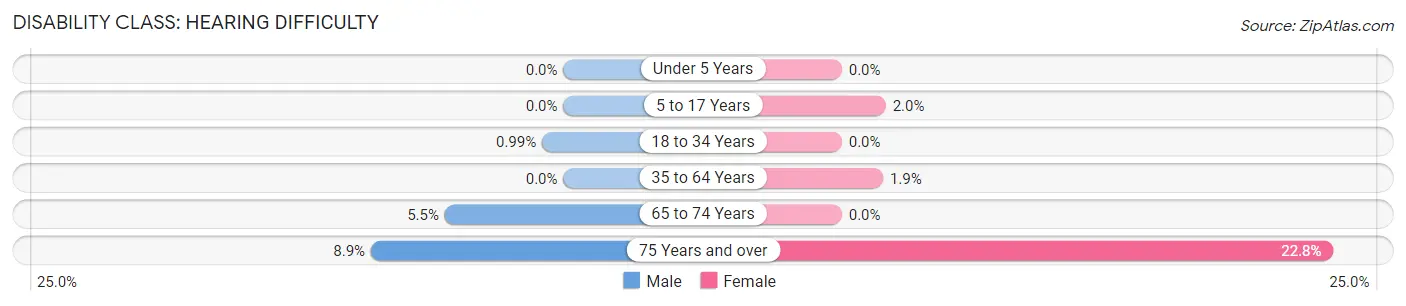
| Age Bracket | Male | Female |
| Under 5 Years | 0 (0.0%) | 0 (0.0%) |
| 5 to 17 Years | 0 (0.0%) | 4 (2.0%) |
| 18 to 34 Years | 5 (1.0%) | 0 (0.0%) |
| 35 to 64 Years | 0 (0.0%) | 9 (1.9%) |
| 65 to 74 Years | 6 (5.5%) | 0 (0.0%) |
| 75 Years and over | 5 (8.9%) | 13 (22.8%) |
Disability Class: Vision Difficulty
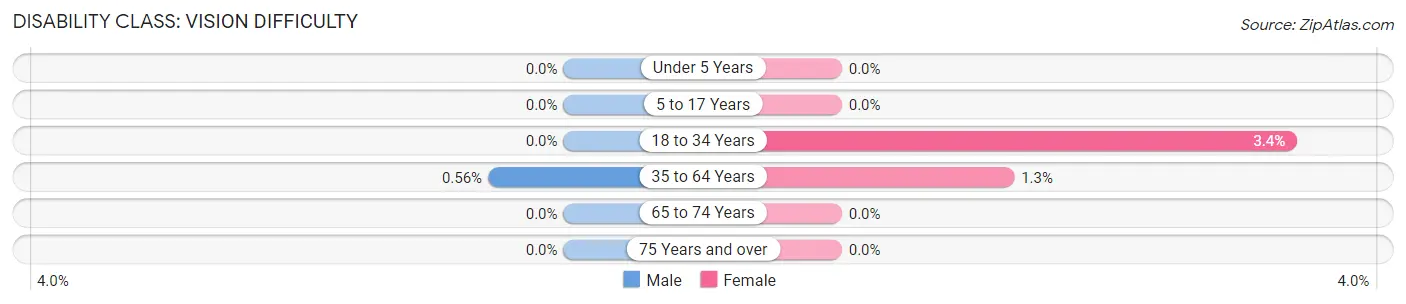
| Age Bracket | Male | Female |
| Under 5 Years | 0 (0.0%) | 0 (0.0%) |
| 5 to 17 Years | 0 (0.0%) | 0 (0.0%) |
| 18 to 34 Years | 0 (0.0%) | 22 (3.4%) |
| 35 to 64 Years | 3 (0.6%) | 6 (1.3%) |
| 65 to 74 Years | 0 (0.0%) | 0 (0.0%) |
| 75 Years and over | 0 (0.0%) | 0 (0.0%) |
Disability Class: Cognitive Difficulty
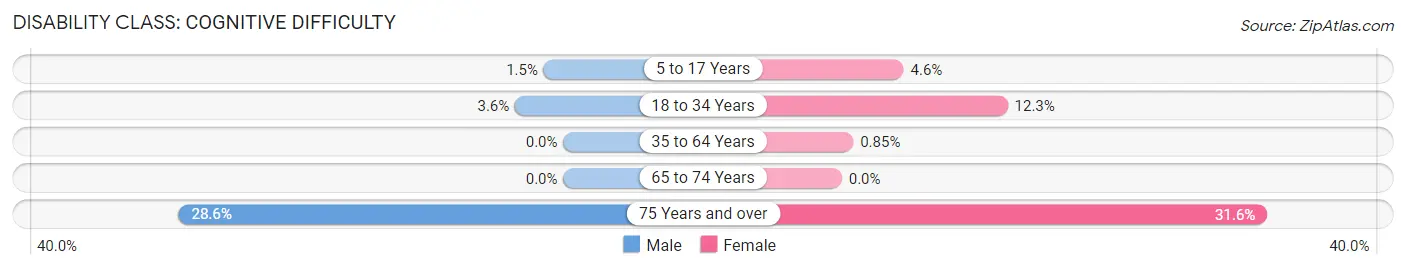
| Age Bracket | Male | Female |
| 5 to 17 Years | 3 (1.5%) | 9 (4.6%) |
| 18 to 34 Years | 18 (3.6%) | 80 (12.3%) |
| 35 to 64 Years | 0 (0.0%) | 4 (0.9%) |
| 65 to 74 Years | 0 (0.0%) | 0 (0.0%) |
| 75 Years and over | 16 (28.6%) | 18 (31.6%) |
Disability Class: Ambulatory Difficulty
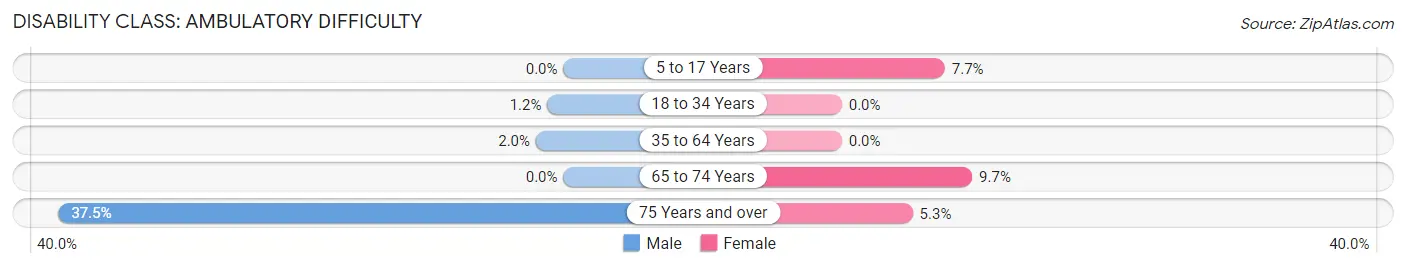
| Age Bracket | Male | Female |
| 5 to 17 Years | 0 (0.0%) | 15 (7.6%) |
| 18 to 34 Years | 6 (1.2%) | 0 (0.0%) |
| 35 to 64 Years | 11 (2.0%) | 0 (0.0%) |
| 65 to 74 Years | 0 (0.0%) | 9 (9.7%) |
| 75 Years and over | 21 (37.5%) | 3 (5.3%) |
Disability Class: Self-Care Difficulty
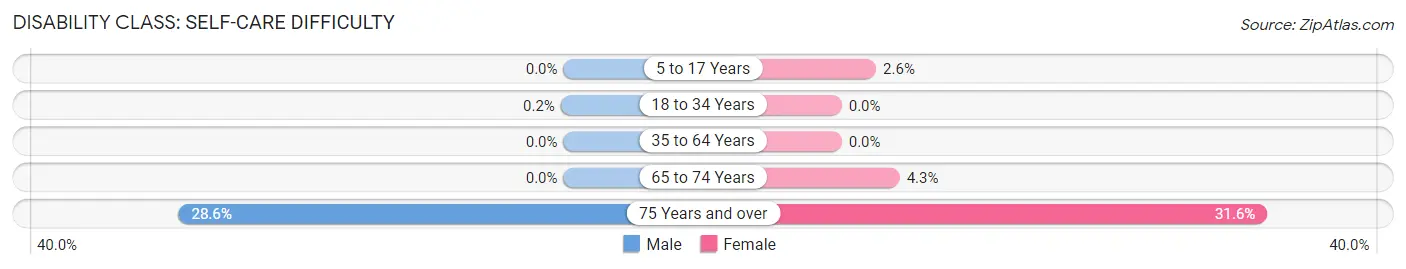
| Age Bracket | Male | Female |
| 5 to 17 Years | 0 (0.0%) | 5 (2.5%) |
| 18 to 34 Years | 1 (0.2%) | 0 (0.0%) |
| 35 to 64 Years | 0 (0.0%) | 0 (0.0%) |
| 65 to 74 Years | 0 (0.0%) | 4 (4.3%) |
| 75 Years and over | 16 (28.6%) | 18 (31.6%) |
Technology Access in Brookville
Computing Device Access in Brookville
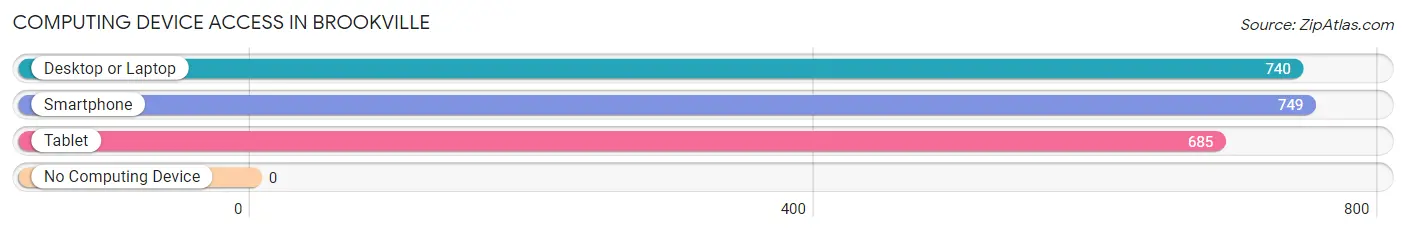
| Device Type | # Households | % Households |
| Desktop or Laptop | 740 | 96.9% |
| Smartphone | 749 | 98.0% |
| Tablet | 685 | 89.7% |
| No Computing Device | 0 | 0.0% |
| Total | 764 | 100.0% |
Internet Access in Brookville
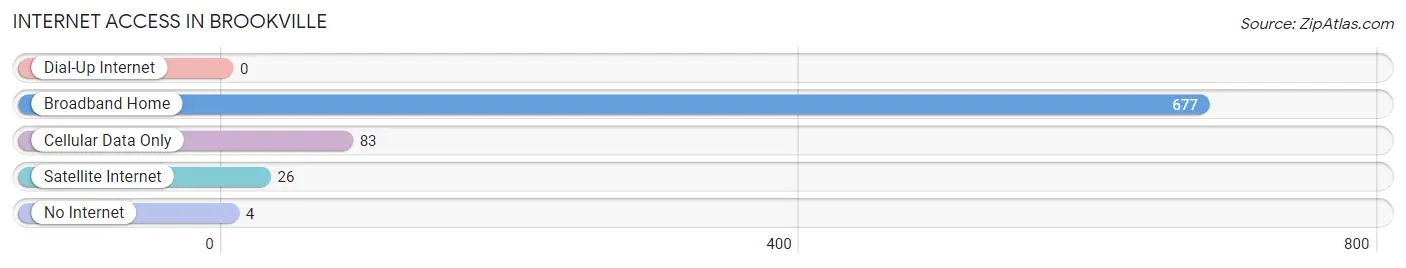
| Internet Type | # Households | % Households |
| Dial-Up Internet | 0 | 0.0% |
| Broadband Home | 677 | 88.6% |
| Cellular Data Only | 83 | 10.9% |
| Satellite Internet | 26 | 3.4% |
| No Internet | 4 | 0.5% |
| Total | 764 | 100.0% |
Brookville Summary
History
The town of Brookville, New York is located in the northern part of Nassau County, on Long Island. It is bordered by the towns of Oyster Bay, North Hempstead, and Hempstead. The area was originally inhabited by the Matinecock Native American tribe, who were part of the Algonquin nation. The first European settlers arrived in the area in the late 1600s, and the town was officially established in 1788.
The town was named after the brook that ran through it, and the area quickly became a popular destination for wealthy New Yorkers looking to escape the hustle and bustle of the city. The town was home to several prominent families, including the Vanderbilts, who built a large estate in the area. The town also became a popular summer destination for wealthy New Yorkers, who built large estates and mansions in the area.
In the late 19th century, the town began to develop into a more suburban area, with the construction of several large estates and mansions. The town also became a popular destination for wealthy New Yorkers looking to escape the hustle and bustle of the city.
Geography
Brookville is located in the northern part of Nassau County, on Long Island. It is bordered by the towns of Oyster Bay, North Hempstead, and Hempstead. The town is located on the north shore of Long Island, and is approximately 25 miles east of New York City. The town is situated on a peninsula, with the Long Island Sound to the north and the Hempstead Bay to the south.
The town is mostly residential, with a few small businesses located in the area. The town is home to several parks, including the Brookville Park, which is a popular destination for outdoor activities. The town also has several beaches, including the popular Long Beach.
Economy
The economy of Brookville is largely based on the service industry, with many residents employed in the retail, hospitality, and healthcare sectors. The town is also home to several small businesses, including restaurants, shops, and professional services.
The town is also home to several large corporations, including the pharmaceutical company Pfizer, which has a large research and development facility in the area. The town is also home to several financial institutions, including the Bank of New York Mellon and the Bank of America.
Demographics
As of the 2010 census, the population of Brookville was 8,919. The population is largely white (86.3%), with a small percentage of African Americans (4.2%), Asians (3.7%), and Hispanics (3.2%). The median household income in the town is $125,000, and the median home value is $1,000,000.
The town is home to several prominent families, including the Vanderbilts, who built a large estate in the area. The town is also home to several prominent institutions, including the Brookville Country Club, which is a popular destination for golfers.
Conclusion
Brookville, New York is a small town located in the northern part of Nassau County, on Long Island. The town was originally inhabited by the Matinecock Native American tribe, and was later settled by wealthy New Yorkers looking to escape the hustle and bustle of the city. The town is largely residential, with a few small businesses located in the area. The economy of the town is largely based on the service industry, with many residents employed in the retail, hospitality, and healthcare sectors. The population of the town is largely white, with a small percentage of African Americans, Asians, and Hispanics. The town is home to several prominent families, including the Vanderbilts, and is also home to several prominent institutions, including the Brookville Country Club.
Common Questions
What is Per Capita Income in Brookville?
Per Capita income in Brookville is $157,836.
What is the Median Family Income in Brookville?
Median Family Income in Brookville is $250,001.
What is the Median Household income in Brookville?
Median Household Income in Brookville is $250,001.
What is Income or Wage Gap in Brookville?
Income or Wage Gap in Brookville is 92.8%.
Women in Brookville earn 7.2 cents for every dollar earned by a man.
What is Inequality or Gini Index in Brookville?
Inequality or Gini Index in Brookville is 0.44.
What is the Total Population of Brookville?
Total Population of Brookville is 2,988.
What is the Total Male Population of Brookville?
Total Male Population of Brookville is 1,492.
What is the Total Female Population of Brookville?
Total Female Population of Brookville is 1,496.
What is the Ratio of Males per 100 Females in Brookville?
There are 99.73 Males per 100 Females in Brookville.
What is the Ratio of Females per 100 Males in Brookville?
There are 100.27 Females per 100 Males in Brookville.
What is the Median Population Age in Brookville?
Median Population Age in Brookville is 24.7 Years.
What is the Average Family Size in Brookville
Average Family Size in Brookville is 2.6 People.
What is the Average Household Size in Brookville
Average Household Size in Brookville is 2.7 People.
How Large is the Labor Force in Brookville?
There are 1,538 People in the Labor Forcein in Brookville.
What is the Percentage of People in the Labor Force in Brookville?
59.7% of People are in the Labor Force in Brookville.
What is the Unemployment Rate in Brookville?
Unemployment Rate in Brookville is 5.7%.