Rye Brook, NY Map & Demographics
Rye Brook Map
Rye Brook Overview
$101,014
PER CAPITA INCOME
$233,680
AVG FAMILY INCOME
$199,965
AVG HOUSEHOLD INCOME
38.1%
WAGE / INCOME GAP [ % ]
61.9¢/ $1
WAGE / INCOME GAP [ $ ]
0.51
INEQUALITY / GINI INDEX
9,920
TOTAL POPULATION
4,839
MALE POPULATION
5,081
FEMALE POPULATION
95.24
MALES / 100 FEMALES
105.00
FEMALES / 100 MALES
45.1
MEDIAN AGE
3.2
AVG FAMILY SIZE
2.9
AVG HOUSEHOLD SIZE
4,832
LABOR FORCE [ PEOPLE ]
60.1%
PERCENT IN LABOR FORCE
9.5%
UNEMPLOYMENT RATE
Rye Brook Area Codes
Income in Rye Brook
Income Overview in Rye Brook
Per Capita Income in Rye Brook is $101,014, while median incomes of families and households are $233,680 and $199,965 respectively.
| Characteristic | Number | Measure |
| Per Capita Income | 9,920 | $101,014 |
| Median Family Income | 2,803 | $233,680 |
| Mean Family Income | 2,803 | $323,897 |
| Median Household Income | 3,405 | $199,965 |
| Mean Household Income | 3,405 | $291,752 |
| Income Deficit | 2,803 | $0 |
| Wage / Income Gap (%) | 9,920 | 38.10% |
| Wage / Income Gap ($) | 9,920 | 61.90¢ per $1 |
| Gini / Inequality Index | 9,920 | 0.51 |
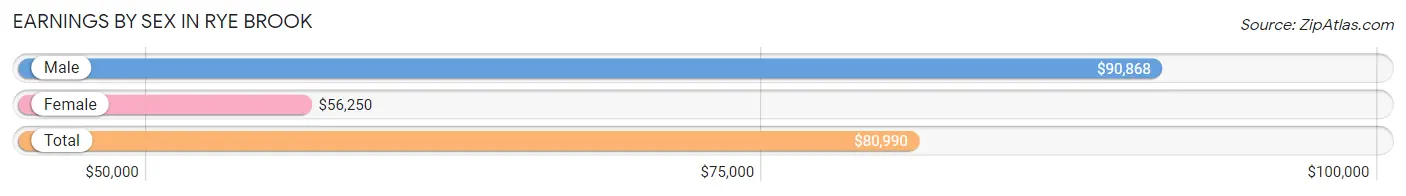
Earnings by Sex in Rye Brook
Average Earnings in Rye Brook are $80,990, $90,868 for men and $56,250 for women, a difference of 38.1%.
| Sex | Number | Average Earnings |
| Male | 2,871 (54.0%) | $90,868 |
| Female | 2,448 (46.0%) | $56,250 |
| Total | 5,319 (100.0%) | $80,990 |
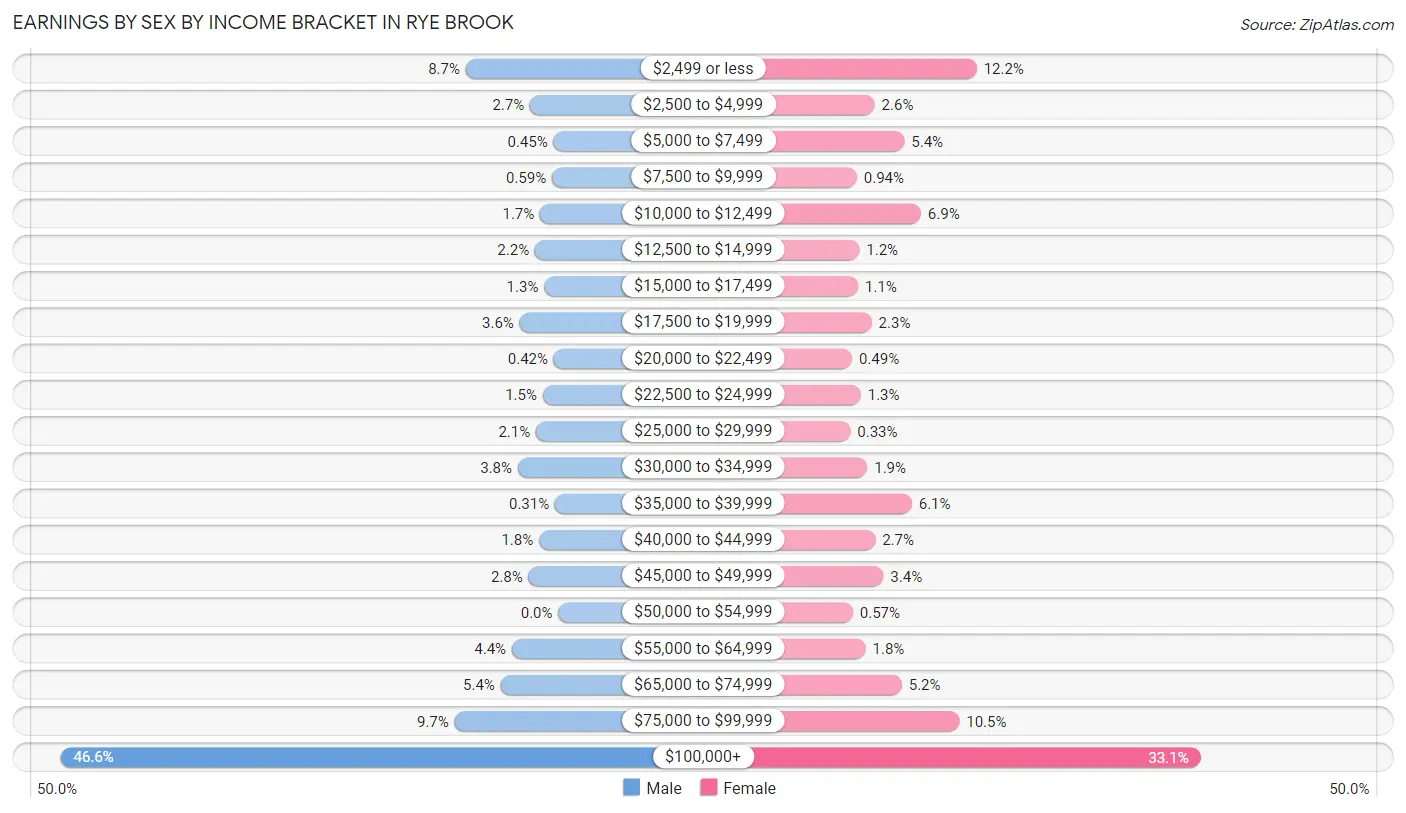
Earnings by Sex by Income Bracket in Rye Brook
The most common earnings brackets in Rye Brook are $100,000+ for men (1,339 | 46.6%) and $100,000+ for women (811 | 33.1%).
| Income | Male | Female |
| $2,499 or less | 249 (8.7%) | 298 (12.2%) |
| $2,500 to $4,999 | 76 (2.6%) | 64 (2.6%) |
| $5,000 to $7,499 | 13 (0.4%) | 132 (5.4%) |
| $7,500 to $9,999 | 17 (0.6%) | 23 (0.9%) |
| $10,000 to $12,499 | 49 (1.7%) | 170 (6.9%) |
| $12,500 to $14,999 | 63 (2.2%) | 29 (1.2%) |
| $15,000 to $17,499 | 38 (1.3%) | 26 (1.1%) |
| $17,500 to $19,999 | 104 (3.6%) | 57 (2.3%) |
| $20,000 to $22,499 | 12 (0.4%) | 12 (0.5%) |
| $22,500 to $24,999 | 42 (1.5%) | 32 (1.3%) |
| $25,000 to $29,999 | 60 (2.1%) | 8 (0.3%) |
| $30,000 to $34,999 | 109 (3.8%) | 47 (1.9%) |
| $35,000 to $39,999 | 9 (0.3%) | 149 (6.1%) |
| $40,000 to $44,999 | 52 (1.8%) | 65 (2.7%) |
| $45,000 to $49,999 | 80 (2.8%) | 84 (3.4%) |
| $50,000 to $54,999 | 0 (0.0%) | 14 (0.6%) |
| $55,000 to $64,999 | 125 (4.3%) | 43 (1.8%) |
| $65,000 to $74,999 | 155 (5.4%) | 126 (5.1%) |
| $75,000 to $99,999 | 279 (9.7%) | 258 (10.5%) |
| $100,000+ | 1,339 (46.6%) | 811 (33.1%) |
| Total | 2,871 (100.0%) | 2,448 (100.0%) |
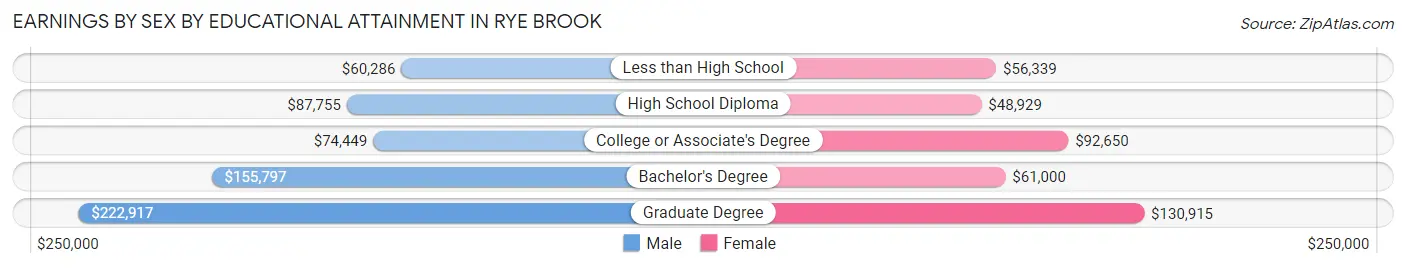
Earnings by Sex by Educational Attainment in Rye Brook
Average earnings in Rye Brook are $141,991 for men and $83,438 for women, a difference of 41.2%. Men with an educational attainment of graduate degree enjoy the highest average annual earnings of $222,917, while those with less than high school education earn the least with $60,286. Women with an educational attainment of graduate degree earn the most with the average annual earnings of $130,915, while those with high school diploma education have the smallest earnings of $48,929.
| Educational Attainment | Male Income | Female Income |
| Less than High School | $60,286 | $56,339 |
| High School Diploma | $87,755 | $48,929 |
| College or Associate's Degree | $74,449 | $92,650 |
| Bachelor's Degree | $155,797 | $61,000 |
| Graduate Degree | $222,917 | $130,915 |
| Total | $141,991 | $83,438 |
Family Income in Rye Brook
Family Income Brackets in Rye Brook
According to the Rye Brook family income data, there are 1,581 families falling into the $200,000+ income range, which is the most common income bracket and makes up 56.4% of all families.
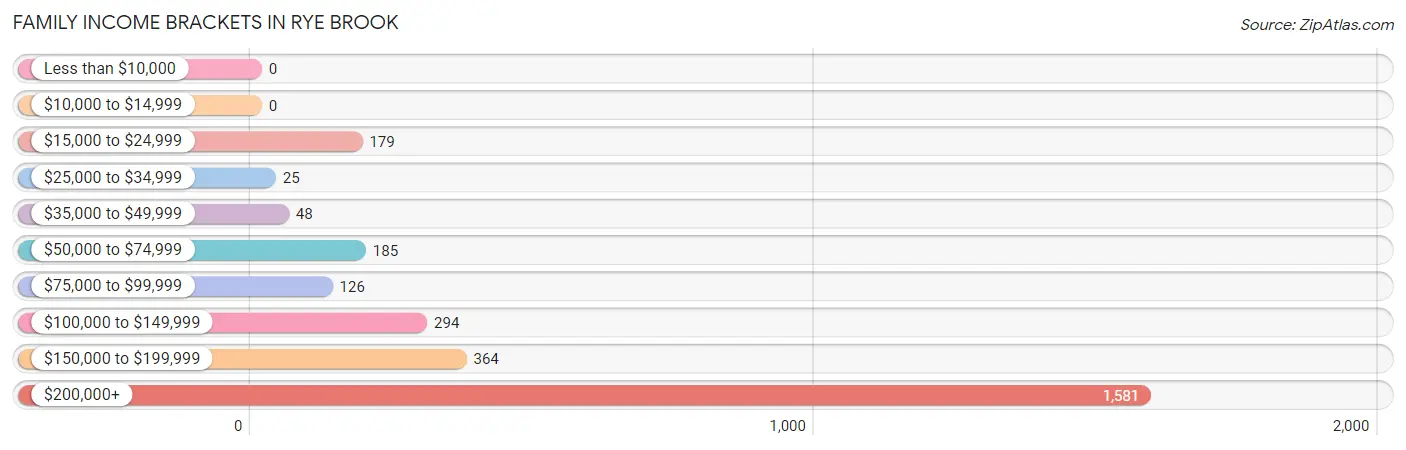
| Income Bracket | # Families | % Families |
| Less than $10,000 | 0 | 0.0% |
| $10,000 to $14,999 | 0 | 0.0% |
| $15,000 to $24,999 | 179 | 6.4% |
| $25,000 to $34,999 | 25 | 0.9% |
| $35,000 to $49,999 | 48 | 1.7% |
| $50,000 to $74,999 | 185 | 6.6% |
| $75,000 to $99,999 | 126 | 4.5% |
| $100,000 to $149,999 | 294 | 10.5% |
| $150,000 to $199,999 | 364 | 13.0% |
| $200,000+ | 1,581 | 56.4% |
Family Income by Famaliy Size in Rye Brook
5-person families (205 | 7.3%) account for the highest median family income in Rye Brook with $250,001 per family, while 2-person families (930 | 33.2%) have the highest median income of $101,458 per family member.
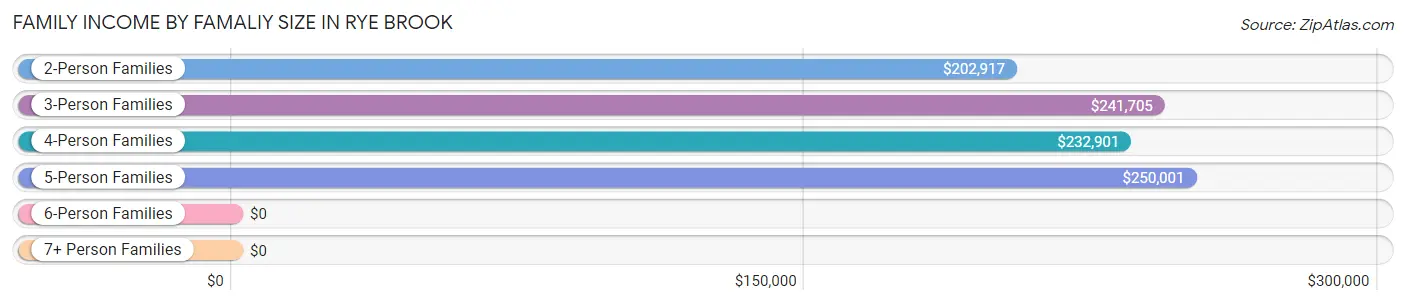
| Income Bracket | # Families | Median Income |
| 2-Person Families | 930 (33.2%) | $202,917 |
| 3-Person Families | 769 (27.4%) | $241,705 |
| 4-Person Families | 848 (30.2%) | $232,901 |
| 5-Person Families | 205 (7.3%) | $250,001 |
| 6-Person Families | 35 (1.3%) | $0 |
| 7+ Person Families | 16 (0.6%) | $0 |
| Total | 2,803 (100.0%) | $233,680 |
Family Income by Number of Earners in Rye Brook
The median family income in Rye Brook is $233,680, with families comprising 1 earner (672) having the highest median family income of $250,001, while families with no earners (456) have the lowest median family income of $97,586, accounting for 24.0% and 16.3% of families, respectively.
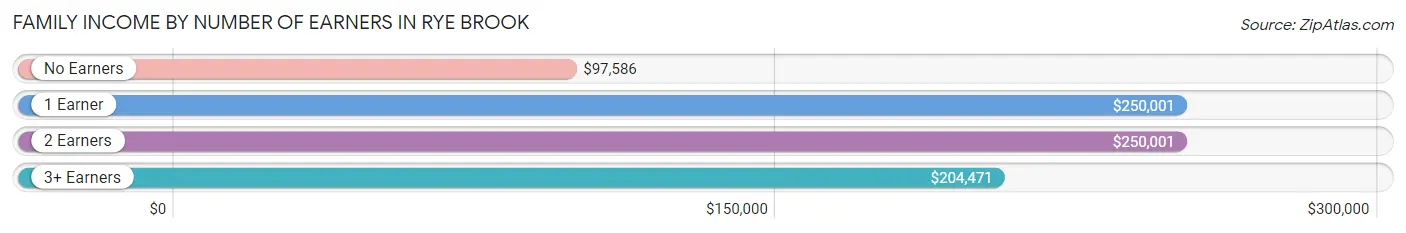
| Number of Earners | # Families | Median Income |
| No Earners | 456 (16.3%) | $97,586 |
| 1 Earner | 672 (24.0%) | $250,001 |
| 2 Earners | 1,042 (37.2%) | $250,001 |
| 3+ Earners | 633 (22.6%) | $204,471 |
| Total | 2,803 (100.0%) | $233,680 |
Household Income in Rye Brook
Household Income Brackets in Rye Brook
With 1,702 households falling in the category, the $200,000+ income range is the most frequent in Rye Brook, accounting for 50.0% of all households.
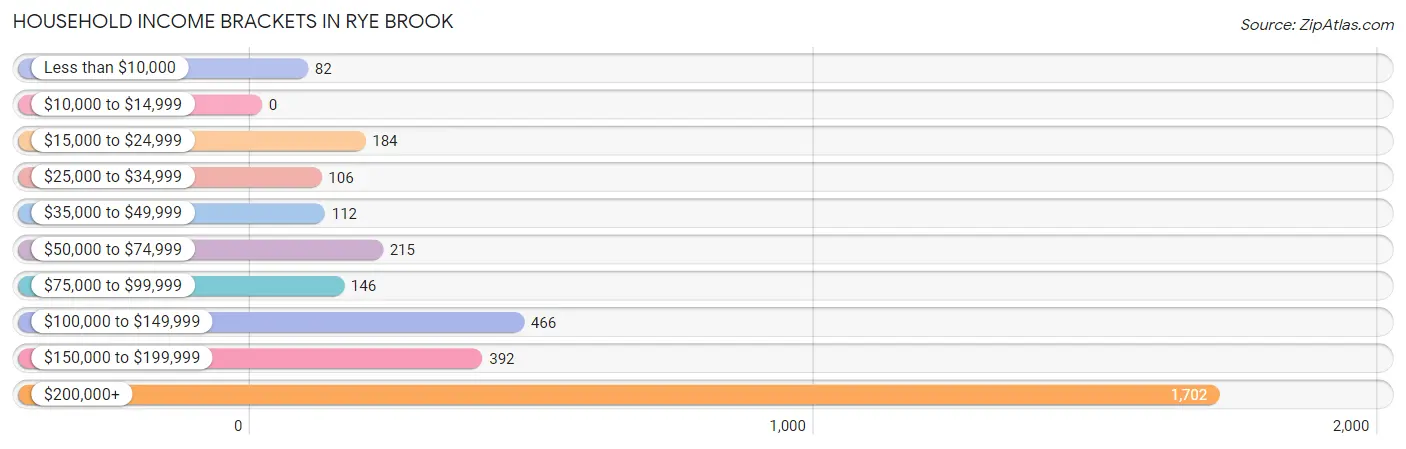
| Income Bracket | # Households | % Households |
| Less than $10,000 | 82 | 2.4% |
| $10,000 to $14,999 | 0 | 0.0% |
| $15,000 to $24,999 | 184 | 5.4% |
| $25,000 to $34,999 | 106 | 3.1% |
| $35,000 to $49,999 | 112 | 3.3% |
| $50,000 to $74,999 | 215 | 6.3% |
| $75,000 to $99,999 | 146 | 4.3% |
| $100,000 to $149,999 | 466 | 13.7% |
| $150,000 to $199,999 | 392 | 11.5% |
| $200,000+ | 1,702 | 50.0% |
Household Income by Householder Age in Rye Brook
The median household income in Rye Brook is $199,965, with the highest median household income of $250,001 found in the 25 to 44 years age bracket for the primary householder. A total of 636 households (18.7%) fall into this category.
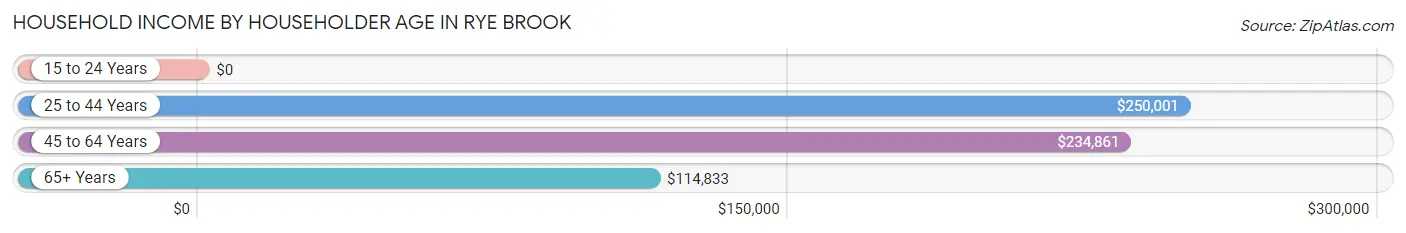
| Income Bracket | # Households | Median Income |
| 15 to 24 Years | 0 (0.0%) | $0 |
| 25 to 44 Years | 636 (18.7%) | $250,001 |
| 45 to 64 Years | 1,549 (45.5%) | $234,861 |
| 65+ Years | 1,220 (35.8%) | $114,833 |
| Total | 3,405 (100.0%) | $199,965 |
Poverty in Rye Brook
Income Below Poverty by Sex and Age in Rye Brook
With 1.8% poverty level for males and 9.0% for females among the residents of Rye Brook, 25 to 34 year old males and 15 year old females are the most vulnerable to poverty, with 15 males (4.9%) and 128 females (40.6%) in their respective age groups living below the poverty level.
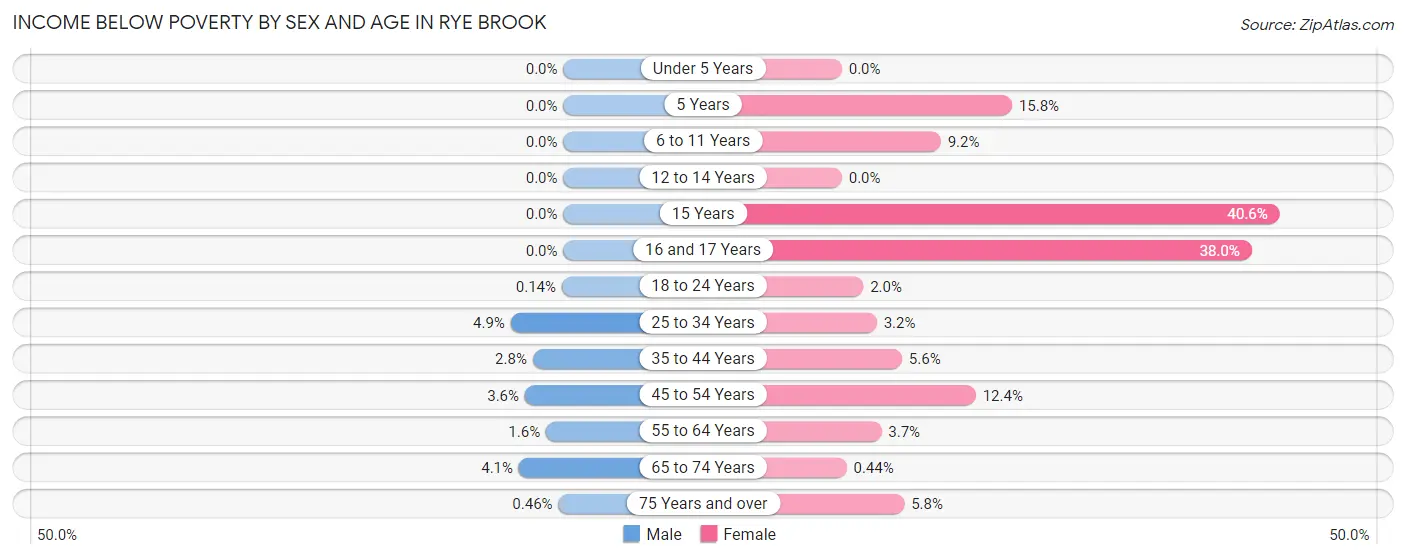
| Age Bracket | Male | Female |
| Under 5 Years | 0 (0.0%) | 0 (0.0%) |
| 5 Years | 0 (0.0%) | 6 (15.8%) |
| 6 to 11 Years | 0 (0.0%) | 28 (9.2%) |
| 12 to 14 Years | 0 (0.0%) | 0 (0.0%) |
| 15 Years | 0 (0.0%) | 128 (40.6%) |
| 16 and 17 Years | 0 (0.0%) | 70 (38.0%) |
| 18 to 24 Years | 1 (0.1%) | 6 (2.0%) |
| 25 to 34 Years | 15 (4.9%) | 6 (3.2%) |
| 35 to 44 Years | 17 (2.8%) | 31 (5.6%) |
| 45 to 54 Years | 25 (3.6%) | 114 (12.4%) |
| 55 to 64 Years | 10 (1.6%) | 26 (3.7%) |
| 65 to 74 Years | 18 (4.1%) | 2 (0.4%) |
| 75 Years and over | 2 (0.5%) | 37 (5.8%) |
| Total | 88 (1.8%) | 454 (9.0%) |
Income Above Poverty by Sex and Age in Rye Brook
According to the poverty statistics in Rye Brook, males aged under 5 years and females aged under 5 years are the age groups that are most secure financially, with 100.0% of males and 100.0% of females in these age groups living above the poverty line.
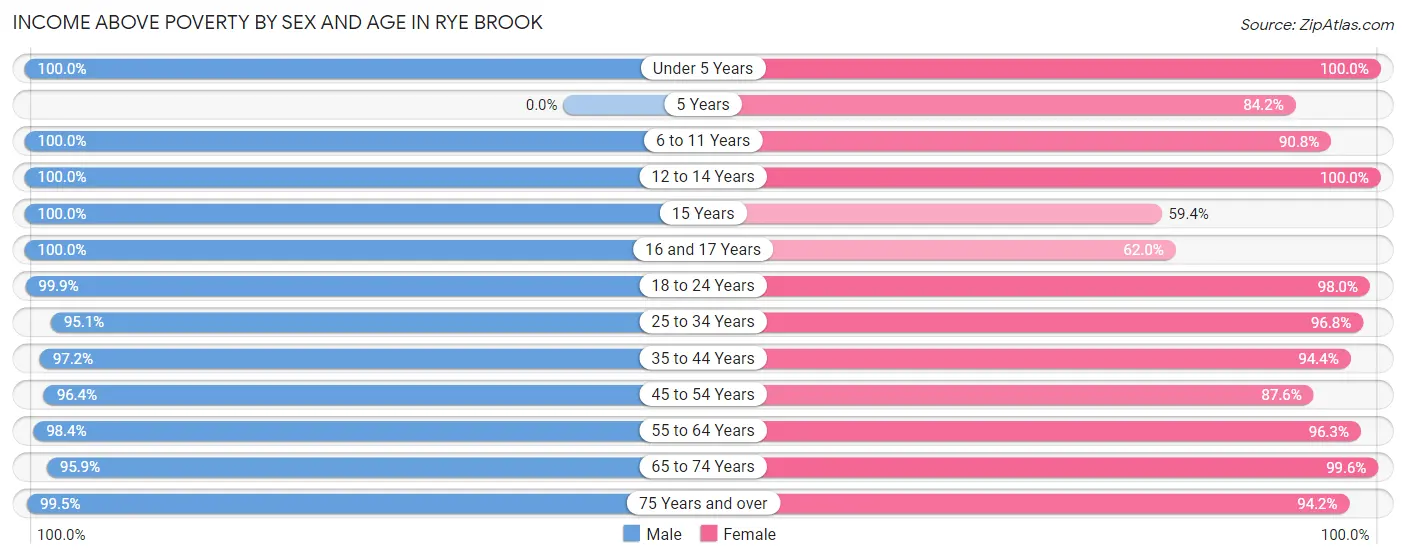
| Age Bracket | Male | Female |
| Under 5 Years | 201 (100.0%) | 179 (100.0%) |
| 5 Years | 0 (0.0%) | 32 (84.2%) |
| 6 to 11 Years | 272 (100.0%) | 277 (90.8%) |
| 12 to 14 Years | 216 (100.0%) | 255 (100.0%) |
| 15 Years | 99 (100.0%) | 187 (59.4%) |
| 16 and 17 Years | 212 (100.0%) | 114 (62.0%) |
| 18 to 24 Years | 707 (99.9%) | 296 (98.0%) |
| 25 to 34 Years | 292 (95.1%) | 179 (96.8%) |
| 35 to 44 Years | 581 (97.2%) | 525 (94.4%) |
| 45 to 54 Years | 676 (96.4%) | 803 (87.6%) |
| 55 to 64 Years | 610 (98.4%) | 683 (96.3%) |
| 65 to 74 Years | 418 (95.9%) | 453 (99.6%) |
| 75 Years and over | 436 (99.5%) | 602 (94.2%) |
| Total | 4,720 (98.2%) | 4,585 (91.0%) |
Income Below Poverty Among Married-Couple Families in Rye Brook
The poverty statistics for married-couple families in Rye Brook show that 1.7% or 39 of the total 2,297 families live below the poverty line. Families with 1 or 2 children have the highest poverty rate of 4.3%, comprising of 39 families. On the other hand, families with no children have the lowest poverty rate of 0.0%, which includes 0 families.
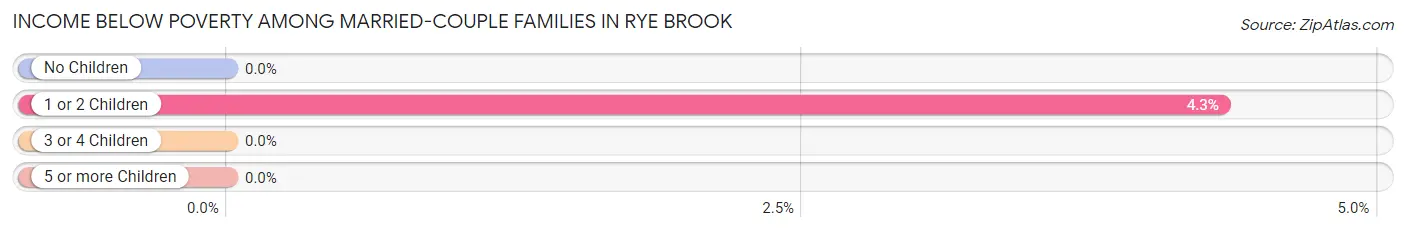
| Children | Above Poverty | Below Poverty |
| No Children | 1,219 (100.0%) | 0 (0.0%) |
| 1 or 2 Children | 864 (95.7%) | 39 (4.3%) |
| 3 or 4 Children | 175 (100.0%) | 0 (0.0%) |
| 5 or more Children | 0 (0.0%) | 0 (0.0%) |
| Total | 2,258 (98.3%) | 39 (1.7%) |
Income Below Poverty Among Single-Parent Households in Rye Brook
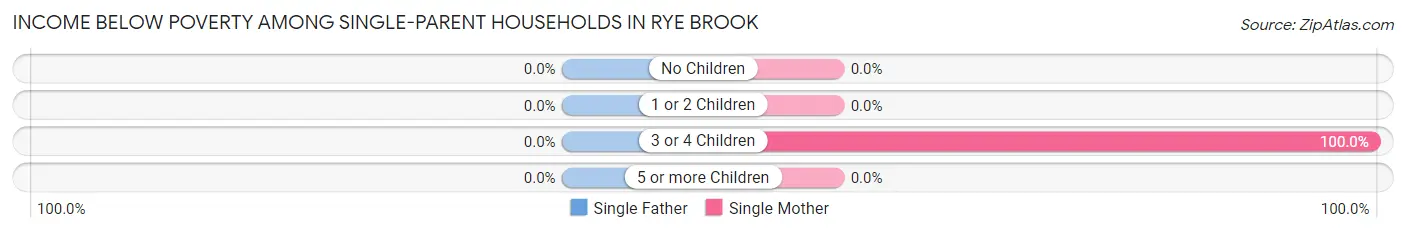
| Children | Single Father | Single Mother |
| No Children | 0 (0.0%) | 0 (0.0%) |
| 1 or 2 Children | 0 (0.0%) | 0 (0.0%) |
| 3 or 4 Children | 0 (0.0%) | 108 (100.0%) |
| 5 or more Children | 0 (0.0%) | 0 (0.0%) |
| Total | 0 (0.0%) | 108 (22.9%) |
Income Below Poverty Among Married-Couple vs Single-Parent Households in Rye Brook
The poverty data for Rye Brook shows that 39 of the married-couple family households (1.7%) and 108 of the single-parent households (21.3%) are living below the poverty level. Within the married-couple family households, those with 1 or 2 children have the highest poverty rate, with 39 households (4.3%) falling below the poverty line. Among the single-parent households, those with 3 or 4 children have the highest poverty rate, with 108 household (100.0%) living below poverty.
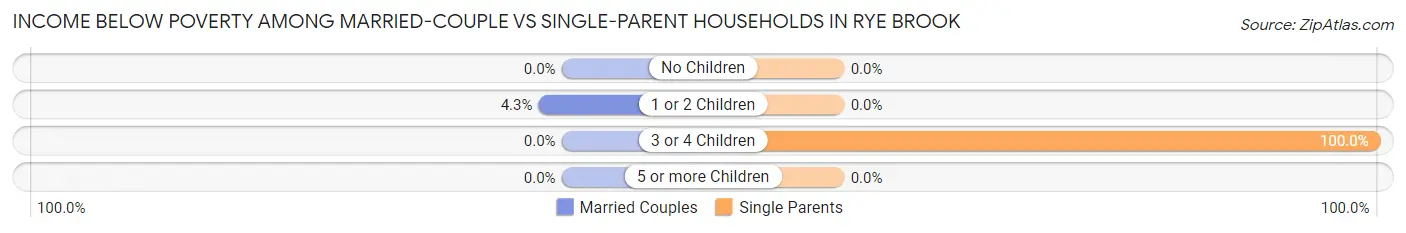
| Children | Married-Couple Families | Single-Parent Households |
| No Children | 0 (0.0%) | 0 (0.0%) |
| 1 or 2 Children | 39 (4.3%) | 0 (0.0%) |
| 3 or 4 Children | 0 (0.0%) | 108 (100.0%) |
| 5 or more Children | 0 (0.0%) | 0 (0.0%) |
| Total | 39 (1.7%) | 108 (21.3%) |
Race in Rye Brook
The most populous races in Rye Brook are White / Caucasian (7,750 | 78.1%), Asian (1,001 | 10.1%), and Hispanic or Latino (977 | 9.9%).
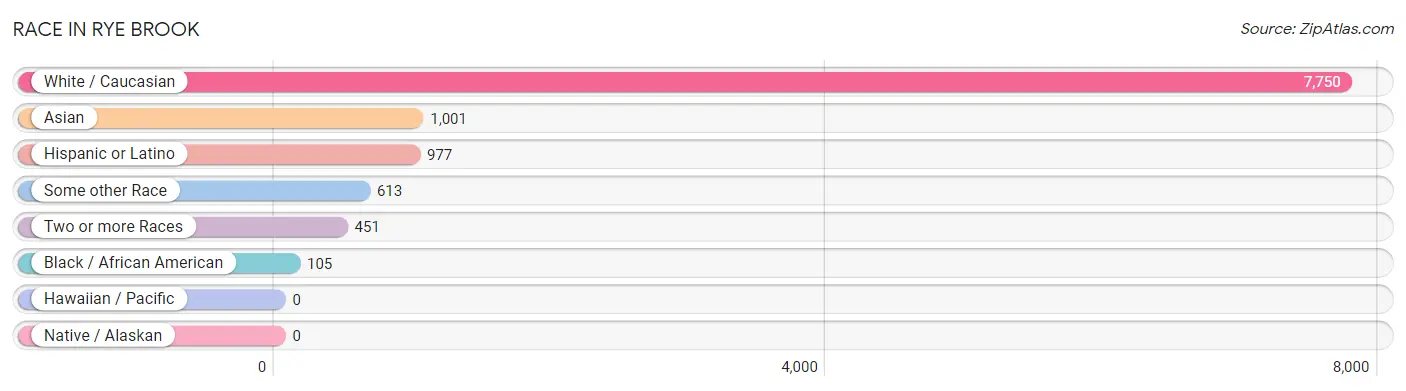
| Race | # Population | % Population |
| Asian | 1,001 | 10.1% |
| Black / African American | 105 | 1.1% |
| Hawaiian / Pacific | 0 | 0.0% |
| Hispanic or Latino | 977 | 9.9% |
| Native / Alaskan | 0 | 0.0% |
| White / Caucasian | 7,750 | 78.1% |
| Two or more Races | 451 | 4.5% |
| Some other Race | 613 | 6.2% |
| Total | 9,920 | 100.0% |
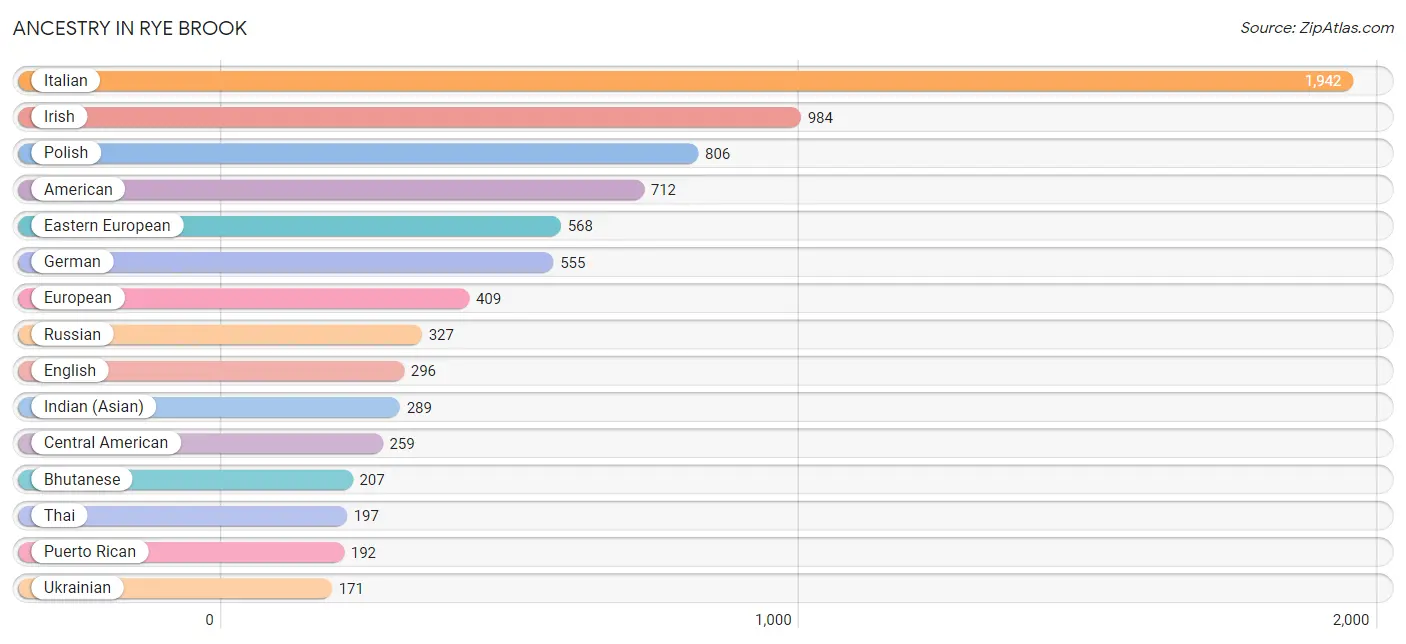
Ancestry in Rye Brook
The most populous ancestries reported in Rye Brook are Italian (1,942 | 19.6%), Irish (984 | 9.9%), Polish (806 | 8.1%), American (712 | 7.2%), and Eastern European (568 | 5.7%), together accounting for 50.5% of all Rye Brook residents.
| Ancestry | # Population | % Population |
| American | 712 | 7.2% |
| Arab | 22 | 0.2% |
| Australian | 13 | 0.1% |
| Austrian | 157 | 1.6% |
| Belgian | 41 | 0.4% |
| Bhutanese | 207 | 2.1% |
| Brazilian | 10 | 0.1% |
| British | 41 | 0.4% |
| Burmese | 133 | 1.3% |
| Canadian | 10 | 0.1% |
| Central American | 259 | 2.6% |
| Colombian | 21 | 0.2% |
| Cuban | 134 | 1.3% |
| Czech | 27 | 0.3% |
| Dominican | 132 | 1.3% |
| Dutch | 18 | 0.2% |
| Eastern European | 568 | 5.7% |
| Ecuadorian | 43 | 0.4% |
| Egyptian | 7 | 0.1% |
| English | 296 | 3.0% |
| Estonian | 159 | 1.6% |
| European | 409 | 4.1% |
| French | 58 | 0.6% |
| German | 555 | 5.6% |
| Greek | 53 | 0.5% |
| Guatemalan | 120 | 1.2% |
| Guyanese | 35 | 0.4% |
| Hungarian | 156 | 1.6% |
| Indian (Asian) | 289 | 2.9% |
| Irish | 984 | 9.9% |
| Israeli | 57 | 0.6% |
| Italian | 1,942 | 19.6% |
| Jamaican | 15 | 0.2% |
| Korean | 71 | 0.7% |
| Lithuanian | 41 | 0.4% |
| Mexican | 104 | 1.1% |
| Northern European | 26 | 0.3% |
| Norwegian | 19 | 0.2% |
| Panamanian | 139 | 1.4% |
| Peruvian | 29 | 0.3% |
| Polish | 806 | 8.1% |
| Portuguese | 24 | 0.2% |
| Puerto Rican | 192 | 1.9% |
| Romanian | 40 | 0.4% |
| Russian | 327 | 3.3% |
| Scandinavian | 28 | 0.3% |
| Scotch-Irish | 60 | 0.6% |
| Scottish | 83 | 0.8% |
| Slovak | 28 | 0.3% |
| Slovene | 17 | 0.2% |
| South African | 1 | 0.0% |
| South American | 142 | 1.4% |
| Spanish | 14 | 0.1% |
| Subsaharan African | 1 | 0.0% |
| Swedish | 25 | 0.3% |
| Swiss | 31 | 0.3% |
| Thai | 197 | 2.0% |
| Ukrainian | 171 | 1.7% |
| Uruguayan | 49 | 0.5% | View All 59 Rows |
Immigrants in Rye Brook
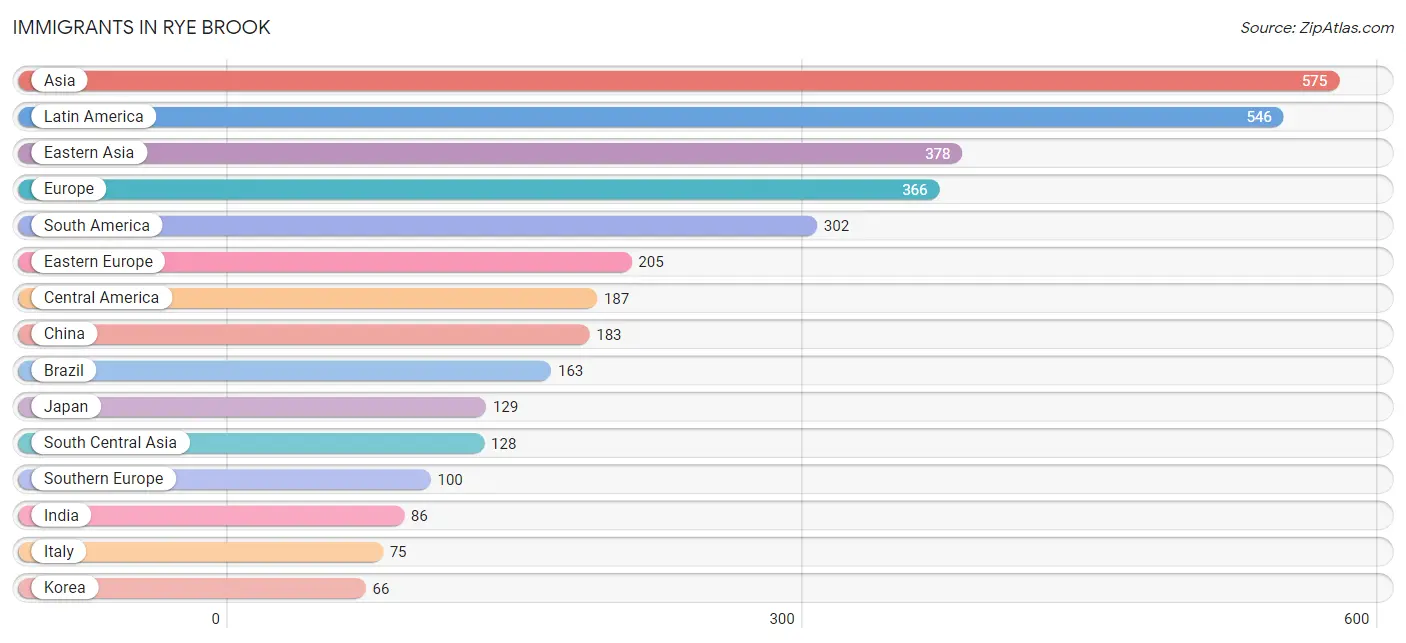
The most numerous immigrant groups reported in Rye Brook came from Asia (575 | 5.8%), Latin America (546 | 5.5%), Eastern Asia (378 | 3.8%), Europe (366 | 3.7%), and South America (302 | 3.0%), together accounting for 21.8% of all Rye Brook residents.
| Immigration Origin | # Population | % Population |
| Africa | 29 | 0.3% |
| Asia | 575 | 5.8% |
| Australia | 19 | 0.2% |
| Brazil | 163 | 1.6% |
| Canada | 21 | 0.2% |
| Caribbean | 57 | 0.6% |
| Central America | 187 | 1.9% |
| China | 183 | 1.8% |
| Colombia | 21 | 0.2% |
| Dominican Republic | 57 | 0.6% |
| Eastern Asia | 378 | 3.8% |
| Eastern Europe | 205 | 2.1% |
| Ecuador | 25 | 0.3% |
| Egypt | 7 | 0.1% |
| Europe | 366 | 3.7% |
| France | 33 | 0.3% |
| Germany | 28 | 0.3% |
| Greece | 12 | 0.1% |
| Guatemala | 63 | 0.6% |
| Hong Kong | 21 | 0.2% |
| India | 86 | 0.9% |
| Iraq | 15 | 0.2% |
| Italy | 75 | 0.8% |
| Japan | 129 | 1.3% |
| Korea | 66 | 0.7% |
| Latin America | 546 | 5.5% |
| Lithuania | 27 | 0.3% |
| Mexico | 66 | 0.7% |
| Middle Africa | 8 | 0.1% |
| Northern Africa | 7 | 0.1% |
| Oceania | 19 | 0.2% |
| Pakistan | 42 | 0.4% |
| Panama | 58 | 0.6% |
| Peru | 44 | 0.4% |
| Philippines | 15 | 0.2% |
| Poland | 25 | 0.3% |
| Portugal | 13 | 0.1% |
| Russia | 28 | 0.3% |
| Serbia | 28 | 0.3% |
| South Africa | 14 | 0.1% |
| South America | 302 | 3.0% |
| South Central Asia | 128 | 1.3% |
| South Eastern Asia | 15 | 0.2% |
| Southern Europe | 100 | 1.0% |
| Ukraine | 26 | 0.3% |
| Uruguay | 49 | 0.5% |
| Western Asia | 54 | 0.5% |
| Western Europe | 61 | 0.6% |
| Zaire | 8 | 0.1% | View All 49 Rows |
Sex and Age in Rye Brook
Sex and Age in Rye Brook
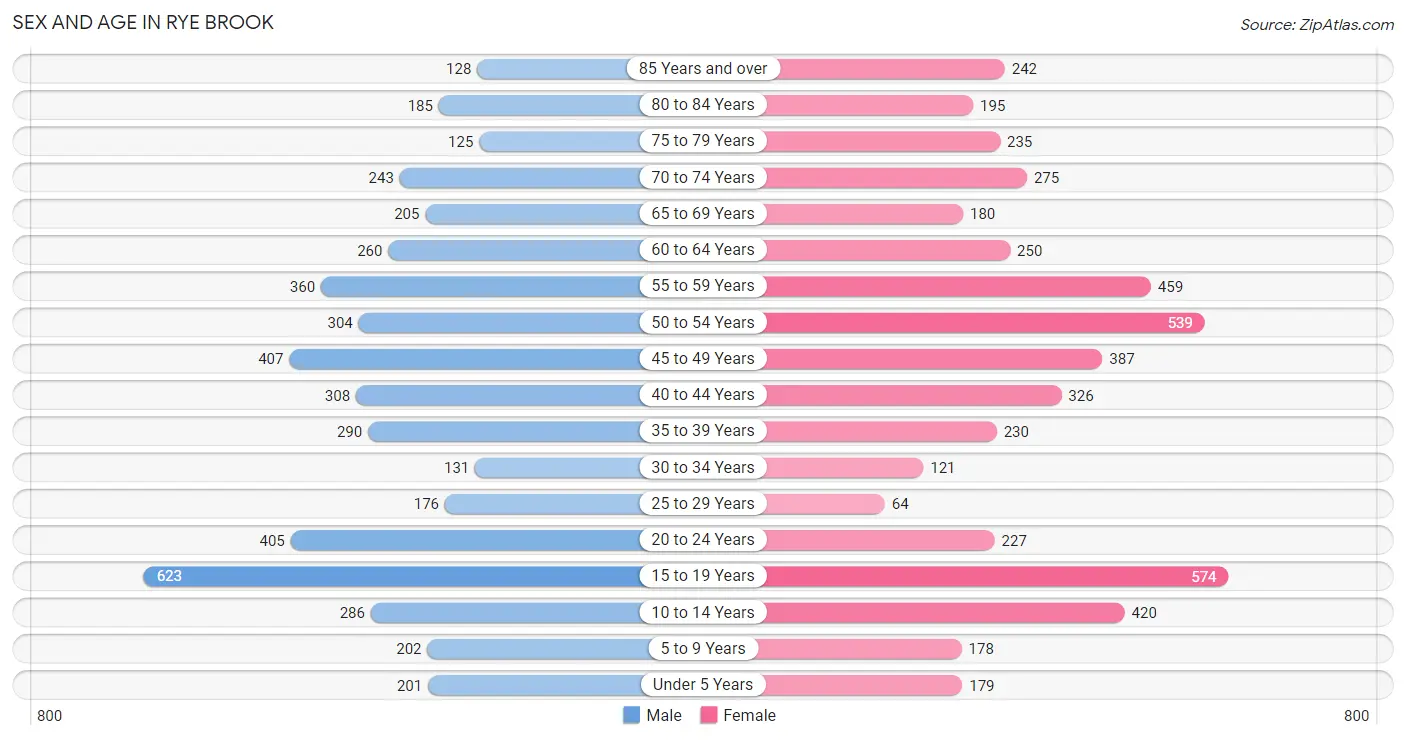
The most populous age groups in Rye Brook are 15 to 19 Years (623 | 12.9%) for men and 15 to 19 Years (574 | 11.3%) for women.
| Age Bracket | Male | Female |
| Under 5 Years | 201 (4.2%) | 179 (3.5%) |
| 5 to 9 Years | 202 (4.2%) | 178 (3.5%) |
| 10 to 14 Years | 286 (5.9%) | 420 (8.3%) |
| 15 to 19 Years | 623 (12.9%) | 574 (11.3%) |
| 20 to 24 Years | 405 (8.4%) | 227 (4.5%) |
| 25 to 29 Years | 176 (3.6%) | 64 (1.3%) |
| 30 to 34 Years | 131 (2.7%) | 121 (2.4%) |
| 35 to 39 Years | 290 (6.0%) | 230 (4.5%) |
| 40 to 44 Years | 308 (6.4%) | 326 (6.4%) |
| 45 to 49 Years | 407 (8.4%) | 387 (7.6%) |
| 50 to 54 Years | 304 (6.3%) | 539 (10.6%) |
| 55 to 59 Years | 360 (7.4%) | 459 (9.0%) |
| 60 to 64 Years | 260 (5.4%) | 250 (4.9%) |
| 65 to 69 Years | 205 (4.2%) | 180 (3.5%) |
| 70 to 74 Years | 243 (5.0%) | 275 (5.4%) |
| 75 to 79 Years | 125 (2.6%) | 235 (4.6%) |
| 80 to 84 Years | 185 (3.8%) | 195 (3.8%) |
| 85 Years and over | 128 (2.6%) | 242 (4.8%) |
| Total | 4,839 (100.0%) | 5,081 (100.0%) |
Families and Households in Rye Brook
Median Family Size in Rye Brook
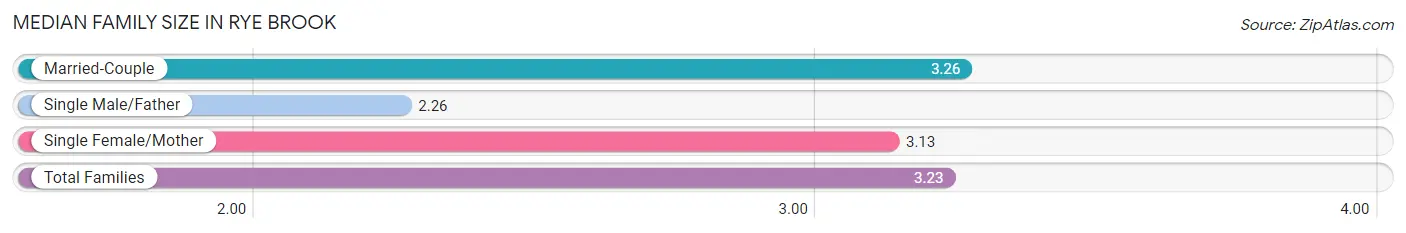
The median family size in Rye Brook is 3.23 persons per family, with married-couple families (2,297 | 82.0%) accounting for the largest median family size of 3.26 persons per family. On the other hand, single male/father families (34 | 1.2%) represent the smallest median family size with 2.26 persons per family.
| Family Type | # Families | Family Size |
| Married-Couple | 2,297 (82.0%) | 3.26 |
| Single Male/Father | 34 (1.2%) | 2.26 |
| Single Female/Mother | 472 (16.8%) | 3.13 |
| Total Families | 2,803 (100.0%) | 3.23 |
Median Household Size in Rye Brook
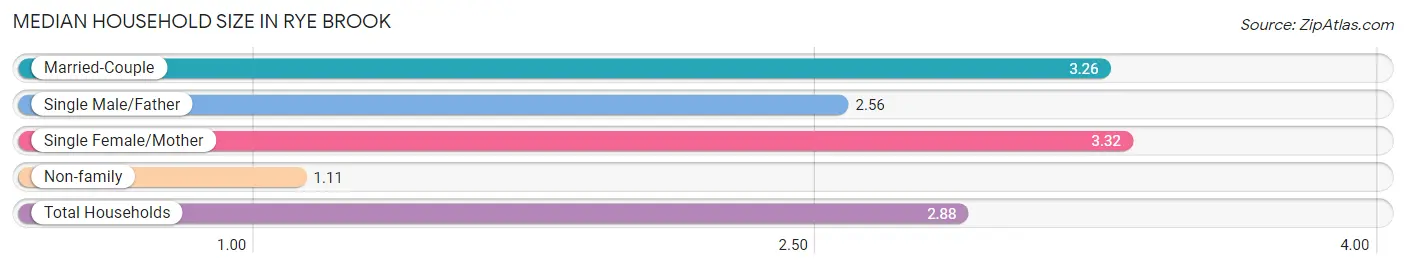
The median household size in Rye Brook is 2.88 persons per household, with single female/mother households (472 | 13.9%) accounting for the largest median household size of 3.32 persons per household. non-family households (602 | 17.7%) represent the smallest median household size with 1.11 persons per household.
| Household Type | # Households | Household Size |
| Married-Couple | 2,297 (67.5%) | 3.26 |
| Single Male/Father | 34 (1.0%) | 2.56 |
| Single Female/Mother | 472 (13.9%) | 3.32 |
| Non-family | 602 (17.7%) | 1.11 |
| Total Households | 3,405 (100.0%) | 2.88 |
Household Size by Marriage Status in Rye Brook
Out of a total of 3,405 households in Rye Brook, 2,803 (82.3%) are family households, while 602 (17.7%) are nonfamily households. The most numerous type of family households are 4-person households, comprising 918, and the most common type of nonfamily households are 1-person households, comprising 540.
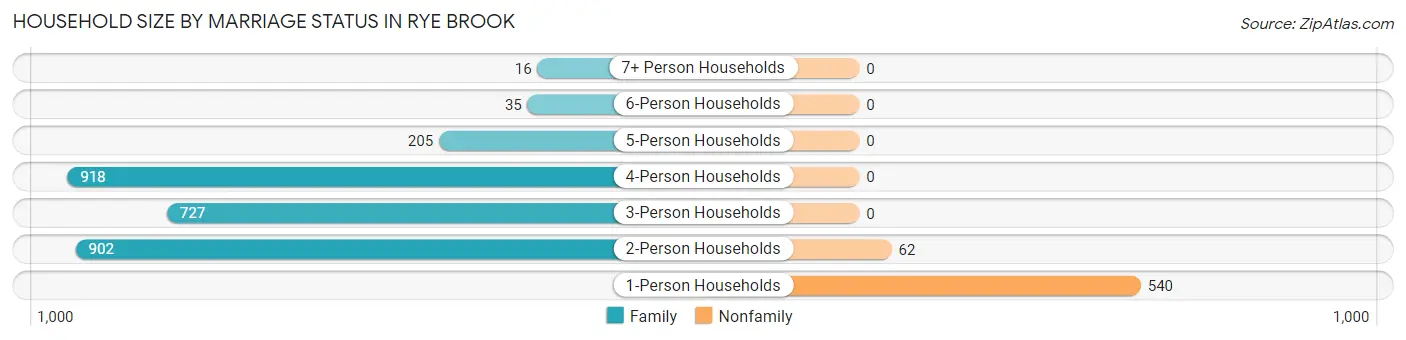
| Household Size | Family Households | Nonfamily Households |
| 1-Person Households | - | 540 (15.9%) |
| 2-Person Households | 902 (26.5%) | 62 (1.8%) |
| 3-Person Households | 727 (21.3%) | 0 (0.0%) |
| 4-Person Households | 918 (27.0%) | 0 (0.0%) |
| 5-Person Households | 205 (6.0%) | 0 (0.0%) |
| 6-Person Households | 35 (1.0%) | 0 (0.0%) |
| 7+ Person Households | 16 (0.5%) | 0 (0.0%) |
| Total | 2,803 (82.3%) | 602 (17.7%) |
Female Fertility in Rye Brook
Fertility by Age in Rye Brook
Average fertility rate in Rye Brook is 95.0 births per 1,000 women. Women in the age bracket of 35 to 50 years have the highest fertility rate with 134.0 births per 1,000 women. Women in the age bracket of 35 to 50 years acount for 76.9% of all women with births.
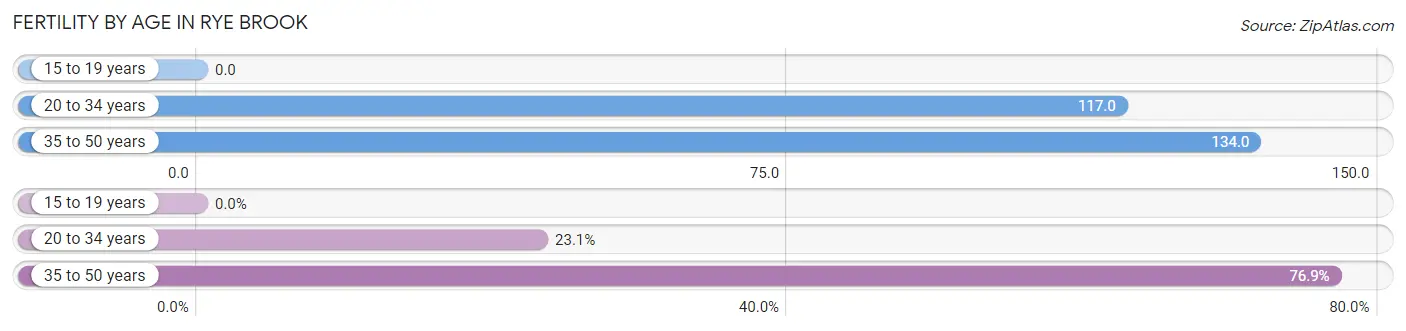
| Age Bracket | Women with Births | Births / 1,000 Women |
| 15 to 19 years | 0 (0.0%) | 0.0 |
| 20 to 34 years | 48 (23.1%) | 117.0 |
| 35 to 50 years | 160 (76.9%) | 134.0 |
| Total | 208 (100.0%) | 95.0 |
Fertility by Age by Marriage Status in Rye Brook
91.3% of women with births (208) in Rye Brook are married. The highest percentage of unmarried women with births falls into 35 to 50 years age bracket with 11.3% of them unmarried at the time of birth, while the lowest percentage of unmarried women with births belong to 20 to 34 years age bracket with 0.0% of them unmarried.
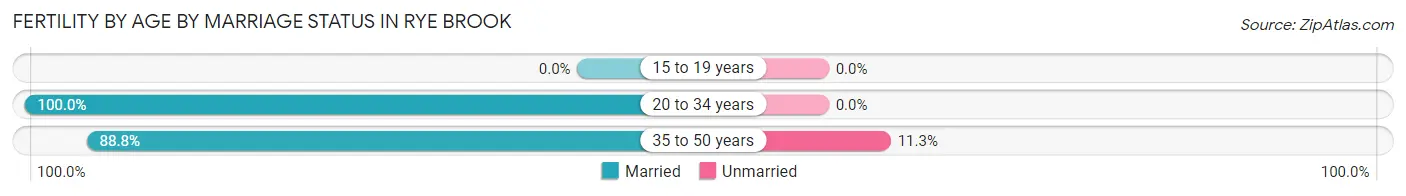
| Age Bracket | Married | Unmarried |
| 15 to 19 years | 0 (0.0%) | 0 (0.0%) |
| 20 to 34 years | 48 (100.0%) | 0 (0.0%) |
| 35 to 50 years | 142 (88.7%) | 18 (11.3%) |
| Total | 190 (91.3%) | 18 (8.6%) |
Fertility by Education in Rye Brook
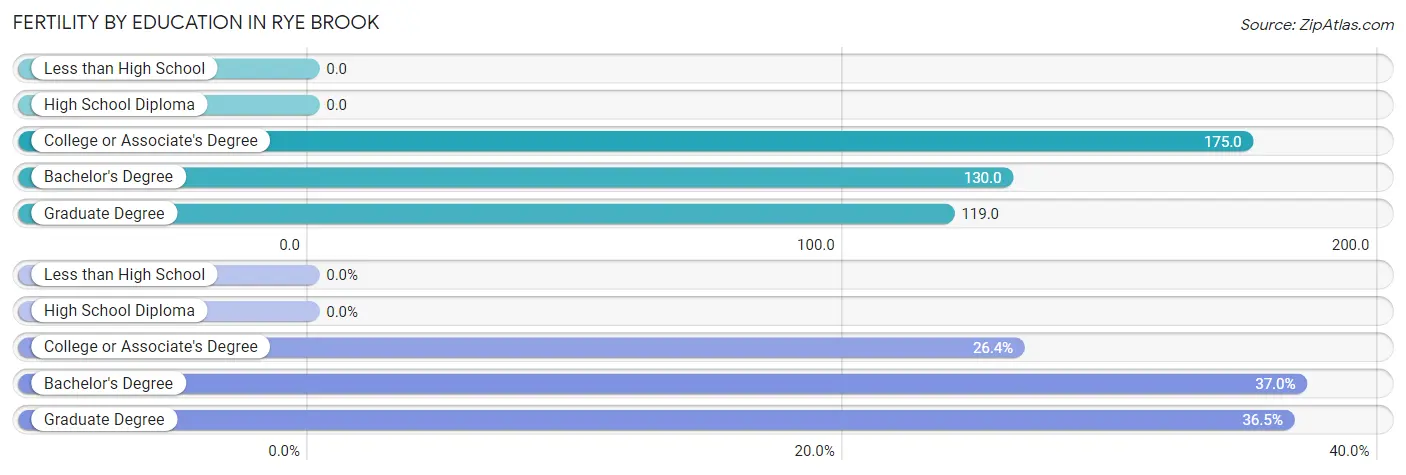
| Educational Attainment | Women with Births | Births / 1,000 Women |
| Less than High School | 0 (0.0%) | 0.0 |
| High School Diploma | 0 (0.0%) | 0.0 |
| College or Associate's Degree | 55 (26.4%) | 175.0 |
| Bachelor's Degree | 77 (37.0%) | 130.0 |
| Graduate Degree | 76 (36.5%) | 119.0 |
| Total | 208 (100.0%) | 95.0 |
Fertility by Education by Marriage Status in Rye Brook
8.6% of women with births in Rye Brook are unmarried. Women with the educational attainment of college or associate's degree are most likely to be married with 100.0% of them married at childbirth, while women with the educational attainment of graduate degree are least likely to be married with 23.7% of them unmarried at childbirth.
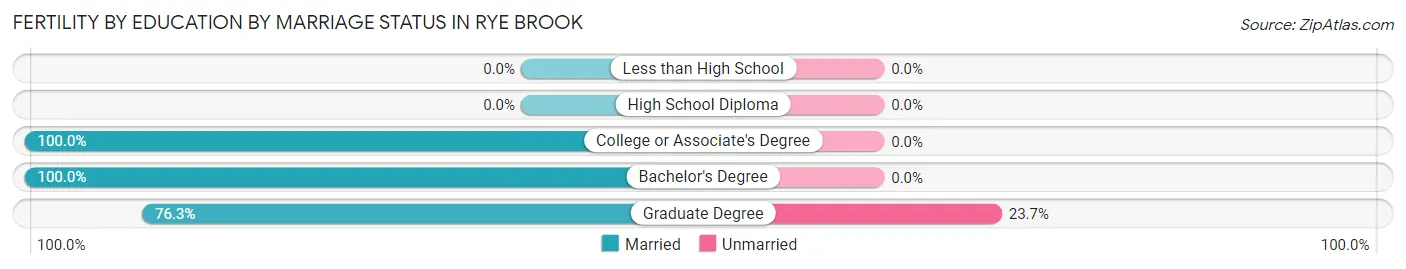
| Educational Attainment | Married | Unmarried |
| Less than High School | 0 (0.0%) | 0 (0.0%) |
| High School Diploma | 0 (0.0%) | 0 (0.0%) |
| College or Associate's Degree | 55 (100.0%) | 0 (0.0%) |
| Bachelor's Degree | 77 (100.0%) | 0 (0.0%) |
| Graduate Degree | 58 (76.3%) | 18 (23.7%) |
| Total | 190 (91.3%) | 18 (8.6%) |
Employment Characteristics in Rye Brook
Employment by Class of Employer in Rye Brook
Among the 4,360 employed individuals in Rye Brook, private company employees (3,014 | 69.1%), local government employees (434 | 10.0%), and self-employed (not incorporated) (371 | 8.5%) make up the most common classes of employment.
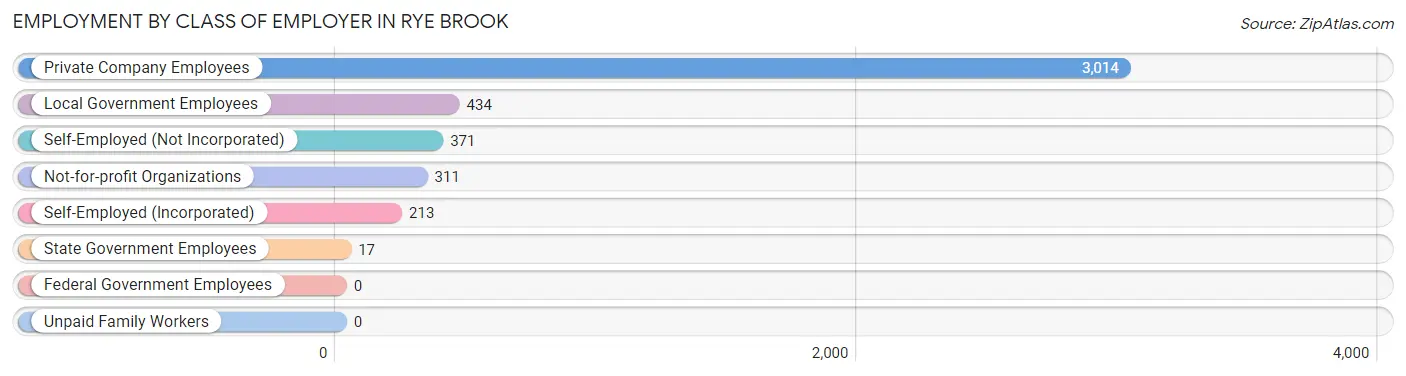
| Employer Class | # Employees | % Employees |
| Private Company Employees | 3,014 | 69.1% |
| Self-Employed (Incorporated) | 213 | 4.9% |
| Self-Employed (Not Incorporated) | 371 | 8.5% |
| Not-for-profit Organizations | 311 | 7.1% |
| Local Government Employees | 434 | 10.0% |
| State Government Employees | 17 | 0.4% |
| Federal Government Employees | 0 | 0.0% |
| Unpaid Family Workers | 0 | 0.0% |
| Total | 4,360 | 100.0% |
Employment Status by Age in Rye Brook
According to the labor force statistics for Rye Brook, out of the total population over 16 years of age (8,040), 60.1% or 4,832 individuals are in the labor force, with 9.5% or 459 of them unemployed. The age group with the highest labor force participation rate is 30 to 34 years, with 100.0% or 252 individuals in the labor force. Within the labor force, the 55 to 59 years age range has the highest percentage of unemployed individuals, with 34.1% or 228 of them being unemployed.
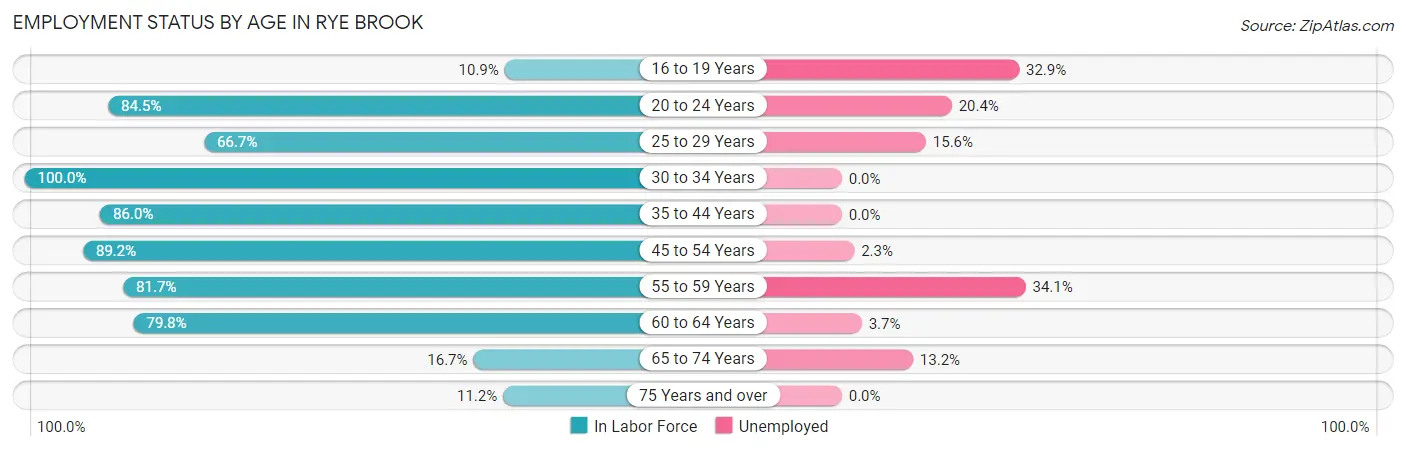
| Age Bracket | In Labor Force | Unemployed |
| 16 to 19 Years | 85 (10.9%) | 28 (32.9%) |
| 20 to 24 Years | 534 (84.5%) | 109 (20.4%) |
| 25 to 29 Years | 160 (66.7%) | 25 (15.6%) |
| 30 to 34 Years | 252 (100.0%) | 0 (0.0%) |
| 35 to 44 Years | 992 (86.0%) | 0 (0.0%) |
| 45 to 54 Years | 1,460 (89.2%) | 34 (2.3%) |
| 55 to 59 Years | 669 (81.7%) | 228 (34.1%) |
| 60 to 64 Years | 407 (79.8%) | 15 (3.7%) |
| 65 to 74 Years | 151 (16.7%) | 20 (13.2%) |
| 75 Years and over | 124 (11.2%) | 0 (0.0%) |
| Total | 4,832 (60.1%) | 459 (9.5%) |
Employment Status by Educational Attainment in Rye Brook
According to labor force statistics for Rye Brook, 85.4% of individuals (3,939) out of the total population between 25 and 64 years of age (4,612) are in the labor force, with 7.6% or 299 of them being unemployed. The group with the highest labor force participation rate are those with the educational attainment of high school diploma, with 95.8% or 431 individuals in the labor force. Within the labor force, individuals with high school diploma education have the highest percentage of unemployment, with 16.7% or 72 of them being unemployed.
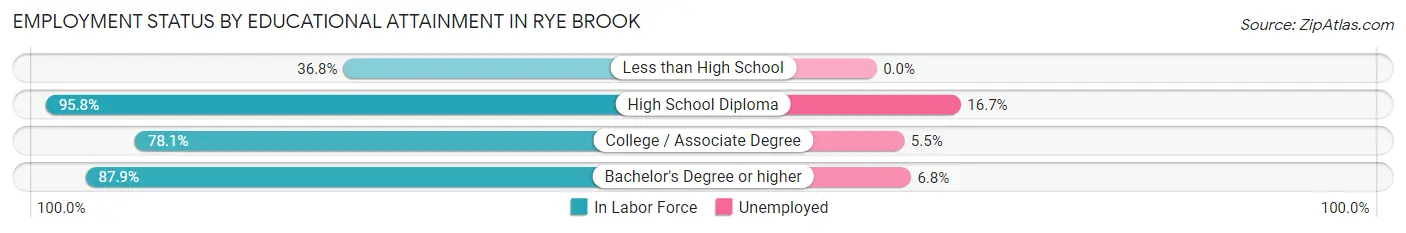
| Educational Attainment | In Labor Force | Unemployed |
| Less than High School | 60 (36.8%) | 0 (0.0%) |
| High School Diploma | 431 (95.8%) | 75 (16.7%) |
| College / Associate Degree | 523 (78.1%) | 37 (5.5%) |
| Bachelor's Degree or higher | 2,926 (87.9%) | 226 (6.8%) |
| Total | 3,939 (85.4%) | 351 (7.6%) |
Employment Occupations by Sex in Rye Brook
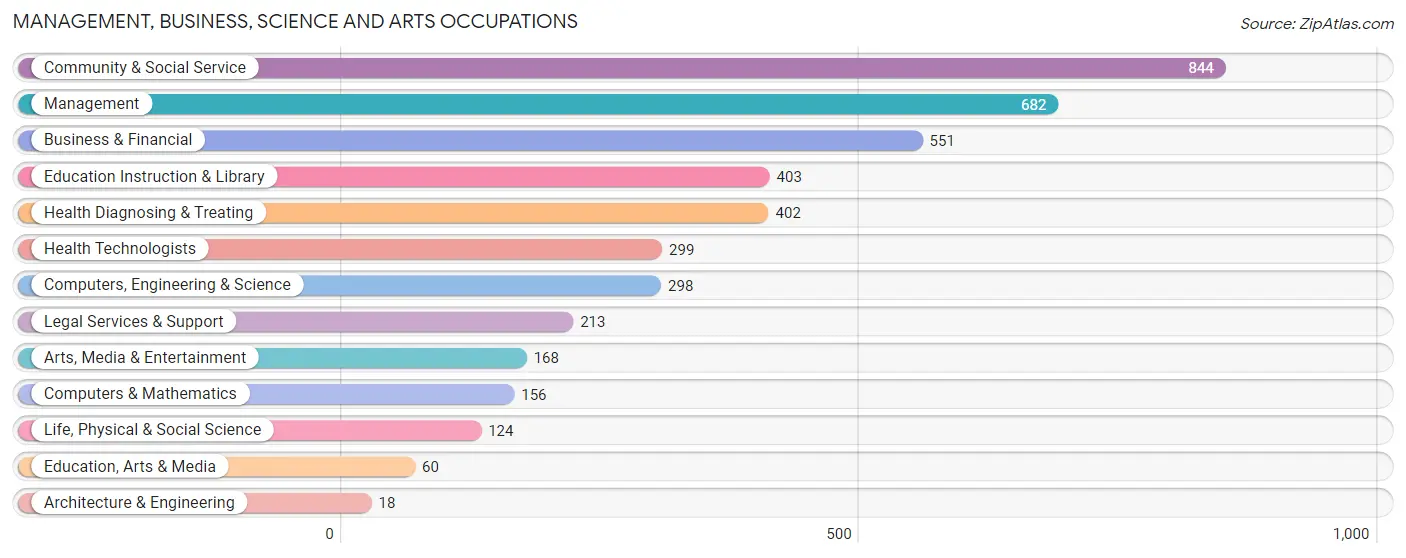
Management, Business, Science and Arts Occupations
The most common Management, Business, Science and Arts occupations in Rye Brook are Community & Social Service (844 | 19.3%), Management (682 | 15.6%), Business & Financial (551 | 12.6%), Education Instruction & Library (403 | 9.2%), and Health Diagnosing & Treating (402 | 9.2%).
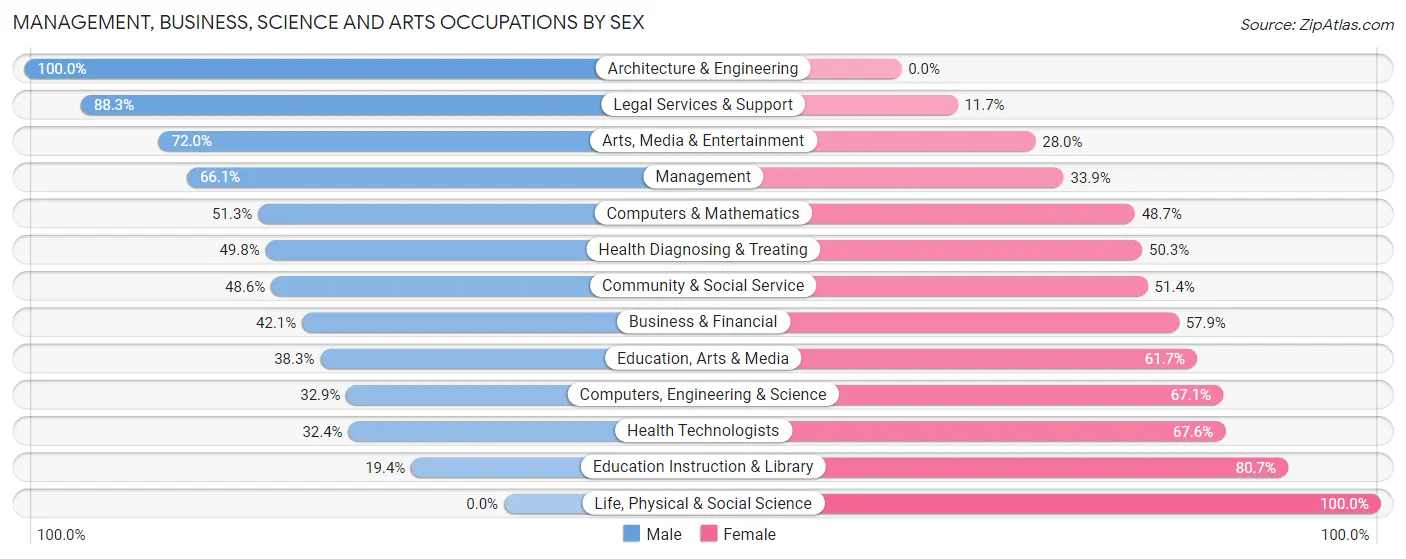
Management, Business, Science and Arts Occupations by Sex
Within the Management, Business, Science and Arts occupations in Rye Brook, the most male-oriented occupations are Architecture & Engineering (100.0%), Legal Services & Support (88.3%), and Arts, Media & Entertainment (72.0%), while the most female-oriented occupations are Life, Physical & Social Science (100.0%), Education Instruction & Library (80.6%), and Health Technologists (67.6%).
| Occupation | Male | Female |
| Management | 451 (66.1%) | 231 (33.9%) |
| Business & Financial | 232 (42.1%) | 319 (57.9%) |
| Computers, Engineering & Science | 98 (32.9%) | 200 (67.1%) |
| Computers & Mathematics | 80 (51.3%) | 76 (48.7%) |
| Architecture & Engineering | 18 (100.0%) | 0 (0.0%) |
| Life, Physical & Social Science | 0 (0.0%) | 124 (100.0%) |
| Community & Social Service | 410 (48.6%) | 434 (51.4%) |
| Education, Arts & Media | 23 (38.3%) | 37 (61.7%) |
| Legal Services & Support | 188 (88.3%) | 25 (11.7%) |
| Education Instruction & Library | 78 (19.4%) | 325 (80.6%) |
| Arts, Media & Entertainment | 121 (72.0%) | 47 (28.0%) |
| Health Diagnosing & Treating | 200 (49.7%) | 202 (50.2%) |
| Health Technologists | 97 (32.4%) | 202 (67.6%) |
| Total (Category) | 1,391 (50.1%) | 1,386 (49.9%) |
| Total (Overall) | 2,388 (54.6%) | 1,988 (45.4%) |
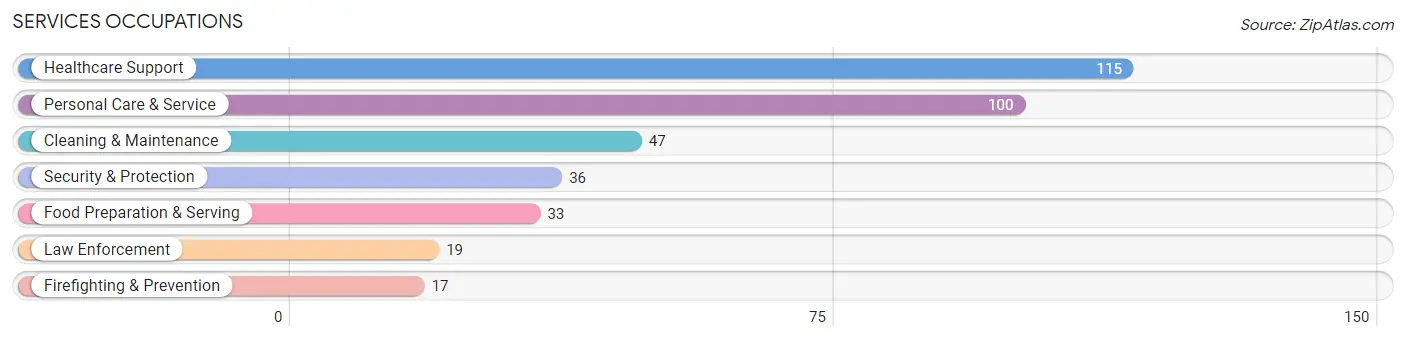
Services Occupations
The most common Services occupations in Rye Brook are Healthcare Support (115 | 2.6%), Personal Care & Service (100 | 2.3%), Cleaning & Maintenance (47 | 1.1%), Security & Protection (36 | 0.8%), and Food Preparation & Serving (33 | 0.7%).
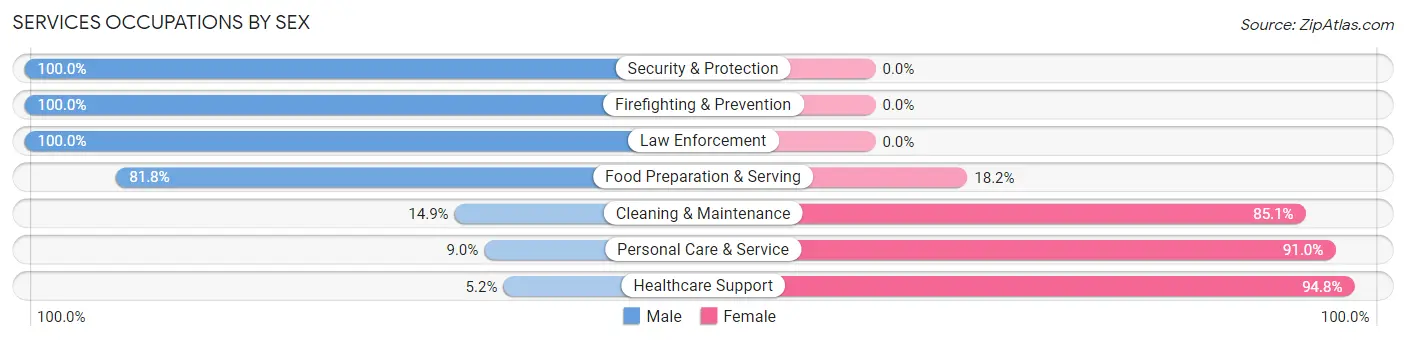
Services Occupations by Sex
Within the Services occupations in Rye Brook, the most male-oriented occupations are Security & Protection (100.0%), Firefighting & Prevention (100.0%), and Law Enforcement (100.0%), while the most female-oriented occupations are Healthcare Support (94.8%), Personal Care & Service (91.0%), and Cleaning & Maintenance (85.1%).
| Occupation | Male | Female |
| Healthcare Support | 6 (5.2%) | 109 (94.8%) |
| Security & Protection | 36 (100.0%) | 0 (0.0%) |
| Firefighting & Prevention | 17 (100.0%) | 0 (0.0%) |
| Law Enforcement | 19 (100.0%) | 0 (0.0%) |
| Food Preparation & Serving | 27 (81.8%) | 6 (18.2%) |
| Cleaning & Maintenance | 7 (14.9%) | 40 (85.1%) |
| Personal Care & Service | 9 (9.0%) | 91 (91.0%) |
| Total (Category) | 85 (25.7%) | 246 (74.3%) |
| Total (Overall) | 2,388 (54.6%) | 1,988 (45.4%) |
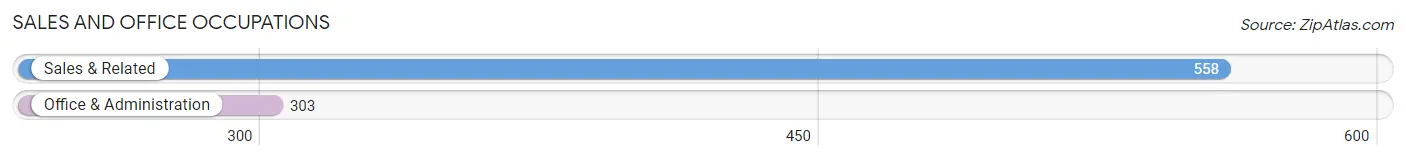
Sales and Office Occupations
The most common Sales and Office occupations in Rye Brook are Sales & Related (558 | 12.8%), and Office & Administration (303 | 6.9%).
Sales and Office Occupations by Sex
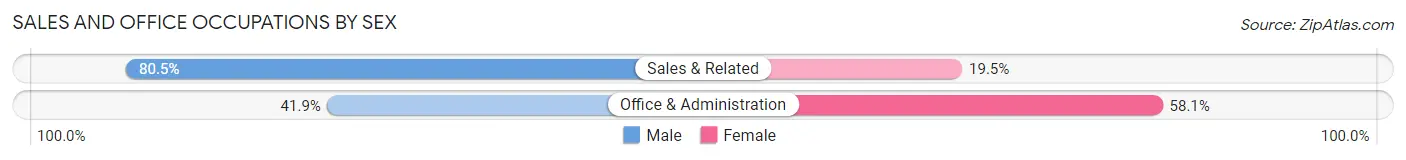
| Occupation | Male | Female |
| Sales & Related | 449 (80.5%) | 109 (19.5%) |
| Office & Administration | 127 (41.9%) | 176 (58.1%) |
| Total (Category) | 576 (66.9%) | 285 (33.1%) |
| Total (Overall) | 2,388 (54.6%) | 1,988 (45.4%) |
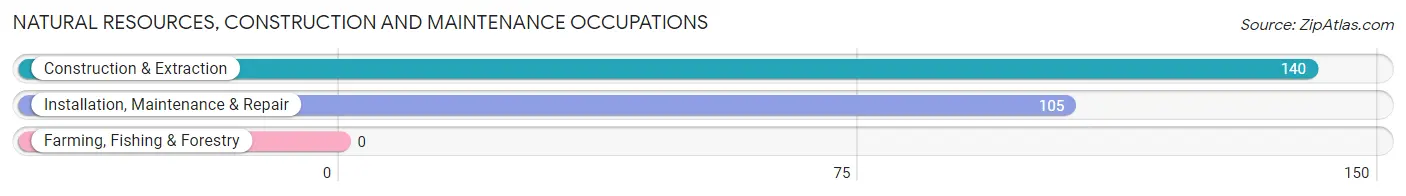
Natural Resources, Construction and Maintenance Occupations
The most common Natural Resources, Construction and Maintenance occupations in Rye Brook are Construction & Extraction (140 | 3.2%), and Installation, Maintenance & Repair (105 | 2.4%).
Natural Resources, Construction and Maintenance Occupations by Sex
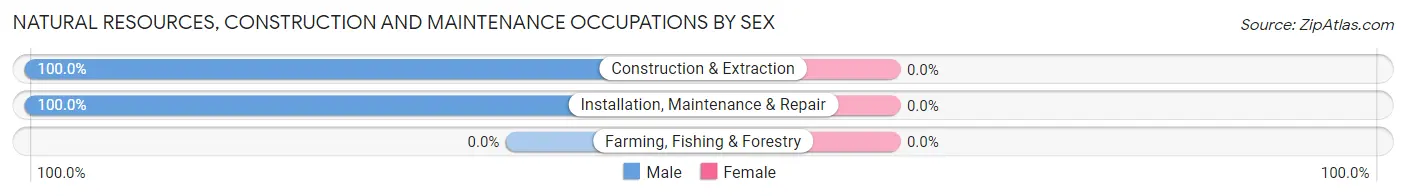
| Occupation | Male | Female |
| Farming, Fishing & Forestry | 0 (0.0%) | 0 (0.0%) |
| Construction & Extraction | 140 (100.0%) | 0 (0.0%) |
| Installation, Maintenance & Repair | 105 (100.0%) | 0 (0.0%) |
| Total (Category) | 245 (100.0%) | 0 (0.0%) |
| Total (Overall) | 2,388 (54.6%) | 1,988 (45.4%) |
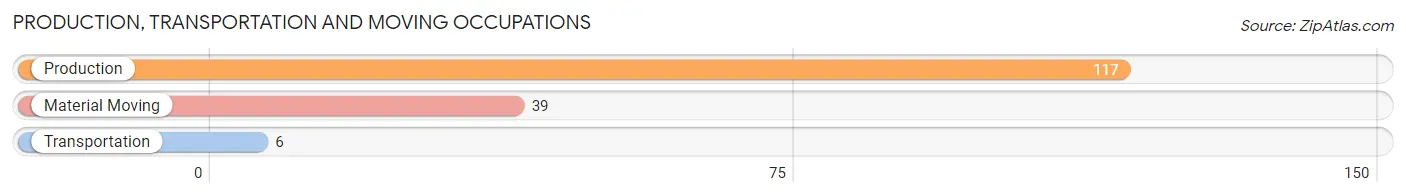
Production, Transportation and Moving Occupations
The most common Production, Transportation and Moving occupations in Rye Brook are Production (117 | 2.7%), Material Moving (39 | 0.9%), and Transportation (6 | 0.1%).
Production, Transportation and Moving Occupations by Sex
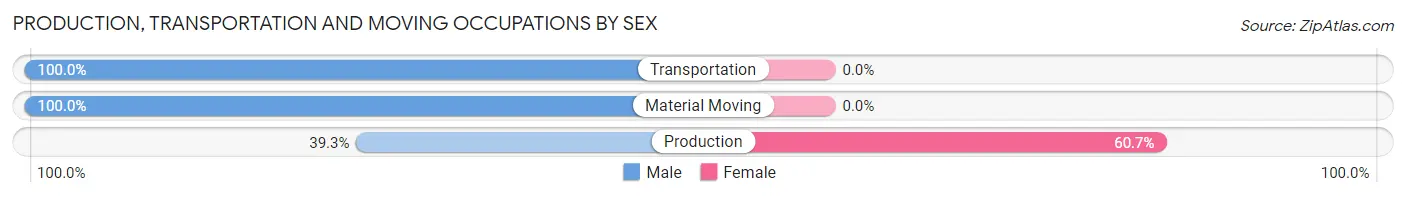
| Occupation | Male | Female |
| Production | 46 (39.3%) | 71 (60.7%) |
| Transportation | 6 (100.0%) | 0 (0.0%) |
| Material Moving | 39 (100.0%) | 0 (0.0%) |
| Total (Category) | 91 (56.2%) | 71 (43.8%) |
| Total (Overall) | 2,388 (54.6%) | 1,988 (45.4%) |
Employment Industries by Sex in Rye Brook
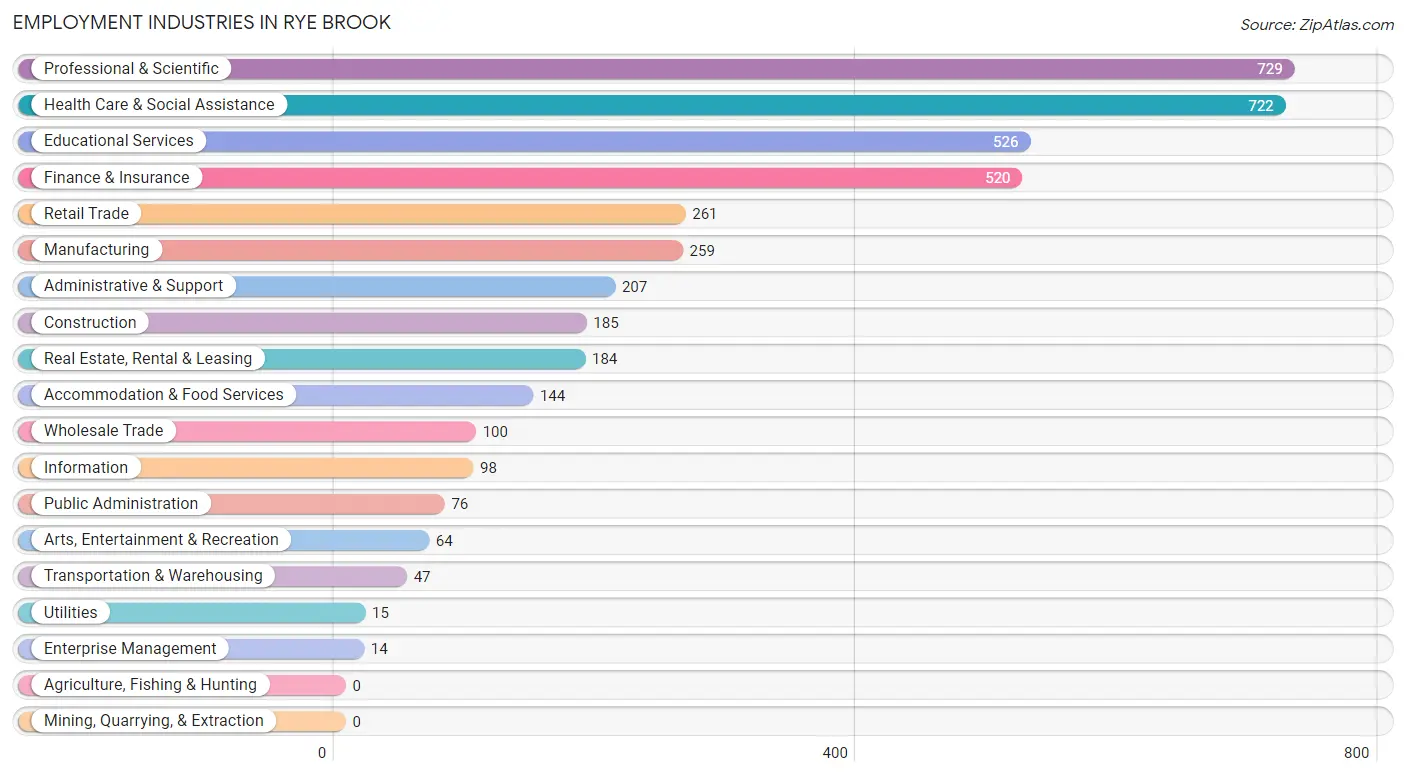
Employment Industries in Rye Brook
The major employment industries in Rye Brook include Professional & Scientific (729 | 16.7%), Health Care & Social Assistance (722 | 16.5%), Educational Services (526 | 12.0%), Finance & Insurance (520 | 11.9%), and Retail Trade (261 | 6.0%).
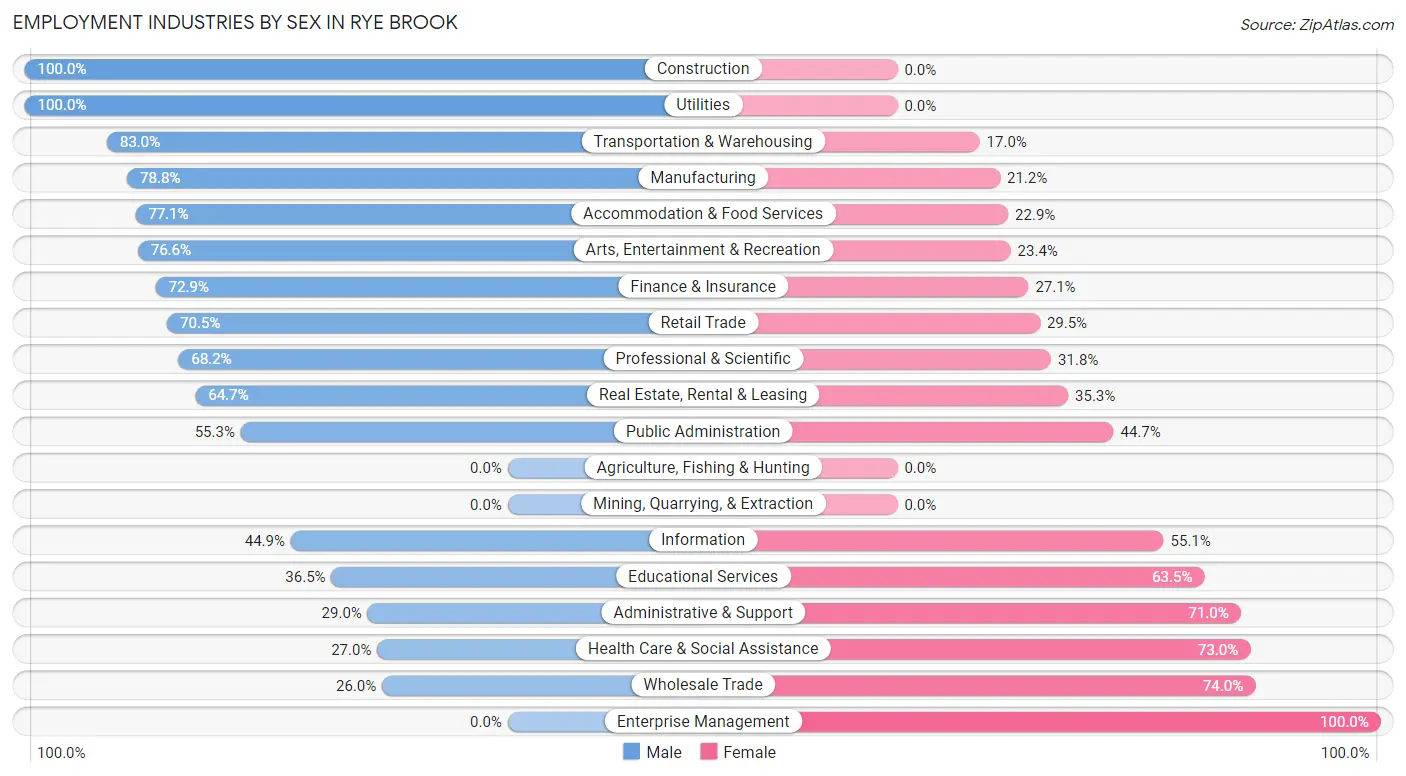
Employment Industries by Sex in Rye Brook
The Rye Brook industries that see more men than women are Construction (100.0%), Utilities (100.0%), and Transportation & Warehousing (83.0%), whereas the industries that tend to have a higher number of women are Enterprise Management (100.0%), Wholesale Trade (74.0%), and Health Care & Social Assistance (73.0%).
| Industry | Male | Female |
| Agriculture, Fishing & Hunting | 0 (0.0%) | 0 (0.0%) |
| Mining, Quarrying, & Extraction | 0 (0.0%) | 0 (0.0%) |
| Construction | 185 (100.0%) | 0 (0.0%) |
| Manufacturing | 204 (78.8%) | 55 (21.2%) |
| Wholesale Trade | 26 (26.0%) | 74 (74.0%) |
| Retail Trade | 184 (70.5%) | 77 (29.5%) |
| Transportation & Warehousing | 39 (83.0%) | 8 (17.0%) |
| Utilities | 15 (100.0%) | 0 (0.0%) |
| Information | 44 (44.9%) | 54 (55.1%) |
| Finance & Insurance | 379 (72.9%) | 141 (27.1%) |
| Real Estate, Rental & Leasing | 119 (64.7%) | 65 (35.3%) |
| Professional & Scientific | 497 (68.2%) | 232 (31.8%) |
| Enterprise Management | 0 (0.0%) | 14 (100.0%) |
| Administrative & Support | 60 (29.0%) | 147 (71.0%) |
| Educational Services | 192 (36.5%) | 334 (63.5%) |
| Health Care & Social Assistance | 195 (27.0%) | 527 (73.0%) |
| Arts, Entertainment & Recreation | 49 (76.6%) | 15 (23.4%) |
| Accommodation & Food Services | 111 (77.1%) | 33 (22.9%) |
| Public Administration | 42 (55.3%) | 34 (44.7%) |
| Total | 2,388 (54.6%) | 1,988 (45.4%) |
Education in Rye Brook
School Enrollment in Rye Brook
The most common levels of schooling among the 2,828 students in Rye Brook are high school (1,068 | 37.8%), college / undergraduate (610 | 21.6%), and middle school (508 | 18.0%).
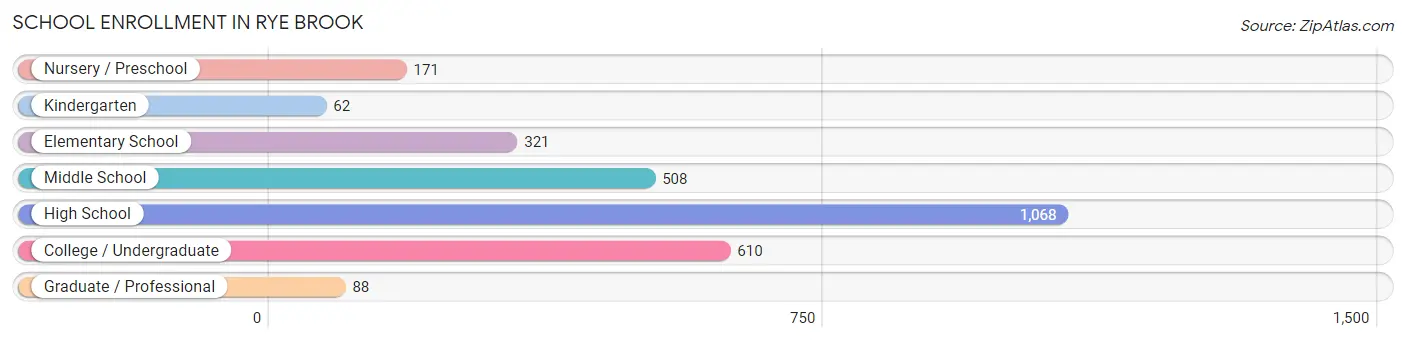
| School Level | # Students | % Students |
| Nursery / Preschool | 171 | 6.0% |
| Kindergarten | 62 | 2.2% |
| Elementary School | 321 | 11.4% |
| Middle School | 508 | 18.0% |
| High School | 1,068 | 37.8% |
| College / Undergraduate | 610 | 21.6% |
| Graduate / Professional | 88 | 3.1% |
| Total | 2,828 | 100.0% |
School Enrollment by Age by Funding Source in Rye Brook
Out of a total of 2,828 students who are enrolled in schools in Rye Brook, 597 (21.1%) attend a private institution, while the remaining 2,231 (78.9%) are enrolled in public schools. The age group of 3 to 4 year olds has the highest likelihood of being enrolled in private schools, with 156 (91.2% in the age bracket) enrolled. Conversely, the age group of 35 years and over has the lowest likelihood of being enrolled in a private school, with 17 (100.0% in the age bracket) attending a public institution.
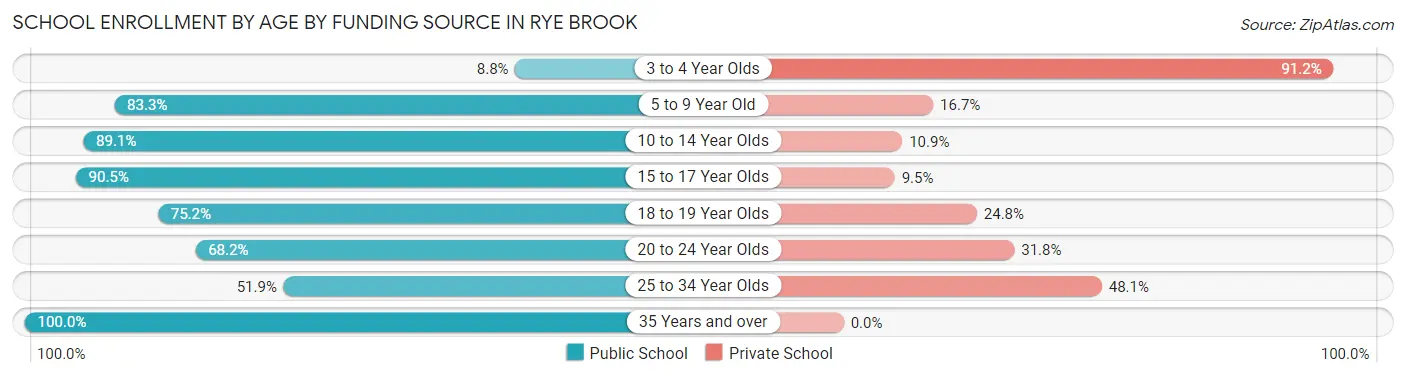
| Age Bracket | Public School | Private School |
| 3 to 4 Year Olds | 15 (8.8%) | 156 (91.2%) |
| 5 to 9 Year Old | 285 (83.3%) | 57 (16.7%) |
| 10 to 14 Year Olds | 629 (89.1%) | 77 (10.9%) |
| 15 to 17 Year Olds | 733 (90.5%) | 77 (9.5%) |
| 18 to 19 Year Olds | 291 (75.2%) | 96 (24.8%) |
| 20 to 24 Year Olds | 234 (68.2%) | 109 (31.8%) |
| 25 to 34 Year Olds | 27 (51.9%) | 25 (48.1%) |
| 35 Years and over | 17 (100.0%) | 0 (0.0%) |
| Total | 2,231 (78.9%) | 597 (21.1%) |
Educational Attainment by Field of Study in Rye Brook
Business (1,373 | 27.6%), social sciences (656 | 13.2%), education (404 | 8.1%), computers & mathematics (367 | 7.4%), and psychology (343 | 6.9%) are the most common fields of study among 4,971 individuals in Rye Brook who have obtained a bachelor's degree or higher.
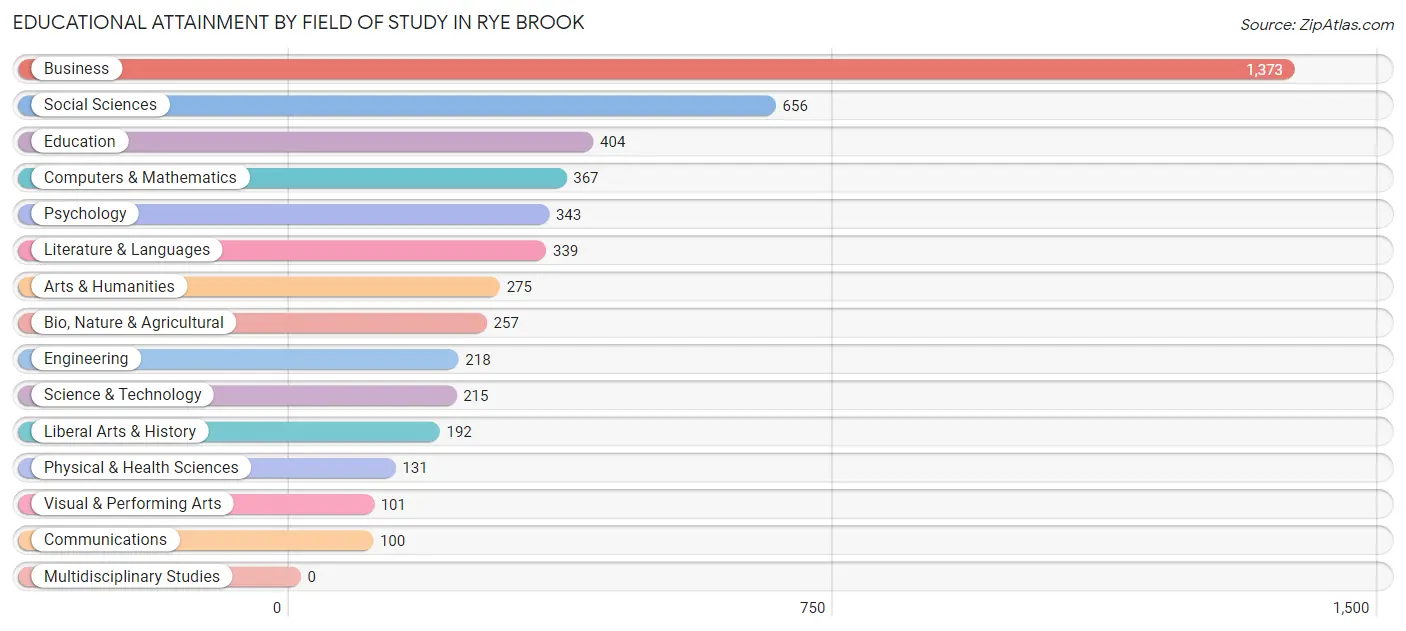
| Field of Study | # Graduates | % Graduates |
| Computers & Mathematics | 367 | 7.4% |
| Bio, Nature & Agricultural | 257 | 5.2% |
| Physical & Health Sciences | 131 | 2.6% |
| Psychology | 343 | 6.9% |
| Social Sciences | 656 | 13.2% |
| Engineering | 218 | 4.4% |
| Multidisciplinary Studies | 0 | 0.0% |
| Science & Technology | 215 | 4.3% |
| Business | 1,373 | 27.6% |
| Education | 404 | 8.1% |
| Literature & Languages | 339 | 6.8% |
| Liberal Arts & History | 192 | 3.9% |
| Visual & Performing Arts | 101 | 2.0% |
| Communications | 100 | 2.0% |
| Arts & Humanities | 275 | 5.5% |
| Total | 4,971 | 100.0% |
Transportation & Commute in Rye Brook
Vehicle Availability by Sex in Rye Brook
The most prevalent vehicle ownership categories in Rye Brook are males with 2 vehicles (1,302, accounting for 54.8%) and females with 2 vehicles (1,062, making up 66.0%).
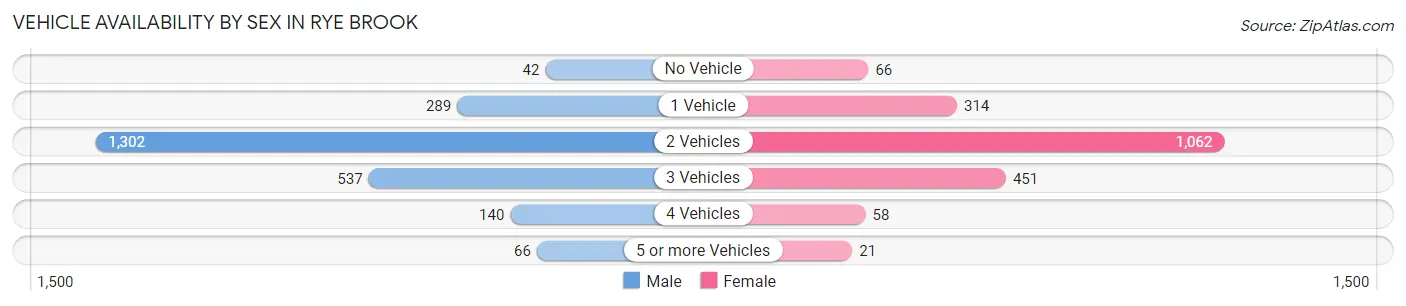
| Vehicles Available | Male | Female |
| No Vehicle | 42 (1.8%) | 66 (3.4%) |
| 1 Vehicle | 289 (12.2%) | 314 (15.9%) |
| 2 Vehicles | 1,302 (54.8%) | 1,062 (53.8%) |
| 3 Vehicles | 537 (22.6%) | 451 (22.9%) |
| 4 Vehicles | 140 (5.9%) | 58 (2.9%) |
| 5 or more Vehicles | 66 (2.8%) | 21 (1.1%) |
| Total | 2,376 (100.0%) | 1,972 (100.0%) |
Commute Time in Rye Brook
The most frequently occuring commute durations in Rye Brook are 60 to 89 minutes (600 commuters, 17.1%), 20 to 24 minutes (576 commuters, 16.5%), and 15 to 19 minutes (550 commuters, 15.7%).
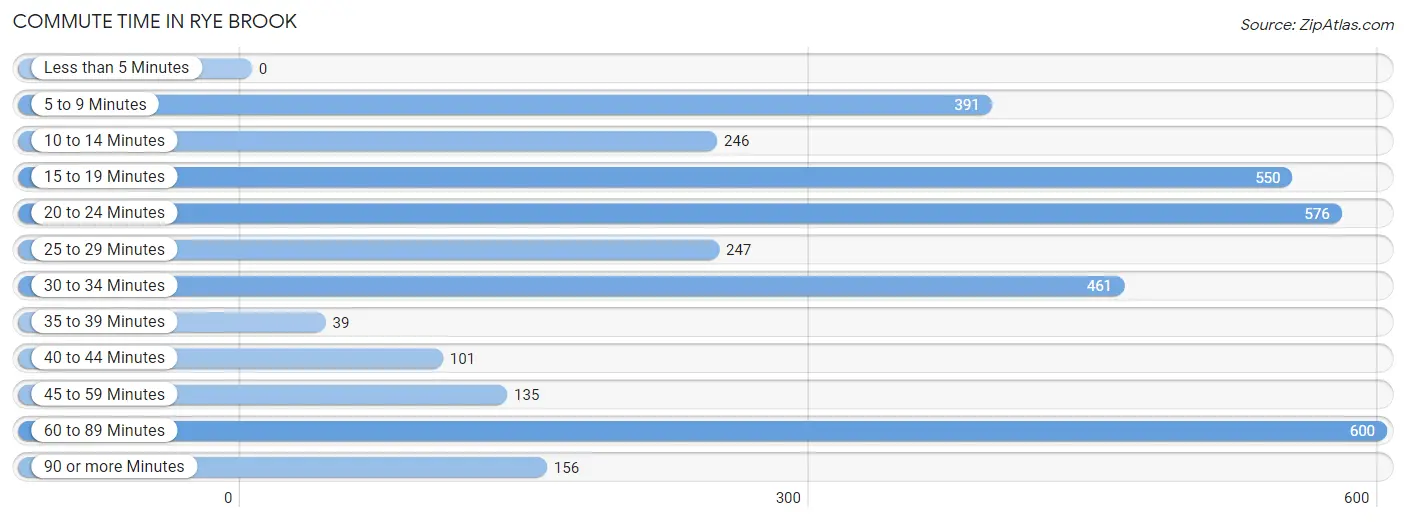
| Commute Time | # Commuters | % Commuters |
| Less than 5 Minutes | 0 | 0.0% |
| 5 to 9 Minutes | 391 | 11.2% |
| 10 to 14 Minutes | 246 | 7.0% |
| 15 to 19 Minutes | 550 | 15.7% |
| 20 to 24 Minutes | 576 | 16.5% |
| 25 to 29 Minutes | 247 | 7.0% |
| 30 to 34 Minutes | 461 | 13.2% |
| 35 to 39 Minutes | 39 | 1.1% |
| 40 to 44 Minutes | 101 | 2.9% |
| 45 to 59 Minutes | 135 | 3.8% |
| 60 to 89 Minutes | 600 | 17.1% |
| 90 or more Minutes | 156 | 4.4% |
Commute Time by Sex in Rye Brook
The most common commute times in Rye Brook are 60 to 89 minutes (500 commuters, 26.3%) for males and 20 to 24 minutes (341 commuters, 21.3%) for females.
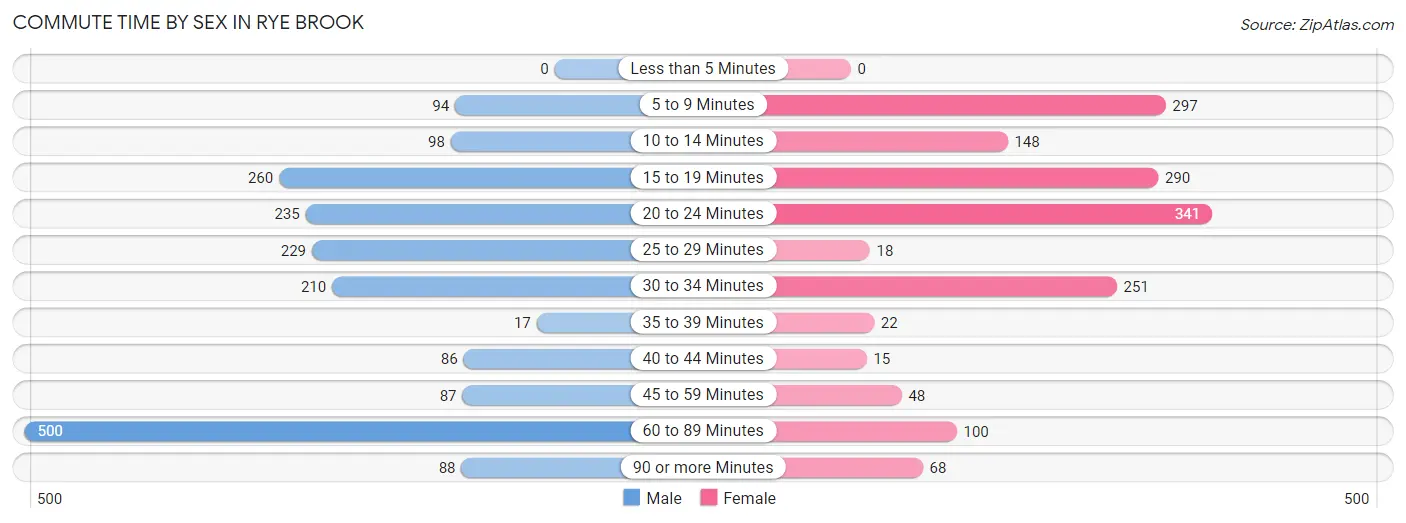
| Commute Time | Male | Female |
| Less than 5 Minutes | 0 (0.0%) | 0 (0.0%) |
| 5 to 9 Minutes | 94 (4.9%) | 297 (18.6%) |
| 10 to 14 Minutes | 98 (5.1%) | 148 (9.3%) |
| 15 to 19 Minutes | 260 (13.7%) | 290 (18.1%) |
| 20 to 24 Minutes | 235 (12.3%) | 341 (21.3%) |
| 25 to 29 Minutes | 229 (12.0%) | 18 (1.1%) |
| 30 to 34 Minutes | 210 (11.0%) | 251 (15.7%) |
| 35 to 39 Minutes | 17 (0.9%) | 22 (1.4%) |
| 40 to 44 Minutes | 86 (4.5%) | 15 (0.9%) |
| 45 to 59 Minutes | 87 (4.6%) | 48 (3.0%) |
| 60 to 89 Minutes | 500 (26.3%) | 100 (6.3%) |
| 90 or more Minutes | 88 (4.6%) | 68 (4.3%) |
Time of Departure to Work by Sex in Rye Brook
The most frequent times of departure to work in Rye Brook are 8:00 AM to 8:29 AM (480, 25.2%) for males and 8:30 AM to 8:59 AM (357, 22.3%) for females.
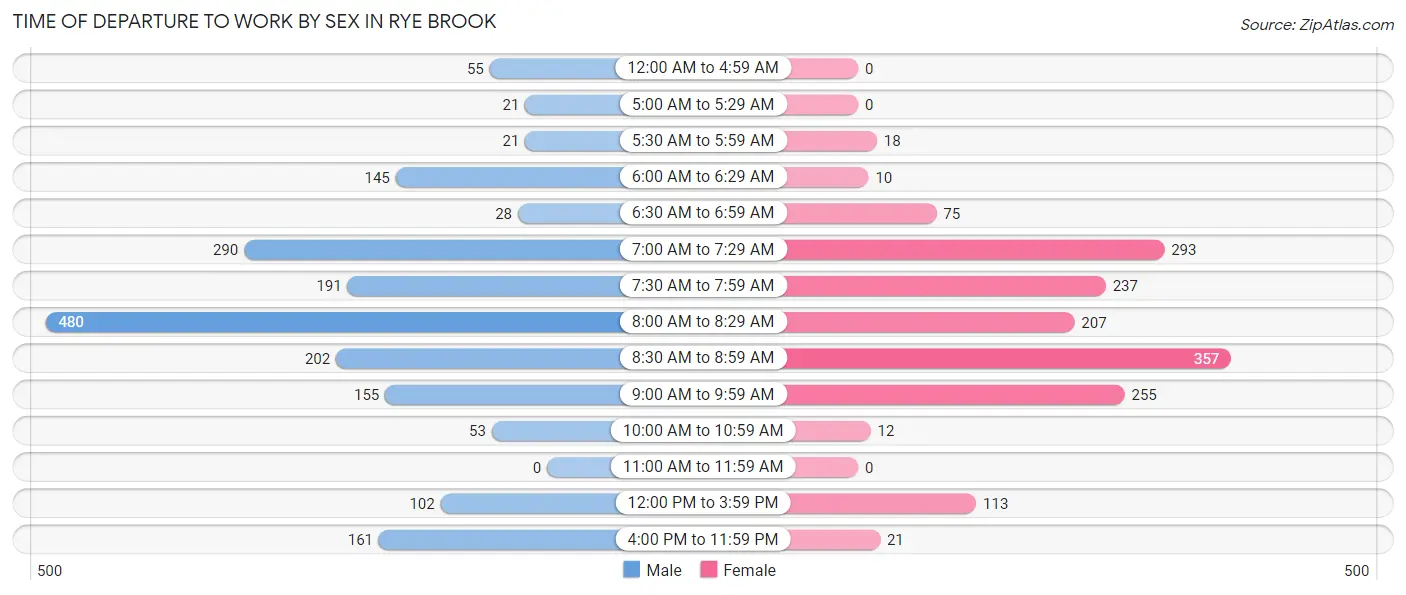
| Time of Departure | Male | Female |
| 12:00 AM to 4:59 AM | 55 (2.9%) | 0 (0.0%) |
| 5:00 AM to 5:29 AM | 21 (1.1%) | 0 (0.0%) |
| 5:30 AM to 5:59 AM | 21 (1.1%) | 18 (1.1%) |
| 6:00 AM to 6:29 AM | 145 (7.6%) | 10 (0.6%) |
| 6:30 AM to 6:59 AM | 28 (1.5%) | 75 (4.7%) |
| 7:00 AM to 7:29 AM | 290 (15.2%) | 293 (18.3%) |
| 7:30 AM to 7:59 AM | 191 (10.0%) | 237 (14.8%) |
| 8:00 AM to 8:29 AM | 480 (25.2%) | 207 (13.0%) |
| 8:30 AM to 8:59 AM | 202 (10.6%) | 357 (22.3%) |
| 9:00 AM to 9:59 AM | 155 (8.1%) | 255 (16.0%) |
| 10:00 AM to 10:59 AM | 53 (2.8%) | 12 (0.7%) |
| 11:00 AM to 11:59 AM | 0 (0.0%) | 0 (0.0%) |
| 12:00 PM to 3:59 PM | 102 (5.4%) | 113 (7.1%) |
| 4:00 PM to 11:59 PM | 161 (8.5%) | 21 (1.3%) |
| Total | 1,904 (100.0%) | 1,598 (100.0%) |
Housing Occupancy in Rye Brook
Occupancy by Ownership in Rye Brook
Of the total 3,405 dwellings in Rye Brook, owner-occupied units account for 2,917 (85.7%), while renter-occupied units make up 488 (14.3%).
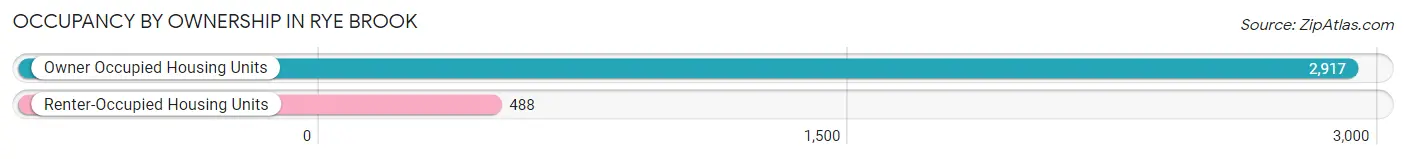
| Occupancy | # Housing Units | % Housing Units |
| Owner Occupied Housing Units | 2,917 | 85.7% |
| Renter-Occupied Housing Units | 488 | 14.3% |
| Total Occupied Housing Units | 3,405 | 100.0% |
Occupancy by Household Size in Rye Brook
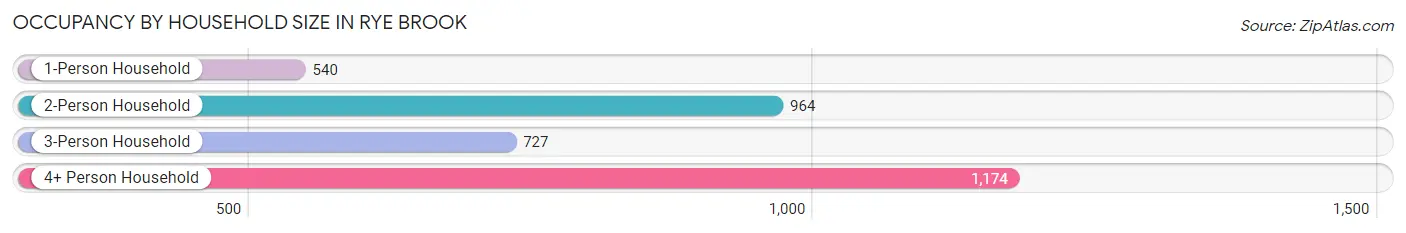
| Household Size | # Housing Units | % Housing Units |
| 1-Person Household | 540 | 15.9% |
| 2-Person Household | 964 | 28.3% |
| 3-Person Household | 727 | 21.3% |
| 4+ Person Household | 1,174 | 34.5% |
| Total Housing Units | 3,405 | 100.0% |
Occupancy by Ownership by Household Size in Rye Brook
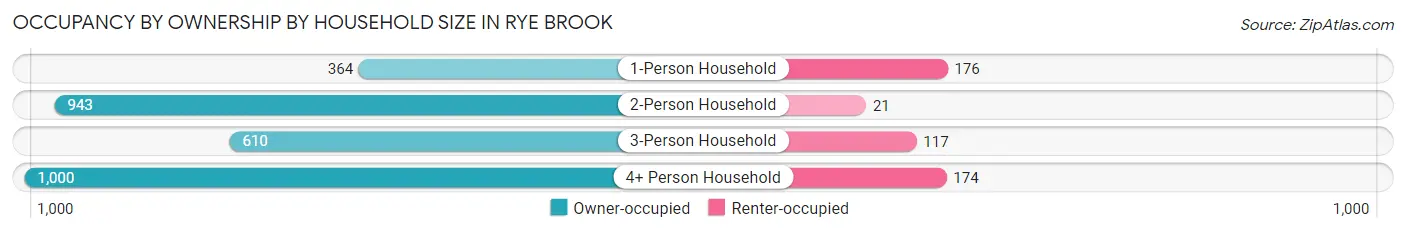
| Household Size | Owner-occupied | Renter-occupied |
| 1-Person Household | 364 (67.4%) | 176 (32.6%) |
| 2-Person Household | 943 (97.8%) | 21 (2.2%) |
| 3-Person Household | 610 (83.9%) | 117 (16.1%) |
| 4+ Person Household | 1,000 (85.2%) | 174 (14.8%) |
| Total Housing Units | 2,917 (85.7%) | 488 (14.3%) |
Occupancy by Educational Attainment in Rye Brook
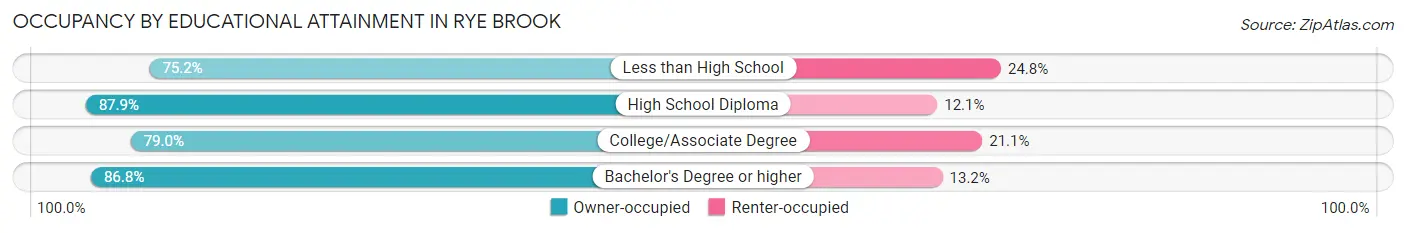
| Household Size | Owner-occupied | Renter-occupied |
| Less than High School | 79 (75.2%) | 26 (24.8%) |
| High School Diploma | 348 (87.9%) | 48 (12.1%) |
| College/Associate Degree | 315 (78.9%) | 84 (21.0%) |
| Bachelor's Degree or higher | 2,175 (86.8%) | 330 (13.2%) |
Occupancy by Age of Householder in Rye Brook
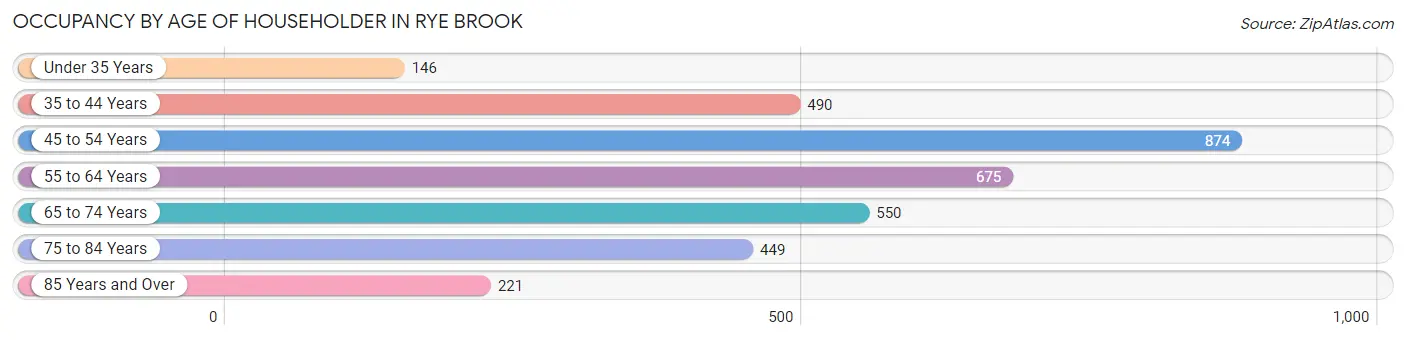
| Age Bracket | # Households | % Households |
| Under 35 Years | 146 | 4.3% |
| 35 to 44 Years | 490 | 14.4% |
| 45 to 54 Years | 874 | 25.7% |
| 55 to 64 Years | 675 | 19.8% |
| 65 to 74 Years | 550 | 16.2% |
| 75 to 84 Years | 449 | 13.2% |
| 85 Years and Over | 221 | 6.5% |
| Total | 3,405 | 100.0% |
Housing Finances in Rye Brook
Median Income by Occupancy in Rye Brook
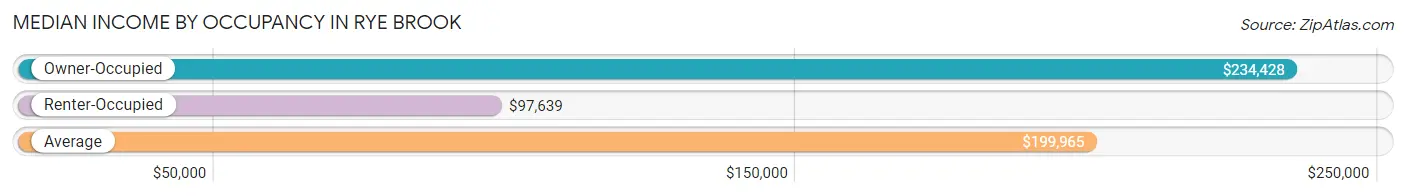
| Occupancy Type | # Households | Median Income |
| Owner-Occupied | 2,917 (85.7%) | $234,428 |
| Renter-Occupied | 488 (14.3%) | $97,639 |
| Average | 3,405 (100.0%) | $199,965 |
Occupancy by Householder Income Bracket in Rye Brook
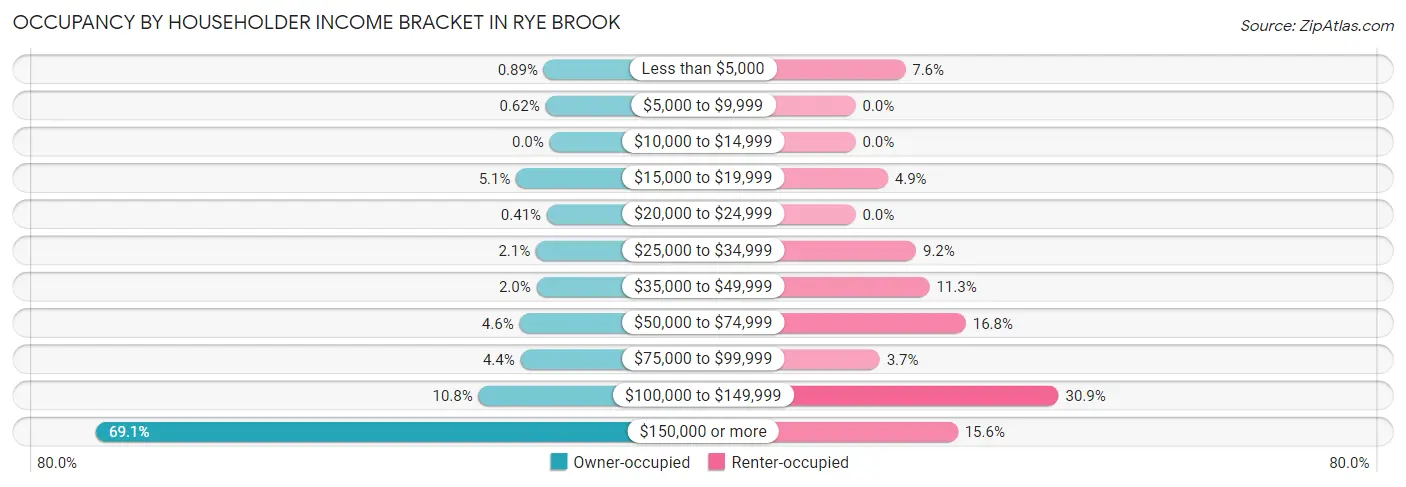
| Income Bracket | Owner-occupied | Renter-occupied |
| Less than $5,000 | 26 (0.9%) | 37 (7.6%) |
| $5,000 to $9,999 | 18 (0.6%) | 0 (0.0%) |
| $10,000 to $14,999 | 0 (0.0%) | 0 (0.0%) |
| $15,000 to $19,999 | 148 (5.1%) | 24 (4.9%) |
| $20,000 to $24,999 | 12 (0.4%) | 0 (0.0%) |
| $25,000 to $34,999 | 60 (2.1%) | 45 (9.2%) |
| $35,000 to $49,999 | 58 (2.0%) | 55 (11.3%) |
| $50,000 to $74,999 | 134 (4.6%) | 82 (16.8%) |
| $75,000 to $99,999 | 129 (4.4%) | 18 (3.7%) |
| $100,000 to $149,999 | 316 (10.8%) | 151 (30.9%) |
| $150,000 or more | 2,016 (69.1%) | 76 (15.6%) |
| Total | 2,917 (100.0%) | 488 (100.0%) |
Monthly Housing Cost Tiers in Rye Brook
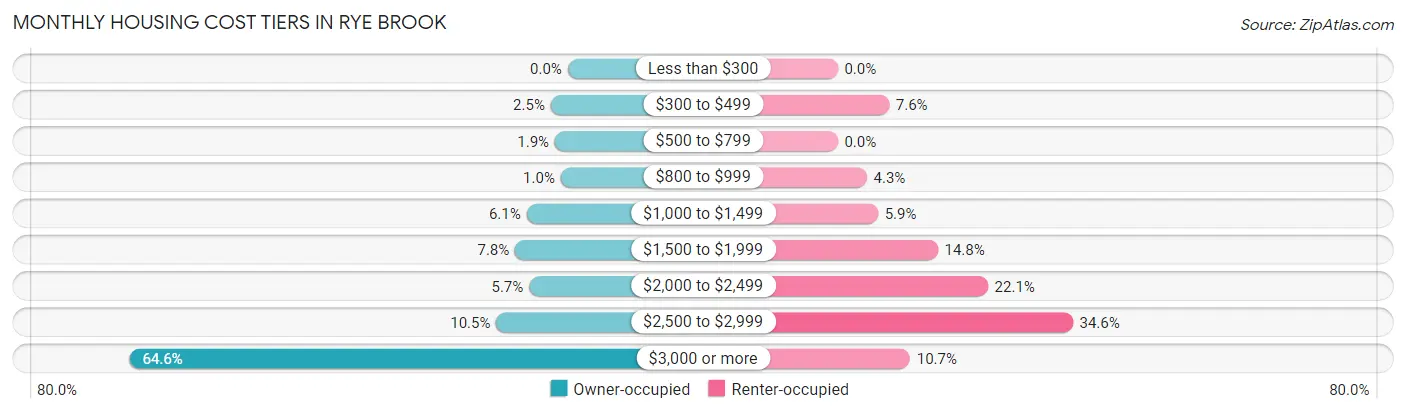
| Monthly Cost | Owner-occupied | Renter-occupied |
| Less than $300 | 0 (0.0%) | 0 (0.0%) |
| $300 to $499 | 73 (2.5%) | 37 (7.6%) |
| $500 to $799 | 55 (1.9%) | 0 (0.0%) |
| $800 to $999 | 30 (1.0%) | 21 (4.3%) |
| $1,000 to $1,499 | 177 (6.1%) | 29 (5.9%) |
| $1,500 to $1,999 | 226 (7.7%) | 72 (14.7%) |
| $2,000 to $2,499 | 166 (5.7%) | 108 (22.1%) |
| $2,500 to $2,999 | 307 (10.5%) | 169 (34.6%) |
| $3,000 or more | 1,883 (64.5%) | 52 (10.7%) |
| Total | 2,917 (100.0%) | 488 (100.0%) |
Physical Housing Characteristics in Rye Brook
Housing Structures in Rye Brook
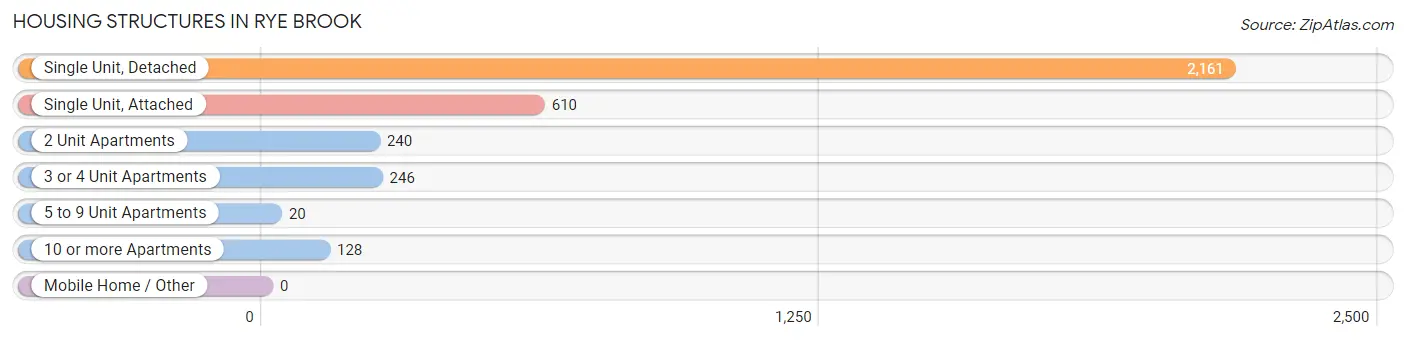
| Structure Type | # Housing Units | % Housing Units |
| Single Unit, Detached | 2,161 | 63.5% |
| Single Unit, Attached | 610 | 17.9% |
| 2 Unit Apartments | 240 | 7.0% |
| 3 or 4 Unit Apartments | 246 | 7.2% |
| 5 to 9 Unit Apartments | 20 | 0.6% |
| 10 or more Apartments | 128 | 3.8% |
| Mobile Home / Other | 0 | 0.0% |
| Total | 3,405 | 100.0% |
Housing Structures by Occupancy in Rye Brook
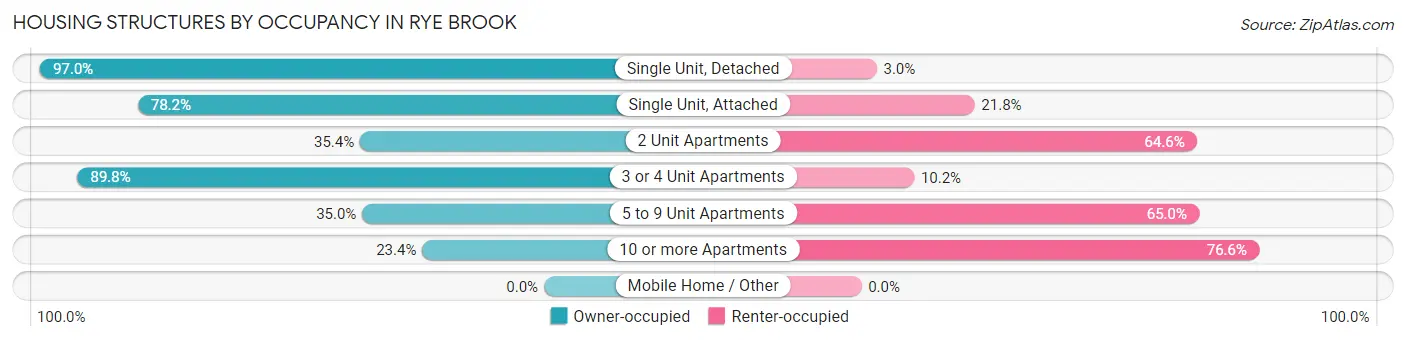
| Structure Type | Owner-occupied | Renter-occupied |
| Single Unit, Detached | 2,097 (97.0%) | 64 (3.0%) |
| Single Unit, Attached | 477 (78.2%) | 133 (21.8%) |
| 2 Unit Apartments | 85 (35.4%) | 155 (64.6%) |
| 3 or 4 Unit Apartments | 221 (89.8%) | 25 (10.2%) |
| 5 to 9 Unit Apartments | 7 (35.0%) | 13 (65.0%) |
| 10 or more Apartments | 30 (23.4%) | 98 (76.6%) |
| Mobile Home / Other | 0 (0.0%) | 0 (0.0%) |
| Total | 2,917 (85.7%) | 488 (14.3%) |
Housing Structures by Number of Rooms in Rye Brook
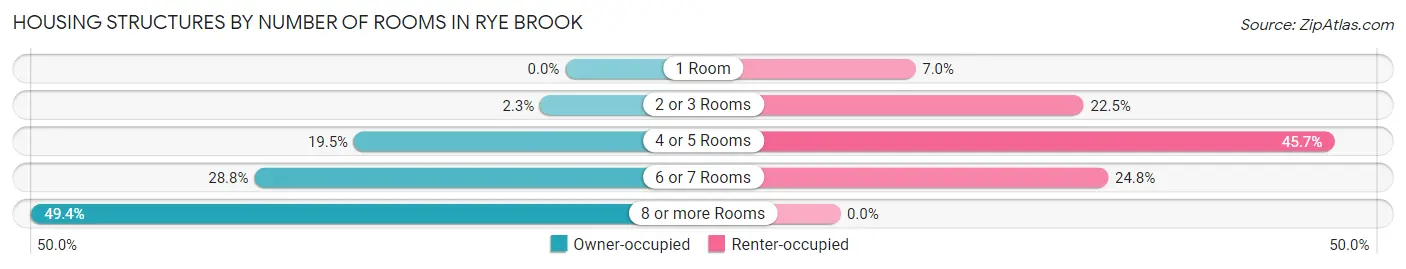
| Number of Rooms | Owner-occupied | Renter-occupied |
| 1 Room | 0 (0.0%) | 34 (7.0%) |
| 2 or 3 Rooms | 68 (2.3%) | 110 (22.5%) |
| 4 or 5 Rooms | 570 (19.5%) | 223 (45.7%) |
| 6 or 7 Rooms | 839 (28.8%) | 121 (24.8%) |
| 8 or more Rooms | 1,440 (49.4%) | 0 (0.0%) |
| Total | 2,917 (100.0%) | 488 (100.0%) |
Housing Structure by Heating Type in Rye Brook
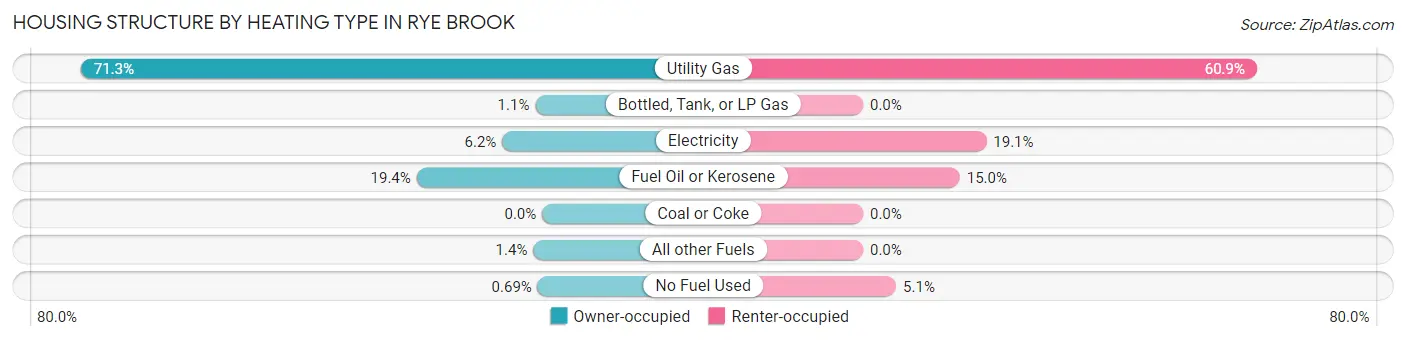
| Heating Type | Owner-occupied | Renter-occupied |
| Utility Gas | 2,080 (71.3%) | 297 (60.9%) |
| Bottled, Tank, or LP Gas | 31 (1.1%) | 0 (0.0%) |
| Electricity | 180 (6.2%) | 93 (19.1%) |
| Fuel Oil or Kerosene | 566 (19.4%) | 73 (15.0%) |
| Coal or Coke | 0 (0.0%) | 0 (0.0%) |
| All other Fuels | 40 (1.4%) | 0 (0.0%) |
| No Fuel Used | 20 (0.7%) | 25 (5.1%) |
| Total | 2,917 (100.0%) | 488 (100.0%) |
Household Vehicle Usage in Rye Brook
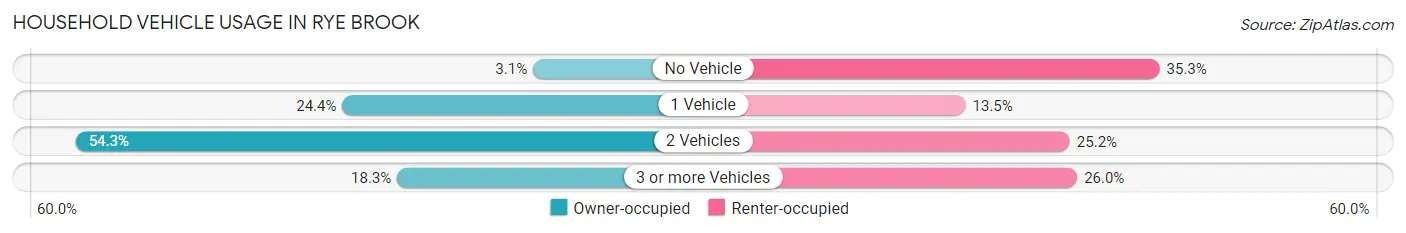
| Vehicles per Household | Owner-occupied | Renter-occupied |
| No Vehicle | 89 (3.0%) | 172 (35.2%) |
| 1 Vehicle | 712 (24.4%) | 66 (13.5%) |
| 2 Vehicles | 1,583 (54.3%) | 123 (25.2%) |
| 3 or more Vehicles | 533 (18.3%) | 127 (26.0%) |
| Total | 2,917 (100.0%) | 488 (100.0%) |
Real Estate & Mortgages in Rye Brook
Real Estate and Mortgage Overview in Rye Brook
| Characteristic | Without Mortgage | With Mortgage |
| Housing Units | 1,188 | 1,729 |
| Median Property Value | $798,000 | $995,200 |
| Median Household Income | $191,525 | $1,290 |
| Monthly Housing Costs | $1,501 | $1,587 |
| Real Estate Taxes | $10,001 | $0 |
Property Value by Mortgage Status in Rye Brook
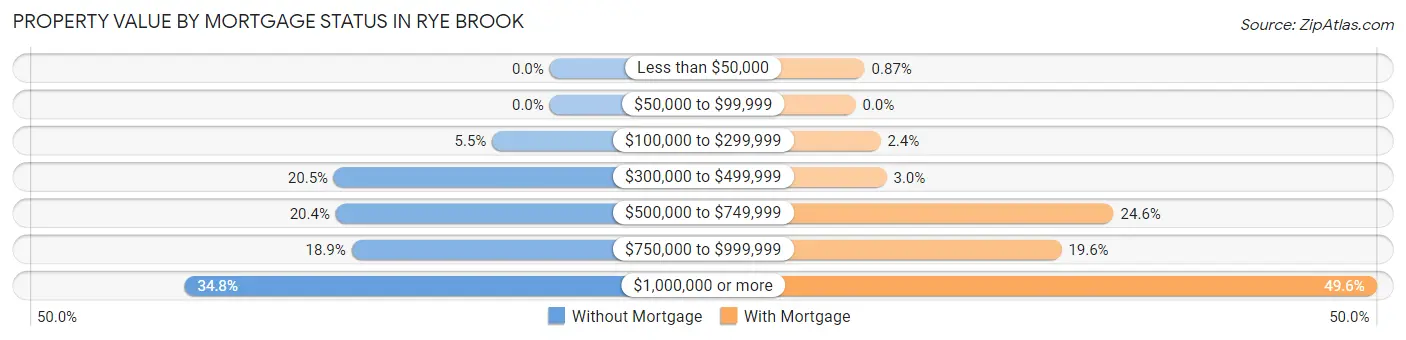
| Property Value | Without Mortgage | With Mortgage |
| Less than $50,000 | 0 (0.0%) | 15 (0.9%) |
| $50,000 to $99,999 | 0 (0.0%) | 0 (0.0%) |
| $100,000 to $299,999 | 65 (5.5%) | 41 (2.4%) |
| $300,000 to $499,999 | 244 (20.5%) | 51 (2.9%) |
| $500,000 to $749,999 | 242 (20.4%) | 425 (24.6%) |
| $750,000 to $999,999 | 224 (18.9%) | 339 (19.6%) |
| $1,000,000 or more | 413 (34.8%) | 858 (49.6%) |
| Total | 1,188 (100.0%) | 1,729 (100.0%) |
Household Income by Mortgage Status in Rye Brook
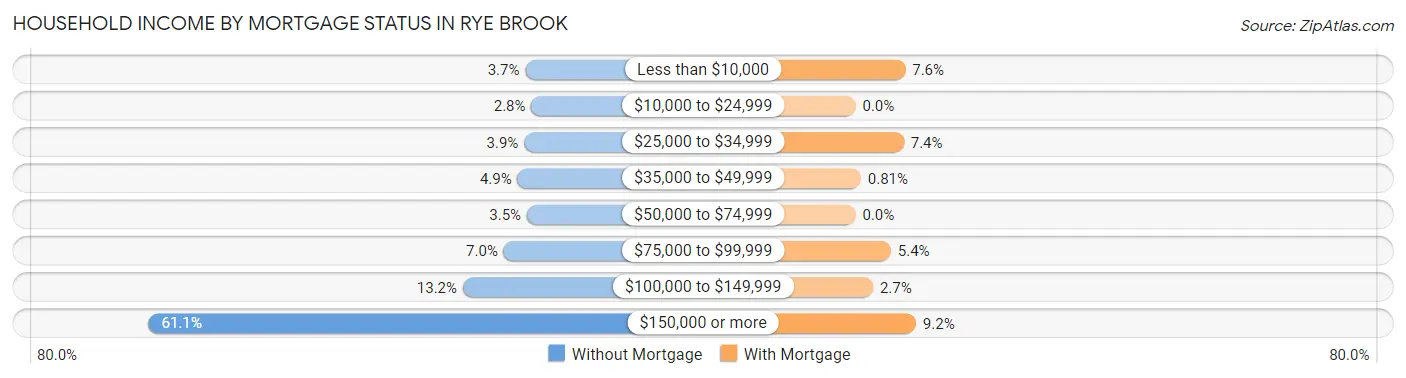
| Household Income | Without Mortgage | With Mortgage |
| Less than $10,000 | 44 (3.7%) | 131 (7.6%) |
| $10,000 to $24,999 | 33 (2.8%) | 0 (0.0%) |
| $25,000 to $34,999 | 46 (3.9%) | 127 (7.3%) |
| $35,000 to $49,999 | 58 (4.9%) | 14 (0.8%) |
| $50,000 to $74,999 | 41 (3.5%) | 0 (0.0%) |
| $75,000 to $99,999 | 83 (7.0%) | 93 (5.4%) |
| $100,000 to $149,999 | 157 (13.2%) | 46 (2.7%) |
| $150,000 or more | 726 (61.1%) | 159 (9.2%) |
| Total | 1,188 (100.0%) | 1,729 (100.0%) |
Property Value to Household Income Ratio in Rye Brook
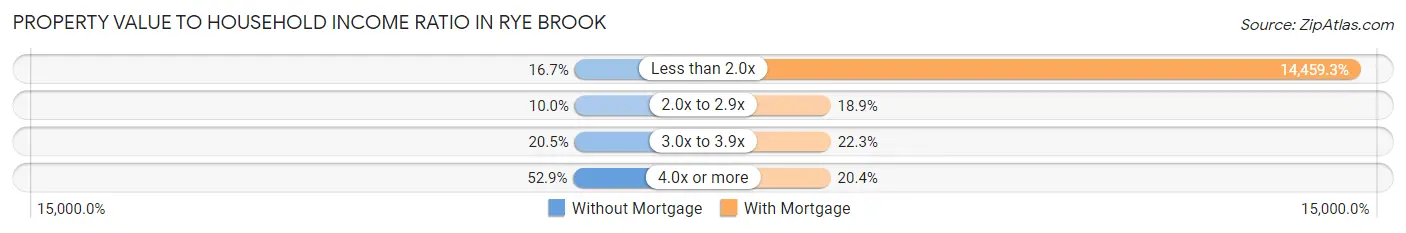
| Value-to-Income Ratio | Without Mortgage | With Mortgage |
| Less than 2.0x | 198 (16.7%) | 250,001 (14,459.3%) |
| 2.0x to 2.9x | 119 (10.0%) | 327 (18.9%) |
| 3.0x to 3.9x | 243 (20.4%) | 386 (22.3%) |
| 4.0x or more | 628 (52.9%) | 353 (20.4%) |
| Total | 1,188 (100.0%) | 1,729 (100.0%) |
Real Estate Taxes by Mortgage Status in Rye Brook
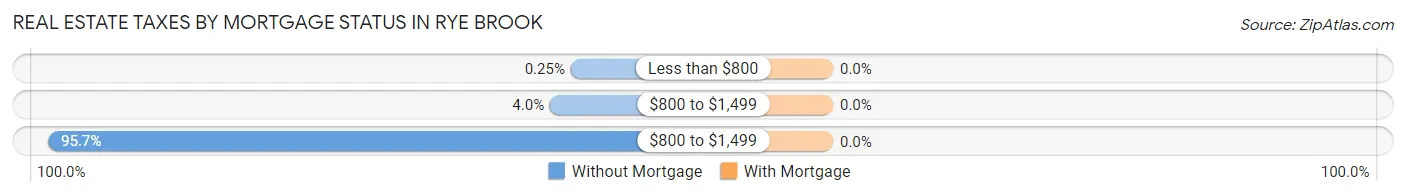
| Property Taxes | Without Mortgage | With Mortgage |
| Less than $800 | 3 (0.3%) | 0 (0.0%) |
| $800 to $1,499 | 48 (4.0%) | 0 (0.0%) |
| $800 to $1,499 | 1,137 (95.7%) | 0 (0.0%) |
| Total | 1,188 (100.0%) | 1,729 (100.0%) |
Health & Disability in Rye Brook
Health Insurance Coverage by Age in Rye Brook
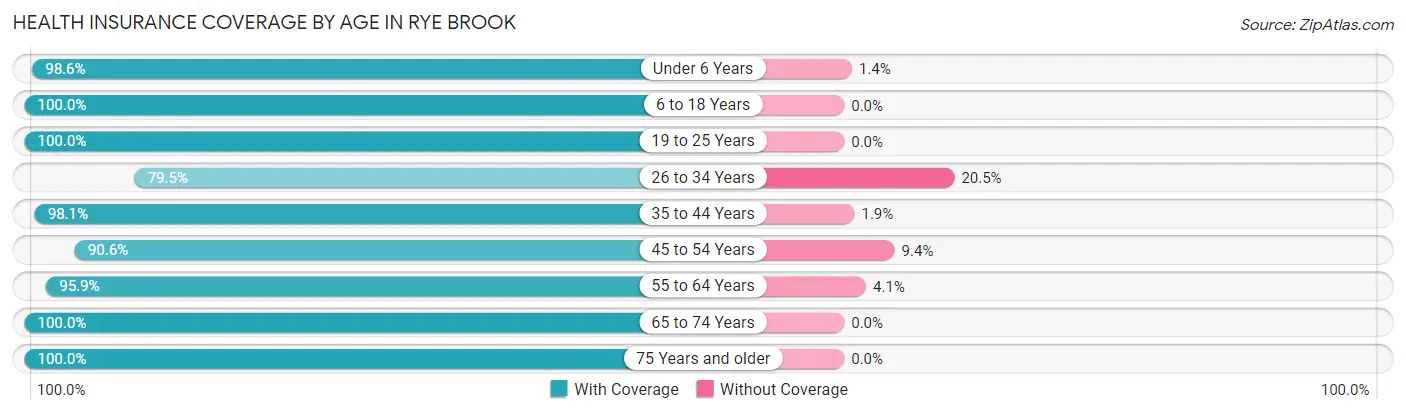
| Age Bracket | With Coverage | Without Coverage |
| Under 6 Years | 412 (98.6%) | 6 (1.4%) |
| 6 to 18 Years | 1,959 (100.0%) | 0 (0.0%) |
| 19 to 25 Years | 967 (100.0%) | 0 (0.0%) |
| 26 to 34 Years | 352 (79.5%) | 91 (20.5%) |
| 35 to 44 Years | 1,132 (98.1%) | 22 (1.9%) |
| 45 to 54 Years | 1,466 (90.6%) | 152 (9.4%) |
| 55 to 64 Years | 1,275 (95.9%) | 54 (4.1%) |
| 65 to 74 Years | 891 (100.0%) | 0 (0.0%) |
| 75 Years and older | 1,077 (100.0%) | 0 (0.0%) |
| Total | 9,531 (96.7%) | 325 (3.3%) |
Health Insurance Coverage by Citizenship Status in Rye Brook
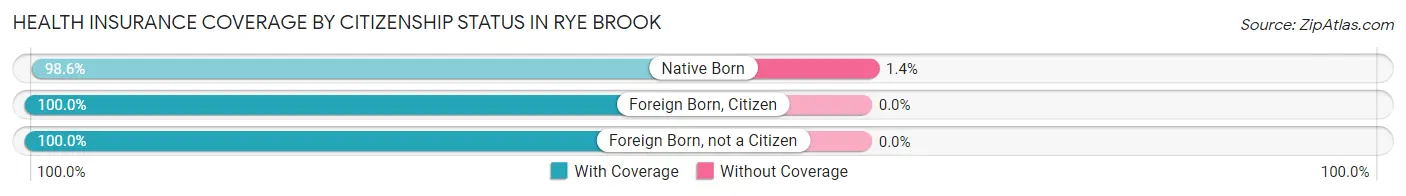
| Citizenship Status | With Coverage | Without Coverage |
| Native Born | 412 (98.6%) | 6 (1.4%) |
| Foreign Born, Citizen | 1,959 (100.0%) | 0 (0.0%) |
| Foreign Born, not a Citizen | 967 (100.0%) | 0 (0.0%) |
Health Insurance Coverage by Household Income in Rye Brook
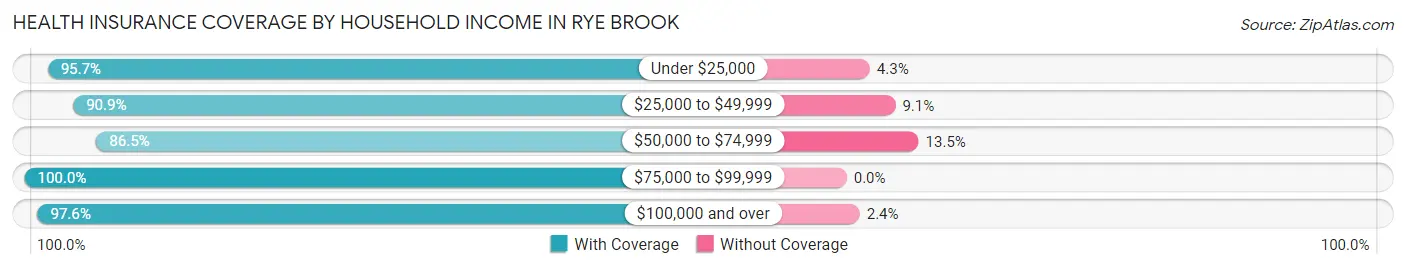
| Household Income | With Coverage | Without Coverage |
| Under $25,000 | 552 (95.7%) | 25 (4.3%) |
| $25,000 to $49,999 | 279 (90.9%) | 28 (9.1%) |
| $50,000 to $74,999 | 482 (86.5%) | 75 (13.5%) |
| $75,000 to $99,999 | 282 (100.0%) | 0 (0.0%) |
| $100,000 and over | 7,896 (97.6%) | 197 (2.4%) |
Public vs Private Health Insurance Coverage by Age in Rye Brook
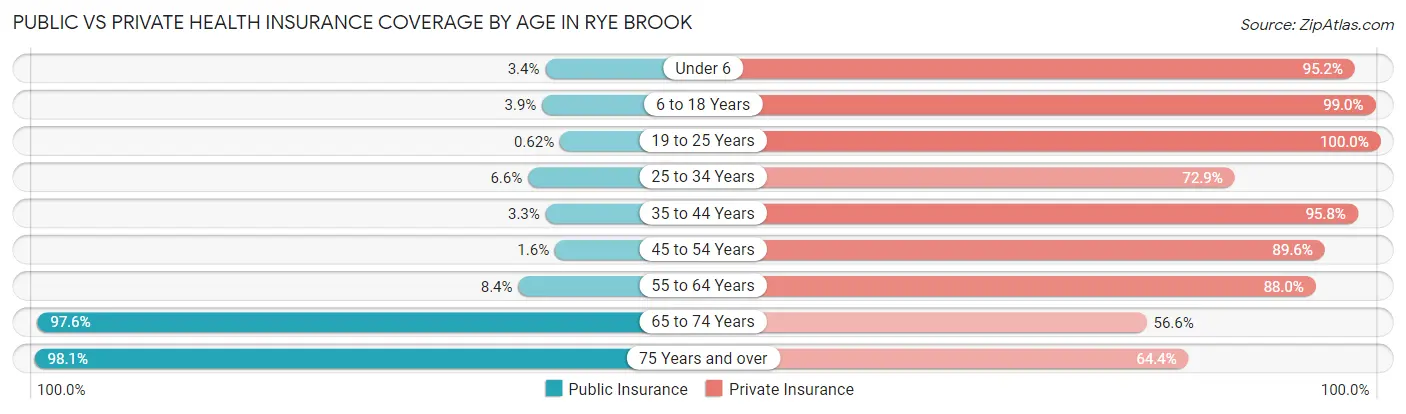
| Age Bracket | Public Insurance | Private Insurance |
| Under 6 | 14 (3.4%) | 398 (95.2%) |
| 6 to 18 Years | 77 (3.9%) | 1,940 (99.0%) |
| 19 to 25 Years | 6 (0.6%) | 967 (100.0%) |
| 25 to 34 Years | 29 (6.6%) | 323 (72.9%) |
| 35 to 44 Years | 38 (3.3%) | 1,105 (95.8%) |
| 45 to 54 Years | 25 (1.5%) | 1,450 (89.6%) |
| 55 to 64 Years | 111 (8.4%) | 1,169 (88.0%) |
| 65 to 74 Years | 870 (97.6%) | 504 (56.6%) |
| 75 Years and over | 1,057 (98.1%) | 693 (64.3%) |
| Total | 2,227 (22.6%) | 8,549 (86.7%) |
Disability Status by Sex by Age in Rye Brook
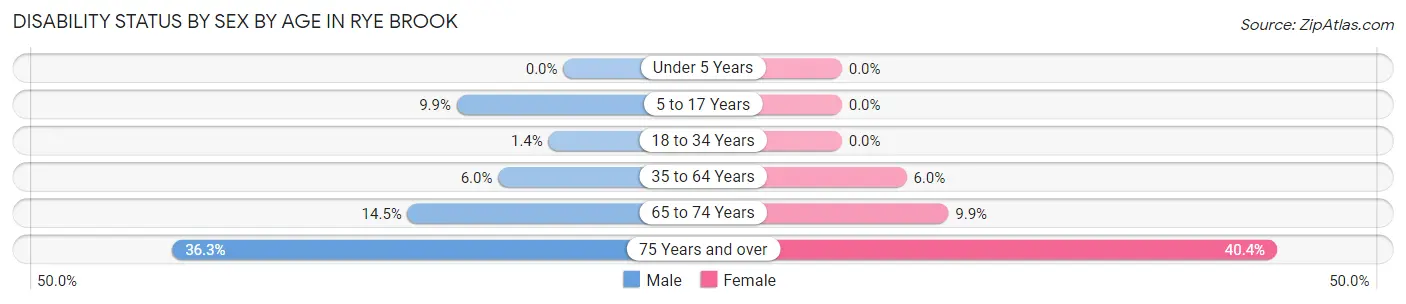
| Age Bracket | Male | Female |
| Under 5 Years | 0 (0.0%) | 0 (0.0%) |
| 5 to 17 Years | 79 (9.9%) | 0 (0.0%) |
| 18 to 34 Years | 14 (1.4%) | 0 (0.0%) |
| 35 to 64 Years | 116 (6.0%) | 131 (6.0%) |
| 65 to 74 Years | 63 (14.4%) | 45 (9.9%) |
| 75 Years and over | 159 (36.3%) | 258 (40.4%) |
Disability Class by Sex by Age in Rye Brook
Disability Class: Hearing Difficulty
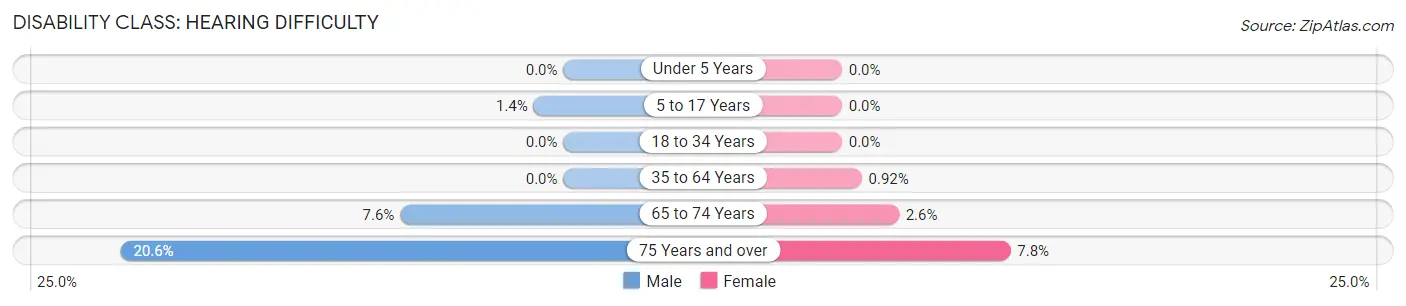
| Age Bracket | Male | Female |
| Under 5 Years | 0 (0.0%) | 0 (0.0%) |
| 5 to 17 Years | 11 (1.4%) | 0 (0.0%) |
| 18 to 34 Years | 0 (0.0%) | 0 (0.0%) |
| 35 to 64 Years | 0 (0.0%) | 20 (0.9%) |
| 65 to 74 Years | 33 (7.6%) | 12 (2.6%) |
| 75 Years and over | 90 (20.5%) | 50 (7.8%) |
Disability Class: Vision Difficulty
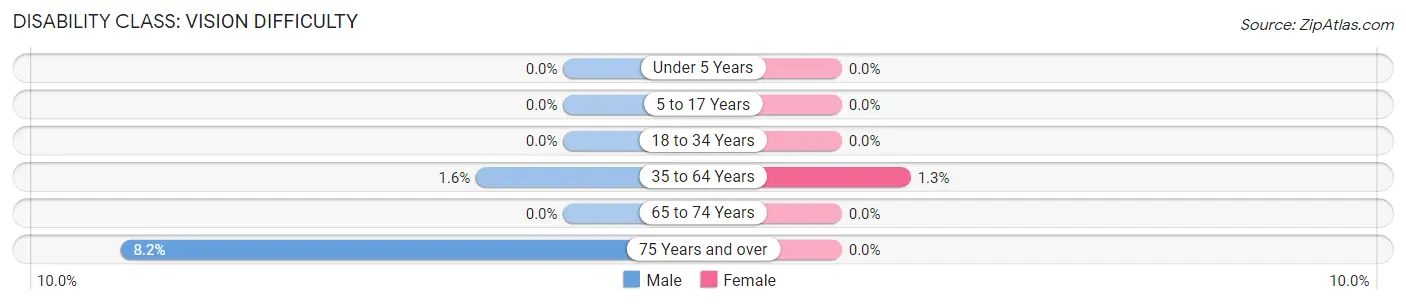
| Age Bracket | Male | Female |
| Under 5 Years | 0 (0.0%) | 0 (0.0%) |
| 5 to 17 Years | 0 (0.0%) | 0 (0.0%) |
| 18 to 34 Years | 0 (0.0%) | 0 (0.0%) |
| 35 to 64 Years | 31 (1.6%) | 28 (1.3%) |
| 65 to 74 Years | 0 (0.0%) | 0 (0.0%) |
| 75 Years and over | 36 (8.2%) | 0 (0.0%) |
Disability Class: Cognitive Difficulty
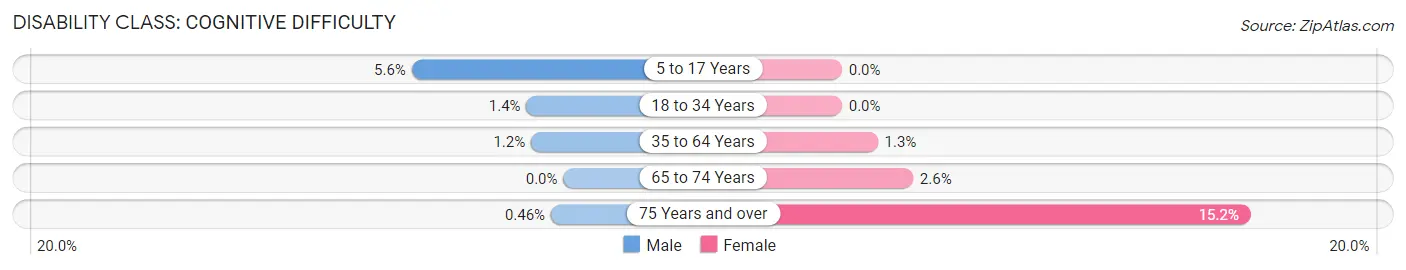
| Age Bracket | Male | Female |
| 5 to 17 Years | 45 (5.6%) | 0 (0.0%) |
| 18 to 34 Years | 14 (1.4%) | 0 (0.0%) |
| 35 to 64 Years | 23 (1.2%) | 29 (1.3%) |
| 65 to 74 Years | 0 (0.0%) | 12 (2.6%) |
| 75 Years and over | 2 (0.5%) | 97 (15.2%) |
Disability Class: Ambulatory Difficulty
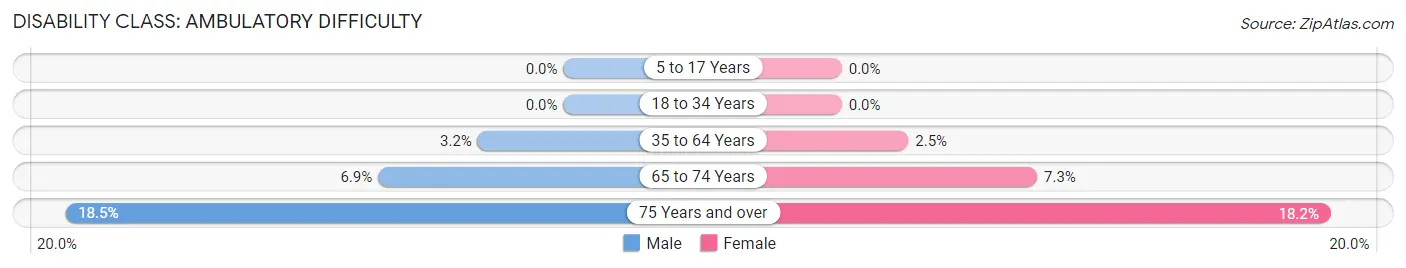
| Age Bracket | Male | Female |
| 5 to 17 Years | 0 (0.0%) | 0 (0.0%) |
| 18 to 34 Years | 0 (0.0%) | 0 (0.0%) |
| 35 to 64 Years | 61 (3.2%) | 54 (2.5%) |
| 65 to 74 Years | 30 (6.9%) | 33 (7.2%) |
| 75 Years and over | 81 (18.5%) | 116 (18.1%) |
Disability Class: Self-Care Difficulty
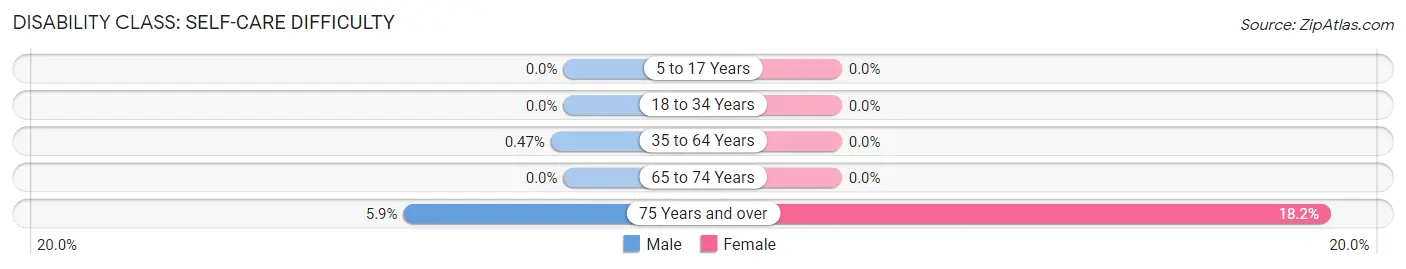
| Age Bracket | Male | Female |
| 5 to 17 Years | 0 (0.0%) | 0 (0.0%) |
| 18 to 34 Years | 0 (0.0%) | 0 (0.0%) |
| 35 to 64 Years | 9 (0.5%) | 0 (0.0%) |
| 65 to 74 Years | 0 (0.0%) | 0 (0.0%) |
| 75 Years and over | 26 (5.9%) | 116 (18.1%) |
Technology Access in Rye Brook
Computing Device Access in Rye Brook
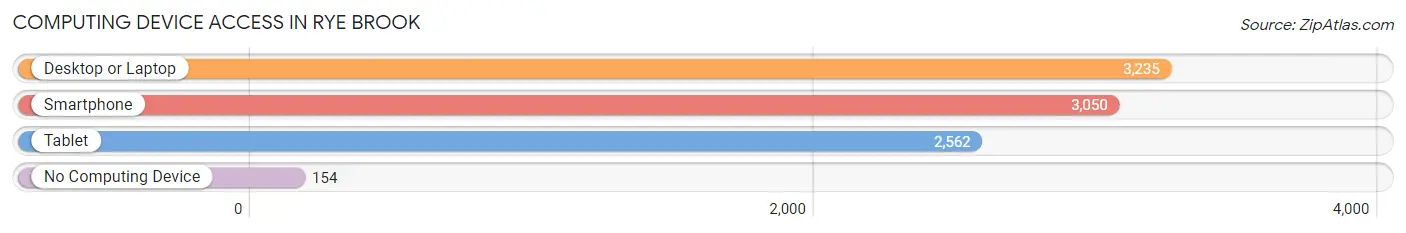
| Device Type | # Households | % Households |
| Desktop or Laptop | 3,235 | 95.0% |
| Smartphone | 3,050 | 89.6% |
| Tablet | 2,562 | 75.2% |
| No Computing Device | 154 | 4.5% |
| Total | 3,405 | 100.0% |
Internet Access in Rye Brook
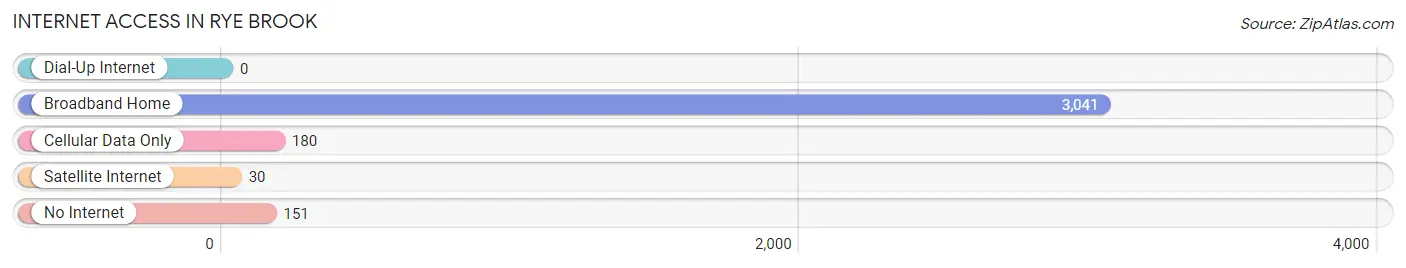
| Internet Type | # Households | % Households |
| Dial-Up Internet | 0 | 0.0% |
| Broadband Home | 3,041 | 89.3% |
| Cellular Data Only | 180 | 5.3% |
| Satellite Internet | 30 | 0.9% |
| No Internet | 151 | 4.4% |
| Total | 3,405 | 100.0% |
Rye Brook Summary
Rye Brook is a village located in Westchester County, New York, United States. It is part of the town of Rye and is located in the southeastern corner of the county. The village is bordered by the city of Rye to the north, the village of Port Chester to the east, the town of Harrison to the south, and the town of Greenwich, Connecticut to the west. As of the 2010 census, the village had a population of 9,347.
History
Rye Brook was originally part of the town of Rye, which was established in 1660. The area was first settled in the late 17th century by Dutch and English settlers. In the late 19th century, the area began to be developed as a residential community. The village of Rye Brook was incorporated in 1982, and the first village elections were held in 1983.
Geography
Rye Brook is located at 41° 0' 0" North, 73° 41' 0" West (41.0000, -73.6833). According to the United States Census Bureau, the village has a total area of 4.2 square miles, all of which is land.
The village is located in the southeastern corner of Westchester County, and is bordered by the city of Rye to the north, the village of Port Chester to the east, the town of Harrison to the south, and the town of Greenwich, Connecticut to the west.
Economy
Rye Brook is home to a number of businesses, including the headquarters of PepsiCo, which is located in the village. Other businesses in the village include the IBM Corporation, the New York Life Insurance Company, and the Westchester Medical Center.
Demographics
As of the 2010 census, there were 9,347 people, 3,541 households, and 2,541 families residing in the village. The population density was 2,231.2 people per square mile. The racial makeup of the village was 81.2% White, 5.2% African American, 0.2% Native American, 8.2% Asian, 0.1% Pacific Islander, 2.7% from other races, and 2.5% from two or more races. Hispanic or Latino of any race were 8.7% of the population.
The median income for a household in the village was $100,945, and the median income for a family was $118,945. The per capita income for the village was $50,945. About 2.2% of families and 3.3% of the population were below the poverty line, including 3.7% of those under age 18 and 2.2% of those age 65 or over.
Common Questions
What is Per Capita Income in Rye Brook?
Per Capita income in Rye Brook is $101,014.
What is the Median Family Income in Rye Brook?
Median Family Income in Rye Brook is $233,680.
What is the Median Household income in Rye Brook?
Median Household Income in Rye Brook is $199,965.
What is Income or Wage Gap in Rye Brook?
Income or Wage Gap in Rye Brook is 38.1%.
Women in Rye Brook earn 61.9 cents for every dollar earned by a man.
What is Inequality or Gini Index in Rye Brook?
Inequality or Gini Index in Rye Brook is 0.51.
What is the Total Population of Rye Brook?
Total Population of Rye Brook is 9,920.
What is the Total Male Population of Rye Brook?
Total Male Population of Rye Brook is 4,839.
What is the Total Female Population of Rye Brook?
Total Female Population of Rye Brook is 5,081.
What is the Ratio of Males per 100 Females in Rye Brook?
There are 95.24 Males per 100 Females in Rye Brook.
What is the Ratio of Females per 100 Males in Rye Brook?
There are 105.00 Females per 100 Males in Rye Brook.
What is the Median Population Age in Rye Brook?
Median Population Age in Rye Brook is 45.1 Years.
What is the Average Family Size in Rye Brook
Average Family Size in Rye Brook is 3.2 People.
What is the Average Household Size in Rye Brook
Average Household Size in Rye Brook is 2.9 People.
How Large is the Labor Force in Rye Brook?
There are 4,832 People in the Labor Forcein in Rye Brook.
What is the Percentage of People in the Labor Force in Rye Brook?
60.1% of People are in the Labor Force in Rye Brook.
What is the Unemployment Rate in Rye Brook?
Unemployment Rate in Rye Brook is 9.5%.