Zip Codes with the Highest Percentage of Families with Income Above $200,000 in Liverpool, NY
RELATED REPORTS & OPTIONS
Family Income | $200k+
Liverpool
Compare Zip Codes
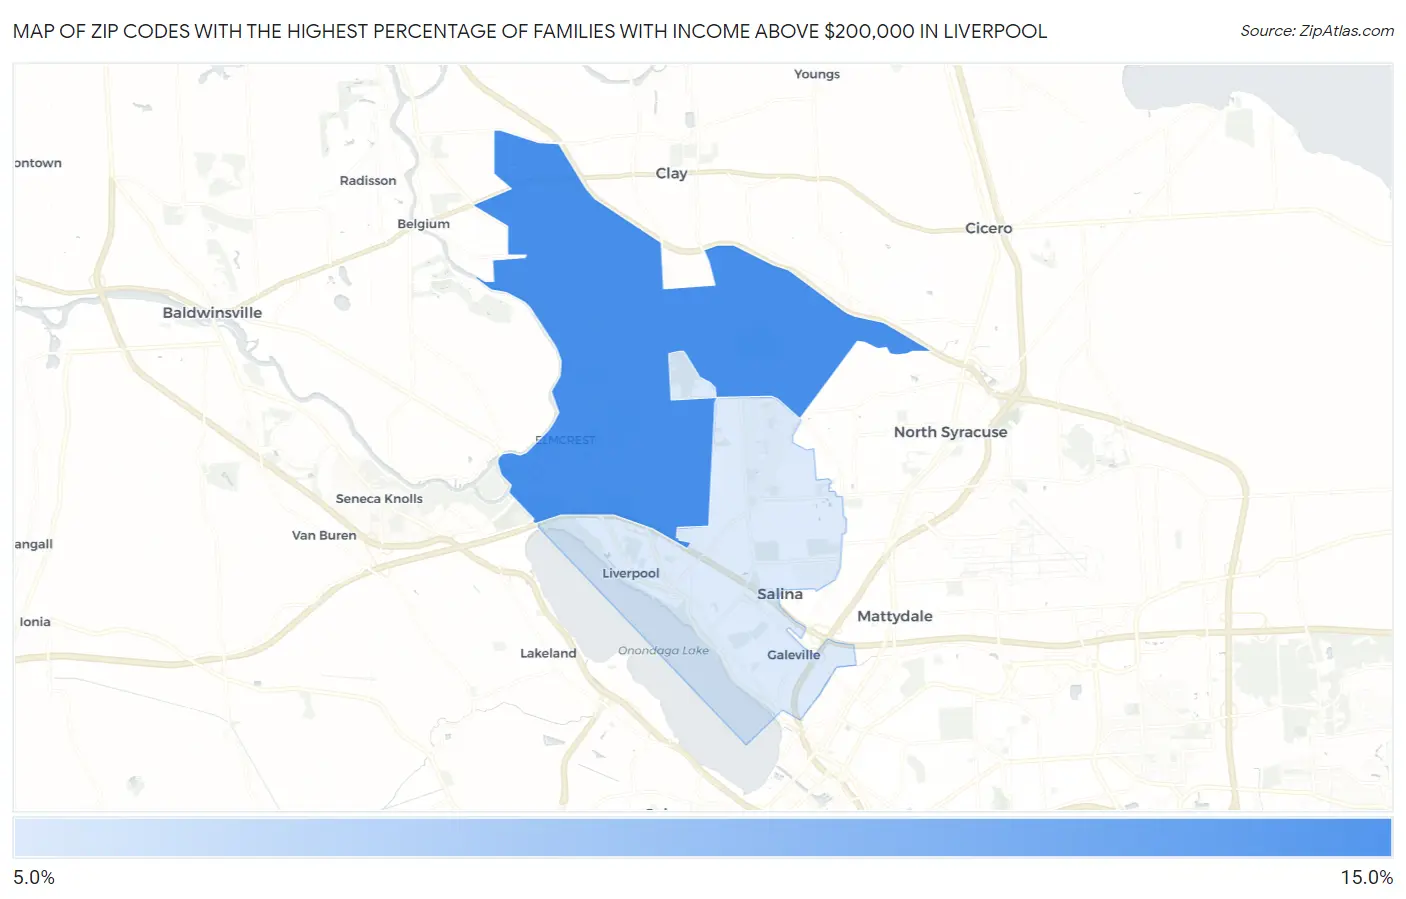
Map of Zip Codes with the Highest Percentage of Families with Income Above $200,000 in Liverpool
6.5%
10.8%
Zip Codes with the Highest Percentage of Families with Income Above $200,000 in Liverpool, NY
| Zip Code | Families with Income > $200k | vs State | vs National | |
| 1. | 13090 | 10.8% | 19.2%(-8.40)#828 | 14.8%(-4.00)#10,006 |
| 2. | 13088 | 6.5% | 19.2%(-12.7)#1,093 | 14.8%(-8.30)#15,525 |
1
Common Questions
What are the Top Zip Codes with the Highest Percentage of Families with Income Above $200,000 in Liverpool, NY?
Top Zip Codes with the Highest Percentage of Families with Income Above $200,000 in Liverpool, NY are:
What zip code has the Highest Percentage of Families with Income Above $200,000 in Liverpool, NY?
13090 has the Highest Percentage of Families with Income Above $200,000 in Liverpool, NY with 10.8%.
What is the Percentage of Families with Income Above $200,000 in Liverpool, NY?
Percentage of Families with Income Above $200,000 in Liverpool is 10.0%.
What is the Percentage of Families with Income Above $200,000 in New York?
Percentage of Families with Income Above $200,000 in New York is 19.2%.
What is the Percentage of Families with Income Above $200,000 in the United States?
Percentage of Families with Income Above $200,000 in the United States is 14.8%.