Crompond, NY Map & Demographics
Crompond Map
Crompond Overview
$71,906
PER CAPITA INCOME
$212,344
AVG FAMILY INCOME
$184,519
AVG HOUSEHOLD INCOME
18.5%
WAGE / INCOME GAP [ % ]
81.5¢/ $1
WAGE / INCOME GAP [ $ ]
0.35
INEQUALITY / GINI INDEX
2,211
TOTAL POPULATION
1,051
MALE POPULATION
1,160
FEMALE POPULATION
90.60
MALES / 100 FEMALES
110.37
FEMALES / 100 MALES
51.4
MEDIAN AGE
3.1
AVG FAMILY SIZE
2.6
AVG HOUSEHOLD SIZE
1,014
LABOR FORCE [ PEOPLE ]
56.5%
PERCENT IN LABOR FORCE
7.3%
UNEMPLOYMENT RATE
Crompond Zip Codes
Crompond Area Codes
Income in Crompond
Income Overview in Crompond
Per Capita Income in Crompond is $71,906, while median incomes of families and households are $212,344 and $184,519 respectively.
| Characteristic | Number | Measure |
| Per Capita Income | 2,211 | $71,906 |
| Median Family Income | 607 | $212,344 |
| Mean Family Income | 607 | $234,646 |
| Median Household Income | 794 | $184,519 |
| Mean Household Income | 794 | $197,991 |
| Income Deficit | 607 | $0 |
| Wage / Income Gap (%) | 2,211 | 18.49% |
| Wage / Income Gap ($) | 2,211 | 81.51¢ per $1 |
| Gini / Inequality Index | 2,211 | 0.35 |
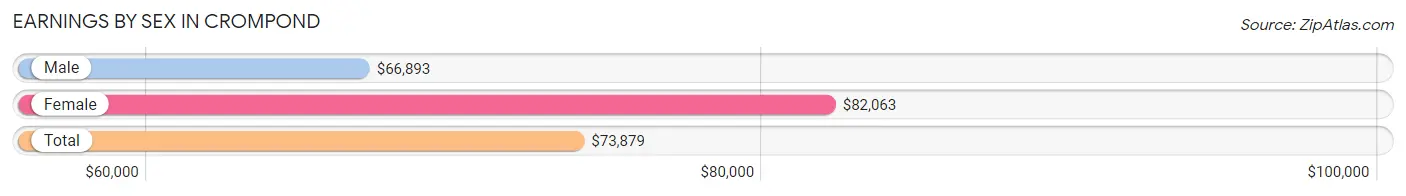
Earnings by Sex in Crompond
Average Earnings in Crompond are $73,879, $66,893 for men and $82,063 for women, a difference of 18.5%.
| Sex | Number | Average Earnings |
| Male | 614 (53.8%) | $66,893 |
| Female | 528 (46.2%) | $82,063 |
| Total | 1,142 (100.0%) | $73,879 |
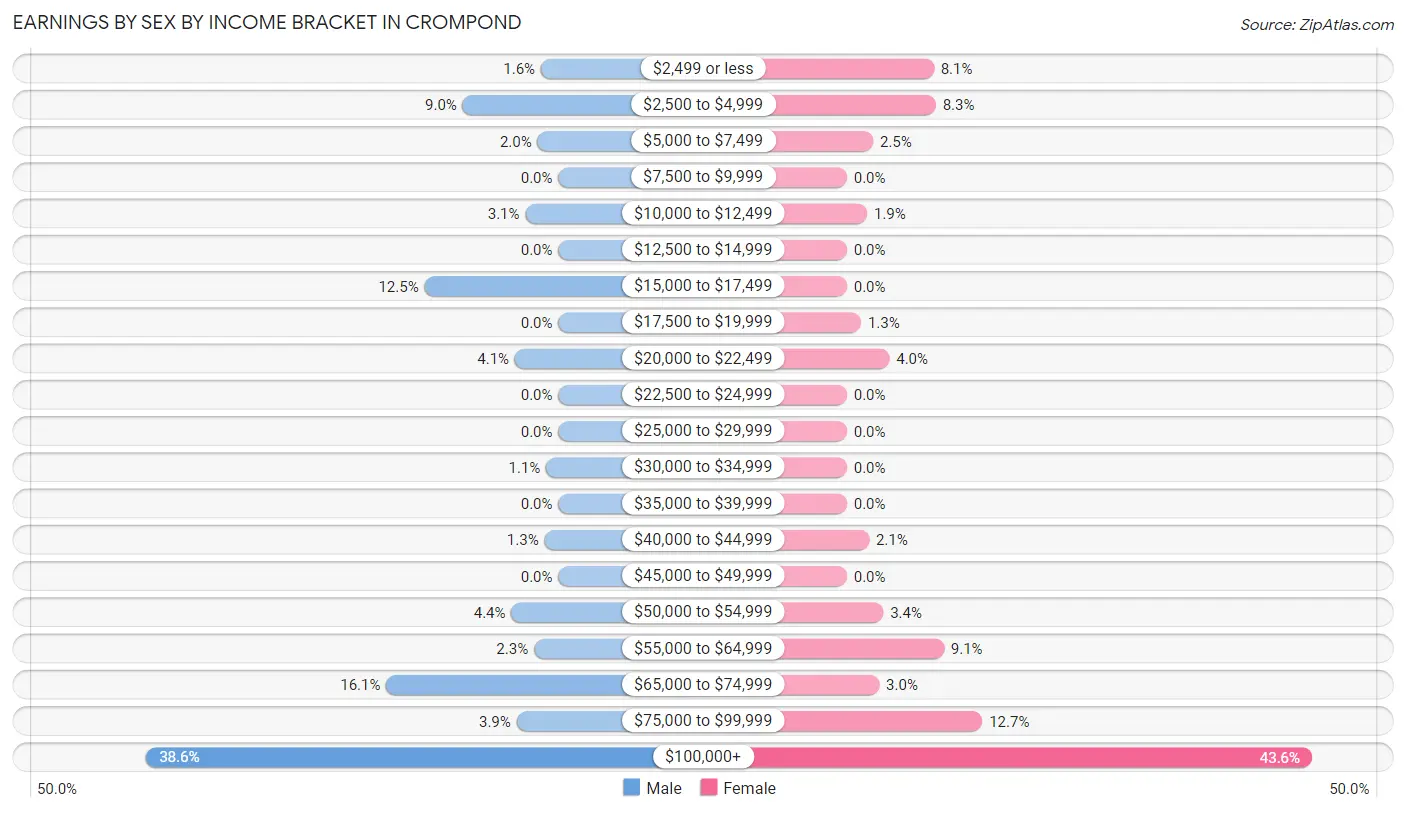
Earnings by Sex by Income Bracket in Crompond
The most common earnings brackets in Crompond are $100,000+ for men (237 | 38.6%) and $100,000+ for women (230 | 43.6%).
| Income | Male | Female |
| $2,499 or less | 10 (1.6%) | 43 (8.1%) |
| $2,500 to $4,999 | 55 (9.0%) | 44 (8.3%) |
| $5,000 to $7,499 | 12 (1.9%) | 13 (2.5%) |
| $7,500 to $9,999 | 0 (0.0%) | 0 (0.0%) |
| $10,000 to $12,499 | 19 (3.1%) | 10 (1.9%) |
| $12,500 to $14,999 | 0 (0.0%) | 0 (0.0%) |
| $15,000 to $17,499 | 77 (12.5%) | 0 (0.0%) |
| $17,500 to $19,999 | 0 (0.0%) | 7 (1.3%) |
| $20,000 to $22,499 | 25 (4.1%) | 21 (4.0%) |
| $22,500 to $24,999 | 0 (0.0%) | 0 (0.0%) |
| $25,000 to $29,999 | 0 (0.0%) | 0 (0.0%) |
| $30,000 to $34,999 | 7 (1.1%) | 0 (0.0%) |
| $35,000 to $39,999 | 0 (0.0%) | 0 (0.0%) |
| $40,000 to $44,999 | 8 (1.3%) | 11 (2.1%) |
| $45,000 to $49,999 | 0 (0.0%) | 0 (0.0%) |
| $50,000 to $54,999 | 27 (4.4%) | 18 (3.4%) |
| $55,000 to $64,999 | 14 (2.3%) | 48 (9.1%) |
| $65,000 to $74,999 | 99 (16.1%) | 16 (3.0%) |
| $75,000 to $99,999 | 24 (3.9%) | 67 (12.7%) |
| $100,000+ | 237 (38.6%) | 230 (43.6%) |
| Total | 614 (100.0%) | 528 (100.0%) |
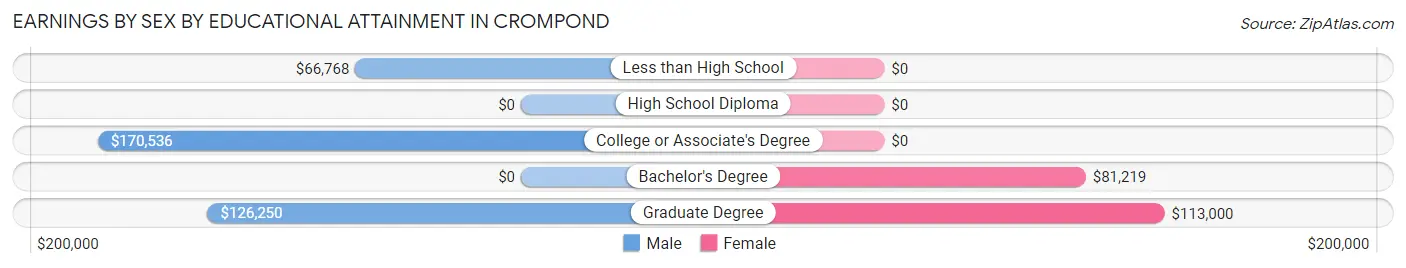
Earnings by Sex by Educational Attainment in Crompond
Average earnings in Crompond are $81,023 for men and $98,269 for women, a difference of 17.5%. Men with an educational attainment of college or associate's degree enjoy the highest average annual earnings of $170,536, while those with less than high school education earn the least with $66,768. Women with an educational attainment of graduate degree earn the most with the average annual earnings of $113,000, while those with bachelor's degree education have the smallest earnings of $81,219.
| Educational Attainment | Male Income | Female Income |
| Less than High School | $66,768 | $0 |
| High School Diploma | - | - |
| College or Associate's Degree | $170,536 | $0 |
| Bachelor's Degree | - | - |
| Graduate Degree | $126,250 | $113,000 |
| Total | $81,023 | $98,269 |
Family Income in Crompond
Family Income Brackets in Crompond
According to the Crompond family income data, there are 348 families falling into the $200,000+ income range, which is the most common income bracket and makes up 57.3% of all families.
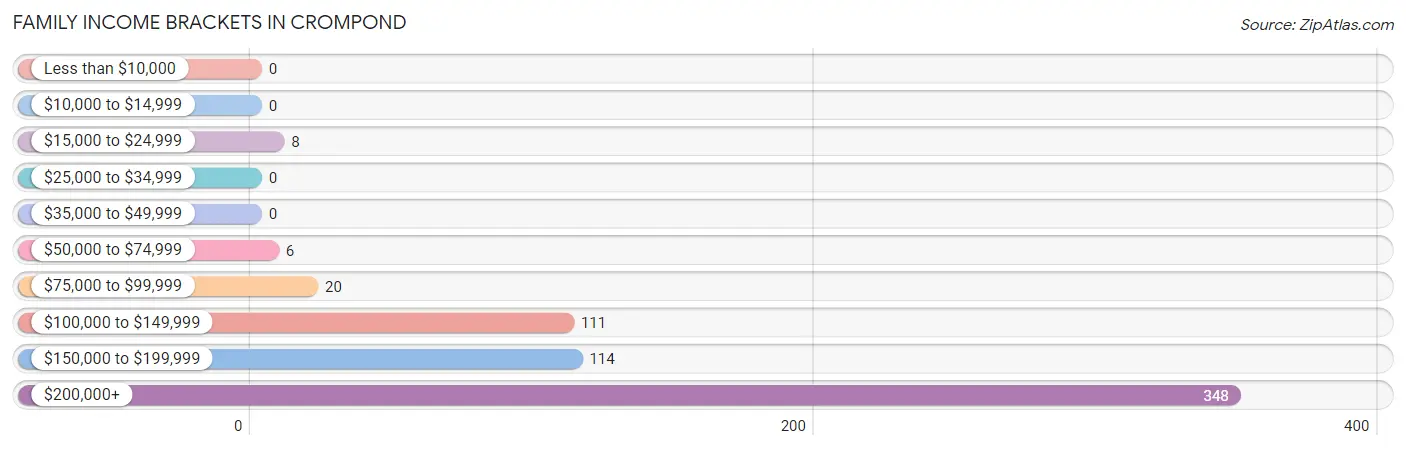
| Income Bracket | # Families | % Families |
| Less than $10,000 | 0 | 0.0% |
| $10,000 to $14,999 | 0 | 0.0% |
| $15,000 to $24,999 | 8 | 1.3% |
| $25,000 to $34,999 | 0 | 0.0% |
| $35,000 to $49,999 | 0 | 0.0% |
| $50,000 to $74,999 | 6 | 1.0% |
| $75,000 to $99,999 | 20 | 3.3% |
| $100,000 to $149,999 | 111 | 18.3% |
| $150,000 to $199,999 | 114 | 18.8% |
| $200,000+ | 348 | 57.3% |
Family Income by Famaliy Size in Crompond
2-person families (284 | 46.8%) account for the highest median family income in Crompond with $250,001 per family, while 2-person families (284 | 46.8%) have the highest median income of $125,000 per family member.
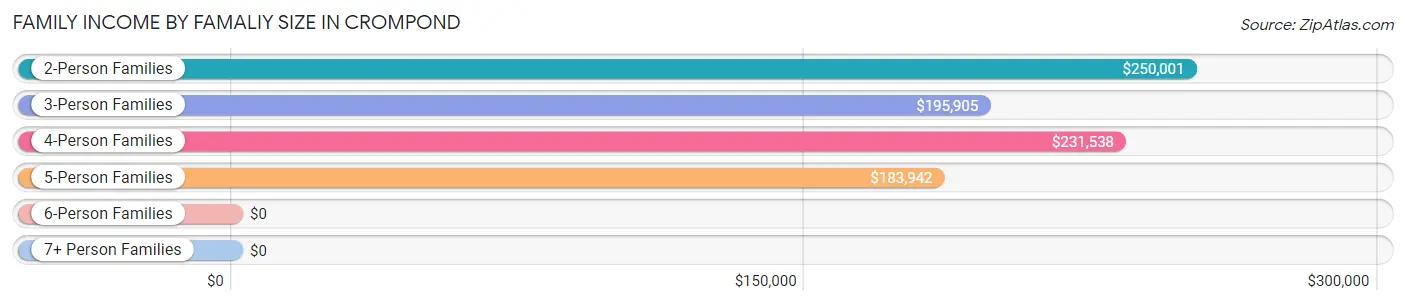
| Income Bracket | # Families | Median Income |
| 2-Person Families | 284 (46.8%) | $250,001 |
| 3-Person Families | 105 (17.3%) | $195,905 |
| 4-Person Families | 154 (25.4%) | $231,538 |
| 5-Person Families | 54 (8.9%) | $183,942 |
| 6-Person Families | 0 (0.0%) | $0 |
| 7+ Person Families | 10 (1.7%) | $0 |
| Total | 607 (100.0%) | $212,344 |
Family Income by Number of Earners in Crompond
The median family income in Crompond is $212,344, with families comprising 2 earners (341) having the highest median family income of $250,001, while families with no earners (46) have the lowest median family income of $138,750, accounting for 56.2% and 7.6% of families, respectively.
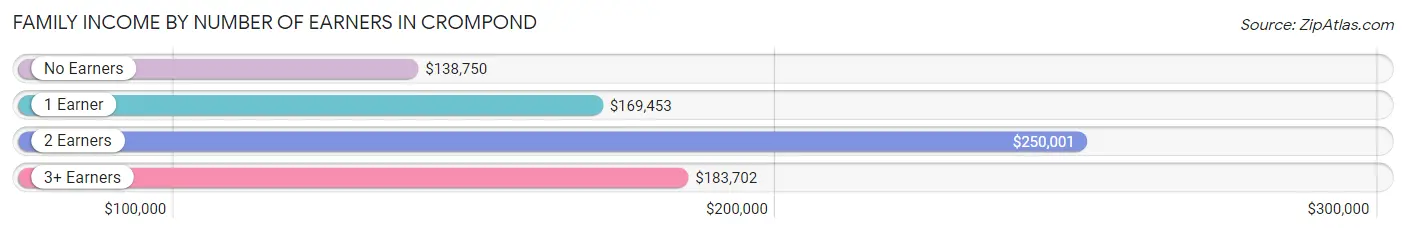
| Number of Earners | # Families | Median Income |
| No Earners | 46 (7.6%) | $138,750 |
| 1 Earner | 133 (21.9%) | $169,453 |
| 2 Earners | 341 (56.2%) | $250,001 |
| 3+ Earners | 87 (14.3%) | $183,702 |
| Total | 607 (100.0%) | $212,344 |
Household Income in Crompond
Household Income Brackets in Crompond
With 363 households falling in the category, the $200,000+ income range is the most frequent in Crompond, accounting for 45.7% of all households.
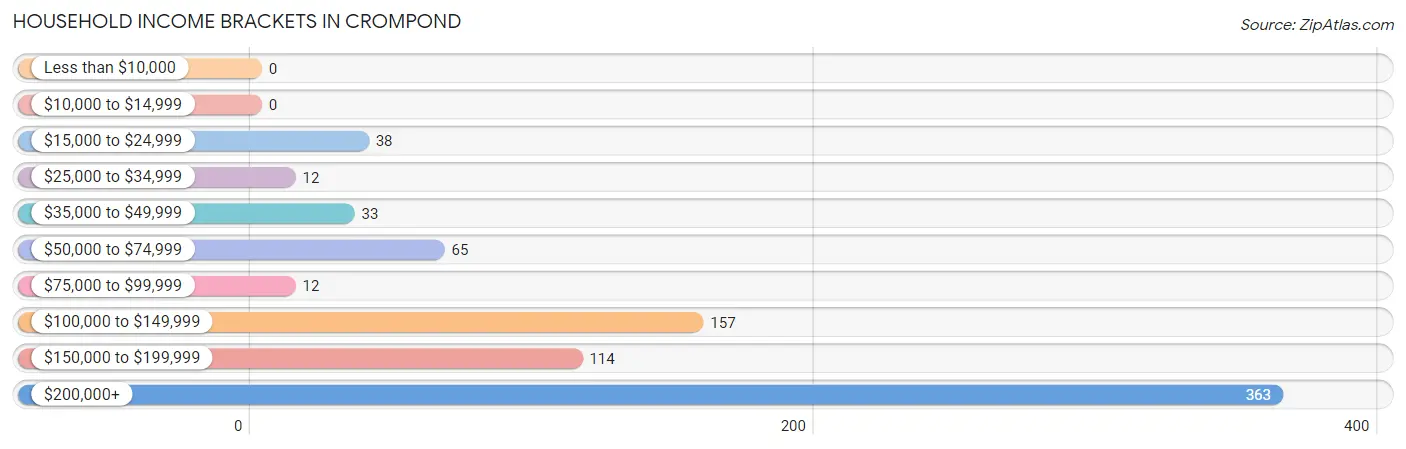
| Income Bracket | # Households | % Households |
| Less than $10,000 | 0 | 0.0% |
| $10,000 to $14,999 | 0 | 0.0% |
| $15,000 to $24,999 | 38 | 4.8% |
| $25,000 to $34,999 | 12 | 1.5% |
| $35,000 to $49,999 | 33 | 4.2% |
| $50,000 to $74,999 | 65 | 8.2% |
| $75,000 to $99,999 | 12 | 1.5% |
| $100,000 to $149,999 | 157 | 19.8% |
| $150,000 to $199,999 | 114 | 14.4% |
| $200,000+ | 363 | 45.7% |
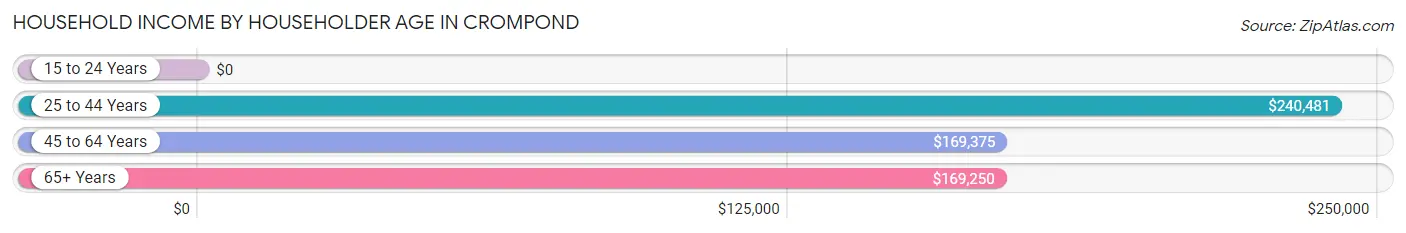
Household Income by Householder Age in Crompond
The median household income in Crompond is $184,519, with the highest median household income of $240,481 found in the 25 to 44 years age bracket for the primary householder. A total of 87 households (11.0%) fall into this category.
| Income Bracket | # Households | Median Income |
| 15 to 24 Years | 0 (0.0%) | $0 |
| 25 to 44 Years | 87 (11.0%) | $240,481 |
| 45 to 64 Years | 345 (43.4%) | $169,375 |
| 65+ Years | 362 (45.6%) | $169,250 |
| Total | 794 (100.0%) | $184,519 |
Poverty in Crompond
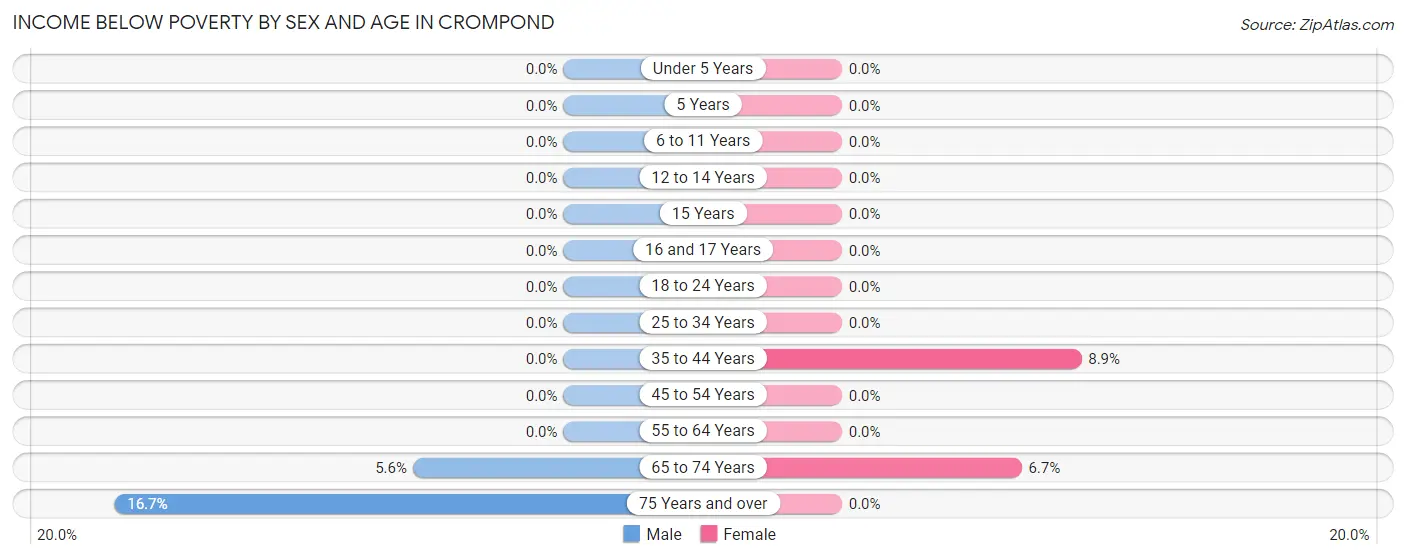
Income Below Poverty by Sex and Age in Crompond
With 1.7% poverty level for males and 2.4% for females among the residents of Crompond, 75 year old and over males and 35 to 44 year old females are the most vulnerable to poverty, with 8 males (16.7%) and 8 females (8.9%) in their respective age groups living below the poverty level.
| Age Bracket | Male | Female |
| Under 5 Years | 0 (0.0%) | 0 (0.0%) |
| 5 Years | 0 (0.0%) | 0 (0.0%) |
| 6 to 11 Years | 0 (0.0%) | 0 (0.0%) |
| 12 to 14 Years | 0 (0.0%) | 0 (0.0%) |
| 15 Years | 0 (0.0%) | 0 (0.0%) |
| 16 and 17 Years | 0 (0.0%) | 0 (0.0%) |
| 18 to 24 Years | 0 (0.0%) | 0 (0.0%) |
| 25 to 34 Years | 0 (0.0%) | 0 (0.0%) |
| 35 to 44 Years | 0 (0.0%) | 8 (8.9%) |
| 45 to 54 Years | 0 (0.0%) | 0 (0.0%) |
| 55 to 64 Years | 0 (0.0%) | 0 (0.0%) |
| 65 to 74 Years | 9 (5.6%) | 18 (6.7%) |
| 75 Years and over | 8 (16.7%) | 0 (0.0%) |
| Total | 17 (1.7%) | 26 (2.4%) |
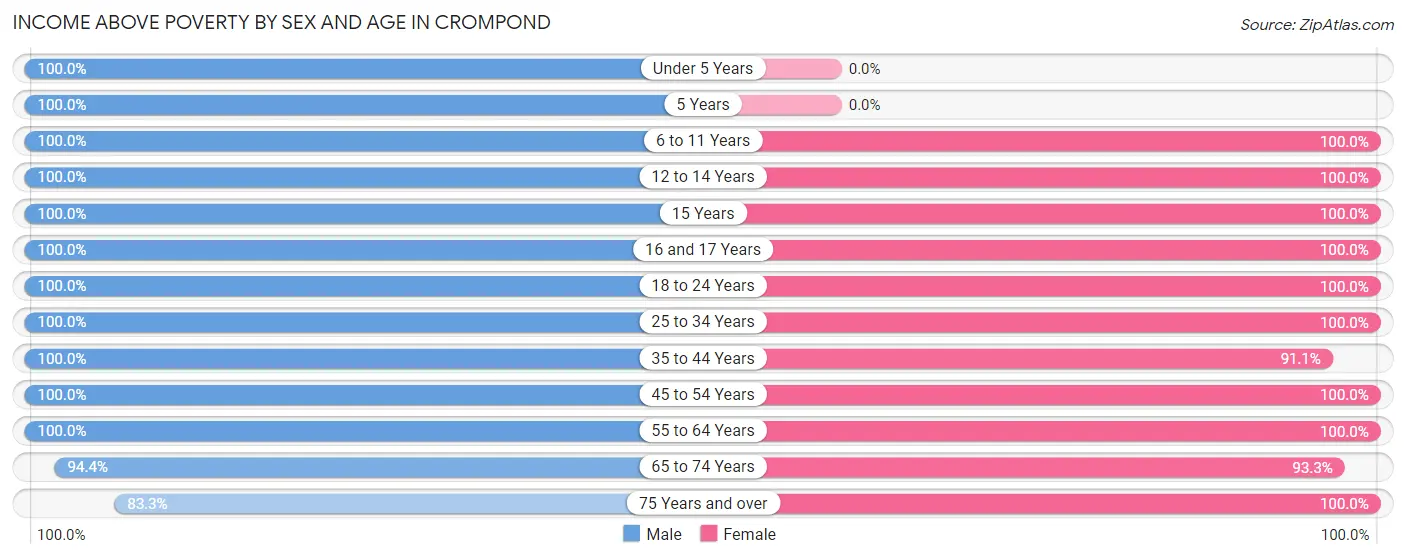
Income Above Poverty by Sex and Age in Crompond
According to the poverty statistics in Crompond, males aged under 5 years and females aged 6 to 11 years are the age groups that are most secure financially, with 100.0% of males and 100.0% of females in these age groups living above the poverty line.
| Age Bracket | Male | Female |
| Under 5 Years | 58 (100.0%) | 0 (0.0%) |
| 5 Years | 17 (100.0%) | 0 (0.0%) |
| 6 to 11 Years | 50 (100.0%) | 68 (100.0%) |
| 12 to 14 Years | 78 (100.0%) | 63 (100.0%) |
| 15 Years | 34 (100.0%) | 49 (100.0%) |
| 16 and 17 Years | 28 (100.0%) | 13 (100.0%) |
| 18 to 24 Years | 108 (100.0%) | 73 (100.0%) |
| 25 to 34 Years | 6 (100.0%) | 84 (100.0%) |
| 35 to 44 Years | 98 (100.0%) | 82 (91.1%) |
| 45 to 54 Years | 163 (100.0%) | 158 (100.0%) |
| 55 to 64 Years | 177 (100.0%) | 125 (100.0%) |
| 65 to 74 Years | 152 (94.4%) | 252 (93.3%) |
| 75 Years and over | 40 (83.3%) | 94 (100.0%) |
| Total | 1,009 (98.3%) | 1,061 (97.6%) |
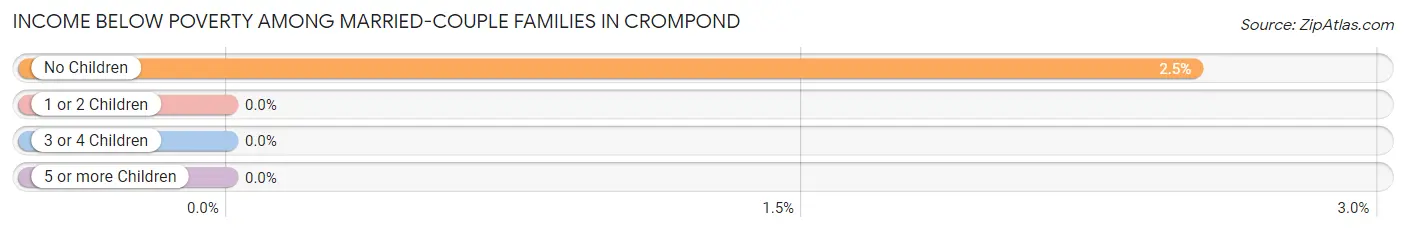
Income Below Poverty Among Married-Couple Families in Crompond
The poverty statistics for married-couple families in Crompond show that 1.5% or 8 of the total 517 families live below the poverty line. Families with no children have the highest poverty rate of 2.5%, comprising of 8 families. On the other hand, families with 1 or 2 children have the lowest poverty rate of 0.0%, which includes 0 families.
| Children | Above Poverty | Below Poverty |
| No Children | 309 (97.5%) | 8 (2.5%) |
| 1 or 2 Children | 162 (100.0%) | 0 (0.0%) |
| 3 or 4 Children | 38 (100.0%) | 0 (0.0%) |
| 5 or more Children | 0 (0.0%) | 0 (0.0%) |
| Total | 509 (98.5%) | 8 (1.5%) |
Income Below Poverty Among Single-Parent Households in Crompond
| Children | Single Father | Single Mother |
| No Children | 0 (0.0%) | 0 (0.0%) |
| 1 or 2 Children | 0 (0.0%) | 0 (0.0%) |
| 3 or 4 Children | 0 (0.0%) | 0 (0.0%) |
| 5 or more Children | 0 (0.0%) | 0 (0.0%) |
| Total | 0 (0.0%) | 0 (0.0%) |
Income Below Poverty Among Married-Couple vs Single-Parent Households in Crompond
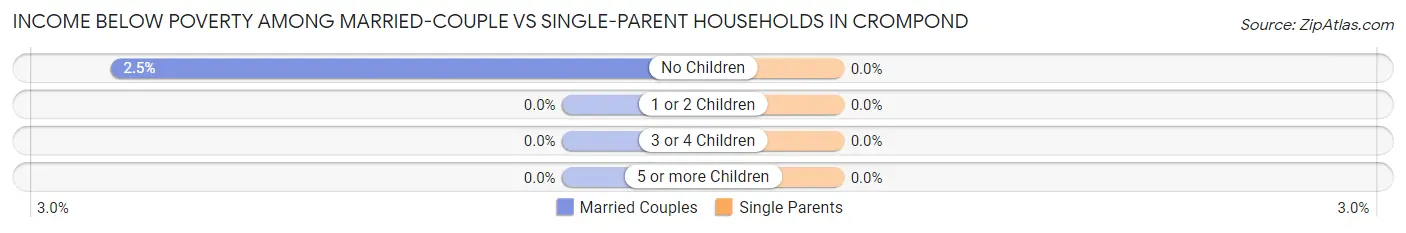
| Children | Married-Couple Families | Single-Parent Households |
| No Children | 8 (2.5%) | 0 (0.0%) |
| 1 or 2 Children | 0 (0.0%) | 0 (0.0%) |
| 3 or 4 Children | 0 (0.0%) | 0 (0.0%) |
| 5 or more Children | 0 (0.0%) | 0 (0.0%) |
| Total | 8 (1.5%) | 0 (0.0%) |
Race in Crompond
The most populous races in Crompond are White / Caucasian (1,744 | 78.9%), Hispanic or Latino (226 | 10.2%), and Black / African American (209 | 9.5%).
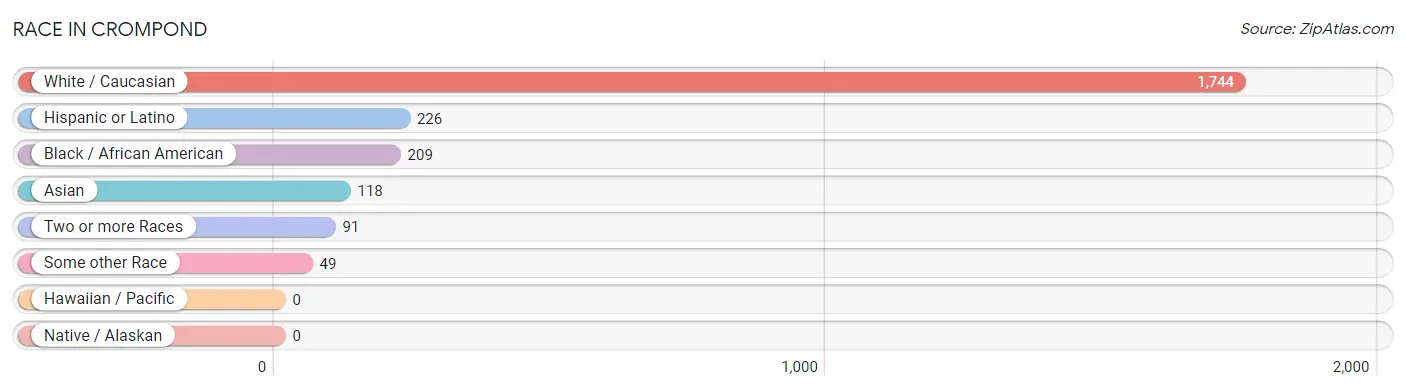
| Race | # Population | % Population |
| Asian | 118 | 5.3% |
| Black / African American | 209 | 9.5% |
| Hawaiian / Pacific | 0 | 0.0% |
| Hispanic or Latino | 226 | 10.2% |
| Native / Alaskan | 0 | 0.0% |
| White / Caucasian | 1,744 | 78.9% |
| Two or more Races | 91 | 4.1% |
| Some other Race | 49 | 2.2% |
| Total | 2,211 | 100.0% |
Ancestry in Crompond
The most populous ancestries reported in Crompond are Italian (585 | 26.5%), Irish (372 | 16.8%), Polish (172 | 7.8%), German (153 | 6.9%), and Bolivian (101 | 4.6%), together accounting for 62.5% of all Crompond residents.
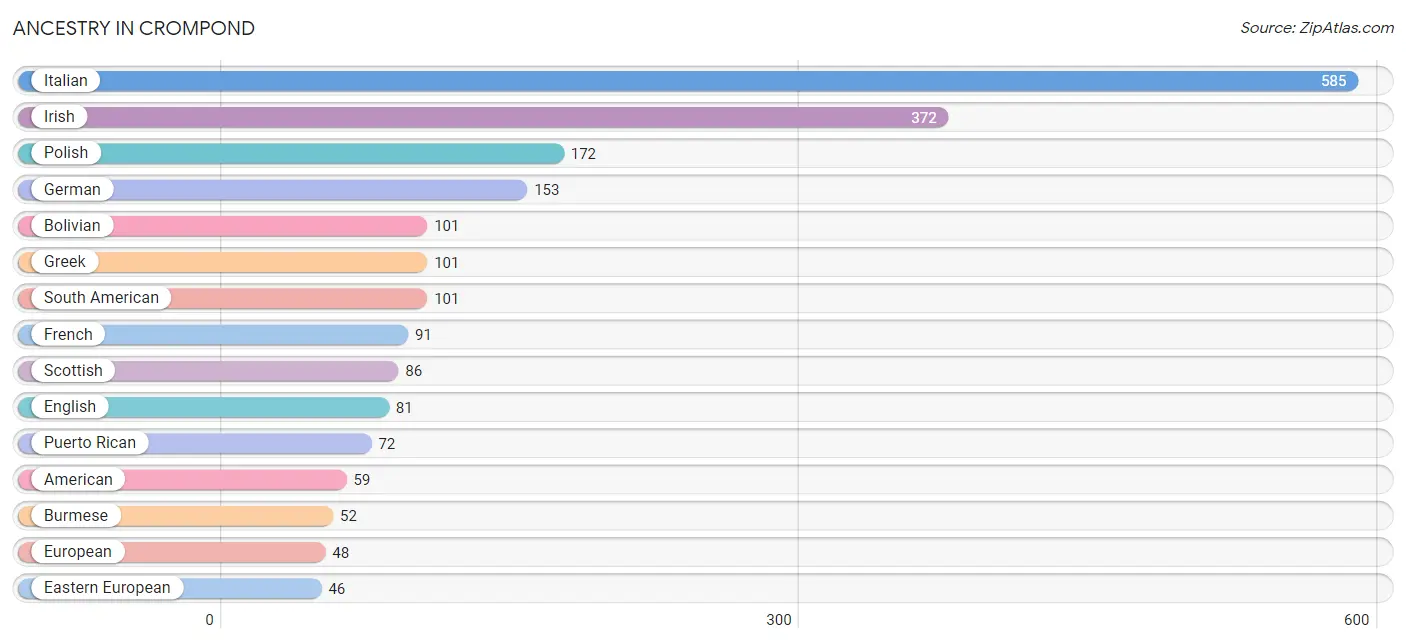
| Ancestry | # Population | % Population |
| American | 59 | 2.7% |
| Arab | 15 | 0.7% |
| Austrian | 21 | 0.9% |
| Bhutanese | 24 | 1.1% |
| Bolivian | 101 | 4.6% |
| British West Indian | 29 | 1.3% |
| Burmese | 52 | 2.4% |
| Canadian | 13 | 0.6% |
| Czech | 4 | 0.2% |
| Dutch | 10 | 0.4% |
| Eastern European | 46 | 2.1% |
| English | 81 | 3.7% |
| European | 48 | 2.2% |
| French | 91 | 4.1% |
| German | 153 | 6.9% |
| Greek | 101 | 4.6% |
| Hungarian | 5 | 0.2% |
| Indian (Asian) | 12 | 0.5% |
| Irish | 372 | 16.8% |
| Italian | 585 | 26.5% |
| Jamaican | 44 | 2.0% |
| Korean | 32 | 1.5% |
| Mexican | 27 | 1.2% |
| Norwegian | 17 | 0.8% |
| Pakistani | 5 | 0.2% |
| Polish | 172 | 7.8% |
| Puerto Rican | 72 | 3.3% |
| Russian | 15 | 0.7% |
| Scottish | 86 | 3.9% |
| South American | 101 | 4.6% |
| Spaniard | 26 | 1.2% |
| Swiss | 8 | 0.4% |
| Thai | 27 | 1.2% |
| Turkish | 11 | 0.5% |
| Ukrainian | 8 | 0.4% | View All 35 Rows |
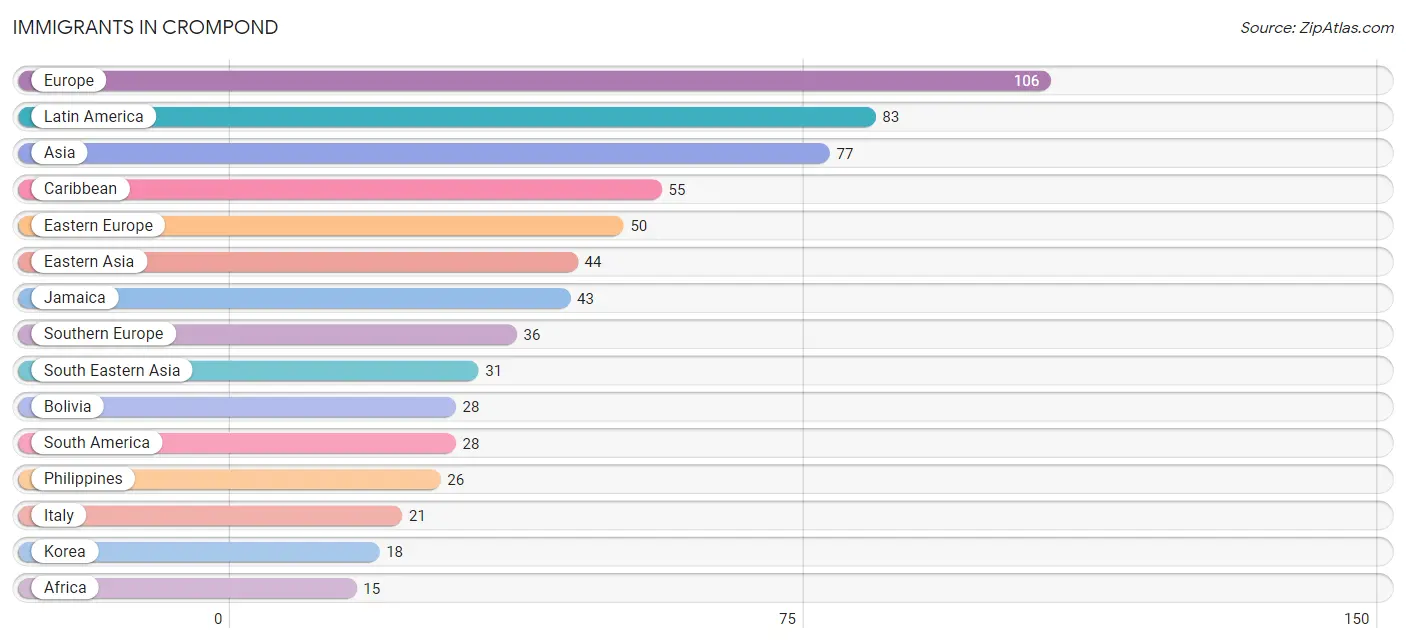
Immigrants in Crompond
The most numerous immigrant groups reported in Crompond came from Europe (106 | 4.8%), Latin America (83 | 3.7%), Asia (77 | 3.5%), Caribbean (55 | 2.5%), and Eastern Europe (50 | 2.3%), together accounting for 16.8% of all Crompond residents.
| Immigration Origin | # Population | % Population |
| Africa | 15 | 0.7% |
| Asia | 77 | 3.5% |
| Bolivia | 28 | 1.3% |
| Caribbean | 55 | 2.5% |
| China | 12 | 0.5% |
| Eastern Asia | 44 | 2.0% |
| Eastern Europe | 50 | 2.3% |
| Egypt | 15 | 0.7% |
| Europe | 106 | 4.8% |
| France | 9 | 0.4% |
| Greece | 15 | 0.7% |
| India | 2 | 0.1% |
| Ireland | 11 | 0.5% |
| Italy | 21 | 0.9% |
| Jamaica | 43 | 1.9% |
| Japan | 14 | 0.6% |
| Korea | 18 | 0.8% |
| Latin America | 83 | 3.7% |
| Northern Africa | 15 | 0.7% |
| Northern Europe | 11 | 0.5% |
| Philippines | 26 | 1.2% |
| South America | 28 | 1.3% |
| South Central Asia | 2 | 0.1% |
| South Eastern Asia | 31 | 1.4% |
| Southern Europe | 36 | 1.6% |
| Taiwan | 12 | 0.5% |
| Thailand | 5 | 0.2% |
| Western Europe | 9 | 0.4% | View All 28 Rows |
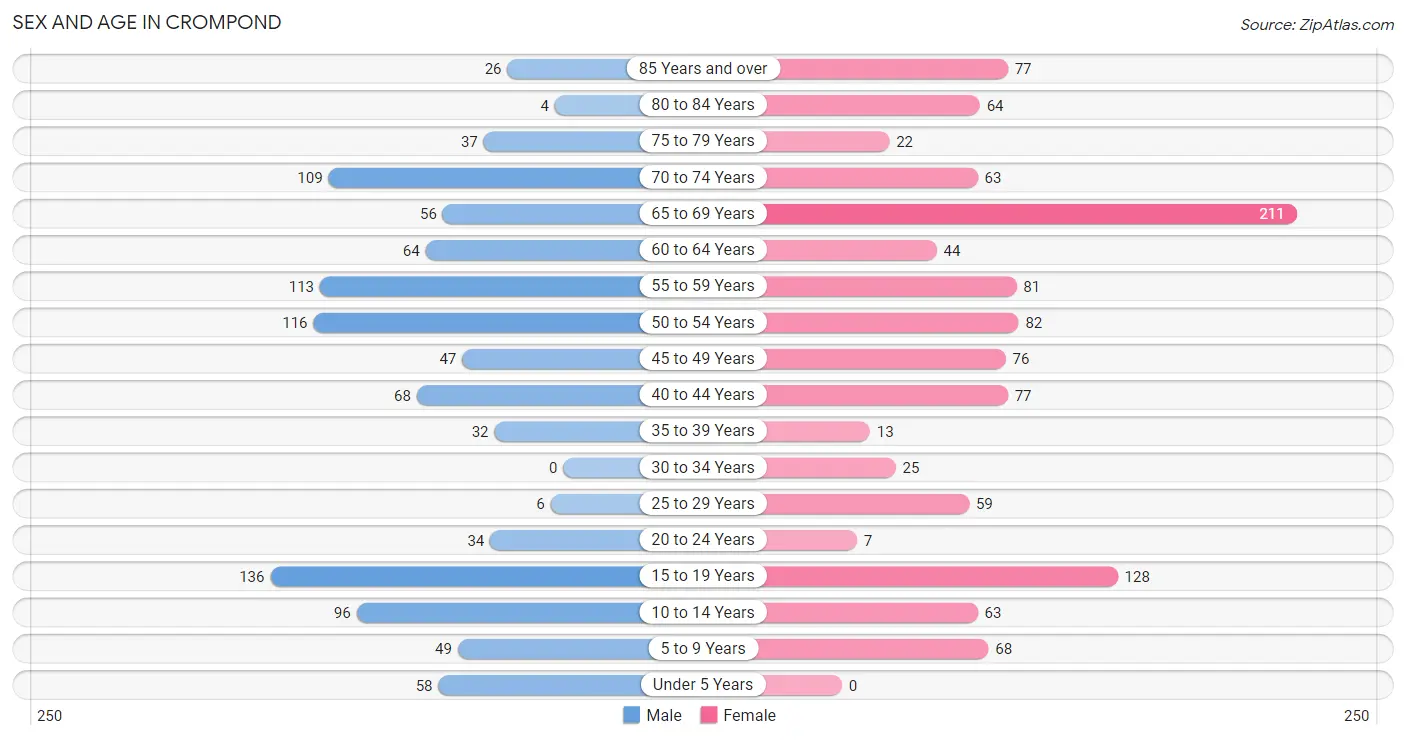
Sex and Age in Crompond
Sex and Age in Crompond
The most populous age groups in Crompond are 15 to 19 Years (136 | 12.9%) for men and 65 to 69 Years (211 | 18.2%) for women.
| Age Bracket | Male | Female |
| Under 5 Years | 58 (5.5%) | 0 (0.0%) |
| 5 to 9 Years | 49 (4.7%) | 68 (5.9%) |
| 10 to 14 Years | 96 (9.1%) | 63 (5.4%) |
| 15 to 19 Years | 136 (12.9%) | 128 (11.0%) |
| 20 to 24 Years | 34 (3.2%) | 7 (0.6%) |
| 25 to 29 Years | 6 (0.6%) | 59 (5.1%) |
| 30 to 34 Years | 0 (0.0%) | 25 (2.2%) |
| 35 to 39 Years | 32 (3.0%) | 13 (1.1%) |
| 40 to 44 Years | 68 (6.5%) | 77 (6.6%) |
| 45 to 49 Years | 47 (4.5%) | 76 (6.6%) |
| 50 to 54 Years | 116 (11.0%) | 82 (7.1%) |
| 55 to 59 Years | 113 (10.7%) | 81 (7.0%) |
| 60 to 64 Years | 64 (6.1%) | 44 (3.8%) |
| 65 to 69 Years | 56 (5.3%) | 211 (18.2%) |
| 70 to 74 Years | 109 (10.4%) | 63 (5.4%) |
| 75 to 79 Years | 37 (3.5%) | 22 (1.9%) |
| 80 to 84 Years | 4 (0.4%) | 64 (5.5%) |
| 85 Years and over | 26 (2.5%) | 77 (6.6%) |
| Total | 1,051 (100.0%) | 1,160 (100.0%) |
Families and Households in Crompond
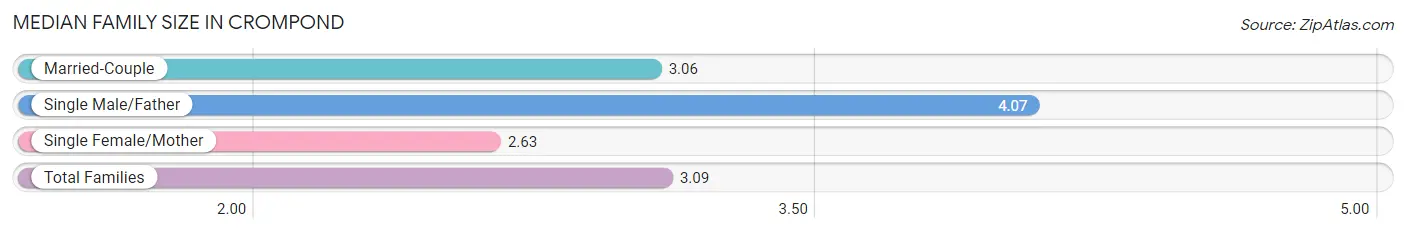
Median Family Size in Crompond
The median family size in Crompond is 3.09 persons per family, with single male/father families (41 | 6.8%) accounting for the largest median family size of 4.07 persons per family. On the other hand, single female/mother families (49 | 8.1%) represent the smallest median family size with 2.63 persons per family.
| Family Type | # Families | Family Size |
| Married-Couple | 517 (85.2%) | 3.06 |
| Single Male/Father | 41 (6.8%) | 4.07 |
| Single Female/Mother | 49 (8.1%) | 2.63 |
| Total Families | 607 (100.0%) | 3.09 |
Median Household Size in Crompond
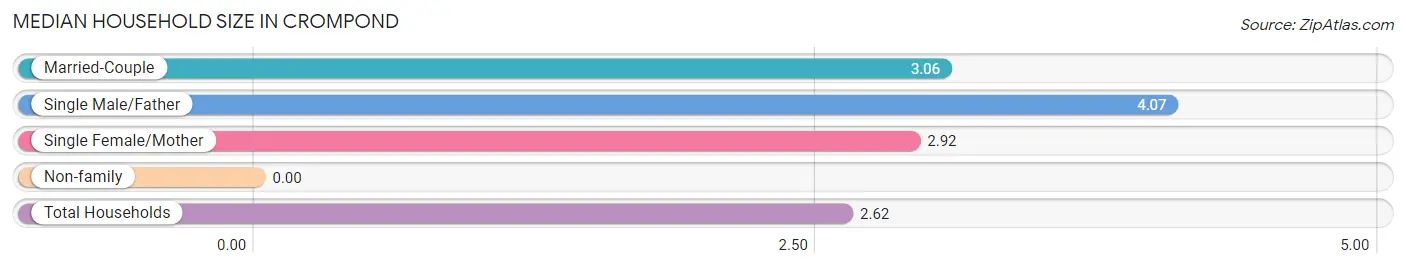
| Household Type | # Households | Household Size |
| Married-Couple | 517 (65.1%) | 3.06 |
| Single Male/Father | 41 (5.2%) | 4.07 |
| Single Female/Mother | 49 (6.2%) | 2.92 |
| Non-family | 187 (23.5%) | - |
| Total Households | 794 (100.0%) | 2.62 |
Household Size by Marriage Status in Crompond
Out of a total of 794 households in Crompond, 607 (76.4%) are family households, while 187 (23.5%) are nonfamily households. The most numerous type of family households are 2-person households, comprising 284, and the most common type of nonfamily households are 1-person households, comprising 187.
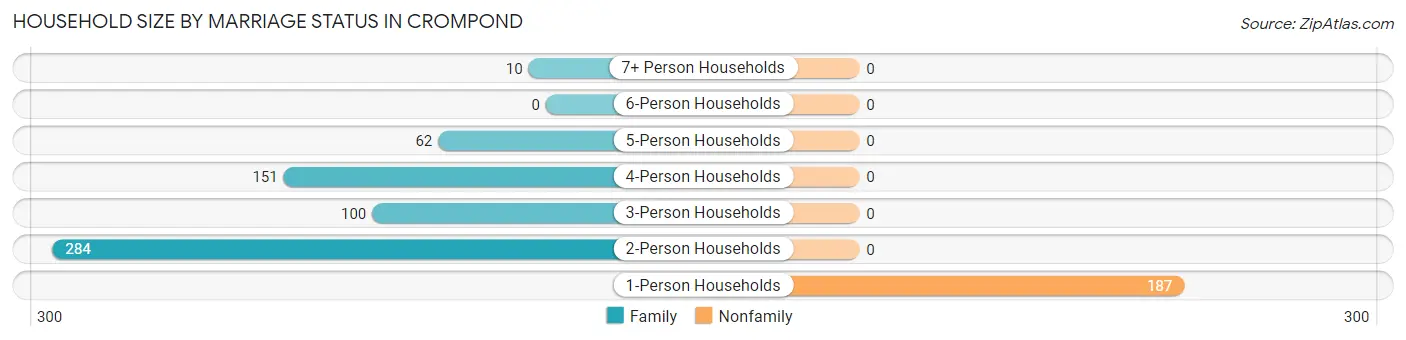
| Household Size | Family Households | Nonfamily Households |
| 1-Person Households | - | 187 (23.5%) |
| 2-Person Households | 284 (35.8%) | 0 (0.0%) |
| 3-Person Households | 100 (12.6%) | 0 (0.0%) |
| 4-Person Households | 151 (19.0%) | 0 (0.0%) |
| 5-Person Households | 62 (7.8%) | 0 (0.0%) |
| 6-Person Households | 0 (0.0%) | 0 (0.0%) |
| 7+ Person Households | 10 (1.3%) | 0 (0.0%) |
| Total | 607 (76.4%) | 187 (23.5%) |
Female Fertility in Crompond
Fertility by Age in Crompond
Average fertility rate in Crompond is 63.0 births per 1,000 women. Women in the age bracket of 20 to 34 years have the highest fertility rate with 143.0 births per 1,000 women. Women in the age bracket of 20 to 34 years acount for 50.0% of all women with births.
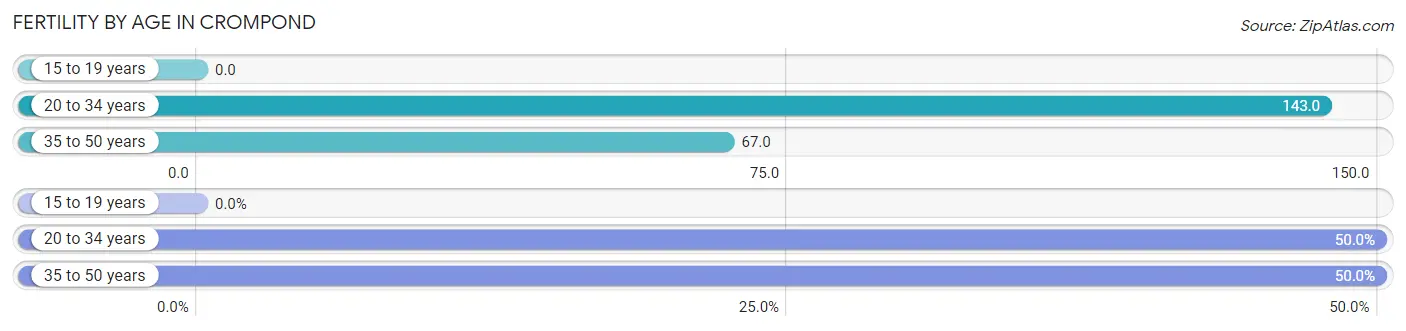
| Age Bracket | Women with Births | Births / 1,000 Women |
| 15 to 19 years | 0 (0.0%) | 0.0 |
| 20 to 34 years | 13 (50.0%) | 143.0 |
| 35 to 50 years | 13 (50.0%) | 67.0 |
| Total | 26 (100.0%) | 63.0 |
Fertility by Age by Marriage Status in Crompond
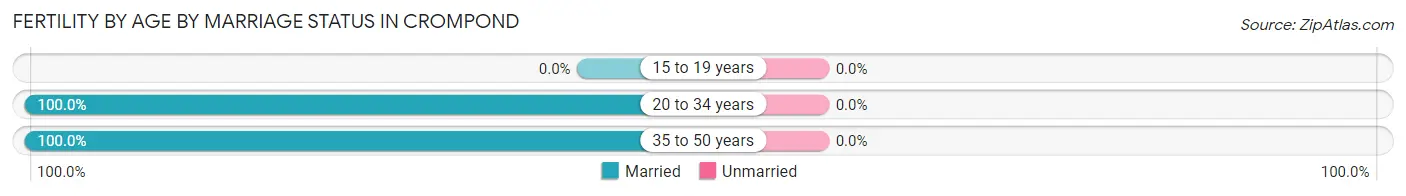
| Age Bracket | Married | Unmarried |
| 15 to 19 years | 0 (0.0%) | 0 (0.0%) |
| 20 to 34 years | 13 (100.0%) | 0 (0.0%) |
| 35 to 50 years | 13 (100.0%) | 0 (0.0%) |
| Total | 26 (100.0%) | 0 (0.0%) |
Fertility by Education in Crompond
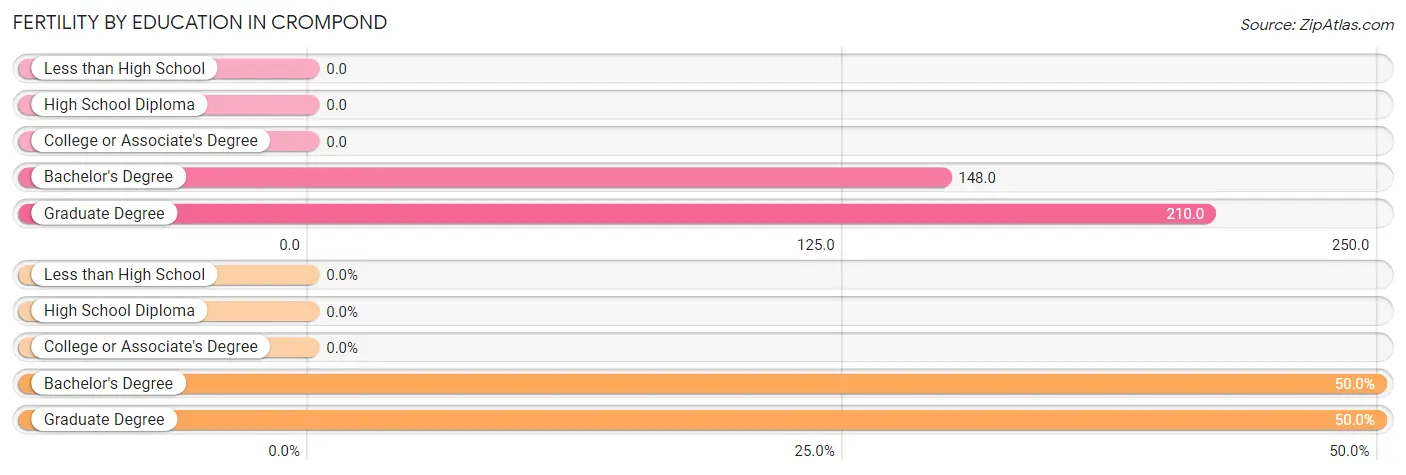
| Educational Attainment | Women with Births | Births / 1,000 Women |
| Less than High School | 0 (0.0%) | 0.0 |
| High School Diploma | 0 (0.0%) | 0.0 |
| College or Associate's Degree | 0 (0.0%) | 0.0 |
| Bachelor's Degree | 13 (50.0%) | 148.0 |
| Graduate Degree | 13 (50.0%) | 210.0 |
| Total | 26 (100.0%) | 63.0 |
Fertility by Education by Marriage Status in Crompond
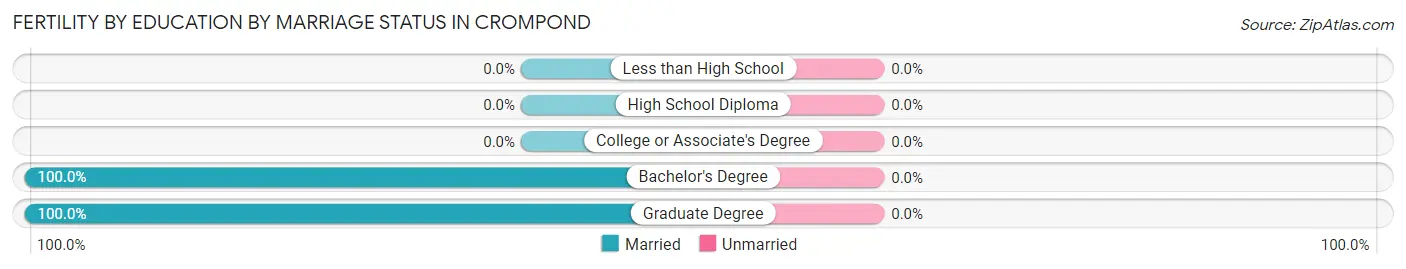
| Educational Attainment | Married | Unmarried |
| Less than High School | 0 (0.0%) | 0 (0.0%) |
| High School Diploma | 0 (0.0%) | 0 (0.0%) |
| College or Associate's Degree | 0 (0.0%) | 0 (0.0%) |
| Bachelor's Degree | 13 (100.0%) | 0 (0.0%) |
| Graduate Degree | 13 (100.0%) | 0 (0.0%) |
| Total | 26 (100.0%) | 0 (0.0%) |
Employment Characteristics in Crompond
Employment by Class of Employer in Crompond
Among the 817 employed individuals in Crompond, private company employees (388 | 47.5%), not-for-profit organizations (215 | 26.3%), and local government employees (79 | 9.7%) make up the most common classes of employment.
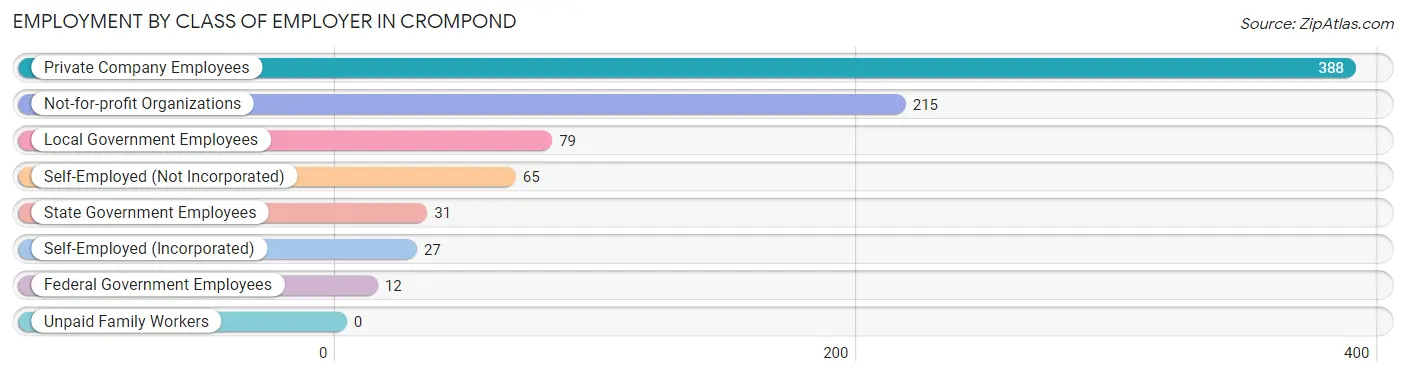
| Employer Class | # Employees | % Employees |
| Private Company Employees | 388 | 47.5% |
| Self-Employed (Incorporated) | 27 | 3.3% |
| Self-Employed (Not Incorporated) | 65 | 8.0% |
| Not-for-profit Organizations | 215 | 26.3% |
| Local Government Employees | 79 | 9.7% |
| State Government Employees | 31 | 3.8% |
| Federal Government Employees | 12 | 1.5% |
| Unpaid Family Workers | 0 | 0.0% |
| Total | 817 | 100.0% |
Employment Status by Age in Crompond
According to the labor force statistics for Crompond, out of the total population over 16 years of age (1,794), 56.5% or 1,014 individuals are in the labor force, with 7.3% or 74 of them unemployed. The age group with the highest labor force participation rate is 30 to 34 years, with 100.0% or 25 individuals in the labor force. Within the labor force, the 30 to 34 years age range has the highest percentage of unemployed individuals, with 48.0% or 12 of them being unemployed.
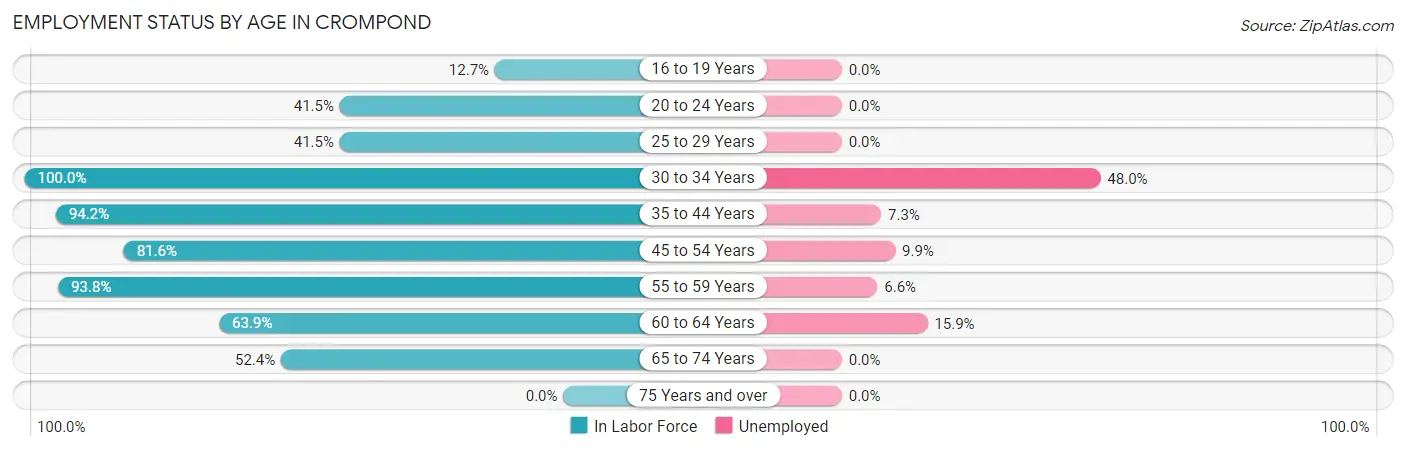
| Age Bracket | In Labor Force | Unemployed |
| 16 to 19 Years | 23 (12.7%) | 0 (0.0%) |
| 20 to 24 Years | 17 (41.5%) | 0 (0.0%) |
| 25 to 29 Years | 27 (41.5%) | 0 (0.0%) |
| 30 to 34 Years | 25 (100.0%) | 12 (48.0%) |
| 35 to 44 Years | 179 (94.2%) | 13 (7.3%) |
| 45 to 54 Years | 262 (81.6%) | 26 (9.9%) |
| 55 to 59 Years | 182 (93.8%) | 12 (6.6%) |
| 60 to 64 Years | 69 (63.9%) | 11 (15.9%) |
| 65 to 74 Years | 230 (52.4%) | 0 (0.0%) |
| 75 Years and over | 0 (0.0%) | 0 (0.0%) |
| Total | 1,014 (56.5%) | 74 (7.3%) |
Employment Status by Educational Attainment in Crompond
According to labor force statistics for Crompond, 82.4% of individuals (744) out of the total population between 25 and 64 years of age (903) are in the labor force, with 9.9% or 74 of them being unemployed. The group with the highest labor force participation rate are those with the educational attainment of bachelor's degree or higher, with 91.6% or 445 individuals in the labor force. Within the labor force, individuals with college / associate degree education have the highest percentage of unemployment, with 29.9% or 61 of them being unemployed.
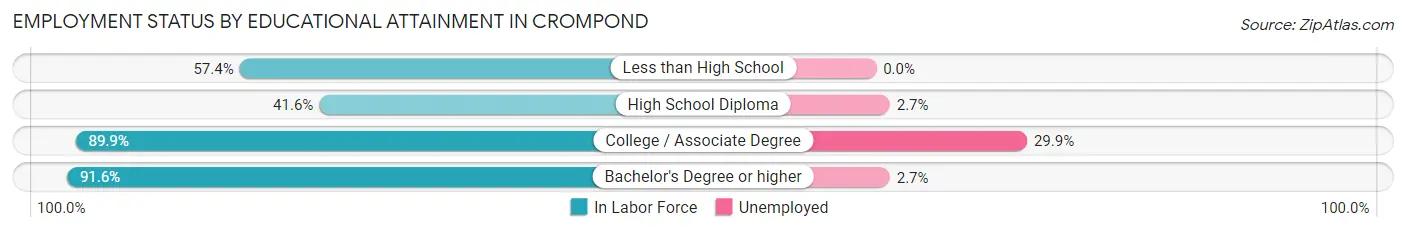
| Educational Attainment | In Labor Force | Unemployed |
| Less than High School | 58 (57.4%) | 0 (0.0%) |
| High School Diploma | 37 (41.6%) | 2 (2.7%) |
| College / Associate Degree | 204 (89.9%) | 68 (29.9%) |
| Bachelor's Degree or higher | 445 (91.6%) | 13 (2.7%) |
| Total | 744 (82.4%) | 89 (9.9%) |
Employment Occupations by Sex in Crompond
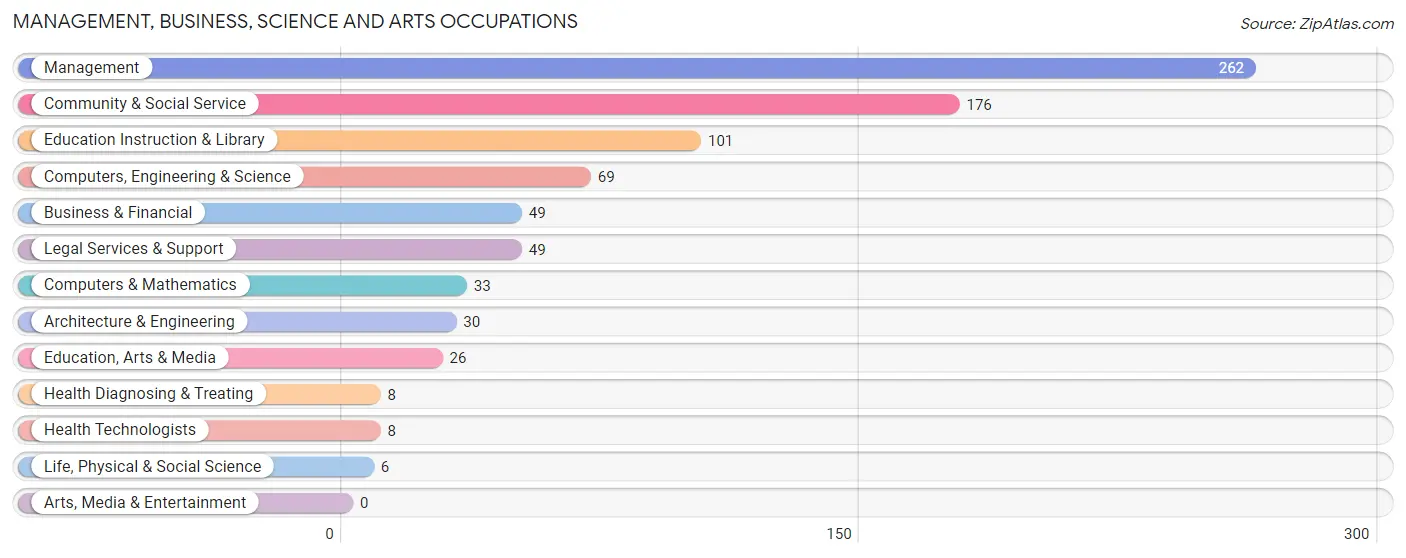
Management, Business, Science and Arts Occupations
The most common Management, Business, Science and Arts occupations in Crompond are Management (262 | 27.9%), Community & Social Service (176 | 18.7%), Education Instruction & Library (101 | 10.7%), Computers, Engineering & Science (69 | 7.3%), and Business & Financial (49 | 5.2%).
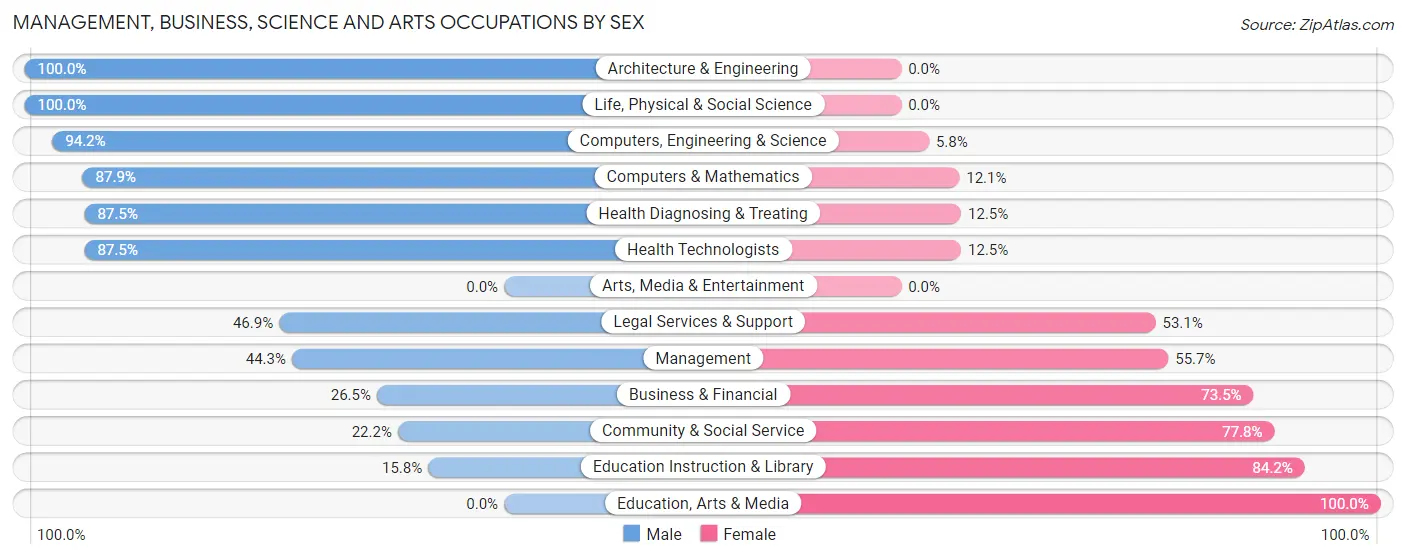
Management, Business, Science and Arts Occupations by Sex
Within the Management, Business, Science and Arts occupations in Crompond, the most male-oriented occupations are Architecture & Engineering (100.0%), Life, Physical & Social Science (100.0%), and Computers, Engineering & Science (94.2%), while the most female-oriented occupations are Education, Arts & Media (100.0%), Education Instruction & Library (84.2%), and Community & Social Service (77.8%).
| Occupation | Male | Female |
| Management | 116 (44.3%) | 146 (55.7%) |
| Business & Financial | 13 (26.5%) | 36 (73.5%) |
| Computers, Engineering & Science | 65 (94.2%) | 4 (5.8%) |
| Computers & Mathematics | 29 (87.9%) | 4 (12.1%) |
| Architecture & Engineering | 30 (100.0%) | 0 (0.0%) |
| Life, Physical & Social Science | 6 (100.0%) | 0 (0.0%) |
| Community & Social Service | 39 (22.2%) | 137 (77.8%) |
| Education, Arts & Media | 0 (0.0%) | 26 (100.0%) |
| Legal Services & Support | 23 (46.9%) | 26 (53.1%) |
| Education Instruction & Library | 16 (15.8%) | 85 (84.2%) |
| Arts, Media & Entertainment | 0 (0.0%) | 0 (0.0%) |
| Health Diagnosing & Treating | 7 (87.5%) | 1 (12.5%) |
| Health Technologists | 7 (87.5%) | 1 (12.5%) |
| Total (Category) | 240 (42.5%) | 324 (57.5%) |
| Total (Overall) | 486 (51.7%) | 454 (48.3%) |
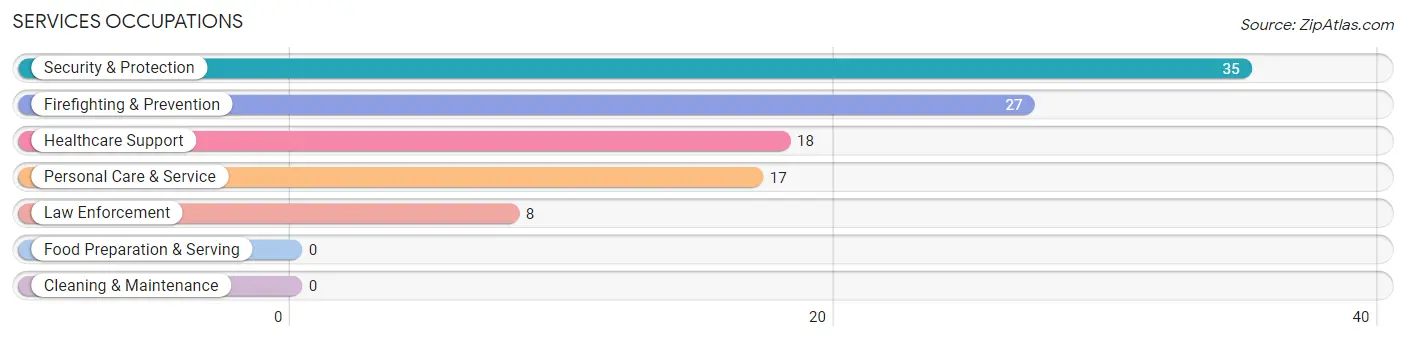
Services Occupations
The most common Services occupations in Crompond are Security & Protection (35 | 3.7%), Firefighting & Prevention (27 | 2.9%), Healthcare Support (18 | 1.9%), Personal Care & Service (17 | 1.8%), and Law Enforcement (8 | 0.9%).
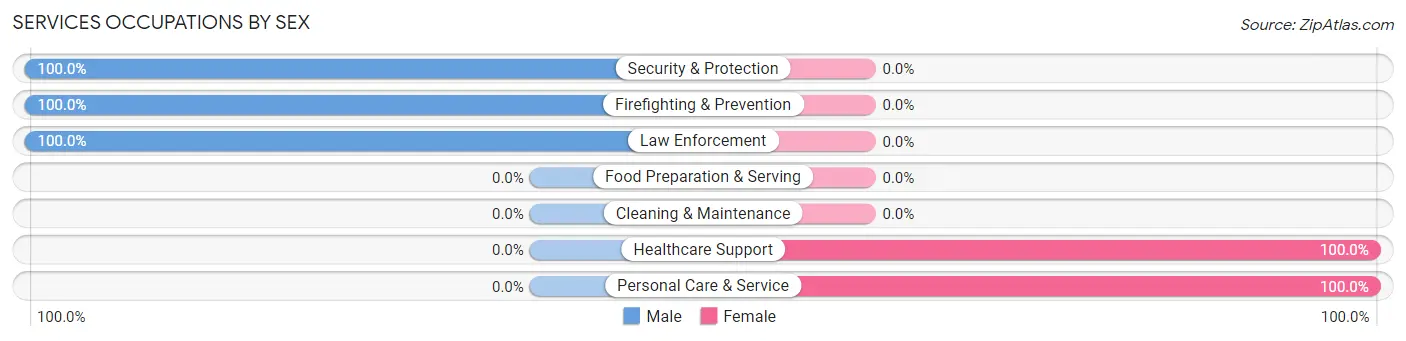
Services Occupations by Sex
Within the Services occupations in Crompond, the most male-oriented occupations are Security & Protection (100.0%), Firefighting & Prevention (100.0%), and Law Enforcement (100.0%), while the most female-oriented occupations are Healthcare Support (100.0%), and Personal Care & Service (100.0%).
| Occupation | Male | Female |
| Healthcare Support | 0 (0.0%) | 18 (100.0%) |
| Security & Protection | 35 (100.0%) | 0 (0.0%) |
| Firefighting & Prevention | 27 (100.0%) | 0 (0.0%) |
| Law Enforcement | 8 (100.0%) | 0 (0.0%) |
| Food Preparation & Serving | 0 (0.0%) | 0 (0.0%) |
| Cleaning & Maintenance | 0 (0.0%) | 0 (0.0%) |
| Personal Care & Service | 0 (0.0%) | 17 (100.0%) |
| Total (Category) | 35 (50.0%) | 35 (50.0%) |
| Total (Overall) | 486 (51.7%) | 454 (48.3%) |
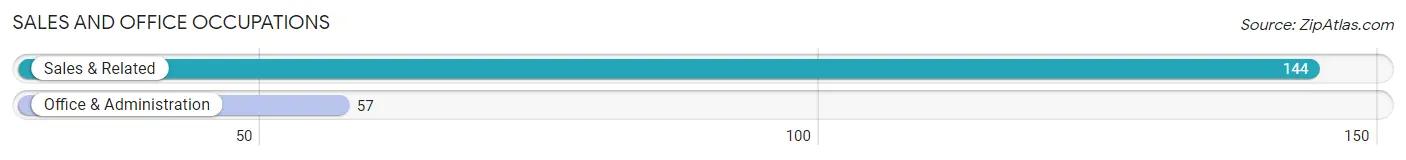
Sales and Office Occupations
The most common Sales and Office occupations in Crompond are Sales & Related (144 | 15.3%), and Office & Administration (57 | 6.1%).
Sales and Office Occupations by Sex
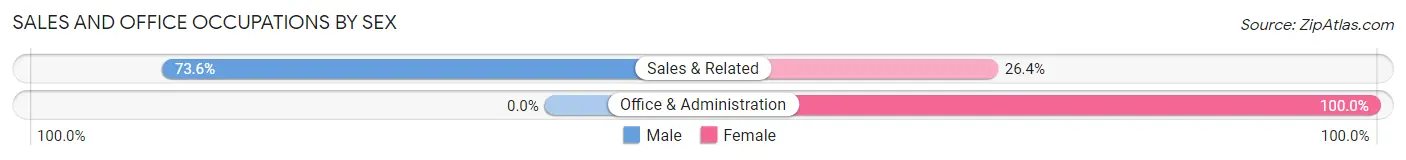
| Occupation | Male | Female |
| Sales & Related | 106 (73.6%) | 38 (26.4%) |
| Office & Administration | 0 (0.0%) | 57 (100.0%) |
| Total (Category) | 106 (52.7%) | 95 (47.3%) |
| Total (Overall) | 486 (51.7%) | 454 (48.3%) |
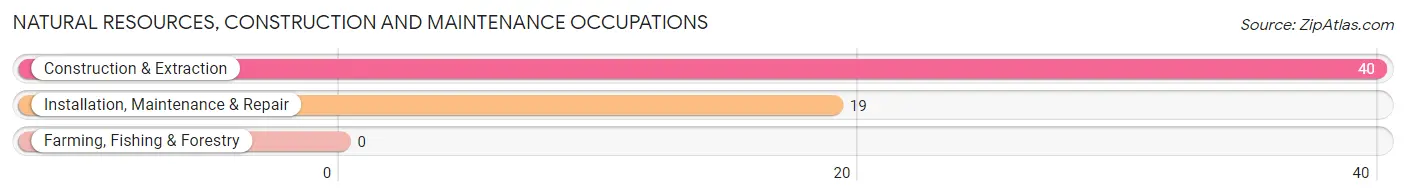
Natural Resources, Construction and Maintenance Occupations
The most common Natural Resources, Construction and Maintenance occupations in Crompond are Construction & Extraction (40 | 4.3%), and Installation, Maintenance & Repair (19 | 2.0%).
Natural Resources, Construction and Maintenance Occupations by Sex
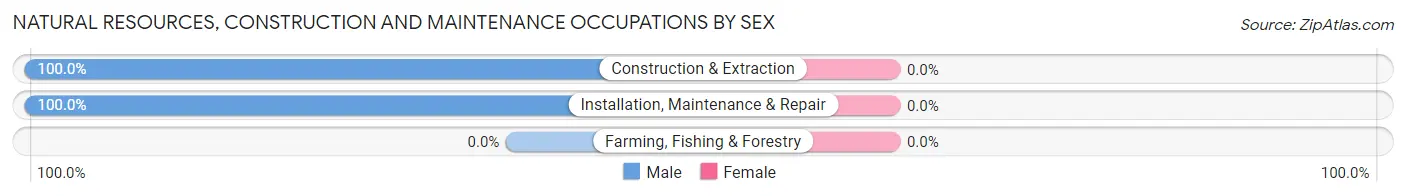
| Occupation | Male | Female |
| Farming, Fishing & Forestry | 0 (0.0%) | 0 (0.0%) |
| Construction & Extraction | 40 (100.0%) | 0 (0.0%) |
| Installation, Maintenance & Repair | 19 (100.0%) | 0 (0.0%) |
| Total (Category) | 59 (100.0%) | 0 (0.0%) |
| Total (Overall) | 486 (51.7%) | 454 (48.3%) |
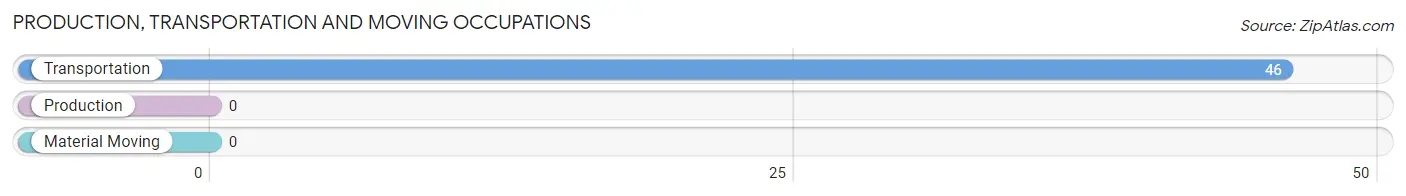
Production, Transportation and Moving Occupations
The most common Production, Transportation and Moving occupations in Crompond are , and Transportation (46 | 4.9%).
Production, Transportation and Moving Occupations by Sex
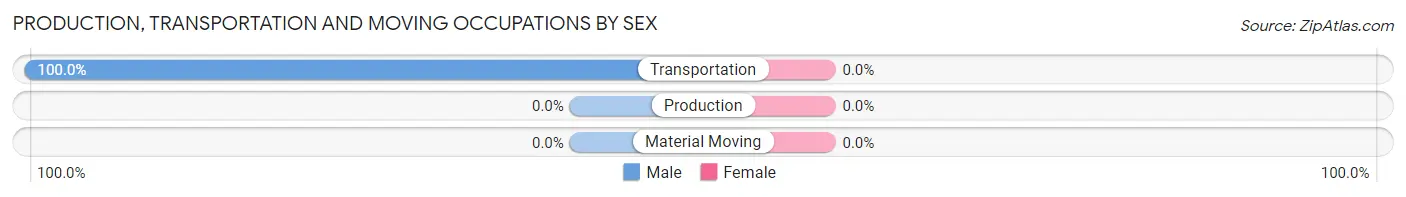
| Occupation | Male | Female |
| Production | 0 (0.0%) | 0 (0.0%) |
| Transportation | 46 (100.0%) | 0 (0.0%) |
| Material Moving | 0 (0.0%) | 0 (0.0%) |
| Total (Category) | 46 (100.0%) | 0 (0.0%) |
| Total (Overall) | 486 (51.7%) | 454 (48.3%) |
Employment Industries by Sex in Crompond
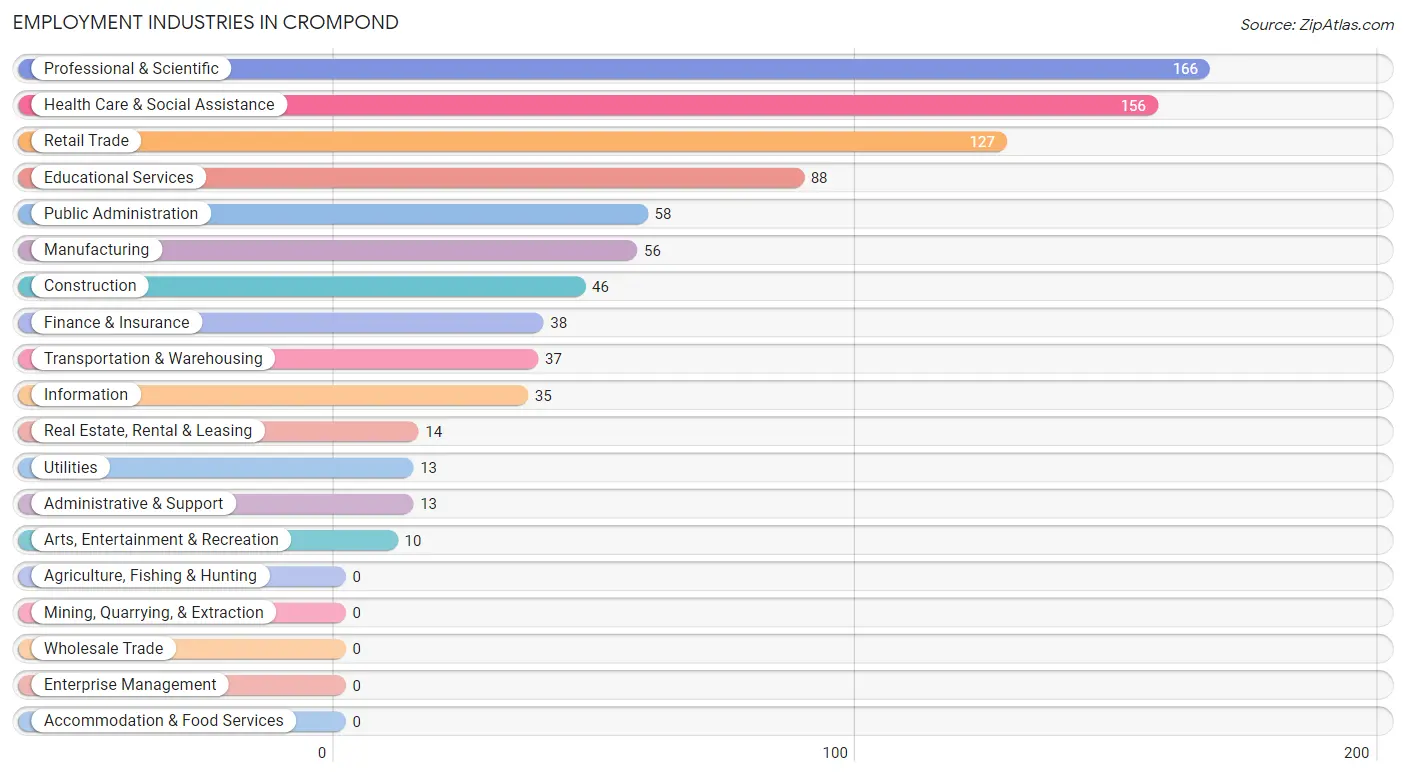
Employment Industries in Crompond
The major employment industries in Crompond include Professional & Scientific (166 | 17.7%), Health Care & Social Assistance (156 | 16.6%), Retail Trade (127 | 13.5%), Educational Services (88 | 9.4%), and Public Administration (58 | 6.2%).
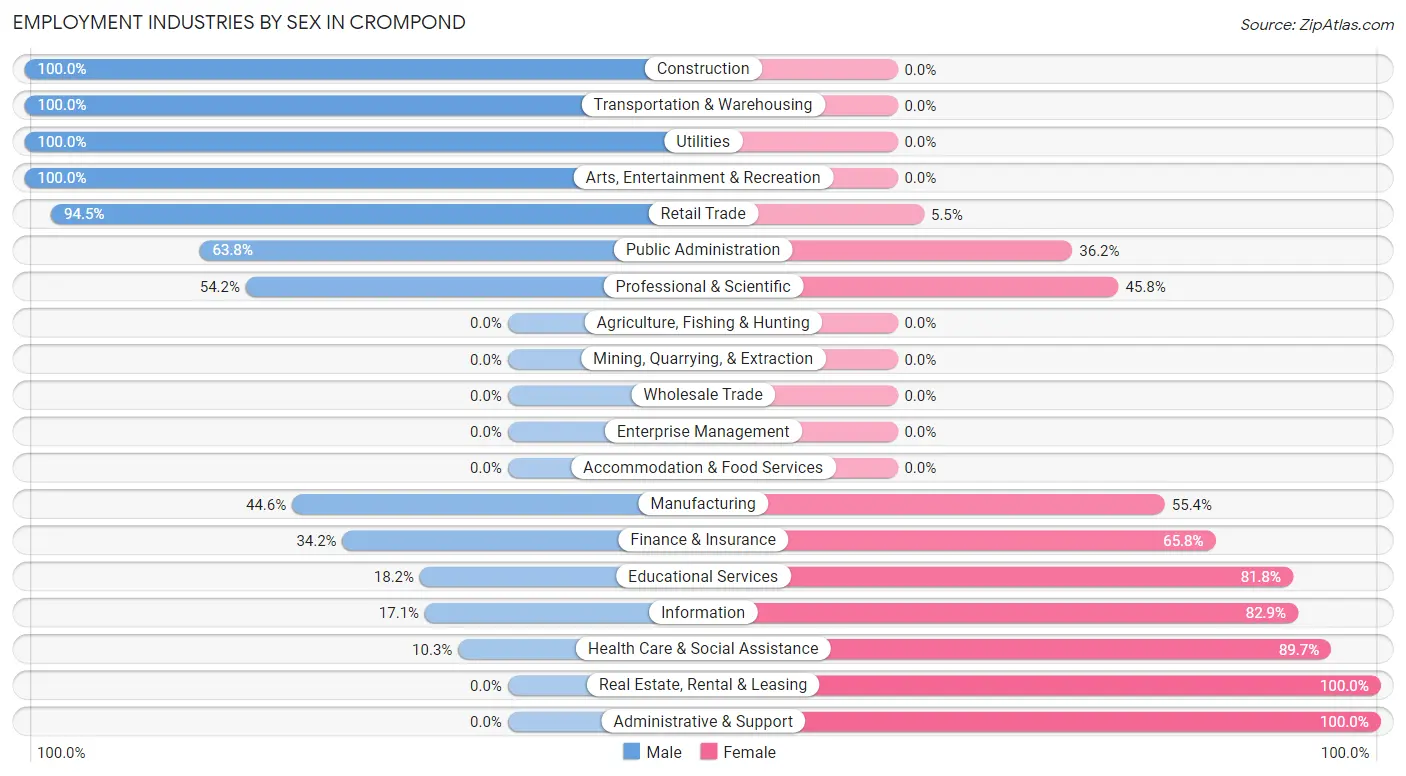
Employment Industries by Sex in Crompond
The Crompond industries that see more men than women are Construction (100.0%), Transportation & Warehousing (100.0%), and Utilities (100.0%), whereas the industries that tend to have a higher number of women are Real Estate, Rental & Leasing (100.0%), Administrative & Support (100.0%), and Health Care & Social Assistance (89.7%).
| Industry | Male | Female |
| Agriculture, Fishing & Hunting | 0 (0.0%) | 0 (0.0%) |
| Mining, Quarrying, & Extraction | 0 (0.0%) | 0 (0.0%) |
| Construction | 46 (100.0%) | 0 (0.0%) |
| Manufacturing | 25 (44.6%) | 31 (55.4%) |
| Wholesale Trade | 0 (0.0%) | 0 (0.0%) |
| Retail Trade | 120 (94.5%) | 7 (5.5%) |
| Transportation & Warehousing | 37 (100.0%) | 0 (0.0%) |
| Utilities | 13 (100.0%) | 0 (0.0%) |
| Information | 6 (17.1%) | 29 (82.9%) |
| Finance & Insurance | 13 (34.2%) | 25 (65.8%) |
| Real Estate, Rental & Leasing | 0 (0.0%) | 14 (100.0%) |
| Professional & Scientific | 90 (54.2%) | 76 (45.8%) |
| Enterprise Management | 0 (0.0%) | 0 (0.0%) |
| Administrative & Support | 0 (0.0%) | 13 (100.0%) |
| Educational Services | 16 (18.2%) | 72 (81.8%) |
| Health Care & Social Assistance | 16 (10.3%) | 140 (89.7%) |
| Arts, Entertainment & Recreation | 10 (100.0%) | 0 (0.0%) |
| Accommodation & Food Services | 0 (0.0%) | 0 (0.0%) |
| Public Administration | 37 (63.8%) | 21 (36.2%) |
| Total | 486 (51.7%) | 454 (48.3%) |
Education in Crompond
School Enrollment in Crompond
The most common levels of schooling among the 607 students in Crompond are high school (211 | 34.8%), middle school (134 | 22.1%), and college / undergraduate (119 | 19.6%).
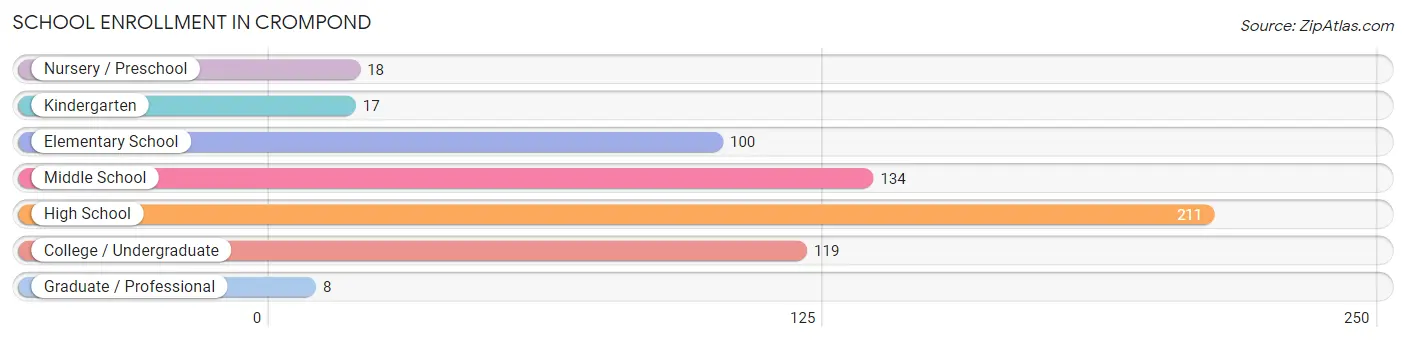
| School Level | # Students | % Students |
| Nursery / Preschool | 18 | 3.0% |
| Kindergarten | 17 | 2.8% |
| Elementary School | 100 | 16.5% |
| Middle School | 134 | 22.1% |
| High School | 211 | 34.8% |
| College / Undergraduate | 119 | 19.6% |
| Graduate / Professional | 8 | 1.3% |
| Total | 607 | 100.0% |
School Enrollment by Age by Funding Source in Crompond
Out of a total of 607 students who are enrolled in schools in Crompond, 130 (21.4%) attend a private institution, while the remaining 477 (78.6%) are enrolled in public schools. The age group of 35 years and over has the highest likelihood of being enrolled in private schools, with 8 (100.0% in the age bracket) enrolled. Conversely, the age group of 3 to 4 year olds has the lowest likelihood of being enrolled in a private school, with 18 (100.0% in the age bracket) attending a public institution.
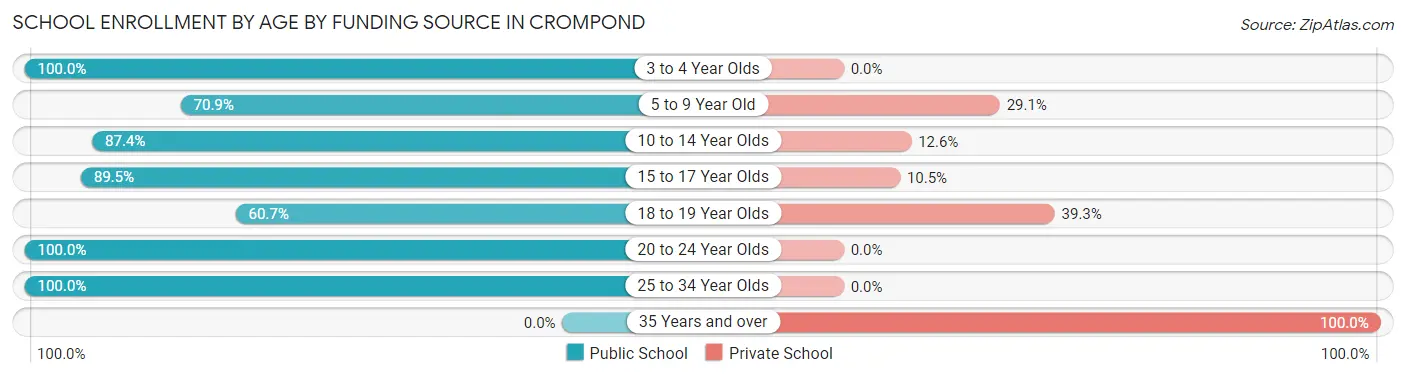
| Age Bracket | Public School | Private School |
| 3 to 4 Year Olds | 18 (100.0%) | 0 (0.0%) |
| 5 to 9 Year Old | 83 (70.9%) | 34 (29.1%) |
| 10 to 14 Year Olds | 139 (87.4%) | 20 (12.6%) |
| 15 to 17 Year Olds | 111 (89.5%) | 13 (10.5%) |
| 18 to 19 Year Olds | 85 (60.7%) | 55 (39.3%) |
| 20 to 24 Year Olds | 24 (100.0%) | 0 (0.0%) |
| 25 to 34 Year Olds | 17 (100.0%) | 0 (0.0%) |
| 35 Years and over | 0 (0.0%) | 8 (100.0%) |
| Total | 477 (78.6%) | 130 (21.4%) |
Educational Attainment by Field of Study in Crompond
Business (140 | 17.5%), psychology (111 | 13.9%), education (85 | 10.6%), physical & health sciences (77 | 9.7%), and social sciences (74 | 9.3%) are the most common fields of study among 798 individuals in Crompond who have obtained a bachelor's degree or higher.
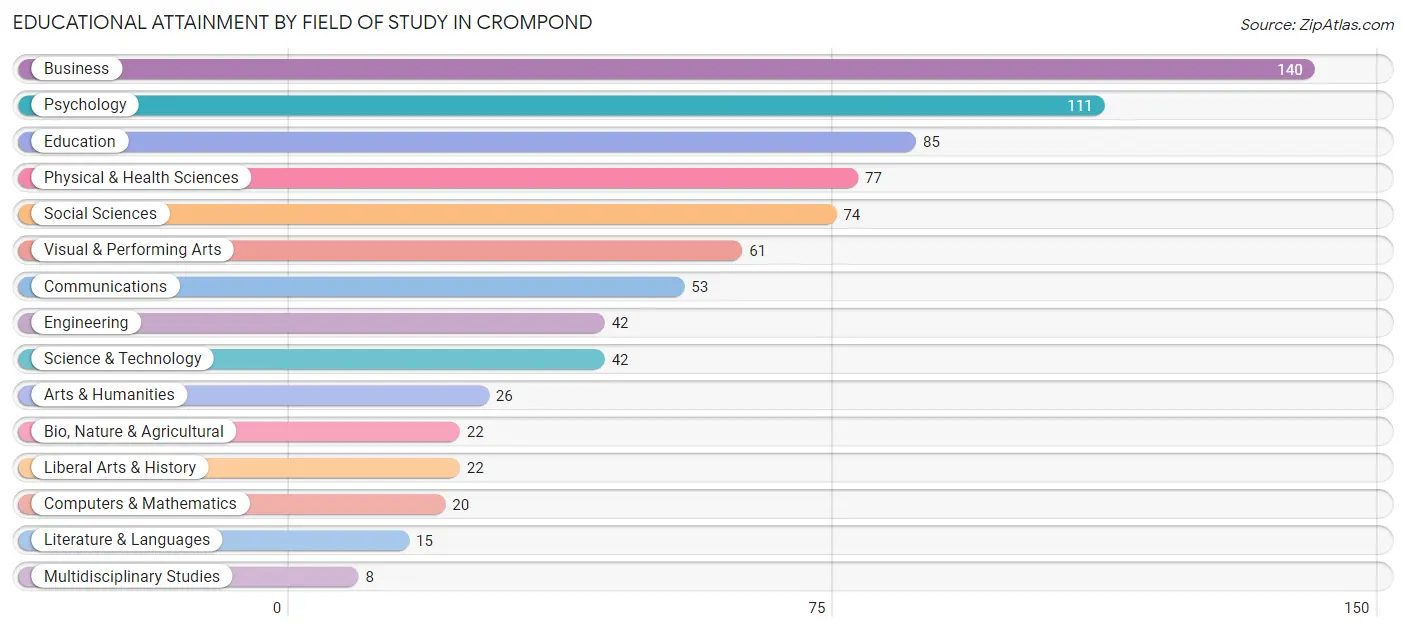
| Field of Study | # Graduates | % Graduates |
| Computers & Mathematics | 20 | 2.5% |
| Bio, Nature & Agricultural | 22 | 2.8% |
| Physical & Health Sciences | 77 | 9.7% |
| Psychology | 111 | 13.9% |
| Social Sciences | 74 | 9.3% |
| Engineering | 42 | 5.3% |
| Multidisciplinary Studies | 8 | 1.0% |
| Science & Technology | 42 | 5.3% |
| Business | 140 | 17.5% |
| Education | 85 | 10.6% |
| Literature & Languages | 15 | 1.9% |
| Liberal Arts & History | 22 | 2.8% |
| Visual & Performing Arts | 61 | 7.6% |
| Communications | 53 | 6.6% |
| Arts & Humanities | 26 | 3.3% |
| Total | 798 | 100.0% |
Transportation & Commute in Crompond
Vehicle Availability by Sex in Crompond
The most prevalent vehicle ownership categories in Crompond are males with 2 vehicles (194, accounting for 48.7%) and females with 2 vehicles (254, making up 46.3%).
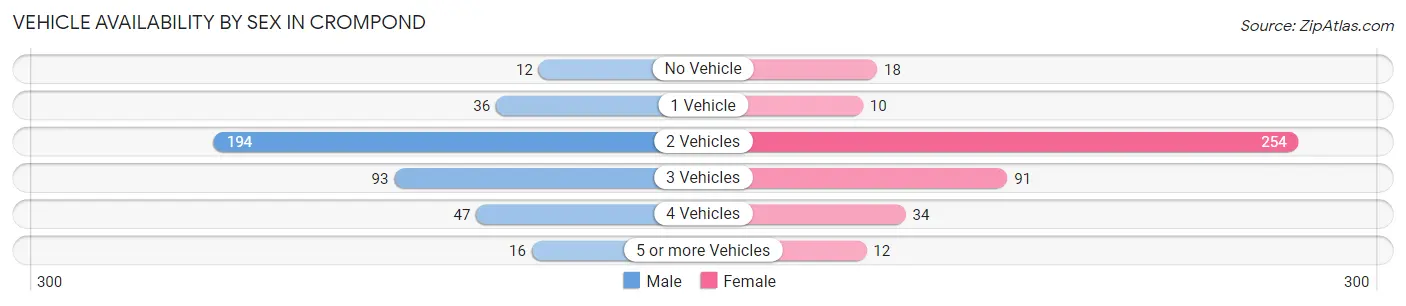
| Vehicles Available | Male | Female |
| No Vehicle | 12 (3.0%) | 18 (4.3%) |
| 1 Vehicle | 36 (9.0%) | 10 (2.4%) |
| 2 Vehicles | 194 (48.7%) | 254 (60.6%) |
| 3 Vehicles | 93 (23.4%) | 91 (21.7%) |
| 4 Vehicles | 47 (11.8%) | 34 (8.1%) |
| 5 or more Vehicles | 16 (4.0%) | 12 (2.9%) |
| Total | 398 (100.0%) | 419 (100.0%) |
Commute Time in Crompond
The most frequently occuring commute durations in Crompond are 30 to 34 minutes (178 commuters, 31.0%), 45 to 59 minutes (104 commuters, 18.1%), and 10 to 14 minutes (78 commuters, 13.6%).
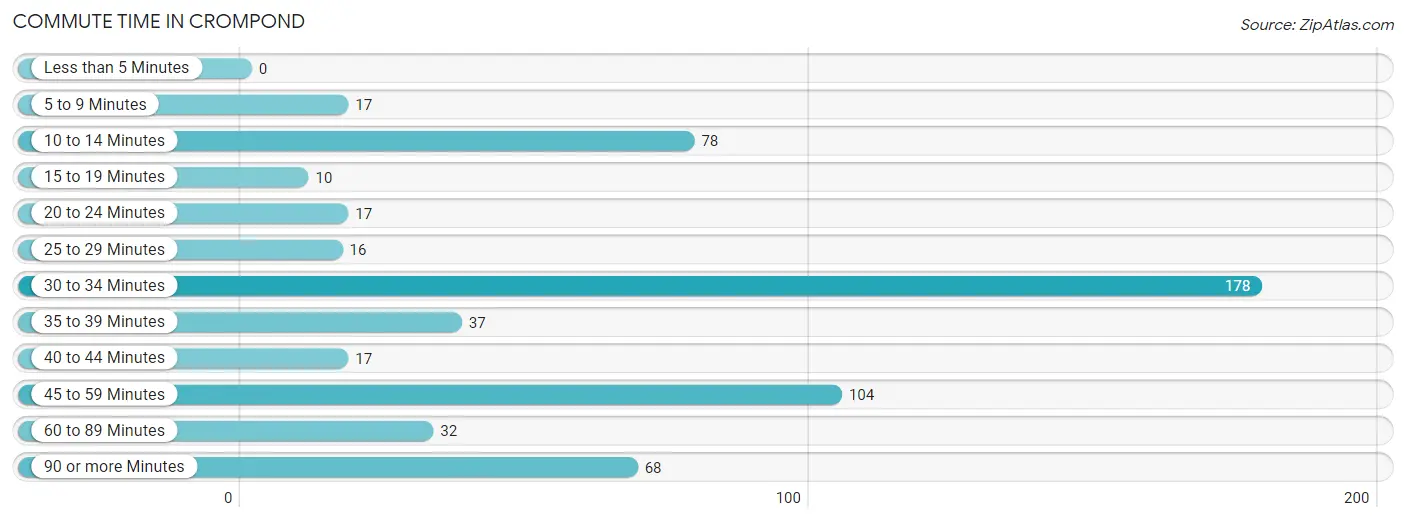
| Commute Time | # Commuters | % Commuters |
| Less than 5 Minutes | 0 | 0.0% |
| 5 to 9 Minutes | 17 | 3.0% |
| 10 to 14 Minutes | 78 | 13.6% |
| 15 to 19 Minutes | 10 | 1.7% |
| 20 to 24 Minutes | 17 | 3.0% |
| 25 to 29 Minutes | 16 | 2.8% |
| 30 to 34 Minutes | 178 | 31.0% |
| 35 to 39 Minutes | 37 | 6.5% |
| 40 to 44 Minutes | 17 | 3.0% |
| 45 to 59 Minutes | 104 | 18.1% |
| 60 to 89 Minutes | 32 | 5.6% |
| 90 or more Minutes | 68 | 11.8% |
Commute Time by Sex in Crompond
The most common commute times in Crompond are 30 to 34 minutes (92 commuters, 27.0%) for males and 30 to 34 minutes (86 commuters, 36.9%) for females.
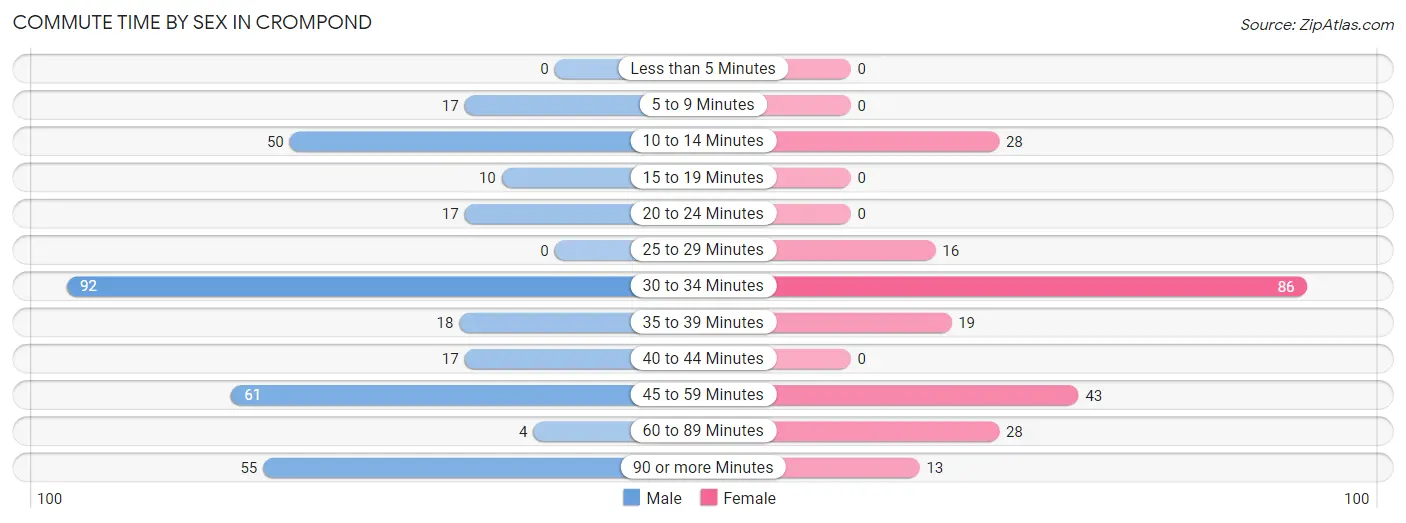
| Commute Time | Male | Female |
| Less than 5 Minutes | 0 (0.0%) | 0 (0.0%) |
| 5 to 9 Minutes | 17 (5.0%) | 0 (0.0%) |
| 10 to 14 Minutes | 50 (14.7%) | 28 (12.0%) |
| 15 to 19 Minutes | 10 (2.9%) | 0 (0.0%) |
| 20 to 24 Minutes | 17 (5.0%) | 0 (0.0%) |
| 25 to 29 Minutes | 0 (0.0%) | 16 (6.9%) |
| 30 to 34 Minutes | 92 (27.0%) | 86 (36.9%) |
| 35 to 39 Minutes | 18 (5.3%) | 19 (8.2%) |
| 40 to 44 Minutes | 17 (5.0%) | 0 (0.0%) |
| 45 to 59 Minutes | 61 (17.9%) | 43 (18.4%) |
| 60 to 89 Minutes | 4 (1.2%) | 28 (12.0%) |
| 90 or more Minutes | 55 (16.1%) | 13 (5.6%) |
Time of Departure to Work by Sex in Crompond
The most frequent times of departure to work in Crompond are 12:00 PM to 3:59 PM (75, 22.0%) for males and 8:00 AM to 8:29 AM (61, 26.2%) for females.
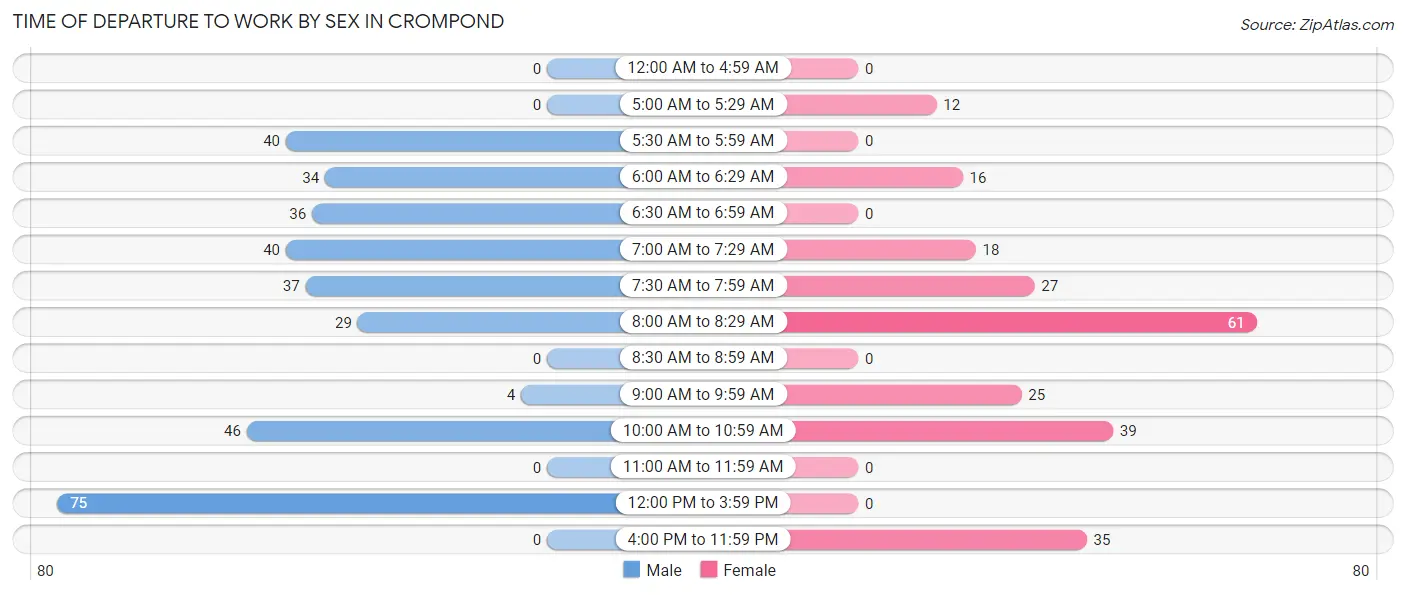
| Time of Departure | Male | Female |
| 12:00 AM to 4:59 AM | 0 (0.0%) | 0 (0.0%) |
| 5:00 AM to 5:29 AM | 0 (0.0%) | 12 (5.1%) |
| 5:30 AM to 5:59 AM | 40 (11.7%) | 0 (0.0%) |
| 6:00 AM to 6:29 AM | 34 (10.0%) | 16 (6.9%) |
| 6:30 AM to 6:59 AM | 36 (10.6%) | 0 (0.0%) |
| 7:00 AM to 7:29 AM | 40 (11.7%) | 18 (7.7%) |
| 7:30 AM to 7:59 AM | 37 (10.8%) | 27 (11.6%) |
| 8:00 AM to 8:29 AM | 29 (8.5%) | 61 (26.2%) |
| 8:30 AM to 8:59 AM | 0 (0.0%) | 0 (0.0%) |
| 9:00 AM to 9:59 AM | 4 (1.2%) | 25 (10.7%) |
| 10:00 AM to 10:59 AM | 46 (13.5%) | 39 (16.7%) |
| 11:00 AM to 11:59 AM | 0 (0.0%) | 0 (0.0%) |
| 12:00 PM to 3:59 PM | 75 (22.0%) | 0 (0.0%) |
| 4:00 PM to 11:59 PM | 0 (0.0%) | 35 (15.0%) |
| Total | 341 (100.0%) | 233 (100.0%) |
Housing Occupancy in Crompond
Occupancy by Ownership in Crompond
Of the total 794 dwellings in Crompond, owner-occupied units account for 735 (92.6%), while renter-occupied units make up 59 (7.4%).
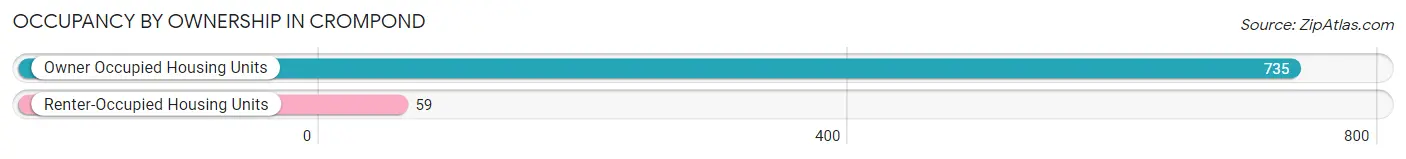
| Occupancy | # Housing Units | % Housing Units |
| Owner Occupied Housing Units | 735 | 92.6% |
| Renter-Occupied Housing Units | 59 | 7.4% |
| Total Occupied Housing Units | 794 | 100.0% |
Occupancy by Household Size in Crompond
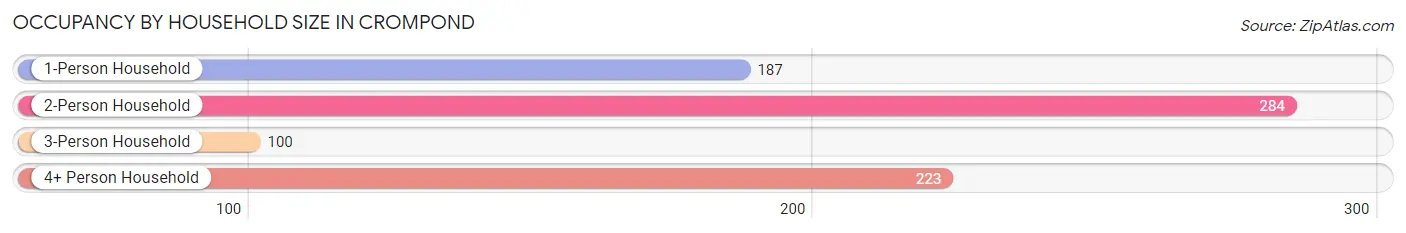
| Household Size | # Housing Units | % Housing Units |
| 1-Person Household | 187 | 23.5% |
| 2-Person Household | 284 | 35.8% |
| 3-Person Household | 100 | 12.6% |
| 4+ Person Household | 223 | 28.1% |
| Total Housing Units | 794 | 100.0% |
Occupancy by Ownership by Household Size in Crompond
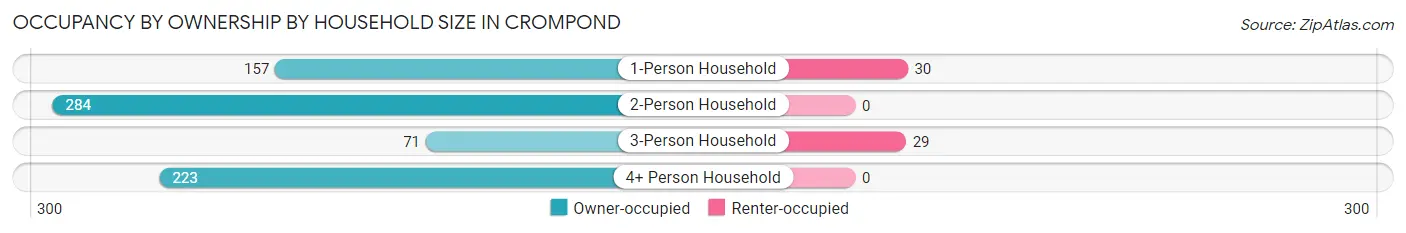
| Household Size | Owner-occupied | Renter-occupied |
| 1-Person Household | 157 (84.0%) | 30 (16.0%) |
| 2-Person Household | 284 (100.0%) | 0 (0.0%) |
| 3-Person Household | 71 (71.0%) | 29 (29.0%) |
| 4+ Person Household | 223 (100.0%) | 0 (0.0%) |
| Total Housing Units | 735 (92.6%) | 59 (7.4%) |
Occupancy by Educational Attainment in Crompond
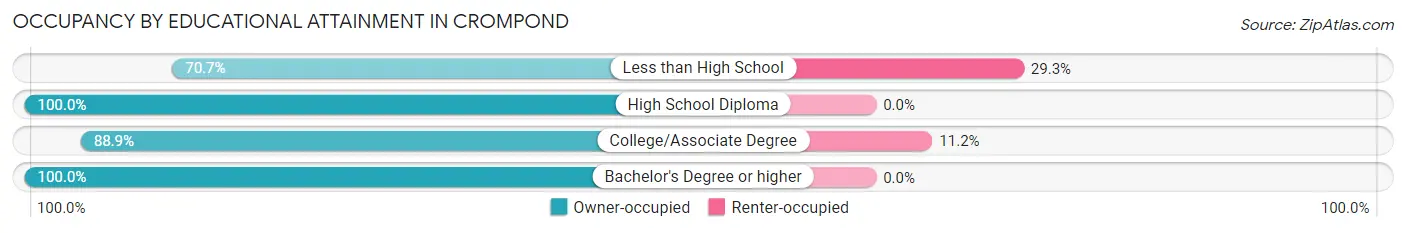
| Household Size | Owner-occupied | Renter-occupied |
| Less than High School | 70 (70.7%) | 29 (29.3%) |
| High School Diploma | 95 (100.0%) | 0 (0.0%) |
| College/Associate Degree | 239 (88.8%) | 30 (11.2%) |
| Bachelor's Degree or higher | 331 (100.0%) | 0 (0.0%) |
Occupancy by Age of Householder in Crompond
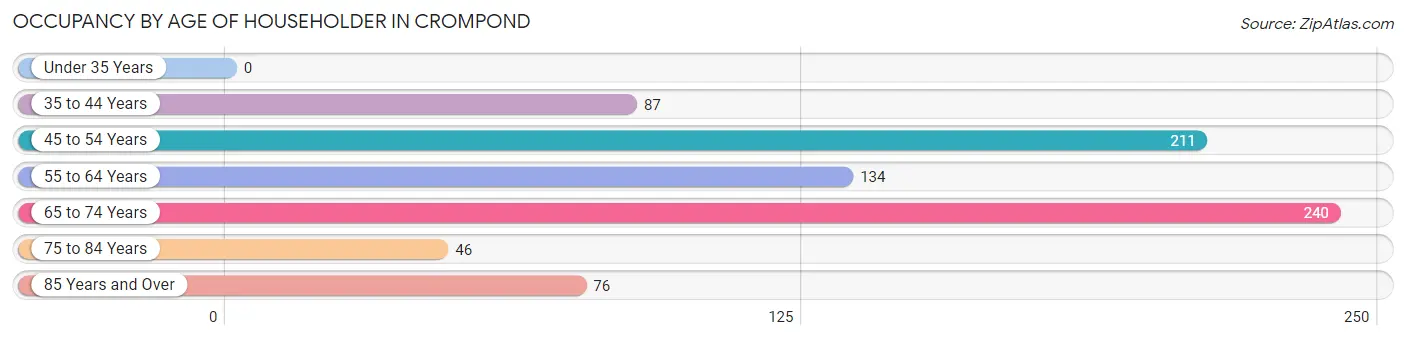
| Age Bracket | # Households | % Households |
| Under 35 Years | 0 | 0.0% |
| 35 to 44 Years | 87 | 11.0% |
| 45 to 54 Years | 211 | 26.6% |
| 55 to 64 Years | 134 | 16.9% |
| 65 to 74 Years | 240 | 30.2% |
| 75 to 84 Years | 46 | 5.8% |
| 85 Years and Over | 76 | 9.6% |
| Total | 794 | 100.0% |
Housing Finances in Crompond
Median Income by Occupancy in Crompond
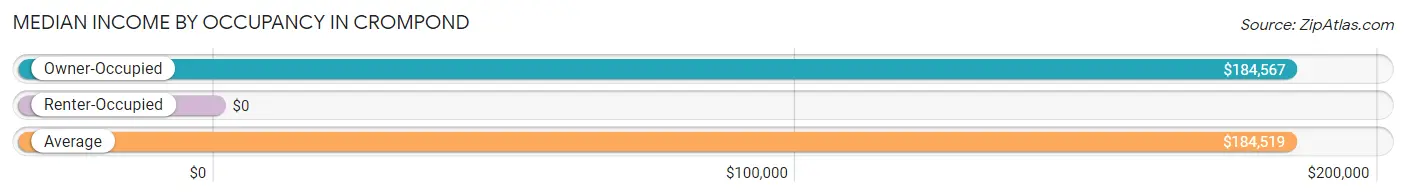
| Occupancy Type | # Households | Median Income |
| Owner-Occupied | 735 (92.6%) | $184,567 |
| Renter-Occupied | 59 (7.4%) | $0 |
| Average | 794 (100.0%) | $184,519 |
Occupancy by Householder Income Bracket in Crompond
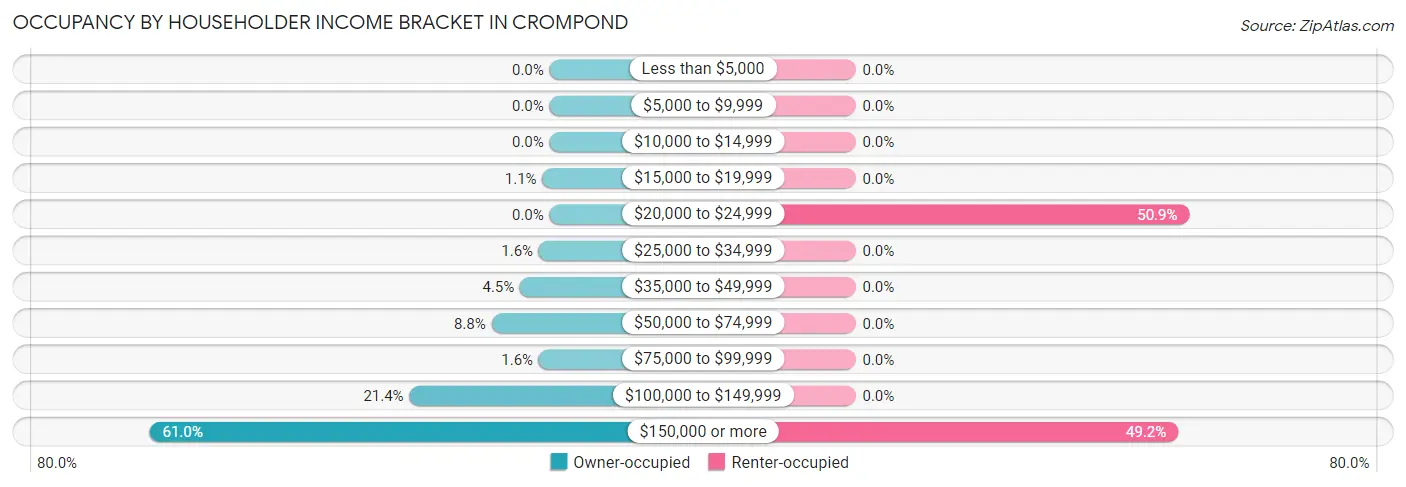
| Income Bracket | Owner-occupied | Renter-occupied |
| Less than $5,000 | 0 (0.0%) | 0 (0.0%) |
| $5,000 to $9,999 | 0 (0.0%) | 0 (0.0%) |
| $10,000 to $14,999 | 0 (0.0%) | 0 (0.0%) |
| $15,000 to $19,999 | 8 (1.1%) | 0 (0.0%) |
| $20,000 to $24,999 | 0 (0.0%) | 30 (50.8%) |
| $25,000 to $34,999 | 12 (1.6%) | 0 (0.0%) |
| $35,000 to $49,999 | 33 (4.5%) | 0 (0.0%) |
| $50,000 to $74,999 | 65 (8.8%) | 0 (0.0%) |
| $75,000 to $99,999 | 12 (1.6%) | 0 (0.0%) |
| $100,000 to $149,999 | 157 (21.4%) | 0 (0.0%) |
| $150,000 or more | 448 (61.0%) | 29 (49.1%) |
| Total | 735 (100.0%) | 59 (100.0%) |
Monthly Housing Cost Tiers in Crompond
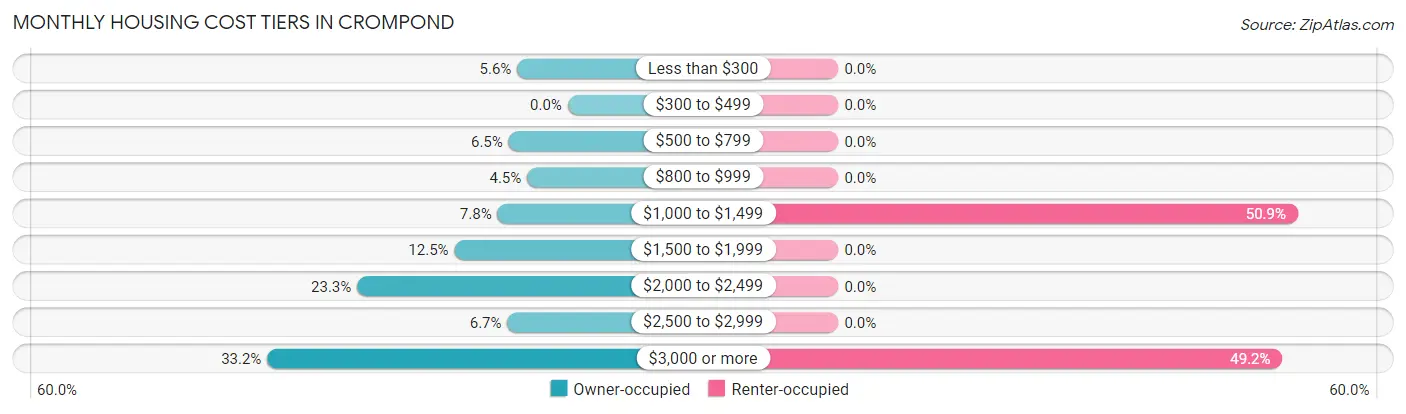
| Monthly Cost | Owner-occupied | Renter-occupied |
| Less than $300 | 41 (5.6%) | 0 (0.0%) |
| $300 to $499 | 0 (0.0%) | 0 (0.0%) |
| $500 to $799 | 48 (6.5%) | 0 (0.0%) |
| $800 to $999 | 33 (4.5%) | 0 (0.0%) |
| $1,000 to $1,499 | 57 (7.8%) | 30 (50.8%) |
| $1,500 to $1,999 | 92 (12.5%) | 0 (0.0%) |
| $2,000 to $2,499 | 171 (23.3%) | 0 (0.0%) |
| $2,500 to $2,999 | 49 (6.7%) | 0 (0.0%) |
| $3,000 or more | 244 (33.2%) | 29 (49.1%) |
| Total | 735 (100.0%) | 59 (100.0%) |
Physical Housing Characteristics in Crompond
Housing Structures in Crompond
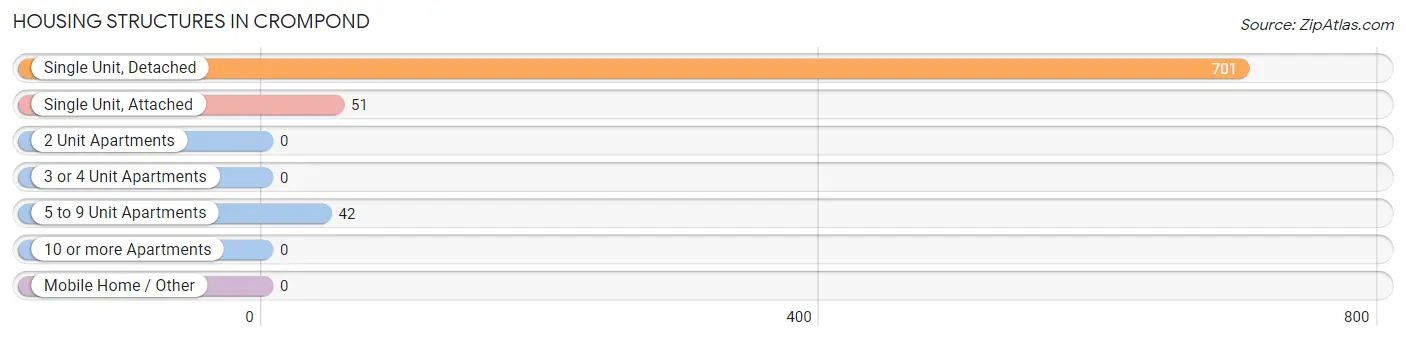
| Structure Type | # Housing Units | % Housing Units |
| Single Unit, Detached | 701 | 88.3% |
| Single Unit, Attached | 51 | 6.4% |
| 2 Unit Apartments | 0 | 0.0% |
| 3 or 4 Unit Apartments | 0 | 0.0% |
| 5 to 9 Unit Apartments | 42 | 5.3% |
| 10 or more Apartments | 0 | 0.0% |
| Mobile Home / Other | 0 | 0.0% |
| Total | 794 | 100.0% |
Housing Structures by Occupancy in Crompond
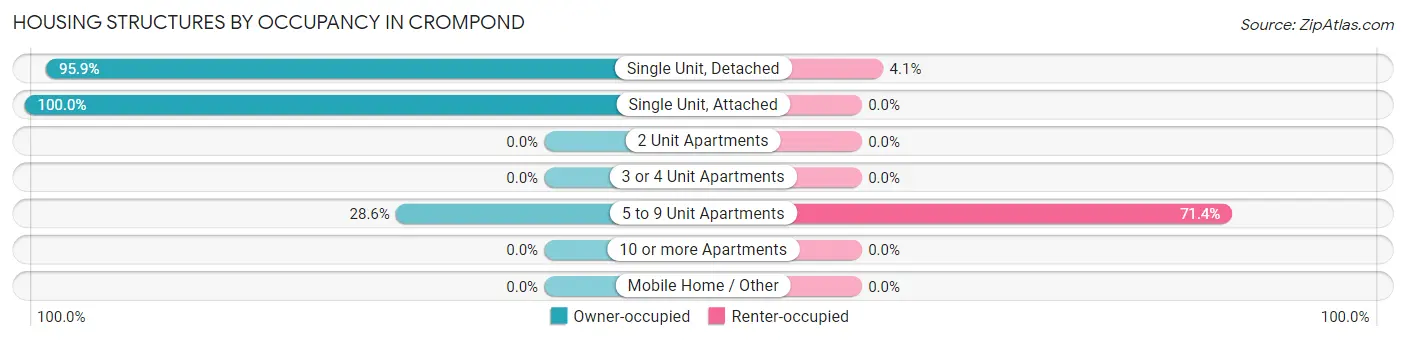
| Structure Type | Owner-occupied | Renter-occupied |
| Single Unit, Detached | 672 (95.9%) | 29 (4.1%) |
| Single Unit, Attached | 51 (100.0%) | 0 (0.0%) |
| 2 Unit Apartments | 0 (0.0%) | 0 (0.0%) |
| 3 or 4 Unit Apartments | 0 (0.0%) | 0 (0.0%) |
| 5 to 9 Unit Apartments | 12 (28.6%) | 30 (71.4%) |
| 10 or more Apartments | 0 (0.0%) | 0 (0.0%) |
| Mobile Home / Other | 0 (0.0%) | 0 (0.0%) |
| Total | 735 (92.6%) | 59 (7.4%) |
Housing Structures by Number of Rooms in Crompond
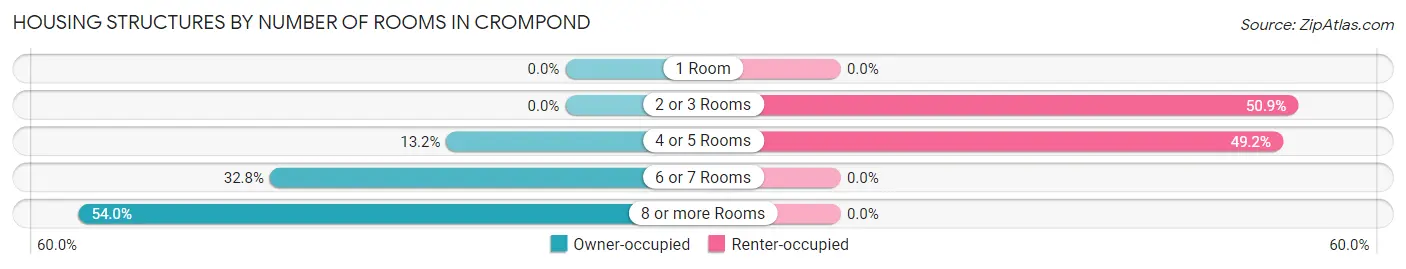
| Number of Rooms | Owner-occupied | Renter-occupied |
| 1 Room | 0 (0.0%) | 0 (0.0%) |
| 2 or 3 Rooms | 0 (0.0%) | 30 (50.8%) |
| 4 or 5 Rooms | 97 (13.2%) | 29 (49.1%) |
| 6 or 7 Rooms | 241 (32.8%) | 0 (0.0%) |
| 8 or more Rooms | 397 (54.0%) | 0 (0.0%) |
| Total | 735 (100.0%) | 59 (100.0%) |
Housing Structure by Heating Type in Crompond

| Heating Type | Owner-occupied | Renter-occupied |
| Utility Gas | 228 (31.0%) | 0 (0.0%) |
| Bottled, Tank, or LP Gas | 0 (0.0%) | 0 (0.0%) |
| Electricity | 13 (1.8%) | 30 (50.8%) |
| Fuel Oil or Kerosene | 482 (65.6%) | 29 (49.1%) |
| Coal or Coke | 0 (0.0%) | 0 (0.0%) |
| All other Fuels | 12 (1.6%) | 0 (0.0%) |
| No Fuel Used | 0 (0.0%) | 0 (0.0%) |
| Total | 735 (100.0%) | 59 (100.0%) |
Household Vehicle Usage in Crompond
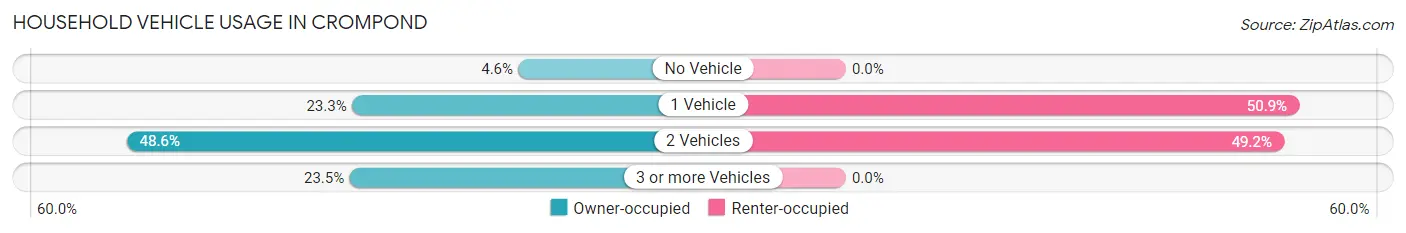
| Vehicles per Household | Owner-occupied | Renter-occupied |
| No Vehicle | 34 (4.6%) | 0 (0.0%) |
| 1 Vehicle | 171 (23.3%) | 30 (50.8%) |
| 2 Vehicles | 357 (48.6%) | 29 (49.1%) |
| 3 or more Vehicles | 173 (23.5%) | 0 (0.0%) |
| Total | 735 (100.0%) | 59 (100.0%) |
Real Estate & Mortgages in Crompond
Real Estate and Mortgage Overview in Crompond
| Characteristic | Without Mortgage | With Mortgage |
| Housing Units | 432 | 303 |
| Median Property Value | $460,400 | $661,200 |
| Median Household Income | $169,375 | $209 |
| Monthly Housing Costs | $1,501 | $231 |
| Real Estate Taxes | $10,001 | $0 |
Property Value by Mortgage Status in Crompond
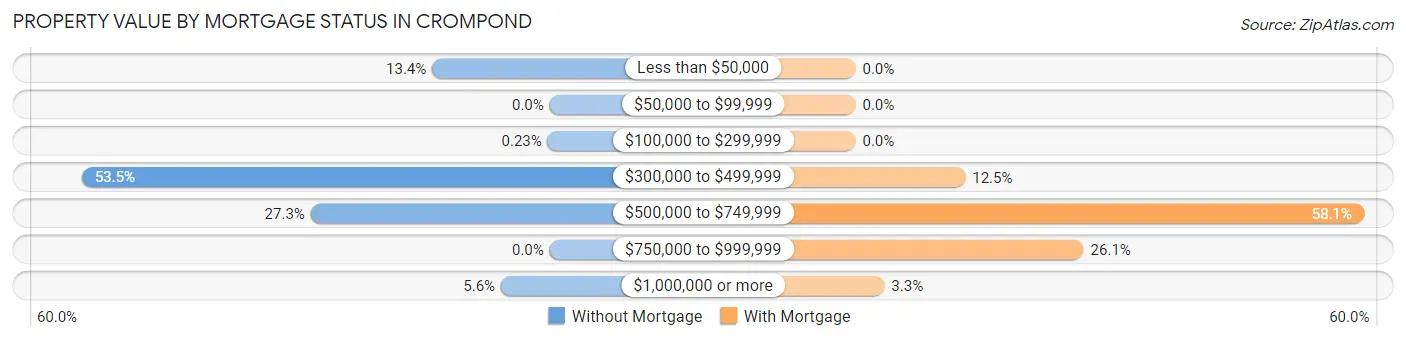
| Property Value | Without Mortgage | With Mortgage |
| Less than $50,000 | 58 (13.4%) | 0 (0.0%) |
| $50,000 to $99,999 | 0 (0.0%) | 0 (0.0%) |
| $100,000 to $299,999 | 1 (0.2%) | 0 (0.0%) |
| $300,000 to $499,999 | 231 (53.5%) | 38 (12.5%) |
| $500,000 to $749,999 | 118 (27.3%) | 176 (58.1%) |
| $750,000 to $999,999 | 0 (0.0%) | 79 (26.1%) |
| $1,000,000 or more | 24 (5.6%) | 10 (3.3%) |
| Total | 432 (100.0%) | 303 (100.0%) |
Household Income by Mortgage Status in Crompond
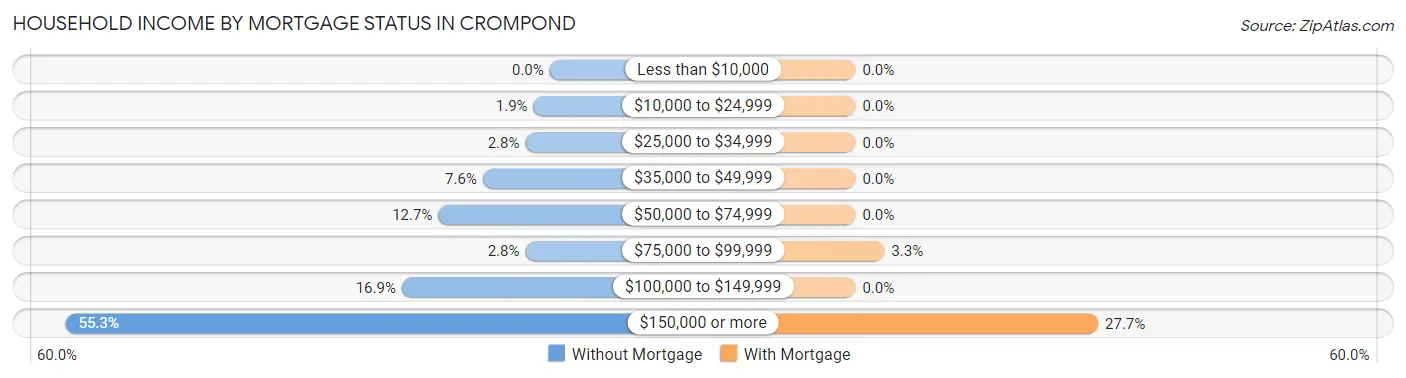
| Household Income | Without Mortgage | With Mortgage |
| Less than $10,000 | 0 (0.0%) | 0 (0.0%) |
| $10,000 to $24,999 | 8 (1.8%) | 0 (0.0%) |
| $25,000 to $34,999 | 12 (2.8%) | 0 (0.0%) |
| $35,000 to $49,999 | 33 (7.6%) | 0 (0.0%) |
| $50,000 to $74,999 | 55 (12.7%) | 0 (0.0%) |
| $75,000 to $99,999 | 12 (2.8%) | 10 (3.3%) |
| $100,000 to $149,999 | 73 (16.9%) | 0 (0.0%) |
| $150,000 or more | 239 (55.3%) | 84 (27.7%) |
| Total | 432 (100.0%) | 303 (100.0%) |
Property Value to Household Income Ratio in Crompond
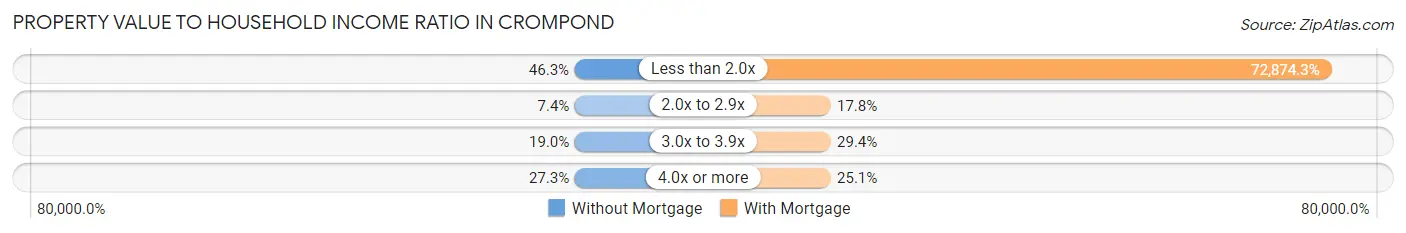
| Value-to-Income Ratio | Without Mortgage | With Mortgage |
| Less than 2.0x | 200 (46.3%) | 220,809 (72,874.3%) |
| 2.0x to 2.9x | 32 (7.4%) | 54 (17.8%) |
| 3.0x to 3.9x | 82 (19.0%) | 89 (29.4%) |
| 4.0x or more | 118 (27.3%) | 76 (25.1%) |
| Total | 432 (100.0%) | 303 (100.0%) |
Real Estate Taxes by Mortgage Status in Crompond
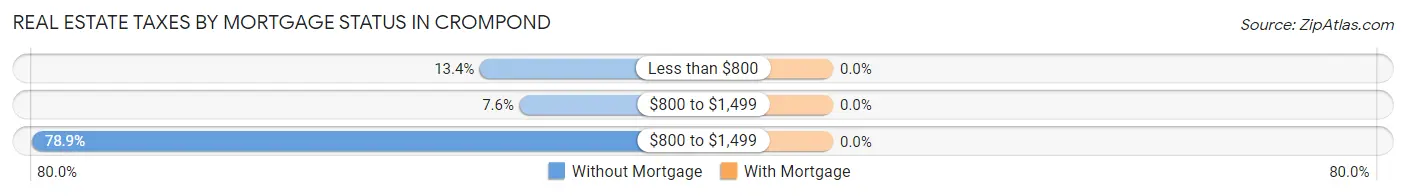
| Property Taxes | Without Mortgage | With Mortgage |
| Less than $800 | 58 (13.4%) | 0 (0.0%) |
| $800 to $1,499 | 33 (7.6%) | 0 (0.0%) |
| $800 to $1,499 | 341 (78.9%) | 0 (0.0%) |
| Total | 432 (100.0%) | 303 (100.0%) |
Health & Disability in Crompond
Health Insurance Coverage by Age in Crompond
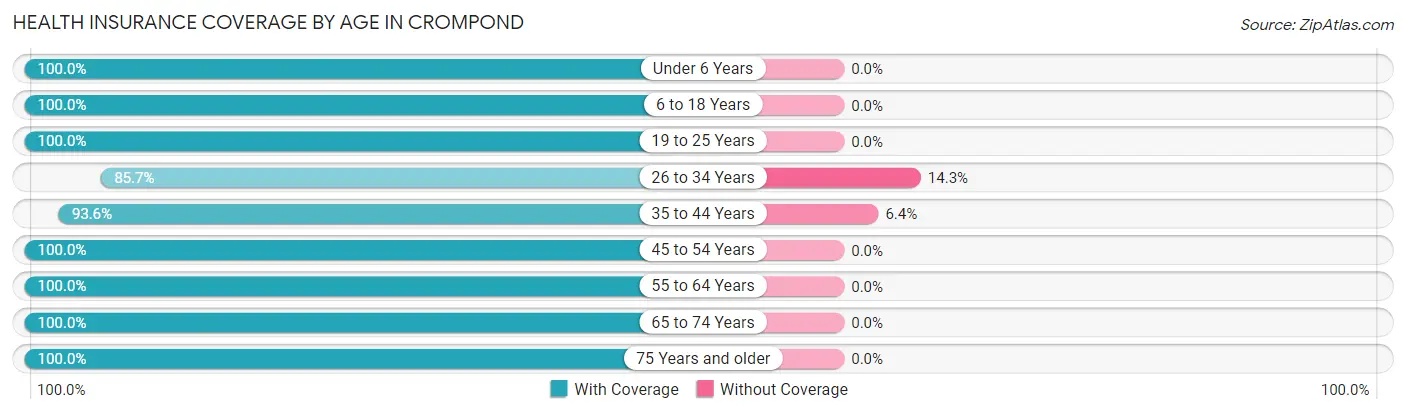
| Age Bracket | With Coverage | Without Coverage |
| Under 6 Years | 75 (100.0%) | 0 (0.0%) |
| 6 to 18 Years | 504 (100.0%) | 0 (0.0%) |
| 19 to 25 Years | 66 (100.0%) | 0 (0.0%) |
| 26 to 34 Years | 72 (85.7%) | 12 (14.3%) |
| 35 to 44 Years | 176 (93.6%) | 12 (6.4%) |
| 45 to 54 Years | 321 (100.0%) | 0 (0.0%) |
| 55 to 64 Years | 302 (100.0%) | 0 (0.0%) |
| 65 to 74 Years | 431 (100.0%) | 0 (0.0%) |
| 75 Years and older | 142 (100.0%) | 0 (0.0%) |
| Total | 2,089 (98.9%) | 24 (1.1%) |
Health Insurance Coverage by Citizenship Status in Crompond
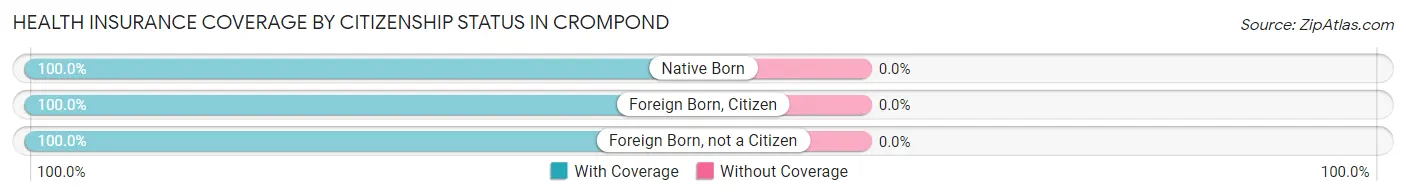
| Citizenship Status | With Coverage | Without Coverage |
| Native Born | 75 (100.0%) | 0 (0.0%) |
| Foreign Born, Citizen | 504 (100.0%) | 0 (0.0%) |
| Foreign Born, not a Citizen | 66 (100.0%) | 0 (0.0%) |
Health Insurance Coverage by Household Income in Crompond
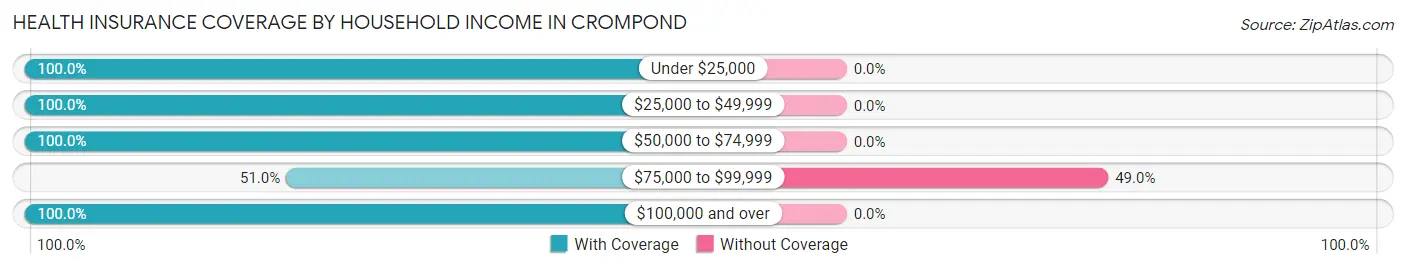
| Household Income | With Coverage | Without Coverage |
| Under $25,000 | 55 (100.0%) | 0 (0.0%) |
| $25,000 to $49,999 | 45 (100.0%) | 0 (0.0%) |
| $50,000 to $74,999 | 73 (100.0%) | 0 (0.0%) |
| $75,000 to $99,999 | 25 (51.0%) | 24 (49.0%) |
| $100,000 and over | 1,855 (100.0%) | 0 (0.0%) |
Public vs Private Health Insurance Coverage by Age in Crompond
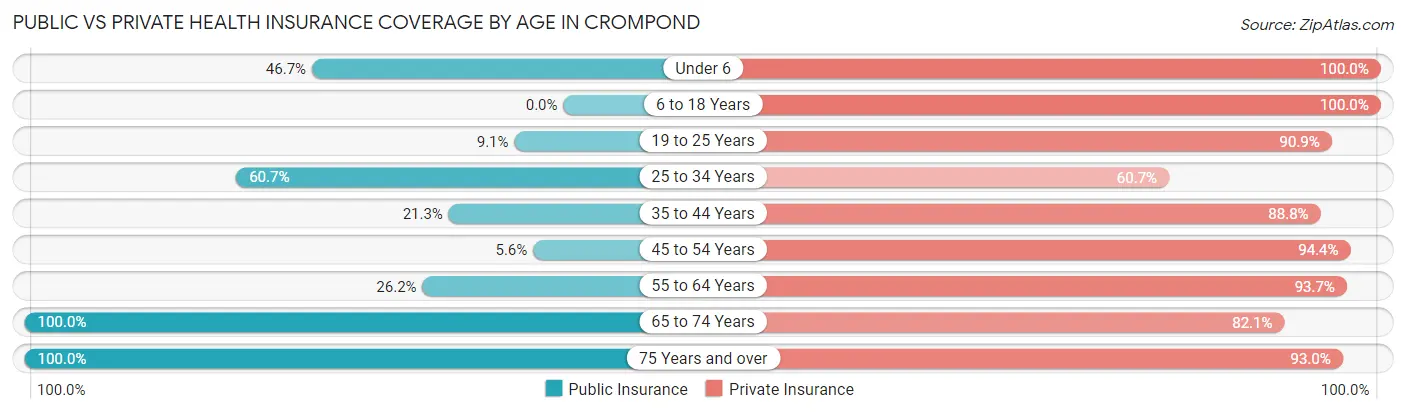
| Age Bracket | Public Insurance | Private Insurance |
| Under 6 | 35 (46.7%) | 75 (100.0%) |
| 6 to 18 Years | 0 (0.0%) | 504 (100.0%) |
| 19 to 25 Years | 6 (9.1%) | 60 (90.9%) |
| 25 to 34 Years | 51 (60.7%) | 51 (60.7%) |
| 35 to 44 Years | 40 (21.3%) | 167 (88.8%) |
| 45 to 54 Years | 18 (5.6%) | 303 (94.4%) |
| 55 to 64 Years | 79 (26.2%) | 283 (93.7%) |
| 65 to 74 Years | 431 (100.0%) | 354 (82.1%) |
| 75 Years and over | 142 (100.0%) | 132 (93.0%) |
| Total | 802 (38.0%) | 1,929 (91.3%) |
Disability Status by Sex by Age in Crompond
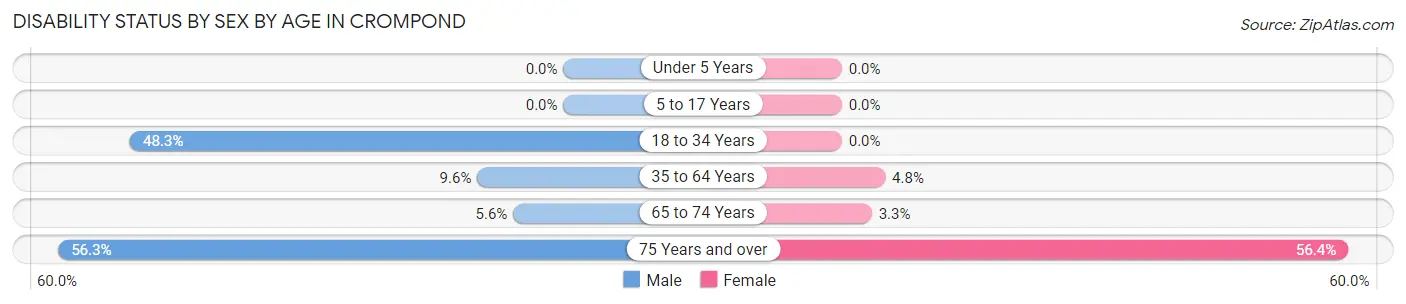
| Age Bracket | Male | Female |
| Under 5 Years | 0 (0.0%) | 0 (0.0%) |
| 5 to 17 Years | 0 (0.0%) | 0 (0.0%) |
| 18 to 34 Years | 55 (48.2%) | 0 (0.0%) |
| 35 to 64 Years | 42 (9.6%) | 18 (4.8%) |
| 65 to 74 Years | 9 (5.6%) | 9 (3.3%) |
| 75 Years and over | 27 (56.2%) | 53 (56.4%) |
Disability Class by Sex by Age in Crompond
Disability Class: Hearing Difficulty
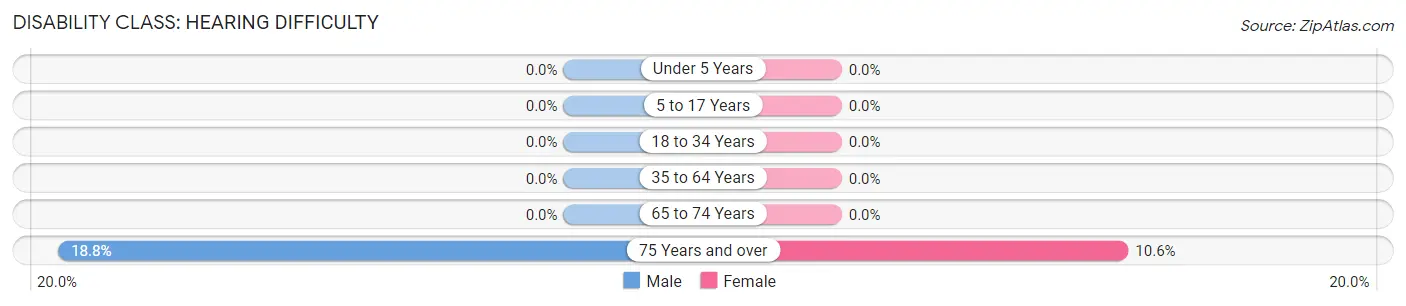
| Age Bracket | Male | Female |
| Under 5 Years | 0 (0.0%) | 0 (0.0%) |
| 5 to 17 Years | 0 (0.0%) | 0 (0.0%) |
| 18 to 34 Years | 0 (0.0%) | 0 (0.0%) |
| 35 to 64 Years | 0 (0.0%) | 0 (0.0%) |
| 65 to 74 Years | 0 (0.0%) | 0 (0.0%) |
| 75 Years and over | 9 (18.8%) | 10 (10.6%) |
Disability Class: Vision Difficulty
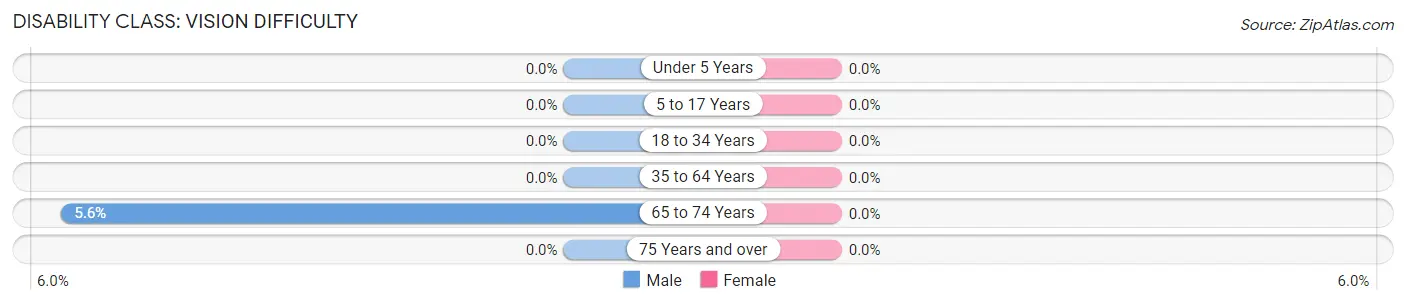
| Age Bracket | Male | Female |
| Under 5 Years | 0 (0.0%) | 0 (0.0%) |
| 5 to 17 Years | 0 (0.0%) | 0 (0.0%) |
| 18 to 34 Years | 0 (0.0%) | 0 (0.0%) |
| 35 to 64 Years | 0 (0.0%) | 0 (0.0%) |
| 65 to 74 Years | 9 (5.6%) | 0 (0.0%) |
| 75 Years and over | 0 (0.0%) | 0 (0.0%) |
Disability Class: Cognitive Difficulty
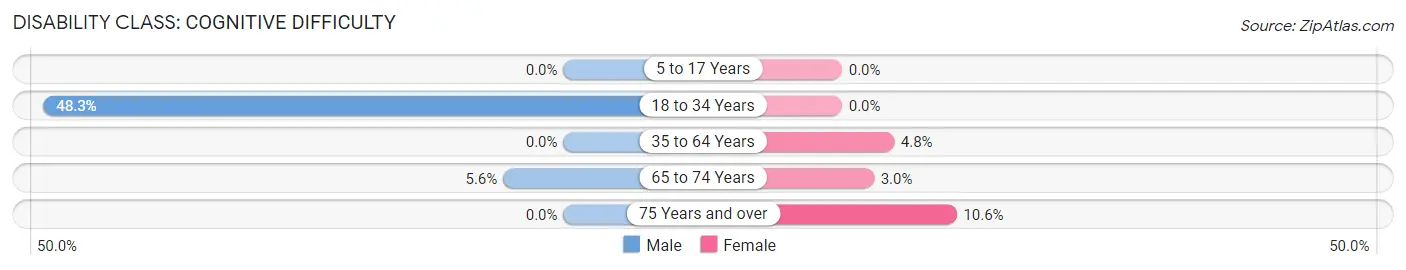
| Age Bracket | Male | Female |
| 5 to 17 Years | 0 (0.0%) | 0 (0.0%) |
| 18 to 34 Years | 55 (48.2%) | 0 (0.0%) |
| 35 to 64 Years | 0 (0.0%) | 18 (4.8%) |
| 65 to 74 Years | 9 (5.6%) | 8 (3.0%) |
| 75 Years and over | 0 (0.0%) | 10 (10.6%) |
Disability Class: Ambulatory Difficulty
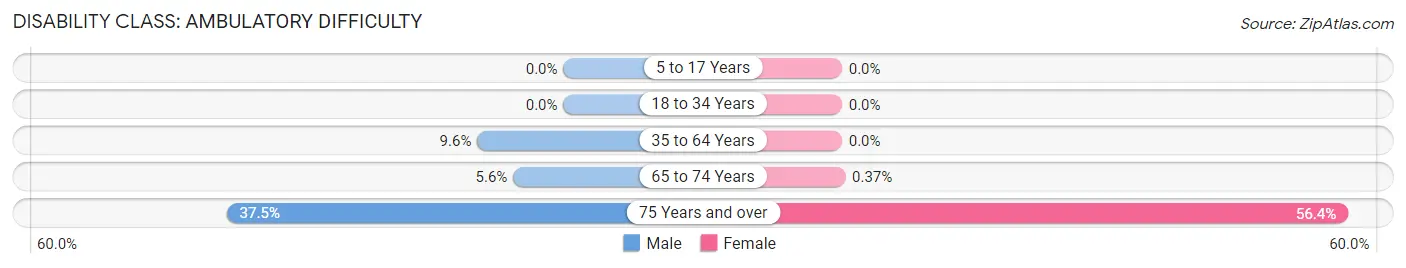
| Age Bracket | Male | Female |
| 5 to 17 Years | 0 (0.0%) | 0 (0.0%) |
| 18 to 34 Years | 0 (0.0%) | 0 (0.0%) |
| 35 to 64 Years | 42 (9.6%) | 0 (0.0%) |
| 65 to 74 Years | 9 (5.6%) | 1 (0.4%) |
| 75 Years and over | 18 (37.5%) | 53 (56.4%) |
Disability Class: Self-Care Difficulty
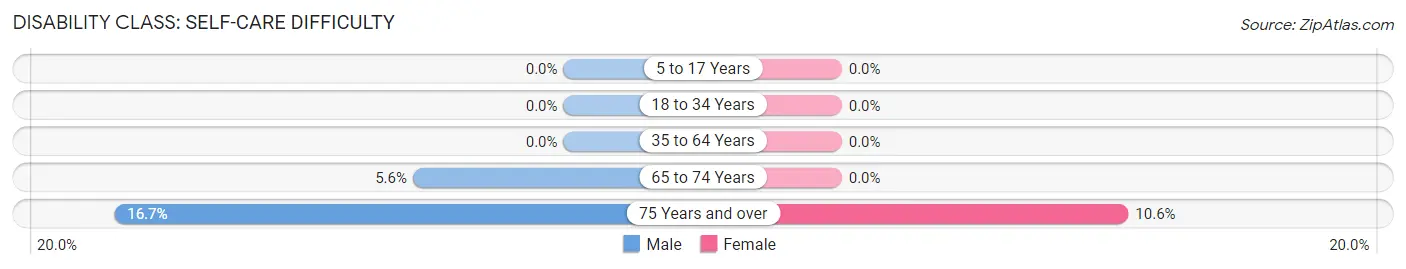
| Age Bracket | Male | Female |
| 5 to 17 Years | 0 (0.0%) | 0 (0.0%) |
| 18 to 34 Years | 0 (0.0%) | 0 (0.0%) |
| 35 to 64 Years | 0 (0.0%) | 0 (0.0%) |
| 65 to 74 Years | 9 (5.6%) | 0 (0.0%) |
| 75 Years and over | 8 (16.7%) | 10 (10.6%) |
Technology Access in Crompond
Computing Device Access in Crompond
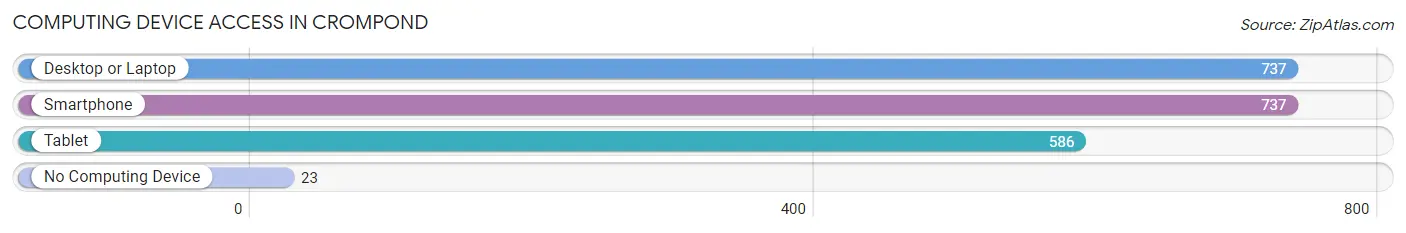
| Device Type | # Households | % Households |
| Desktop or Laptop | 737 | 92.8% |
| Smartphone | 737 | 92.8% |
| Tablet | 586 | 73.8% |
| No Computing Device | 23 | 2.9% |
| Total | 794 | 100.0% |
Internet Access in Crompond
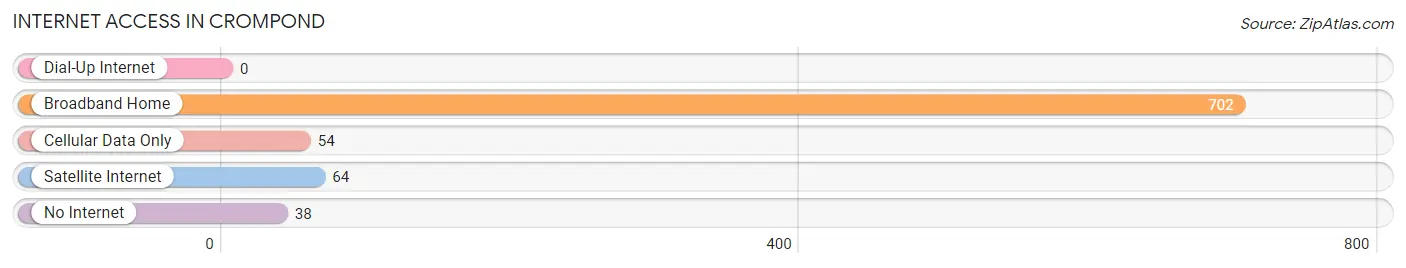
| Internet Type | # Households | % Households |
| Dial-Up Internet | 0 | 0.0% |
| Broadband Home | 702 | 88.4% |
| Cellular Data Only | 54 | 6.8% |
| Satellite Internet | 64 | 8.1% |
| No Internet | 38 | 4.8% |
| Total | 794 | 100.0% |
Crompond Summary
Crompond is a hamlet located in the town of Yorktown in Westchester County, New York. It is situated in the southeastern corner of the town, near the border with Putnam County. The hamlet is located on the east side of the Croton Reservoir, and is bordered by the hamlets of Granite Springs and Jefferson Valley.
History
The hamlet of Crompond was first settled in the late 1700s by the Crompond family, who were of Dutch descent. The family owned a large tract of land in the area, and the hamlet was named after them. The hamlet was originally known as Crompond Corners, and was a small farming community.
In the late 1800s, the hamlet began to grow as the railroad was extended to the area. The railroad brought new businesses and industries to the area, and the hamlet began to develop. The hamlet was officially incorporated in 1892.
In the early 1900s, the hamlet continued to grow and develop. The hamlet was home to a number of businesses, including a sawmill, a gristmill, a blacksmith shop, and a general store. The hamlet also had a post office, a school, and a church.
Geography
Crompond is located in the southeastern corner of the town of Yorktown, near the border with Putnam County. The hamlet is situated on the east side of the Croton Reservoir, and is bordered by the hamlets of Granite Springs and Jefferson Valley. The hamlet is located in the Hudson Valley region of New York, and is approximately 40 miles north of New York City.
The hamlet is located in a rural area, and is surrounded by forests and rolling hills. The hamlet is home to a number of parks and recreational areas, including the Croton Gorge Park, the Franklin D. Roosevelt State Park, and the Taconic State Park.
Economy
The economy of Crompond is largely based on agriculture and tourism. The hamlet is home to a number of farms, which produce a variety of crops, including corn, soybeans, and hay. The hamlet is also home to a number of wineries, which produce a variety of wines.
The hamlet is also home to a number of businesses, including restaurants, retail stores, and professional services. The hamlet is also home to a number of bed and breakfasts, which attract tourists from around the region.
Demographics
As of the 2010 census, the population of Crompond was 1,845. The population is largely white (94.3%), with a small percentage of African Americans (2.2%) and Hispanics (2.5%). The median household income in the hamlet is $90,000, and the median home value is $400,000. The hamlet is home to a number of churches, including the Crompond Presbyterian Church and the Crompond United Methodist Church.
Common Questions
What is Per Capita Income in Crompond?
Per Capita income in Crompond is $71,906.
What is the Median Family Income in Crompond?
Median Family Income in Crompond is $212,344.
What is the Median Household income in Crompond?
Median Household Income in Crompond is $184,519.
What is Income or Wage Gap in Crompond?
Income or Wage Gap in Crompond is 18.5%.
Women in Crompond earn 81.5 cents for every dollar earned by a man.
What is Inequality or Gini Index in Crompond?
Inequality or Gini Index in Crompond is 0.35.
What is the Total Population of Crompond?
Total Population of Crompond is 2,211.
What is the Total Male Population of Crompond?
Total Male Population of Crompond is 1,051.
What is the Total Female Population of Crompond?
Total Female Population of Crompond is 1,160.
What is the Ratio of Males per 100 Females in Crompond?
There are 90.60 Males per 100 Females in Crompond.
What is the Ratio of Females per 100 Males in Crompond?
There are 110.37 Females per 100 Males in Crompond.
What is the Median Population Age in Crompond?
Median Population Age in Crompond is 51.4 Years.
What is the Average Family Size in Crompond
Average Family Size in Crompond is 3.1 People.
What is the Average Household Size in Crompond
Average Household Size in Crompond is 2.6 People.
How Large is the Labor Force in Crompond?
There are 1,014 People in the Labor Forcein in Crompond.
What is the Percentage of People in the Labor Force in Crompond?
56.5% of People are in the Labor Force in Crompond.
What is the Unemployment Rate in Crompond?
Unemployment Rate in Crompond is 7.3%.