Lincolndale, NY Map & Demographics
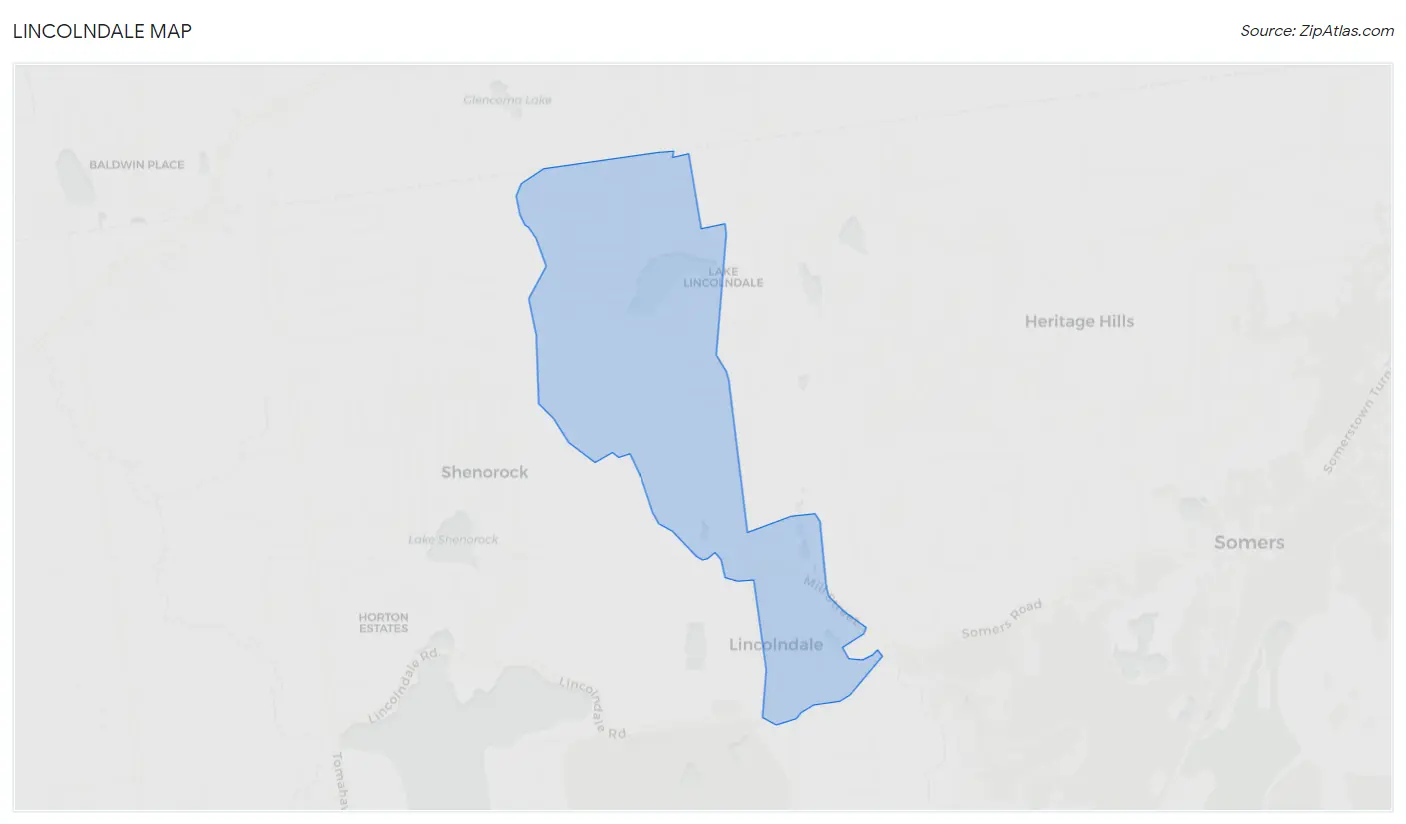
Lincolndale Map
Lincolndale Overview
$70,530
PER CAPITA INCOME
$217,917
AVG FAMILY INCOME
$152,222
AVG HOUSEHOLD INCOME
18.5%
WAGE / INCOME GAP [ % ]
81.5¢/ $1
WAGE / INCOME GAP [ $ ]
0.39
INEQUALITY / GINI INDEX
1,217
TOTAL POPULATION
537
MALE POPULATION
680
FEMALE POPULATION
78.97
MALES / 100 FEMALES
126.63
FEMALES / 100 MALES
42.9
MEDIAN AGE
3.1
AVG FAMILY SIZE
2.7
AVG HOUSEHOLD SIZE
772
LABOR FORCE [ PEOPLE ]
78.1%
PERCENT IN LABOR FORCE
Lincolndale Zip Codes
Lincolndale Area Codes
Income in Lincolndale
Income Overview in Lincolndale
Per Capita Income in Lincolndale is $70,530, while median incomes of families and households are $217,917 and $152,222 respectively.
| Characteristic | Number | Measure |
| Per Capita Income | 1,217 | $70,530 |
| Median Family Income | 335 | $217,917 |
| Mean Family Income | 335 | $198,344 |
| Median Household Income | 452 | $152,222 |
| Mean Household Income | 452 | $182,733 |
| Income Deficit | 335 | $0 |
| Wage / Income Gap (%) | 1,217 | 18.48% |
| Wage / Income Gap ($) | 1,217 | 81.52¢ per $1 |
| Gini / Inequality Index | 1,217 | 0.39 |
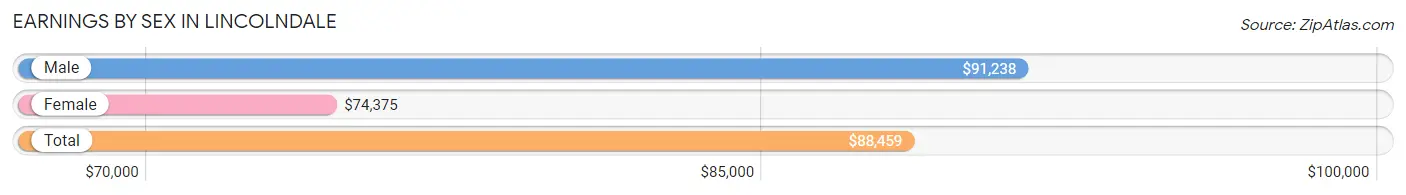
Earnings by Sex in Lincolndale
Average Earnings in Lincolndale are $88,459, $91,238 for men and $74,375 for women, a difference of 18.5%.
| Sex | Number | Average Earnings |
| Male | 365 (45.2%) | $91,238 |
| Female | 442 (54.8%) | $74,375 |
| Total | 807 (100.0%) | $88,459 |
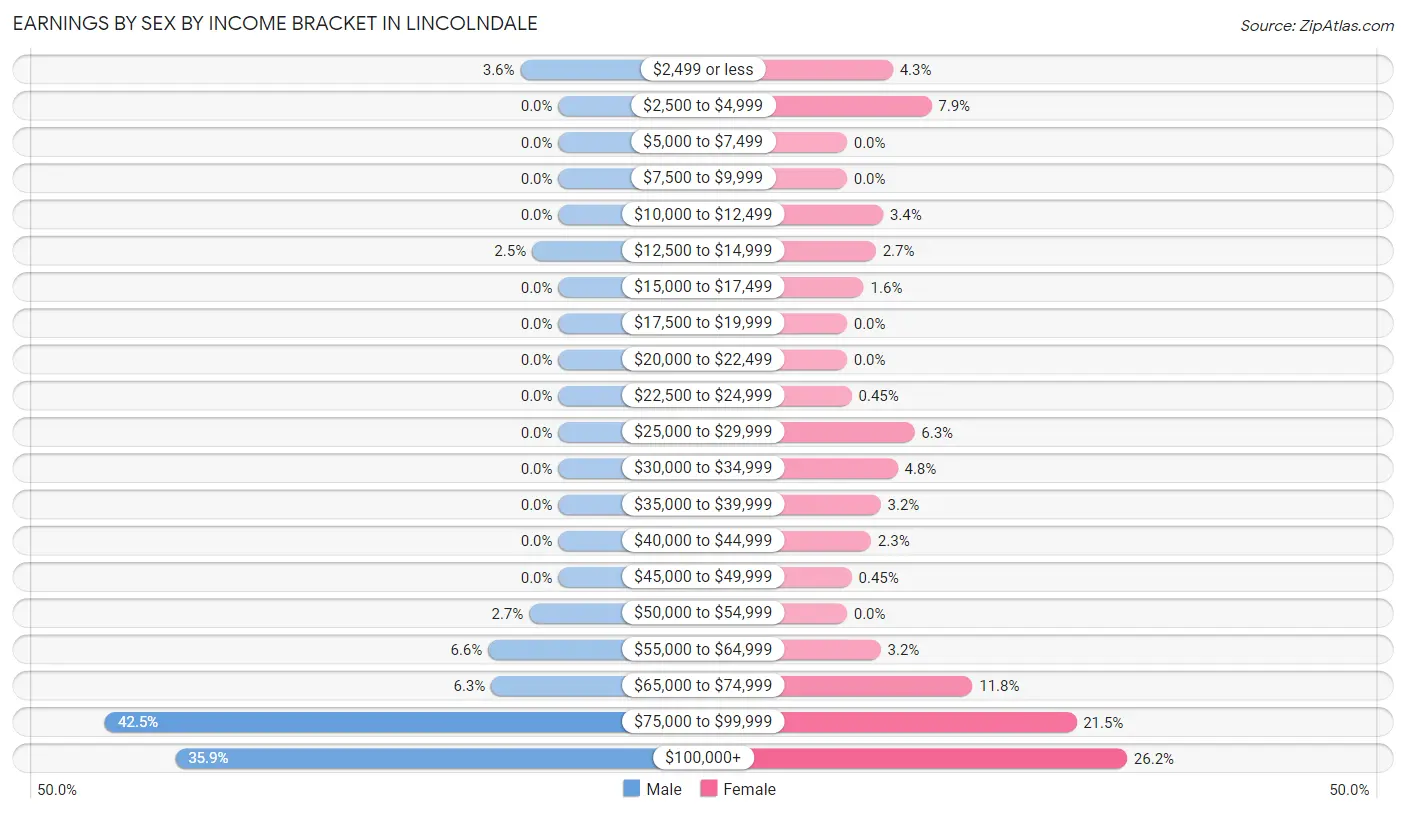
Earnings by Sex by Income Bracket in Lincolndale
The most common earnings brackets in Lincolndale are $75,000 to $99,999 for men (155 | 42.5%) and $100,000+ for women (116 | 26.2%).
| Income | Male | Female |
| $2,499 or less | 13 (3.6%) | 19 (4.3%) |
| $2,500 to $4,999 | 0 (0.0%) | 35 (7.9%) |
| $5,000 to $7,499 | 0 (0.0%) | 0 (0.0%) |
| $7,500 to $9,999 | 0 (0.0%) | 0 (0.0%) |
| $10,000 to $12,499 | 0 (0.0%) | 15 (3.4%) |
| $12,500 to $14,999 | 9 (2.5%) | 12 (2.7%) |
| $15,000 to $17,499 | 0 (0.0%) | 7 (1.6%) |
| $17,500 to $19,999 | 0 (0.0%) | 0 (0.0%) |
| $20,000 to $22,499 | 0 (0.0%) | 0 (0.0%) |
| $22,500 to $24,999 | 0 (0.0%) | 2 (0.4%) |
| $25,000 to $29,999 | 0 (0.0%) | 28 (6.3%) |
| $30,000 to $34,999 | 0 (0.0%) | 21 (4.8%) |
| $35,000 to $39,999 | 0 (0.0%) | 14 (3.2%) |
| $40,000 to $44,999 | 0 (0.0%) | 10 (2.3%) |
| $45,000 to $49,999 | 0 (0.0%) | 2 (0.4%) |
| $50,000 to $54,999 | 10 (2.7%) | 0 (0.0%) |
| $55,000 to $64,999 | 24 (6.6%) | 14 (3.2%) |
| $65,000 to $74,999 | 23 (6.3%) | 52 (11.8%) |
| $75,000 to $99,999 | 155 (42.5%) | 95 (21.5%) |
| $100,000+ | 131 (35.9%) | 116 (26.2%) |
| Total | 365 (100.0%) | 442 (100.0%) |
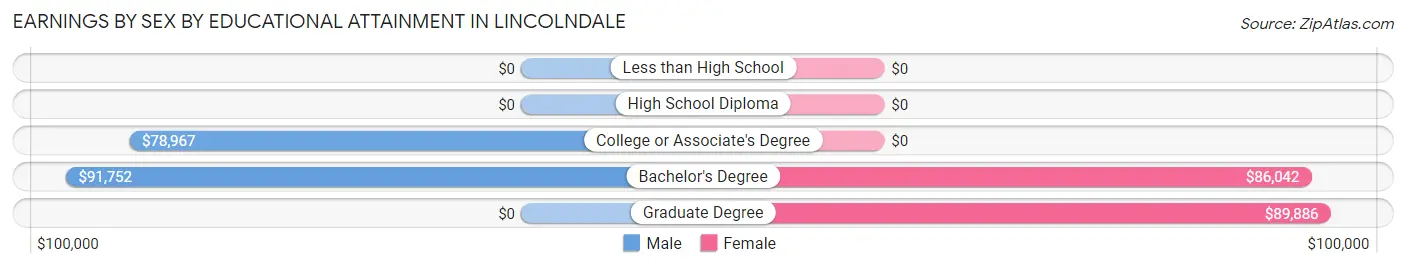
Earnings by Sex by Educational Attainment in Lincolndale
Average earnings in Lincolndale are $91,679 for men and $76,458 for women, a difference of 16.6%. Men with an educational attainment of bachelor's degree enjoy the highest average annual earnings of $91,752, while those with college or associate's degree education earn the least with $78,967. Women with an educational attainment of graduate degree earn the most with the average annual earnings of $89,886, while those with bachelor's degree education have the smallest earnings of $86,042.
| Educational Attainment | Male Income | Female Income |
| Less than High School | - | - |
| High School Diploma | - | - |
| College or Associate's Degree | $78,967 | $0 |
| Bachelor's Degree | $91,752 | $86,042 |
| Graduate Degree | - | - |
| Total | $91,679 | $76,458 |
Family Income in Lincolndale
Family Income Brackets in Lincolndale
According to the Lincolndale family income data, there are 170 families falling into the $200,000+ income range, which is the most common income bracket and makes up 50.7% of all families.
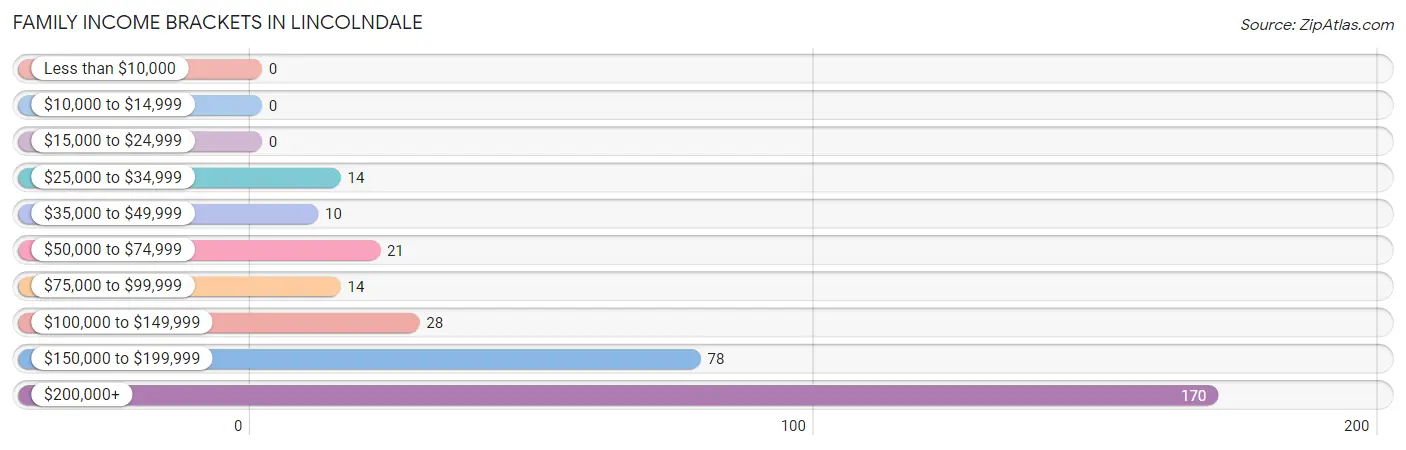
| Income Bracket | # Families | % Families |
| Less than $10,000 | 0 | 0.0% |
| $10,000 to $14,999 | 0 | 0.0% |
| $15,000 to $24,999 | 0 | 0.0% |
| $25,000 to $34,999 | 14 | 4.2% |
| $35,000 to $49,999 | 10 | 3.0% |
| $50,000 to $74,999 | 21 | 6.3% |
| $75,000 to $99,999 | 14 | 4.2% |
| $100,000 to $149,999 | 28 | 8.4% |
| $150,000 to $199,999 | 78 | 23.3% |
| $200,000+ | 170 | 50.7% |
Family Income by Famaliy Size in Lincolndale
3-person families (130 | 38.8%) account for the highest median family income in Lincolndale with $228,333 per family, while 3-person families (130 | 38.8%) have the highest median income of $76,111 per family member.
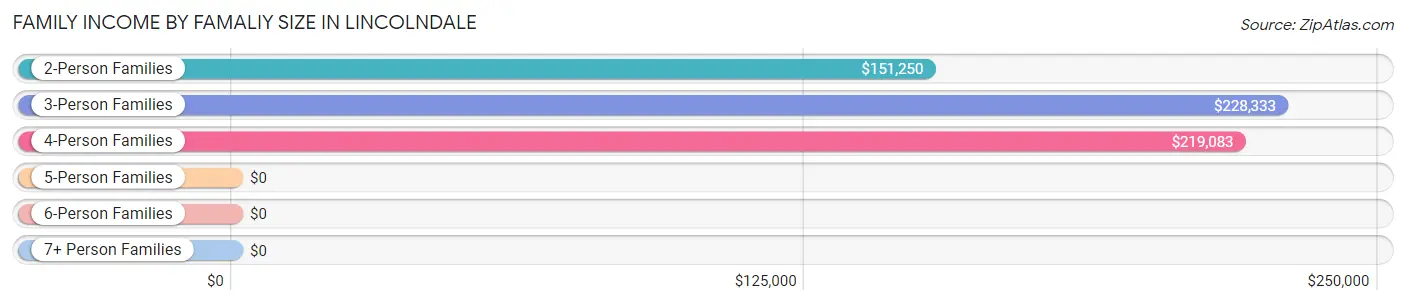
| Income Bracket | # Families | Median Income |
| 2-Person Families | 114 (34.0%) | $151,250 |
| 3-Person Families | 130 (38.8%) | $228,333 |
| 4-Person Families | 79 (23.6%) | $219,083 |
| 5-Person Families | 10 (3.0%) | $0 |
| 6-Person Families | 2 (0.6%) | $0 |
| 7+ Person Families | 0 (0.0%) | $0 |
| Total | 335 (100.0%) | $217,917 |
Family Income by Number of Earners in Lincolndale
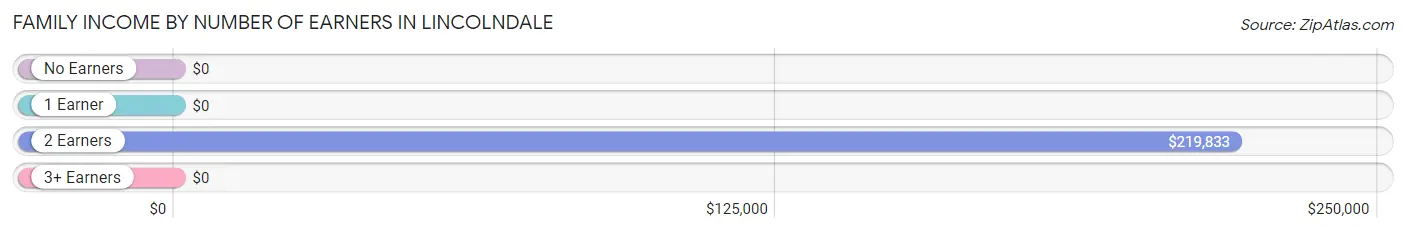
| Number of Earners | # Families | Median Income |
| No Earners | 21 (6.3%) | $0 |
| 1 Earner | 36 (10.7%) | $0 |
| 2 Earners | 198 (59.1%) | $219,833 |
| 3+ Earners | 80 (23.9%) | $0 |
| Total | 335 (100.0%) | $217,917 |
Household Income in Lincolndale
Household Income Brackets in Lincolndale
With 182 households falling in the category, the $200,000+ income range is the most frequent in Lincolndale, accounting for 40.3% of all households.
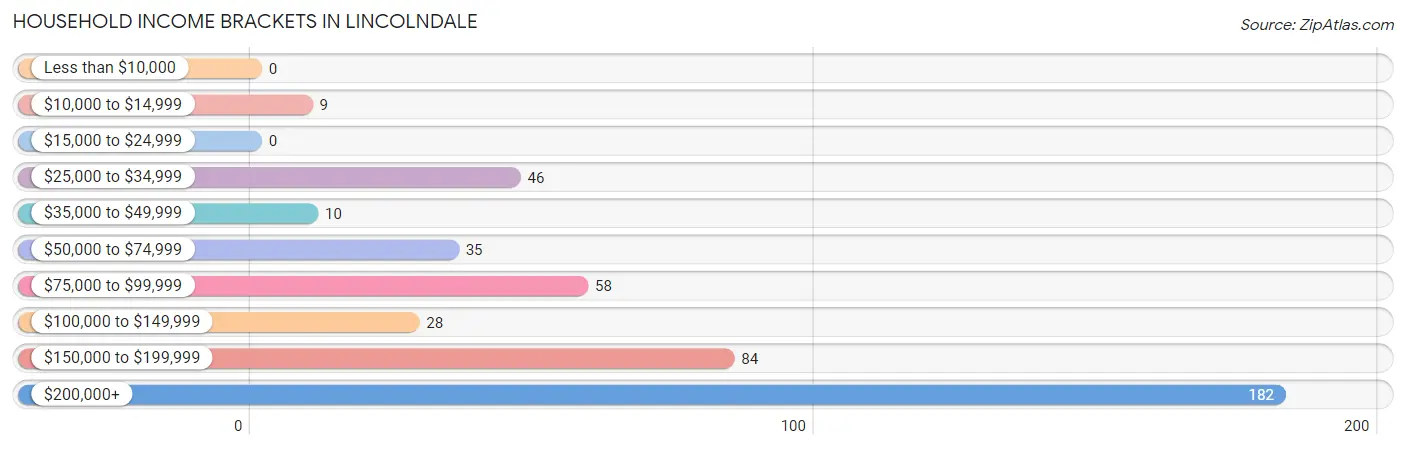
| Income Bracket | # Households | % Households |
| Less than $10,000 | 0 | 0.0% |
| $10,000 to $14,999 | 9 | 2.0% |
| $15,000 to $24,999 | 0 | 0.0% |
| $25,000 to $34,999 | 46 | 10.2% |
| $35,000 to $49,999 | 10 | 2.2% |
| $50,000 to $74,999 | 35 | 7.7% |
| $75,000 to $99,999 | 58 | 12.8% |
| $100,000 to $149,999 | 28 | 6.2% |
| $150,000 to $199,999 | 84 | 18.6% |
| $200,000+ | 182 | 40.3% |
Household Income by Householder Age in Lincolndale
The median household income in Lincolndale is $152,222, with the highest median household income of $228,865 found in the 25 to 44 years age bracket for the primary householder. A total of 107 households (23.7%) fall into this category.
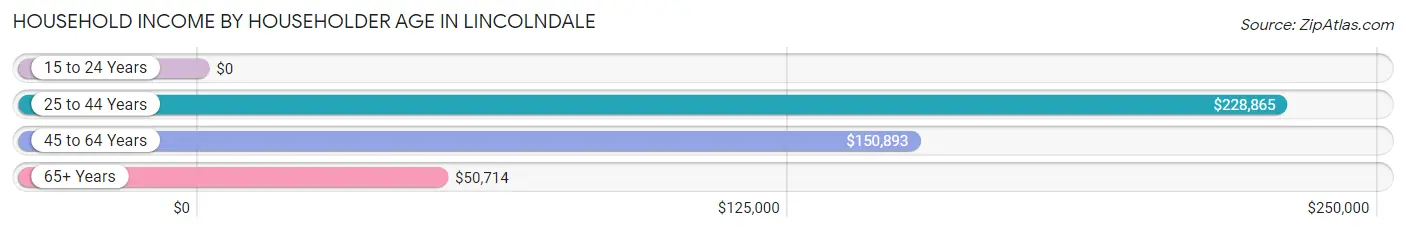
| Income Bracket | # Households | Median Income |
| 15 to 24 Years | 0 (0.0%) | $0 |
| 25 to 44 Years | 107 (23.7%) | $228,865 |
| 45 to 64 Years | 269 (59.5%) | $150,893 |
| 65+ Years | 76 (16.8%) | $50,714 |
| Total | 452 (100.0%) | $152,222 |
Poverty in Lincolndale
Income Below Poverty by Sex and Age in Lincolndale
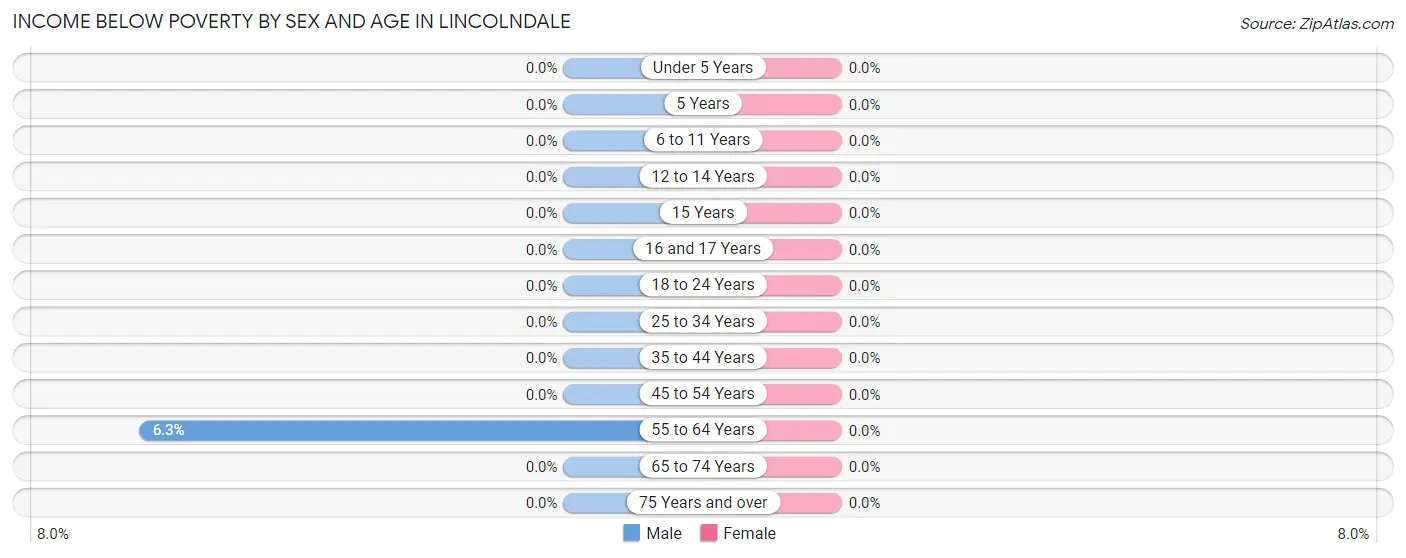
| Age Bracket | Male | Female |
| Under 5 Years | 0 (0.0%) | 0 (0.0%) |
| 5 Years | 0 (0.0%) | 0 (0.0%) |
| 6 to 11 Years | 0 (0.0%) | 0 (0.0%) |
| 12 to 14 Years | 0 (0.0%) | 0 (0.0%) |
| 15 Years | 0 (0.0%) | 0 (0.0%) |
| 16 and 17 Years | 0 (0.0%) | 0 (0.0%) |
| 18 to 24 Years | 0 (0.0%) | 0 (0.0%) |
| 25 to 34 Years | 0 (0.0%) | 0 (0.0%) |
| 35 to 44 Years | 0 (0.0%) | 0 (0.0%) |
| 45 to 54 Years | 0 (0.0%) | 0 (0.0%) |
| 55 to 64 Years | 9 (6.3%) | 0 (0.0%) |
| 65 to 74 Years | 0 (0.0%) | 0 (0.0%) |
| 75 Years and over | 0 (0.0%) | 0 (0.0%) |
| Total | 9 (1.7%) | 0 (0.0%) |
Income Above Poverty by Sex and Age in Lincolndale
According to the poverty statistics in Lincolndale, males aged under 5 years and females aged under 5 years are the age groups that are most secure financially, with 100.0% of males and 100.0% of females in these age groups living above the poverty line.
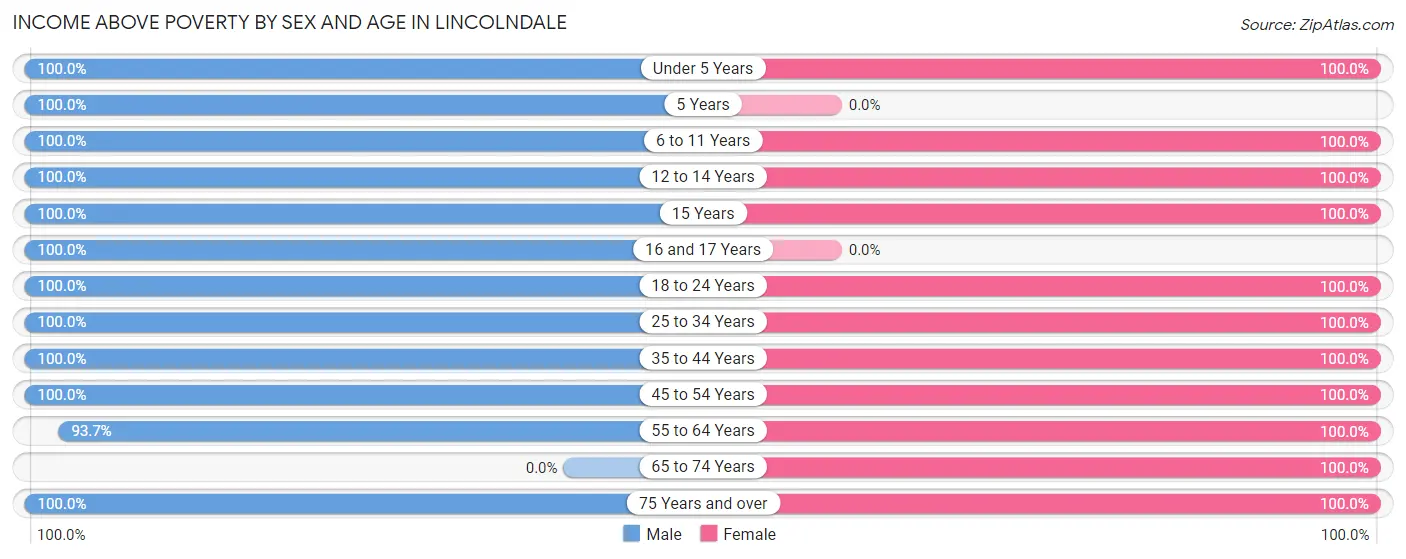
| Age Bracket | Male | Female |
| Under 5 Years | 6 (100.0%) | 1 (100.0%) |
| 5 Years | 11 (100.0%) | 0 (0.0%) |
| 6 to 11 Years | 58 (100.0%) | 48 (100.0%) |
| 12 to 14 Years | 11 (100.0%) | 41 (100.0%) |
| 15 Years | 16 (100.0%) | 14 (100.0%) |
| 16 and 17 Years | 24 (100.0%) | 0 (0.0%) |
| 18 to 24 Years | 42 (100.0%) | 34 (100.0%) |
| 25 to 34 Years | 24 (100.0%) | 65 (100.0%) |
| 35 to 44 Years | 131 (100.0%) | 107 (100.0%) |
| 45 to 54 Years | 60 (100.0%) | 136 (100.0%) |
| 55 to 64 Years | 134 (93.7%) | 134 (100.0%) |
| 65 to 74 Years | 0 (0.0%) | 67 (100.0%) |
| 75 Years and over | 11 (100.0%) | 11 (100.0%) |
| Total | 528 (98.3%) | 658 (100.0%) |
Income Below Poverty Among Married-Couple Families in Lincolndale
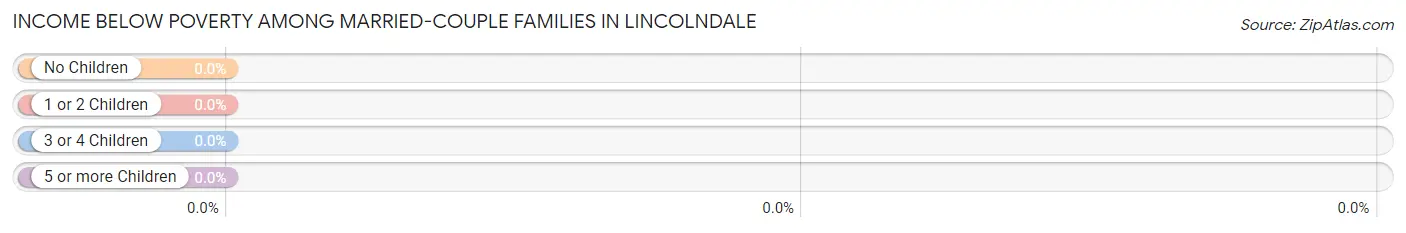
| Children | Above Poverty | Below Poverty |
| No Children | 134 (100.0%) | 0 (0.0%) |
| 1 or 2 Children | 122 (100.0%) | 0 (0.0%) |
| 3 or 4 Children | 12 (100.0%) | 0 (0.0%) |
| 5 or more Children | 0 (0.0%) | 0 (0.0%) |
| Total | 268 (100.0%) | 0 (0.0%) |
Income Below Poverty Among Single-Parent Households in Lincolndale
| Children | Single Father | Single Mother |
| No Children | 0 (0.0%) | 0 (0.0%) |
| 1 or 2 Children | 0 (0.0%) | 0 (0.0%) |
| 3 or 4 Children | 0 (0.0%) | 0 (0.0%) |
| 5 or more Children | 0 (0.0%) | 0 (0.0%) |
| Total | 0 (0.0%) | 0 (0.0%) |
Income Below Poverty Among Married-Couple vs Single-Parent Households in Lincolndale
| Children | Married-Couple Families | Single-Parent Households |
| No Children | 0 (0.0%) | 0 (0.0%) |
| 1 or 2 Children | 0 (0.0%) | 0 (0.0%) |
| 3 or 4 Children | 0 (0.0%) | 0 (0.0%) |
| 5 or more Children | 0 (0.0%) | 0 (0.0%) |
| Total | 0 (0.0%) | 0 (0.0%) |
Race in Lincolndale
The most populous races in Lincolndale are White / Caucasian (981 | 80.6%), Hispanic or Latino (256 | 21.0%), and Two or more Races (204 | 16.8%).
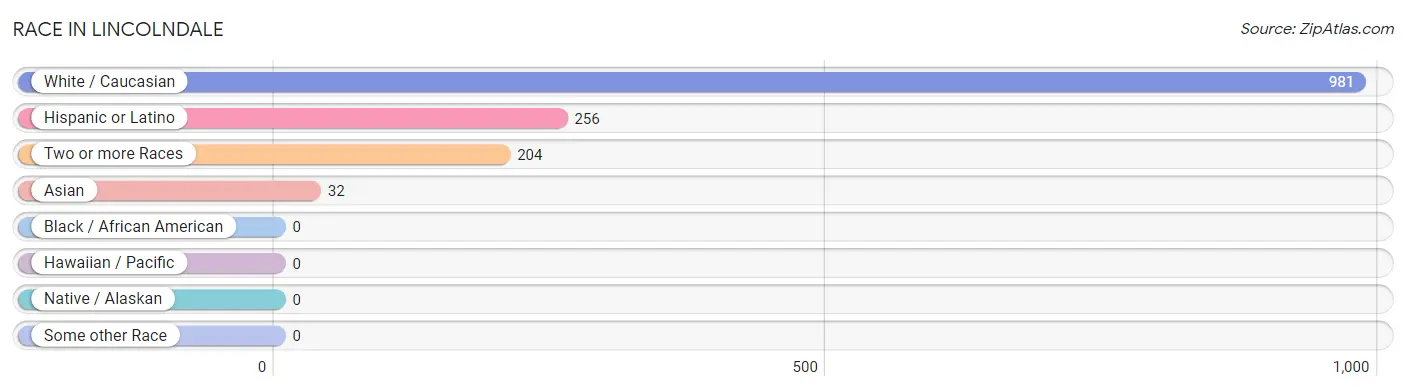
| Race | # Population | % Population |
| Asian | 32 | 2.6% |
| Black / African American | 0 | 0.0% |
| Hawaiian / Pacific | 0 | 0.0% |
| Hispanic or Latino | 256 | 21.0% |
| Native / Alaskan | 0 | 0.0% |
| White / Caucasian | 981 | 80.6% |
| Two or more Races | 204 | 16.8% |
| Some other Race | 0 | 0.0% |
| Total | 1,217 | 100.0% |
Ancestry in Lincolndale
The most populous ancestries reported in Lincolndale are Italian (380 | 31.2%), Puerto Rican (254 | 20.9%), Irish (186 | 15.3%), English (147 | 12.1%), and German (102 | 8.4%), together accounting for 87.8% of all Lincolndale residents.
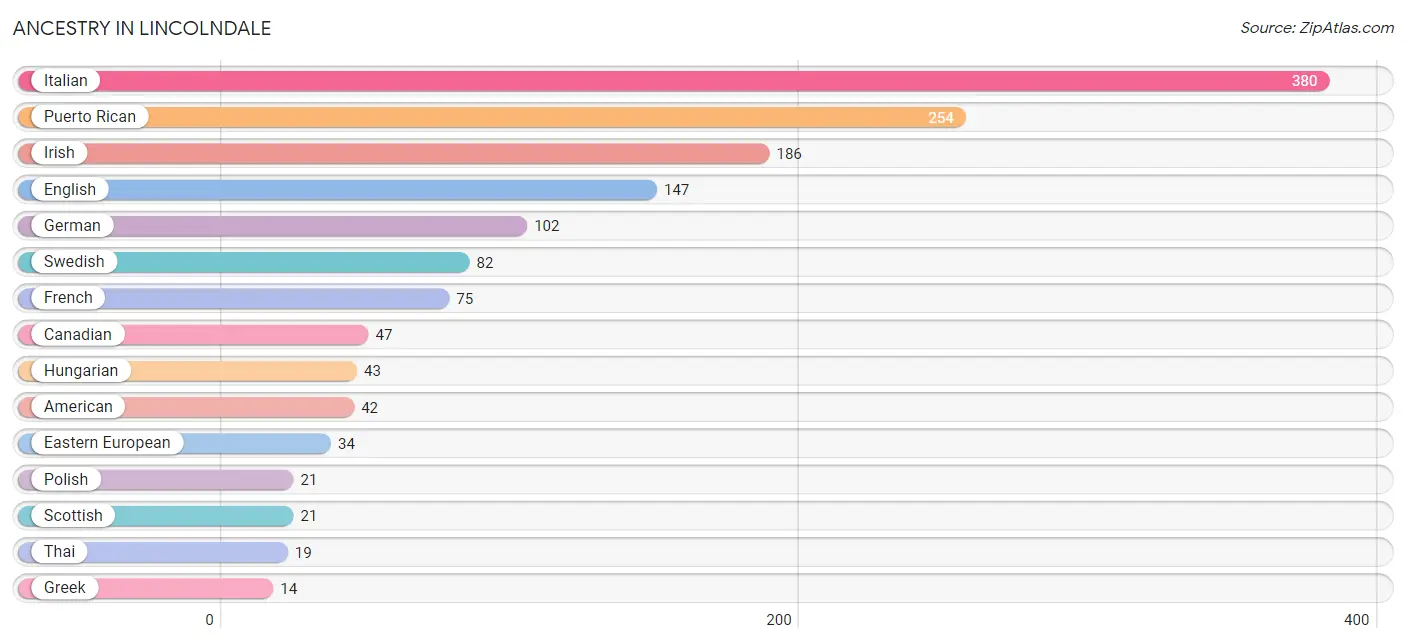
| Ancestry | # Population | % Population |
| Albanian | 11 | 0.9% |
| American | 42 | 3.5% |
| Canadian | 47 | 3.9% |
| Croatian | 10 | 0.8% |
| Eastern European | 34 | 2.8% |
| English | 147 | 12.1% |
| French | 75 | 6.2% |
| German | 102 | 8.4% |
| Greek | 14 | 1.1% |
| Hungarian | 43 | 3.5% |
| Indian (Asian) | 13 | 1.1% |
| Irish | 186 | 15.3% |
| Italian | 380 | 31.2% |
| Lithuanian | 12 | 1.0% |
| Mexican | 2 | 0.2% |
| Polish | 21 | 1.7% |
| Puerto Rican | 254 | 20.9% |
| Scotch-Irish | 13 | 1.1% |
| Scottish | 21 | 1.7% |
| Slovak | 9 | 0.7% |
| Swedish | 82 | 6.7% |
| Thai | 19 | 1.6% | View All 22 Rows |
Immigrants in Lincolndale
The most numerous immigrant groups reported in Lincolndale came from Europe (44 | 3.6%), Asia (32 | 2.6%), Eastern Europe (26 | 2.1%), Belarus (22 | 1.8%), and India (19 | 1.6%), together accounting for 11.8% of all Lincolndale residents.
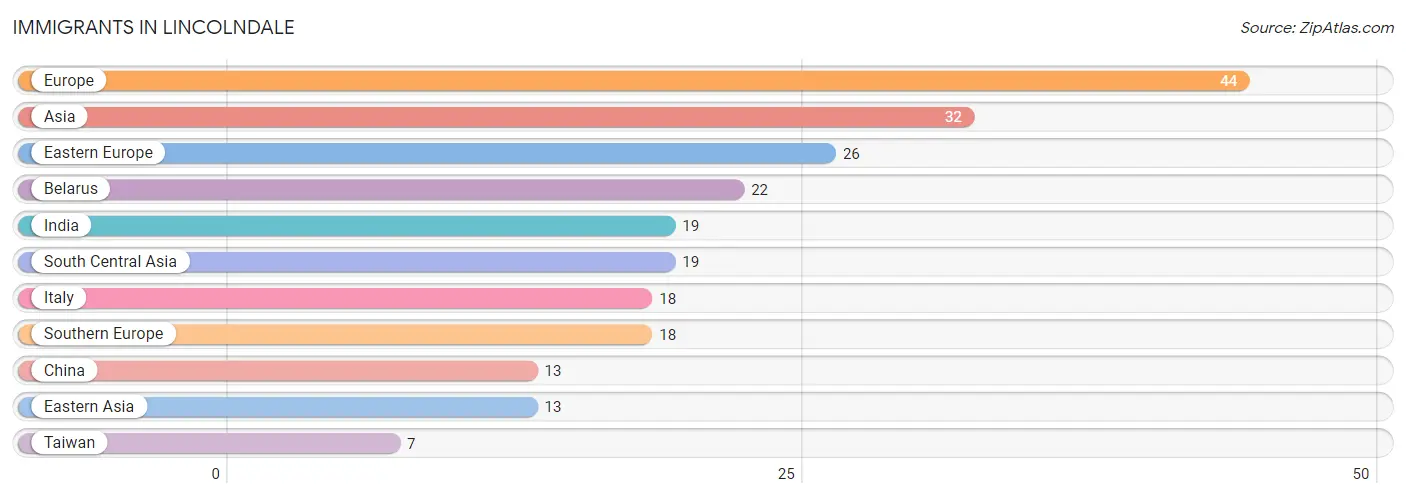
| Immigration Origin | # Population | % Population |
| Asia | 32 | 2.6% |
| Belarus | 22 | 1.8% |
| China | 13 | 1.1% |
| Eastern Asia | 13 | 1.1% |
| Eastern Europe | 26 | 2.1% |
| Europe | 44 | 3.6% |
| India | 19 | 1.6% |
| Italy | 18 | 1.5% |
| South Central Asia | 19 | 1.6% |
| Southern Europe | 18 | 1.5% |
| Taiwan | 7 | 0.6% | View All 11 Rows |
Sex and Age in Lincolndale
Sex and Age in Lincolndale
The most populous age groups in Lincolndale are 40 to 44 Years (131 | 24.4%) for men and 50 to 54 Years (103 | 15.1%) for women.
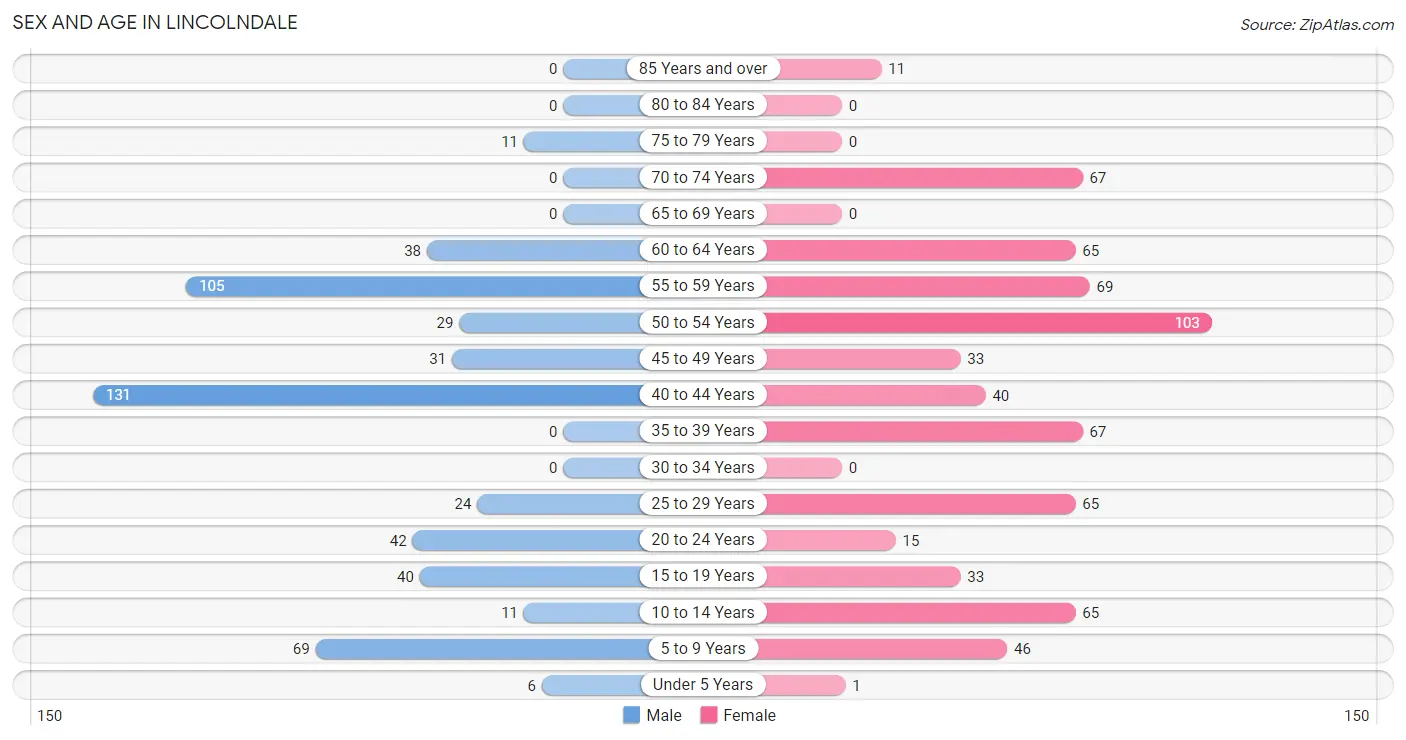
| Age Bracket | Male | Female |
| Under 5 Years | 6 (1.1%) | 1 (0.2%) |
| 5 to 9 Years | 69 (12.9%) | 46 (6.8%) |
| 10 to 14 Years | 11 (2.1%) | 65 (9.6%) |
| 15 to 19 Years | 40 (7.4%) | 33 (4.9%) |
| 20 to 24 Years | 42 (7.8%) | 15 (2.2%) |
| 25 to 29 Years | 24 (4.5%) | 65 (9.6%) |
| 30 to 34 Years | 0 (0.0%) | 0 (0.0%) |
| 35 to 39 Years | 0 (0.0%) | 67 (9.9%) |
| 40 to 44 Years | 131 (24.4%) | 40 (5.9%) |
| 45 to 49 Years | 31 (5.8%) | 33 (4.9%) |
| 50 to 54 Years | 29 (5.4%) | 103 (15.1%) |
| 55 to 59 Years | 105 (19.6%) | 69 (10.2%) |
| 60 to 64 Years | 38 (7.1%) | 65 (9.6%) |
| 65 to 69 Years | 0 (0.0%) | 0 (0.0%) |
| 70 to 74 Years | 0 (0.0%) | 67 (9.9%) |
| 75 to 79 Years | 11 (2.1%) | 0 (0.0%) |
| 80 to 84 Years | 0 (0.0%) | 0 (0.0%) |
| 85 Years and over | 0 (0.0%) | 11 (1.6%) |
| Total | 537 (100.0%) | 680 (100.0%) |
Families and Households in Lincolndale
Median Family Size in Lincolndale
The median family size in Lincolndale is 3.12 persons per family, with married-couple families (268 | 80.0%) accounting for the largest median family size of 3.28 persons per family. On the other hand, single female/mother families (45 | 13.4%) represent the smallest median family size with 2.22 persons per family.
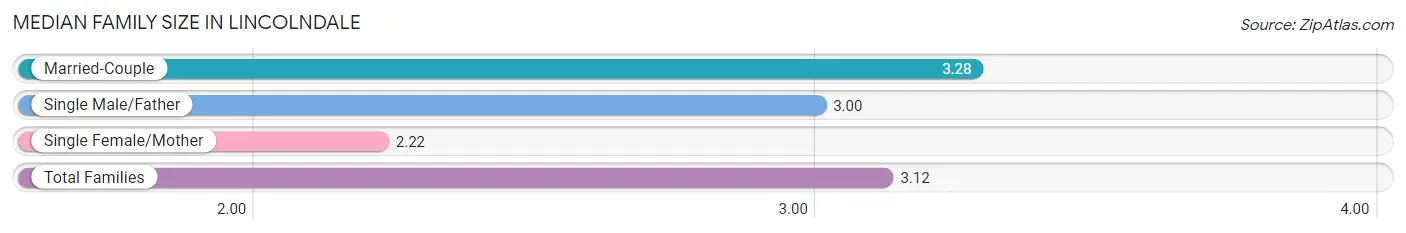
| Family Type | # Families | Family Size |
| Married-Couple | 268 (80.0%) | 3.28 |
| Single Male/Father | 22 (6.6%) | 3.00 |
| Single Female/Mother | 45 (13.4%) | 2.22 |
| Total Families | 335 (100.0%) | 3.12 |
Median Household Size in Lincolndale
The median household size in Lincolndale is 2.69 persons per household, with single male/father households (22 | 4.9%) accounting for the largest median household size of 5 persons per household. non-family households (117 | 25.9%) represent the smallest median household size with 1.09 persons per household.
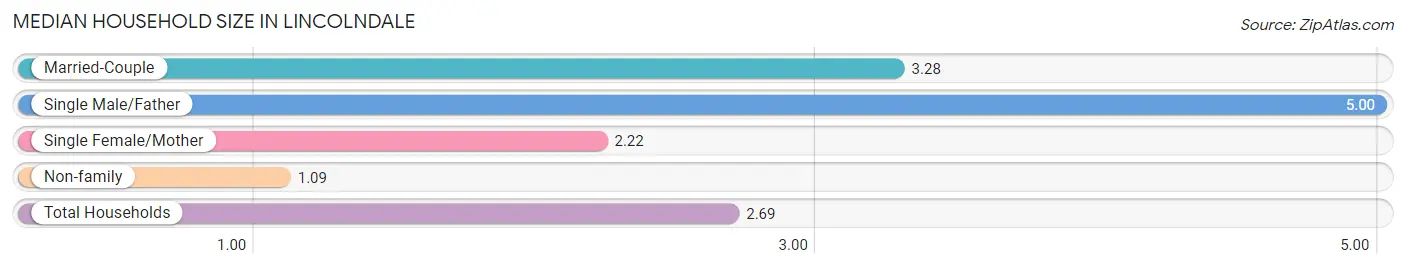
| Household Type | # Households | Household Size |
| Married-Couple | 268 (59.3%) | 3.28 |
| Single Male/Father | 22 (4.9%) | 5.00 |
| Single Female/Mother | 45 (10.0%) | 2.22 |
| Non-family | 117 (25.9%) | 1.09 |
| Total Households | 452 (100.0%) | 2.69 |
Household Size by Marriage Status in Lincolndale
Out of a total of 452 households in Lincolndale, 335 (74.1%) are family households, while 117 (25.9%) are nonfamily households. The most numerous type of family households are 2-person households, comprising 114, and the most common type of nonfamily households are 1-person households, comprising 105.
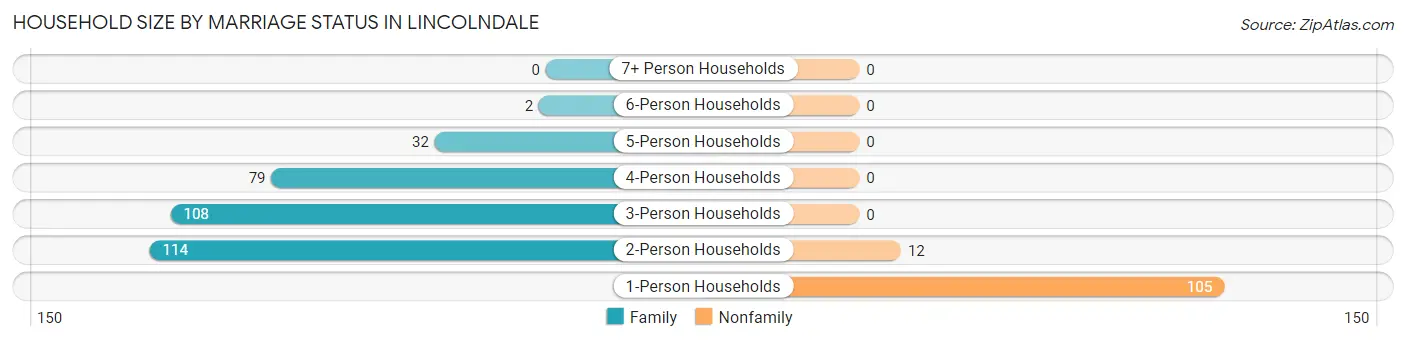
| Household Size | Family Households | Nonfamily Households |
| 1-Person Households | - | 105 (23.2%) |
| 2-Person Households | 114 (25.2%) | 12 (2.6%) |
| 3-Person Households | 108 (23.9%) | 0 (0.0%) |
| 4-Person Households | 79 (17.5%) | 0 (0.0%) |
| 5-Person Households | 32 (7.1%) | 0 (0.0%) |
| 6-Person Households | 2 (0.4%) | 0 (0.0%) |
| 7+ Person Households | 0 (0.0%) | 0 (0.0%) |
| Total | 335 (74.1%) | 117 (25.9%) |
Female Fertility in Lincolndale
Fertility by Age in Lincolndale
| Age Bracket | Women with Births | Births / 1,000 Women |
| 15 to 19 years | 0 (0.0%) | 0.0 |
| 20 to 34 years | 0 (0.0%) | 0.0 |
| 35 to 50 years | 0 (0.0%) | 0.0 |
| Total | 0 (0.0%) | 0.0 |
Fertility by Age by Marriage Status in Lincolndale
| Age Bracket | Married | Unmarried |
| 15 to 19 years | 0 (0.0%) | 0 (0.0%) |
| 20 to 34 years | 0 (0.0%) | 0 (0.0%) |
| 35 to 50 years | 0 (0.0%) | 0 (0.0%) |
| Total | 0 (0.0%) | 0 (0.0%) |
Fertility by Education in Lincolndale
| Educational Attainment | Women with Births | Births / 1,000 Women |
| Less than High School | 0 (0.0%) | 0.0 |
| High School Diploma | 0 (0.0%) | 0.0 |
| College or Associate's Degree | 0 (0.0%) | 0.0 |
| Bachelor's Degree | 0 (0.0%) | 0.0 |
| Graduate Degree | 0 (0.0%) | 0.0 |
| Total | 0 (0.0%) | 0.0 |
Fertility by Education by Marriage Status in Lincolndale
| Educational Attainment | Married | Unmarried |
| Less than High School | 0 (0.0%) | 0 (0.0%) |
| High School Diploma | 0 (0.0%) | 0 (0.0%) |
| College or Associate's Degree | 0 (0.0%) | 0 (0.0%) |
| Bachelor's Degree | 0 (0.0%) | 0 (0.0%) |
| Graduate Degree | 0 (0.0%) | 0 (0.0%) |
| Total | 0 (0.0%) | 0 (0.0%) |
Employment Characteristics in Lincolndale
Employment by Class of Employer in Lincolndale
Among the 745 employed individuals in Lincolndale, private company employees (369 | 49.5%), local government employees (189 | 25.4%), and not-for-profit organizations (85 | 11.4%) make up the most common classes of employment.
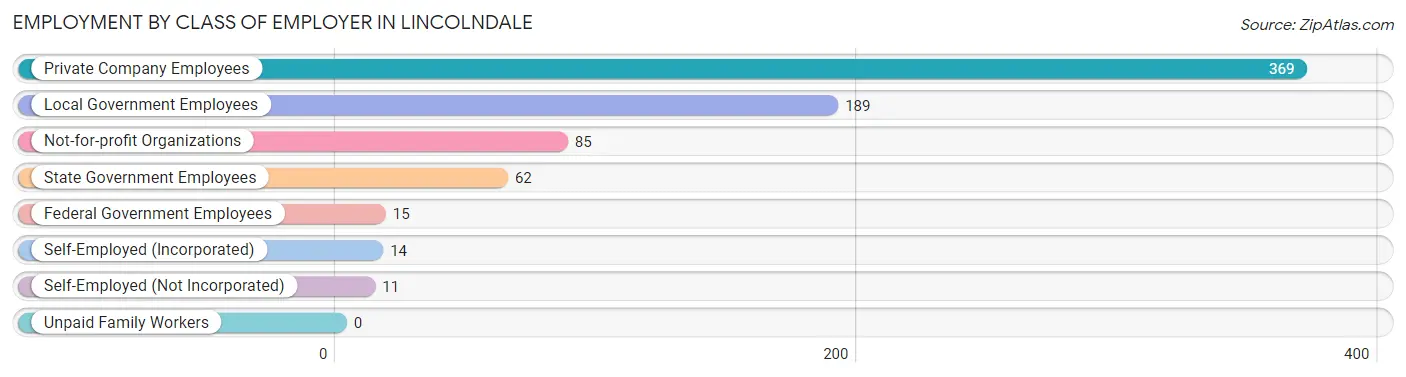
| Employer Class | # Employees | % Employees |
| Private Company Employees | 369 | 49.5% |
| Self-Employed (Incorporated) | 14 | 1.9% |
| Self-Employed (Not Incorporated) | 11 | 1.5% |
| Not-for-profit Organizations | 85 | 11.4% |
| Local Government Employees | 189 | 25.4% |
| State Government Employees | 62 | 8.3% |
| Federal Government Employees | 15 | 2.0% |
| Unpaid Family Workers | 0 | 0.0% |
| Total | 745 | 100.0% |
Employment Status by Age in Lincolndale
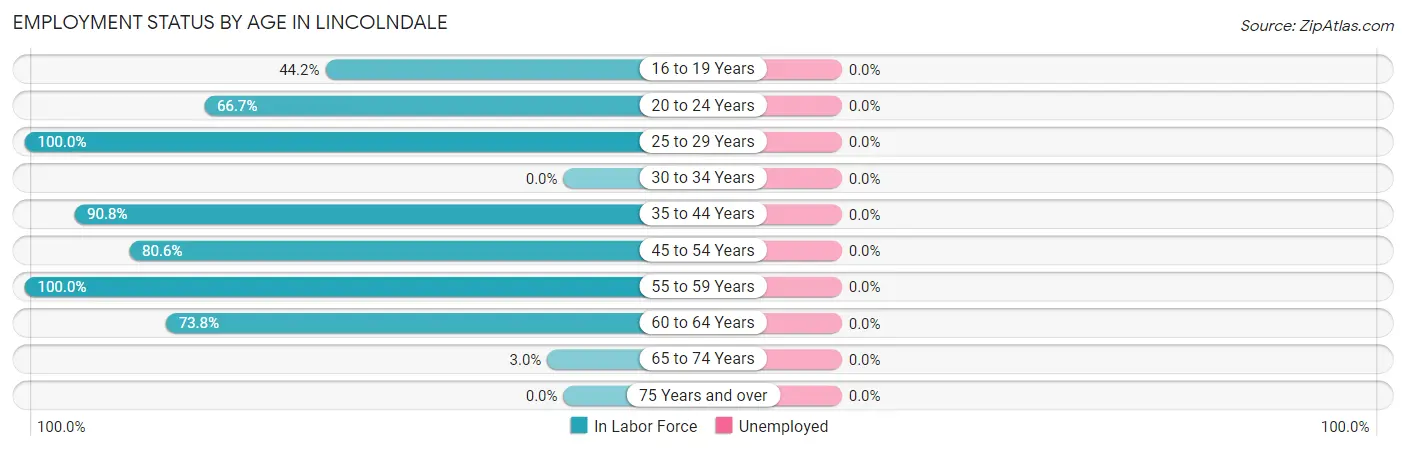
| Age Bracket | In Labor Force | Unemployed |
| 16 to 19 Years | 19 (44.2%) | 0 (0.0%) |
| 20 to 24 Years | 38 (66.7%) | 0 (0.0%) |
| 25 to 29 Years | 89 (100.0%) | 0 (0.0%) |
| 30 to 34 Years | 0 (0.0%) | 0 (0.0%) |
| 35 to 44 Years | 216 (90.8%) | 0 (0.0%) |
| 45 to 54 Years | 158 (80.6%) | 0 (0.0%) |
| 55 to 59 Years | 174 (100.0%) | 0 (0.0%) |
| 60 to 64 Years | 76 (73.8%) | 0 (0.0%) |
| 65 to 74 Years | 2 (3.0%) | 0 (0.0%) |
| 75 Years and over | 0 (0.0%) | 0 (0.0%) |
| Total | 772 (78.1%) | 0 (0.0%) |
Employment Status by Educational Attainment in Lincolndale
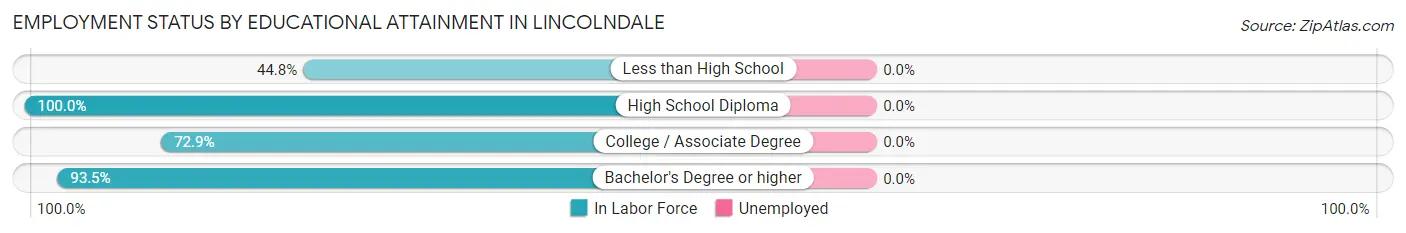
| Educational Attainment | In Labor Force | Unemployed |
| Less than High School | 13 (44.8%) | 0 (0.0%) |
| High School Diploma | 91 (100.0%) | 0 (0.0%) |
| College / Associate Degree | 94 (72.9%) | 0 (0.0%) |
| Bachelor's Degree or higher | 515 (93.5%) | 0 (0.0%) |
| Total | 713 (89.1%) | 0 (0.0%) |
Employment Occupations by Sex in Lincolndale
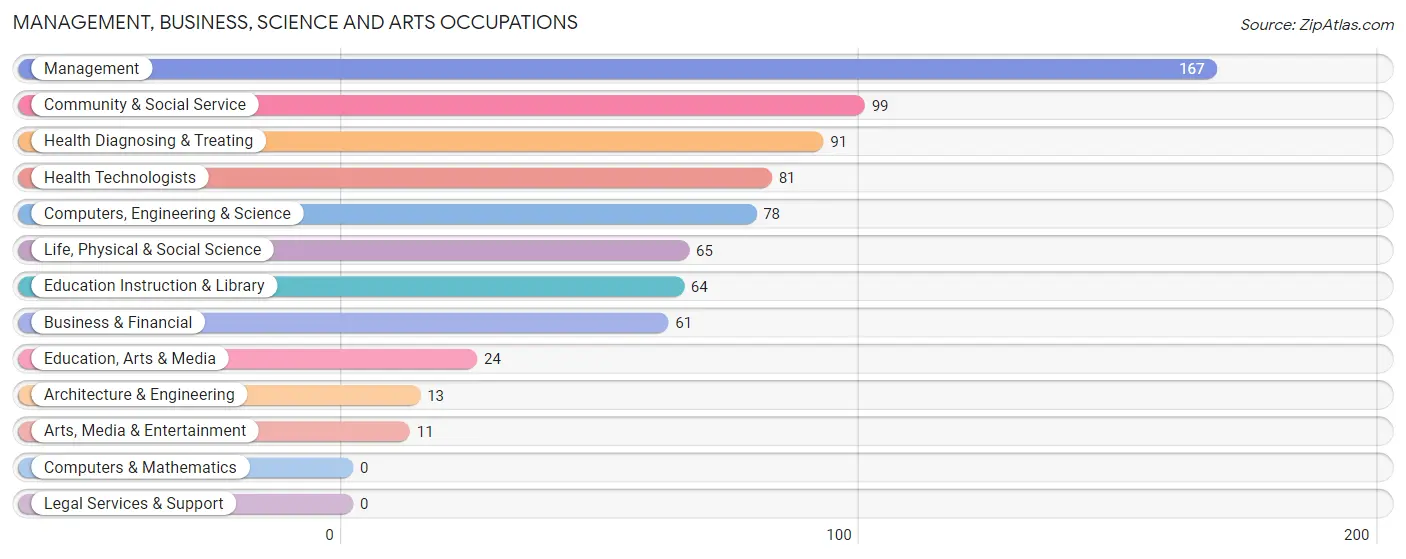
Management, Business, Science and Arts Occupations
The most common Management, Business, Science and Arts occupations in Lincolndale are Management (167 | 21.6%), Community & Social Service (99 | 12.8%), Health Diagnosing & Treating (91 | 11.8%), Health Technologists (81 | 10.5%), and Computers, Engineering & Science (78 | 10.1%).
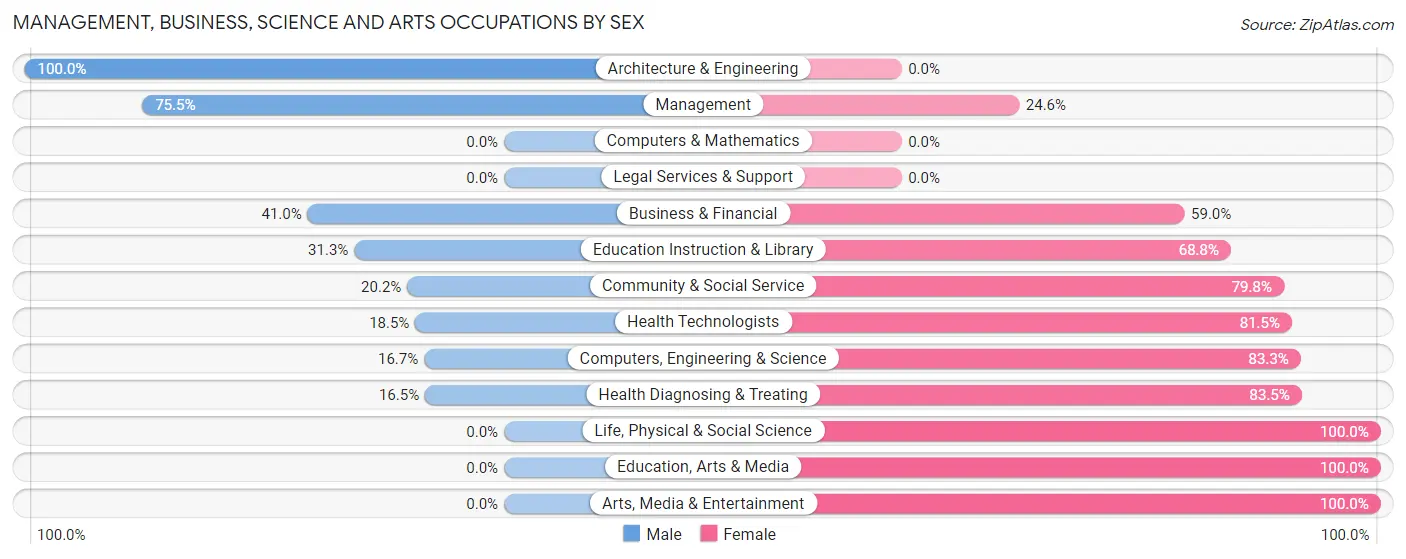
Management, Business, Science and Arts Occupations by Sex
Within the Management, Business, Science and Arts occupations in Lincolndale, the most male-oriented occupations are Architecture & Engineering (100.0%), Management (75.4%), and Business & Financial (41.0%), while the most female-oriented occupations are Life, Physical & Social Science (100.0%), Education, Arts & Media (100.0%), and Arts, Media & Entertainment (100.0%).
| Occupation | Male | Female |
| Management | 126 (75.4%) | 41 (24.5%) |
| Business & Financial | 25 (41.0%) | 36 (59.0%) |
| Computers, Engineering & Science | 13 (16.7%) | 65 (83.3%) |
| Computers & Mathematics | 0 (0.0%) | 0 (0.0%) |
| Architecture & Engineering | 13 (100.0%) | 0 (0.0%) |
| Life, Physical & Social Science | 0 (0.0%) | 65 (100.0%) |
| Community & Social Service | 20 (20.2%) | 79 (79.8%) |
| Education, Arts & Media | 0 (0.0%) | 24 (100.0%) |
| Legal Services & Support | 0 (0.0%) | 0 (0.0%) |
| Education Instruction & Library | 20 (31.2%) | 44 (68.8%) |
| Arts, Media & Entertainment | 0 (0.0%) | 11 (100.0%) |
| Health Diagnosing & Treating | 15 (16.5%) | 76 (83.5%) |
| Health Technologists | 15 (18.5%) | 66 (81.5%) |
| Total (Category) | 199 (40.1%) | 297 (59.9%) |
| Total (Overall) | 330 (42.7%) | 442 (57.3%) |
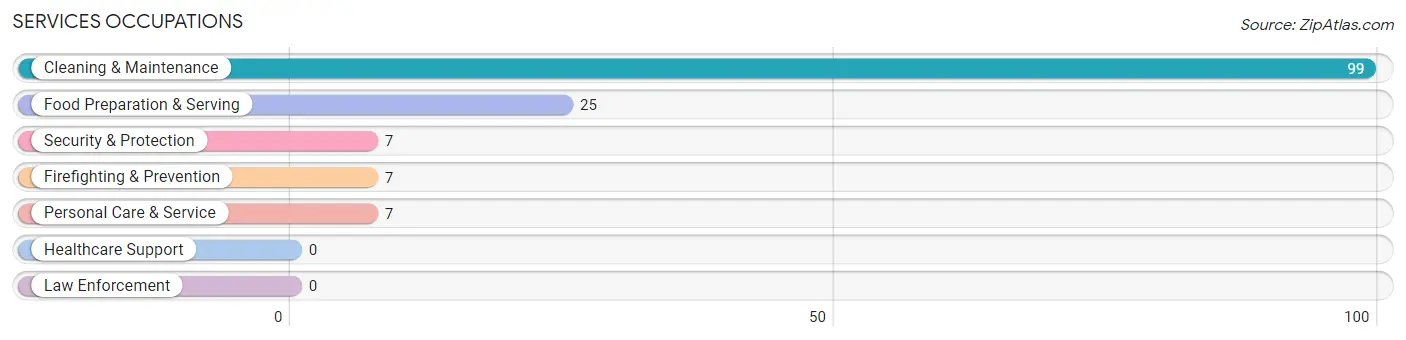
Services Occupations
The most common Services occupations in Lincolndale are Cleaning & Maintenance (99 | 12.8%), Food Preparation & Serving (25 | 3.2%), Security & Protection (7 | 0.9%), Firefighting & Prevention (7 | 0.9%), and Personal Care & Service (7 | 0.9%).
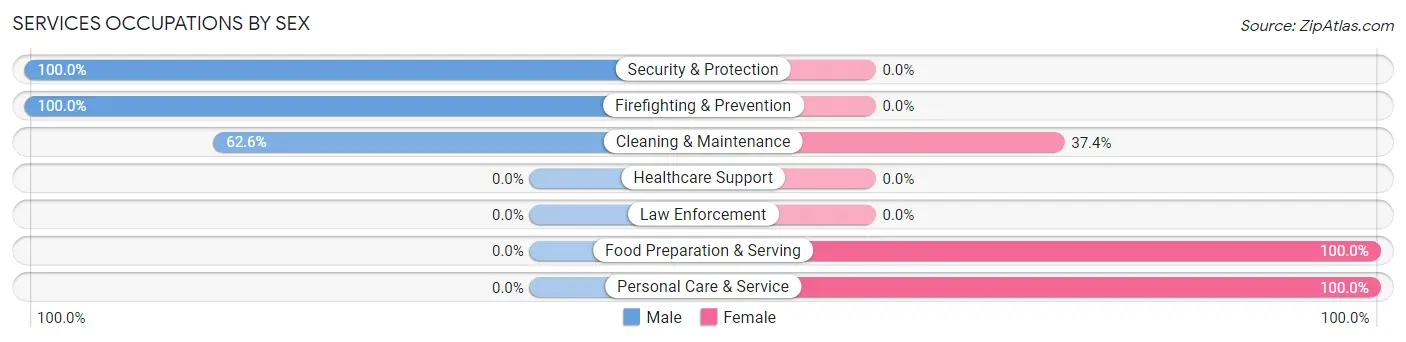
Services Occupations by Sex
Within the Services occupations in Lincolndale, the most male-oriented occupations are Security & Protection (100.0%), Firefighting & Prevention (100.0%), and Cleaning & Maintenance (62.6%), while the most female-oriented occupations are Food Preparation & Serving (100.0%), Personal Care & Service (100.0%), and Cleaning & Maintenance (37.4%).
| Occupation | Male | Female |
| Healthcare Support | 0 (0.0%) | 0 (0.0%) |
| Security & Protection | 7 (100.0%) | 0 (0.0%) |
| Firefighting & Prevention | 7 (100.0%) | 0 (0.0%) |
| Law Enforcement | 0 (0.0%) | 0 (0.0%) |
| Food Preparation & Serving | 0 (0.0%) | 25 (100.0%) |
| Cleaning & Maintenance | 62 (62.6%) | 37 (37.4%) |
| Personal Care & Service | 0 (0.0%) | 7 (100.0%) |
| Total (Category) | 69 (50.0%) | 69 (50.0%) |
| Total (Overall) | 330 (42.7%) | 442 (57.3%) |
Sales and Office Occupations
The most common Sales and Office occupations in Lincolndale are Office & Administration (41 | 5.3%), and Sales & Related (19 | 2.5%).
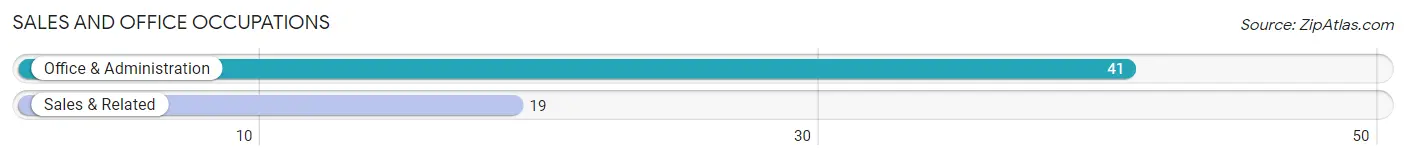
Sales and Office Occupations by Sex
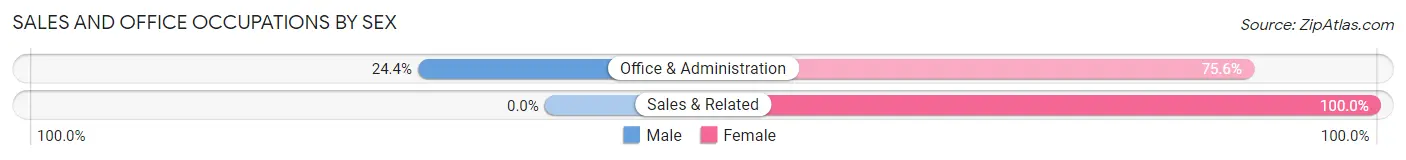
| Occupation | Male | Female |
| Sales & Related | 0 (0.0%) | 19 (100.0%) |
| Office & Administration | 10 (24.4%) | 31 (75.6%) |
| Total (Category) | 10 (16.7%) | 50 (83.3%) |
| Total (Overall) | 330 (42.7%) | 442 (57.3%) |
Natural Resources, Construction and Maintenance Occupations
The most common Natural Resources, Construction and Maintenance occupations in Lincolndale are Construction & Extraction (41 | 5.3%), and Installation, Maintenance & Repair (11 | 1.4%).
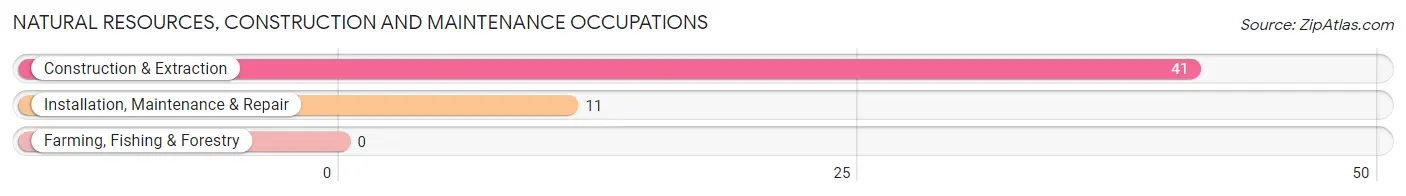
Natural Resources, Construction and Maintenance Occupations by Sex
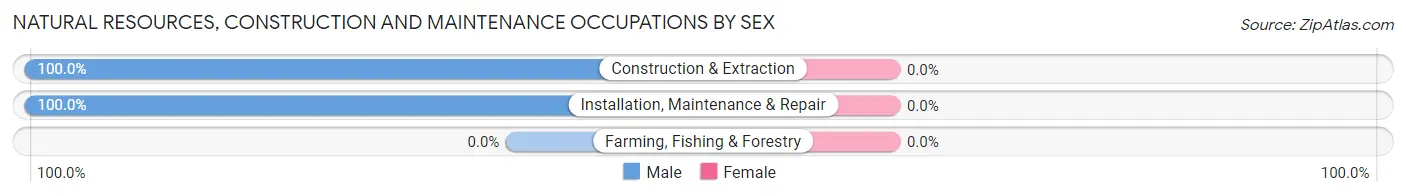
| Occupation | Male | Female |
| Farming, Fishing & Forestry | 0 (0.0%) | 0 (0.0%) |
| Construction & Extraction | 41 (100.0%) | 0 (0.0%) |
| Installation, Maintenance & Repair | 11 (100.0%) | 0 (0.0%) |
| Total (Category) | 52 (100.0%) | 0 (0.0%) |
| Total (Overall) | 330 (42.7%) | 442 (57.3%) |
Production, Transportation and Moving Occupations
The most common Production, Transportation and Moving occupations in Lincolndale are Transportation (14 | 1.8%), and Production (12 | 1.5%).
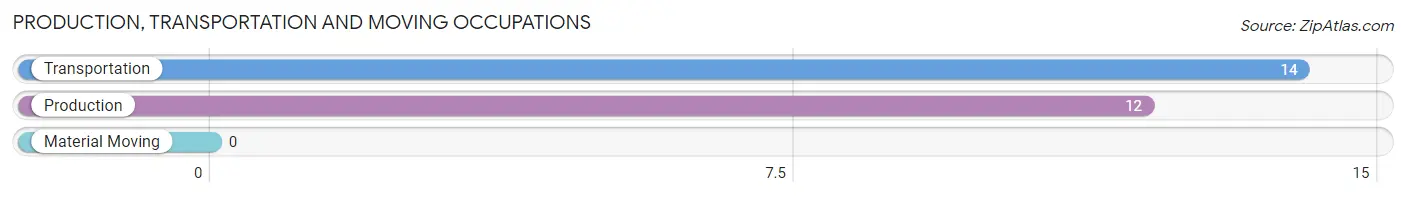
Production, Transportation and Moving Occupations by Sex
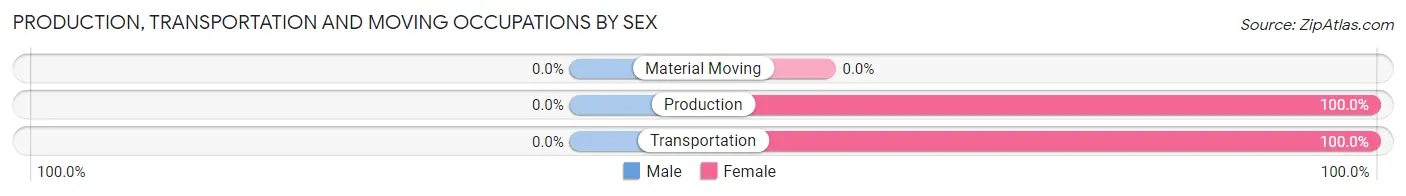
| Occupation | Male | Female |
| Production | 0 (0.0%) | 12 (100.0%) |
| Transportation | 0 (0.0%) | 14 (100.0%) |
| Material Moving | 0 (0.0%) | 0 (0.0%) |
| Total (Category) | 0 (0.0%) | 26 (100.0%) |
| Total (Overall) | 330 (42.7%) | 442 (57.3%) |
Employment Industries by Sex in Lincolndale
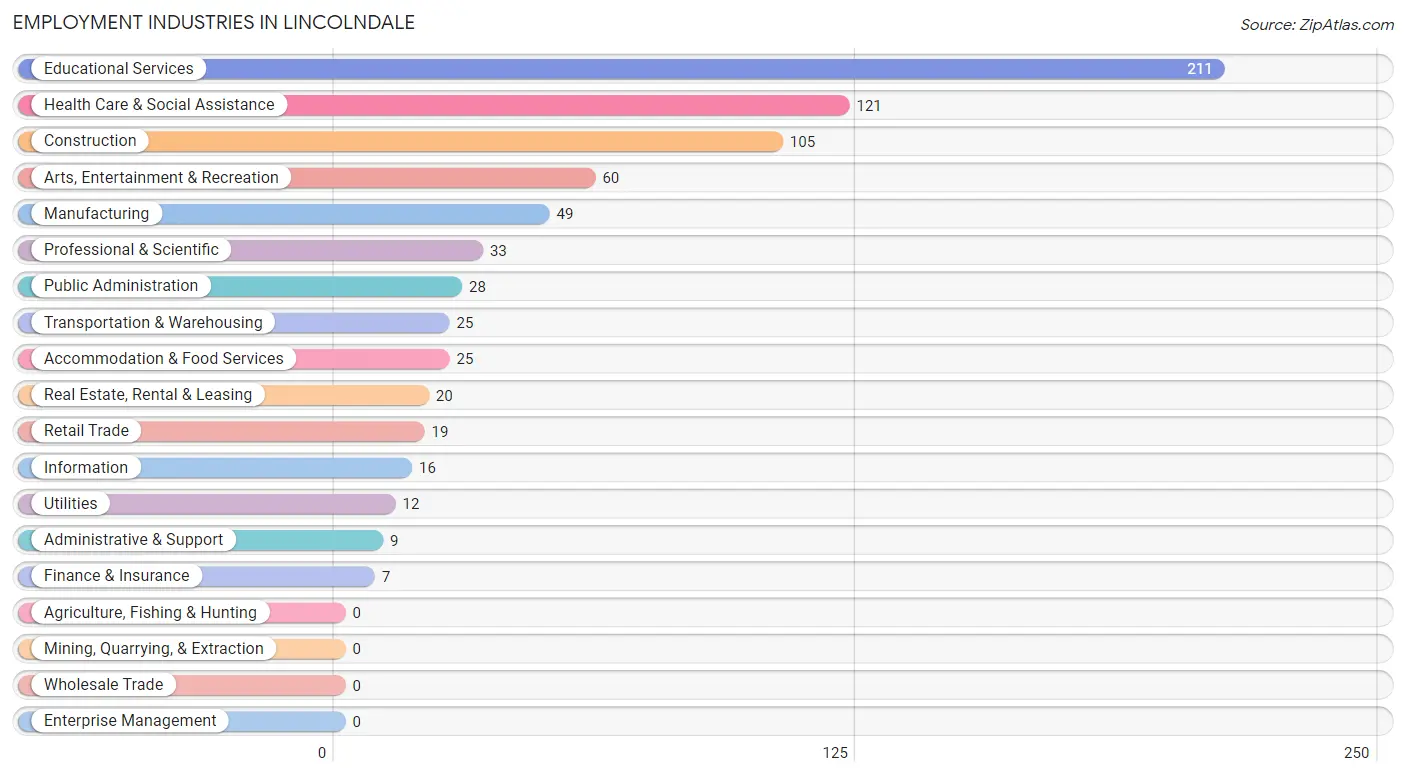
Employment Industries in Lincolndale
The major employment industries in Lincolndale include Educational Services (211 | 27.3%), Health Care & Social Assistance (121 | 15.7%), Construction (105 | 13.6%), Arts, Entertainment & Recreation (60 | 7.8%), and Manufacturing (49 | 6.4%).
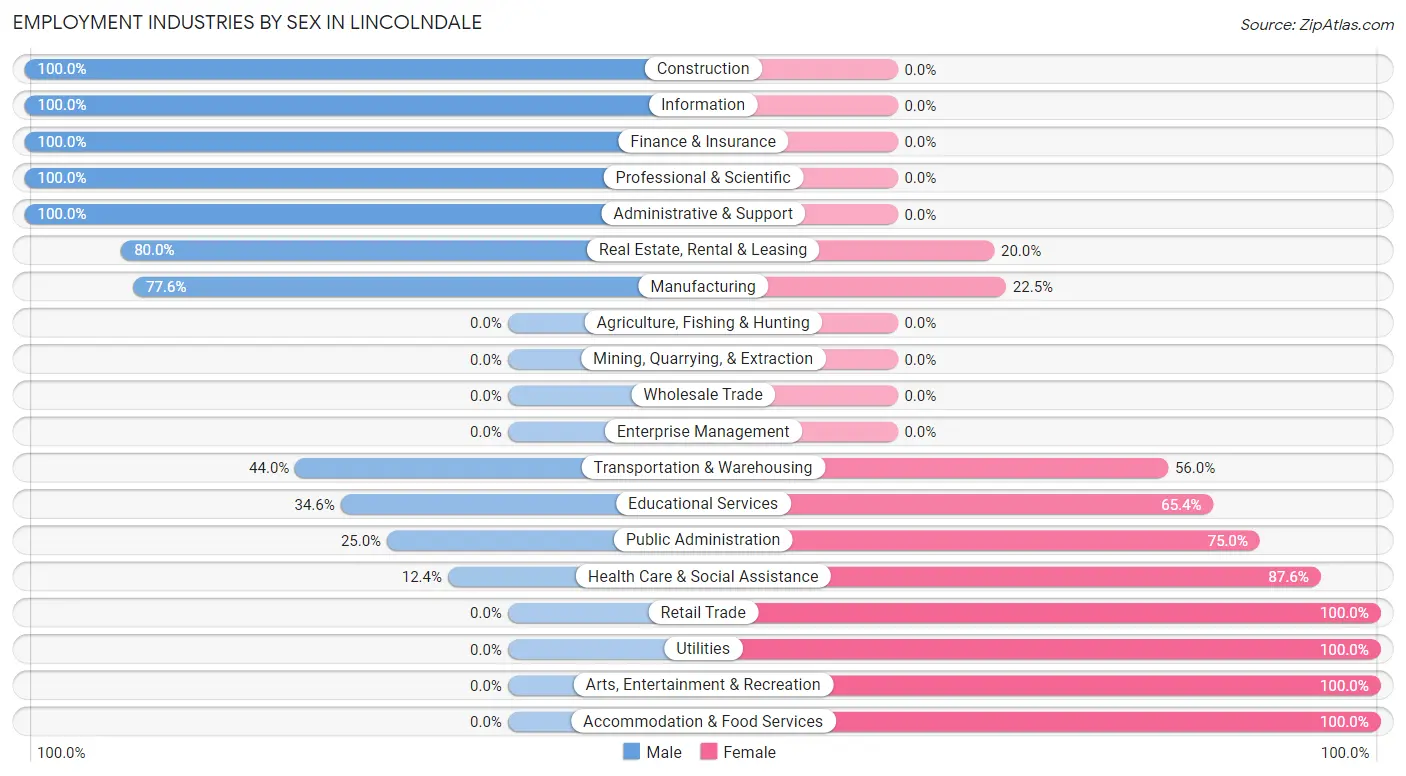
Employment Industries by Sex in Lincolndale
The Lincolndale industries that see more men than women are Construction (100.0%), Information (100.0%), and Finance & Insurance (100.0%), whereas the industries that tend to have a higher number of women are Retail Trade (100.0%), Utilities (100.0%), and Arts, Entertainment & Recreation (100.0%).
| Industry | Male | Female |
| Agriculture, Fishing & Hunting | 0 (0.0%) | 0 (0.0%) |
| Mining, Quarrying, & Extraction | 0 (0.0%) | 0 (0.0%) |
| Construction | 105 (100.0%) | 0 (0.0%) |
| Manufacturing | 38 (77.5%) | 11 (22.5%) |
| Wholesale Trade | 0 (0.0%) | 0 (0.0%) |
| Retail Trade | 0 (0.0%) | 19 (100.0%) |
| Transportation & Warehousing | 11 (44.0%) | 14 (56.0%) |
| Utilities | 0 (0.0%) | 12 (100.0%) |
| Information | 16 (100.0%) | 0 (0.0%) |
| Finance & Insurance | 7 (100.0%) | 0 (0.0%) |
| Real Estate, Rental & Leasing | 16 (80.0%) | 4 (20.0%) |
| Professional & Scientific | 33 (100.0%) | 0 (0.0%) |
| Enterprise Management | 0 (0.0%) | 0 (0.0%) |
| Administrative & Support | 9 (100.0%) | 0 (0.0%) |
| Educational Services | 73 (34.6%) | 138 (65.4%) |
| Health Care & Social Assistance | 15 (12.4%) | 106 (87.6%) |
| Arts, Entertainment & Recreation | 0 (0.0%) | 60 (100.0%) |
| Accommodation & Food Services | 0 (0.0%) | 25 (100.0%) |
| Public Administration | 7 (25.0%) | 21 (75.0%) |
| Total | 330 (42.7%) | 442 (57.3%) |
Education in Lincolndale
School Enrollment in Lincolndale
The most common levels of schooling among the 339 students in Lincolndale are elementary school (98 | 28.9%), middle school (76 | 22.4%), and high school (54 | 15.9%).
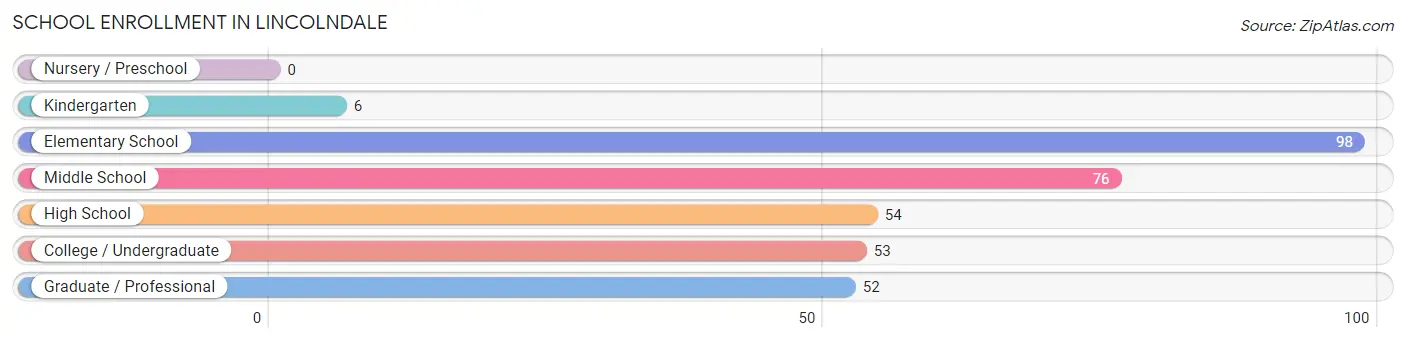
| School Level | # Students | % Students |
| Nursery / Preschool | 0 | 0.0% |
| Kindergarten | 6 | 1.8% |
| Elementary School | 98 | 28.9% |
| Middle School | 76 | 22.4% |
| High School | 54 | 15.9% |
| College / Undergraduate | 53 | 15.6% |
| Graduate / Professional | 52 | 15.3% |
| Total | 339 | 100.0% |
School Enrollment by Age by Funding Source in Lincolndale
Out of a total of 339 students who are enrolled in schools in Lincolndale, 50 (14.7%) attend a private institution, while the remaining 289 (85.3%) are enrolled in public schools. The age group of 18 to 19 year olds has the highest likelihood of being enrolled in private schools, with 19 (100.0% in the age bracket) enrolled. Conversely, the age group of 5 to 9 year old has the lowest likelihood of being enrolled in a private school, with 104 (100.0% in the age bracket) attending a public institution.
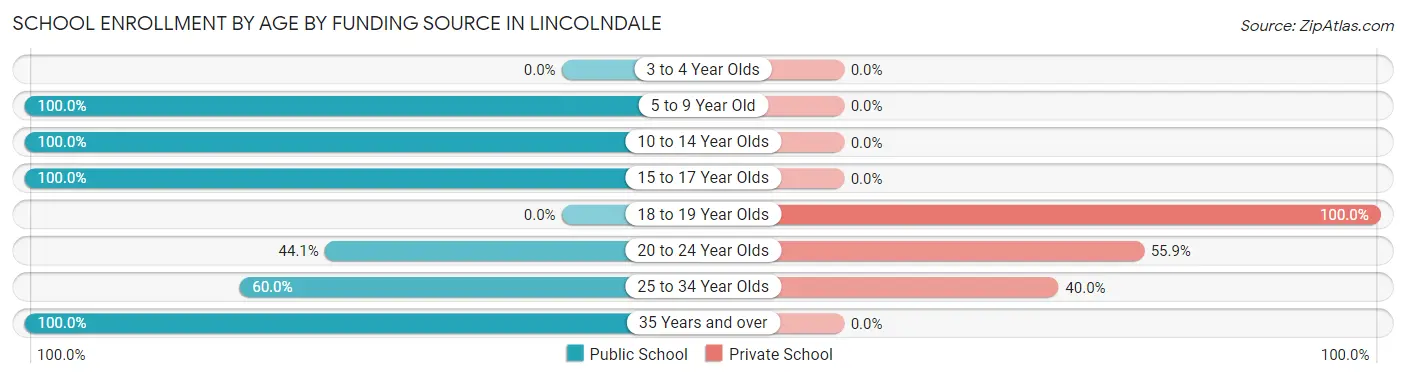
| Age Bracket | Public School | Private School |
| 3 to 4 Year Olds | 0 (0.0%) | 0 (0.0%) |
| 5 to 9 Year Old | 104 (100.0%) | 0 (0.0%) |
| 10 to 14 Year Olds | 76 (100.0%) | 0 (0.0%) |
| 15 to 17 Year Olds | 54 (100.0%) | 0 (0.0%) |
| 18 to 19 Year Olds | 0 (0.0%) | 19 (100.0%) |
| 20 to 24 Year Olds | 15 (44.1%) | 19 (55.9%) |
| 25 to 34 Year Olds | 18 (60.0%) | 12 (40.0%) |
| 35 Years and over | 22 (100.0%) | 0 (0.0%) |
| Total | 289 (85.3%) | 50 (14.7%) |
Educational Attainment by Field of Study in Lincolndale
Business (174 | 28.7%), psychology (147 | 24.3%), education (58 | 9.6%), science & technology (42 | 6.9%), and physical & health sciences (32 | 5.3%) are the most common fields of study among 606 individuals in Lincolndale who have obtained a bachelor's degree or higher.
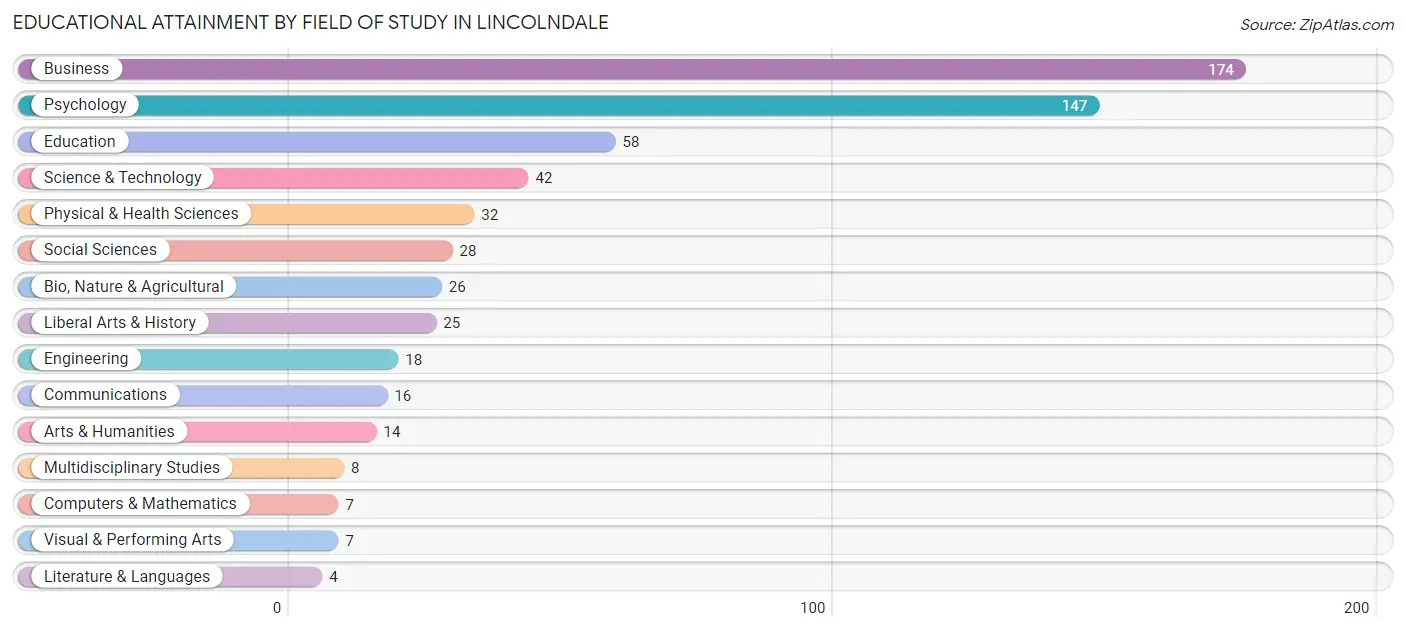
| Field of Study | # Graduates | % Graduates |
| Computers & Mathematics | 7 | 1.2% |
| Bio, Nature & Agricultural | 26 | 4.3% |
| Physical & Health Sciences | 32 | 5.3% |
| Psychology | 147 | 24.3% |
| Social Sciences | 28 | 4.6% |
| Engineering | 18 | 3.0% |
| Multidisciplinary Studies | 8 | 1.3% |
| Science & Technology | 42 | 6.9% |
| Business | 174 | 28.7% |
| Education | 58 | 9.6% |
| Literature & Languages | 4 | 0.7% |
| Liberal Arts & History | 25 | 4.1% |
| Visual & Performing Arts | 7 | 1.2% |
| Communications | 16 | 2.6% |
| Arts & Humanities | 14 | 2.3% |
| Total | 606 | 100.0% |
Transportation & Commute in Lincolndale
Vehicle Availability by Sex in Lincolndale
The most prevalent vehicle ownership categories in Lincolndale are males with 2 vehicles (191, accounting for 60.1%) and females with 2 vehicles (229, making up 44.7%).
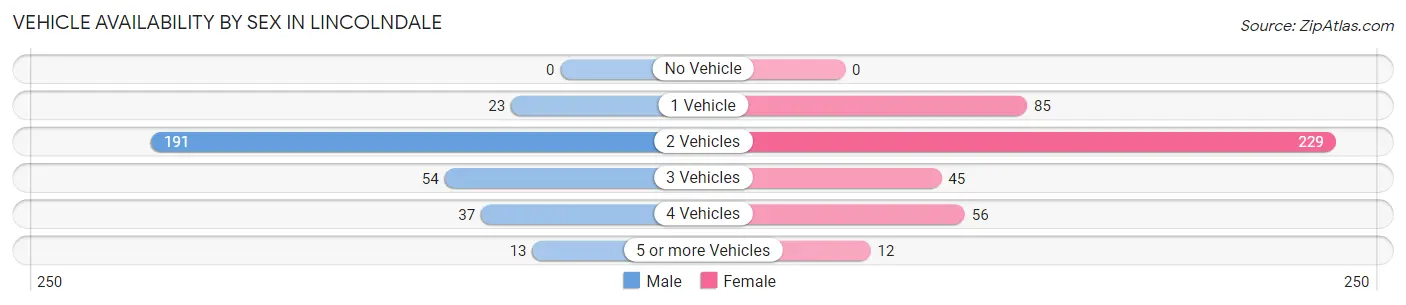
| Vehicles Available | Male | Female |
| No Vehicle | 0 (0.0%) | 0 (0.0%) |
| 1 Vehicle | 23 (7.2%) | 85 (19.9%) |
| 2 Vehicles | 191 (60.1%) | 229 (53.6%) |
| 3 Vehicles | 54 (17.0%) | 45 (10.5%) |
| 4 Vehicles | 37 (11.6%) | 56 (13.1%) |
| 5 or more Vehicles | 13 (4.1%) | 12 (2.8%) |
| Total | 318 (100.0%) | 427 (100.0%) |
Commute Time in Lincolndale
The most frequently occuring commute durations in Lincolndale are 30 to 34 minutes (185 commuters, 33.3%), 45 to 59 minutes (112 commuters, 20.2%), and 5 to 9 minutes (54 commuters, 9.7%).
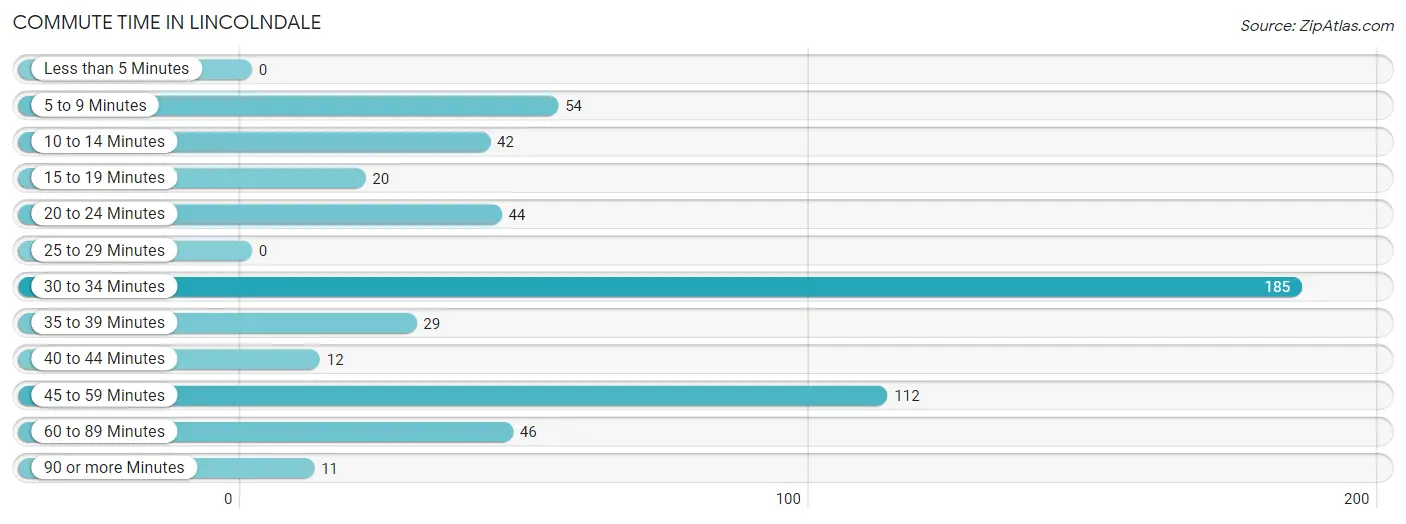
| Commute Time | # Commuters | % Commuters |
| Less than 5 Minutes | 0 | 0.0% |
| 5 to 9 Minutes | 54 | 9.7% |
| 10 to 14 Minutes | 42 | 7.6% |
| 15 to 19 Minutes | 20 | 3.6% |
| 20 to 24 Minutes | 44 | 7.9% |
| 25 to 29 Minutes | 0 | 0.0% |
| 30 to 34 Minutes | 185 | 33.3% |
| 35 to 39 Minutes | 29 | 5.2% |
| 40 to 44 Minutes | 12 | 2.2% |
| 45 to 59 Minutes | 112 | 20.2% |
| 60 to 89 Minutes | 46 | 8.3% |
| 90 or more Minutes | 11 | 2.0% |
Commute Time by Sex in Lincolndale
The most common commute times in Lincolndale are 30 to 34 minutes (82 commuters, 40.0%) for males and 30 to 34 minutes (103 commuters, 29.4%) for females.
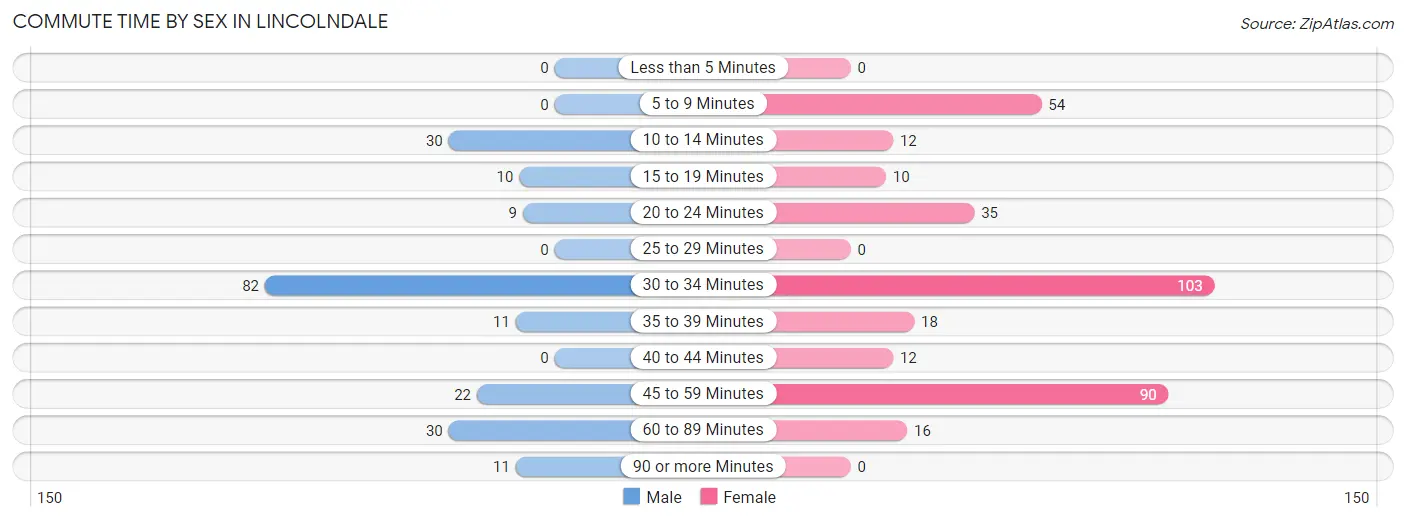
| Commute Time | Male | Female |
| Less than 5 Minutes | 0 (0.0%) | 0 (0.0%) |
| 5 to 9 Minutes | 0 (0.0%) | 54 (15.4%) |
| 10 to 14 Minutes | 30 (14.6%) | 12 (3.4%) |
| 15 to 19 Minutes | 10 (4.9%) | 10 (2.9%) |
| 20 to 24 Minutes | 9 (4.4%) | 35 (10.0%) |
| 25 to 29 Minutes | 0 (0.0%) | 0 (0.0%) |
| 30 to 34 Minutes | 82 (40.0%) | 103 (29.4%) |
| 35 to 39 Minutes | 11 (5.4%) | 18 (5.1%) |
| 40 to 44 Minutes | 0 (0.0%) | 12 (3.4%) |
| 45 to 59 Minutes | 22 (10.7%) | 90 (25.7%) |
| 60 to 89 Minutes | 30 (14.6%) | 16 (4.6%) |
| 90 or more Minutes | 11 (5.4%) | 0 (0.0%) |
Time of Departure to Work by Sex in Lincolndale
The most frequent times of departure to work in Lincolndale are 8:00 AM to 8:29 AM (78, 38.1%) for males and 7:30 AM to 7:59 AM (156, 44.6%) for females.
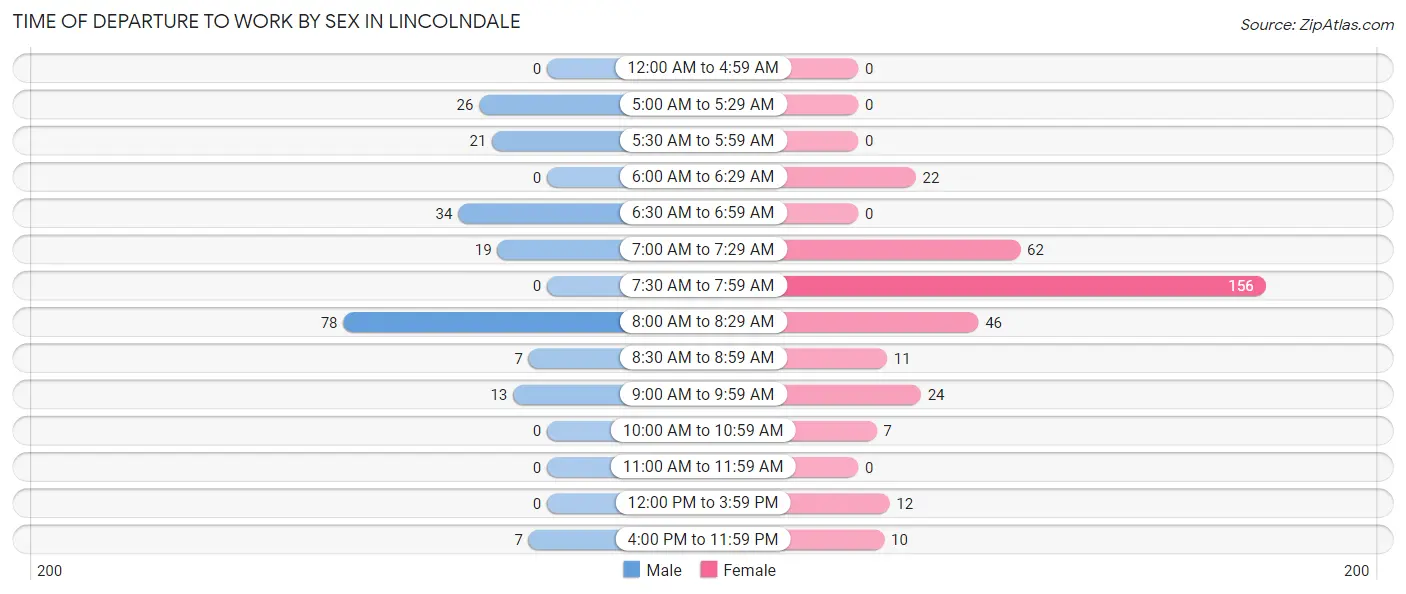
| Time of Departure | Male | Female |
| 12:00 AM to 4:59 AM | 0 (0.0%) | 0 (0.0%) |
| 5:00 AM to 5:29 AM | 26 (12.7%) | 0 (0.0%) |
| 5:30 AM to 5:59 AM | 21 (10.2%) | 0 (0.0%) |
| 6:00 AM to 6:29 AM | 0 (0.0%) | 22 (6.3%) |
| 6:30 AM to 6:59 AM | 34 (16.6%) | 0 (0.0%) |
| 7:00 AM to 7:29 AM | 19 (9.3%) | 62 (17.7%) |
| 7:30 AM to 7:59 AM | 0 (0.0%) | 156 (44.6%) |
| 8:00 AM to 8:29 AM | 78 (38.1%) | 46 (13.1%) |
| 8:30 AM to 8:59 AM | 7 (3.4%) | 11 (3.1%) |
| 9:00 AM to 9:59 AM | 13 (6.3%) | 24 (6.9%) |
| 10:00 AM to 10:59 AM | 0 (0.0%) | 7 (2.0%) |
| 11:00 AM to 11:59 AM | 0 (0.0%) | 0 (0.0%) |
| 12:00 PM to 3:59 PM | 0 (0.0%) | 12 (3.4%) |
| 4:00 PM to 11:59 PM | 7 (3.4%) | 10 (2.9%) |
| Total | 205 (100.0%) | 350 (100.0%) |
Housing Occupancy in Lincolndale
Occupancy by Ownership in Lincolndale
Of the total 452 dwellings in Lincolndale, owner-occupied units account for 428 (94.7%), while renter-occupied units make up 24 (5.3%).
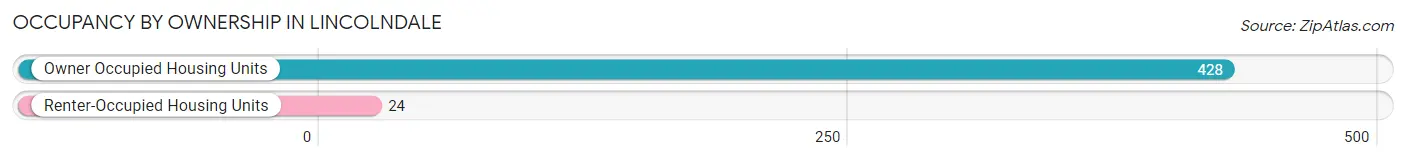
| Occupancy | # Housing Units | % Housing Units |
| Owner Occupied Housing Units | 428 | 94.7% |
| Renter-Occupied Housing Units | 24 | 5.3% |
| Total Occupied Housing Units | 452 | 100.0% |
Occupancy by Household Size in Lincolndale
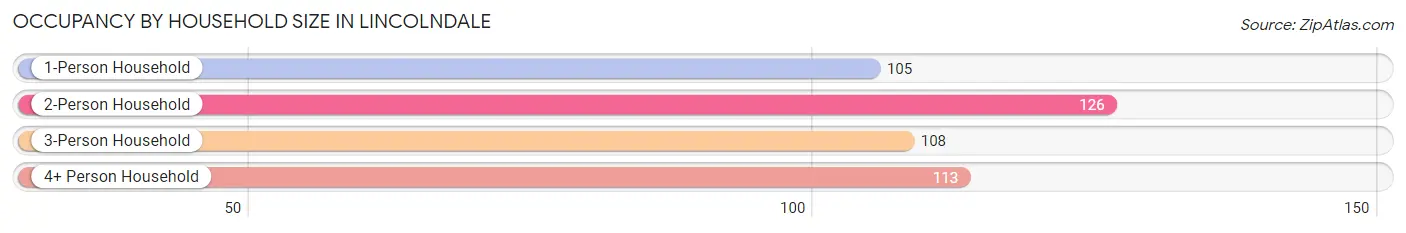
| Household Size | # Housing Units | % Housing Units |
| 1-Person Household | 105 | 23.2% |
| 2-Person Household | 126 | 27.9% |
| 3-Person Household | 108 | 23.9% |
| 4+ Person Household | 113 | 25.0% |
| Total Housing Units | 452 | 100.0% |
Occupancy by Ownership by Household Size in Lincolndale
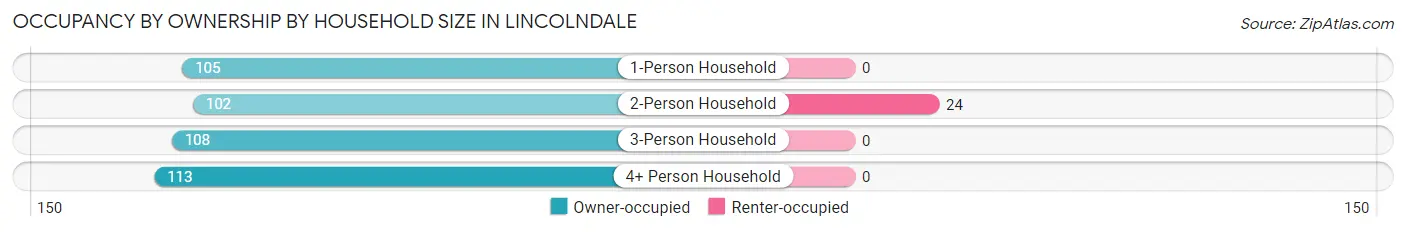
| Household Size | Owner-occupied | Renter-occupied |
| 1-Person Household | 105 (100.0%) | 0 (0.0%) |
| 2-Person Household | 102 (80.9%) | 24 (19.1%) |
| 3-Person Household | 108 (100.0%) | 0 (0.0%) |
| 4+ Person Household | 113 (100.0%) | 0 (0.0%) |
| Total Housing Units | 428 (94.7%) | 24 (5.3%) |
Occupancy by Educational Attainment in Lincolndale
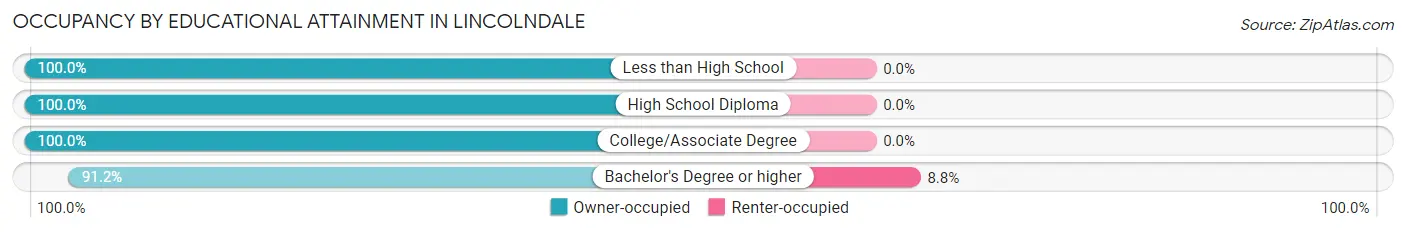
| Household Size | Owner-occupied | Renter-occupied |
| Less than High School | 16 (100.0%) | 0 (0.0%) |
| High School Diploma | 65 (100.0%) | 0 (0.0%) |
| College/Associate Degree | 98 (100.0%) | 0 (0.0%) |
| Bachelor's Degree or higher | 249 (91.2%) | 24 (8.8%) |
Occupancy by Age of Householder in Lincolndale
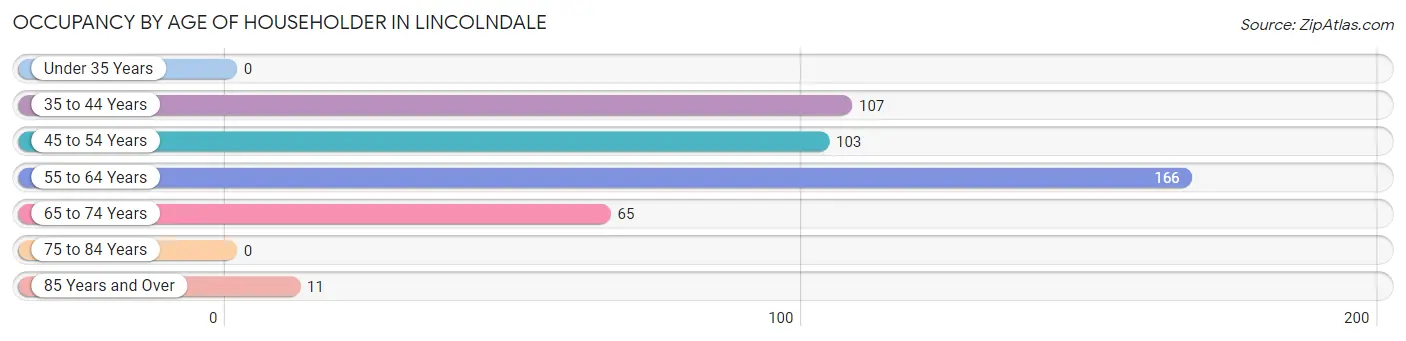
| Age Bracket | # Households | % Households |
| Under 35 Years | 0 | 0.0% |
| 35 to 44 Years | 107 | 23.7% |
| 45 to 54 Years | 103 | 22.8% |
| 55 to 64 Years | 166 | 36.7% |
| 65 to 74 Years | 65 | 14.4% |
| 75 to 84 Years | 0 | 0.0% |
| 85 Years and Over | 11 | 2.4% |
| Total | 452 | 100.0% |
Housing Finances in Lincolndale
Median Income by Occupancy in Lincolndale
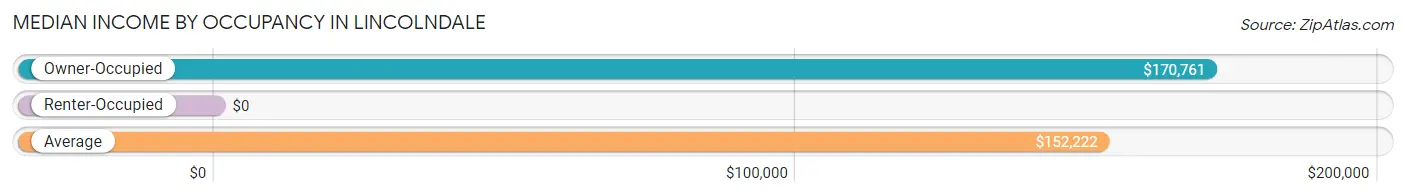
| Occupancy Type | # Households | Median Income |
| Owner-Occupied | 428 (94.7%) | $170,761 |
| Renter-Occupied | 24 (5.3%) | $0 |
| Average | 452 (100.0%) | $152,222 |
Occupancy by Householder Income Bracket in Lincolndale
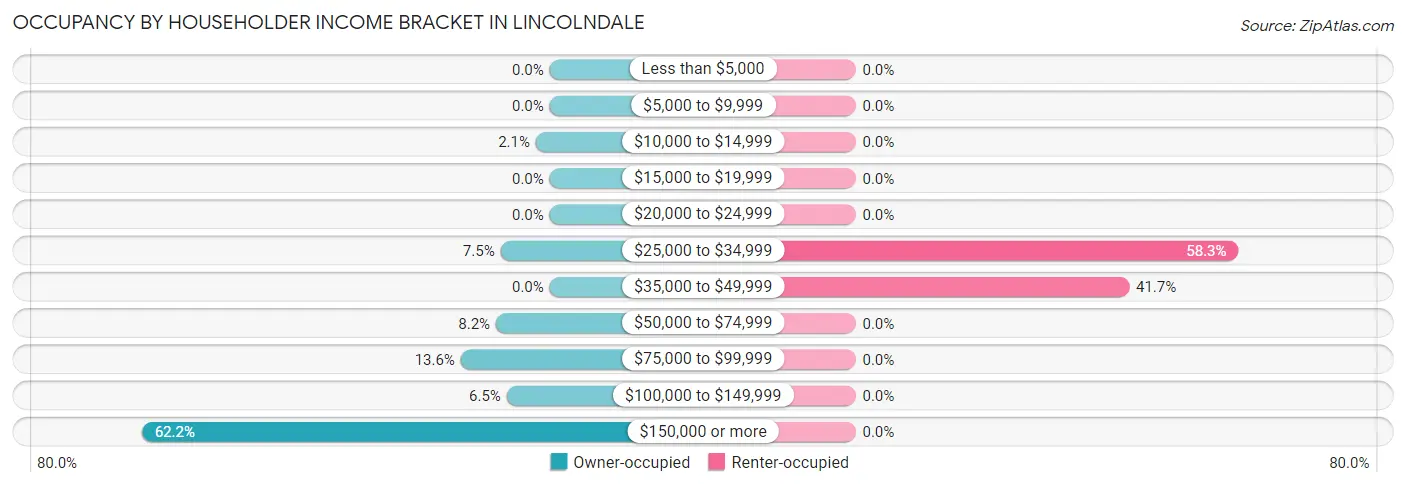
| Income Bracket | Owner-occupied | Renter-occupied |
| Less than $5,000 | 0 (0.0%) | 0 (0.0%) |
| $5,000 to $9,999 | 0 (0.0%) | 0 (0.0%) |
| $10,000 to $14,999 | 9 (2.1%) | 0 (0.0%) |
| $15,000 to $19,999 | 0 (0.0%) | 0 (0.0%) |
| $20,000 to $24,999 | 0 (0.0%) | 0 (0.0%) |
| $25,000 to $34,999 | 32 (7.5%) | 14 (58.3%) |
| $35,000 to $49,999 | 0 (0.0%) | 10 (41.7%) |
| $50,000 to $74,999 | 35 (8.2%) | 0 (0.0%) |
| $75,000 to $99,999 | 58 (13.6%) | 0 (0.0%) |
| $100,000 to $149,999 | 28 (6.5%) | 0 (0.0%) |
| $150,000 or more | 266 (62.2%) | 0 (0.0%) |
| Total | 428 (100.0%) | 24 (100.0%) |
Monthly Housing Cost Tiers in Lincolndale
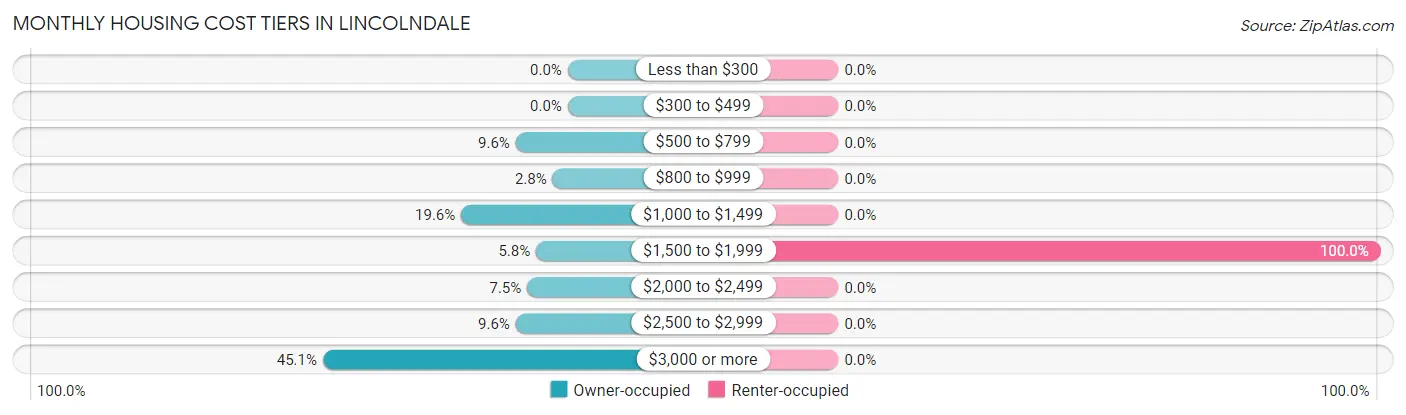
| Monthly Cost | Owner-occupied | Renter-occupied |
| Less than $300 | 0 (0.0%) | 0 (0.0%) |
| $300 to $499 | 0 (0.0%) | 0 (0.0%) |
| $500 to $799 | 41 (9.6%) | 0 (0.0%) |
| $800 to $999 | 12 (2.8%) | 0 (0.0%) |
| $1,000 to $1,499 | 84 (19.6%) | 0 (0.0%) |
| $1,500 to $1,999 | 25 (5.8%) | 24 (100.0%) |
| $2,000 to $2,499 | 32 (7.5%) | 0 (0.0%) |
| $2,500 to $2,999 | 41 (9.6%) | 0 (0.0%) |
| $3,000 or more | 193 (45.1%) | 0 (0.0%) |
| Total | 428 (100.0%) | 24 (100.0%) |
Physical Housing Characteristics in Lincolndale
Housing Structures in Lincolndale
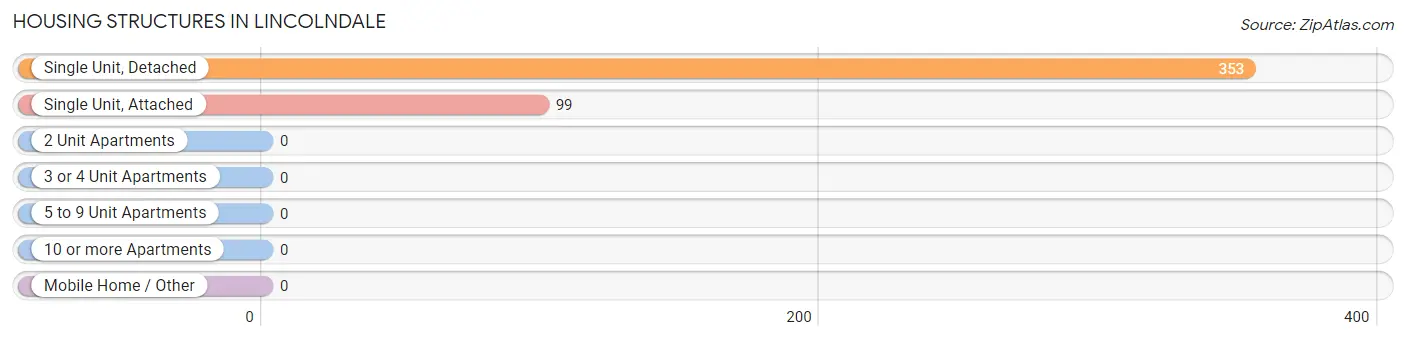
| Structure Type | # Housing Units | % Housing Units |
| Single Unit, Detached | 353 | 78.1% |
| Single Unit, Attached | 99 | 21.9% |
| 2 Unit Apartments | 0 | 0.0% |
| 3 or 4 Unit Apartments | 0 | 0.0% |
| 5 to 9 Unit Apartments | 0 | 0.0% |
| 10 or more Apartments | 0 | 0.0% |
| Mobile Home / Other | 0 | 0.0% |
| Total | 452 | 100.0% |
Housing Structures by Occupancy in Lincolndale
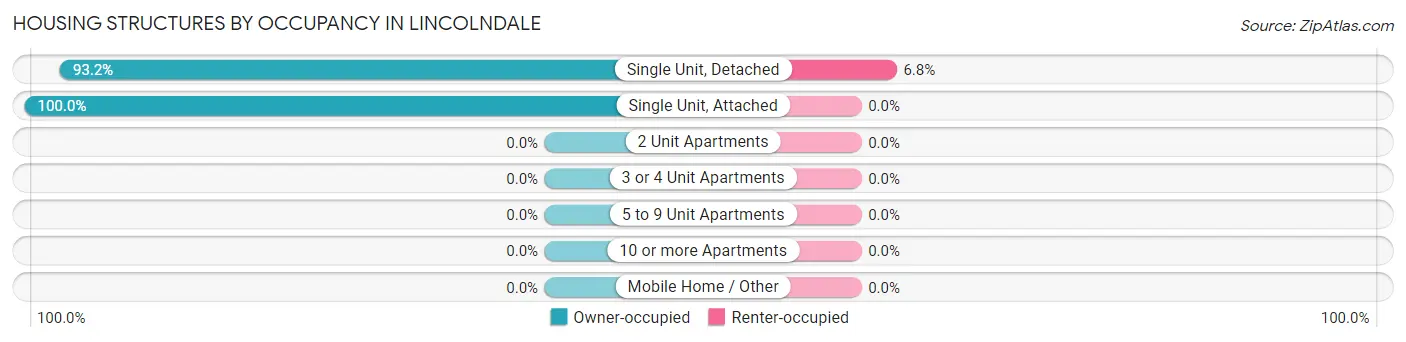
| Structure Type | Owner-occupied | Renter-occupied |
| Single Unit, Detached | 329 (93.2%) | 24 (6.8%) |
| Single Unit, Attached | 99 (100.0%) | 0 (0.0%) |
| 2 Unit Apartments | 0 (0.0%) | 0 (0.0%) |
| 3 or 4 Unit Apartments | 0 (0.0%) | 0 (0.0%) |
| 5 to 9 Unit Apartments | 0 (0.0%) | 0 (0.0%) |
| 10 or more Apartments | 0 (0.0%) | 0 (0.0%) |
| Mobile Home / Other | 0 (0.0%) | 0 (0.0%) |
| Total | 428 (94.7%) | 24 (5.3%) |
Housing Structures by Number of Rooms in Lincolndale
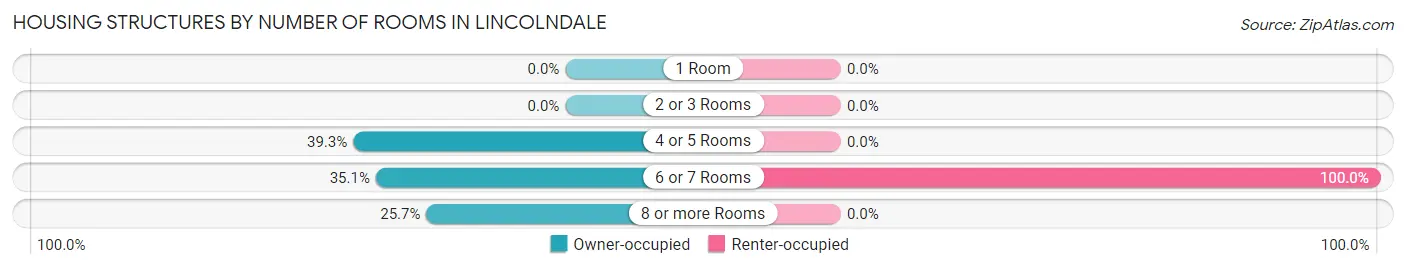
| Number of Rooms | Owner-occupied | Renter-occupied |
| 1 Room | 0 (0.0%) | 0 (0.0%) |
| 2 or 3 Rooms | 0 (0.0%) | 0 (0.0%) |
| 4 or 5 Rooms | 168 (39.3%) | 0 (0.0%) |
| 6 or 7 Rooms | 150 (35.0%) | 24 (100.0%) |
| 8 or more Rooms | 110 (25.7%) | 0 (0.0%) |
| Total | 428 (100.0%) | 24 (100.0%) |
Housing Structure by Heating Type in Lincolndale
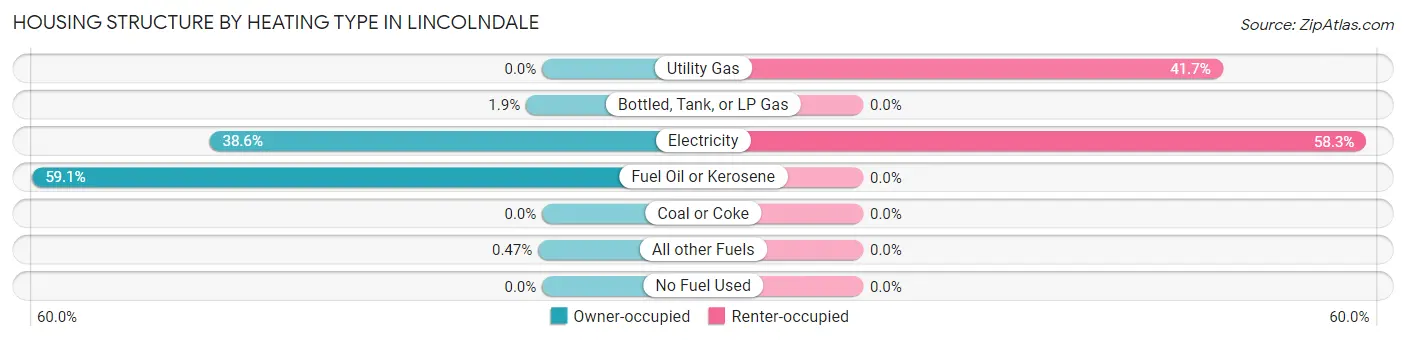
| Heating Type | Owner-occupied | Renter-occupied |
| Utility Gas | 0 (0.0%) | 10 (41.7%) |
| Bottled, Tank, or LP Gas | 8 (1.9%) | 0 (0.0%) |
| Electricity | 165 (38.6%) | 14 (58.3%) |
| Fuel Oil or Kerosene | 253 (59.1%) | 0 (0.0%) |
| Coal or Coke | 0 (0.0%) | 0 (0.0%) |
| All other Fuels | 2 (0.5%) | 0 (0.0%) |
| No Fuel Used | 0 (0.0%) | 0 (0.0%) |
| Total | 428 (100.0%) | 24 (100.0%) |
Household Vehicle Usage in Lincolndale
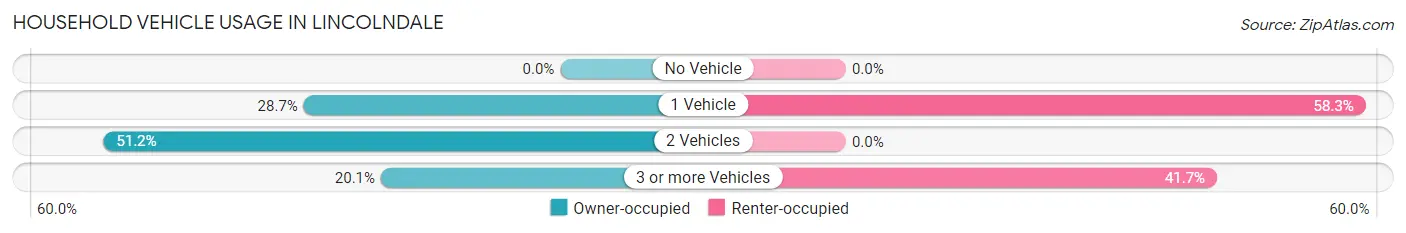
| Vehicles per Household | Owner-occupied | Renter-occupied |
| No Vehicle | 0 (0.0%) | 0 (0.0%) |
| 1 Vehicle | 123 (28.7%) | 14 (58.3%) |
| 2 Vehicles | 219 (51.2%) | 0 (0.0%) |
| 3 or more Vehicles | 86 (20.1%) | 10 (41.7%) |
| Total | 428 (100.0%) | 24 (100.0%) |
Real Estate & Mortgages in Lincolndale
Real Estate and Mortgage Overview in Lincolndale
| Characteristic | Without Mortgage | With Mortgage |
| Housing Units | 143 | 285 |
| Median Property Value | $407,400 | $490,000 |
| Median Household Income | $90,536 | $250 |
| Monthly Housing Costs | $1,319 | $193 |
| Real Estate Taxes | $7,841 | $0 |
Property Value by Mortgage Status in Lincolndale
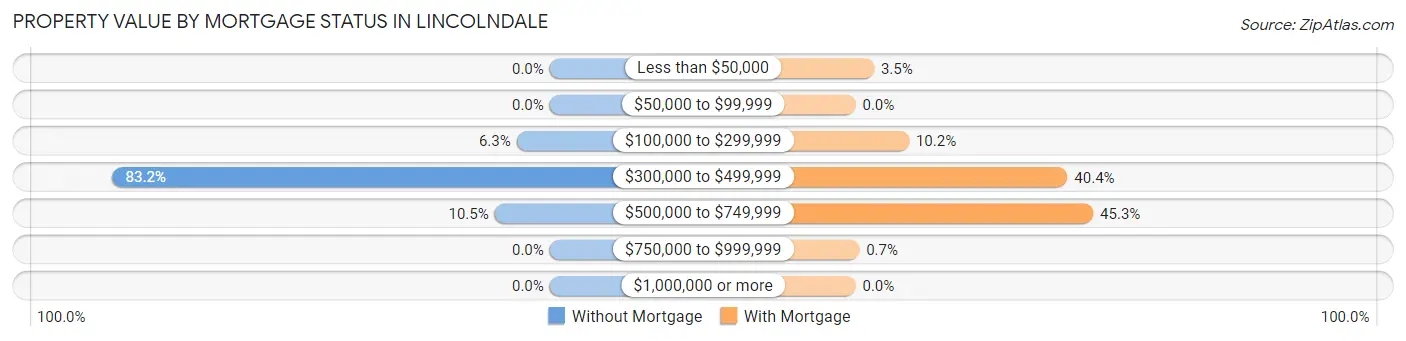
| Property Value | Without Mortgage | With Mortgage |
| Less than $50,000 | 0 (0.0%) | 10 (3.5%) |
| $50,000 to $99,999 | 0 (0.0%) | 0 (0.0%) |
| $100,000 to $299,999 | 9 (6.3%) | 29 (10.2%) |
| $300,000 to $499,999 | 119 (83.2%) | 115 (40.4%) |
| $500,000 to $749,999 | 15 (10.5%) | 129 (45.3%) |
| $750,000 to $999,999 | 0 (0.0%) | 2 (0.7%) |
| $1,000,000 or more | 0 (0.0%) | 0 (0.0%) |
| Total | 143 (100.0%) | 285 (100.0%) |
Household Income by Mortgage Status in Lincolndale
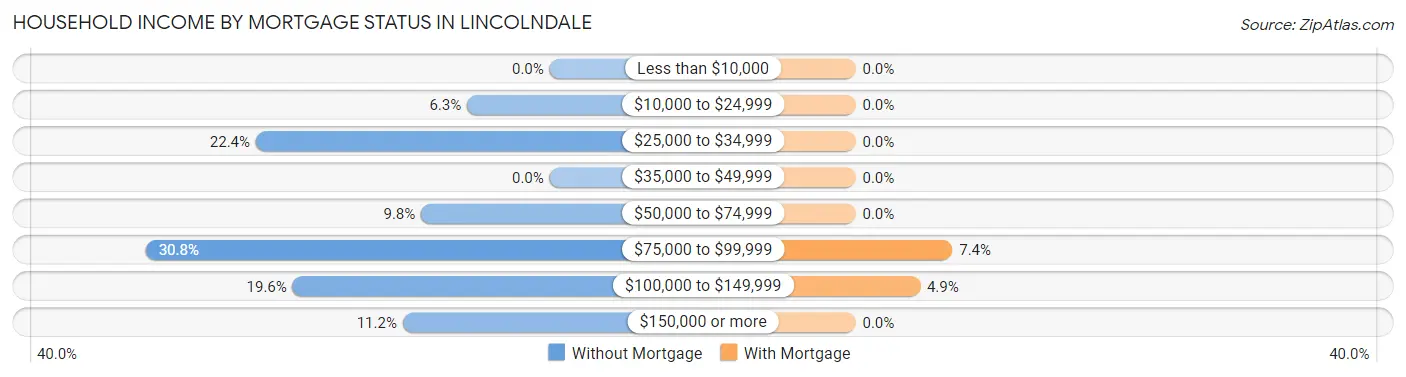
| Household Income | Without Mortgage | With Mortgage |
| Less than $10,000 | 0 (0.0%) | 0 (0.0%) |
| $10,000 to $24,999 | 9 (6.3%) | 0 (0.0%) |
| $25,000 to $34,999 | 32 (22.4%) | 0 (0.0%) |
| $35,000 to $49,999 | 0 (0.0%) | 0 (0.0%) |
| $50,000 to $74,999 | 14 (9.8%) | 0 (0.0%) |
| $75,000 to $99,999 | 44 (30.8%) | 21 (7.4%) |
| $100,000 to $149,999 | 28 (19.6%) | 14 (4.9%) |
| $150,000 or more | 16 (11.2%) | 0 (0.0%) |
| Total | 143 (100.0%) | 285 (100.0%) |
Property Value to Household Income Ratio in Lincolndale
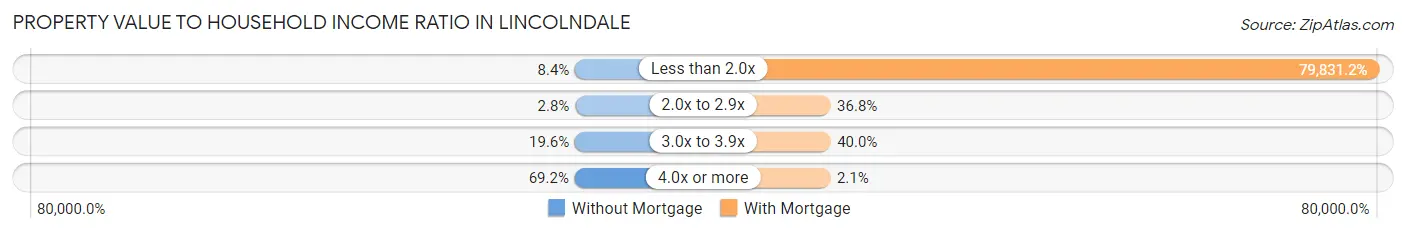
| Value-to-Income Ratio | Without Mortgage | With Mortgage |
| Less than 2.0x | 12 (8.4%) | 227,519 (79,831.2%) |
| 2.0x to 2.9x | 4 (2.8%) | 105 (36.8%) |
| 3.0x to 3.9x | 28 (19.6%) | 114 (40.0%) |
| 4.0x or more | 99 (69.2%) | 6 (2.1%) |
| Total | 143 (100.0%) | 285 (100.0%) |
Real Estate Taxes by Mortgage Status in Lincolndale
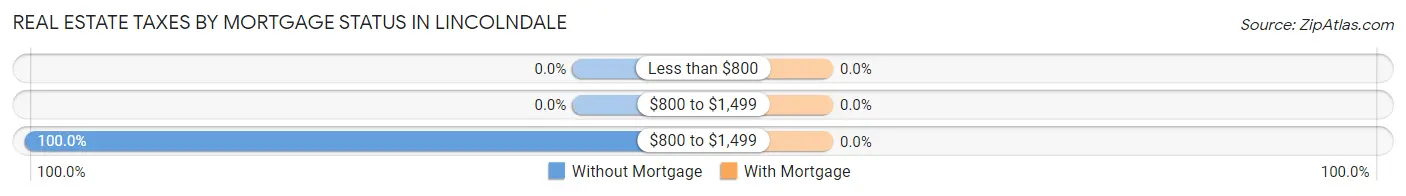
| Property Taxes | Without Mortgage | With Mortgage |
| Less than $800 | 0 (0.0%) | 0 (0.0%) |
| $800 to $1,499 | 0 (0.0%) | 0 (0.0%) |
| $800 to $1,499 | 143 (100.0%) | 0 (0.0%) |
| Total | 143 (100.0%) | 285 (100.0%) |
Health & Disability in Lincolndale
Health Insurance Coverage by Age in Lincolndale
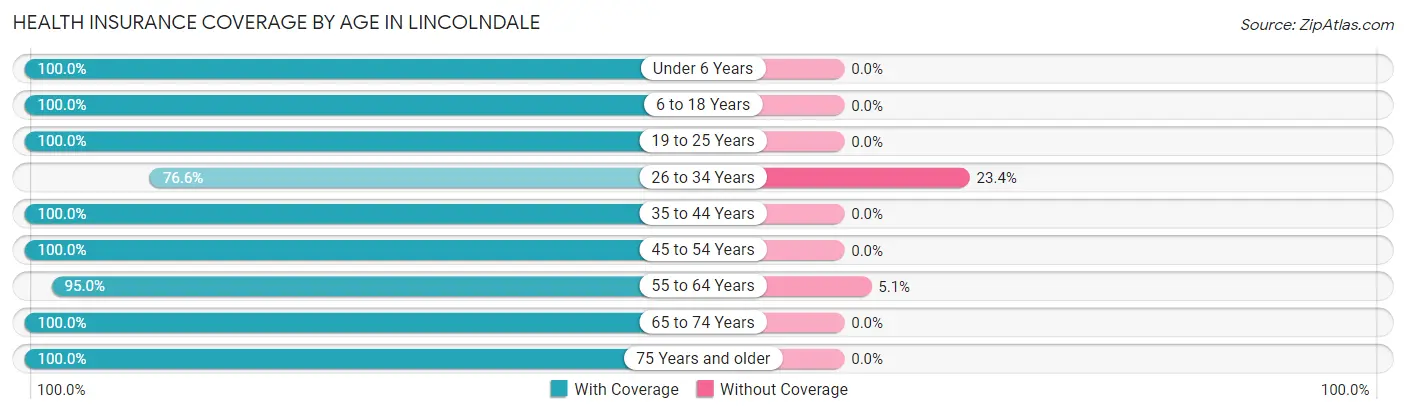
| Age Bracket | With Coverage | Without Coverage |
| Under 6 Years | 18 (100.0%) | 0 (0.0%) |
| 6 to 18 Years | 253 (100.0%) | 0 (0.0%) |
| 19 to 25 Years | 69 (100.0%) | 0 (0.0%) |
| 26 to 34 Years | 59 (76.6%) | 18 (23.4%) |
| 35 to 44 Years | 238 (100.0%) | 0 (0.0%) |
| 45 to 54 Years | 196 (100.0%) | 0 (0.0%) |
| 55 to 64 Years | 263 (95.0%) | 14 (5.1%) |
| 65 to 74 Years | 67 (100.0%) | 0 (0.0%) |
| 75 Years and older | 22 (100.0%) | 0 (0.0%) |
| Total | 1,185 (97.4%) | 32 (2.6%) |
Health Insurance Coverage by Citizenship Status in Lincolndale
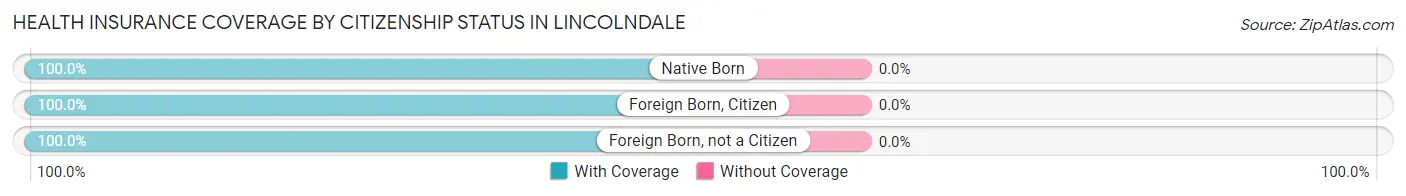
| Citizenship Status | With Coverage | Without Coverage |
| Native Born | 18 (100.0%) | 0 (0.0%) |
| Foreign Born, Citizen | 253 (100.0%) | 0 (0.0%) |
| Foreign Born, not a Citizen | 69 (100.0%) | 0 (0.0%) |
Health Insurance Coverage by Household Income in Lincolndale
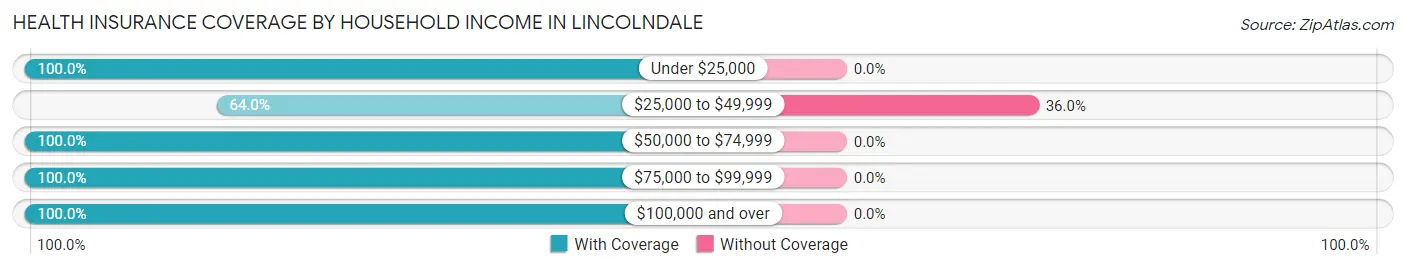
| Household Income | With Coverage | Without Coverage |
| Under $25,000 | 9 (100.0%) | 0 (0.0%) |
| $25,000 to $49,999 | 57 (64.0%) | 32 (36.0%) |
| $50,000 to $74,999 | 57 (100.0%) | 0 (0.0%) |
| $75,000 to $99,999 | 102 (100.0%) | 0 (0.0%) |
| $100,000 and over | 960 (100.0%) | 0 (0.0%) |
Public vs Private Health Insurance Coverage by Age in Lincolndale
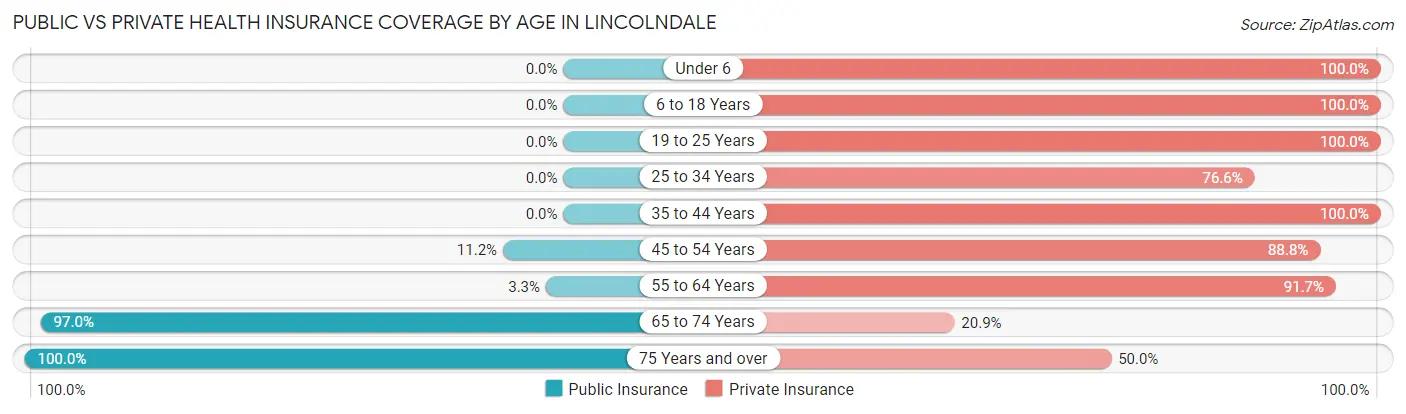
| Age Bracket | Public Insurance | Private Insurance |
| Under 6 | 0 (0.0%) | 18 (100.0%) |
| 6 to 18 Years | 0 (0.0%) | 253 (100.0%) |
| 19 to 25 Years | 0 (0.0%) | 69 (100.0%) |
| 25 to 34 Years | 0 (0.0%) | 59 (76.6%) |
| 35 to 44 Years | 0 (0.0%) | 238 (100.0%) |
| 45 to 54 Years | 22 (11.2%) | 174 (88.8%) |
| 55 to 64 Years | 9 (3.3%) | 254 (91.7%) |
| 65 to 74 Years | 65 (97.0%) | 14 (20.9%) |
| 75 Years and over | 22 (100.0%) | 11 (50.0%) |
| Total | 118 (9.7%) | 1,090 (89.6%) |
Disability Status by Sex by Age in Lincolndale
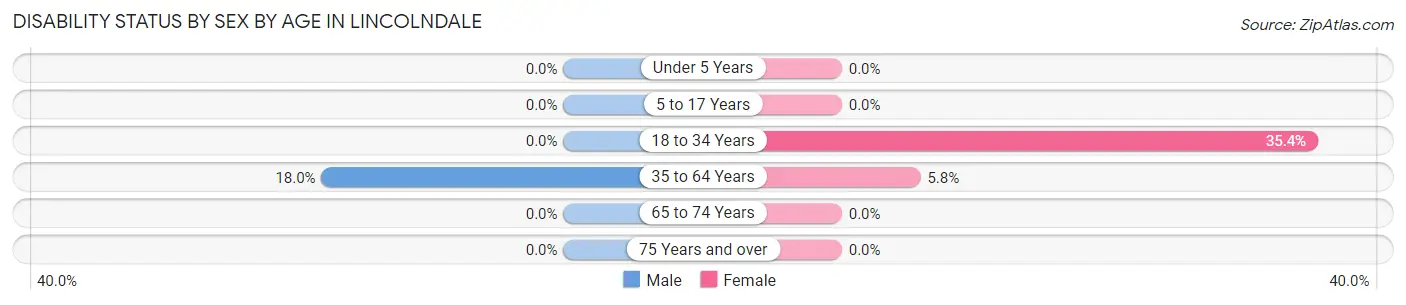
| Age Bracket | Male | Female |
| Under 5 Years | 0 (0.0%) | 0 (0.0%) |
| 5 to 17 Years | 0 (0.0%) | 0 (0.0%) |
| 18 to 34 Years | 0 (0.0%) | 35 (35.3%) |
| 35 to 64 Years | 60 (18.0%) | 22 (5.8%) |
| 65 to 74 Years | 0 (0.0%) | 0 (0.0%) |
| 75 Years and over | 0 (0.0%) | 0 (0.0%) |
Disability Class by Sex by Age in Lincolndale
Disability Class: Hearing Difficulty
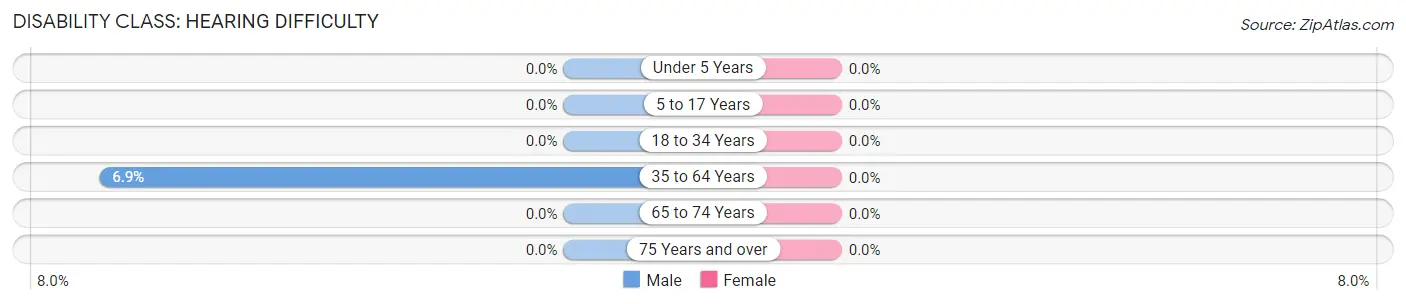
| Age Bracket | Male | Female |
| Under 5 Years | 0 (0.0%) | 0 (0.0%) |
| 5 to 17 Years | 0 (0.0%) | 0 (0.0%) |
| 18 to 34 Years | 0 (0.0%) | 0 (0.0%) |
| 35 to 64 Years | 23 (6.9%) | 0 (0.0%) |
| 65 to 74 Years | 0 (0.0%) | 0 (0.0%) |
| 75 Years and over | 0 (0.0%) | 0 (0.0%) |
Disability Class: Vision Difficulty
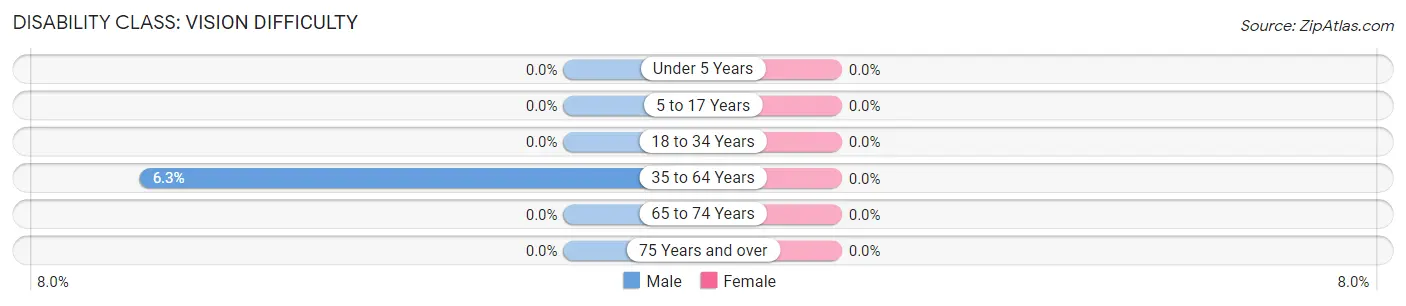
| Age Bracket | Male | Female |
| Under 5 Years | 0 (0.0%) | 0 (0.0%) |
| 5 to 17 Years | 0 (0.0%) | 0 (0.0%) |
| 18 to 34 Years | 0 (0.0%) | 0 (0.0%) |
| 35 to 64 Years | 21 (6.3%) | 0 (0.0%) |
| 65 to 74 Years | 0 (0.0%) | 0 (0.0%) |
| 75 Years and over | 0 (0.0%) | 0 (0.0%) |
Disability Class: Cognitive Difficulty
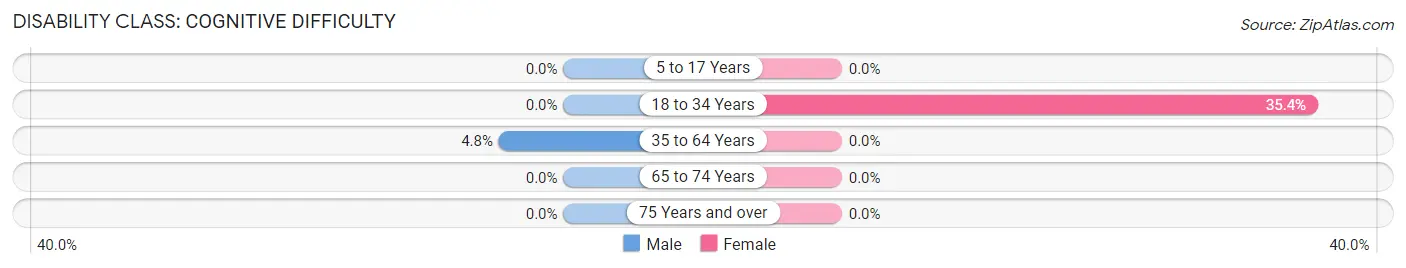
| Age Bracket | Male | Female |
| 5 to 17 Years | 0 (0.0%) | 0 (0.0%) |
| 18 to 34 Years | 0 (0.0%) | 35 (35.3%) |
| 35 to 64 Years | 16 (4.8%) | 0 (0.0%) |
| 65 to 74 Years | 0 (0.0%) | 0 (0.0%) |
| 75 Years and over | 0 (0.0%) | 0 (0.0%) |
Disability Class: Ambulatory Difficulty
| Age Bracket | Male | Female |
| 5 to 17 Years | 0 (0.0%) | 0 (0.0%) |
| 18 to 34 Years | 0 (0.0%) | 0 (0.0%) |
| 35 to 64 Years | 0 (0.0%) | 0 (0.0%) |
| 65 to 74 Years | 0 (0.0%) | 0 (0.0%) |
| 75 Years and over | 0 (0.0%) | 0 (0.0%) |
Disability Class: Self-Care Difficulty
| Age Bracket | Male | Female |
| 5 to 17 Years | 0 (0.0%) | 0 (0.0%) |
| 18 to 34 Years | 0 (0.0%) | 0 (0.0%) |
| 35 to 64 Years | 16 (4.8%) | 0 (0.0%) |
| 65 to 74 Years | 0 (0.0%) | 0 (0.0%) |
| 75 Years and over | 0 (0.0%) | 0 (0.0%) |
Technology Access in Lincolndale
Computing Device Access in Lincolndale
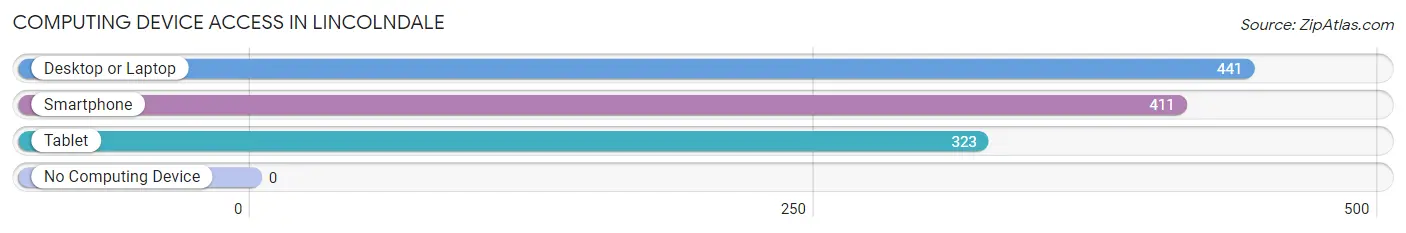
| Device Type | # Households | % Households |
| Desktop or Laptop | 441 | 97.6% |
| Smartphone | 411 | 90.9% |
| Tablet | 323 | 71.5% |
| No Computing Device | 0 | 0.0% |
| Total | 452 | 100.0% |
Internet Access in Lincolndale
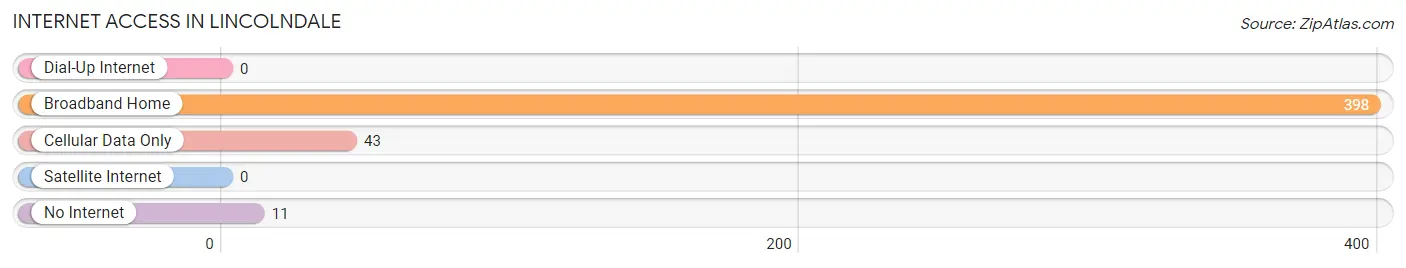
| Internet Type | # Households | % Households |
| Dial-Up Internet | 0 | 0.0% |
| Broadband Home | 398 | 88.0% |
| Cellular Data Only | 43 | 9.5% |
| Satellite Internet | 0 | 0.0% |
| No Internet | 11 | 2.4% |
| Total | 452 | 100.0% |
Lincolndale Summary
Lincolndale is a hamlet located in the town of Somers in Westchester County, New York. It is situated in the southeastern corner of the town, near the border with Putnam County. The hamlet is located approximately 40 miles north of New York City and is part of the New York metropolitan area.
History
The area that is now Lincolndale was originally inhabited by the Wappinger Native American tribe. The first European settlers arrived in the area in the late 17th century. The hamlet was originally known as “Lincoln’s Dale” after the first settler, Abraham Lincoln, who arrived in the area in 1720. The hamlet was officially incorporated in 1845.
Geography
Lincolndale is located in the southeastern corner of the town of Somers, near the border with Putnam County. The hamlet is situated on the banks of the Muscoot River, which flows through the area. The hamlet is located approximately 40 miles north of New York City and is part of the New York metropolitan area.
The hamlet has a total area of 0.9 square miles, all of which is land. The terrain is mostly flat, with some rolling hills. The highest point in the hamlet is approximately 400 feet above sea level.
Economy
The economy of Lincolndale is largely based on agriculture and tourism. The hamlet is home to several farms, which produce a variety of crops, including corn, soybeans, and hay. The hamlet is also home to several wineries, which produce a variety of wines.
The hamlet is also home to several small businesses, including restaurants, shops, and other services. The hamlet is also home to several bed and breakfasts, which attract tourists from around the region.
Demographics
As of the 2010 census, the population of Lincolndale was 1,845. The population is largely white (94.2%), with small percentages of African Americans (2.2%), Asians (1.2%), and Hispanics (1.2%). The median household income is $90,917, and the median home value is $521,400.
The hamlet is served by the Somers Central School District, which includes three elementary schools, one middle school, and one high school. The hamlet is also home to several churches, including the Lincolndale United Methodist Church and the Lincolndale Presbyterian Church.
Common Questions
What is Per Capita Income in Lincolndale?
Per Capita income in Lincolndale is $70,530.
What is the Median Family Income in Lincolndale?
Median Family Income in Lincolndale is $217,917.
What is the Median Household income in Lincolndale?
Median Household Income in Lincolndale is $152,222.
What is Income or Wage Gap in Lincolndale?
Income or Wage Gap in Lincolndale is 18.5%.
Women in Lincolndale earn 81.5 cents for every dollar earned by a man.
What is Inequality or Gini Index in Lincolndale?
Inequality or Gini Index in Lincolndale is 0.39.
What is the Total Population of Lincolndale?
Total Population of Lincolndale is 1,217.
What is the Total Male Population of Lincolndale?
Total Male Population of Lincolndale is 537.
What is the Total Female Population of Lincolndale?
Total Female Population of Lincolndale is 680.
What is the Ratio of Males per 100 Females in Lincolndale?
There are 78.97 Males per 100 Females in Lincolndale.
What is the Ratio of Females per 100 Males in Lincolndale?
There are 126.63 Females per 100 Males in Lincolndale.
What is the Median Population Age in Lincolndale?
Median Population Age in Lincolndale is 42.9 Years.
What is the Average Family Size in Lincolndale
Average Family Size in Lincolndale is 3.1 People.
What is the Average Household Size in Lincolndale
Average Household Size in Lincolndale is 2.7 People.
How Large is the Labor Force in Lincolndale?
There are 772 People in the Labor Forcein in Lincolndale.
What is the Percentage of People in the Labor Force in Lincolndale?
78.1% of People are in the Labor Force in Lincolndale.