Old Bethpage, NY Map & Demographics
Old Bethpage Map
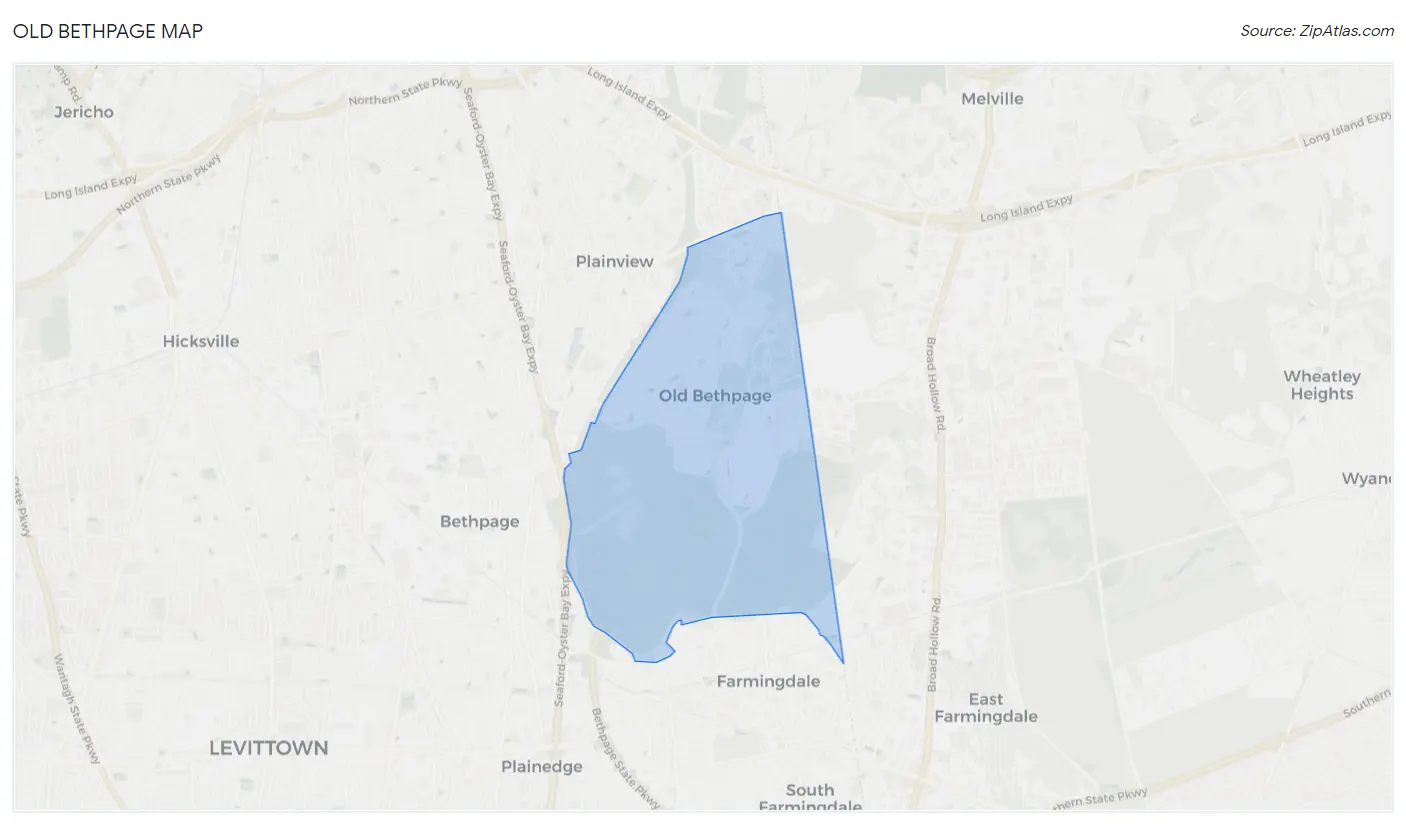
Old Bethpage Overview
$70,478
PER CAPITA INCOME
$203,250
AVG FAMILY INCOME
$180,341
AVG HOUSEHOLD INCOME
26.4%
WAGE / INCOME GAP [ % ]
73.6¢/ $1
WAGE / INCOME GAP [ $ ]
0.41
INEQUALITY / GINI INDEX
5,779
TOTAL POPULATION
2,830
MALE POPULATION
2,949
FEMALE POPULATION
95.96
MALES / 100 FEMALES
104.20
FEMALES / 100 MALES
47.1
MEDIAN AGE
3.2
AVG FAMILY SIZE
2.9
AVG HOUSEHOLD SIZE
3,077
LABOR FORCE [ PEOPLE ]
66.0%
PERCENT IN LABOR FORCE
3.5%
UNEMPLOYMENT RATE
Old Bethpage Zip Codes
Income in Old Bethpage
Income Overview in Old Bethpage
Per Capita Income in Old Bethpage is $70,478, while median incomes of families and households are $203,250 and $180,341 respectively.
| Characteristic | Number | Measure |
| Per Capita Income | 5,779 | $70,478 |
| Median Family Income | 1,625 | $203,250 |
| Mean Family Income | 1,625 | $220,695 |
| Median Household Income | 1,994 | $180,341 |
| Mean Household Income | 1,994 | $196,272 |
| Income Deficit | 1,625 | $0 |
| Wage / Income Gap (%) | 5,779 | 26.44% |
| Wage / Income Gap ($) | 5,779 | 73.56¢ per $1 |
| Gini / Inequality Index | 5,779 | 0.41 |
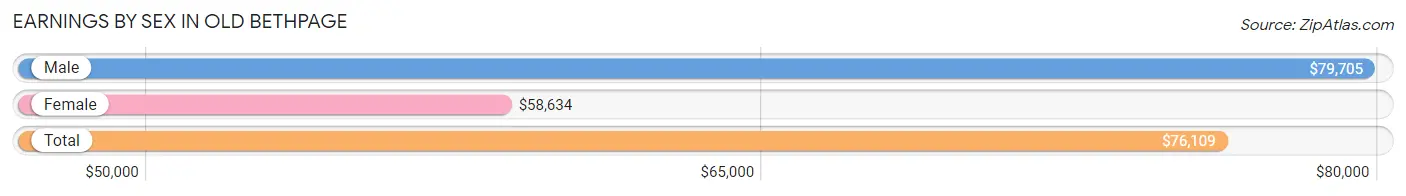
Earnings by Sex in Old Bethpage
Average Earnings in Old Bethpage are $76,109, $79,705 for men and $58,634 for women, a difference of 26.4%.
| Sex | Number | Average Earnings |
| Male | 1,696 (53.3%) | $79,705 |
| Female | 1,485 (46.7%) | $58,634 |
| Total | 3,181 (100.0%) | $76,109 |
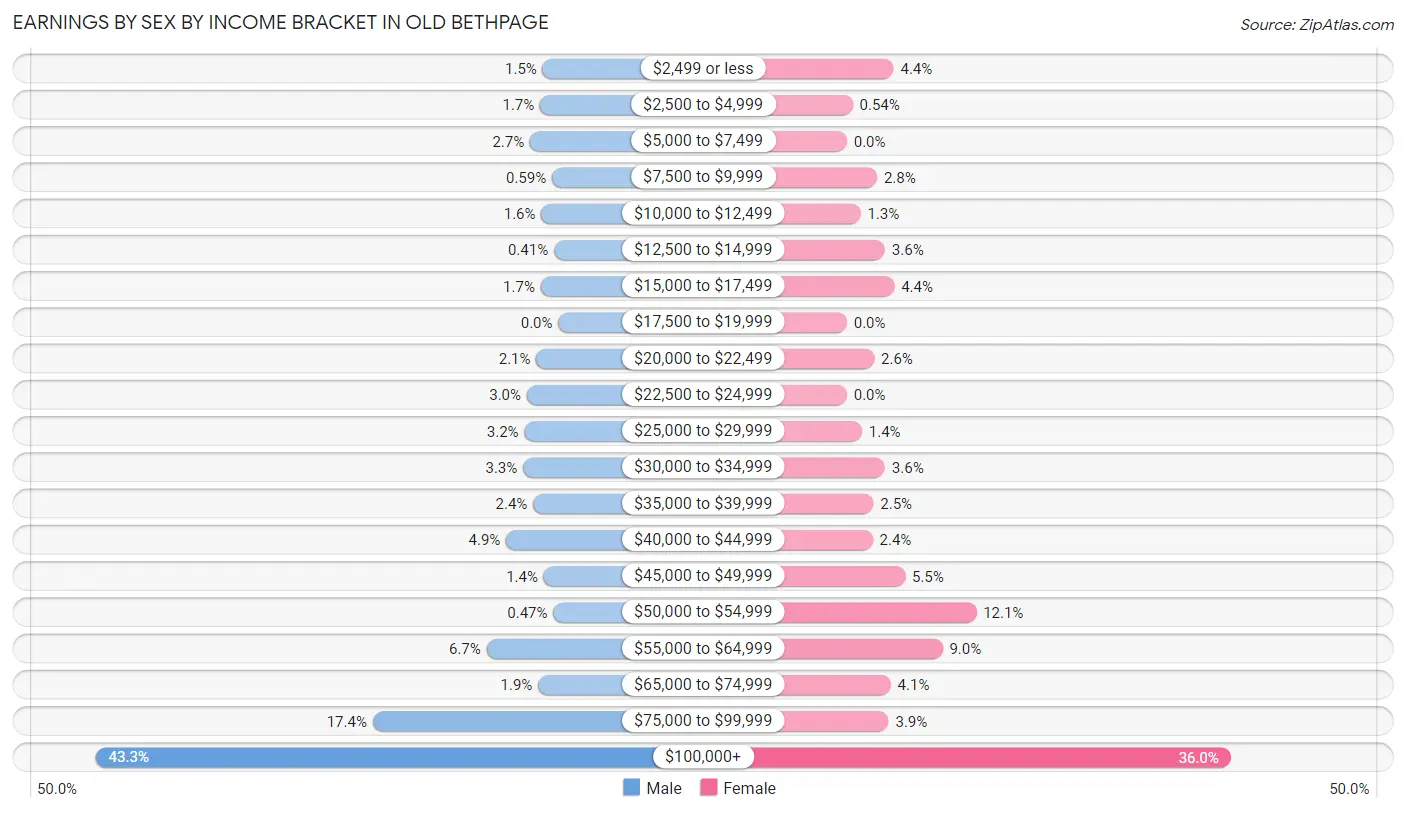
Earnings by Sex by Income Bracket in Old Bethpage
The most common earnings brackets in Old Bethpage are $100,000+ for men (735 | 43.3%) and $100,000+ for women (534 | 36.0%).
| Income | Male | Female |
| $2,499 or less | 25 (1.5%) | 65 (4.4%) |
| $2,500 to $4,999 | 29 (1.7%) | 8 (0.5%) |
| $5,000 to $7,499 | 45 (2.6%) | 0 (0.0%) |
| $7,500 to $9,999 | 10 (0.6%) | 42 (2.8%) |
| $10,000 to $12,499 | 27 (1.6%) | 19 (1.3%) |
| $12,500 to $14,999 | 7 (0.4%) | 53 (3.6%) |
| $15,000 to $17,499 | 28 (1.7%) | 66 (4.4%) |
| $17,500 to $19,999 | 0 (0.0%) | 0 (0.0%) |
| $20,000 to $22,499 | 35 (2.1%) | 38 (2.6%) |
| $22,500 to $24,999 | 50 (2.9%) | 0 (0.0%) |
| $25,000 to $29,999 | 54 (3.2%) | 21 (1.4%) |
| $30,000 to $34,999 | 56 (3.3%) | 53 (3.6%) |
| $35,000 to $39,999 | 40 (2.4%) | 37 (2.5%) |
| $40,000 to $44,999 | 83 (4.9%) | 36 (2.4%) |
| $45,000 to $49,999 | 23 (1.4%) | 81 (5.4%) |
| $50,000 to $54,999 | 8 (0.5%) | 180 (12.1%) |
| $55,000 to $64,999 | 114 (6.7%) | 133 (9.0%) |
| $65,000 to $74,999 | 32 (1.9%) | 61 (4.1%) |
| $75,000 to $99,999 | 295 (17.4%) | 58 (3.9%) |
| $100,000+ | 735 (43.3%) | 534 (36.0%) |
| Total | 1,696 (100.0%) | 1,485 (100.0%) |
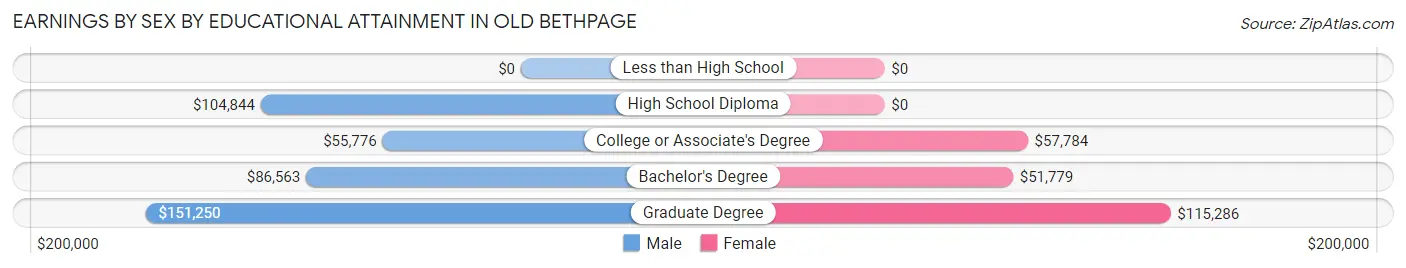
Earnings by Sex by Educational Attainment in Old Bethpage
Average earnings in Old Bethpage are $91,806 for men and $61,136 for women, a difference of 33.4%. Men with an educational attainment of graduate degree enjoy the highest average annual earnings of $151,250, while those with college or associate's degree education earn the least with $55,776. Women with an educational attainment of graduate degree earn the most with the average annual earnings of $115,286, while those with bachelor's degree education have the smallest earnings of $51,779.
| Educational Attainment | Male Income | Female Income |
| Less than High School | - | - |
| High School Diploma | $104,844 | $0 |
| College or Associate's Degree | $55,776 | $57,784 |
| Bachelor's Degree | $86,563 | $51,779 |
| Graduate Degree | $151,250 | $115,286 |
| Total | $91,806 | $61,136 |
Family Income in Old Bethpage
Family Income Brackets in Old Bethpage
According to the Old Bethpage family income data, there are 856 families falling into the $200,000+ income range, which is the most common income bracket and makes up 52.7% of all families.
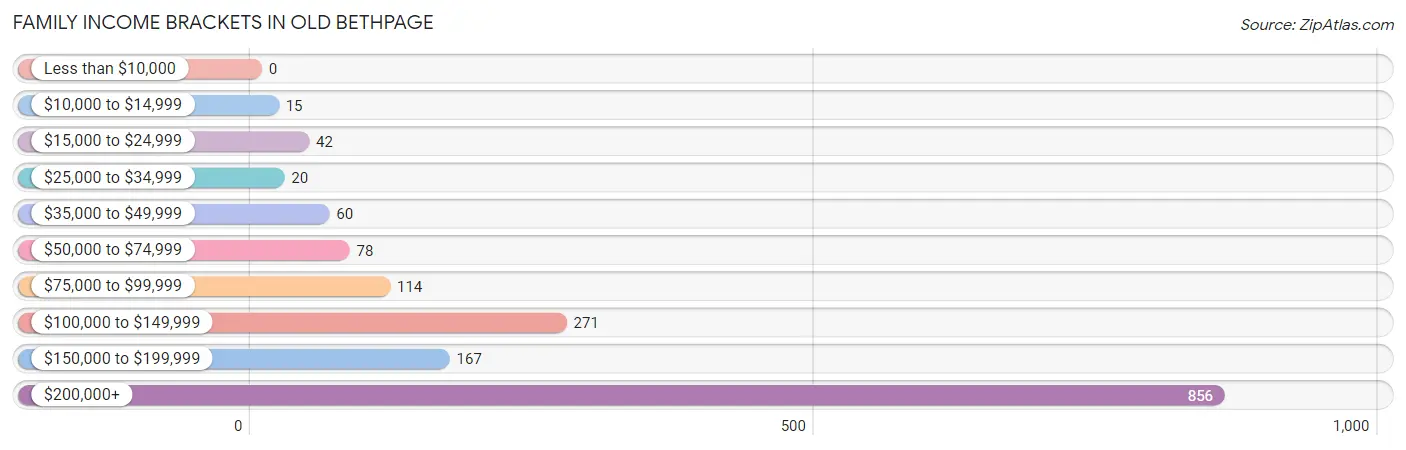
| Income Bracket | # Families | % Families |
| Less than $10,000 | 0 | 0.0% |
| $10,000 to $14,999 | 15 | 0.9% |
| $15,000 to $24,999 | 42 | 2.6% |
| $25,000 to $34,999 | 20 | 1.2% |
| $35,000 to $49,999 | 60 | 3.7% |
| $50,000 to $74,999 | 78 | 4.8% |
| $75,000 to $99,999 | 114 | 7.0% |
| $100,000 to $149,999 | 271 | 16.7% |
| $150,000 to $199,999 | 167 | 10.3% |
| $200,000+ | 856 | 52.7% |
Family Income by Famaliy Size in Old Bethpage
5-person families (163 | 10.0%) account for the highest median family income in Old Bethpage with $250,001 per family, while 2-person families (767 | 47.2%) have the highest median income of $113,245 per family member.
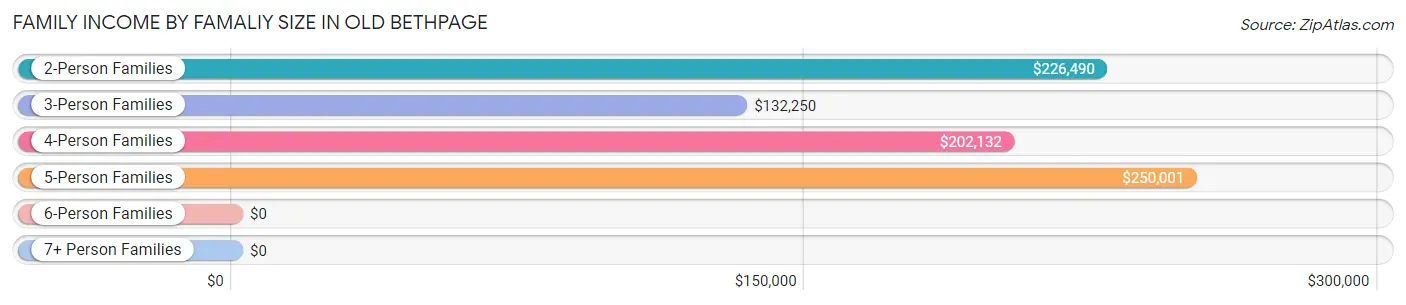
| Income Bracket | # Families | Median Income |
| 2-Person Families | 767 (47.2%) | $226,490 |
| 3-Person Families | 324 (19.9%) | $132,250 |
| 4-Person Families | 354 (21.8%) | $202,132 |
| 5-Person Families | 163 (10.0%) | $250,001 |
| 6-Person Families | 13 (0.8%) | $0 |
| 7+ Person Families | 4 (0.3%) | $0 |
| Total | 1,625 (100.0%) | $203,250 |
Family Income by Number of Earners in Old Bethpage
The median family income in Old Bethpage is $203,250, with families comprising 2 earners (681) having the highest median family income of $234,026, while families with no earners (222) have the lowest median family income of $68,333, accounting for 41.9% and 13.7% of families, respectively.
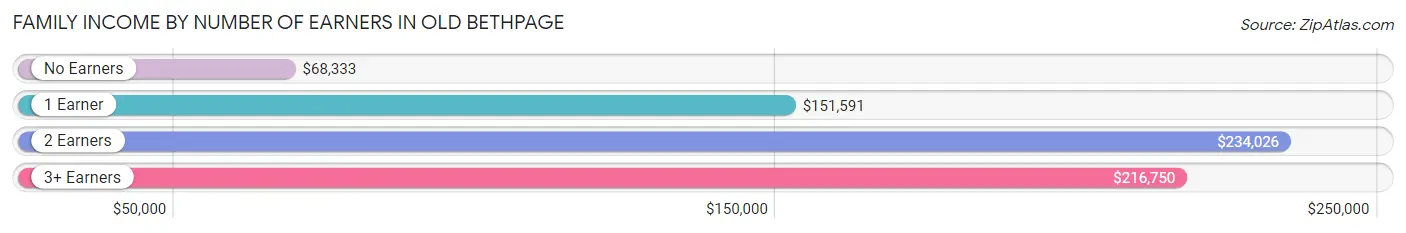
| Number of Earners | # Families | Median Income |
| No Earners | 222 (13.7%) | $68,333 |
| 1 Earner | 452 (27.8%) | $151,591 |
| 2 Earners | 681 (41.9%) | $234,026 |
| 3+ Earners | 270 (16.6%) | $216,750 |
| Total | 1,625 (100.0%) | $203,250 |
Household Income in Old Bethpage
Household Income Brackets in Old Bethpage
With 931 households falling in the category, the $200,000+ income range is the most frequent in Old Bethpage, accounting for 46.7% of all households. In contrast, only 30 households (1.5%) fall into the $10,000 to $14,999 income bracket, making it the least populous group.
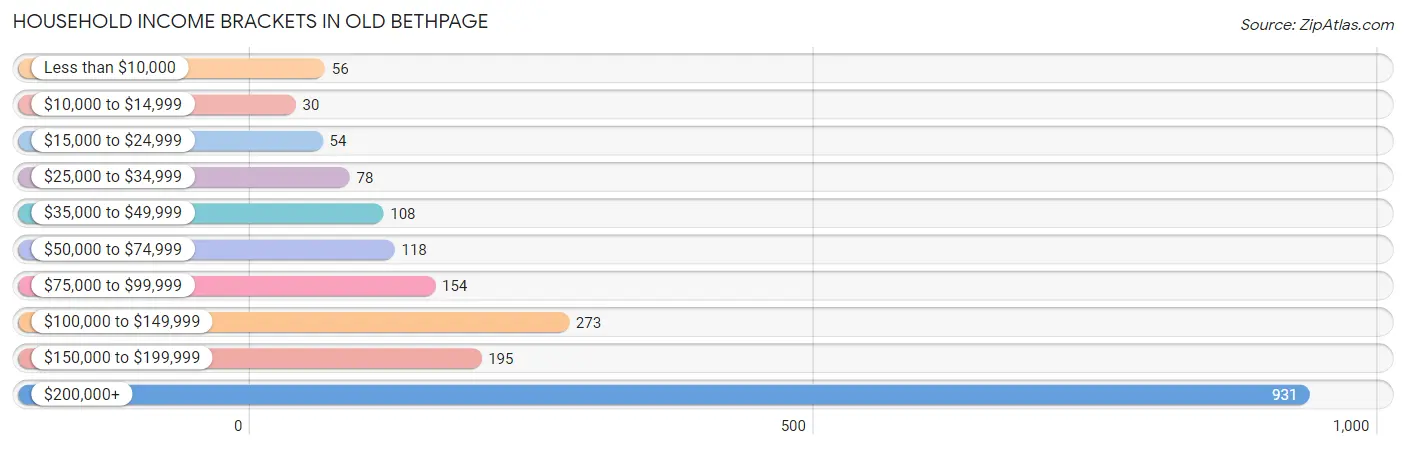
| Income Bracket | # Households | % Households |
| Less than $10,000 | 56 | 2.8% |
| $10,000 to $14,999 | 30 | 1.5% |
| $15,000 to $24,999 | 54 | 2.7% |
| $25,000 to $34,999 | 78 | 3.9% |
| $35,000 to $49,999 | 108 | 5.4% |
| $50,000 to $74,999 | 118 | 5.9% |
| $75,000 to $99,999 | 154 | 7.7% |
| $100,000 to $149,999 | 273 | 13.7% |
| $150,000 to $199,999 | 195 | 9.8% |
| $200,000+ | 931 | 46.7% |
Household Income by Householder Age in Old Bethpage
The median household income in Old Bethpage is $180,341, with the highest median household income of $218,250 found in the 45 to 64 years age bracket for the primary householder. A total of 850 households (42.6%) fall into this category.
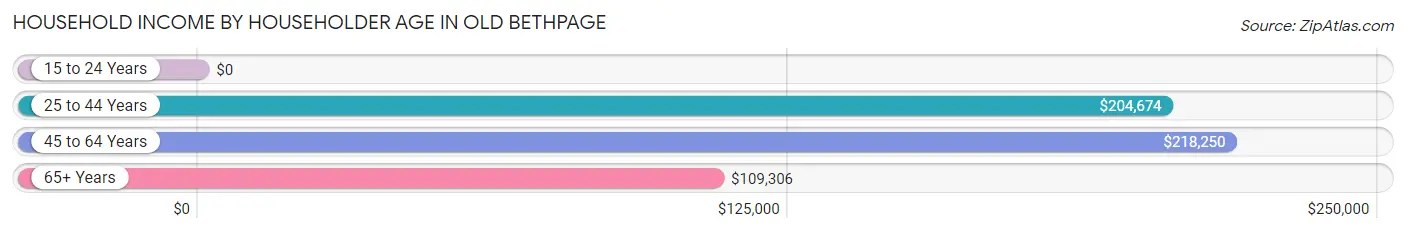
| Income Bracket | # Households | Median Income |
| 15 to 24 Years | 0 (0.0%) | $0 |
| 25 to 44 Years | 368 (18.5%) | $204,674 |
| 45 to 64 Years | 850 (42.6%) | $218,250 |
| 65+ Years | 776 (38.9%) | $109,306 |
| Total | 1,994 (100.0%) | $180,341 |
Poverty in Old Bethpage
Income Below Poverty by Sex and Age in Old Bethpage
With 2.6% poverty level for males and 3.1% for females among the residents of Old Bethpage, 55 to 64 year old males and 65 to 74 year old females are the most vulnerable to poverty, with 41 males (7.7%) and 41 females (14.0%) in their respective age groups living below the poverty level.
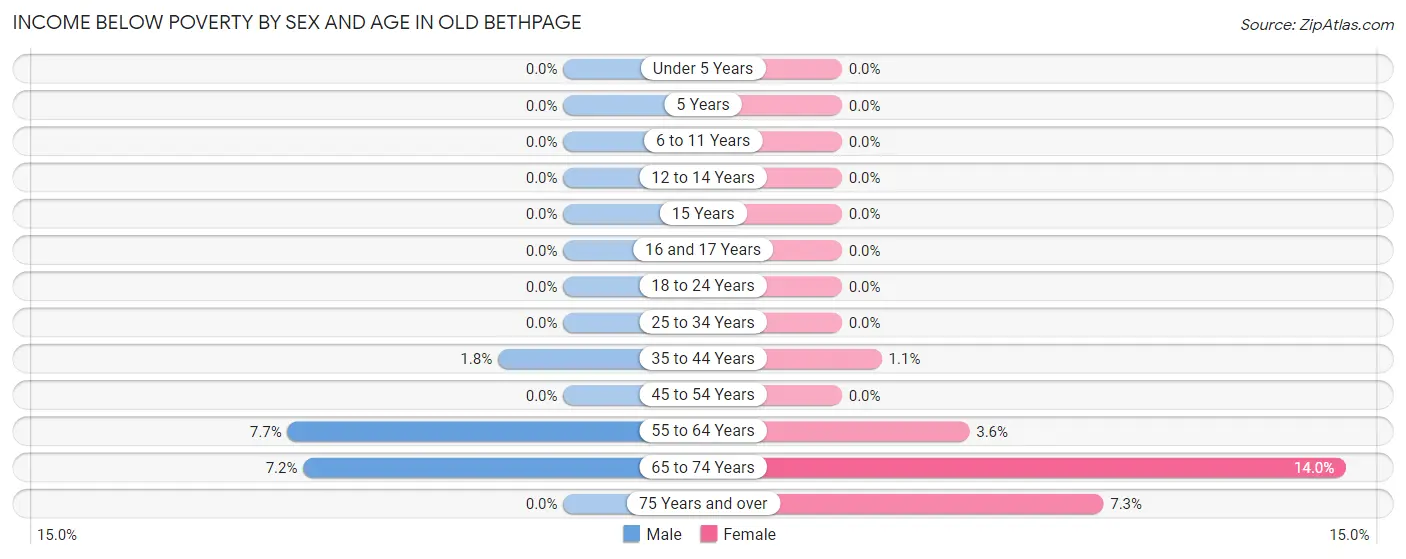
| Age Bracket | Male | Female |
| Under 5 Years | 0 (0.0%) | 0 (0.0%) |
| 5 Years | 0 (0.0%) | 0 (0.0%) |
| 6 to 11 Years | 0 (0.0%) | 0 (0.0%) |
| 12 to 14 Years | 0 (0.0%) | 0 (0.0%) |
| 15 Years | 0 (0.0%) | 0 (0.0%) |
| 16 and 17 Years | 0 (0.0%) | 0 (0.0%) |
| 18 to 24 Years | 0 (0.0%) | 0 (0.0%) |
| 25 to 34 Years | 0 (0.0%) | 0 (0.0%) |
| 35 to 44 Years | 6 (1.8%) | 4 (1.1%) |
| 45 to 54 Years | 0 (0.0%) | 0 (0.0%) |
| 55 to 64 Years | 41 (7.7%) | 20 (3.5%) |
| 65 to 74 Years | 27 (7.2%) | 41 (14.0%) |
| 75 Years and over | 0 (0.0%) | 26 (7.3%) |
| Total | 74 (2.6%) | 91 (3.1%) |
Income Above Poverty by Sex and Age in Old Bethpage
According to the poverty statistics in Old Bethpage, males aged under 5 years and females aged under 5 years are the age groups that are most secure financially, with 100.0% of males and 100.0% of females in these age groups living above the poverty line.
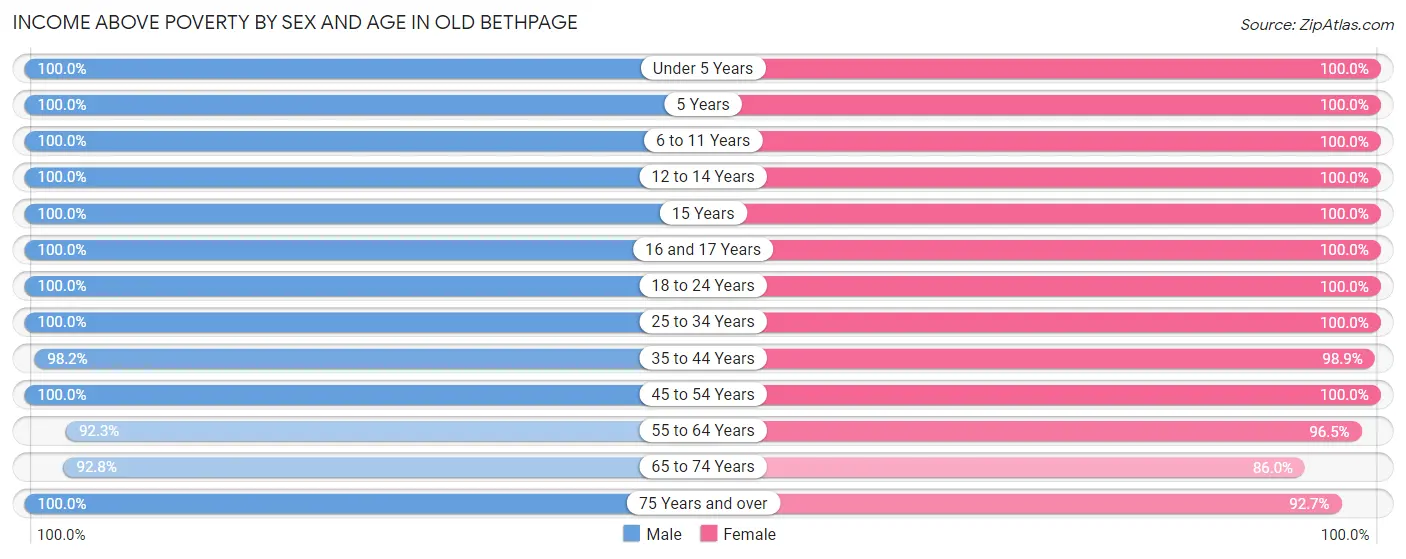
| Age Bracket | Male | Female |
| Under 5 Years | 224 (100.0%) | 90 (100.0%) |
| 5 Years | 32 (100.0%) | 63 (100.0%) |
| 6 to 11 Years | 156 (100.0%) | 303 (100.0%) |
| 12 to 14 Years | 79 (100.0%) | 102 (100.0%) |
| 15 Years | 16 (100.0%) | 52 (100.0%) |
| 16 and 17 Years | 84 (100.0%) | 56 (100.0%) |
| 18 to 24 Years | 262 (100.0%) | 52 (100.0%) |
| 25 to 34 Years | 158 (100.0%) | 343 (100.0%) |
| 35 to 44 Years | 323 (98.2%) | 356 (98.9%) |
| 45 to 54 Years | 371 (100.0%) | 316 (100.0%) |
| 55 to 64 Years | 493 (92.3%) | 543 (96.5%) |
| 65 to 74 Years | 346 (92.8%) | 251 (86.0%) |
| 75 Years and over | 212 (100.0%) | 331 (92.7%) |
| Total | 2,756 (97.4%) | 2,858 (96.9%) |
Income Below Poverty Among Married-Couple Families in Old Bethpage
The poverty statistics for married-couple families in Old Bethpage show that 1.9% or 27 of the total 1,447 families live below the poverty line. Families with no children have the highest poverty rate of 2.9%, comprising of 27 families. On the other hand, families with 1 or 2 children have the lowest poverty rate of 0.0%, which includes 0 families.
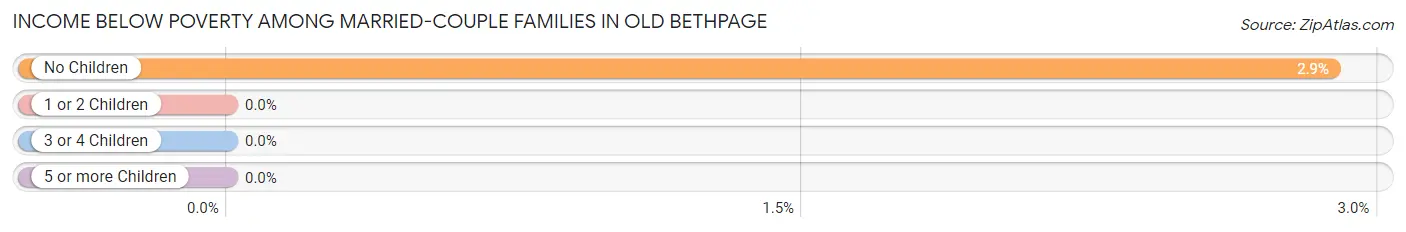
| Children | Above Poverty | Below Poverty |
| No Children | 909 (97.1%) | 27 (2.9%) |
| 1 or 2 Children | 419 (100.0%) | 0 (0.0%) |
| 3 or 4 Children | 92 (100.0%) | 0 (0.0%) |
| 5 or more Children | 0 (0.0%) | 0 (0.0%) |
| Total | 1,420 (98.1%) | 27 (1.9%) |
Income Below Poverty Among Single-Parent Households in Old Bethpage
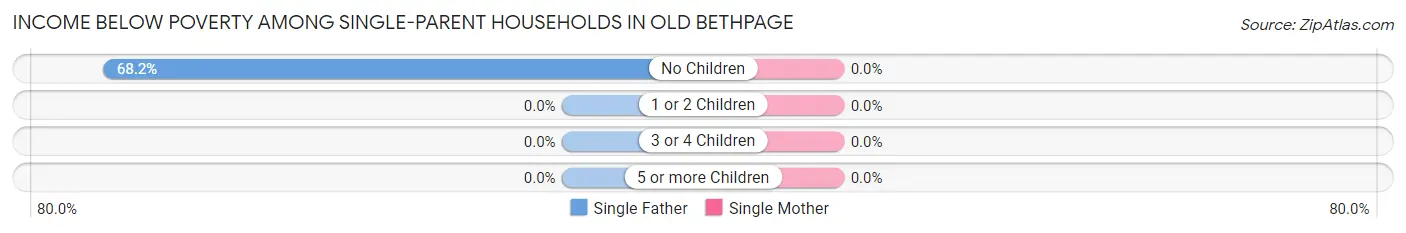
| Children | Single Father | Single Mother |
| No Children | 15 (68.2%) | 0 (0.0%) |
| 1 or 2 Children | 0 (0.0%) | 0 (0.0%) |
| 3 or 4 Children | 0 (0.0%) | 0 (0.0%) |
| 5 or more Children | 0 (0.0%) | 0 (0.0%) |
| Total | 15 (26.8%) | 0 (0.0%) |
Income Below Poverty Among Married-Couple vs Single-Parent Households in Old Bethpage
The poverty data for Old Bethpage shows that 27 of the married-couple family households (1.9%) and 15 of the single-parent households (8.4%) are living below the poverty level. Within the married-couple family households, those with no children have the highest poverty rate, with 27 households (2.9%) falling below the poverty line. Among the single-parent households, those with no children have the highest poverty rate, with 15 household (12.4%) living below poverty.
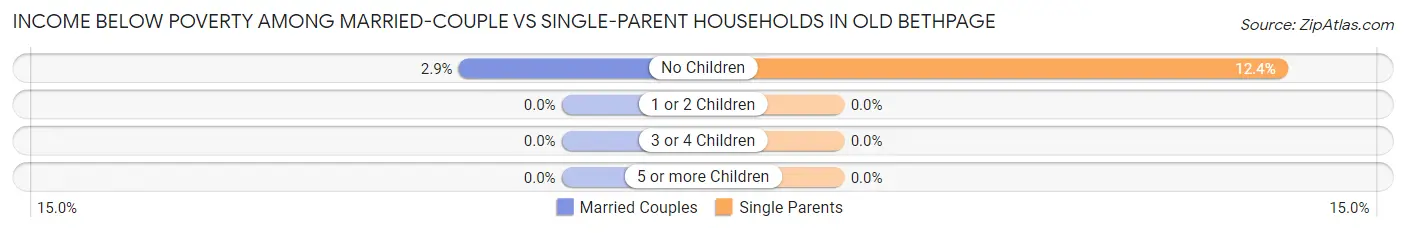
| Children | Married-Couple Families | Single-Parent Households |
| No Children | 27 (2.9%) | 15 (12.4%) |
| 1 or 2 Children | 0 (0.0%) | 0 (0.0%) |
| 3 or 4 Children | 0 (0.0%) | 0 (0.0%) |
| 5 or more Children | 0 (0.0%) | 0 (0.0%) |
| Total | 27 (1.9%) | 15 (8.4%) |
Race in Old Bethpage
The most populous races in Old Bethpage are White / Caucasian (4,632 | 80.1%), Asian (933 | 16.1%), and Two or more Races (193 | 3.3%).
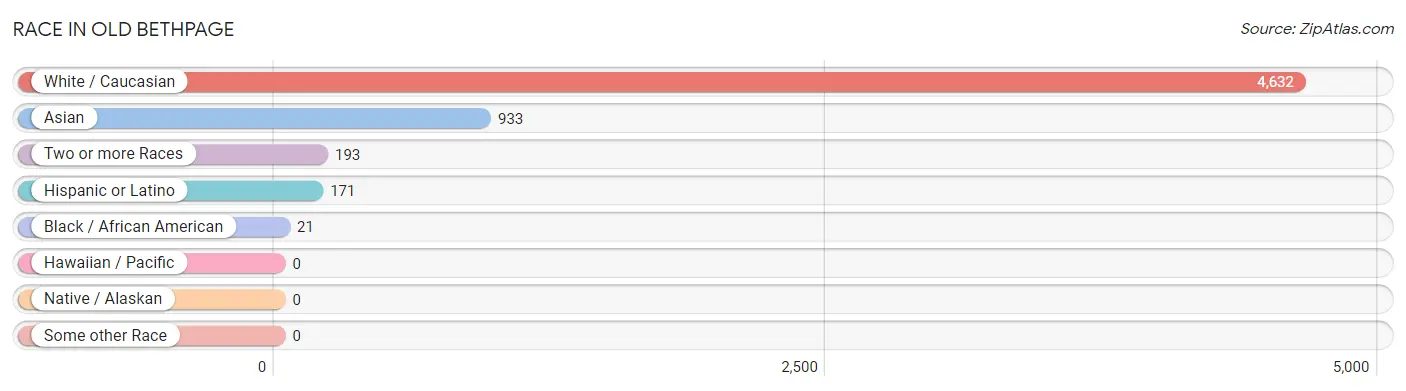
| Race | # Population | % Population |
| Asian | 933 | 16.1% |
| Black / African American | 21 | 0.4% |
| Hawaiian / Pacific | 0 | 0.0% |
| Hispanic or Latino | 171 | 3.0% |
| Native / Alaskan | 0 | 0.0% |
| White / Caucasian | 4,632 | 80.1% |
| Two or more Races | 193 | 3.3% |
| Some other Race | 0 | 0.0% |
| Total | 5,779 | 100.0% |
Ancestry in Old Bethpage
The most populous ancestries reported in Old Bethpage are Polish (814 | 14.1%), Italian (648 | 11.2%), German (606 | 10.5%), American (603 | 10.4%), and Irish (447 | 7.7%), together accounting for 53.9% of all Old Bethpage residents.
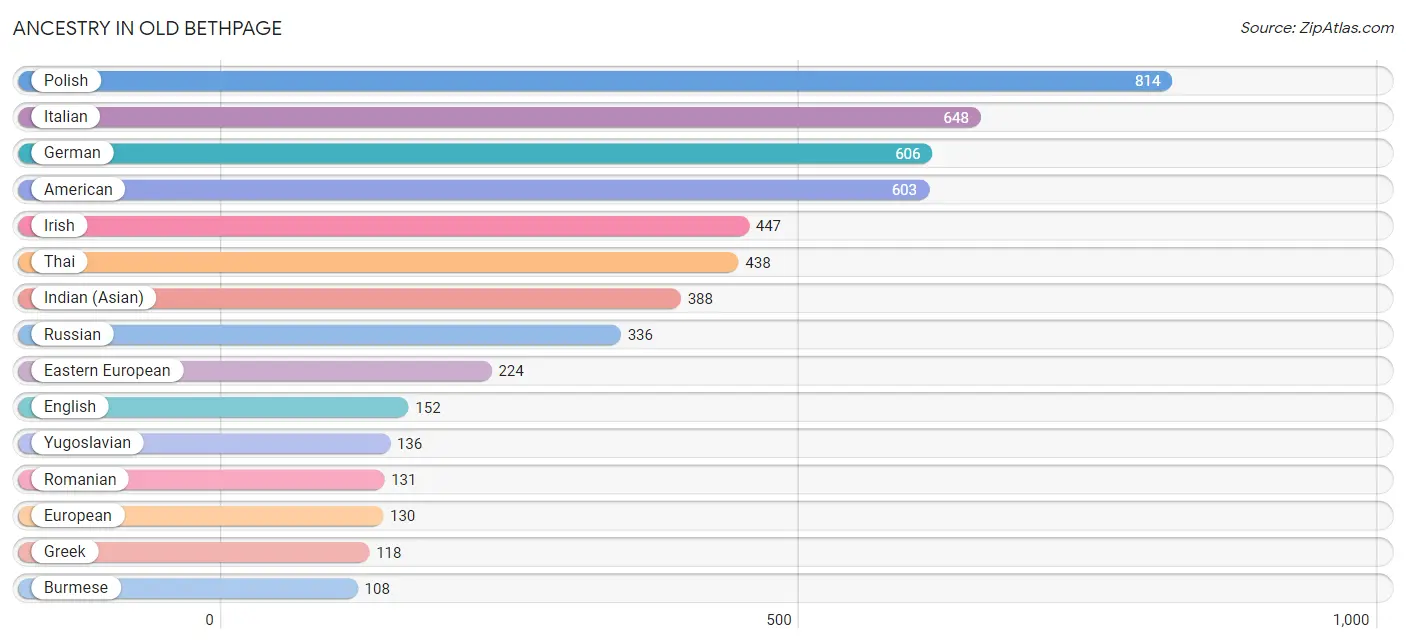
| Ancestry | # Population | % Population |
| African | 3 | 0.1% |
| American | 603 | 10.4% |
| Arab | 89 | 1.5% |
| Armenian | 11 | 0.2% |
| Austrian | 34 | 0.6% |
| Burmese | 108 | 1.9% |
| Central American | 32 | 0.5% |
| Chilean | 34 | 0.6% |
| Colombian | 29 | 0.5% |
| Croatian | 6 | 0.1% |
| Czech | 18 | 0.3% |
| Czechoslovakian | 16 | 0.3% |
| Eastern European | 224 | 3.9% |
| English | 152 | 2.6% |
| European | 130 | 2.2% |
| French | 91 | 1.6% |
| German | 606 | 10.5% |
| Ghanaian | 40 | 0.7% |
| Greek | 118 | 2.0% |
| Honduran | 32 | 0.5% |
| Hungarian | 19 | 0.3% |
| Indian (Asian) | 388 | 6.7% |
| Irish | 447 | 7.7% |
| Israeli | 26 | 0.4% |
| Italian | 648 | 11.2% |
| Korean | 34 | 0.6% |
| Lebanese | 89 | 1.5% |
| Lithuanian | 17 | 0.3% |
| Maltese | 26 | 0.4% |
| Norwegian | 8 | 0.1% |
| Polish | 814 | 14.1% |
| Portuguese | 71 | 1.2% |
| Puerto Rican | 10 | 0.2% |
| Romanian | 131 | 2.3% |
| Russian | 336 | 5.8% |
| Scotch-Irish | 16 | 0.3% |
| South American | 63 | 1.1% |
| Spaniard | 51 | 0.9% |
| Subsaharan African | 43 | 0.7% |
| Swiss | 30 | 0.5% |
| Thai | 438 | 7.6% |
| Turkish | 26 | 0.4% |
| Ukrainian | 32 | 0.5% |
| Yugoslavian | 136 | 2.4% | View All 44 Rows |
Immigrants in Old Bethpage
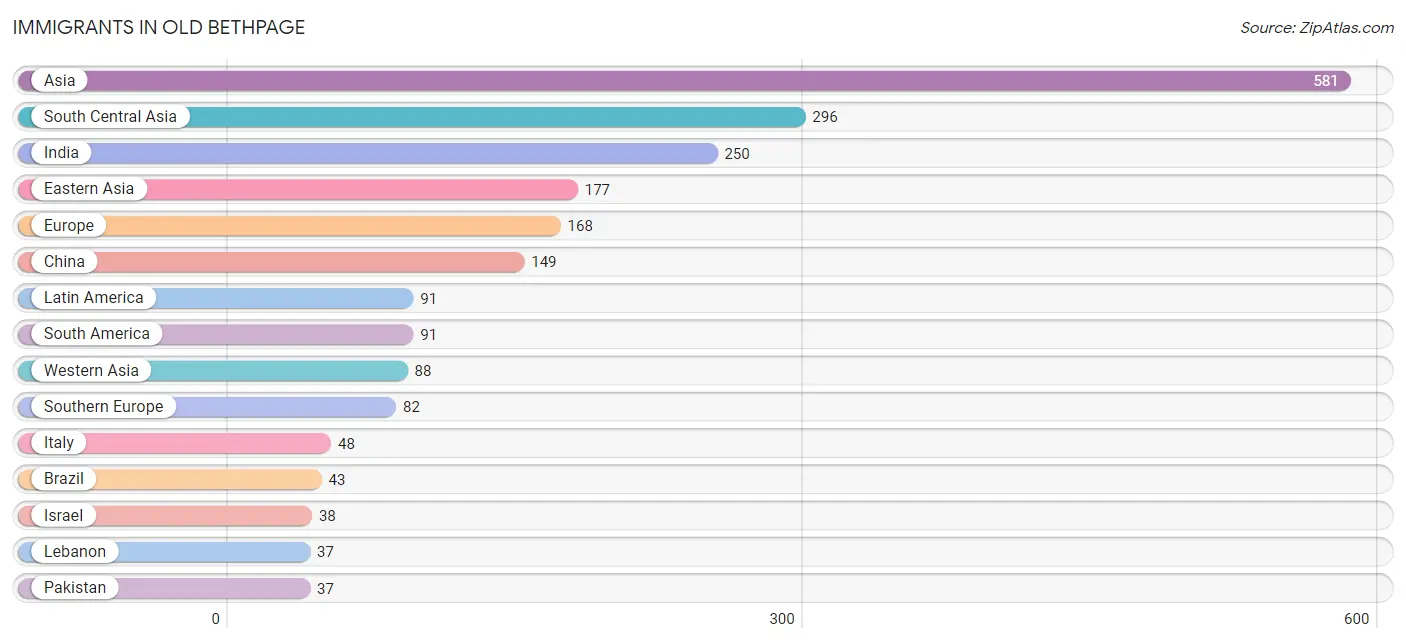
The most numerous immigrant groups reported in Old Bethpage came from Asia (581 | 10.1%), South Central Asia (296 | 5.1%), India (250 | 4.3%), Eastern Asia (177 | 3.1%), and Europe (168 | 2.9%), together accounting for 25.5% of all Old Bethpage residents.
| Immigration Origin | # Population | % Population |
| Africa | 3 | 0.1% |
| Asia | 581 | 10.1% |
| Brazil | 43 | 0.7% |
| Chile | 34 | 0.6% |
| China | 149 | 2.6% |
| Colombia | 14 | 0.2% |
| Eastern Asia | 177 | 3.1% |
| Eastern Europe | 26 | 0.4% |
| England | 17 | 0.3% |
| Europe | 168 | 2.9% |
| Germany | 36 | 0.6% |
| Ghana | 3 | 0.1% |
| Greece | 8 | 0.1% |
| Hong Kong | 6 | 0.1% |
| India | 250 | 4.3% |
| Ireland | 7 | 0.1% |
| Israel | 38 | 0.7% |
| Italy | 48 | 0.8% |
| Korea | 28 | 0.5% |
| Latin America | 91 | 1.6% |
| Lebanon | 37 | 0.6% |
| Northern Europe | 24 | 0.4% |
| Pakistan | 37 | 0.6% |
| Philippines | 20 | 0.4% |
| Poland | 17 | 0.3% |
| South America | 91 | 1.6% |
| South Central Asia | 296 | 5.1% |
| South Eastern Asia | 20 | 0.4% |
| Southern Europe | 82 | 1.4% |
| Taiwan | 25 | 0.4% |
| Ukraine | 9 | 0.2% |
| Western Africa | 3 | 0.1% |
| Western Asia | 88 | 1.5% |
| Western Europe | 36 | 0.6% | View All 34 Rows |
Sex and Age in Old Bethpage
Sex and Age in Old Bethpage
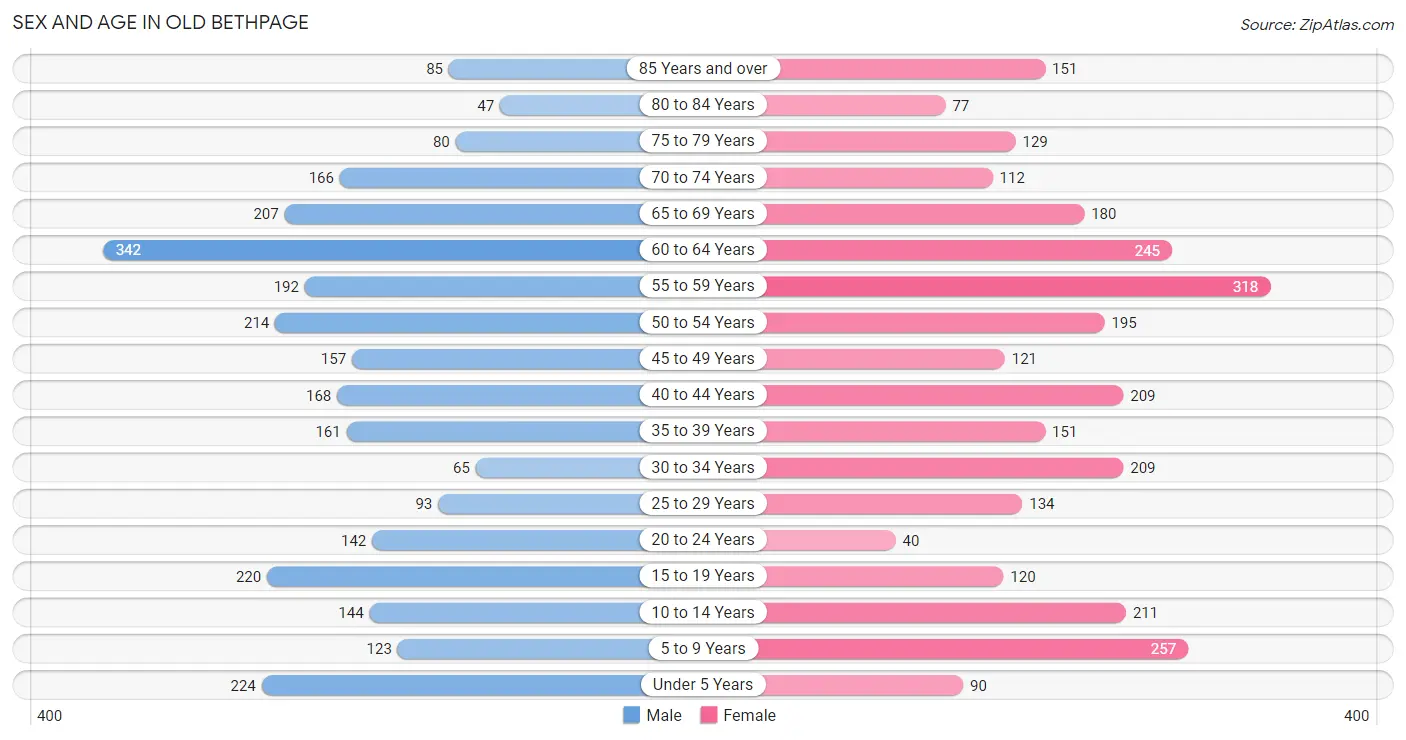
The most populous age groups in Old Bethpage are 60 to 64 Years (342 | 12.1%) for men and 55 to 59 Years (318 | 10.8%) for women.
| Age Bracket | Male | Female |
| Under 5 Years | 224 (7.9%) | 90 (3.0%) |
| 5 to 9 Years | 123 (4.3%) | 257 (8.7%) |
| 10 to 14 Years | 144 (5.1%) | 211 (7.1%) |
| 15 to 19 Years | 220 (7.8%) | 120 (4.1%) |
| 20 to 24 Years | 142 (5.0%) | 40 (1.4%) |
| 25 to 29 Years | 93 (3.3%) | 134 (4.5%) |
| 30 to 34 Years | 65 (2.3%) | 209 (7.1%) |
| 35 to 39 Years | 161 (5.7%) | 151 (5.1%) |
| 40 to 44 Years | 168 (5.9%) | 209 (7.1%) |
| 45 to 49 Years | 157 (5.6%) | 121 (4.1%) |
| 50 to 54 Years | 214 (7.6%) | 195 (6.6%) |
| 55 to 59 Years | 192 (6.8%) | 318 (10.8%) |
| 60 to 64 Years | 342 (12.1%) | 245 (8.3%) |
| 65 to 69 Years | 207 (7.3%) | 180 (6.1%) |
| 70 to 74 Years | 166 (5.9%) | 112 (3.8%) |
| 75 to 79 Years | 80 (2.8%) | 129 (4.4%) |
| 80 to 84 Years | 47 (1.7%) | 77 (2.6%) |
| 85 Years and over | 85 (3.0%) | 151 (5.1%) |
| Total | 2,830 (100.0%) | 2,949 (100.0%) |
Families and Households in Old Bethpage
Median Family Size in Old Bethpage
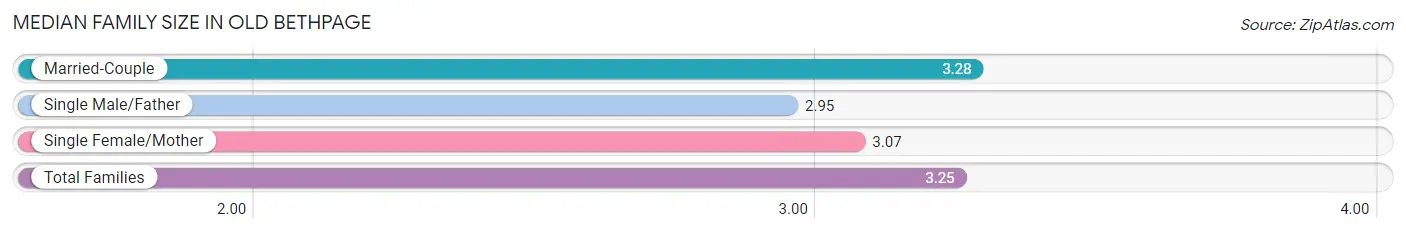
The median family size in Old Bethpage is 3.25 persons per family, with married-couple families (1,447 | 89.0%) accounting for the largest median family size of 3.28 persons per family. On the other hand, single male/father families (56 | 3.5%) represent the smallest median family size with 2.95 persons per family.
| Family Type | # Families | Family Size |
| Married-Couple | 1,447 (89.0%) | 3.28 |
| Single Male/Father | 56 (3.5%) | 2.95 |
| Single Female/Mother | 122 (7.5%) | 3.07 |
| Total Families | 1,625 (100.0%) | 3.25 |
Median Household Size in Old Bethpage
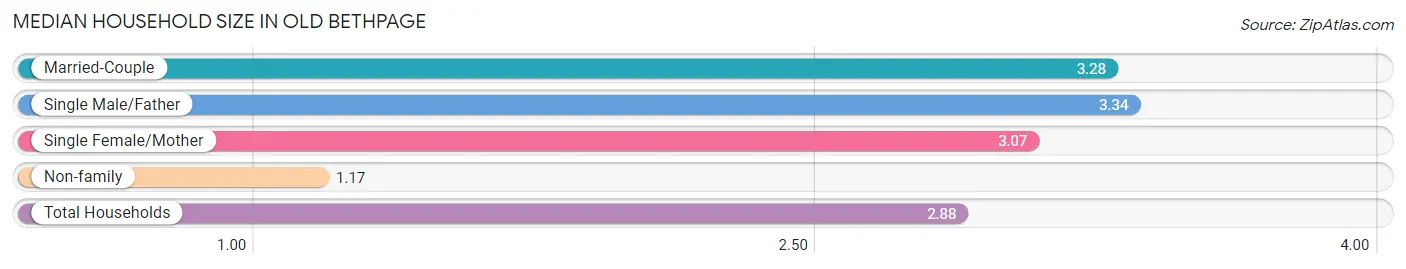
The median household size in Old Bethpage is 2.88 persons per household, with single male/father households (56 | 2.8%) accounting for the largest median household size of 3.34 persons per household. non-family households (369 | 18.5%) represent the smallest median household size with 1.17 persons per household.
| Household Type | # Households | Household Size |
| Married-Couple | 1,447 (72.6%) | 3.28 |
| Single Male/Father | 56 (2.8%) | 3.34 |
| Single Female/Mother | 122 (6.1%) | 3.07 |
| Non-family | 369 (18.5%) | 1.17 |
| Total Households | 1,994 (100.0%) | 2.88 |
Household Size by Marriage Status in Old Bethpage
Out of a total of 1,994 households in Old Bethpage, 1,625 (81.5%) are family households, while 369 (18.5%) are nonfamily households. The most numerous type of family households are 2-person households, comprising 767, and the most common type of nonfamily households are 1-person households, comprising 308.
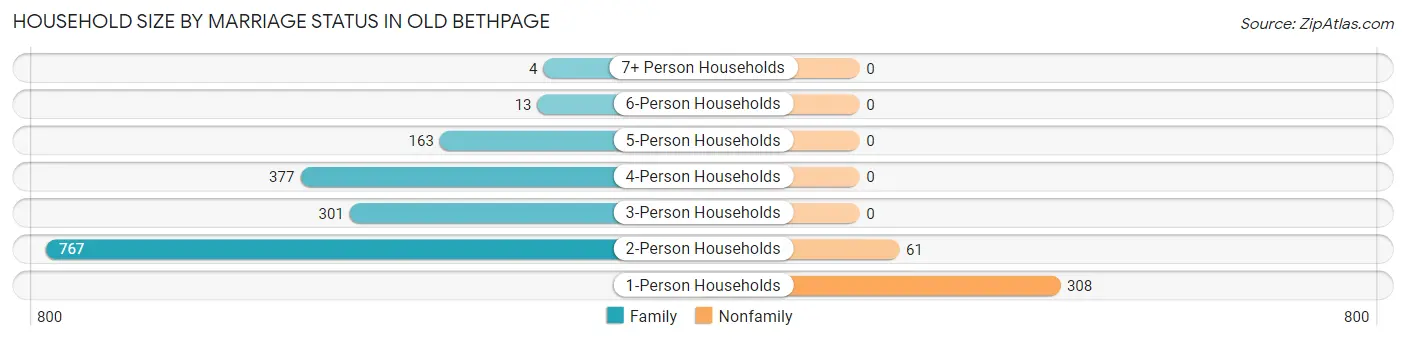
| Household Size | Family Households | Nonfamily Households |
| 1-Person Households | - | 308 (15.4%) |
| 2-Person Households | 767 (38.5%) | 61 (3.1%) |
| 3-Person Households | 301 (15.1%) | 0 (0.0%) |
| 4-Person Households | 377 (18.9%) | 0 (0.0%) |
| 5-Person Households | 163 (8.2%) | 0 (0.0%) |
| 6-Person Households | 13 (0.6%) | 0 (0.0%) |
| 7+ Person Households | 4 (0.2%) | 0 (0.0%) |
| Total | 1,625 (81.5%) | 369 (18.5%) |
Female Fertility in Old Bethpage
Fertility by Age in Old Bethpage
Average fertility rate in Old Bethpage is 205.0 births per 1,000 women. Women in the age bracket of 20 to 34 years have the highest fertility rate with 480.0 births per 1,000 women. Women in the age bracket of 20 to 34 years acount for 89.3% of all women with births.
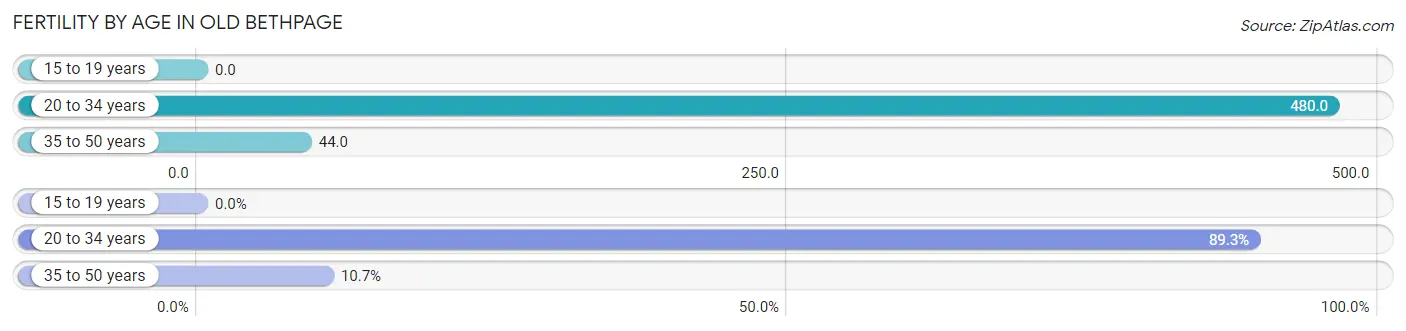
| Age Bracket | Women with Births | Births / 1,000 Women |
| 15 to 19 years | 0 (0.0%) | 0.0 |
| 20 to 34 years | 184 (89.3%) | 480.0 |
| 35 to 50 years | 22 (10.7%) | 44.0 |
| Total | 206 (100.0%) | 205.0 |
Fertility by Age by Marriage Status in Old Bethpage
89.3% of women with births (206) in Old Bethpage are married. The highest percentage of unmarried women with births falls into 35 to 50 years age bracket with 100.0% of them unmarried at the time of birth, while the lowest percentage of unmarried women with births belong to 20 to 34 years age bracket with 0.0% of them unmarried.
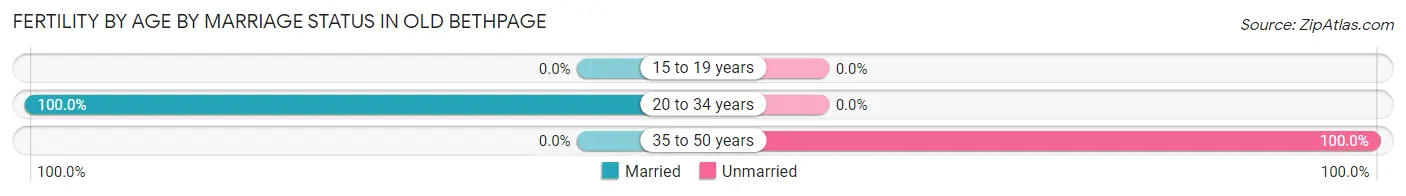
| Age Bracket | Married | Unmarried |
| 15 to 19 years | 0 (0.0%) | 0 (0.0%) |
| 20 to 34 years | 184 (100.0%) | 0 (0.0%) |
| 35 to 50 years | 0 (0.0%) | 22 (100.0%) |
| Total | 184 (89.3%) | 22 (10.7%) |
Fertility by Education in Old Bethpage
| Educational Attainment | Women with Births | Births / 1,000 Women |
| Less than High School | 0 (0.0%) | 0.0 |
| High School Diploma | 0 (0.0%) | 0.0 |
| College or Associate's Degree | 22 (10.7%) | 256.0 |
| Bachelor's Degree | 175 (85.0%) | 500.0 |
| Graduate Degree | 9 (4.4%) | 26.0 |
| Total | 206 (100.0%) | 205.0 |
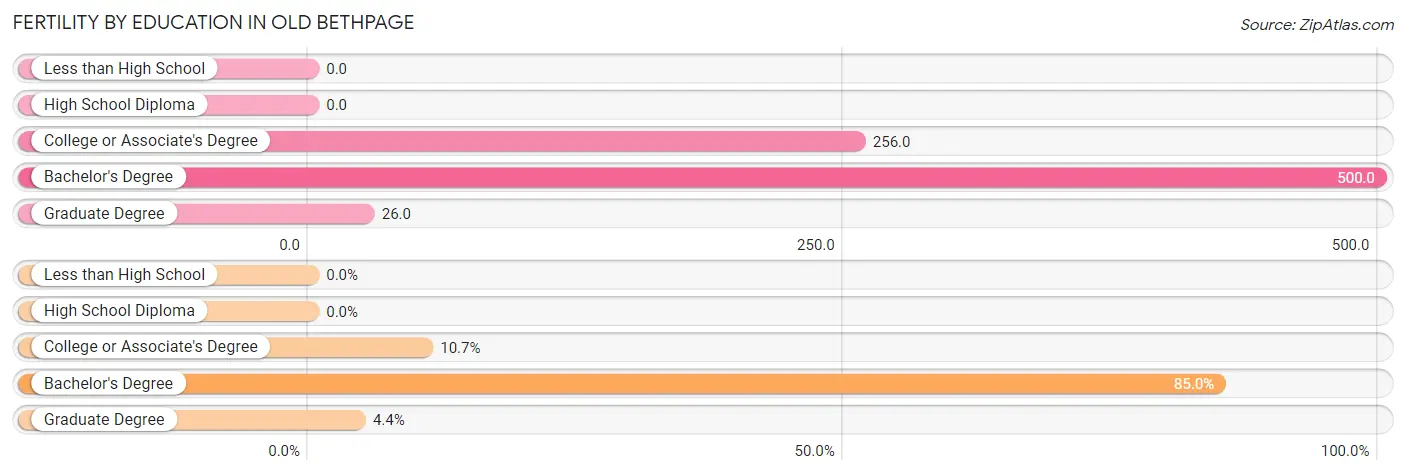
Fertility by Education by Marriage Status in Old Bethpage
10.7% of women with births in Old Bethpage are unmarried. Women with the educational attainment of bachelor's degree are most likely to be married with 100.0% of them married at childbirth, while women with the educational attainment of college or associate's degree are least likely to be married with 100.0% of them unmarried at childbirth.
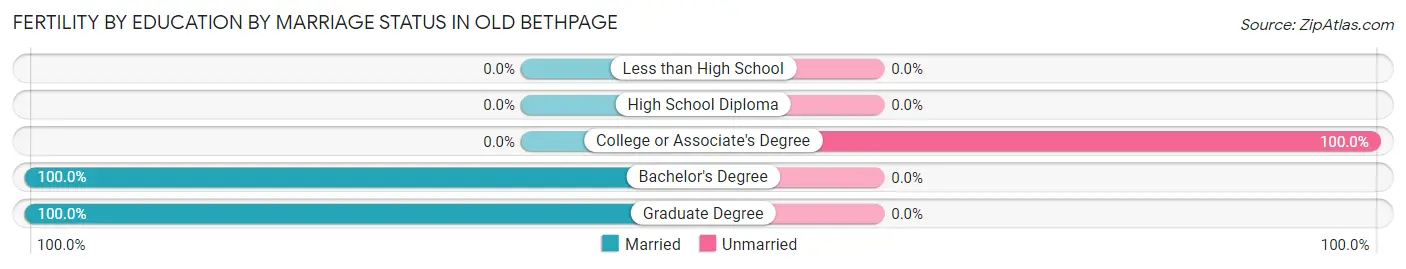
| Educational Attainment | Married | Unmarried |
| Less than High School | 0 (0.0%) | 0 (0.0%) |
| High School Diploma | 0 (0.0%) | 0 (0.0%) |
| College or Associate's Degree | 0 (0.0%) | 22 (100.0%) |
| Bachelor's Degree | 175 (100.0%) | 0 (0.0%) |
| Graduate Degree | 9 (100.0%) | 0 (0.0%) |
| Total | 184 (89.3%) | 22 (10.7%) |
Employment Characteristics in Old Bethpage
Employment by Class of Employer in Old Bethpage
Among the 2,954 employed individuals in Old Bethpage, private company employees (1,628 | 55.1%), local government employees (608 | 20.6%), and self-employed (incorporated) (199 | 6.7%) make up the most common classes of employment.
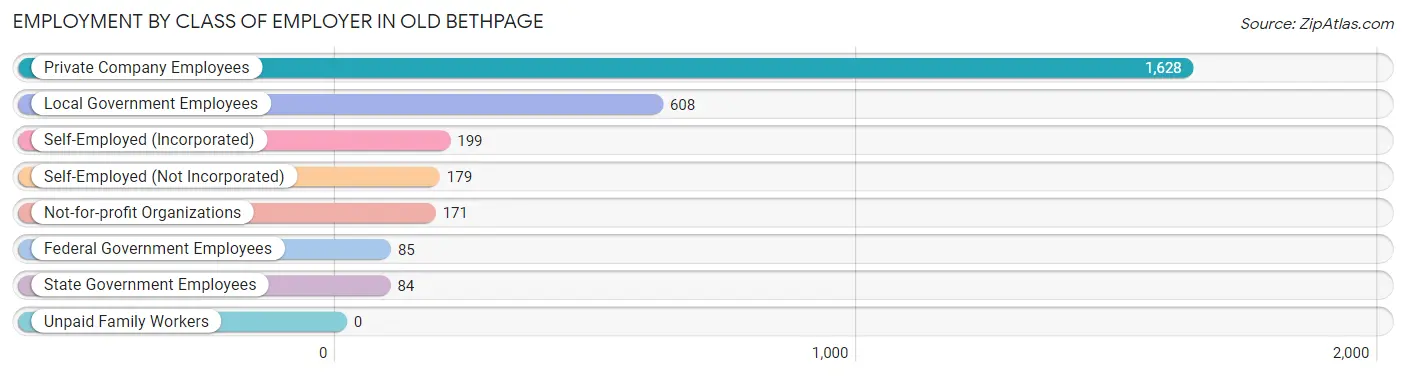
| Employer Class | # Employees | % Employees |
| Private Company Employees | 1,628 | 55.1% |
| Self-Employed (Incorporated) | 199 | 6.7% |
| Self-Employed (Not Incorporated) | 179 | 6.1% |
| Not-for-profit Organizations | 171 | 5.8% |
| Local Government Employees | 608 | 20.6% |
| State Government Employees | 84 | 2.8% |
| Federal Government Employees | 85 | 2.9% |
| Unpaid Family Workers | 0 | 0.0% |
| Total | 2,954 | 100.0% |
Employment Status by Age in Old Bethpage
According to the labor force statistics for Old Bethpage, out of the total population over 16 years of age (4,662), 66.0% or 3,077 individuals are in the labor force, with 3.5% or 108 of them unemployed. The age group with the highest labor force participation rate is 25 to 29 years, with 100.0% or 227 individuals in the labor force. Within the labor force, the 75 years and over age range has the highest percentage of unemployed individuals, with 44.8% or 26 of them being unemployed.
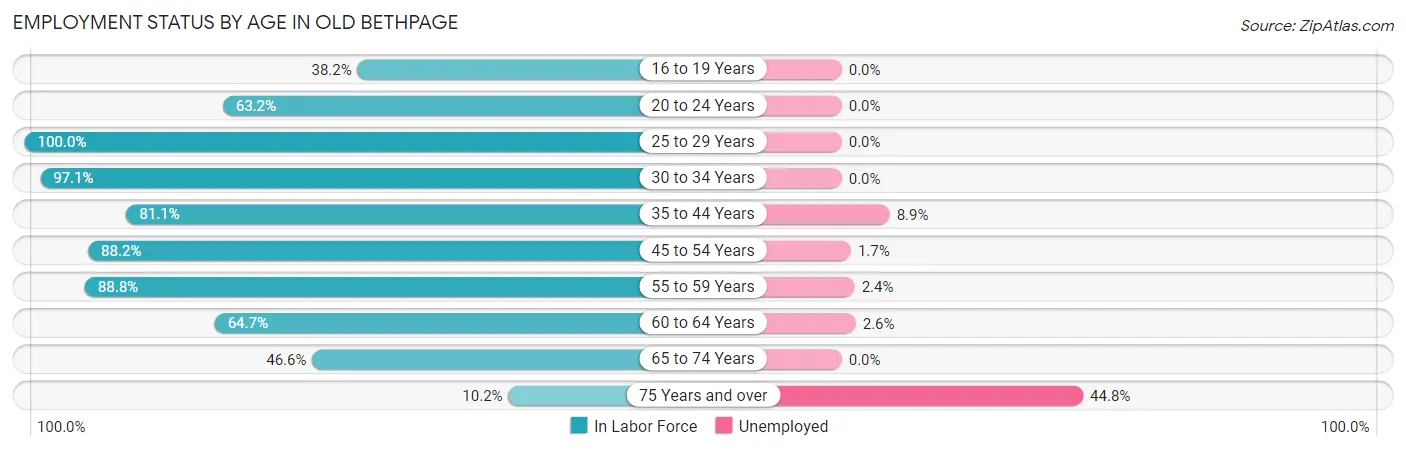
| Age Bracket | In Labor Force | Unemployed |
| 16 to 19 Years | 104 (38.2%) | 0 (0.0%) |
| 20 to 24 Years | 115 (63.2%) | 0 (0.0%) |
| 25 to 29 Years | 227 (100.0%) | 0 (0.0%) |
| 30 to 34 Years | 266 (97.1%) | 0 (0.0%) |
| 35 to 44 Years | 559 (81.1%) | 50 (8.9%) |
| 45 to 54 Years | 606 (88.2%) | 10 (1.7%) |
| 55 to 59 Years | 453 (88.8%) | 11 (2.4%) |
| 60 to 64 Years | 380 (64.7%) | 10 (2.6%) |
| 65 to 74 Years | 310 (46.6%) | 0 (0.0%) |
| 75 Years and over | 58 (10.2%) | 26 (44.8%) |
| Total | 3,077 (66.0%) | 108 (3.5%) |
Employment Status by Educational Attainment in Old Bethpage
According to labor force statistics for Old Bethpage, 83.8% of individuals (2,492) out of the total population between 25 and 64 years of age (2,974) are in the labor force, with 3.3% or 82 of them being unemployed. The group with the highest labor force participation rate are those with the educational attainment of bachelor's degree or higher, with 89.8% or 1,896 individuals in the labor force. Within the labor force, individuals with college / associate degree education have the highest percentage of unemployment, with 3.4% or 10 of them being unemployed.
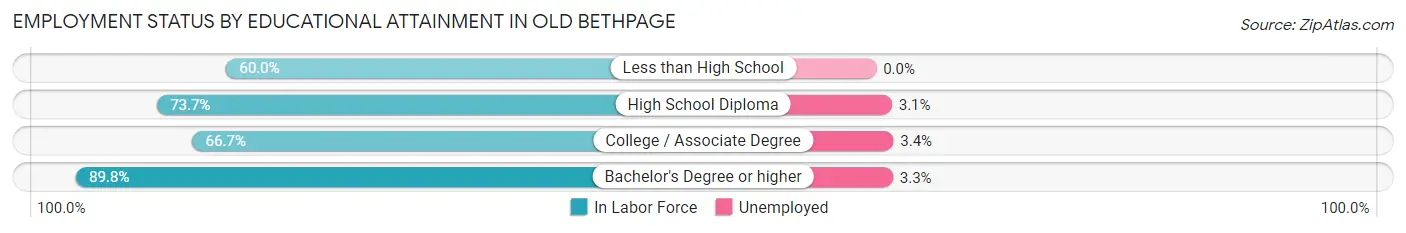
| Educational Attainment | In Labor Force | Unemployed |
| Less than High School | 45 (60.0%) | 0 (0.0%) |
| High School Diploma | 258 (73.7%) | 11 (3.1%) |
| College / Associate Degree | 292 (66.7%) | 15 (3.4%) |
| Bachelor's Degree or higher | 1,896 (89.8%) | 70 (3.3%) |
| Total | 2,492 (83.8%) | 98 (3.3%) |
Employment Occupations by Sex in Old Bethpage
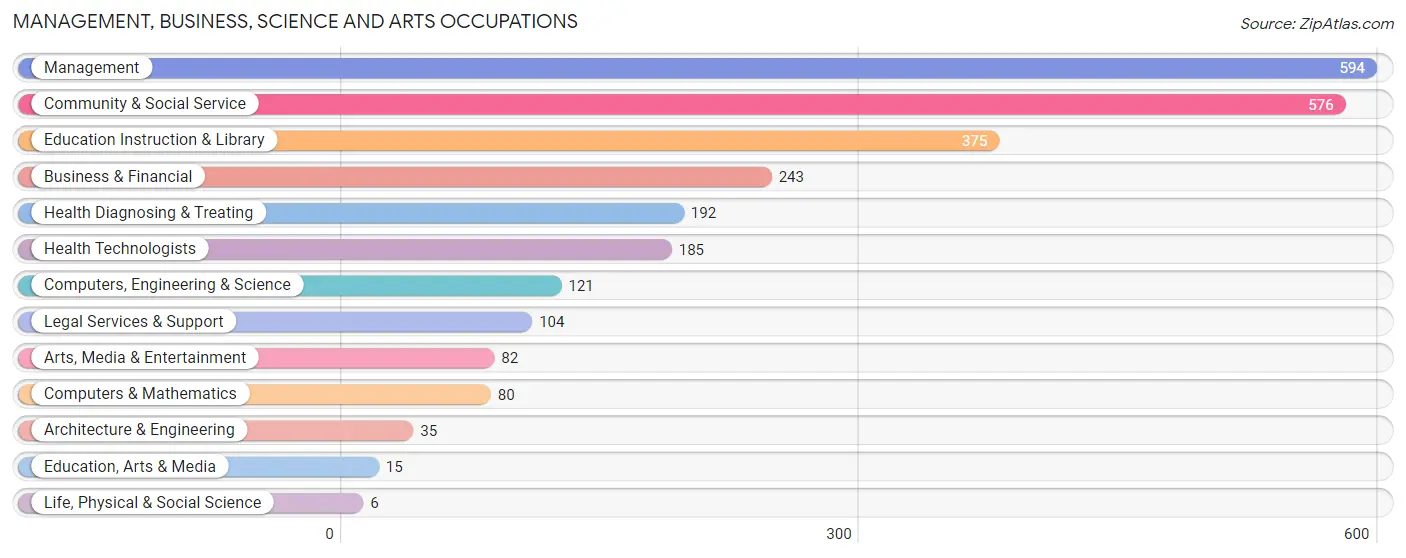
Management, Business, Science and Arts Occupations
The most common Management, Business, Science and Arts occupations in Old Bethpage are Management (594 | 20.0%), Community & Social Service (576 | 19.4%), Education Instruction & Library (375 | 12.6%), Business & Financial (243 | 8.2%), and Health Diagnosing & Treating (192 | 6.5%).
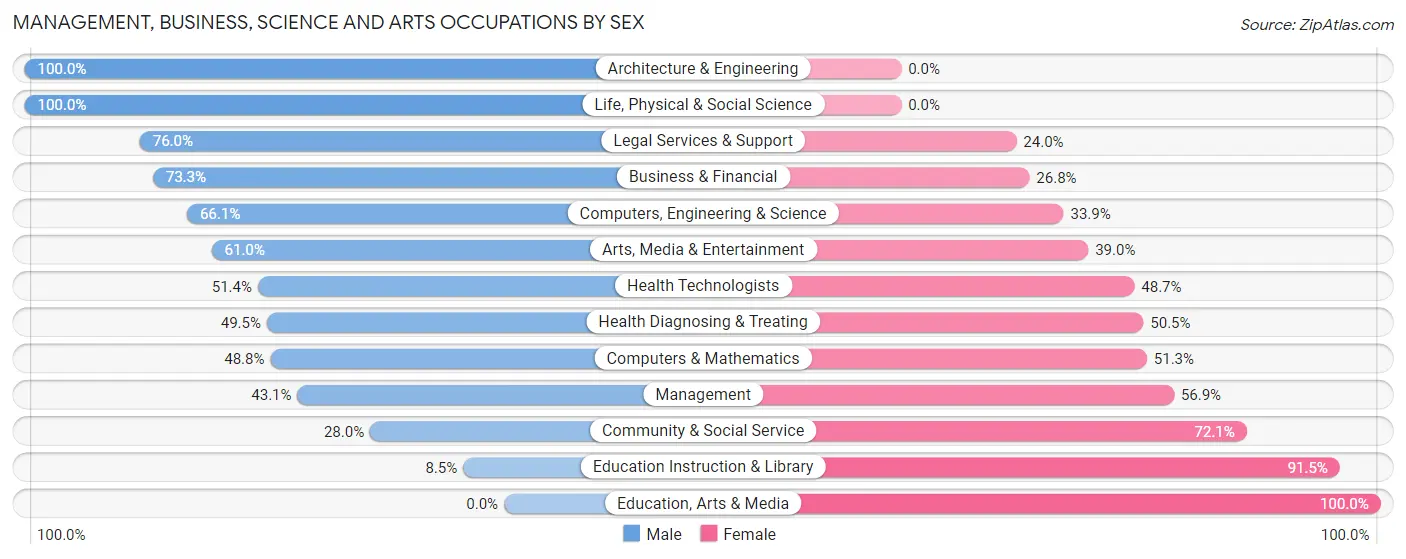
Management, Business, Science and Arts Occupations by Sex
Within the Management, Business, Science and Arts occupations in Old Bethpage, the most male-oriented occupations are Architecture & Engineering (100.0%), Life, Physical & Social Science (100.0%), and Legal Services & Support (76.0%), while the most female-oriented occupations are Education, Arts & Media (100.0%), Education Instruction & Library (91.5%), and Community & Social Service (72.1%).
| Occupation | Male | Female |
| Management | 256 (43.1%) | 338 (56.9%) |
| Business & Financial | 178 (73.3%) | 65 (26.8%) |
| Computers, Engineering & Science | 80 (66.1%) | 41 (33.9%) |
| Computers & Mathematics | 39 (48.7%) | 41 (51.2%) |
| Architecture & Engineering | 35 (100.0%) | 0 (0.0%) |
| Life, Physical & Social Science | 6 (100.0%) | 0 (0.0%) |
| Community & Social Service | 161 (28.0%) | 415 (72.1%) |
| Education, Arts & Media | 0 (0.0%) | 15 (100.0%) |
| Legal Services & Support | 79 (76.0%) | 25 (24.0%) |
| Education Instruction & Library | 32 (8.5%) | 343 (91.5%) |
| Arts, Media & Entertainment | 50 (61.0%) | 32 (39.0%) |
| Health Diagnosing & Treating | 95 (49.5%) | 97 (50.5%) |
| Health Technologists | 95 (51.3%) | 90 (48.6%) |
| Total (Category) | 770 (44.6%) | 956 (55.4%) |
| Total (Overall) | 1,585 (53.3%) | 1,386 (46.7%) |
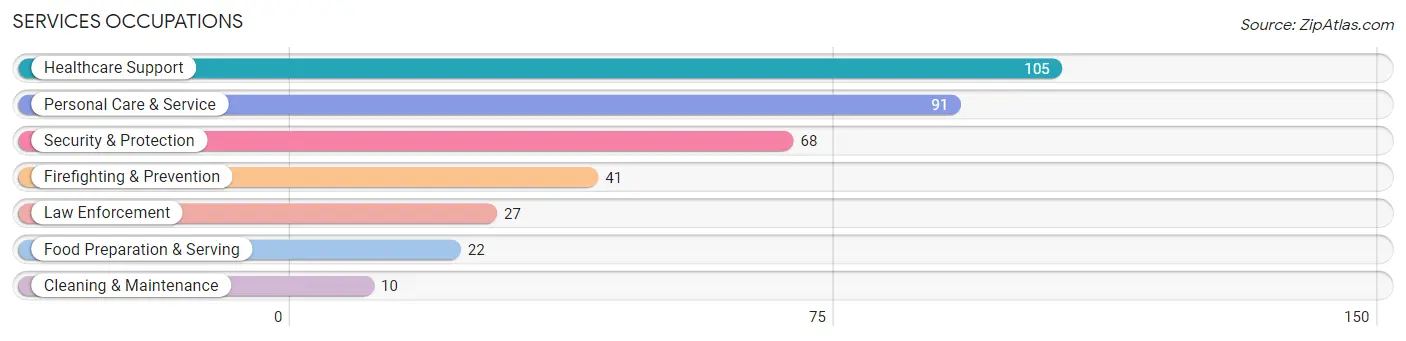
Services Occupations
The most common Services occupations in Old Bethpage are Healthcare Support (105 | 3.5%), Personal Care & Service (91 | 3.1%), Security & Protection (68 | 2.3%), Firefighting & Prevention (41 | 1.4%), and Law Enforcement (27 | 0.9%).
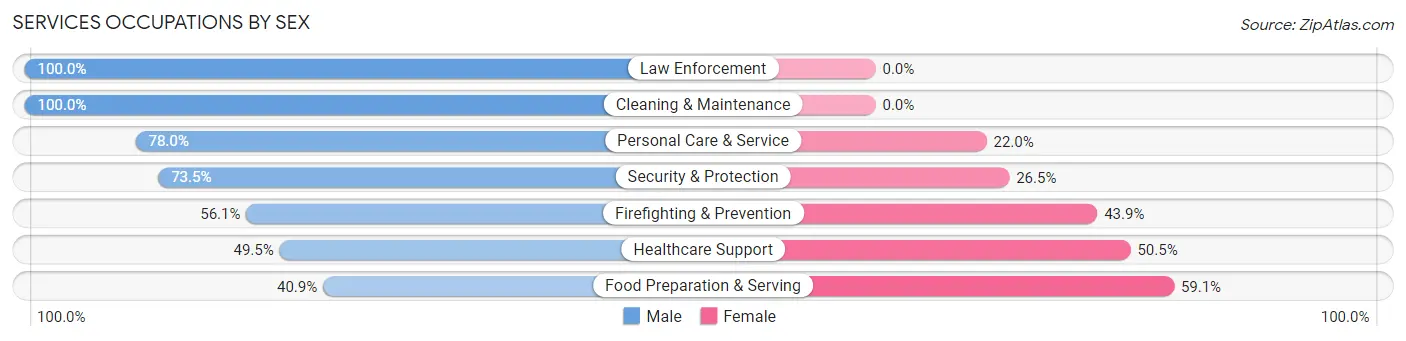
Services Occupations by Sex
Within the Services occupations in Old Bethpage, the most male-oriented occupations are Law Enforcement (100.0%), Cleaning & Maintenance (100.0%), and Personal Care & Service (78.0%), while the most female-oriented occupations are Food Preparation & Serving (59.1%), Healthcare Support (50.5%), and Firefighting & Prevention (43.9%).
| Occupation | Male | Female |
| Healthcare Support | 52 (49.5%) | 53 (50.5%) |
| Security & Protection | 50 (73.5%) | 18 (26.5%) |
| Firefighting & Prevention | 23 (56.1%) | 18 (43.9%) |
| Law Enforcement | 27 (100.0%) | 0 (0.0%) |
| Food Preparation & Serving | 9 (40.9%) | 13 (59.1%) |
| Cleaning & Maintenance | 10 (100.0%) | 0 (0.0%) |
| Personal Care & Service | 71 (78.0%) | 20 (22.0%) |
| Total (Category) | 192 (64.9%) | 104 (35.1%) |
| Total (Overall) | 1,585 (53.3%) | 1,386 (46.7%) |
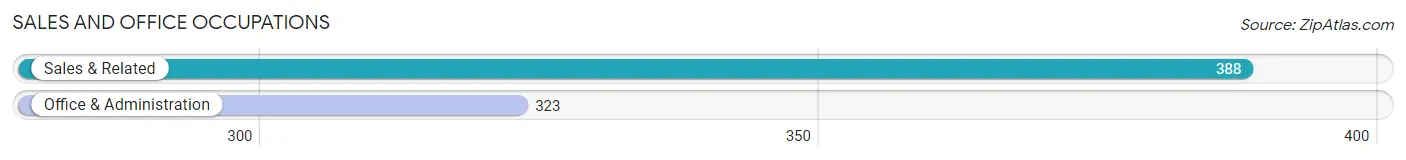
Sales and Office Occupations
The most common Sales and Office occupations in Old Bethpage are Sales & Related (388 | 13.1%), and Office & Administration (323 | 10.9%).
Sales and Office Occupations by Sex
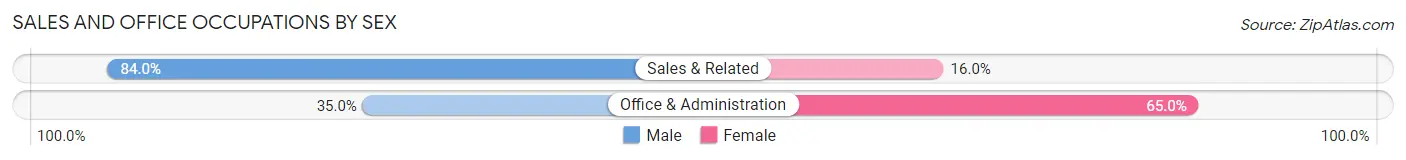
| Occupation | Male | Female |
| Sales & Related | 326 (84.0%) | 62 (16.0%) |
| Office & Administration | 113 (35.0%) | 210 (65.0%) |
| Total (Category) | 439 (61.7%) | 272 (38.3%) |
| Total (Overall) | 1,585 (53.3%) | 1,386 (46.7%) |
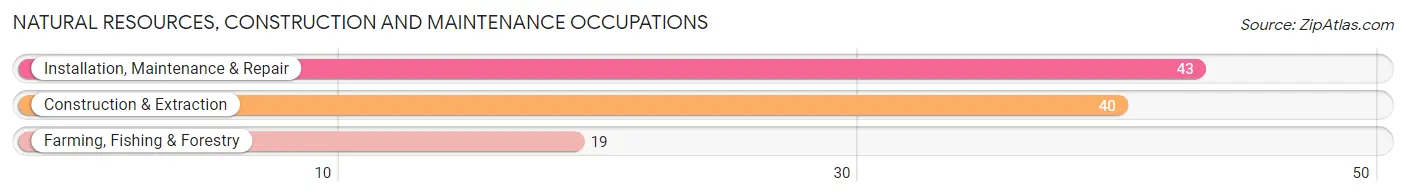
Natural Resources, Construction and Maintenance Occupations
The most common Natural Resources, Construction and Maintenance occupations in Old Bethpage are Installation, Maintenance & Repair (43 | 1.5%), Construction & Extraction (40 | 1.3%), and Farming, Fishing & Forestry (19 | 0.6%).
Natural Resources, Construction and Maintenance Occupations by Sex
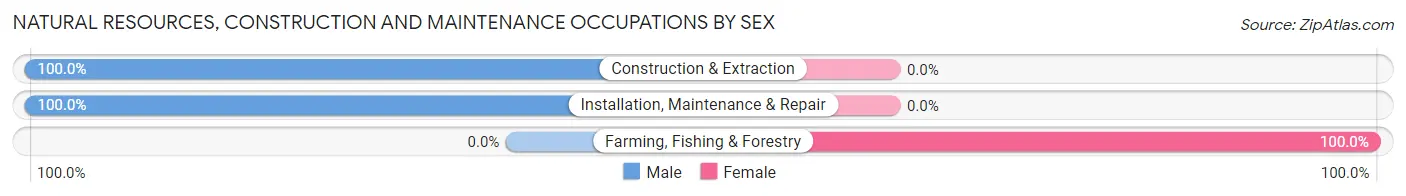
| Occupation | Male | Female |
| Farming, Fishing & Forestry | 0 (0.0%) | 19 (100.0%) |
| Construction & Extraction | 40 (100.0%) | 0 (0.0%) |
| Installation, Maintenance & Repair | 43 (100.0%) | 0 (0.0%) |
| Total (Category) | 83 (81.4%) | 19 (18.6%) |
| Total (Overall) | 1,585 (53.3%) | 1,386 (46.7%) |
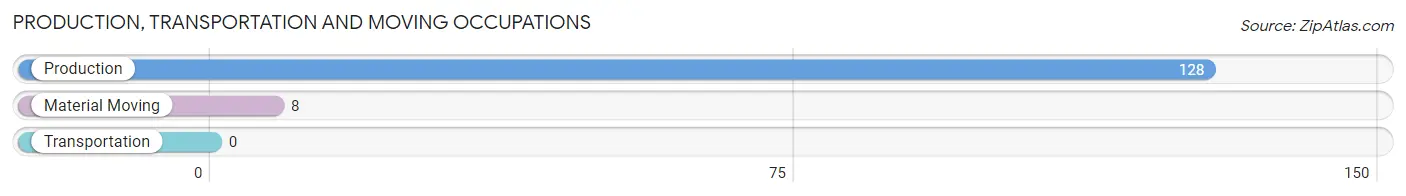
Production, Transportation and Moving Occupations
The most common Production, Transportation and Moving occupations in Old Bethpage are Production (128 | 4.3%), and Material Moving (8 | 0.3%).
Production, Transportation and Moving Occupations by Sex
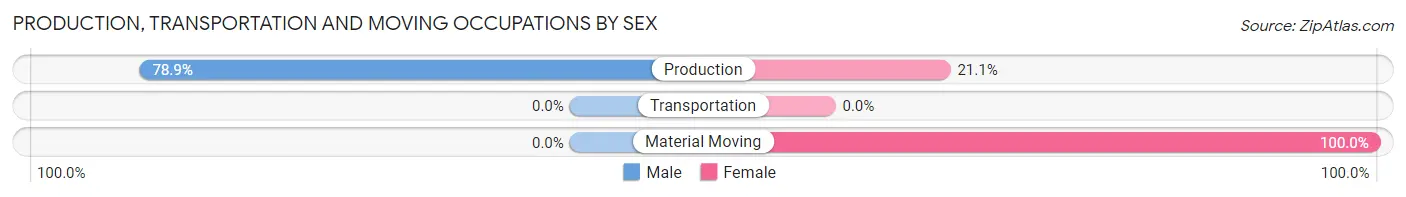
| Occupation | Male | Female |
| Production | 101 (78.9%) | 27 (21.1%) |
| Transportation | 0 (0.0%) | 0 (0.0%) |
| Material Moving | 0 (0.0%) | 8 (100.0%) |
| Total (Category) | 101 (74.3%) | 35 (25.7%) |
| Total (Overall) | 1,585 (53.3%) | 1,386 (46.7%) |
Employment Industries by Sex in Old Bethpage
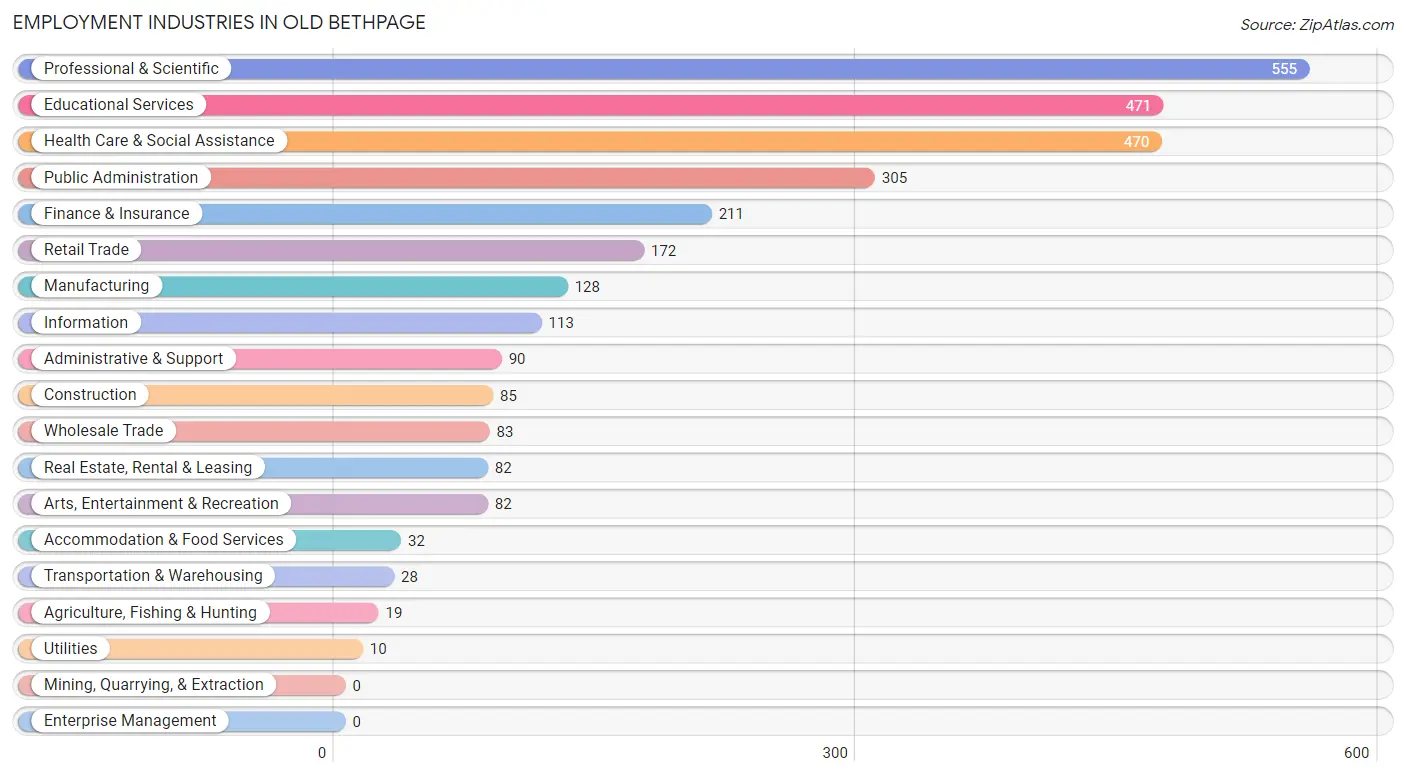
Employment Industries in Old Bethpage
The major employment industries in Old Bethpage include Professional & Scientific (555 | 18.7%), Educational Services (471 | 15.9%), Health Care & Social Assistance (470 | 15.8%), Public Administration (305 | 10.3%), and Finance & Insurance (211 | 7.1%).
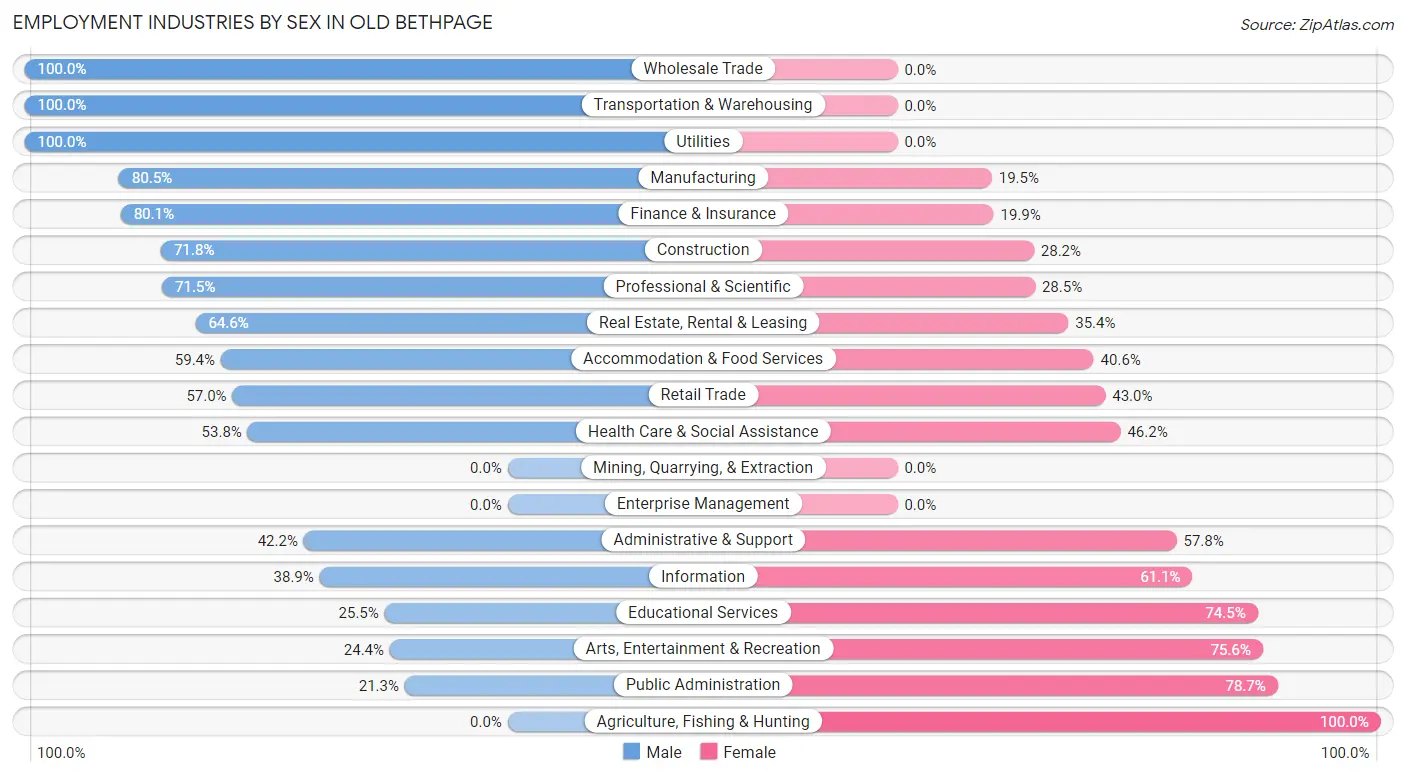
Employment Industries by Sex in Old Bethpage
The Old Bethpage industries that see more men than women are Wholesale Trade (100.0%), Transportation & Warehousing (100.0%), and Utilities (100.0%), whereas the industries that tend to have a higher number of women are Agriculture, Fishing & Hunting (100.0%), Public Administration (78.7%), and Arts, Entertainment & Recreation (75.6%).
| Industry | Male | Female |
| Agriculture, Fishing & Hunting | 0 (0.0%) | 19 (100.0%) |
| Mining, Quarrying, & Extraction | 0 (0.0%) | 0 (0.0%) |
| Construction | 61 (71.8%) | 24 (28.2%) |
| Manufacturing | 103 (80.5%) | 25 (19.5%) |
| Wholesale Trade | 83 (100.0%) | 0 (0.0%) |
| Retail Trade | 98 (57.0%) | 74 (43.0%) |
| Transportation & Warehousing | 28 (100.0%) | 0 (0.0%) |
| Utilities | 10 (100.0%) | 0 (0.0%) |
| Information | 44 (38.9%) | 69 (61.1%) |
| Finance & Insurance | 169 (80.1%) | 42 (19.9%) |
| Real Estate, Rental & Leasing | 53 (64.6%) | 29 (35.4%) |
| Professional & Scientific | 397 (71.5%) | 158 (28.5%) |
| Enterprise Management | 0 (0.0%) | 0 (0.0%) |
| Administrative & Support | 38 (42.2%) | 52 (57.8%) |
| Educational Services | 120 (25.5%) | 351 (74.5%) |
| Health Care & Social Assistance | 253 (53.8%) | 217 (46.2%) |
| Arts, Entertainment & Recreation | 20 (24.4%) | 62 (75.6%) |
| Accommodation & Food Services | 19 (59.4%) | 13 (40.6%) |
| Public Administration | 65 (21.3%) | 240 (78.7%) |
| Total | 1,585 (53.3%) | 1,386 (46.7%) |
Education in Old Bethpage
School Enrollment in Old Bethpage
The most common levels of schooling among the 1,417 students in Old Bethpage are college / undergraduate (332 | 23.4%), middle school (305 | 21.5%), and elementary school (241 | 17.0%).
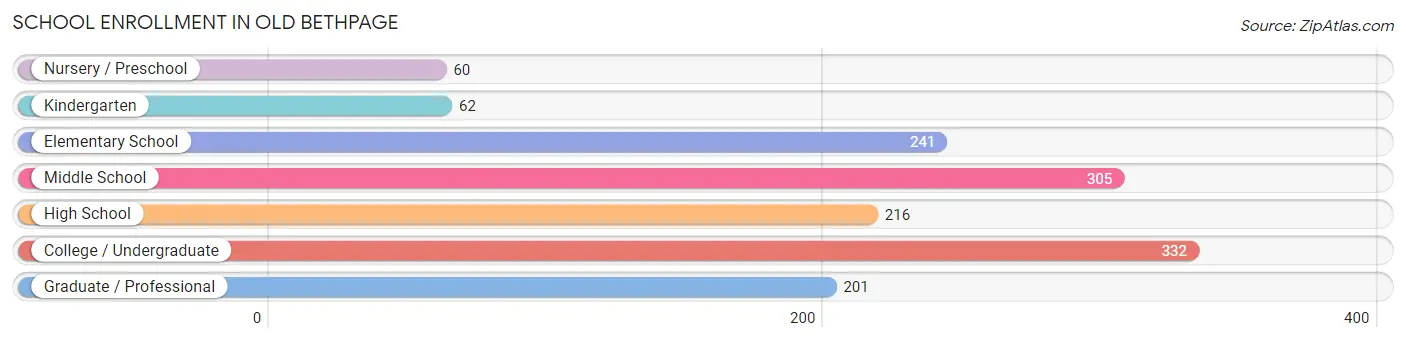
| School Level | # Students | % Students |
| Nursery / Preschool | 60 | 4.2% |
| Kindergarten | 62 | 4.4% |
| Elementary School | 241 | 17.0% |
| Middle School | 305 | 21.5% |
| High School | 216 | 15.2% |
| College / Undergraduate | 332 | 23.4% |
| Graduate / Professional | 201 | 14.2% |
| Total | 1,417 | 100.0% |
School Enrollment by Age by Funding Source in Old Bethpage
Out of a total of 1,417 students who are enrolled in schools in Old Bethpage, 290 (20.5%) attend a private institution, while the remaining 1,127 (79.5%) are enrolled in public schools. The age group of 25 to 34 year olds has the highest likelihood of being enrolled in private schools, with 13 (100.0% in the age bracket) enrolled. Conversely, the age group of 35 years and over has the lowest likelihood of being enrolled in a private school, with 271 (94.8% in the age bracket) attending a public institution.
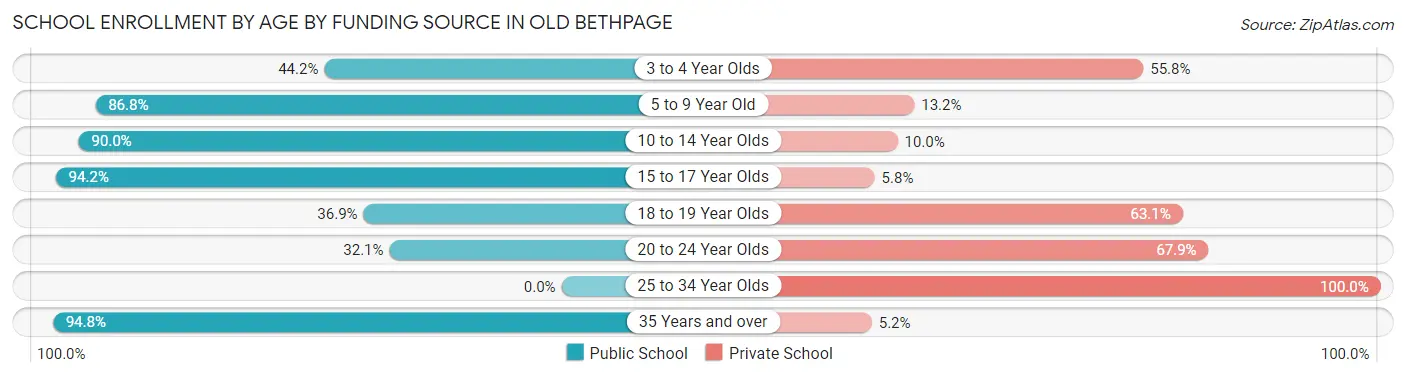
| Age Bracket | Public School | Private School |
| 3 to 4 Year Olds | 19 (44.2%) | 24 (55.8%) |
| 5 to 9 Year Old | 264 (86.8%) | 40 (13.2%) |
| 10 to 14 Year Olds | 296 (90.0%) | 33 (10.0%) |
| 15 to 17 Year Olds | 196 (94.2%) | 12 (5.8%) |
| 18 to 19 Year Olds | 38 (36.9%) | 65 (63.1%) |
| 20 to 24 Year Olds | 42 (32.1%) | 89 (67.9%) |
| 25 to 34 Year Olds | 0 (0.0%) | 13 (100.0%) |
| 35 Years and over | 271 (94.8%) | 15 (5.2%) |
| Total | 1,127 (79.5%) | 290 (20.5%) |
Educational Attainment by Field of Study in Old Bethpage
Business (982 | 32.6%), education (443 | 14.7%), science & technology (190 | 6.3%), computers & mathematics (181 | 6.0%), and social sciences (177 | 5.9%) are the most common fields of study among 3,016 individuals in Old Bethpage who have obtained a bachelor's degree or higher.
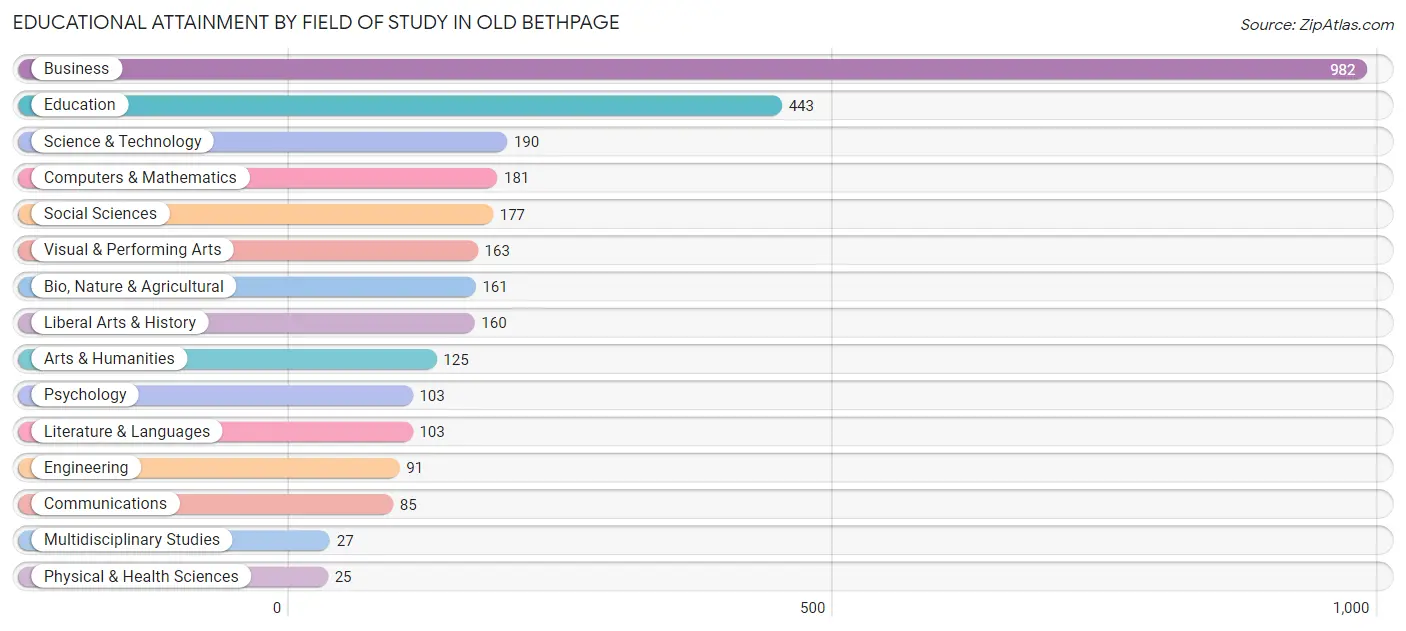
| Field of Study | # Graduates | % Graduates |
| Computers & Mathematics | 181 | 6.0% |
| Bio, Nature & Agricultural | 161 | 5.3% |
| Physical & Health Sciences | 25 | 0.8% |
| Psychology | 103 | 3.4% |
| Social Sciences | 177 | 5.9% |
| Engineering | 91 | 3.0% |
| Multidisciplinary Studies | 27 | 0.9% |
| Science & Technology | 190 | 6.3% |
| Business | 982 | 32.6% |
| Education | 443 | 14.7% |
| Literature & Languages | 103 | 3.4% |
| Liberal Arts & History | 160 | 5.3% |
| Visual & Performing Arts | 163 | 5.4% |
| Communications | 85 | 2.8% |
| Arts & Humanities | 125 | 4.1% |
| Total | 3,016 | 100.0% |
Transportation & Commute in Old Bethpage
Vehicle Availability by Sex in Old Bethpage
The most prevalent vehicle ownership categories in Old Bethpage are males with 2 vehicles (809, accounting for 51.6%) and females with 2 vehicles (810, making up 59.1%).
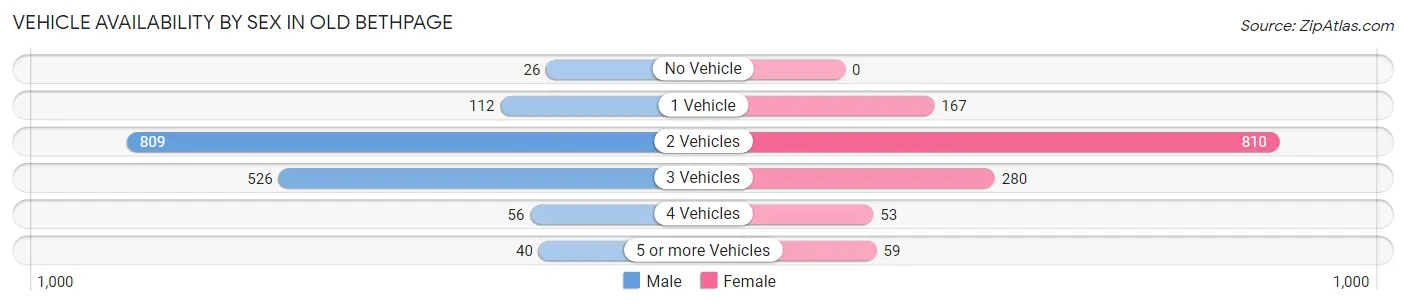
| Vehicles Available | Male | Female |
| No Vehicle | 26 (1.7%) | 0 (0.0%) |
| 1 Vehicle | 112 (7.1%) | 167 (12.2%) |
| 2 Vehicles | 809 (51.6%) | 810 (59.2%) |
| 3 Vehicles | 526 (33.5%) | 280 (20.4%) |
| 4 Vehicles | 56 (3.6%) | 53 (3.9%) |
| 5 or more Vehicles | 40 (2.5%) | 59 (4.3%) |
| Total | 1,569 (100.0%) | 1,369 (100.0%) |
Commute Time in Old Bethpage
The most frequently occuring commute durations in Old Bethpage are 30 to 34 minutes (645 commuters, 26.2%), 60 to 89 minutes (354 commuters, 14.4%), and 10 to 14 minutes (276 commuters, 11.2%).
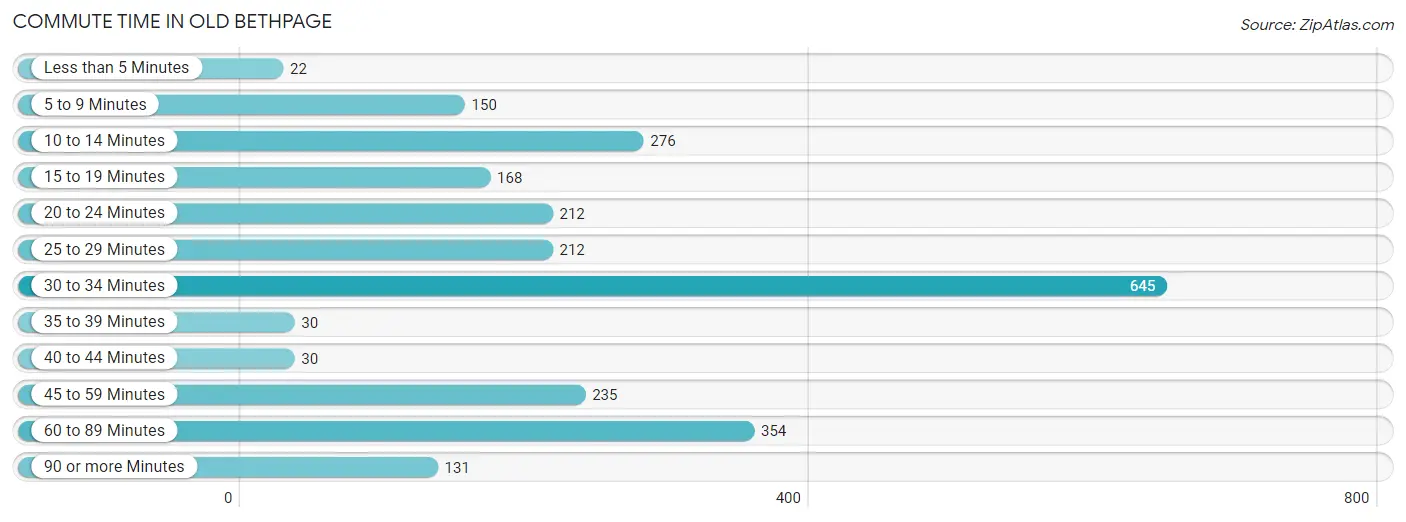
| Commute Time | # Commuters | % Commuters |
| Less than 5 Minutes | 22 | 0.9% |
| 5 to 9 Minutes | 150 | 6.1% |
| 10 to 14 Minutes | 276 | 11.2% |
| 15 to 19 Minutes | 168 | 6.8% |
| 20 to 24 Minutes | 212 | 8.6% |
| 25 to 29 Minutes | 212 | 8.6% |
| 30 to 34 Minutes | 645 | 26.2% |
| 35 to 39 Minutes | 30 | 1.2% |
| 40 to 44 Minutes | 30 | 1.2% |
| 45 to 59 Minutes | 235 | 9.5% |
| 60 to 89 Minutes | 354 | 14.4% |
| 90 or more Minutes | 131 | 5.3% |
Commute Time by Sex in Old Bethpage
The most common commute times in Old Bethpage are 30 to 34 minutes (503 commuters, 35.6%) for males and 45 to 59 minutes (179 commuters, 17.0%) for females.
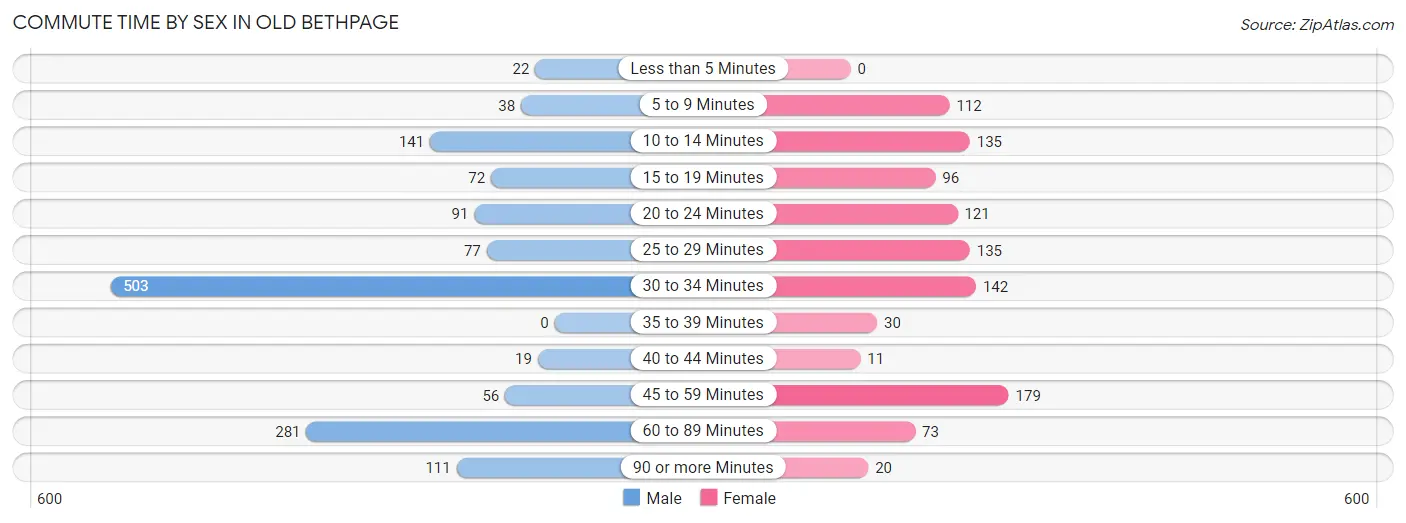
| Commute Time | Male | Female |
| Less than 5 Minutes | 22 (1.6%) | 0 (0.0%) |
| 5 to 9 Minutes | 38 (2.7%) | 112 (10.6%) |
| 10 to 14 Minutes | 141 (10.0%) | 135 (12.8%) |
| 15 to 19 Minutes | 72 (5.1%) | 96 (9.1%) |
| 20 to 24 Minutes | 91 (6.5%) | 121 (11.5%) |
| 25 to 29 Minutes | 77 (5.5%) | 135 (12.8%) |
| 30 to 34 Minutes | 503 (35.6%) | 142 (13.5%) |
| 35 to 39 Minutes | 0 (0.0%) | 30 (2.9%) |
| 40 to 44 Minutes | 19 (1.3%) | 11 (1.0%) |
| 45 to 59 Minutes | 56 (4.0%) | 179 (17.0%) |
| 60 to 89 Minutes | 281 (19.9%) | 73 (6.9%) |
| 90 or more Minutes | 111 (7.9%) | 20 (1.9%) |
Time of Departure to Work by Sex in Old Bethpage
The most frequent times of departure to work in Old Bethpage are 8:00 AM to 8:29 AM (324, 23.0%) for males and 7:00 AM to 7:29 AM (252, 23.9%) for females.
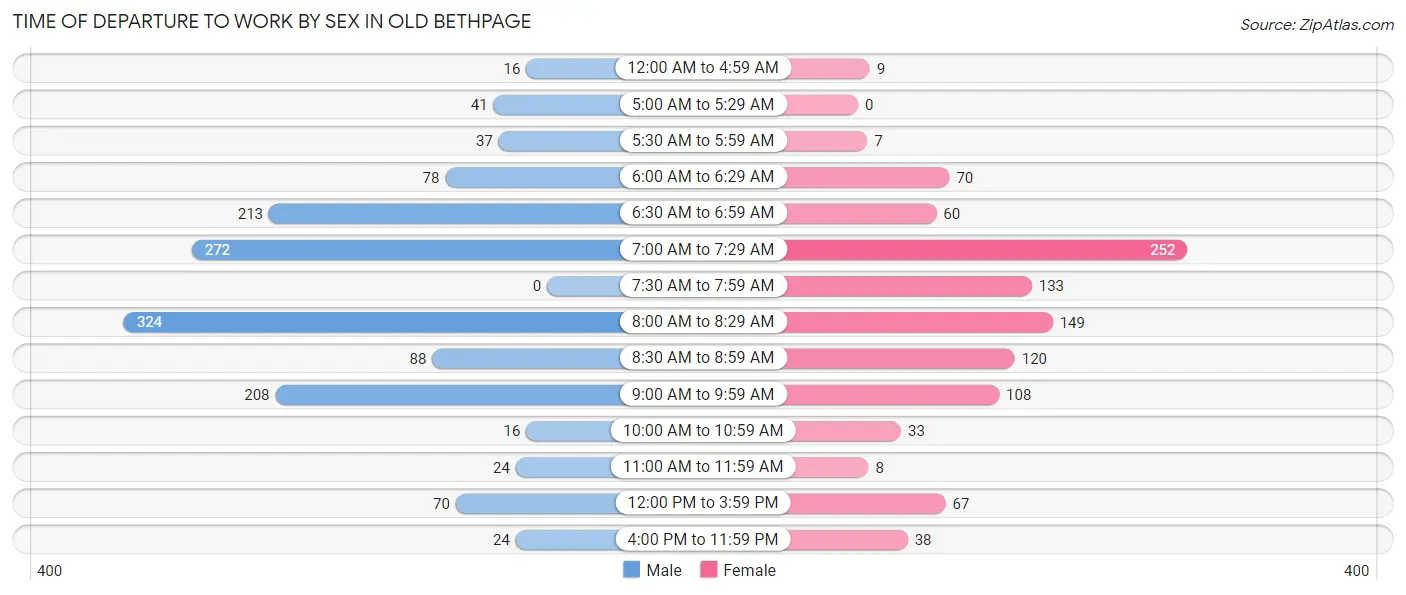
| Time of Departure | Male | Female |
| 12:00 AM to 4:59 AM | 16 (1.1%) | 9 (0.9%) |
| 5:00 AM to 5:29 AM | 41 (2.9%) | 0 (0.0%) |
| 5:30 AM to 5:59 AM | 37 (2.6%) | 7 (0.7%) |
| 6:00 AM to 6:29 AM | 78 (5.5%) | 70 (6.6%) |
| 6:30 AM to 6:59 AM | 213 (15.1%) | 60 (5.7%) |
| 7:00 AM to 7:29 AM | 272 (19.3%) | 252 (23.9%) |
| 7:30 AM to 7:59 AM | 0 (0.0%) | 133 (12.6%) |
| 8:00 AM to 8:29 AM | 324 (23.0%) | 149 (14.1%) |
| 8:30 AM to 8:59 AM | 88 (6.2%) | 120 (11.4%) |
| 9:00 AM to 9:59 AM | 208 (14.7%) | 108 (10.2%) |
| 10:00 AM to 10:59 AM | 16 (1.1%) | 33 (3.1%) |
| 11:00 AM to 11:59 AM | 24 (1.7%) | 8 (0.8%) |
| 12:00 PM to 3:59 PM | 70 (5.0%) | 67 (6.4%) |
| 4:00 PM to 11:59 PM | 24 (1.7%) | 38 (3.6%) |
| Total | 1,411 (100.0%) | 1,054 (100.0%) |
Housing Occupancy in Old Bethpage
Occupancy by Ownership in Old Bethpage
Of the total 1,994 dwellings in Old Bethpage, owner-occupied units account for 1,848 (92.7%), while renter-occupied units make up 146 (7.3%).
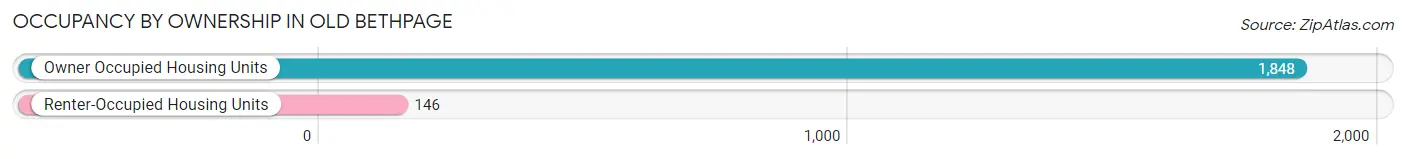
| Occupancy | # Housing Units | % Housing Units |
| Owner Occupied Housing Units | 1,848 | 92.7% |
| Renter-Occupied Housing Units | 146 | 7.3% |
| Total Occupied Housing Units | 1,994 | 100.0% |
Occupancy by Household Size in Old Bethpage
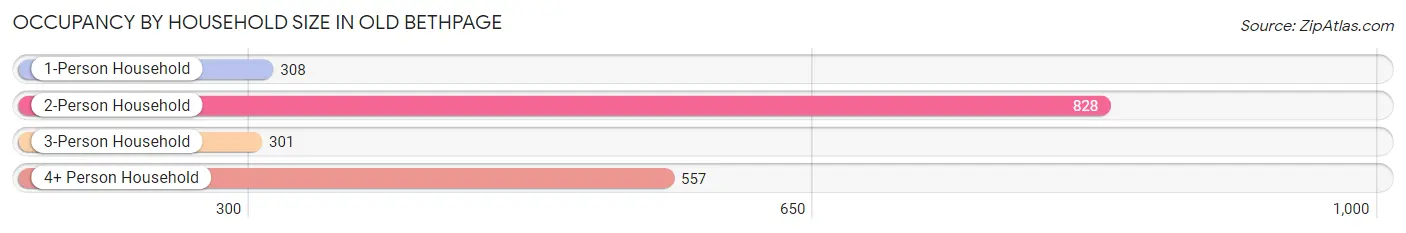
| Household Size | # Housing Units | % Housing Units |
| 1-Person Household | 308 | 15.4% |
| 2-Person Household | 828 | 41.5% |
| 3-Person Household | 301 | 15.1% |
| 4+ Person Household | 557 | 27.9% |
| Total Housing Units | 1,994 | 100.0% |
Occupancy by Ownership by Household Size in Old Bethpage
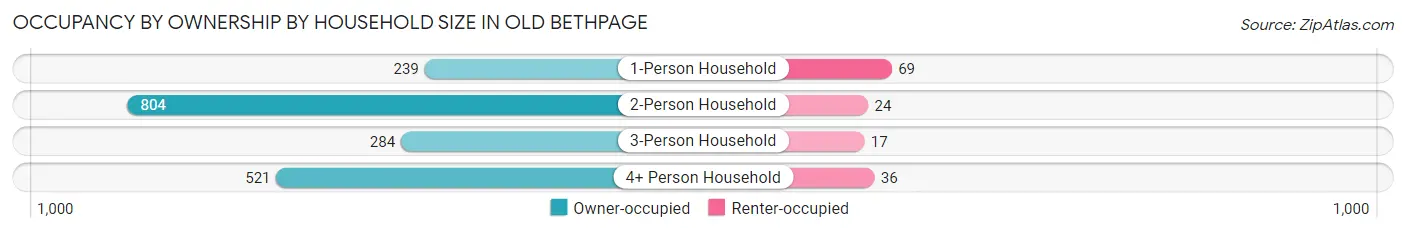
| Household Size | Owner-occupied | Renter-occupied |
| 1-Person Household | 239 (77.6%) | 69 (22.4%) |
| 2-Person Household | 804 (97.1%) | 24 (2.9%) |
| 3-Person Household | 284 (94.4%) | 17 (5.7%) |
| 4+ Person Household | 521 (93.5%) | 36 (6.5%) |
| Total Housing Units | 1,848 (92.7%) | 146 (7.3%) |
Occupancy by Educational Attainment in Old Bethpage
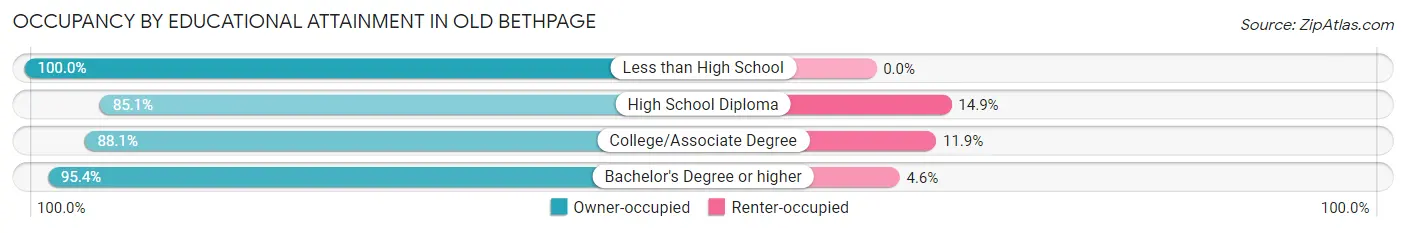
| Household Size | Owner-occupied | Renter-occupied |
| Less than High School | 41 (100.0%) | 0 (0.0%) |
| High School Diploma | 268 (85.1%) | 47 (14.9%) |
| College/Associate Degree | 282 (88.1%) | 38 (11.9%) |
| Bachelor's Degree or higher | 1,257 (95.4%) | 61 (4.6%) |
Occupancy by Age of Householder in Old Bethpage
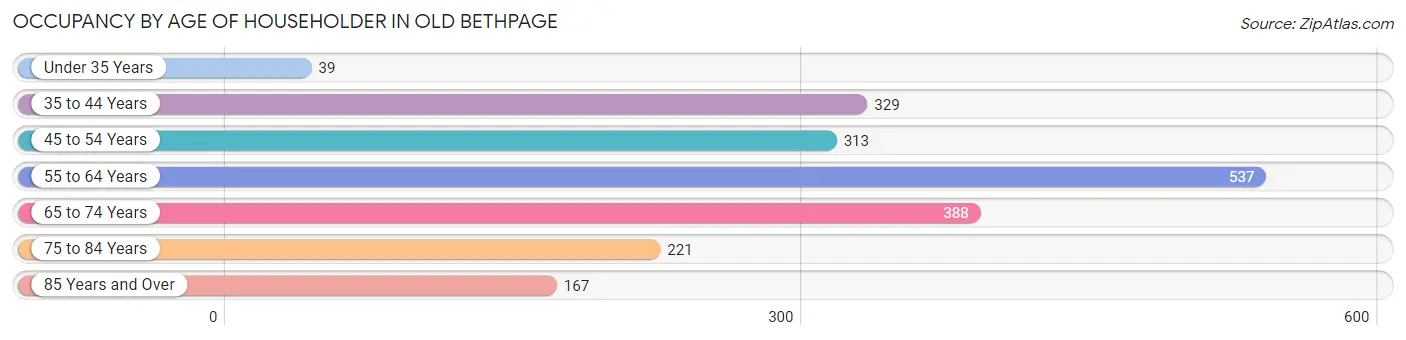
| Age Bracket | # Households | % Households |
| Under 35 Years | 39 | 2.0% |
| 35 to 44 Years | 329 | 16.5% |
| 45 to 54 Years | 313 | 15.7% |
| 55 to 64 Years | 537 | 26.9% |
| 65 to 74 Years | 388 | 19.5% |
| 75 to 84 Years | 221 | 11.1% |
| 85 Years and Over | 167 | 8.4% |
| Total | 1,994 | 100.0% |
Housing Finances in Old Bethpage
Median Income by Occupancy in Old Bethpage
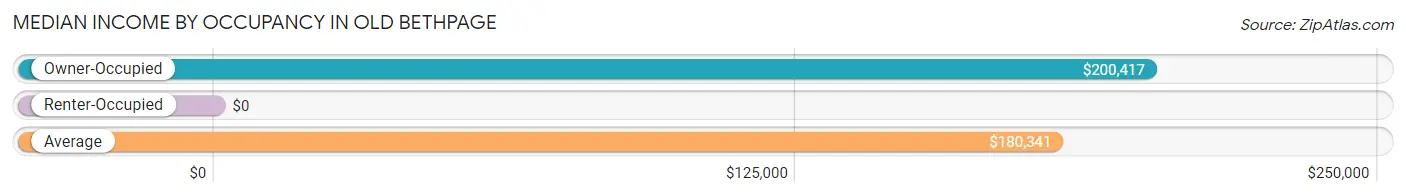
| Occupancy Type | # Households | Median Income |
| Owner-Occupied | 1,848 (92.7%) | $200,417 |
| Renter-Occupied | 146 (7.3%) | $0 |
| Average | 1,994 (100.0%) | $180,341 |
Occupancy by Householder Income Bracket in Old Bethpage
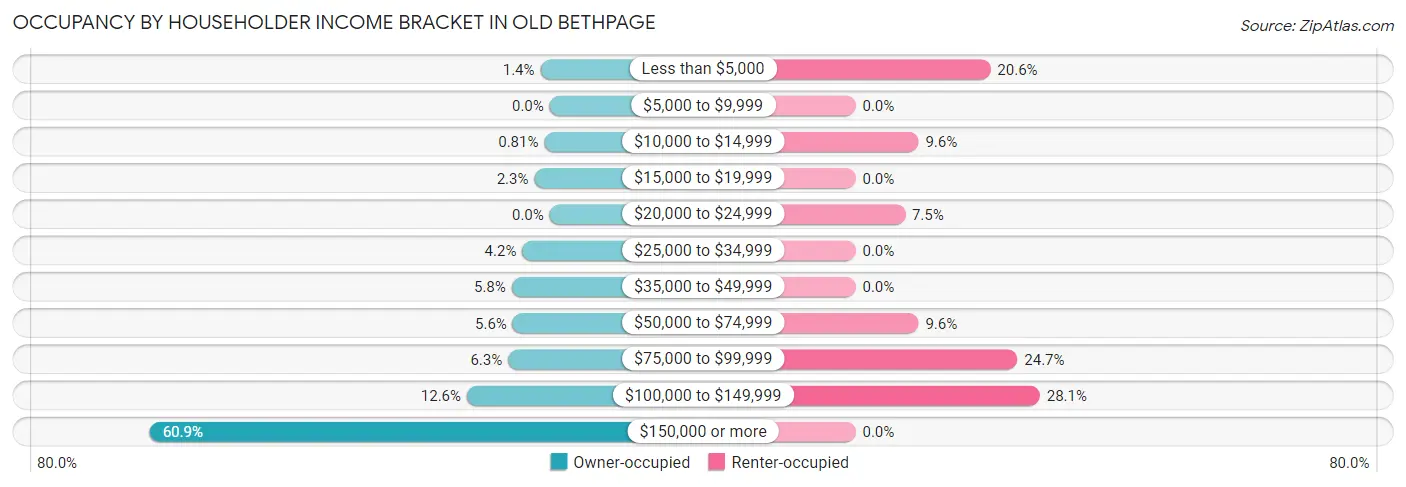
| Income Bracket | Owner-occupied | Renter-occupied |
| Less than $5,000 | 26 (1.4%) | 30 (20.5%) |
| $5,000 to $9,999 | 0 (0.0%) | 0 (0.0%) |
| $10,000 to $14,999 | 15 (0.8%) | 14 (9.6%) |
| $15,000 to $19,999 | 43 (2.3%) | 0 (0.0%) |
| $20,000 to $24,999 | 0 (0.0%) | 11 (7.5%) |
| $25,000 to $34,999 | 77 (4.2%) | 0 (0.0%) |
| $35,000 to $49,999 | 107 (5.8%) | 0 (0.0%) |
| $50,000 to $74,999 | 104 (5.6%) | 14 (9.6%) |
| $75,000 to $99,999 | 117 (6.3%) | 36 (24.7%) |
| $100,000 to $149,999 | 233 (12.6%) | 41 (28.1%) |
| $150,000 or more | 1,126 (60.9%) | 0 (0.0%) |
| Total | 1,848 (100.0%) | 146 (100.0%) |
Monthly Housing Cost Tiers in Old Bethpage
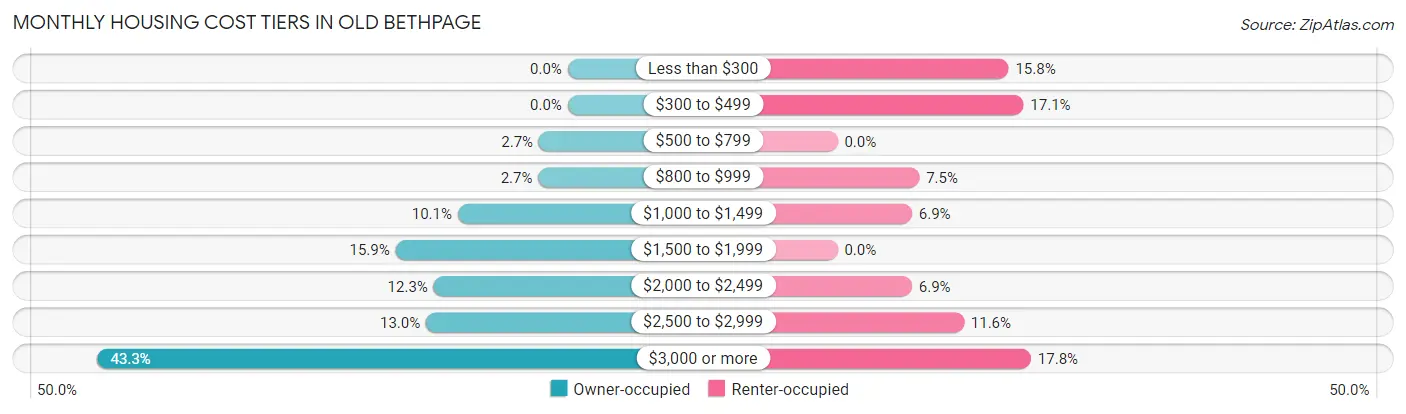
| Monthly Cost | Owner-occupied | Renter-occupied |
| Less than $300 | 0 (0.0%) | 23 (15.8%) |
| $300 to $499 | 0 (0.0%) | 25 (17.1%) |
| $500 to $799 | 49 (2.6%) | 0 (0.0%) |
| $800 to $999 | 50 (2.7%) | 11 (7.5%) |
| $1,000 to $1,499 | 187 (10.1%) | 10 (6.9%) |
| $1,500 to $1,999 | 293 (15.9%) | 0 (0.0%) |
| $2,000 to $2,499 | 228 (12.3%) | 10 (6.9%) |
| $2,500 to $2,999 | 241 (13.0%) | 17 (11.6%) |
| $3,000 or more | 800 (43.3%) | 26 (17.8%) |
| Total | 1,848 (100.0%) | 146 (100.0%) |
Physical Housing Characteristics in Old Bethpage
Housing Structures in Old Bethpage
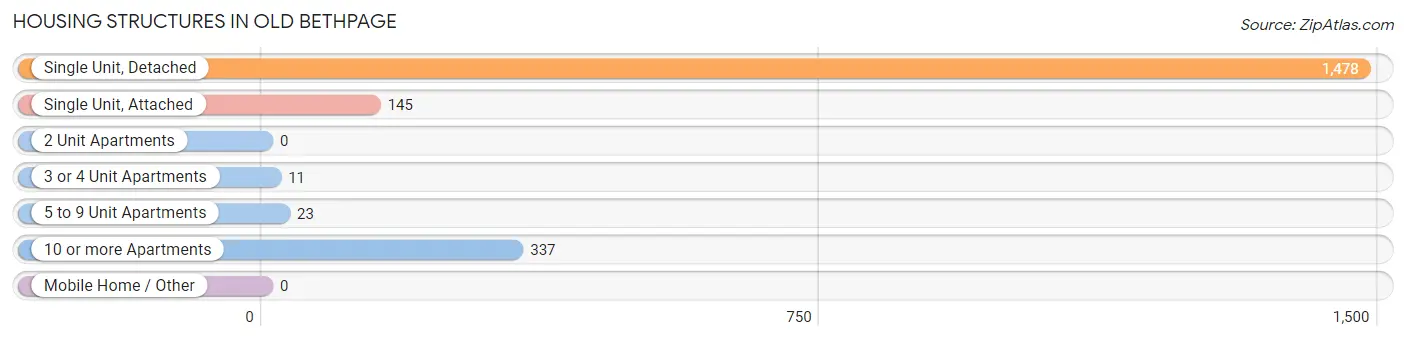
| Structure Type | # Housing Units | % Housing Units |
| Single Unit, Detached | 1,478 | 74.1% |
| Single Unit, Attached | 145 | 7.3% |
| 2 Unit Apartments | 0 | 0.0% |
| 3 or 4 Unit Apartments | 11 | 0.5% |
| 5 to 9 Unit Apartments | 23 | 1.1% |
| 10 or more Apartments | 337 | 16.9% |
| Mobile Home / Other | 0 | 0.0% |
| Total | 1,994 | 100.0% |
Housing Structures by Occupancy in Old Bethpage
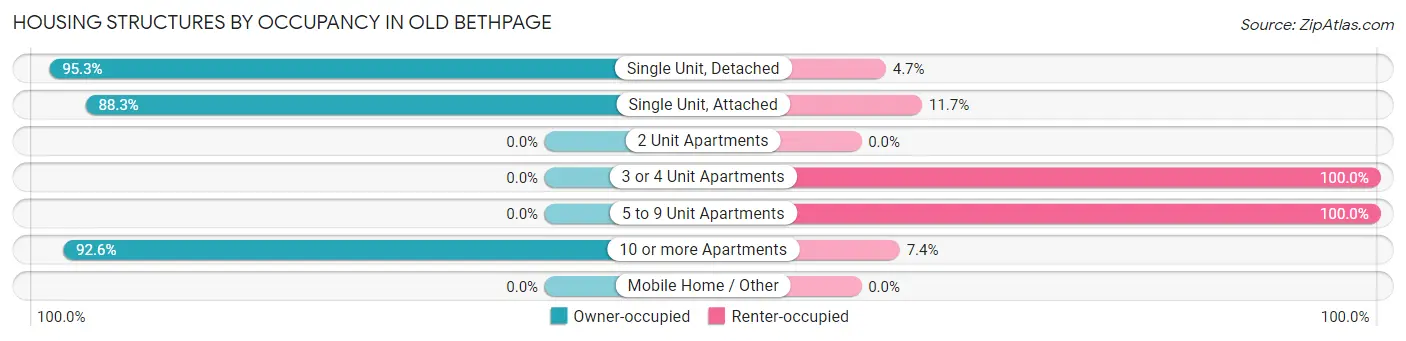
| Structure Type | Owner-occupied | Renter-occupied |
| Single Unit, Detached | 1,408 (95.3%) | 70 (4.7%) |
| Single Unit, Attached | 128 (88.3%) | 17 (11.7%) |
| 2 Unit Apartments | 0 (0.0%) | 0 (0.0%) |
| 3 or 4 Unit Apartments | 0 (0.0%) | 11 (100.0%) |
| 5 to 9 Unit Apartments | 0 (0.0%) | 23 (100.0%) |
| 10 or more Apartments | 312 (92.6%) | 25 (7.4%) |
| Mobile Home / Other | 0 (0.0%) | 0 (0.0%) |
| Total | 1,848 (92.7%) | 146 (7.3%) |
Housing Structures by Number of Rooms in Old Bethpage
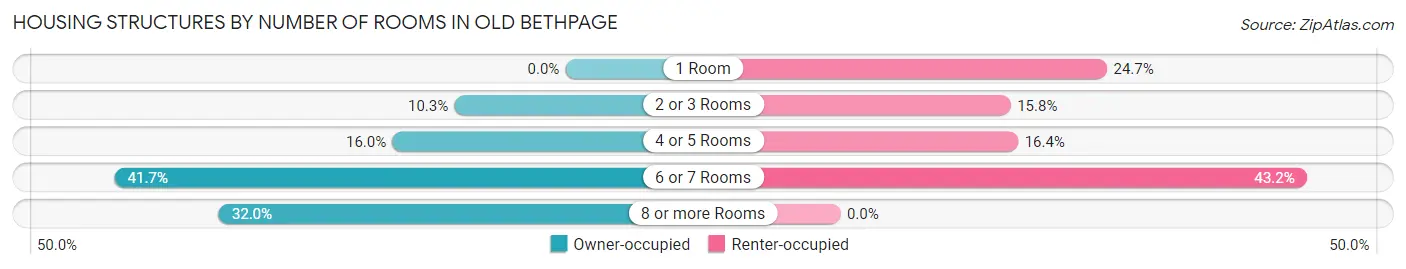
| Number of Rooms | Owner-occupied | Renter-occupied |
| 1 Room | 0 (0.0%) | 36 (24.7%) |
| 2 or 3 Rooms | 190 (10.3%) | 23 (15.8%) |
| 4 or 5 Rooms | 296 (16.0%) | 24 (16.4%) |
| 6 or 7 Rooms | 770 (41.7%) | 63 (43.1%) |
| 8 or more Rooms | 592 (32.0%) | 0 (0.0%) |
| Total | 1,848 (100.0%) | 146 (100.0%) |
Housing Structure by Heating Type in Old Bethpage
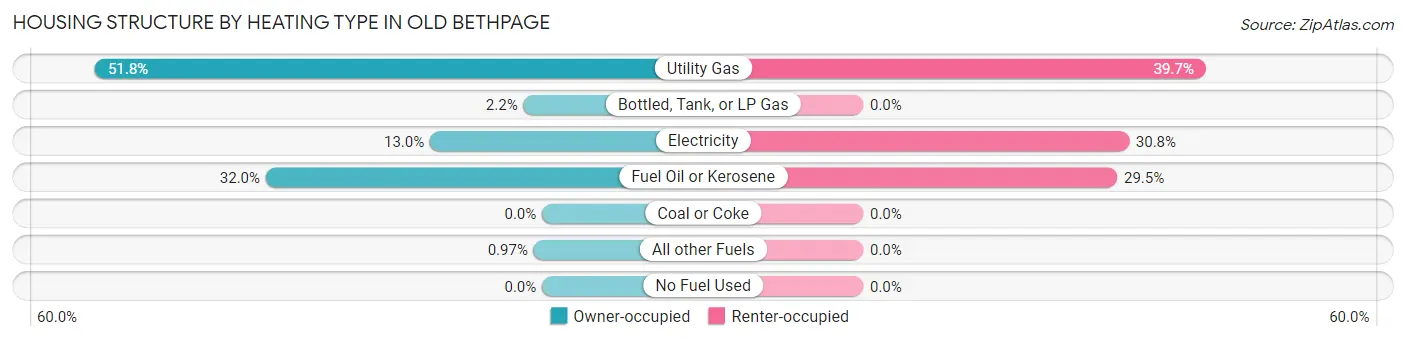
| Heating Type | Owner-occupied | Renter-occupied |
| Utility Gas | 958 (51.8%) | 58 (39.7%) |
| Bottled, Tank, or LP Gas | 40 (2.2%) | 0 (0.0%) |
| Electricity | 240 (13.0%) | 45 (30.8%) |
| Fuel Oil or Kerosene | 592 (32.0%) | 43 (29.4%) |
| Coal or Coke | 0 (0.0%) | 0 (0.0%) |
| All other Fuels | 18 (1.0%) | 0 (0.0%) |
| No Fuel Used | 0 (0.0%) | 0 (0.0%) |
| Total | 1,848 (100.0%) | 146 (100.0%) |
Household Vehicle Usage in Old Bethpage
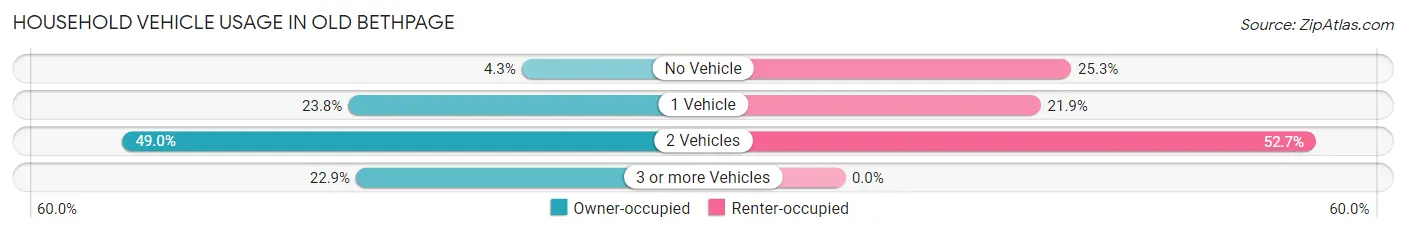
| Vehicles per Household | Owner-occupied | Renter-occupied |
| No Vehicle | 80 (4.3%) | 37 (25.3%) |
| 1 Vehicle | 439 (23.8%) | 32 (21.9%) |
| 2 Vehicles | 906 (49.0%) | 77 (52.7%) |
| 3 or more Vehicles | 423 (22.9%) | 0 (0.0%) |
| Total | 1,848 (100.0%) | 146 (100.0%) |
Real Estate & Mortgages in Old Bethpage
Real Estate and Mortgage Overview in Old Bethpage
| Characteristic | Without Mortgage | With Mortgage |
| Housing Units | 858 | 990 |
| Median Property Value | $767,000 | $811,500 |
| Median Household Income | $110,833 | $768 |
| Monthly Housing Costs | $1,501 | $766 |
| Real Estate Taxes | $10,001 | $17 |
Property Value by Mortgage Status in Old Bethpage
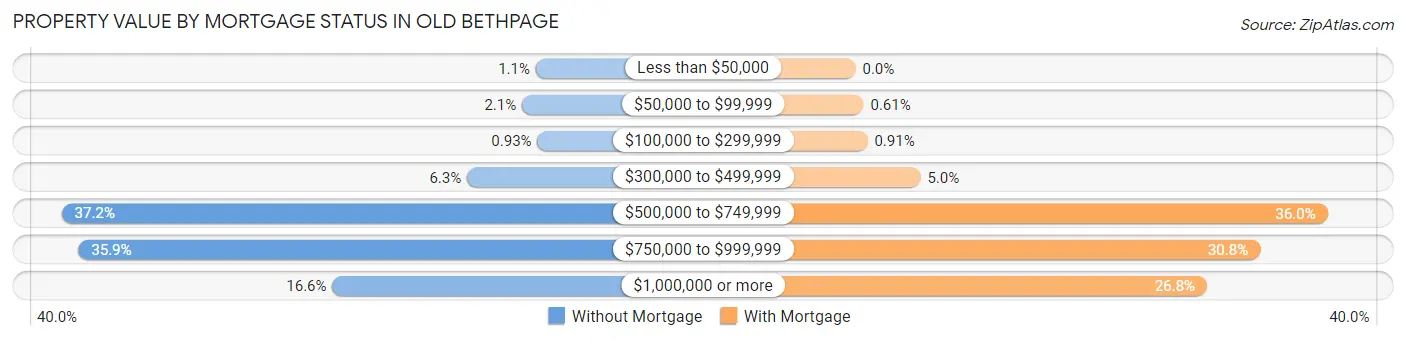
| Property Value | Without Mortgage | With Mortgage |
| Less than $50,000 | 9 (1.1%) | 0 (0.0%) |
| $50,000 to $99,999 | 18 (2.1%) | 6 (0.6%) |
| $100,000 to $299,999 | 8 (0.9%) | 9 (0.9%) |
| $300,000 to $499,999 | 54 (6.3%) | 49 (5.0%) |
| $500,000 to $749,999 | 319 (37.2%) | 356 (36.0%) |
| $750,000 to $999,999 | 308 (35.9%) | 305 (30.8%) |
| $1,000,000 or more | 142 (16.6%) | 265 (26.8%) |
| Total | 858 (100.0%) | 990 (100.0%) |
Household Income by Mortgage Status in Old Bethpage
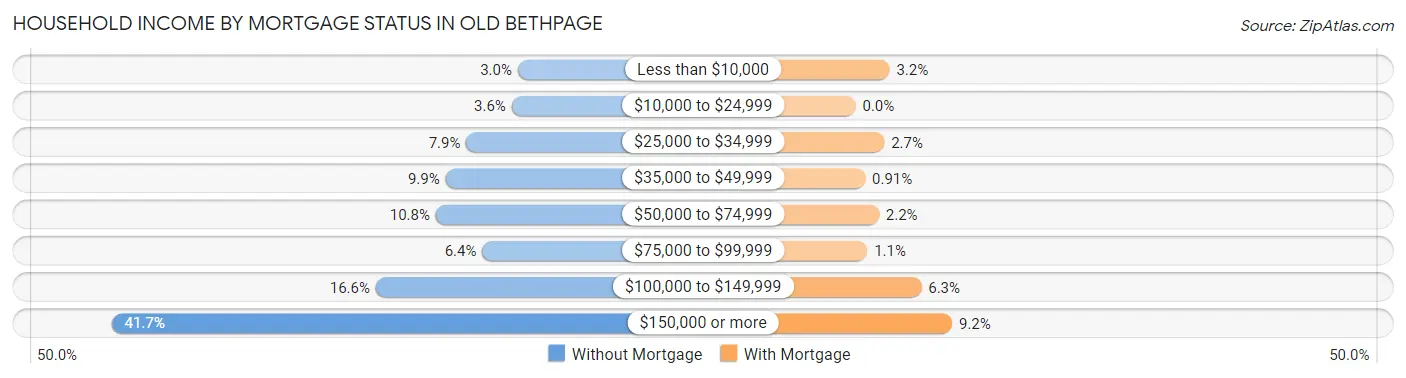
| Household Income | Without Mortgage | With Mortgage |
| Less than $10,000 | 26 (3.0%) | 32 (3.2%) |
| $10,000 to $24,999 | 31 (3.6%) | 0 (0.0%) |
| $25,000 to $34,999 | 68 (7.9%) | 27 (2.7%) |
| $35,000 to $49,999 | 85 (9.9%) | 9 (0.9%) |
| $50,000 to $74,999 | 93 (10.8%) | 22 (2.2%) |
| $75,000 to $99,999 | 55 (6.4%) | 11 (1.1%) |
| $100,000 to $149,999 | 142 (16.6%) | 62 (6.3%) |
| $150,000 or more | 358 (41.7%) | 91 (9.2%) |
| Total | 858 (100.0%) | 990 (100.0%) |
Property Value to Household Income Ratio in Old Bethpage
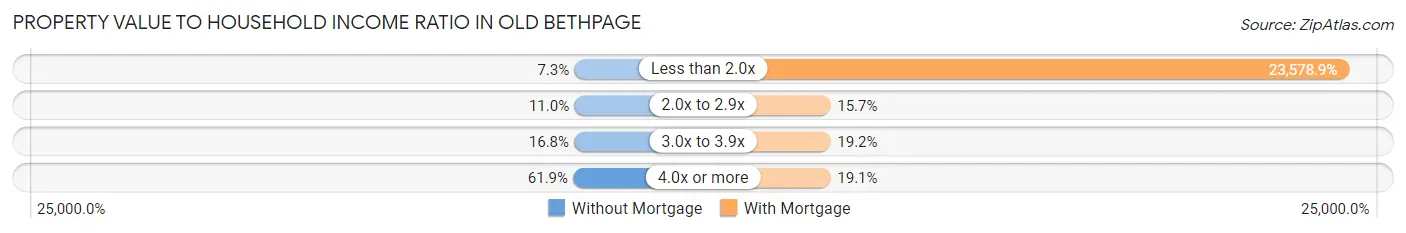
| Value-to-Income Ratio | Without Mortgage | With Mortgage |
| Less than 2.0x | 63 (7.3%) | 233,431 (23,578.9%) |
| 2.0x to 2.9x | 94 (11.0%) | 155 (15.7%) |
| 3.0x to 3.9x | 144 (16.8%) | 190 (19.2%) |
| 4.0x or more | 531 (61.9%) | 189 (19.1%) |
| Total | 858 (100.0%) | 990 (100.0%) |
Real Estate Taxes by Mortgage Status in Old Bethpage
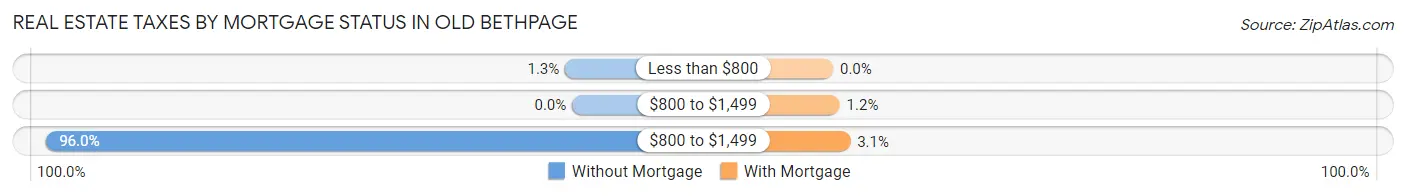
| Property Taxes | Without Mortgage | With Mortgage |
| Less than $800 | 11 (1.3%) | 0 (0.0%) |
| $800 to $1,499 | 0 (0.0%) | 12 (1.2%) |
| $800 to $1,499 | 824 (96.0%) | 31 (3.1%) |
| Total | 858 (100.0%) | 990 (100.0%) |
Health & Disability in Old Bethpage
Health Insurance Coverage by Age in Old Bethpage
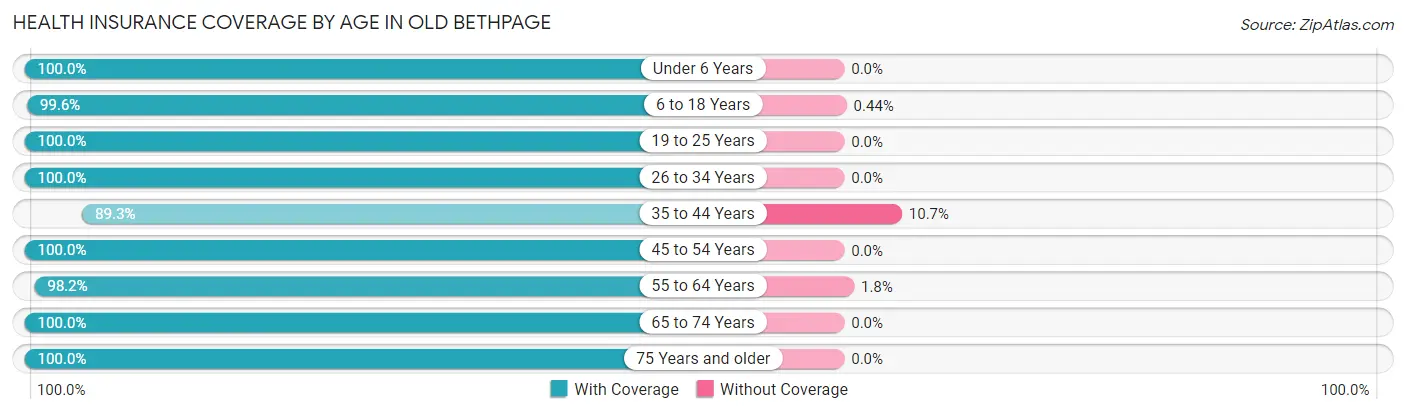
| Age Bracket | With Coverage | Without Coverage |
| Under 6 Years | 409 (100.0%) | 0 (0.0%) |
| 6 to 18 Years | 911 (99.6%) | 4 (0.4%) |
| 19 to 25 Years | 273 (100.0%) | 0 (0.0%) |
| 26 to 34 Years | 475 (100.0%) | 0 (0.0%) |
| 35 to 44 Years | 615 (89.3%) | 74 (10.7%) |
| 45 to 54 Years | 687 (100.0%) | 0 (0.0%) |
| 55 to 64 Years | 1,077 (98.2%) | 20 (1.8%) |
| 65 to 74 Years | 665 (100.0%) | 0 (0.0%) |
| 75 Years and older | 569 (100.0%) | 0 (0.0%) |
| Total | 5,681 (98.3%) | 98 (1.7%) |
Health Insurance Coverage by Citizenship Status in Old Bethpage
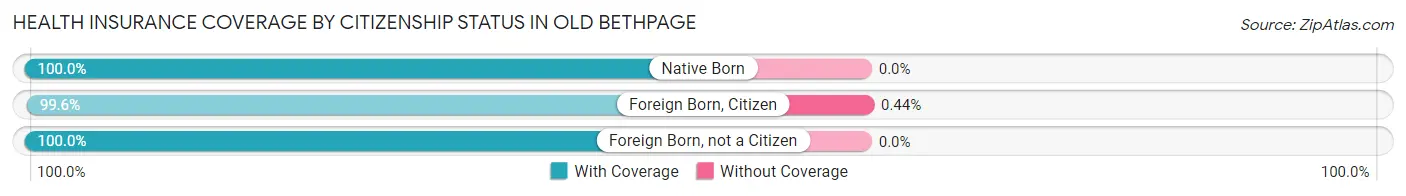
| Citizenship Status | With Coverage | Without Coverage |
| Native Born | 409 (100.0%) | 0 (0.0%) |
| Foreign Born, Citizen | 911 (99.6%) | 4 (0.4%) |
| Foreign Born, not a Citizen | 273 (100.0%) | 0 (0.0%) |
Health Insurance Coverage by Household Income in Old Bethpage
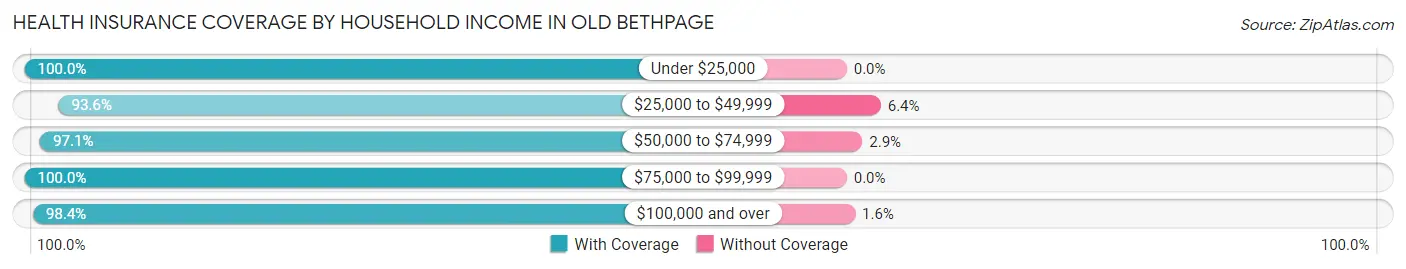
| Household Income | With Coverage | Without Coverage |
| Under $25,000 | 197 (100.0%) | 0 (0.0%) |
| $25,000 to $49,999 | 294 (93.6%) | 20 (6.4%) |
| $50,000 to $74,999 | 266 (97.1%) | 8 (2.9%) |
| $75,000 to $99,999 | 462 (100.0%) | 0 (0.0%) |
| $100,000 and over | 4,424 (98.4%) | 70 (1.6%) |
Public vs Private Health Insurance Coverage by Age in Old Bethpage
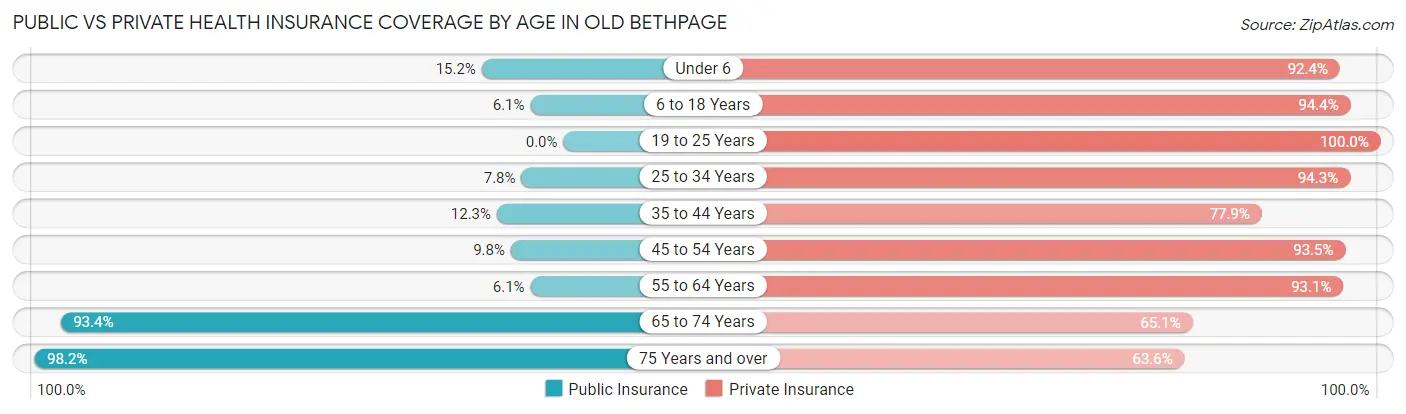
| Age Bracket | Public Insurance | Private Insurance |
| Under 6 | 62 (15.2%) | 378 (92.4%) |
| 6 to 18 Years | 56 (6.1%) | 864 (94.4%) |
| 19 to 25 Years | 0 (0.0%) | 273 (100.0%) |
| 25 to 34 Years | 37 (7.8%) | 448 (94.3%) |
| 35 to 44 Years | 85 (12.3%) | 537 (77.9%) |
| 45 to 54 Years | 67 (9.8%) | 642 (93.4%) |
| 55 to 64 Years | 67 (6.1%) | 1,021 (93.1%) |
| 65 to 74 Years | 621 (93.4%) | 433 (65.1%) |
| 75 Years and over | 559 (98.2%) | 362 (63.6%) |
| Total | 1,554 (26.9%) | 4,958 (85.8%) |
Disability Status by Sex by Age in Old Bethpage
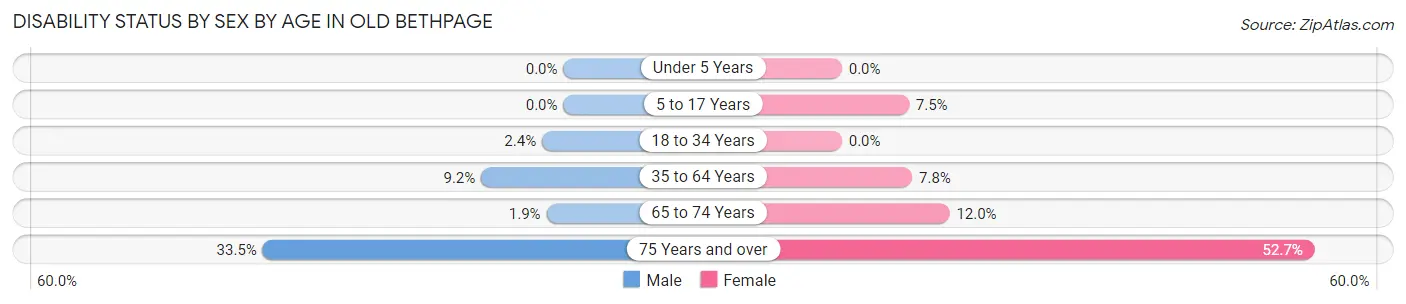
| Age Bracket | Male | Female |
| Under 5 Years | 0 (0.0%) | 0 (0.0%) |
| 5 to 17 Years | 0 (0.0%) | 43 (7.5%) |
| 18 to 34 Years | 10 (2.4%) | 0 (0.0%) |
| 35 to 64 Years | 113 (9.2%) | 97 (7.8%) |
| 65 to 74 Years | 7 (1.9%) | 35 (12.0%) |
| 75 Years and over | 71 (33.5%) | 188 (52.7%) |
Disability Class by Sex by Age in Old Bethpage
Disability Class: Hearing Difficulty
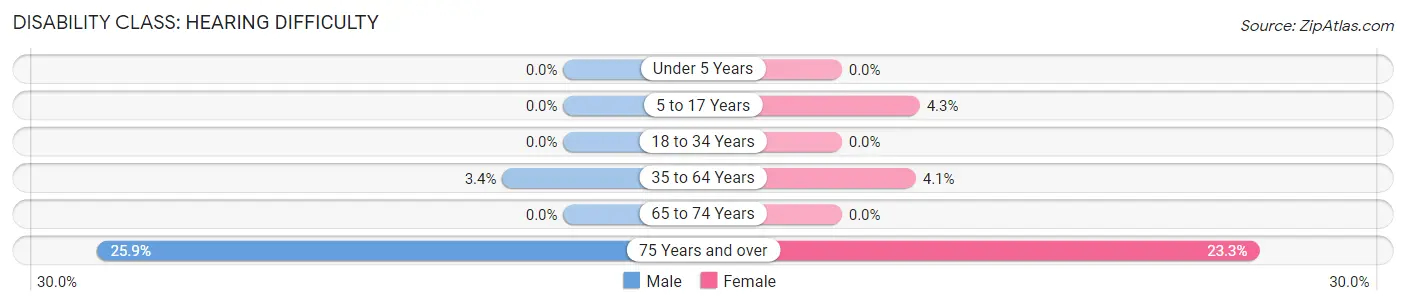
| Age Bracket | Male | Female |
| Under 5 Years | 0 (0.0%) | 0 (0.0%) |
| 5 to 17 Years | 0 (0.0%) | 25 (4.3%) |
| 18 to 34 Years | 0 (0.0%) | 0 (0.0%) |
| 35 to 64 Years | 42 (3.4%) | 51 (4.1%) |
| 65 to 74 Years | 0 (0.0%) | 0 (0.0%) |
| 75 Years and over | 55 (25.9%) | 83 (23.3%) |
Disability Class: Vision Difficulty
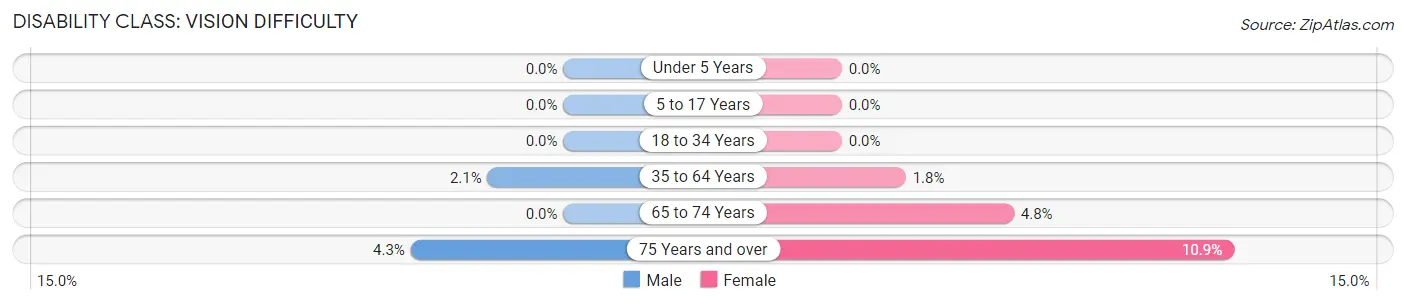
| Age Bracket | Male | Female |
| Under 5 Years | 0 (0.0%) | 0 (0.0%) |
| 5 to 17 Years | 0 (0.0%) | 0 (0.0%) |
| 18 to 34 Years | 0 (0.0%) | 0 (0.0%) |
| 35 to 64 Years | 26 (2.1%) | 22 (1.8%) |
| 65 to 74 Years | 0 (0.0%) | 14 (4.8%) |
| 75 Years and over | 9 (4.3%) | 39 (10.9%) |
Disability Class: Cognitive Difficulty
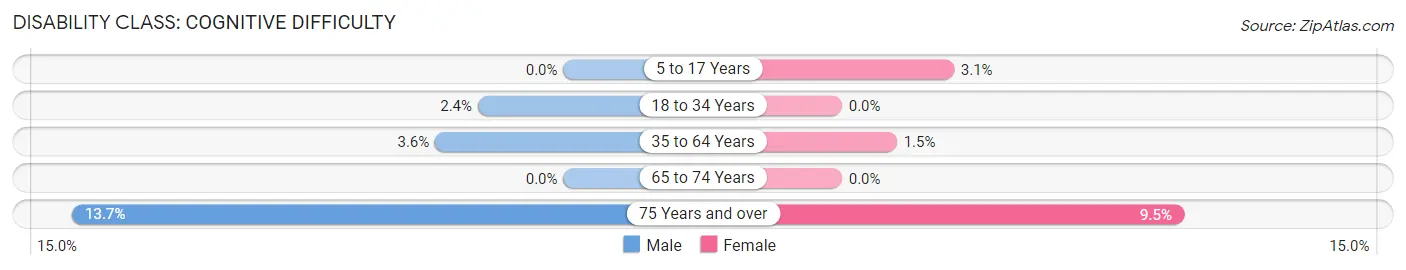
| Age Bracket | Male | Female |
| 5 to 17 Years | 0 (0.0%) | 18 (3.1%) |
| 18 to 34 Years | 10 (2.4%) | 0 (0.0%) |
| 35 to 64 Years | 44 (3.6%) | 19 (1.5%) |
| 65 to 74 Years | 0 (0.0%) | 0 (0.0%) |
| 75 Years and over | 29 (13.7%) | 34 (9.5%) |
Disability Class: Ambulatory Difficulty
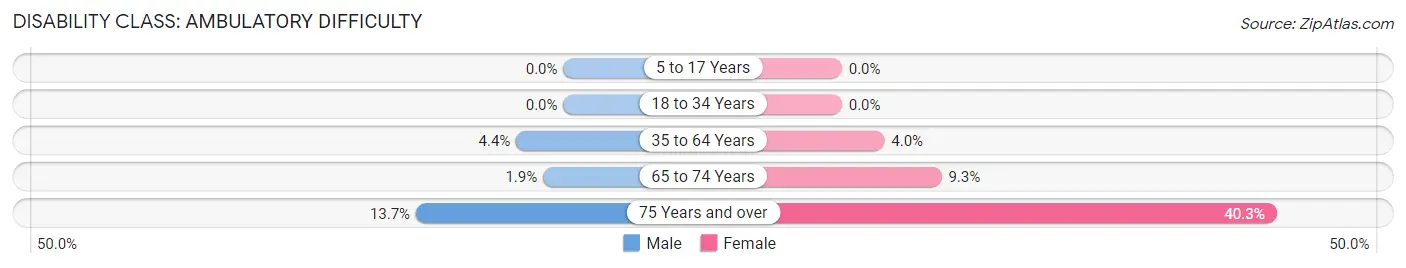
| Age Bracket | Male | Female |
| 5 to 17 Years | 0 (0.0%) | 0 (0.0%) |
| 18 to 34 Years | 0 (0.0%) | 0 (0.0%) |
| 35 to 64 Years | 54 (4.4%) | 49 (4.0%) |
| 65 to 74 Years | 7 (1.9%) | 27 (9.2%) |
| 75 Years and over | 29 (13.7%) | 144 (40.3%) |
Disability Class: Self-Care Difficulty
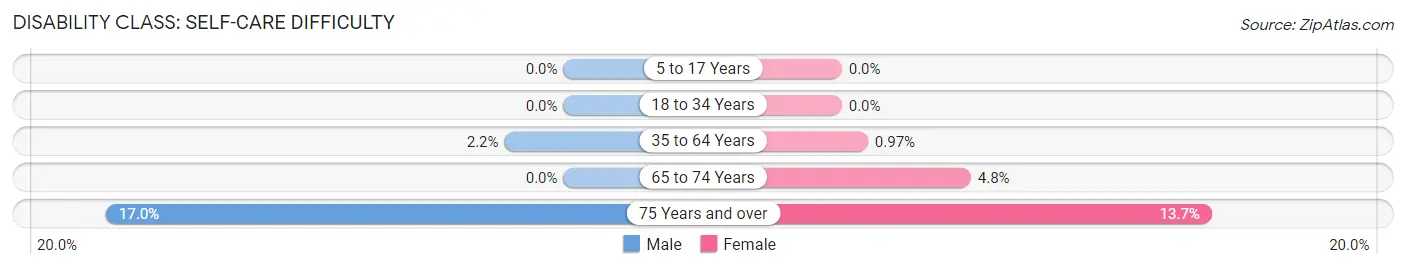
| Age Bracket | Male | Female |
| 5 to 17 Years | 0 (0.0%) | 0 (0.0%) |
| 18 to 34 Years | 0 (0.0%) | 0 (0.0%) |
| 35 to 64 Years | 27 (2.2%) | 12 (1.0%) |
| 65 to 74 Years | 0 (0.0%) | 14 (4.8%) |
| 75 Years and over | 36 (17.0%) | 49 (13.7%) |
Technology Access in Old Bethpage
Computing Device Access in Old Bethpage
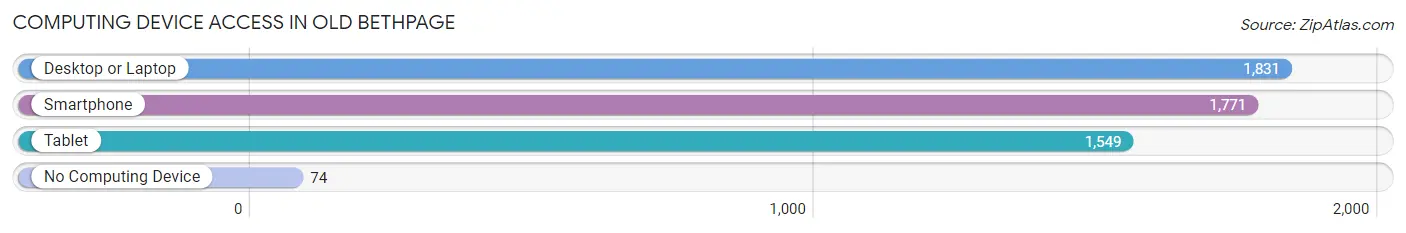
| Device Type | # Households | % Households |
| Desktop or Laptop | 1,831 | 91.8% |
| Smartphone | 1,771 | 88.8% |
| Tablet | 1,549 | 77.7% |
| No Computing Device | 74 | 3.7% |
| Total | 1,994 | 100.0% |
Internet Access in Old Bethpage
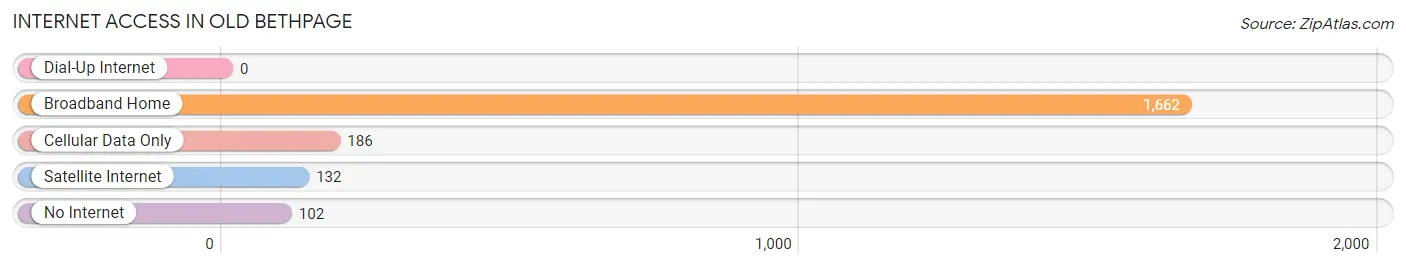
| Internet Type | # Households | % Households |
| Dial-Up Internet | 0 | 0.0% |
| Broadband Home | 1,662 | 83.4% |
| Cellular Data Only | 186 | 9.3% |
| Satellite Internet | 132 | 6.6% |
| No Internet | 102 | 5.1% |
| Total | 1,994 | 100.0% |
Old Bethpage Summary
Bethpage is a hamlet located in the Town of Oyster Bay in Nassau County, New York. It is situated on the border of Nassau and Suffolk counties, and is part of the Greater New York City metropolitan area. The hamlet is located on the south side of the Long Island Expressway, and is approximately 25 miles east of Manhattan.
History
The area now known as Old Bethpage was originally inhabited by the Matinecock Native American tribe. The first European settlers arrived in the area in the late 1600s, and the hamlet was officially established in 1837. The hamlet was named after the Bethpage Purchase, a tract of land purchased by Thomas Powell in 1695.
The hamlet was largely agricultural until the early 20th century, when it began to experience rapid growth due to its proximity to New York City. The hamlet was home to a number of large farms, including the Bethpage State Park, which was established in 1932.
Geography
Old Bethpage is located in the Town of Oyster Bay in Nassau County, New York. It is situated on the border of Nassau and Suffolk counties, and is part of the Greater New York City metropolitan area. The hamlet is located on the south side of the Long Island Expressway, and is approximately 25 miles east of Manhattan.
The hamlet is bordered by Plainview to the west, Hicksville to the north, Farmingdale to the east, and Massapequa to the south. The hamlet is located in the Pine Barrens, a large area of pine forest that stretches across Long Island.
Economy
Old Bethpage is largely a residential community, and the majority of its residents are employed in the nearby cities of New York City and Long Island. The hamlet is home to a number of small businesses, including restaurants, retail stores, and professional services.
The hamlet is also home to a number of large employers, including Northwell Health, a healthcare provider, and Bethpage Federal Credit Union, a financial services provider. The hamlet is also home to a number of industrial and manufacturing businesses, including a large printing plant and a number of auto repair shops.
Demographics
As of the 2010 census, Old Bethpage had a population of 6,523. The population is largely white (90.2%), with a small percentage of African Americans (3.2%), Asians (3.1%), and Hispanics (2.3%). The median household income is $107,945, and the median home value is $521,000.
The hamlet is served by the Bethpage Union Free School District, which includes four elementary schools, one middle school, and one high school. The hamlet is also home to a number of private schools, including the Bethpage Montessori School and the St. Thomas Aquinas Catholic School.
Conclusion
Old Bethpage is a hamlet located in the Town of Oyster Bay in Nassau County, New York. It is situated on the border of Nassau and Suffolk counties, and is part of the Greater New York City metropolitan area. The hamlet was originally inhabited by the Matinecock Native American tribe, and was officially established in 1837. The hamlet is largely residential, and is home to a number of small businesses, large employers, and industrial and manufacturing businesses. The population is largely white, with a small percentage of African Americans, Asians, and Hispanics. The hamlet is served by the Bethpage Union Free School District, and is home to a number of private schools.
Common Questions
What is Per Capita Income in Old Bethpage?
Per Capita income in Old Bethpage is $70,478.
What is the Median Family Income in Old Bethpage?
Median Family Income in Old Bethpage is $203,250.
What is the Median Household income in Old Bethpage?
Median Household Income in Old Bethpage is $180,341.
What is Income or Wage Gap in Old Bethpage?
Income or Wage Gap in Old Bethpage is 26.4%.
Women in Old Bethpage earn 73.6 cents for every dollar earned by a man.
What is Inequality or Gini Index in Old Bethpage?
Inequality or Gini Index in Old Bethpage is 0.41.
What is the Total Population of Old Bethpage?
Total Population of Old Bethpage is 5,779.
What is the Total Male Population of Old Bethpage?
Total Male Population of Old Bethpage is 2,830.
What is the Total Female Population of Old Bethpage?
Total Female Population of Old Bethpage is 2,949.
What is the Ratio of Males per 100 Females in Old Bethpage?
There are 95.96 Males per 100 Females in Old Bethpage.
What is the Ratio of Females per 100 Males in Old Bethpage?
There are 104.20 Females per 100 Males in Old Bethpage.
What is the Median Population Age in Old Bethpage?
Median Population Age in Old Bethpage is 47.1 Years.
What is the Average Family Size in Old Bethpage
Average Family Size in Old Bethpage is 3.2 People.
What is the Average Household Size in Old Bethpage
Average Household Size in Old Bethpage is 2.9 People.
How Large is the Labor Force in Old Bethpage?
There are 3,077 People in the Labor Forcein in Old Bethpage.
What is the Percentage of People in the Labor Force in Old Bethpage?
66.0% of People are in the Labor Force in Old Bethpage.
What is the Unemployment Rate in Old Bethpage?
Unemployment Rate in Old Bethpage is 3.5%.