Head of the Harbor, NY Map & Demographics
Head of the Harbor Map
Head of the Harbor Overview
$104,246
PER CAPITA INCOME
$250,001
AVG FAMILY INCOME
$250,001
AVG HOUSEHOLD INCOME
59.9%
WAGE / INCOME GAP [ % ]
40.1¢/ $1
WAGE / INCOME GAP [ $ ]
0.41
INEQUALITY / GINI INDEX
1,501
TOTAL POPULATION
743
MALE POPULATION
758
FEMALE POPULATION
98.02
MALES / 100 FEMALES
102.02
FEMALES / 100 MALES
46.8
MEDIAN AGE
3.3
AVG FAMILY SIZE
3.1
AVG HOUSEHOLD SIZE
859
LABOR FORCE [ PEOPLE ]
69.8%
PERCENT IN LABOR FORCE
2.9%
UNEMPLOYMENT RATE
Income in Head of the Harbor
Income Overview in Head of the Harbor
Per Capita Income in Head of the Harbor is $104,246, while median incomes of families and households are $250,001 and $250,001 respectively.
| Characteristic | Number | Measure |
| Per Capita Income | 1,501 | $104,246 |
| Median Family Income | 410 | $250,001 |
| Mean Family Income | 410 | $328,493 |
| Median Household Income | 490 | $250,001 |
| Mean Household Income | 490 | $316,771 |
| Income Deficit | 410 | $0 |
| Wage / Income Gap (%) | 1,501 | 59.92% |
| Wage / Income Gap ($) | 1,501 | 40.08¢ per $1 |
| Gini / Inequality Index | 1,501 | 0.41 |
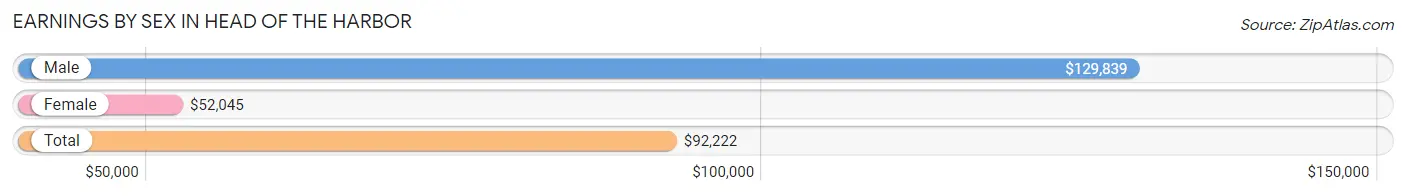
Earnings by Sex in Head of the Harbor
Average Earnings in Head of the Harbor are $92,222, $129,839 for men and $52,045 for women, a difference of 59.9%.
| Sex | Number | Average Earnings |
| Male | 462 (51.7%) | $129,839 |
| Female | 432 (48.3%) | $52,045 |
| Total | 894 (100.0%) | $92,222 |
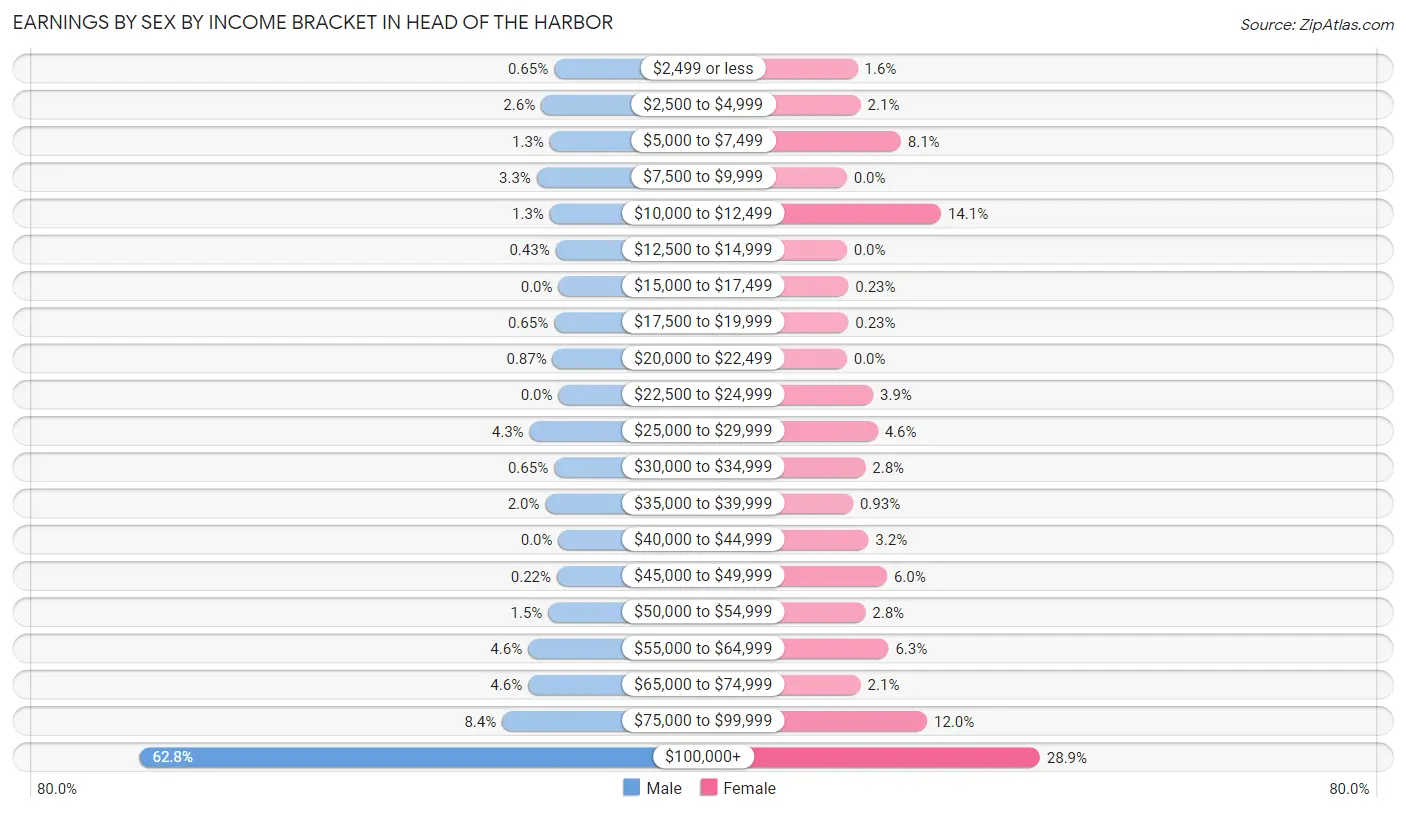
Earnings by Sex by Income Bracket in Head of the Harbor
The most common earnings brackets in Head of the Harbor are $100,000+ for men (290 | 62.8%) and $100,000+ for women (125 | 28.9%).
| Income | Male | Female |
| $2,499 or less | 3 (0.6%) | 7 (1.6%) |
| $2,500 to $4,999 | 12 (2.6%) | 9 (2.1%) |
| $5,000 to $7,499 | 6 (1.3%) | 35 (8.1%) |
| $7,500 to $9,999 | 15 (3.3%) | 0 (0.0%) |
| $10,000 to $12,499 | 6 (1.3%) | 61 (14.1%) |
| $12,500 to $14,999 | 2 (0.4%) | 0 (0.0%) |
| $15,000 to $17,499 | 0 (0.0%) | 1 (0.2%) |
| $17,500 to $19,999 | 3 (0.6%) | 1 (0.2%) |
| $20,000 to $22,499 | 4 (0.9%) | 0 (0.0%) |
| $22,500 to $24,999 | 0 (0.0%) | 17 (3.9%) |
| $25,000 to $29,999 | 20 (4.3%) | 20 (4.6%) |
| $30,000 to $34,999 | 3 (0.6%) | 12 (2.8%) |
| $35,000 to $39,999 | 9 (1.9%) | 4 (0.9%) |
| $40,000 to $44,999 | 0 (0.0%) | 14 (3.2%) |
| $45,000 to $49,999 | 1 (0.2%) | 26 (6.0%) |
| $50,000 to $54,999 | 7 (1.5%) | 12 (2.8%) |
| $55,000 to $64,999 | 21 (4.5%) | 27 (6.2%) |
| $65,000 to $74,999 | 21 (4.5%) | 9 (2.1%) |
| $75,000 to $99,999 | 39 (8.4%) | 52 (12.0%) |
| $100,000+ | 290 (62.8%) | 125 (28.9%) |
| Total | 462 (100.0%) | 432 (100.0%) |
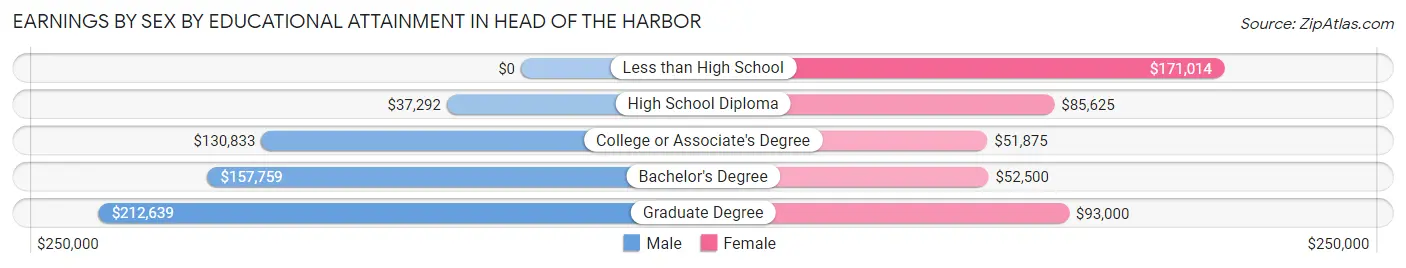
Earnings by Sex by Educational Attainment in Head of the Harbor
Average earnings in Head of the Harbor are $137,941 for men and $82,768 for women, a difference of 40.0%. Men with an educational attainment of graduate degree enjoy the highest average annual earnings of $212,639, while those with high school diploma education earn the least with $37,292. Women with an educational attainment of less than high school earn the most with the average annual earnings of $171,014, while those with college or associate's degree education have the smallest earnings of $51,875.
| Educational Attainment | Male Income | Female Income |
| Less than High School | - | - |
| High School Diploma | $37,292 | $85,625 |
| College or Associate's Degree | $130,833 | $51,875 |
| Bachelor's Degree | $157,759 | $52,500 |
| Graduate Degree | $212,639 | $93,000 |
| Total | $137,941 | $82,768 |
Family Income in Head of the Harbor
Family Income Brackets in Head of the Harbor
According to the Head of the Harbor family income data, there are 267 families falling into the $200,000+ income range, which is the most common income bracket and makes up 65.1% of all families.
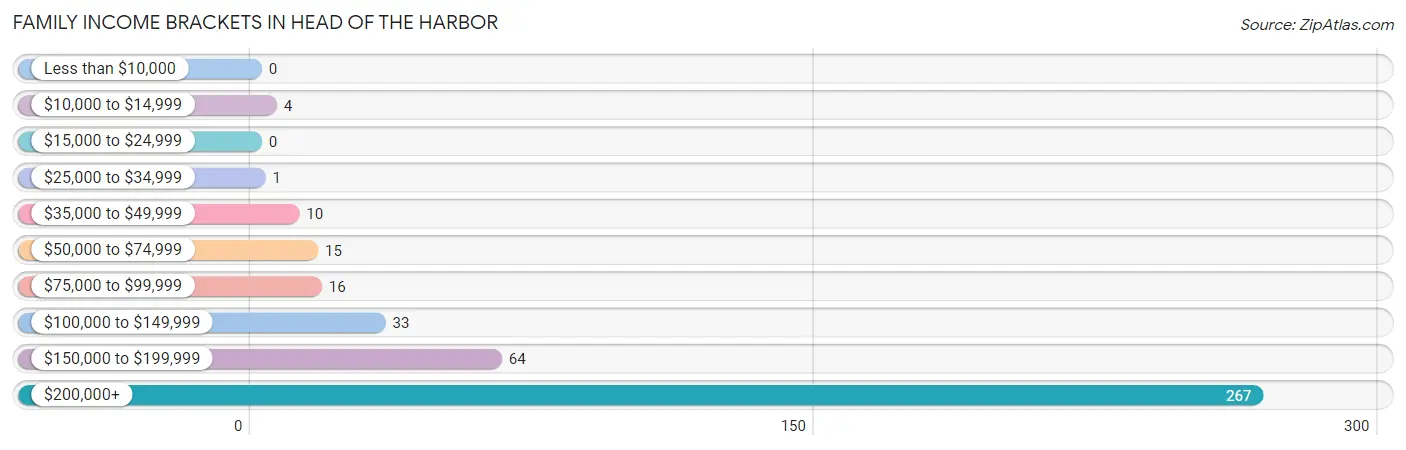
| Income Bracket | # Families | % Families |
| Less than $10,000 | 0 | 0.0% |
| $10,000 to $14,999 | 4 | 1.0% |
| $15,000 to $24,999 | 0 | 0.0% |
| $25,000 to $34,999 | 1 | 0.2% |
| $35,000 to $49,999 | 10 | 2.4% |
| $50,000 to $74,999 | 15 | 3.7% |
| $75,000 to $99,999 | 16 | 3.9% |
| $100,000 to $149,999 | 33 | 8.0% |
| $150,000 to $199,999 | 64 | 15.6% |
| $200,000+ | 267 | 65.1% |
Family Income by Famaliy Size in Head of the Harbor
3-person families (130 | 31.7%) account for the highest median family income in Head of the Harbor with $250,001 per family, while 2-person families (146 | 35.6%) have the highest median income of $116,250 per family member.
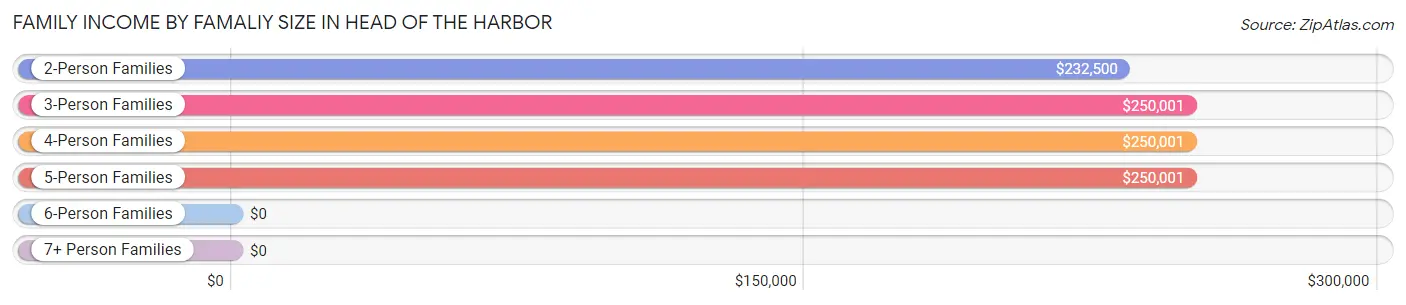
| Income Bracket | # Families | Median Income |
| 2-Person Families | 146 (35.6%) | $232,500 |
| 3-Person Families | 130 (31.7%) | $250,001 |
| 4-Person Families | 70 (17.1%) | $250,001 |
| 5-Person Families | 41 (10.0%) | $250,001 |
| 6-Person Families | 17 (4.2%) | $0 |
| 7+ Person Families | 6 (1.5%) | $0 |
| Total | 410 (100.0%) | $250,001 |
Family Income by Number of Earners in Head of the Harbor
The median family income in Head of the Harbor is $250,001, with families comprising 1 earner (125) having the highest median family income of $250,001, while families with no earners (24) have the lowest median family income of $145,833, accounting for 30.5% and 5.9% of families, respectively.
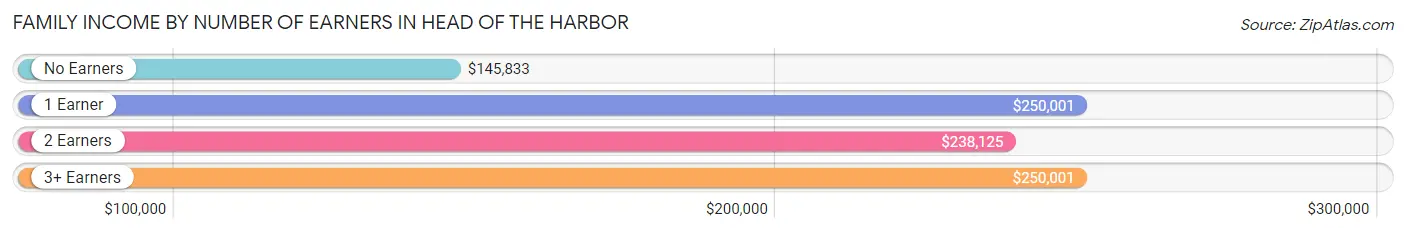
| Number of Earners | # Families | Median Income |
| No Earners | 24 (5.9%) | $145,833 |
| 1 Earner | 125 (30.5%) | $250,001 |
| 2 Earners | 152 (37.1%) | $238,125 |
| 3+ Earners | 109 (26.6%) | $250,001 |
| Total | 410 (100.0%) | $250,001 |
Household Income in Head of the Harbor
Household Income Brackets in Head of the Harbor
With 293 households falling in the category, the $200,000+ income range is the most frequent in Head of the Harbor, accounting for 59.8% of all households.
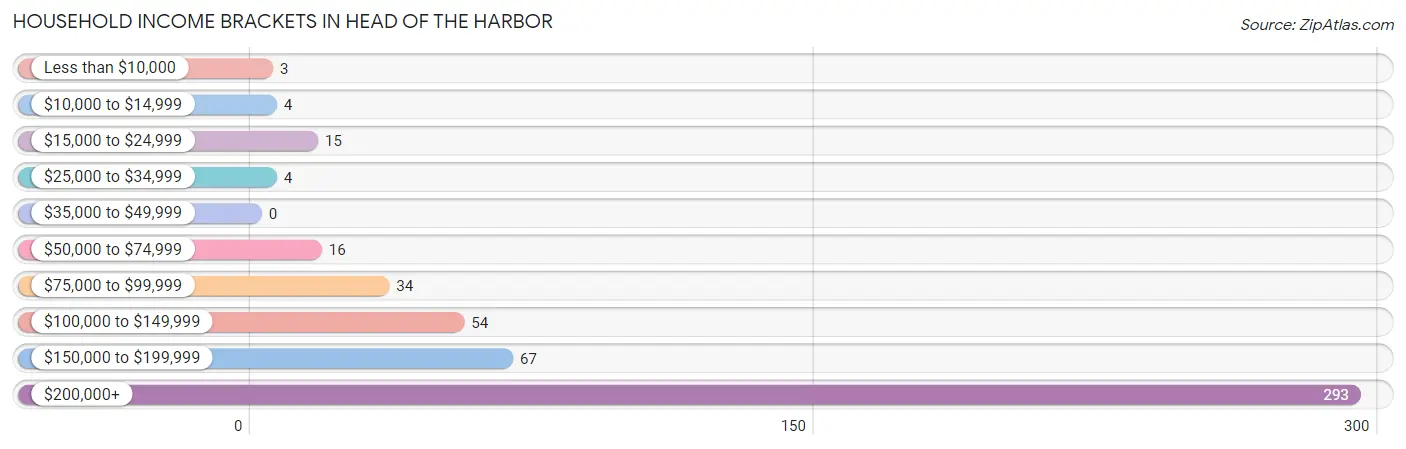
| Income Bracket | # Households | % Households |
| Less than $10,000 | 3 | 0.6% |
| $10,000 to $14,999 | 4 | 0.8% |
| $15,000 to $24,999 | 15 | 3.1% |
| $25,000 to $34,999 | 4 | 0.8% |
| $35,000 to $49,999 | 0 | 0.0% |
| $50,000 to $74,999 | 16 | 3.3% |
| $75,000 to $99,999 | 34 | 6.9% |
| $100,000 to $149,999 | 54 | 11.0% |
| $150,000 to $199,999 | 67 | 13.7% |
| $200,000+ | 293 | 59.8% |
Household Income by Householder Age in Head of the Harbor
The median household income in Head of the Harbor is $250,001, with the highest median household income of $250,001 found in the 45 to 64 years age bracket for the primary householder. A total of 260 households (53.1%) fall into this category.
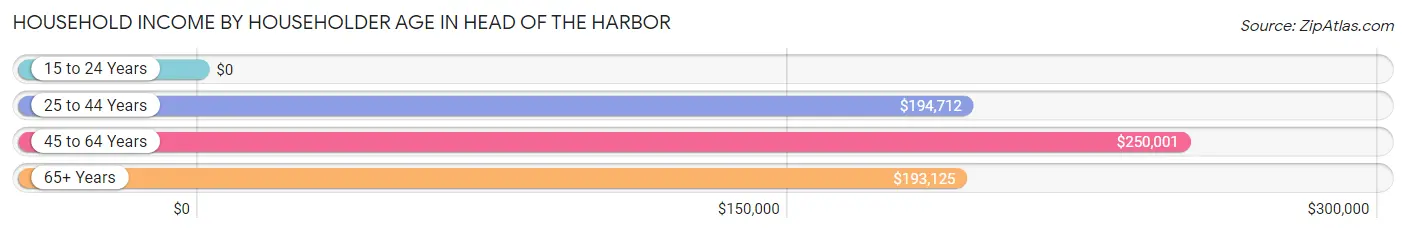
| Income Bracket | # Households | Median Income |
| 15 to 24 Years | 0 (0.0%) | $0 |
| 25 to 44 Years | 83 (16.9%) | $194,712 |
| 45 to 64 Years | 260 (53.1%) | $250,001 |
| 65+ Years | 147 (30.0%) | $193,125 |
| Total | 490 (100.0%) | $250,001 |
Poverty in Head of the Harbor
Income Below Poverty by Sex and Age in Head of the Harbor
With 1.5% poverty level for males and 2.2% for females among the residents of Head of the Harbor, under 5 year old males and 25 to 34 year old females are the most vulnerable to poverty, with 4 males (28.6%) and 13 females (17.1%) in their respective age groups living below the poverty level.
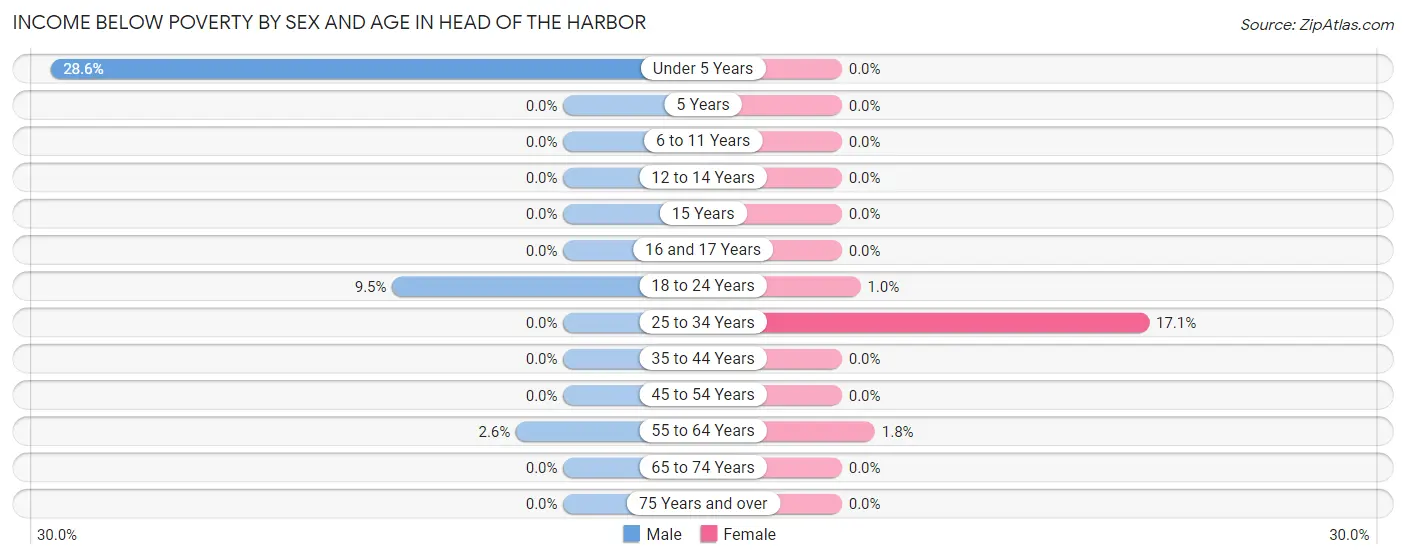
| Age Bracket | Male | Female |
| Under 5 Years | 4 (28.6%) | 0 (0.0%) |
| 5 Years | 0 (0.0%) | 0 (0.0%) |
| 6 to 11 Years | 0 (0.0%) | 0 (0.0%) |
| 12 to 14 Years | 0 (0.0%) | 0 (0.0%) |
| 15 Years | 0 (0.0%) | 0 (0.0%) |
| 16 and 17 Years | 0 (0.0%) | 0 (0.0%) |
| 18 to 24 Years | 4 (9.5%) | 1 (1.0%) |
| 25 to 34 Years | 0 (0.0%) | 13 (17.1%) |
| 35 to 44 Years | 0 (0.0%) | 0 (0.0%) |
| 45 to 54 Years | 0 (0.0%) | 0 (0.0%) |
| 55 to 64 Years | 3 (2.6%) | 3 (1.8%) |
| 65 to 74 Years | 0 (0.0%) | 0 (0.0%) |
| 75 Years and over | 0 (0.0%) | 0 (0.0%) |
| Total | 11 (1.5%) | 17 (2.2%) |
Income Above Poverty by Sex and Age in Head of the Harbor
According to the poverty statistics in Head of the Harbor, males aged 6 to 11 years and females aged under 5 years are the age groups that are most secure financially, with 100.0% of males and 100.0% of females in these age groups living above the poverty line.
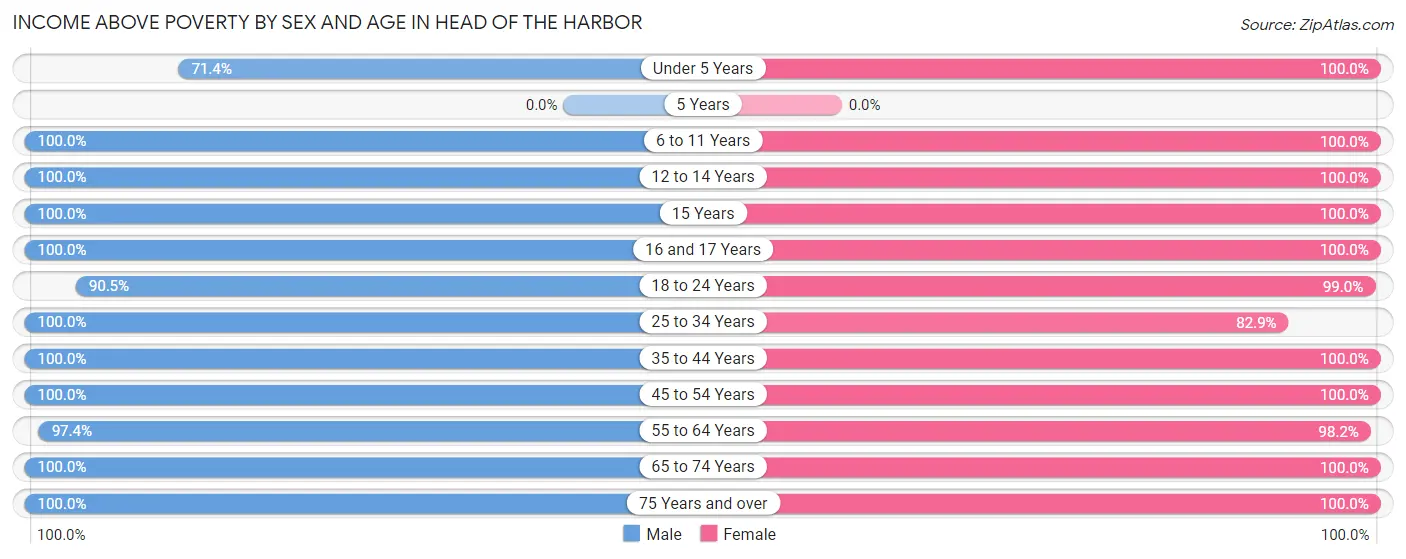
| Age Bracket | Male | Female |
| Under 5 Years | 10 (71.4%) | 18 (100.0%) |
| 5 Years | 0 (0.0%) | 0 (0.0%) |
| 6 to 11 Years | 123 (100.0%) | 55 (100.0%) |
| 12 to 14 Years | 32 (100.0%) | 10 (100.0%) |
| 15 Years | 5 (100.0%) | 11 (100.0%) |
| 16 and 17 Years | 38 (100.0%) | 31 (100.0%) |
| 18 to 24 Years | 38 (90.5%) | 95 (99.0%) |
| 25 to 34 Years | 41 (100.0%) | 63 (82.9%) |
| 35 to 44 Years | 44 (100.0%) | 75 (100.0%) |
| 45 to 54 Years | 161 (100.0%) | 97 (100.0%) |
| 55 to 64 Years | 111 (97.4%) | 160 (98.2%) |
| 65 to 74 Years | 72 (100.0%) | 51 (100.0%) |
| 75 Years and over | 57 (100.0%) | 73 (100.0%) |
| Total | 732 (98.5%) | 739 (97.8%) |
Income Below Poverty Among Married-Couple Families in Head of the Harbor
The poverty statistics for married-couple families in Head of the Harbor show that 1.2% or 4 of the total 340 families live below the poverty line. Families with 1 or 2 children have the highest poverty rate of 2.5%, comprising of 4 families. On the other hand, families with no children have the lowest poverty rate of 0.0%, which includes 0 families.
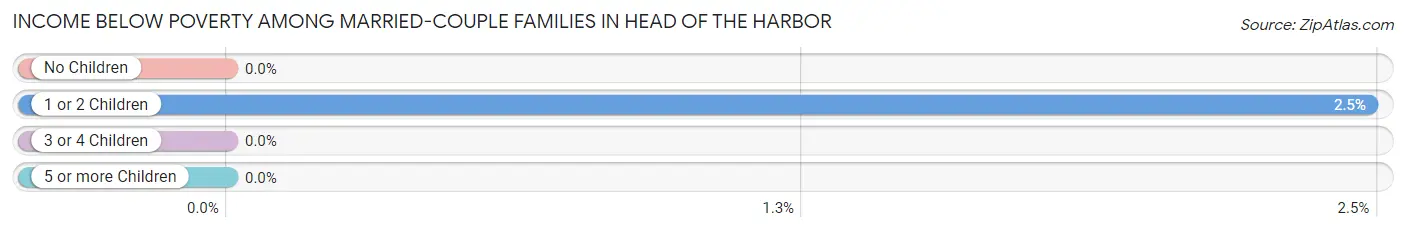
| Children | Above Poverty | Below Poverty |
| No Children | 164 (100.0%) | 0 (0.0%) |
| 1 or 2 Children | 157 (97.5%) | 4 (2.5%) |
| 3 or 4 Children | 11 (100.0%) | 0 (0.0%) |
| 5 or more Children | 4 (100.0%) | 0 (0.0%) |
| Total | 336 (98.8%) | 4 (1.2%) |
Income Below Poverty Among Single-Parent Households in Head of the Harbor
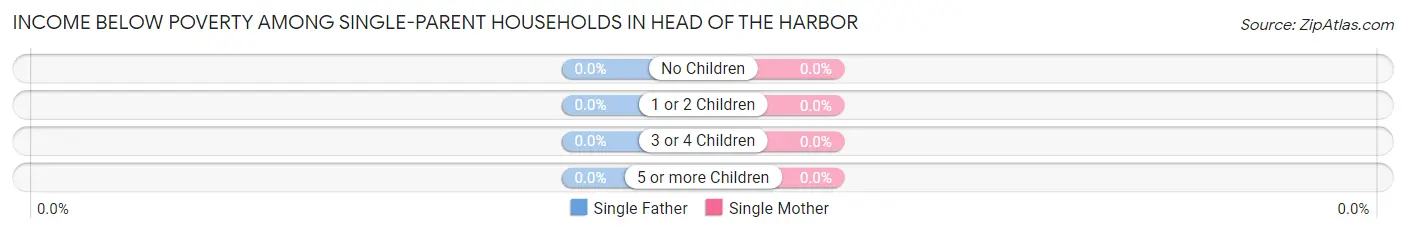
| Children | Single Father | Single Mother |
| No Children | 0 (0.0%) | 0 (0.0%) |
| 1 or 2 Children | 0 (0.0%) | 0 (0.0%) |
| 3 or 4 Children | 0 (0.0%) | 0 (0.0%) |
| 5 or more Children | 0 (0.0%) | 0 (0.0%) |
| Total | 0 (0.0%) | 0 (0.0%) |
Income Below Poverty Among Married-Couple vs Single-Parent Households in Head of the Harbor
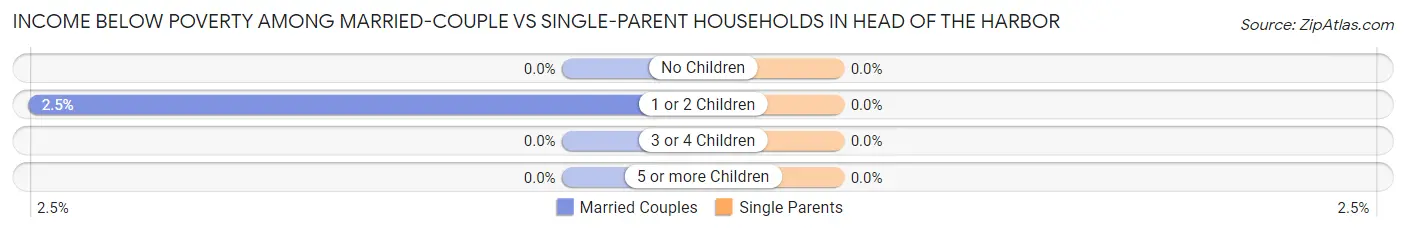
| Children | Married-Couple Families | Single-Parent Households |
| No Children | 0 (0.0%) | 0 (0.0%) |
| 1 or 2 Children | 4 (2.5%) | 0 (0.0%) |
| 3 or 4 Children | 0 (0.0%) | 0 (0.0%) |
| 5 or more Children | 0 (0.0%) | 0 (0.0%) |
| Total | 4 (1.2%) | 0 (0.0%) |
Race in Head of the Harbor
The most populous races in Head of the Harbor are White / Caucasian (1,206 | 80.3%), Hispanic or Latino (182 | 12.1%), and Two or more Races (160 | 10.7%).
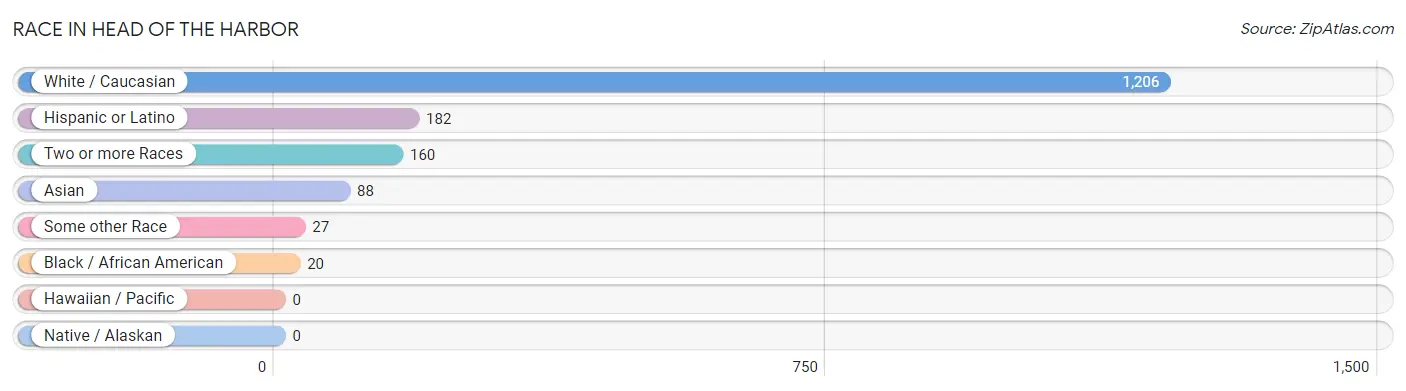
| Race | # Population | % Population |
| Asian | 88 | 5.9% |
| Black / African American | 20 | 1.3% |
| Hawaiian / Pacific | 0 | 0.0% |
| Hispanic or Latino | 182 | 12.1% |
| Native / Alaskan | 0 | 0.0% |
| White / Caucasian | 1,206 | 80.3% |
| Two or more Races | 160 | 10.7% |
| Some other Race | 27 | 1.8% |
| Total | 1,501 | 100.0% |
Ancestry in Head of the Harbor
The most populous ancestries reported in Head of the Harbor are Italian (261 | 17.4%), Irish (211 | 14.1%), German (203 | 13.5%), American (138 | 9.2%), and Spanish (84 | 5.6%), together accounting for 59.8% of all Head of the Harbor residents.
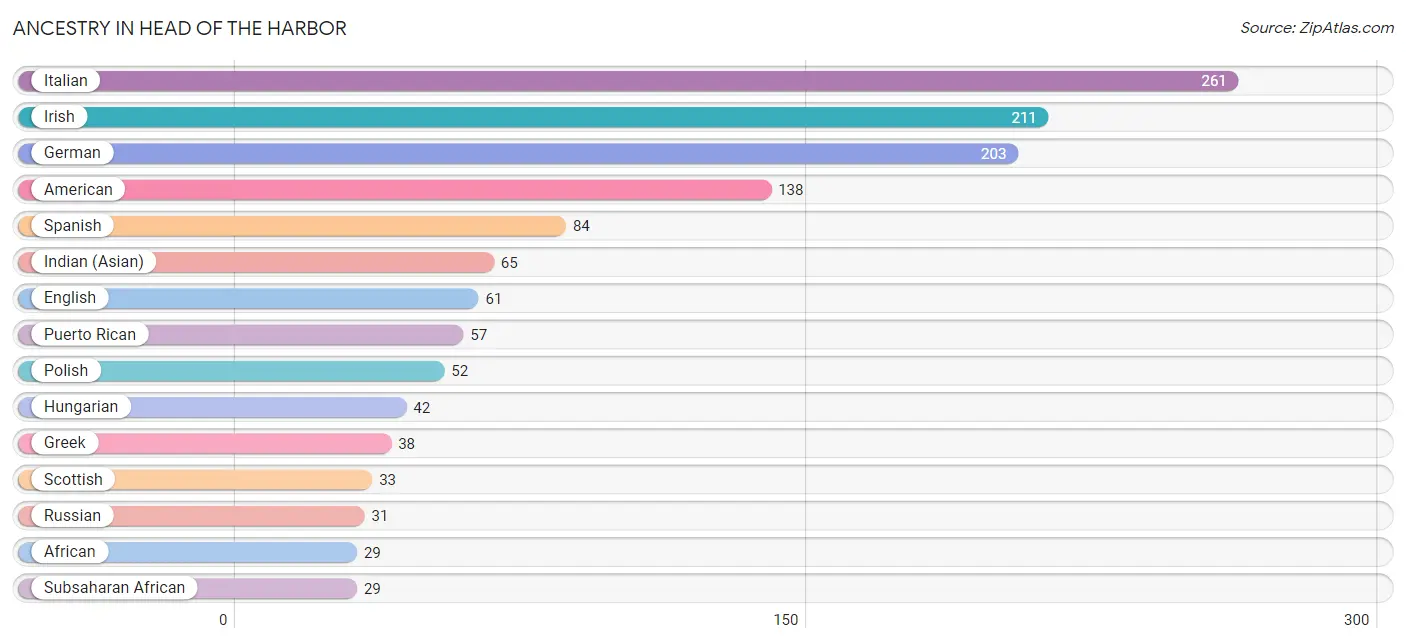
| Ancestry | # Population | % Population |
| African | 29 | 1.9% |
| American | 138 | 9.2% |
| Arab | 13 | 0.9% |
| Austrian | 3 | 0.2% |
| Bhutanese | 2 | 0.1% |
| British | 4 | 0.3% |
| Burmese | 21 | 1.4% |
| Central American | 2 | 0.1% |
| Colombian | 1 | 0.1% |
| Cuban | 7 | 0.5% |
| Czech | 3 | 0.2% |
| Danish | 3 | 0.2% |
| Dominican | 27 | 1.8% |
| Dutch | 3 | 0.2% |
| English | 61 | 4.1% |
| European | 19 | 1.3% |
| Filipino | 11 | 0.7% |
| French | 4 | 0.3% |
| French Canadian | 19 | 1.3% |
| German | 203 | 13.5% |
| Greek | 38 | 2.5% |
| Hungarian | 42 | 2.8% |
| Indian (Asian) | 65 | 4.3% |
| Iraqi | 11 | 0.7% |
| Irish | 211 | 14.1% |
| Italian | 261 | 17.4% |
| Korean | 17 | 1.1% |
| Mexican | 4 | 0.3% |
| Moroccan | 2 | 0.1% |
| Norwegian | 21 | 1.4% |
| Panamanian | 2 | 0.1% |
| Polish | 52 | 3.5% |
| Portuguese | 10 | 0.7% |
| Puerto Rican | 57 | 3.8% |
| Romanian | 5 | 0.3% |
| Russian | 31 | 2.1% |
| Scotch-Irish | 4 | 0.3% |
| Scottish | 33 | 2.2% |
| Slovak | 3 | 0.2% |
| South American | 1 | 0.1% |
| Spanish | 84 | 5.6% |
| Subsaharan African | 29 | 1.9% |
| Swedish | 15 | 1.0% |
| Swiss | 3 | 0.2% |
| Thai | 3 | 0.2% |
| Ukrainian | 1 | 0.1% |
| Yugoslavian | 3 | 0.2% | View All 47 Rows |
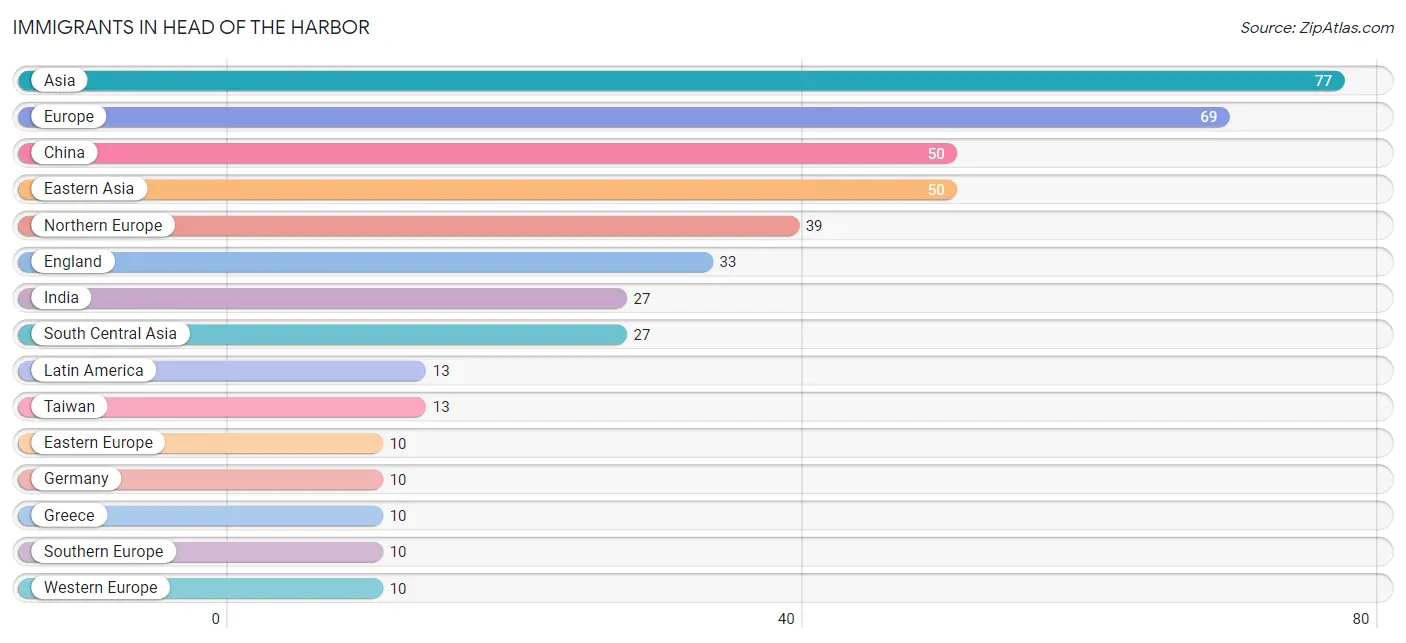
Immigrants in Head of the Harbor
The most numerous immigrant groups reported in Head of the Harbor came from Asia (77 | 5.1%), Europe (69 | 4.6%), China (50 | 3.3%), Eastern Asia (50 | 3.3%), and Northern Europe (39 | 2.6%), together accounting for 19.0% of all Head of the Harbor residents.
| Immigration Origin | # Population | % Population |
| Africa | 6 | 0.4% |
| Asia | 77 | 5.1% |
| Belarus | 1 | 0.1% |
| Bosnia and Herzegovina | 3 | 0.2% |
| Caribbean | 7 | 0.5% |
| China | 50 | 3.3% |
| Dominican Republic | 7 | 0.5% |
| Eastern Asia | 50 | 3.3% |
| Eastern Europe | 10 | 0.7% |
| England | 33 | 2.2% |
| Europe | 69 | 4.6% |
| Germany | 10 | 0.7% |
| Greece | 10 | 0.7% |
| Hungary | 3 | 0.2% |
| India | 27 | 1.8% |
| Latin America | 13 | 0.9% |
| Morocco | 6 | 0.4% |
| Northern Africa | 6 | 0.4% |
| Northern Europe | 39 | 2.6% |
| Romania | 2 | 0.1% |
| South America | 6 | 0.4% |
| South Central Asia | 27 | 1.8% |
| Southern Europe | 10 | 0.7% |
| Taiwan | 13 | 0.9% |
| Ukraine | 1 | 0.1% |
| Western Europe | 10 | 0.7% | View All 26 Rows |
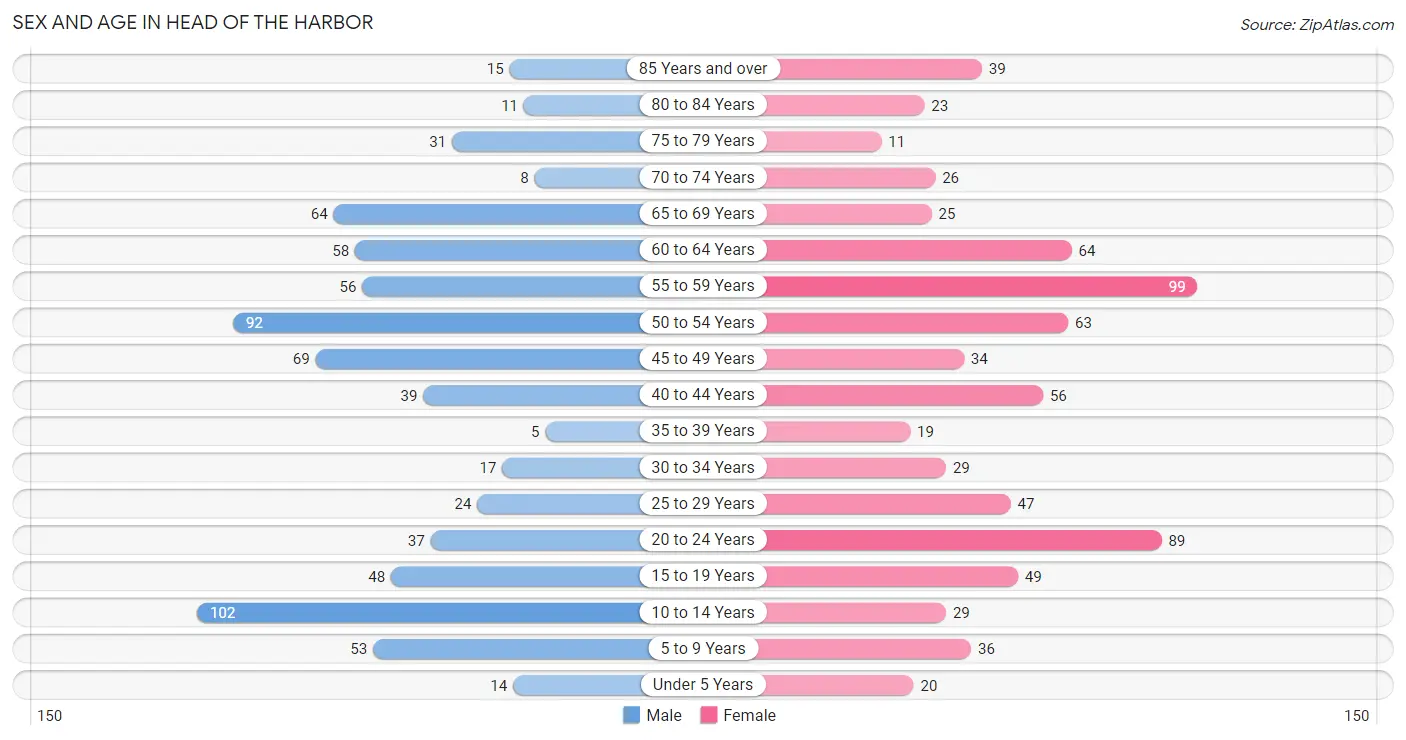
Sex and Age in Head of the Harbor
Sex and Age in Head of the Harbor
The most populous age groups in Head of the Harbor are 10 to 14 Years (102 | 13.7%) for men and 55 to 59 Years (99 | 13.1%) for women.
| Age Bracket | Male | Female |
| Under 5 Years | 14 (1.9%) | 20 (2.6%) |
| 5 to 9 Years | 53 (7.1%) | 36 (4.8%) |
| 10 to 14 Years | 102 (13.7%) | 29 (3.8%) |
| 15 to 19 Years | 48 (6.5%) | 49 (6.5%) |
| 20 to 24 Years | 37 (5.0%) | 89 (11.7%) |
| 25 to 29 Years | 24 (3.2%) | 47 (6.2%) |
| 30 to 34 Years | 17 (2.3%) | 29 (3.8%) |
| 35 to 39 Years | 5 (0.7%) | 19 (2.5%) |
| 40 to 44 Years | 39 (5.2%) | 56 (7.4%) |
| 45 to 49 Years | 69 (9.3%) | 34 (4.5%) |
| 50 to 54 Years | 92 (12.4%) | 63 (8.3%) |
| 55 to 59 Years | 56 (7.5%) | 99 (13.1%) |
| 60 to 64 Years | 58 (7.8%) | 64 (8.4%) |
| 65 to 69 Years | 64 (8.6%) | 25 (3.3%) |
| 70 to 74 Years | 8 (1.1%) | 26 (3.4%) |
| 75 to 79 Years | 31 (4.2%) | 11 (1.5%) |
| 80 to 84 Years | 11 (1.5%) | 23 (3.0%) |
| 85 Years and over | 15 (2.0%) | 39 (5.1%) |
| Total | 743 (100.0%) | 758 (100.0%) |
Families and Households in Head of the Harbor
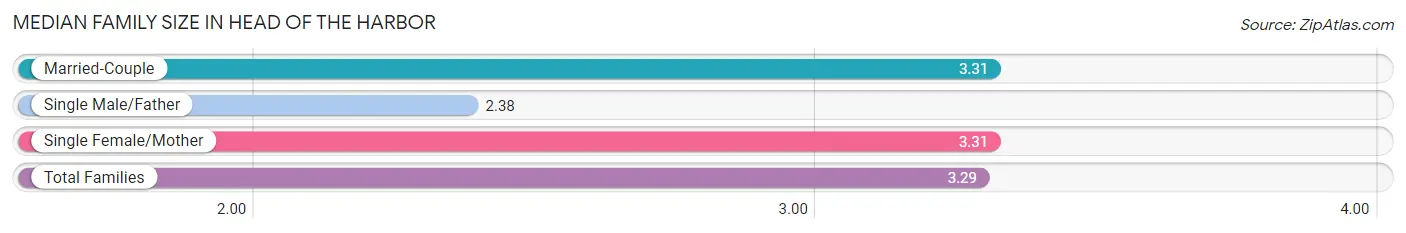
Median Family Size in Head of the Harbor
The median family size in Head of the Harbor is 3.29 persons per family, with married-couple families (340 | 82.9%) accounting for the largest median family size of 3.31 persons per family. On the other hand, single male/father families (8 | 1.9%) represent the smallest median family size with 2.38 persons per family.
| Family Type | # Families | Family Size |
| Married-Couple | 340 (82.9%) | 3.31 |
| Single Male/Father | 8 (1.9%) | 2.38 |
| Single Female/Mother | 62 (15.1%) | 3.31 |
| Total Families | 410 (100.0%) | 3.29 |
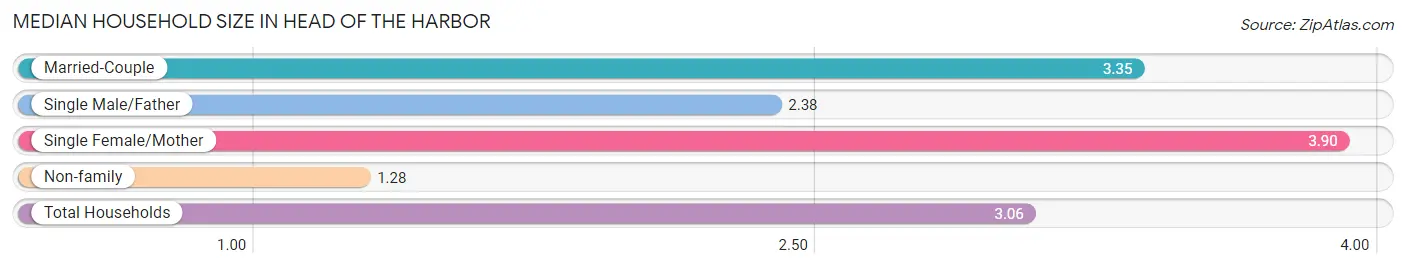
Median Household Size in Head of the Harbor
The median household size in Head of the Harbor is 3.06 persons per household, with single female/mother households (62 | 12.7%) accounting for the largest median household size of 3.9 persons per household. non-family households (80 | 16.3%) represent the smallest median household size with 1.28 persons per household.
| Household Type | # Households | Household Size |
| Married-Couple | 340 (69.4%) | 3.35 |
| Single Male/Father | 8 (1.6%) | 2.38 |
| Single Female/Mother | 62 (12.7%) | 3.90 |
| Non-family | 80 (16.3%) | 1.28 |
| Total Households | 490 (100.0%) | 3.06 |
Household Size by Marriage Status in Head of the Harbor
Out of a total of 490 households in Head of the Harbor, 410 (83.7%) are family households, while 80 (16.3%) are nonfamily households. The most numerous type of family households are 2-person households, comprising 138, and the most common type of nonfamily households are 1-person households, comprising 62.
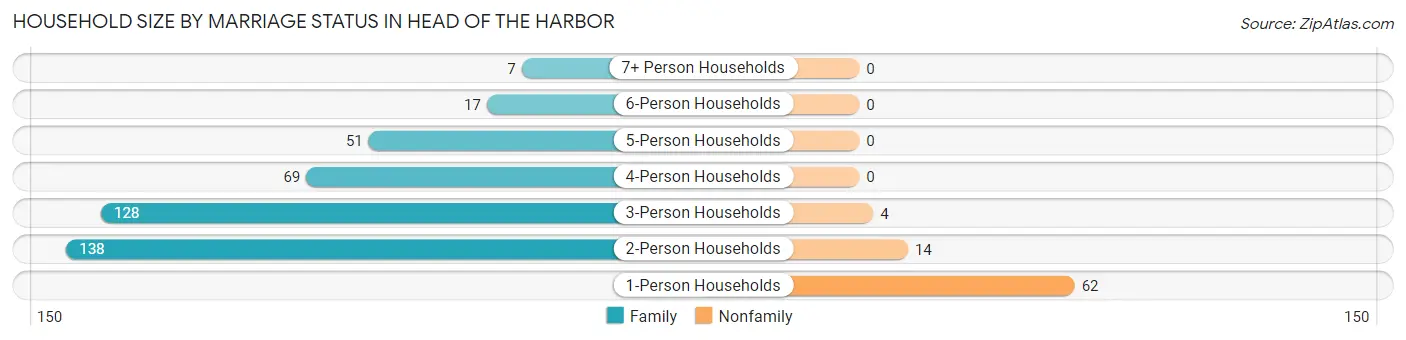
| Household Size | Family Households | Nonfamily Households |
| 1-Person Households | - | 62 (12.7%) |
| 2-Person Households | 138 (28.2%) | 14 (2.9%) |
| 3-Person Households | 128 (26.1%) | 4 (0.8%) |
| 4-Person Households | 69 (14.1%) | 0 (0.0%) |
| 5-Person Households | 51 (10.4%) | 0 (0.0%) |
| 6-Person Households | 17 (3.5%) | 0 (0.0%) |
| 7+ Person Households | 7 (1.4%) | 0 (0.0%) |
| Total | 410 (83.7%) | 80 (16.3%) |
Female Fertility in Head of the Harbor
Fertility by Age in Head of the Harbor
Average fertility rate in Head of the Harbor is 21.0 births per 1,000 women. Women in the age bracket of 20 to 34 years have the highest fertility rate with 42.0 births per 1,000 women. Women in the age bracket of 20 to 34 years acount for 100.0% of all women with births.
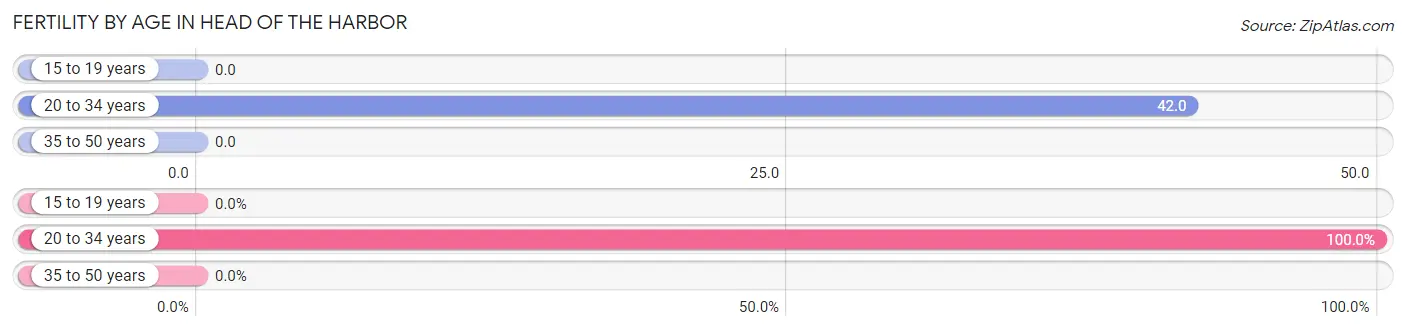
| Age Bracket | Women with Births | Births / 1,000 Women |
| 15 to 19 years | 0 (0.0%) | 0.0 |
| 20 to 34 years | 7 (100.0%) | 42.0 |
| 35 to 50 years | 0 (0.0%) | 0.0 |
| Total | 7 (100.0%) | 21.0 |
Fertility by Age by Marriage Status in Head of the Harbor
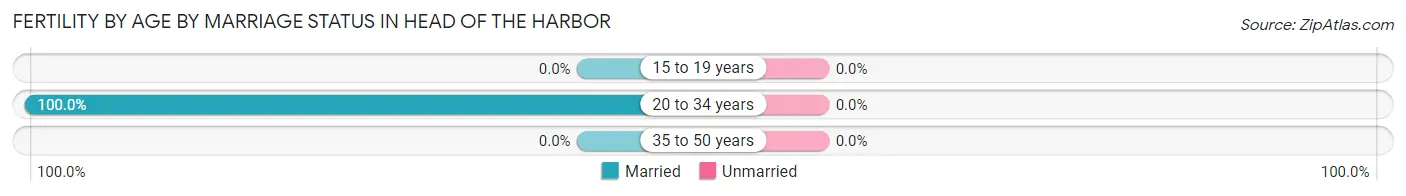
| Age Bracket | Married | Unmarried |
| 15 to 19 years | 0 (0.0%) | 0 (0.0%) |
| 20 to 34 years | 7 (100.0%) | 0 (0.0%) |
| 35 to 50 years | 0 (0.0%) | 0 (0.0%) |
| Total | 7 (100.0%) | 0 (0.0%) |
Fertility by Education in Head of the Harbor
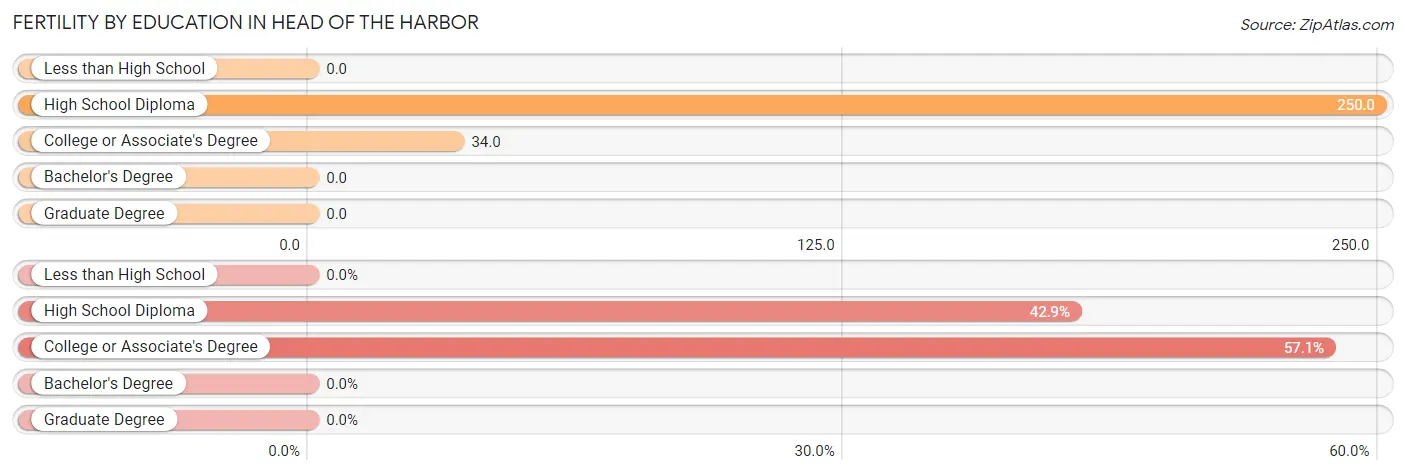
| Educational Attainment | Women with Births | Births / 1,000 Women |
| Less than High School | 0 (0.0%) | 0.0 |
| High School Diploma | 3 (42.9%) | 250.0 |
| College or Associate's Degree | 4 (57.1%) | 34.0 |
| Bachelor's Degree | 0 (0.0%) | 0.0 |
| Graduate Degree | 0 (0.0%) | 0.0 |
| Total | 7 (100.0%) | 21.0 |
Fertility by Education by Marriage Status in Head of the Harbor
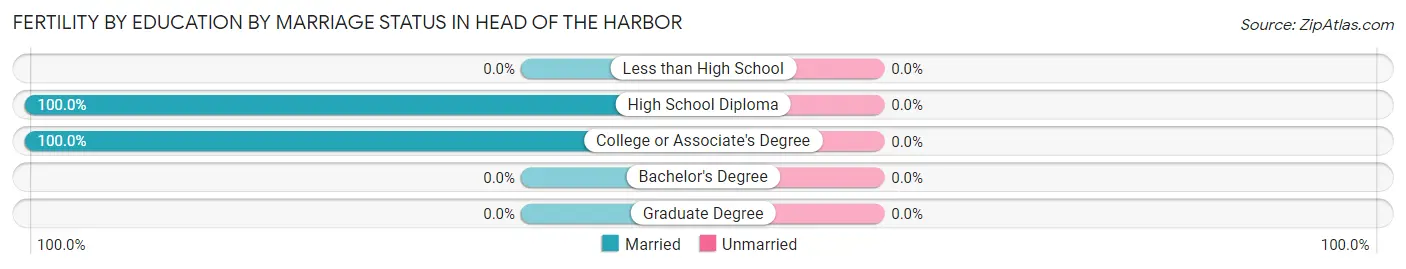
| Educational Attainment | Married | Unmarried |
| Less than High School | 0 (0.0%) | 0 (0.0%) |
| High School Diploma | 3 (100.0%) | 0 (0.0%) |
| College or Associate's Degree | 4 (100.0%) | 0 (0.0%) |
| Bachelor's Degree | 0 (0.0%) | 0 (0.0%) |
| Graduate Degree | 0 (0.0%) | 0 (0.0%) |
| Total | 7 (100.0%) | 0 (0.0%) |
Employment Characteristics in Head of the Harbor
Employment by Class of Employer in Head of the Harbor
Among the 834 employed individuals in Head of the Harbor, private company employees (456 | 54.7%), self-employed (not incorporated) (111 | 13.3%), and self-employed (incorporated) (93 | 11.2%) make up the most common classes of employment.
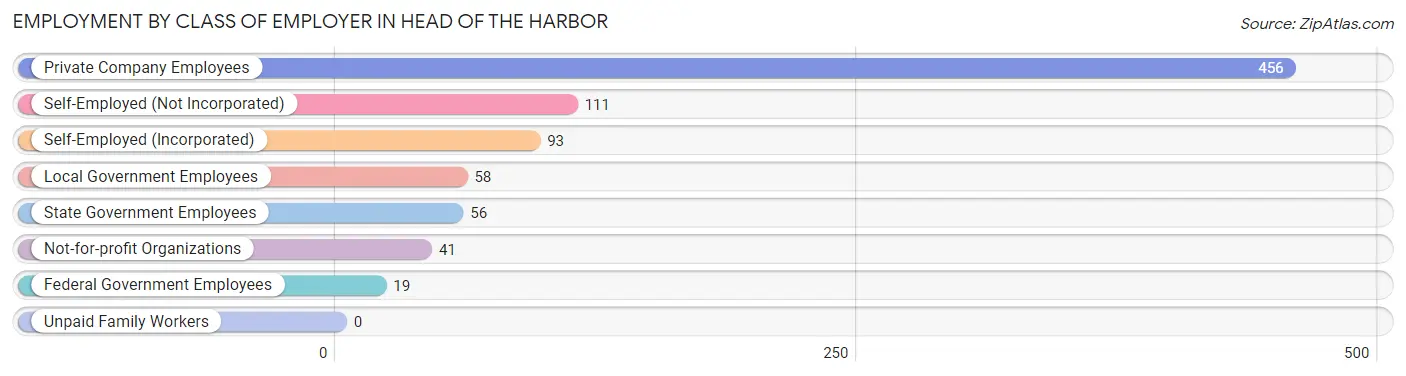
| Employer Class | # Employees | % Employees |
| Private Company Employees | 456 | 54.7% |
| Self-Employed (Incorporated) | 93 | 11.2% |
| Self-Employed (Not Incorporated) | 111 | 13.3% |
| Not-for-profit Organizations | 41 | 4.9% |
| Local Government Employees | 58 | 7.0% |
| State Government Employees | 56 | 6.7% |
| Federal Government Employees | 19 | 2.3% |
| Unpaid Family Workers | 0 | 0.0% |
| Total | 834 | 100.0% |
Employment Status by Age in Head of the Harbor
According to the labor force statistics for Head of the Harbor, out of the total population over 16 years of age (1,231), 69.8% or 859 individuals are in the labor force, with 2.9% or 25 of them unemployed. The age group with the highest labor force participation rate is 25 to 29 years, with 95.8% or 68 individuals in the labor force. Within the labor force, the 75 years and over age range has the highest percentage of unemployed individuals, with 12.0% or 3 of them being unemployed.
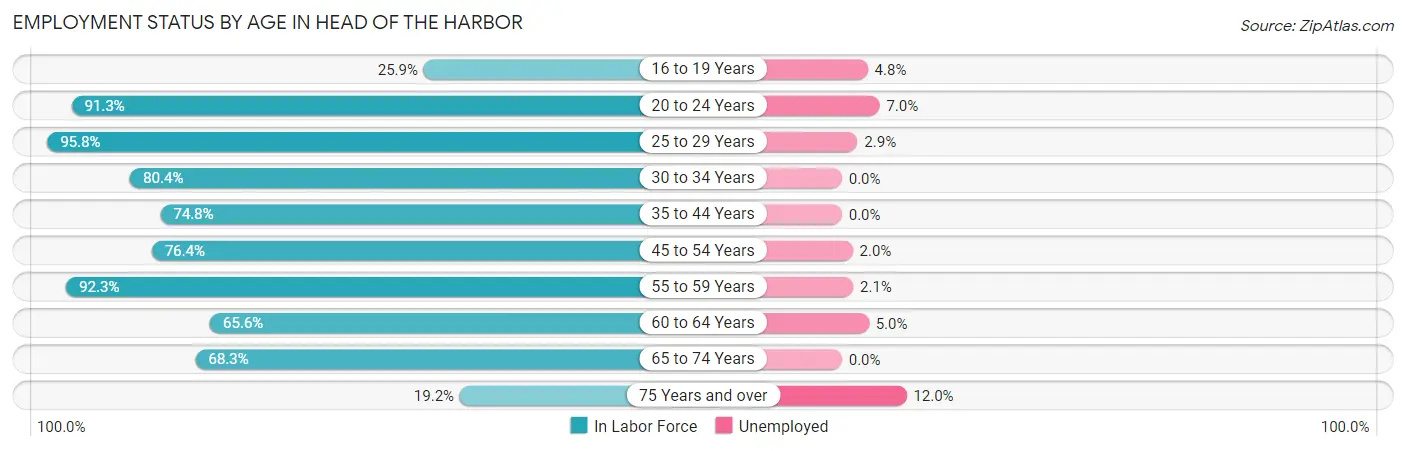
| Age Bracket | In Labor Force | Unemployed |
| 16 to 19 Years | 21 (25.9%) | 1 (4.8%) |
| 20 to 24 Years | 115 (91.3%) | 8 (7.0%) |
| 25 to 29 Years | 68 (95.8%) | 2 (2.9%) |
| 30 to 34 Years | 37 (80.4%) | 0 (0.0%) |
| 35 to 44 Years | 89 (74.8%) | 0 (0.0%) |
| 45 to 54 Years | 197 (76.4%) | 4 (2.0%) |
| 55 to 59 Years | 143 (92.3%) | 3 (2.1%) |
| 60 to 64 Years | 80 (65.6%) | 4 (5.0%) |
| 65 to 74 Years | 84 (68.3%) | 0 (0.0%) |
| 75 Years and over | 25 (19.2%) | 3 (12.0%) |
| Total | 859 (69.8%) | 25 (2.9%) |
Employment Status by Educational Attainment in Head of the Harbor
According to labor force statistics for Head of the Harbor, 79.6% of individuals (614) out of the total population between 25 and 64 years of age (771) are in the labor force, with 2.1% or 13 of them being unemployed. The group with the highest labor force participation rate are those with the educational attainment of less than high school, with 100.0% or 48 individuals in the labor force. Within the labor force, individuals with college / associate degree education have the highest percentage of unemployment, with 6.8% or 7 of them being unemployed.
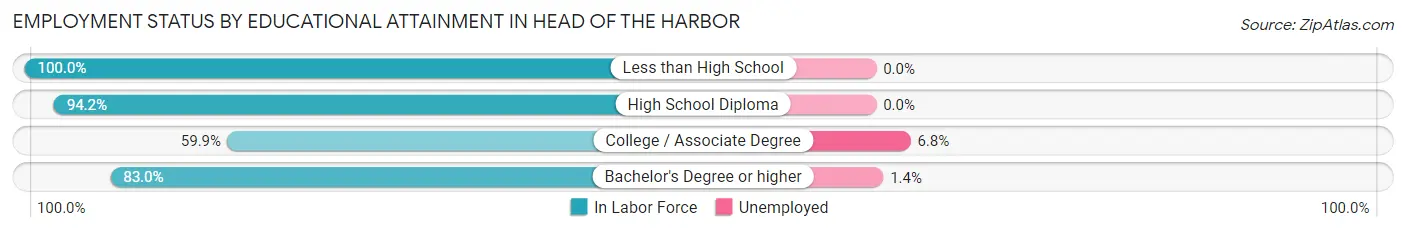
| Educational Attainment | In Labor Force | Unemployed |
| Less than High School | 48 (100.0%) | 0 (0.0%) |
| High School Diploma | 49 (94.2%) | 0 (0.0%) |
| College / Associate Degree | 103 (59.9%) | 12 (6.8%) |
| Bachelor's Degree or higher | 414 (83.0%) | 7 (1.4%) |
| Total | 614 (79.6%) | 16 (2.1%) |
Employment Occupations by Sex in Head of the Harbor
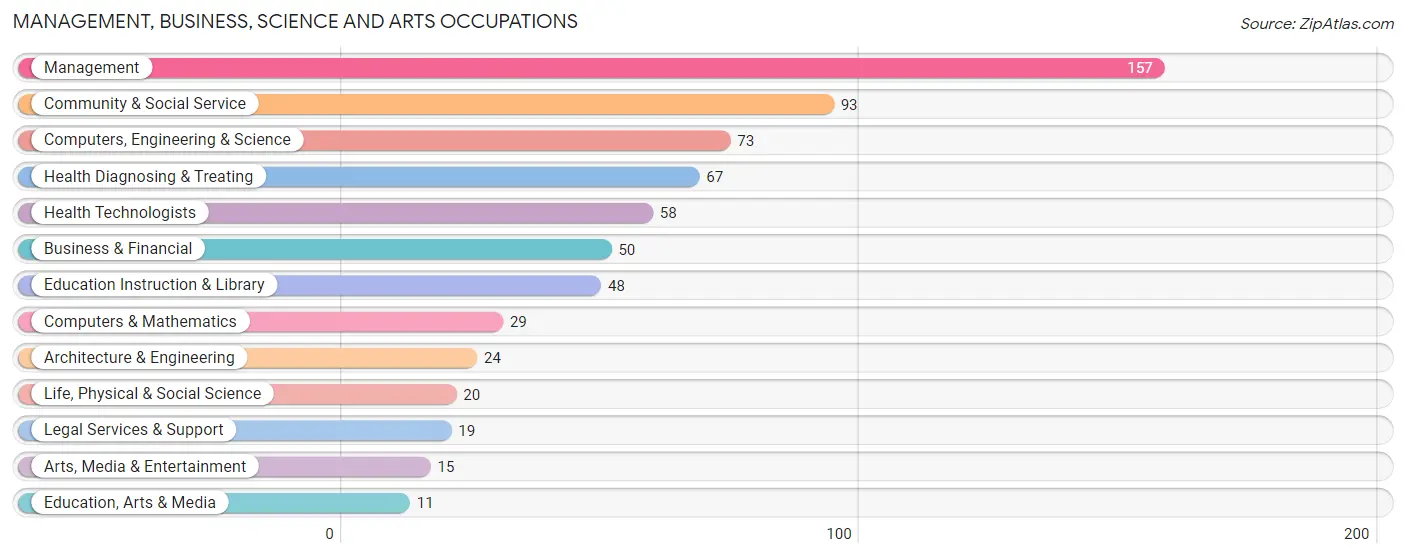
Management, Business, Science and Arts Occupations
The most common Management, Business, Science and Arts occupations in Head of the Harbor are Management (157 | 18.9%), Community & Social Service (93 | 11.2%), Computers, Engineering & Science (73 | 8.8%), Health Diagnosing & Treating (67 | 8.0%), and Health Technologists (58 | 7.0%).
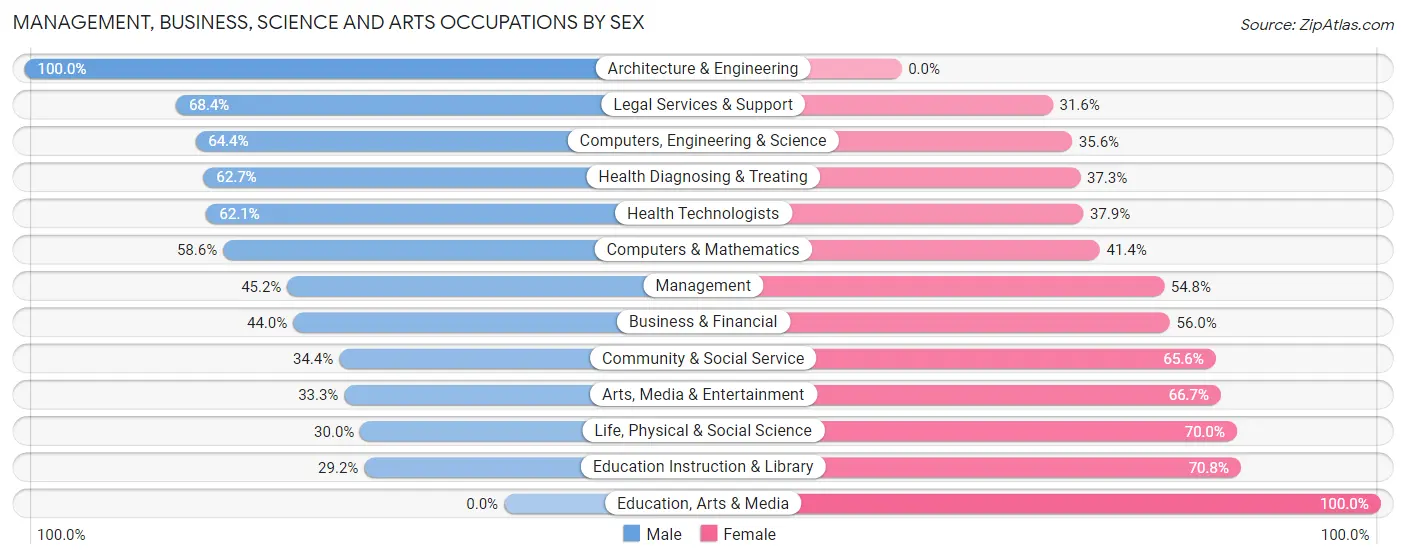
Management, Business, Science and Arts Occupations by Sex
Within the Management, Business, Science and Arts occupations in Head of the Harbor, the most male-oriented occupations are Architecture & Engineering (100.0%), Legal Services & Support (68.4%), and Computers, Engineering & Science (64.4%), while the most female-oriented occupations are Education, Arts & Media (100.0%), Education Instruction & Library (70.8%), and Life, Physical & Social Science (70.0%).
| Occupation | Male | Female |
| Management | 71 (45.2%) | 86 (54.8%) |
| Business & Financial | 22 (44.0%) | 28 (56.0%) |
| Computers, Engineering & Science | 47 (64.4%) | 26 (35.6%) |
| Computers & Mathematics | 17 (58.6%) | 12 (41.4%) |
| Architecture & Engineering | 24 (100.0%) | 0 (0.0%) |
| Life, Physical & Social Science | 6 (30.0%) | 14 (70.0%) |
| Community & Social Service | 32 (34.4%) | 61 (65.6%) |
| Education, Arts & Media | 0 (0.0%) | 11 (100.0%) |
| Legal Services & Support | 13 (68.4%) | 6 (31.6%) |
| Education Instruction & Library | 14 (29.2%) | 34 (70.8%) |
| Arts, Media & Entertainment | 5 (33.3%) | 10 (66.7%) |
| Health Diagnosing & Treating | 42 (62.7%) | 25 (37.3%) |
| Health Technologists | 36 (62.1%) | 22 (37.9%) |
| Total (Category) | 214 (48.6%) | 226 (51.4%) |
| Total (Overall) | 436 (52.3%) | 397 (47.7%) |
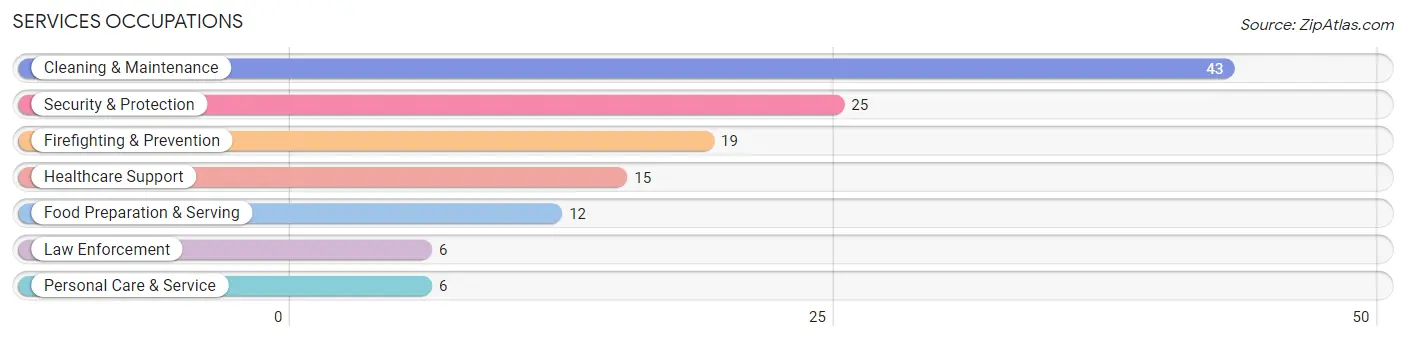
Services Occupations
The most common Services occupations in Head of the Harbor are Cleaning & Maintenance (43 | 5.2%), Security & Protection (25 | 3.0%), Firefighting & Prevention (19 | 2.3%), Healthcare Support (15 | 1.8%), and Food Preparation & Serving (12 | 1.4%).
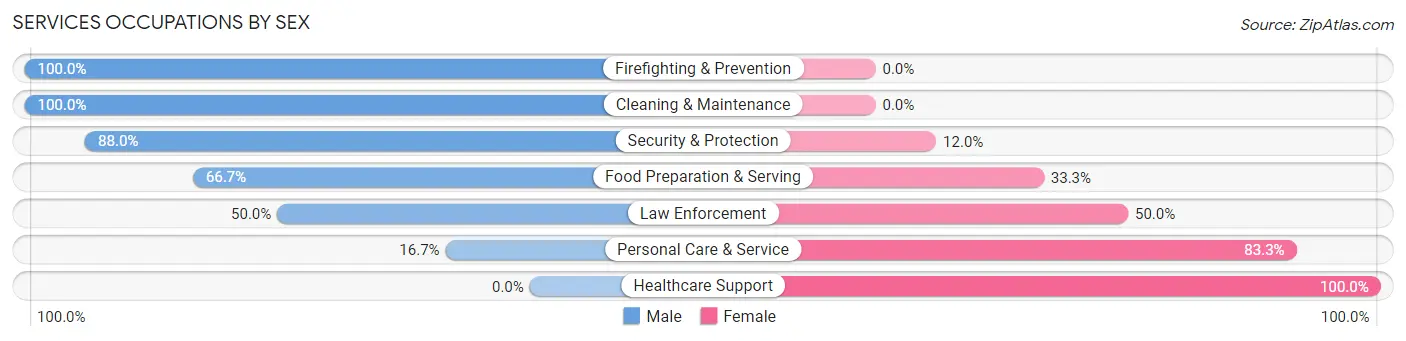
Services Occupations by Sex
Within the Services occupations in Head of the Harbor, the most male-oriented occupations are Firefighting & Prevention (100.0%), Cleaning & Maintenance (100.0%), and Security & Protection (88.0%), while the most female-oriented occupations are Healthcare Support (100.0%), Personal Care & Service (83.3%), and Law Enforcement (50.0%).
| Occupation | Male | Female |
| Healthcare Support | 0 (0.0%) | 15 (100.0%) |
| Security & Protection | 22 (88.0%) | 3 (12.0%) |
| Firefighting & Prevention | 19 (100.0%) | 0 (0.0%) |
| Law Enforcement | 3 (50.0%) | 3 (50.0%) |
| Food Preparation & Serving | 8 (66.7%) | 4 (33.3%) |
| Cleaning & Maintenance | 43 (100.0%) | 0 (0.0%) |
| Personal Care & Service | 1 (16.7%) | 5 (83.3%) |
| Total (Category) | 74 (73.3%) | 27 (26.7%) |
| Total (Overall) | 436 (52.3%) | 397 (47.7%) |
Sales and Office Occupations
The most common Sales and Office occupations in Head of the Harbor are Sales & Related (157 | 18.9%), and Office & Administration (51 | 6.1%).
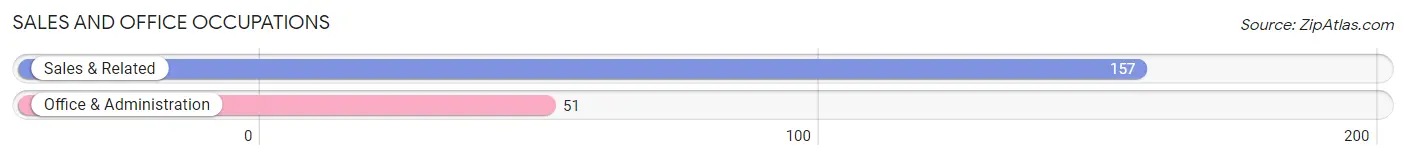
Sales and Office Occupations by Sex
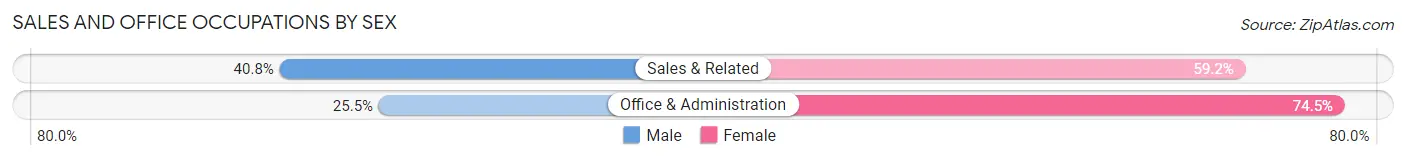
| Occupation | Male | Female |
| Sales & Related | 64 (40.8%) | 93 (59.2%) |
| Office & Administration | 13 (25.5%) | 38 (74.5%) |
| Total (Category) | 77 (37.0%) | 131 (63.0%) |
| Total (Overall) | 436 (52.3%) | 397 (47.7%) |
Natural Resources, Construction and Maintenance Occupations
The most common Natural Resources, Construction and Maintenance occupations in Head of the Harbor are Installation, Maintenance & Repair (37 | 4.4%), and Construction & Extraction (20 | 2.4%).
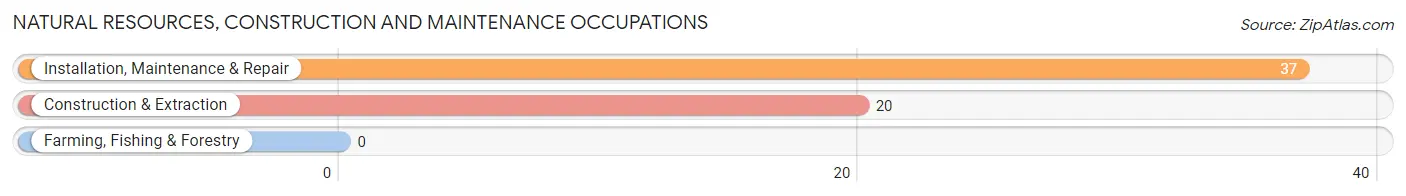
Natural Resources, Construction and Maintenance Occupations by Sex
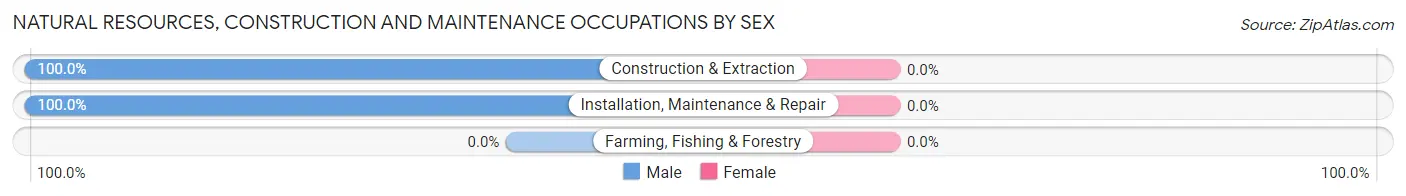
| Occupation | Male | Female |
| Farming, Fishing & Forestry | 0 (0.0%) | 0 (0.0%) |
| Construction & Extraction | 20 (100.0%) | 0 (0.0%) |
| Installation, Maintenance & Repair | 37 (100.0%) | 0 (0.0%) |
| Total (Category) | 57 (100.0%) | 0 (0.0%) |
| Total (Overall) | 436 (52.3%) | 397 (47.7%) |
Production, Transportation and Moving Occupations
The most common Production, Transportation and Moving occupations in Head of the Harbor are Transportation (13 | 1.6%), Material Moving (13 | 1.6%), and Production (1 | 0.1%).
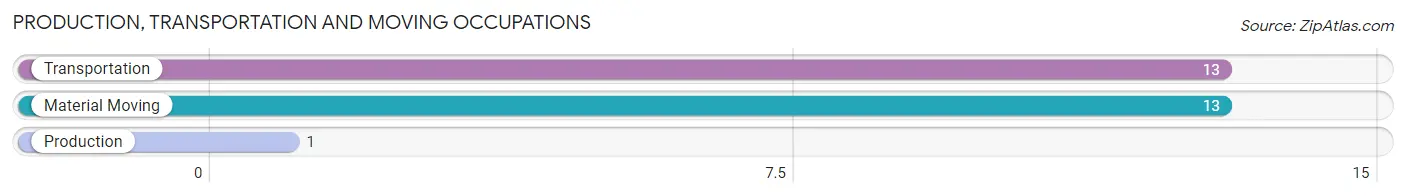
Production, Transportation and Moving Occupations by Sex
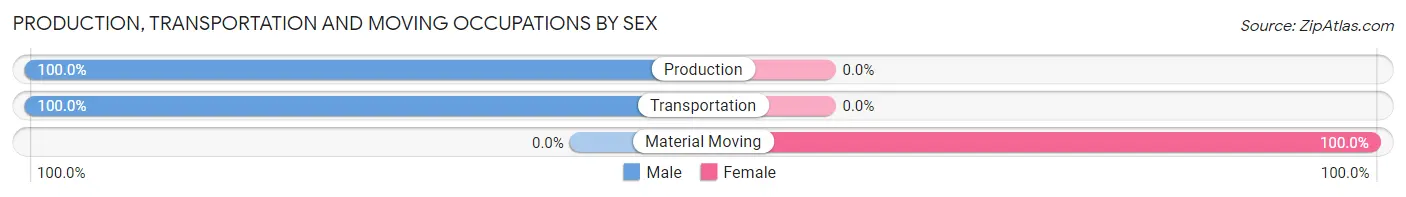
| Occupation | Male | Female |
| Production | 1 (100.0%) | 0 (0.0%) |
| Transportation | 13 (100.0%) | 0 (0.0%) |
| Material Moving | 0 (0.0%) | 13 (100.0%) |
| Total (Category) | 14 (51.8%) | 13 (48.1%) |
| Total (Overall) | 436 (52.3%) | 397 (47.7%) |
Employment Industries by Sex in Head of the Harbor
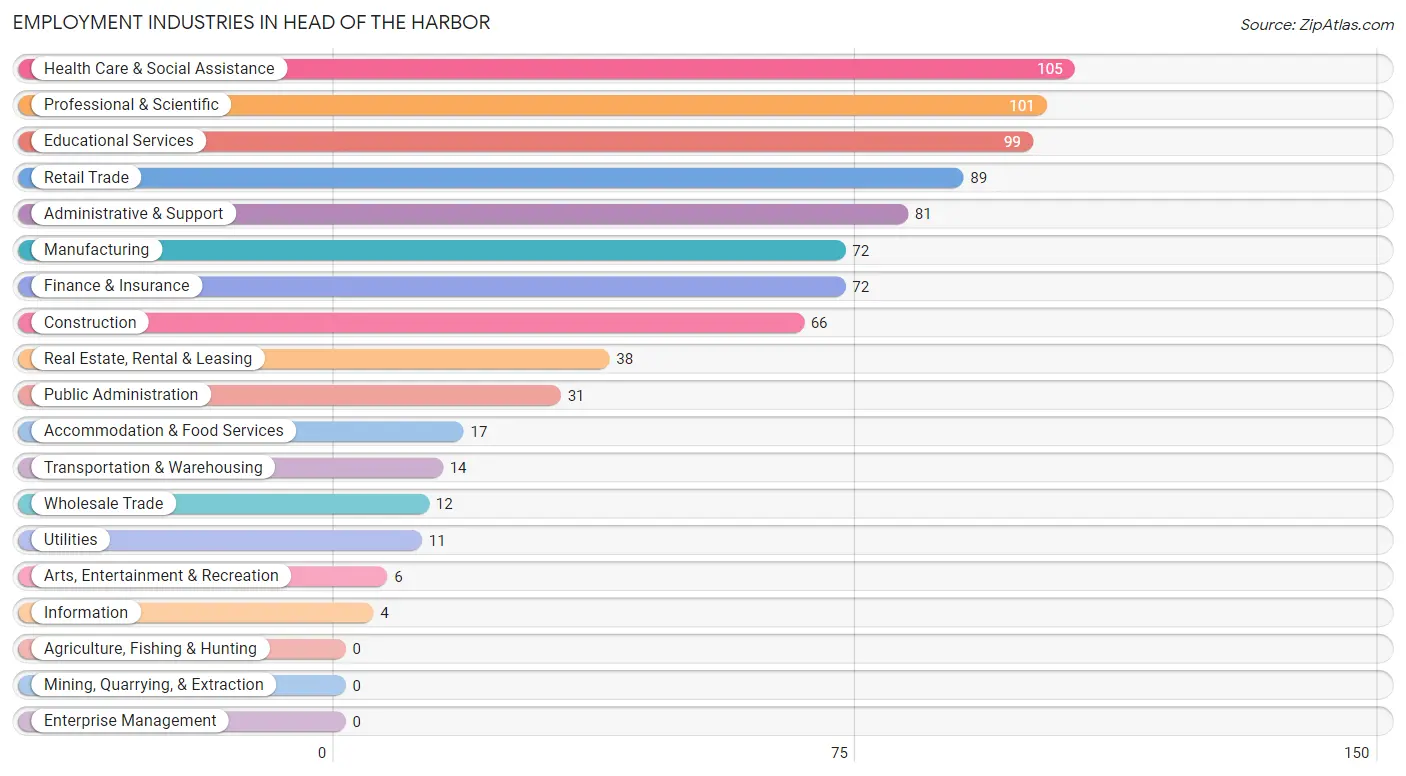
Employment Industries in Head of the Harbor
The major employment industries in Head of the Harbor include Health Care & Social Assistance (105 | 12.6%), Professional & Scientific (101 | 12.1%), Educational Services (99 | 11.9%), Retail Trade (89 | 10.7%), and Administrative & Support (81 | 9.7%).
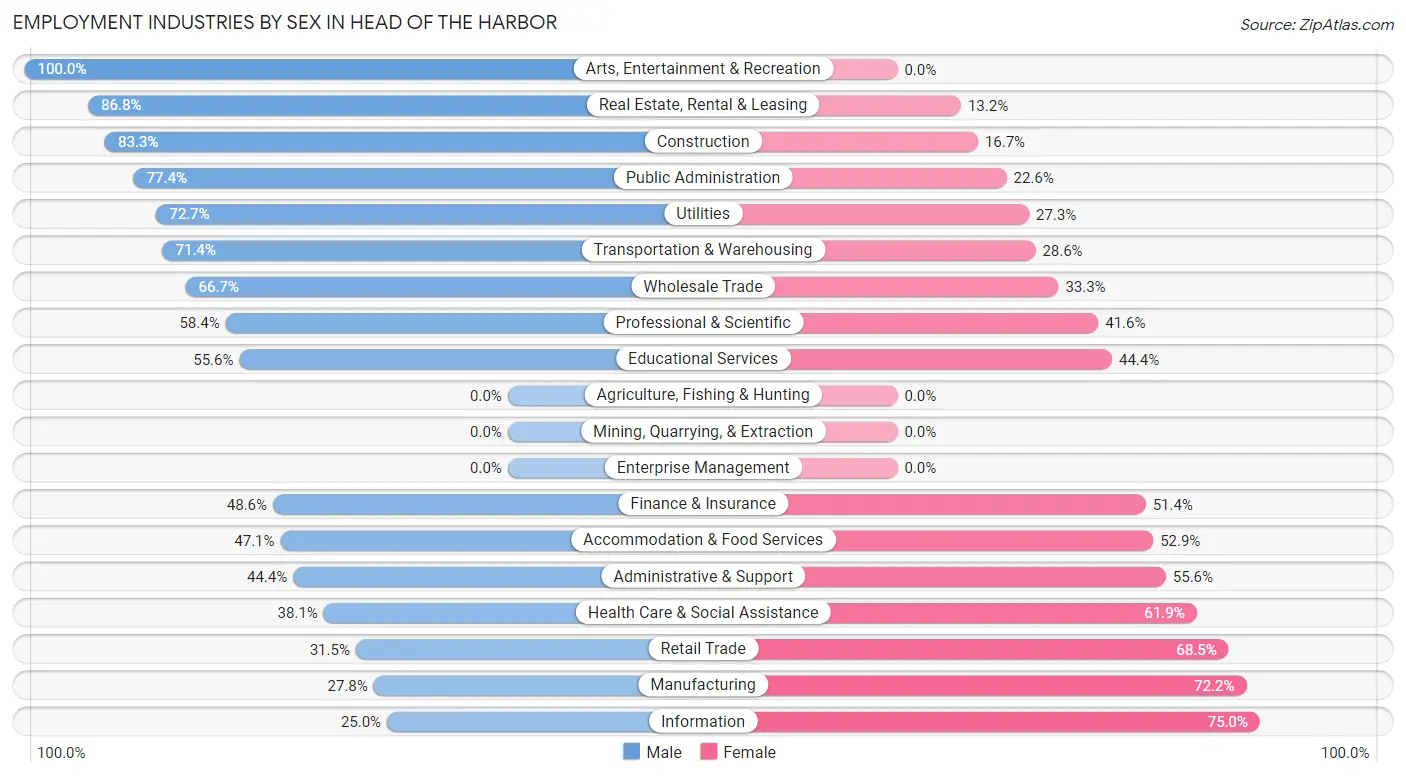
Employment Industries by Sex in Head of the Harbor
The Head of the Harbor industries that see more men than women are Arts, Entertainment & Recreation (100.0%), Real Estate, Rental & Leasing (86.8%), and Construction (83.3%), whereas the industries that tend to have a higher number of women are Information (75.0%), Manufacturing (72.2%), and Retail Trade (68.5%).
| Industry | Male | Female |
| Agriculture, Fishing & Hunting | 0 (0.0%) | 0 (0.0%) |
| Mining, Quarrying, & Extraction | 0 (0.0%) | 0 (0.0%) |
| Construction | 55 (83.3%) | 11 (16.7%) |
| Manufacturing | 20 (27.8%) | 52 (72.2%) |
| Wholesale Trade | 8 (66.7%) | 4 (33.3%) |
| Retail Trade | 28 (31.5%) | 61 (68.5%) |
| Transportation & Warehousing | 10 (71.4%) | 4 (28.6%) |
| Utilities | 8 (72.7%) | 3 (27.3%) |
| Information | 1 (25.0%) | 3 (75.0%) |
| Finance & Insurance | 35 (48.6%) | 37 (51.4%) |
| Real Estate, Rental & Leasing | 33 (86.8%) | 5 (13.2%) |
| Professional & Scientific | 59 (58.4%) | 42 (41.6%) |
| Enterprise Management | 0 (0.0%) | 0 (0.0%) |
| Administrative & Support | 36 (44.4%) | 45 (55.6%) |
| Educational Services | 55 (55.6%) | 44 (44.4%) |
| Health Care & Social Assistance | 40 (38.1%) | 65 (61.9%) |
| Arts, Entertainment & Recreation | 6 (100.0%) | 0 (0.0%) |
| Accommodation & Food Services | 8 (47.1%) | 9 (52.9%) |
| Public Administration | 24 (77.4%) | 7 (22.6%) |
| Total | 436 (52.3%) | 397 (47.7%) |
Education in Head of the Harbor
School Enrollment in Head of the Harbor
The most common levels of schooling among the 397 students in Head of the Harbor are elementary school (147 | 37.0%), high school (89 | 22.4%), and middle school (74 | 18.6%).
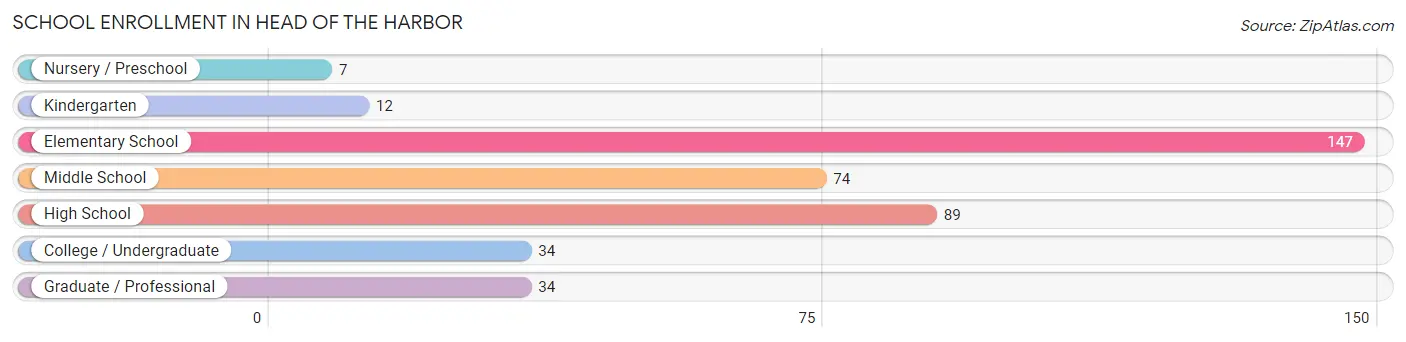
| School Level | # Students | % Students |
| Nursery / Preschool | 7 | 1.8% |
| Kindergarten | 12 | 3.0% |
| Elementary School | 147 | 37.0% |
| Middle School | 74 | 18.6% |
| High School | 89 | 22.4% |
| College / Undergraduate | 34 | 8.6% |
| Graduate / Professional | 34 | 8.6% |
| Total | 397 | 100.0% |
School Enrollment by Age by Funding Source in Head of the Harbor
Out of a total of 397 students who are enrolled in schools in Head of the Harbor, 42 (10.6%) attend a private institution, while the remaining 355 (89.4%) are enrolled in public schools. The age group of 25 to 34 year olds has the highest likelihood of being enrolled in private schools, with 8 (34.8% in the age bracket) enrolled. Conversely, the age group of 10 to 14 year olds has the lowest likelihood of being enrolled in a private school, with 131 (100.0% in the age bracket) attending a public institution.
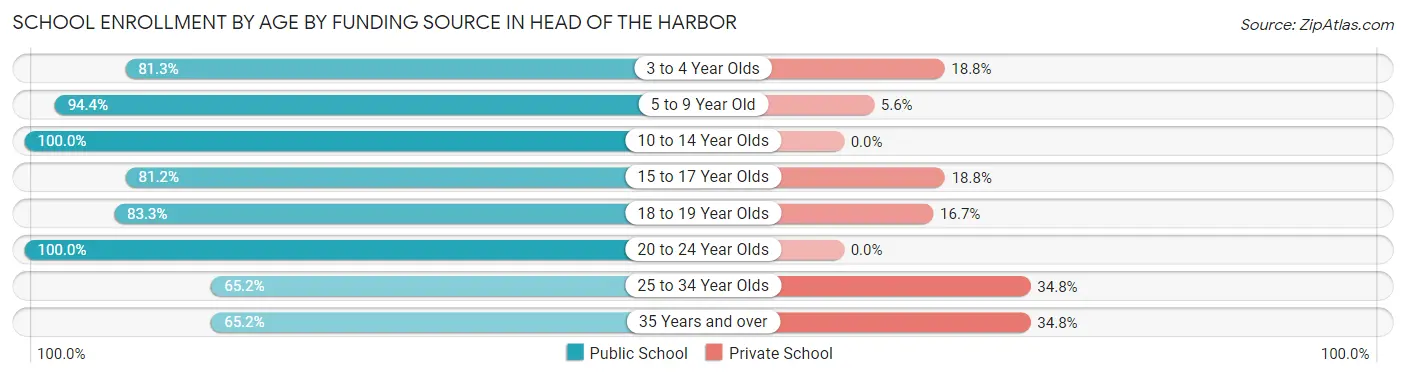
| Age Bracket | Public School | Private School |
| 3 to 4 Year Olds | 13 (81.2%) | 3 (18.8%) |
| 5 to 9 Year Old | 84 (94.4%) | 5 (5.6%) |
| 10 to 14 Year Olds | 131 (100.0%) | 0 (0.0%) |
| 15 to 17 Year Olds | 69 (81.2%) | 16 (18.8%) |
| 18 to 19 Year Olds | 10 (83.3%) | 2 (16.7%) |
| 20 to 24 Year Olds | 18 (100.0%) | 0 (0.0%) |
| 25 to 34 Year Olds | 15 (65.2%) | 8 (34.8%) |
| 35 Years and over | 15 (65.2%) | 8 (34.8%) |
| Total | 355 (89.4%) | 42 (10.6%) |
Educational Attainment by Field of Study in Head of the Harbor
Business (158 | 23.5%), education (71 | 10.5%), bio, nature & agricultural (61 | 9.1%), social sciences (60 | 8.9%), and science & technology (48 | 7.1%) are the most common fields of study among 673 individuals in Head of the Harbor who have obtained a bachelor's degree or higher.
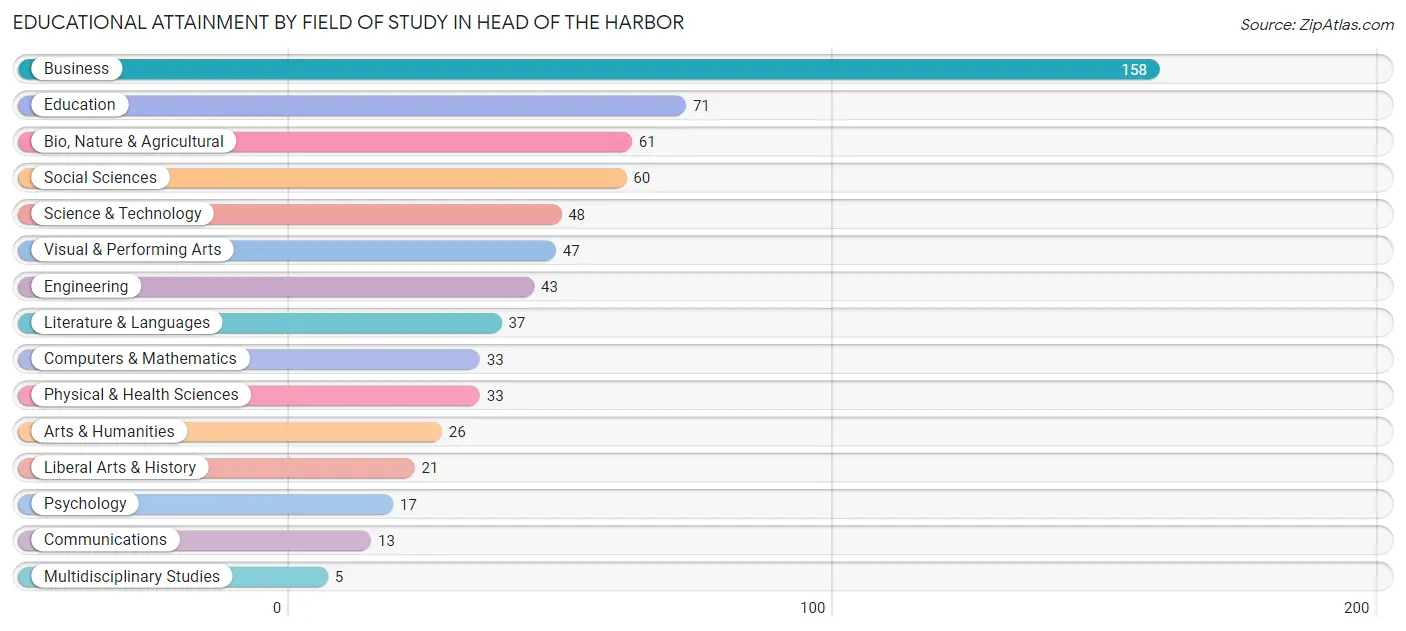
| Field of Study | # Graduates | % Graduates |
| Computers & Mathematics | 33 | 4.9% |
| Bio, Nature & Agricultural | 61 | 9.1% |
| Physical & Health Sciences | 33 | 4.9% |
| Psychology | 17 | 2.5% |
| Social Sciences | 60 | 8.9% |
| Engineering | 43 | 6.4% |
| Multidisciplinary Studies | 5 | 0.7% |
| Science & Technology | 48 | 7.1% |
| Business | 158 | 23.5% |
| Education | 71 | 10.5% |
| Literature & Languages | 37 | 5.5% |
| Liberal Arts & History | 21 | 3.1% |
| Visual & Performing Arts | 47 | 7.0% |
| Communications | 13 | 1.9% |
| Arts & Humanities | 26 | 3.9% |
| Total | 673 | 100.0% |
Transportation & Commute in Head of the Harbor
Vehicle Availability by Sex in Head of the Harbor
The most prevalent vehicle ownership categories in Head of the Harbor are males with 3 vehicles (201, accounting for 46.0%) and females with 3 vehicles (235, making up 50.6%).
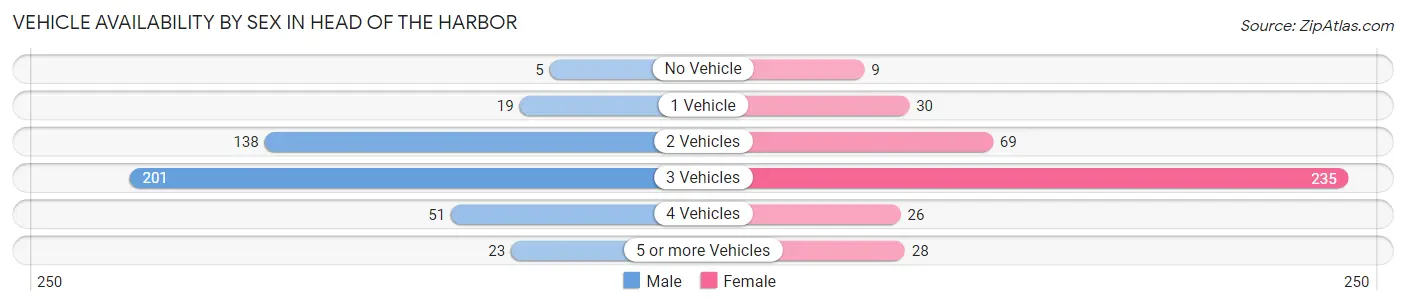
| Vehicles Available | Male | Female |
| No Vehicle | 5 (1.1%) | 9 (2.3%) |
| 1 Vehicle | 19 (4.3%) | 30 (7.6%) |
| 2 Vehicles | 138 (31.6%) | 69 (17.4%) |
| 3 Vehicles | 201 (46.0%) | 235 (59.2%) |
| 4 Vehicles | 51 (11.7%) | 26 (6.6%) |
| 5 or more Vehicles | 23 (5.3%) | 28 (7.0%) |
| Total | 437 (100.0%) | 397 (100.0%) |
Commute Time in Head of the Harbor
The most frequently occuring commute durations in Head of the Harbor are 30 to 34 minutes (145 commuters, 23.4%), 20 to 24 minutes (76 commuters, 12.3%), and less than 5 minutes (59 commuters, 9.5%).
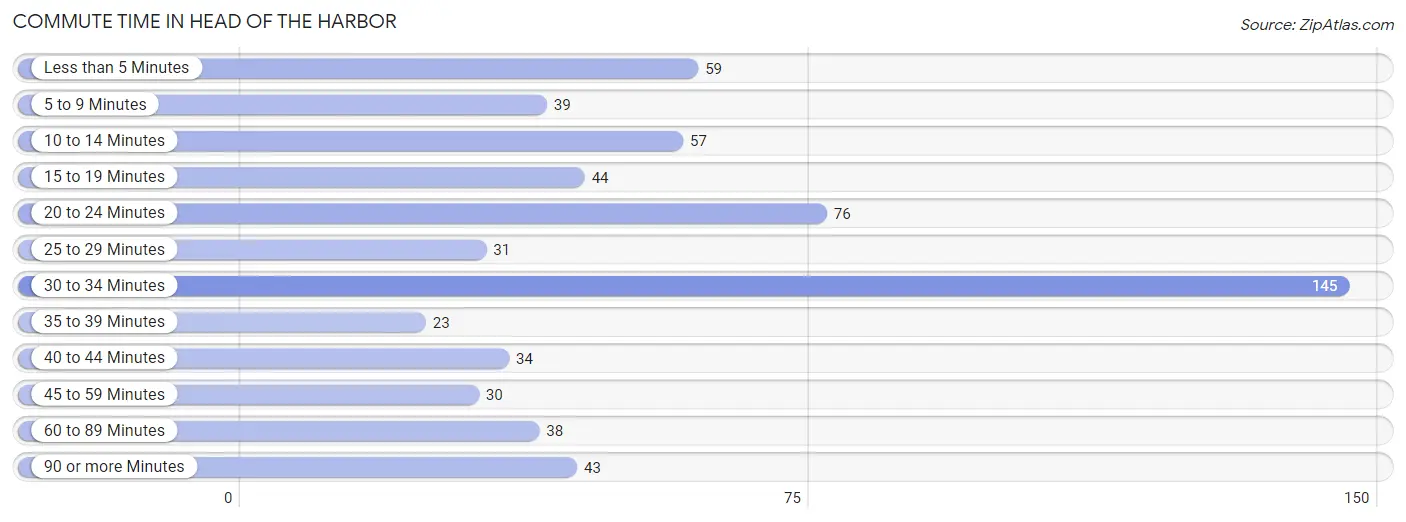
| Commute Time | # Commuters | % Commuters |
| Less than 5 Minutes | 59 | 9.5% |
| 5 to 9 Minutes | 39 | 6.3% |
| 10 to 14 Minutes | 57 | 9.2% |
| 15 to 19 Minutes | 44 | 7.1% |
| 20 to 24 Minutes | 76 | 12.3% |
| 25 to 29 Minutes | 31 | 5.0% |
| 30 to 34 Minutes | 145 | 23.4% |
| 35 to 39 Minutes | 23 | 3.7% |
| 40 to 44 Minutes | 34 | 5.5% |
| 45 to 59 Minutes | 30 | 4.9% |
| 60 to 89 Minutes | 38 | 6.1% |
| 90 or more Minutes | 43 | 7.0% |
Commute Time by Sex in Head of the Harbor
The most common commute times in Head of the Harbor are 30 to 34 minutes (78 commuters, 21.8%) for males and 30 to 34 minutes (67 commuters, 25.7%) for females.
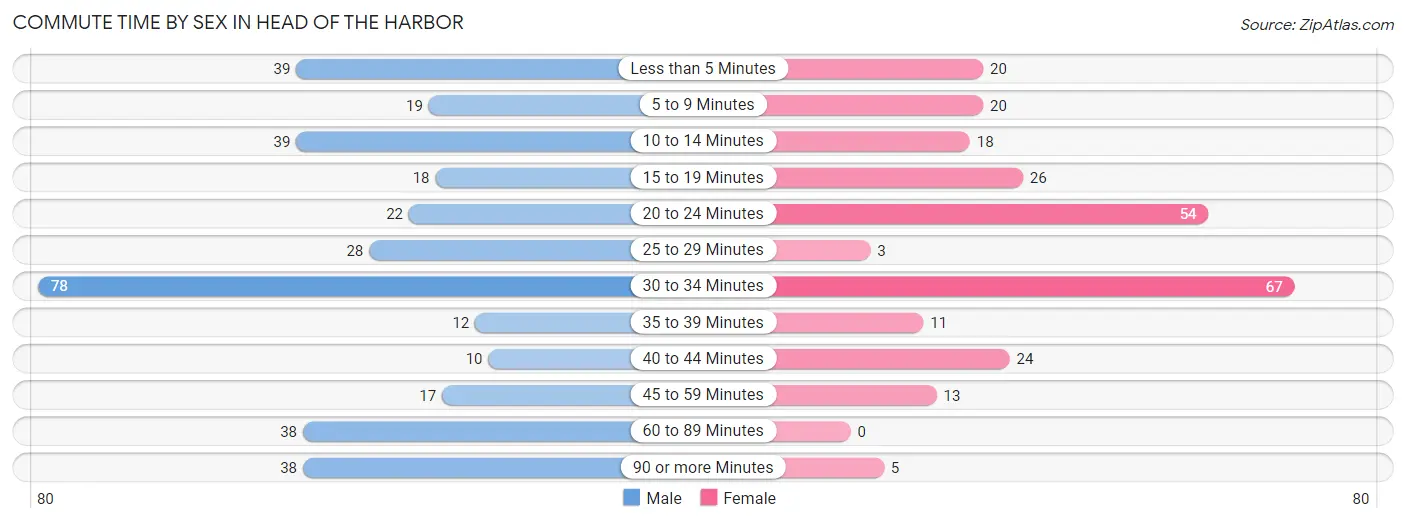
| Commute Time | Male | Female |
| Less than 5 Minutes | 39 (10.9%) | 20 (7.7%) |
| 5 to 9 Minutes | 19 (5.3%) | 20 (7.7%) |
| 10 to 14 Minutes | 39 (10.9%) | 18 (6.9%) |
| 15 to 19 Minutes | 18 (5.0%) | 26 (10.0%) |
| 20 to 24 Minutes | 22 (6.1%) | 54 (20.7%) |
| 25 to 29 Minutes | 28 (7.8%) | 3 (1.1%) |
| 30 to 34 Minutes | 78 (21.8%) | 67 (25.7%) |
| 35 to 39 Minutes | 12 (3.4%) | 11 (4.2%) |
| 40 to 44 Minutes | 10 (2.8%) | 24 (9.2%) |
| 45 to 59 Minutes | 17 (4.8%) | 13 (5.0%) |
| 60 to 89 Minutes | 38 (10.6%) | 0 (0.0%) |
| 90 or more Minutes | 38 (10.6%) | 5 (1.9%) |
Time of Departure to Work by Sex in Head of the Harbor
The most frequent times of departure to work in Head of the Harbor are 6:00 AM to 6:29 AM (76, 21.2%) for males and 5:30 AM to 5:59 AM (47, 18.0%) for females.
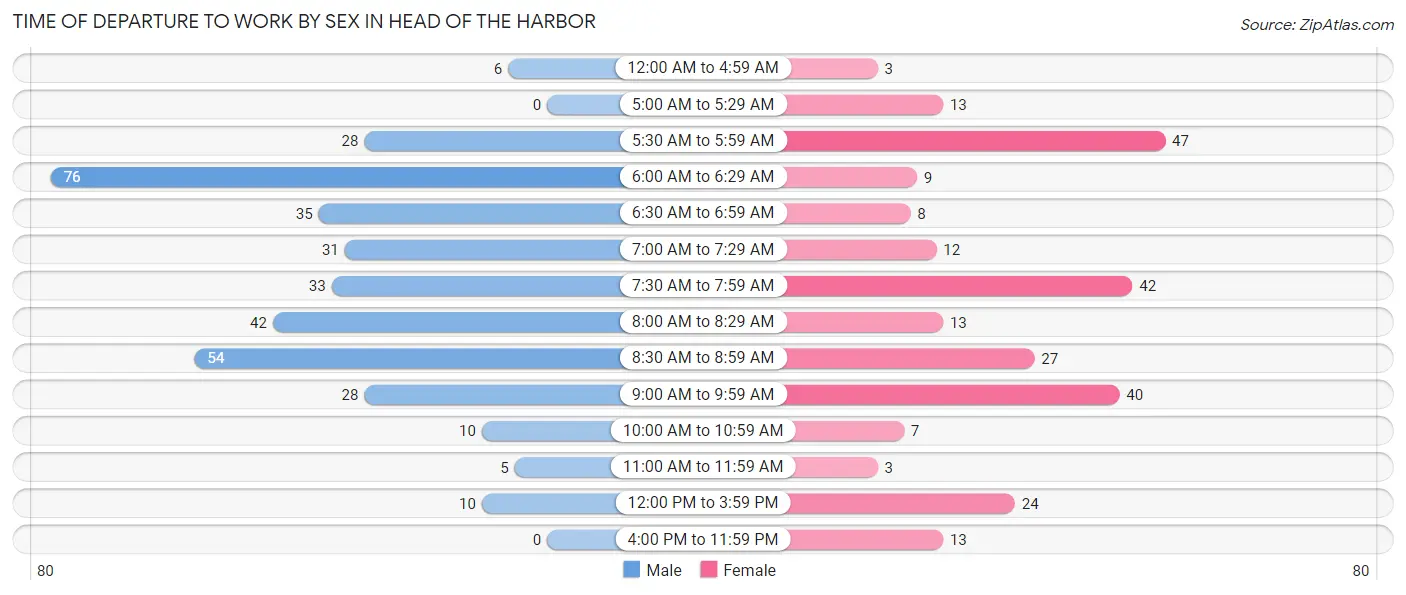
| Time of Departure | Male | Female |
| 12:00 AM to 4:59 AM | 6 (1.7%) | 3 (1.1%) |
| 5:00 AM to 5:29 AM | 0 (0.0%) | 13 (5.0%) |
| 5:30 AM to 5:59 AM | 28 (7.8%) | 47 (18.0%) |
| 6:00 AM to 6:29 AM | 76 (21.2%) | 9 (3.5%) |
| 6:30 AM to 6:59 AM | 35 (9.8%) | 8 (3.1%) |
| 7:00 AM to 7:29 AM | 31 (8.7%) | 12 (4.6%) |
| 7:30 AM to 7:59 AM | 33 (9.2%) | 42 (16.1%) |
| 8:00 AM to 8:29 AM | 42 (11.7%) | 13 (5.0%) |
| 8:30 AM to 8:59 AM | 54 (15.1%) | 27 (10.3%) |
| 9:00 AM to 9:59 AM | 28 (7.8%) | 40 (15.3%) |
| 10:00 AM to 10:59 AM | 10 (2.8%) | 7 (2.7%) |
| 11:00 AM to 11:59 AM | 5 (1.4%) | 3 (1.1%) |
| 12:00 PM to 3:59 PM | 10 (2.8%) | 24 (9.2%) |
| 4:00 PM to 11:59 PM | 0 (0.0%) | 13 (5.0%) |
| Total | 358 (100.0%) | 261 (100.0%) |
Housing Occupancy in Head of the Harbor
Occupancy by Ownership in Head of the Harbor
Of the total 490 dwellings in Head of the Harbor, owner-occupied units account for 475 (96.9%), while renter-occupied units make up 15 (3.1%).
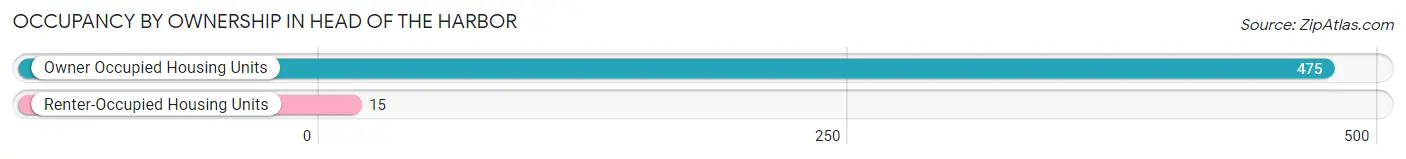
| Occupancy | # Housing Units | % Housing Units |
| Owner Occupied Housing Units | 475 | 96.9% |
| Renter-Occupied Housing Units | 15 | 3.1% |
| Total Occupied Housing Units | 490 | 100.0% |
Occupancy by Household Size in Head of the Harbor
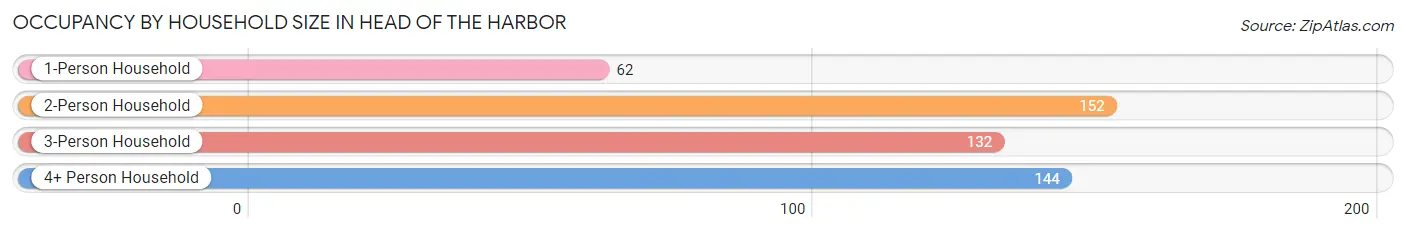
| Household Size | # Housing Units | % Housing Units |
| 1-Person Household | 62 | 12.7% |
| 2-Person Household | 152 | 31.0% |
| 3-Person Household | 132 | 26.9% |
| 4+ Person Household | 144 | 29.4% |
| Total Housing Units | 490 | 100.0% |
Occupancy by Ownership by Household Size in Head of the Harbor
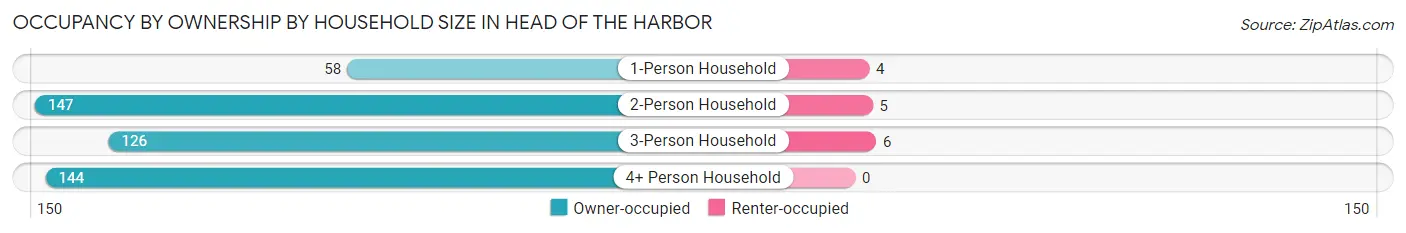
| Household Size | Owner-occupied | Renter-occupied |
| 1-Person Household | 58 (93.5%) | 4 (6.5%) |
| 2-Person Household | 147 (96.7%) | 5 (3.3%) |
| 3-Person Household | 126 (95.5%) | 6 (4.5%) |
| 4+ Person Household | 144 (100.0%) | 0 (0.0%) |
| Total Housing Units | 475 (96.9%) | 15 (3.1%) |
Occupancy by Educational Attainment in Head of the Harbor
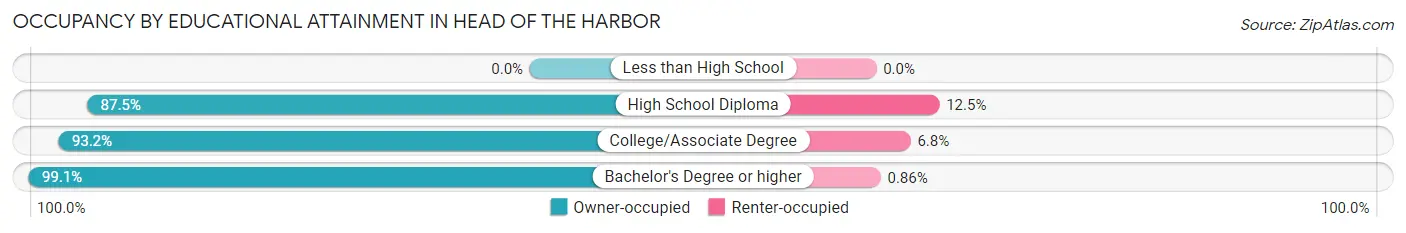
| Household Size | Owner-occupied | Renter-occupied |
| Less than High School | 0 (0.0%) | 0 (0.0%) |
| High School Diploma | 35 (87.5%) | 5 (12.5%) |
| College/Associate Degree | 96 (93.2%) | 7 (6.8%) |
| Bachelor's Degree or higher | 344 (99.1%) | 3 (0.9%) |
Occupancy by Age of Householder in Head of the Harbor
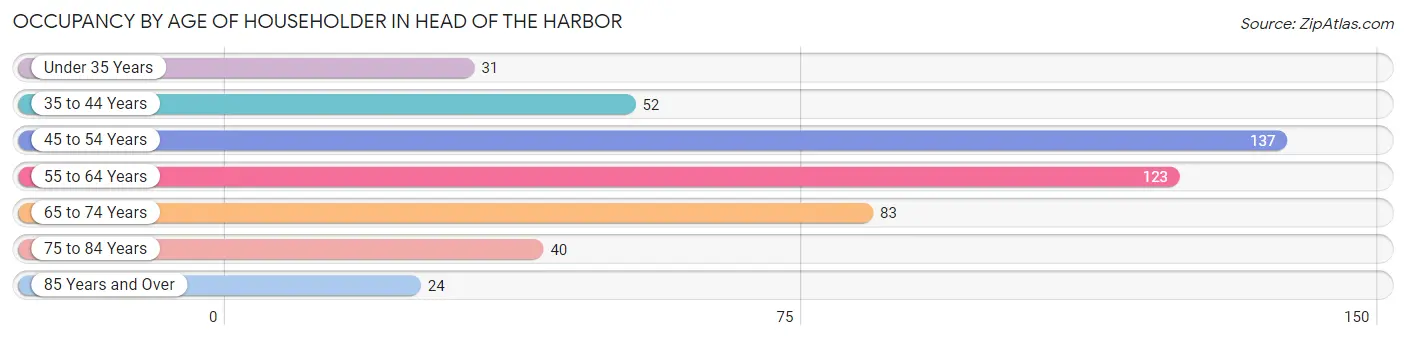
| Age Bracket | # Households | % Households |
| Under 35 Years | 31 | 6.3% |
| 35 to 44 Years | 52 | 10.6% |
| 45 to 54 Years | 137 | 28.0% |
| 55 to 64 Years | 123 | 25.1% |
| 65 to 74 Years | 83 | 16.9% |
| 75 to 84 Years | 40 | 8.2% |
| 85 Years and Over | 24 | 4.9% |
| Total | 490 | 100.0% |
Housing Finances in Head of the Harbor
Median Income by Occupancy in Head of the Harbor
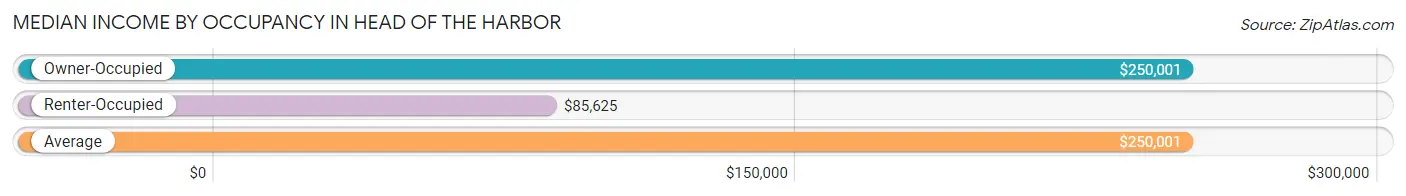
| Occupancy Type | # Households | Median Income |
| Owner-Occupied | 475 (96.9%) | $250,001 |
| Renter-Occupied | 15 (3.1%) | $85,625 |
| Average | 490 (100.0%) | $250,001 |
Occupancy by Householder Income Bracket in Head of the Harbor
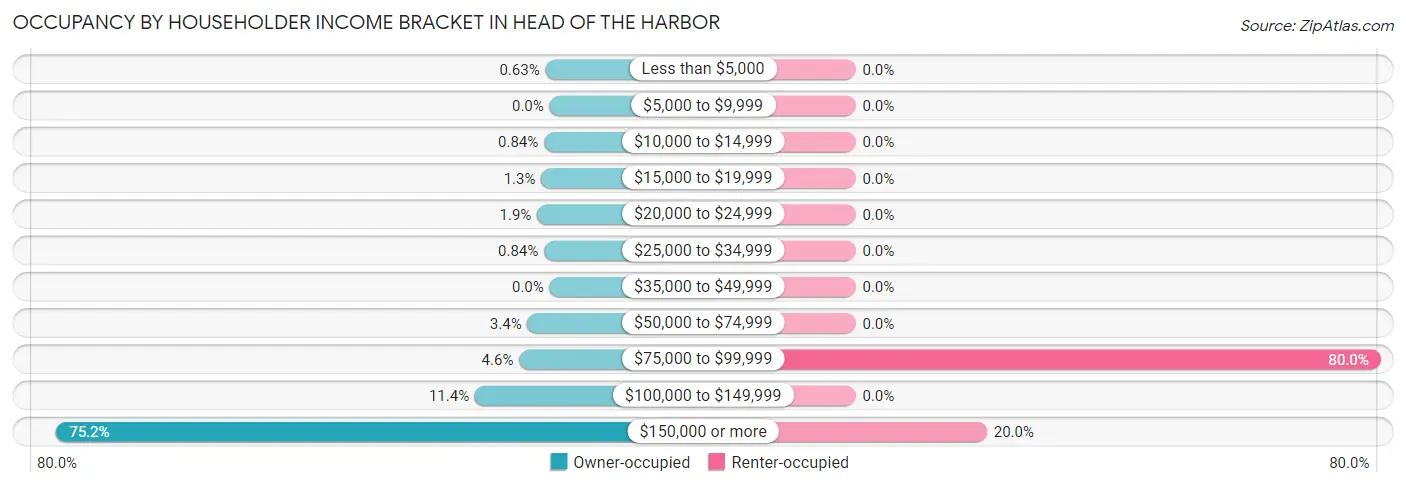
| Income Bracket | Owner-occupied | Renter-occupied |
| Less than $5,000 | 3 (0.6%) | 0 (0.0%) |
| $5,000 to $9,999 | 0 (0.0%) | 0 (0.0%) |
| $10,000 to $14,999 | 4 (0.8%) | 0 (0.0%) |
| $15,000 to $19,999 | 6 (1.3%) | 0 (0.0%) |
| $20,000 to $24,999 | 9 (1.9%) | 0 (0.0%) |
| $25,000 to $34,999 | 4 (0.8%) | 0 (0.0%) |
| $35,000 to $49,999 | 0 (0.0%) | 0 (0.0%) |
| $50,000 to $74,999 | 16 (3.4%) | 0 (0.0%) |
| $75,000 to $99,999 | 22 (4.6%) | 12 (80.0%) |
| $100,000 to $149,999 | 54 (11.4%) | 0 (0.0%) |
| $150,000 or more | 357 (75.2%) | 3 (20.0%) |
| Total | 475 (100.0%) | 15 (100.0%) |
Monthly Housing Cost Tiers in Head of the Harbor
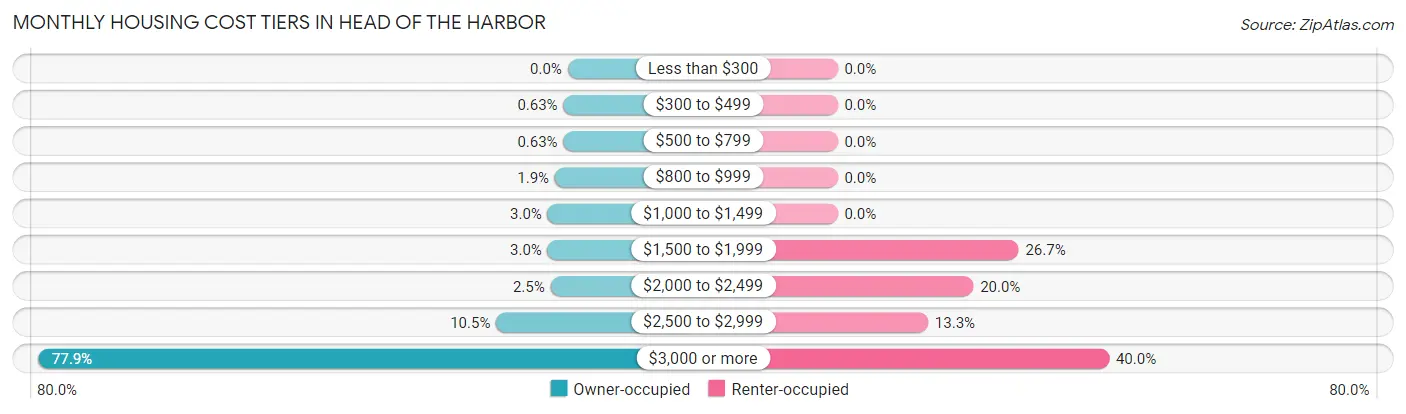
| Monthly Cost | Owner-occupied | Renter-occupied |
| Less than $300 | 0 (0.0%) | 0 (0.0%) |
| $300 to $499 | 3 (0.6%) | 0 (0.0%) |
| $500 to $799 | 3 (0.6%) | 0 (0.0%) |
| $800 to $999 | 9 (1.9%) | 0 (0.0%) |
| $1,000 to $1,499 | 14 (2.9%) | 0 (0.0%) |
| $1,500 to $1,999 | 14 (2.9%) | 4 (26.7%) |
| $2,000 to $2,499 | 12 (2.5%) | 3 (20.0%) |
| $2,500 to $2,999 | 50 (10.5%) | 2 (13.3%) |
| $3,000 or more | 370 (77.9%) | 6 (40.0%) |
| Total | 475 (100.0%) | 15 (100.0%) |
Physical Housing Characteristics in Head of the Harbor
Housing Structures in Head of the Harbor
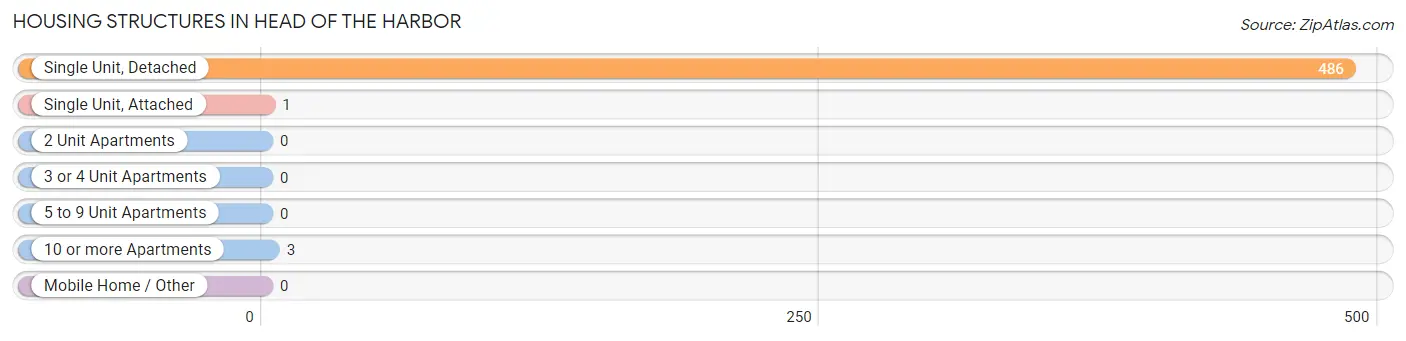
| Structure Type | # Housing Units | % Housing Units |
| Single Unit, Detached | 486 | 99.2% |
| Single Unit, Attached | 1 | 0.2% |
| 2 Unit Apartments | 0 | 0.0% |
| 3 or 4 Unit Apartments | 0 | 0.0% |
| 5 to 9 Unit Apartments | 0 | 0.0% |
| 10 or more Apartments | 3 | 0.6% |
| Mobile Home / Other | 0 | 0.0% |
| Total | 490 | 100.0% |
Housing Structures by Occupancy in Head of the Harbor
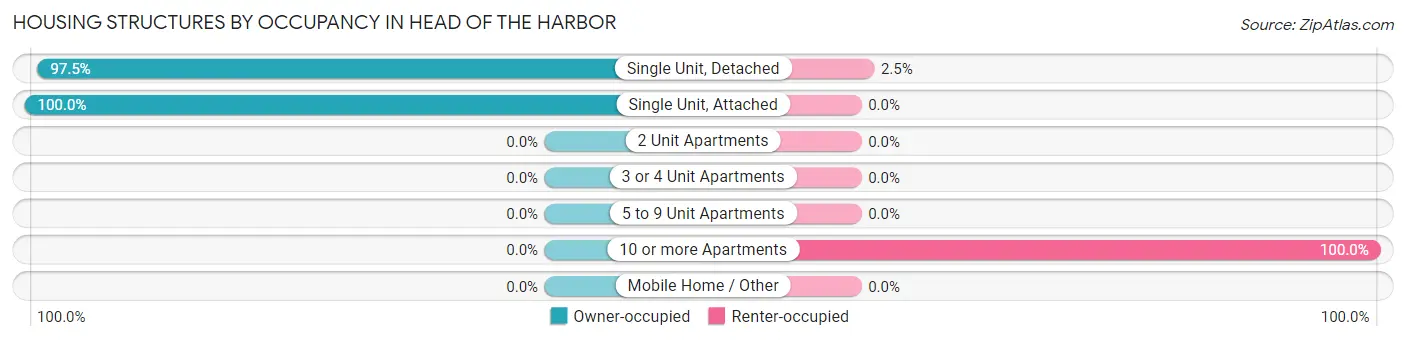
| Structure Type | Owner-occupied | Renter-occupied |
| Single Unit, Detached | 474 (97.5%) | 12 (2.5%) |
| Single Unit, Attached | 1 (100.0%) | 0 (0.0%) |
| 2 Unit Apartments | 0 (0.0%) | 0 (0.0%) |
| 3 or 4 Unit Apartments | 0 (0.0%) | 0 (0.0%) |
| 5 to 9 Unit Apartments | 0 (0.0%) | 0 (0.0%) |
| 10 or more Apartments | 0 (0.0%) | 3 (100.0%) |
| Mobile Home / Other | 0 (0.0%) | 0 (0.0%) |
| Total | 475 (96.9%) | 15 (3.1%) |
Housing Structures by Number of Rooms in Head of the Harbor
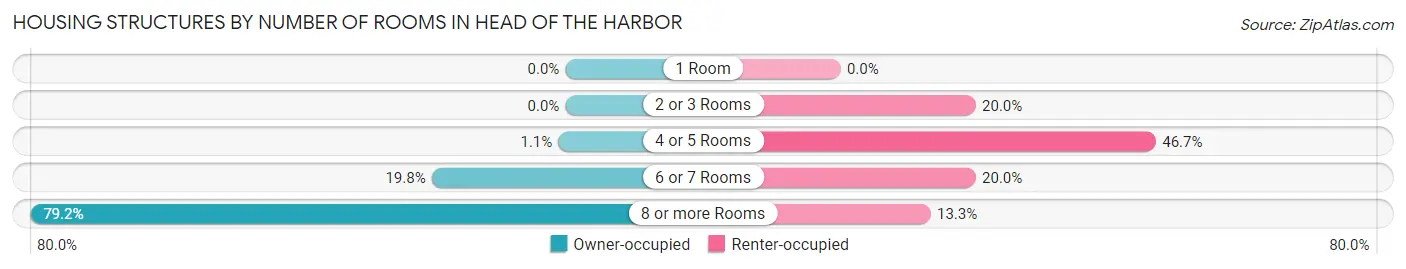
| Number of Rooms | Owner-occupied | Renter-occupied |
| 1 Room | 0 (0.0%) | 0 (0.0%) |
| 2 or 3 Rooms | 0 (0.0%) | 3 (20.0%) |
| 4 or 5 Rooms | 5 (1.1%) | 7 (46.7%) |
| 6 or 7 Rooms | 94 (19.8%) | 3 (20.0%) |
| 8 or more Rooms | 376 (79.2%) | 2 (13.3%) |
| Total | 475 (100.0%) | 15 (100.0%) |
Housing Structure by Heating Type in Head of the Harbor
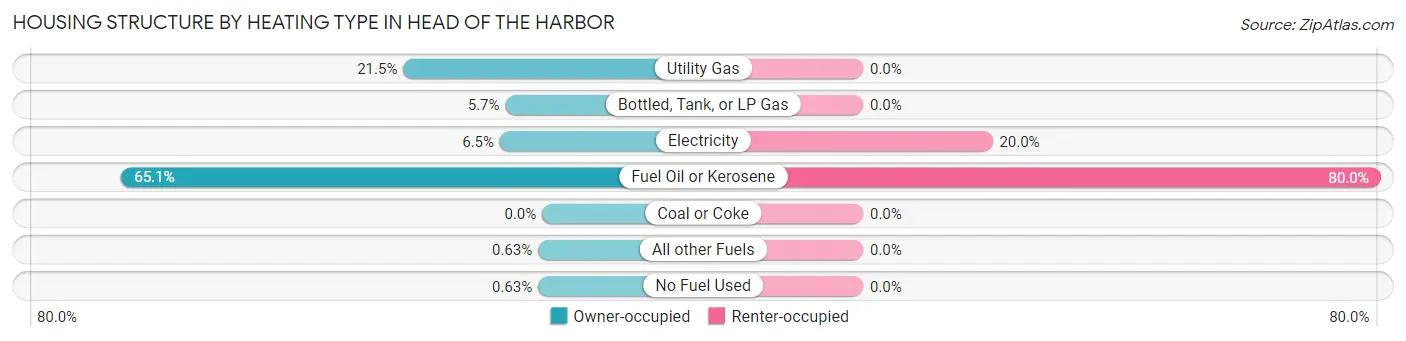
| Heating Type | Owner-occupied | Renter-occupied |
| Utility Gas | 102 (21.5%) | 0 (0.0%) |
| Bottled, Tank, or LP Gas | 27 (5.7%) | 0 (0.0%) |
| Electricity | 31 (6.5%) | 3 (20.0%) |
| Fuel Oil or Kerosene | 309 (65.0%) | 12 (80.0%) |
| Coal or Coke | 0 (0.0%) | 0 (0.0%) |
| All other Fuels | 3 (0.6%) | 0 (0.0%) |
| No Fuel Used | 3 (0.6%) | 0 (0.0%) |
| Total | 475 (100.0%) | 15 (100.0%) |
Household Vehicle Usage in Head of the Harbor
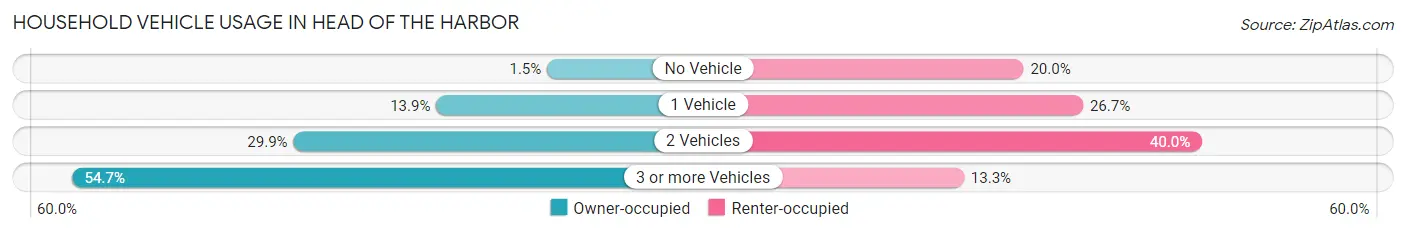
| Vehicles per Household | Owner-occupied | Renter-occupied |
| No Vehicle | 7 (1.5%) | 3 (20.0%) |
| 1 Vehicle | 66 (13.9%) | 4 (26.7%) |
| 2 Vehicles | 142 (29.9%) | 6 (40.0%) |
| 3 or more Vehicles | 260 (54.7%) | 2 (13.3%) |
| Total | 475 (100.0%) | 15 (100.0%) |
Real Estate & Mortgages in Head of the Harbor
Real Estate and Mortgage Overview in Head of the Harbor
| Characteristic | Without Mortgage | With Mortgage |
| Housing Units | 228 | 247 |
| Median Property Value | $1,131,600 | $1,013,300 |
| Median Household Income | $250,001 | $193 |
| Monthly Housing Costs | $1,501 | $228 |
| Real Estate Taxes | $10,001 | $6 |
Property Value by Mortgage Status in Head of the Harbor
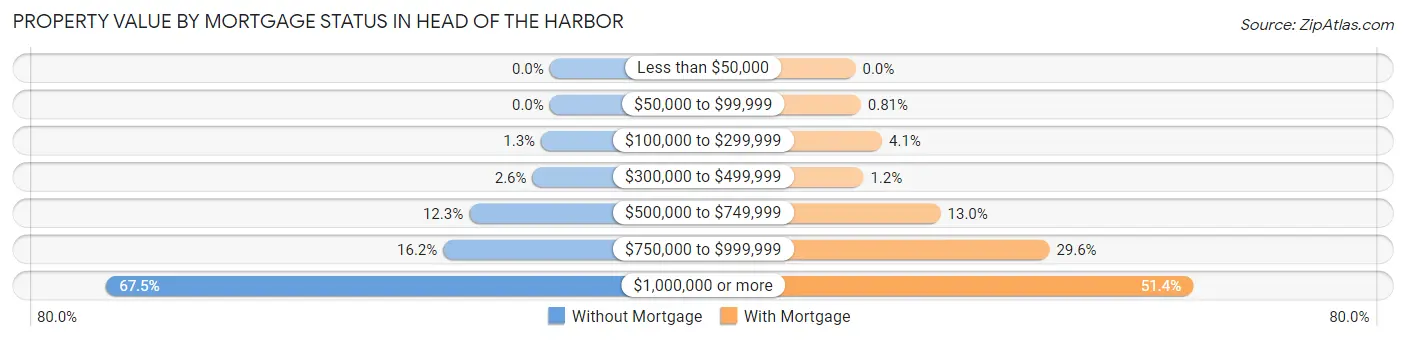
| Property Value | Without Mortgage | With Mortgage |
| Less than $50,000 | 0 (0.0%) | 0 (0.0%) |
| $50,000 to $99,999 | 0 (0.0%) | 2 (0.8%) |
| $100,000 to $299,999 | 3 (1.3%) | 10 (4.1%) |
| $300,000 to $499,999 | 6 (2.6%) | 3 (1.2%) |
| $500,000 to $749,999 | 28 (12.3%) | 32 (13.0%) |
| $750,000 to $999,999 | 37 (16.2%) | 73 (29.5%) |
| $1,000,000 or more | 154 (67.5%) | 127 (51.4%) |
| Total | 228 (100.0%) | 247 (100.0%) |
Household Income by Mortgage Status in Head of the Harbor
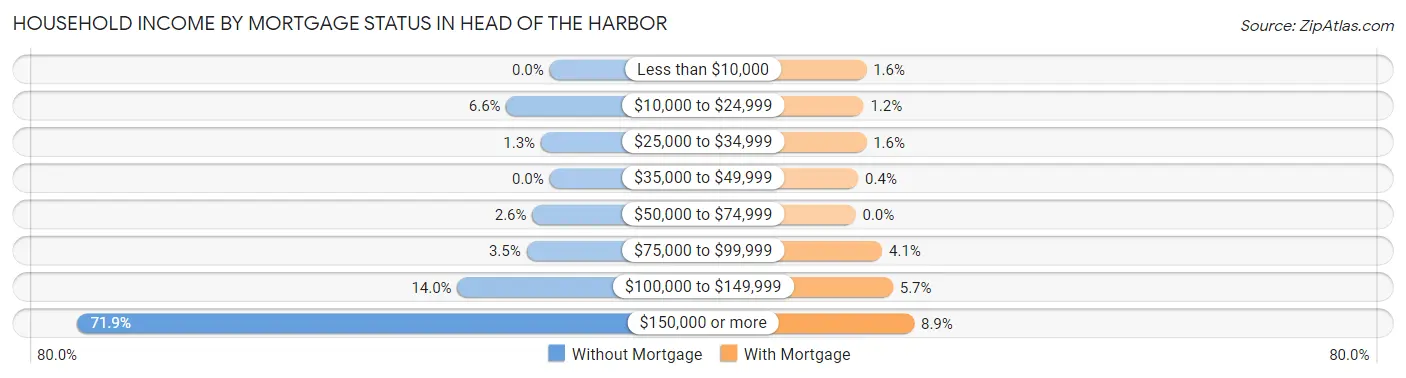
| Household Income | Without Mortgage | With Mortgage |
| Less than $10,000 | 0 (0.0%) | 4 (1.6%) |
| $10,000 to $24,999 | 15 (6.6%) | 3 (1.2%) |
| $25,000 to $34,999 | 3 (1.3%) | 4 (1.6%) |
| $35,000 to $49,999 | 0 (0.0%) | 1 (0.4%) |
| $50,000 to $74,999 | 6 (2.6%) | 0 (0.0%) |
| $75,000 to $99,999 | 8 (3.5%) | 10 (4.1%) |
| $100,000 to $149,999 | 32 (14.0%) | 14 (5.7%) |
| $150,000 or more | 164 (71.9%) | 22 (8.9%) |
| Total | 228 (100.0%) | 247 (100.0%) |
Property Value to Household Income Ratio in Head of the Harbor
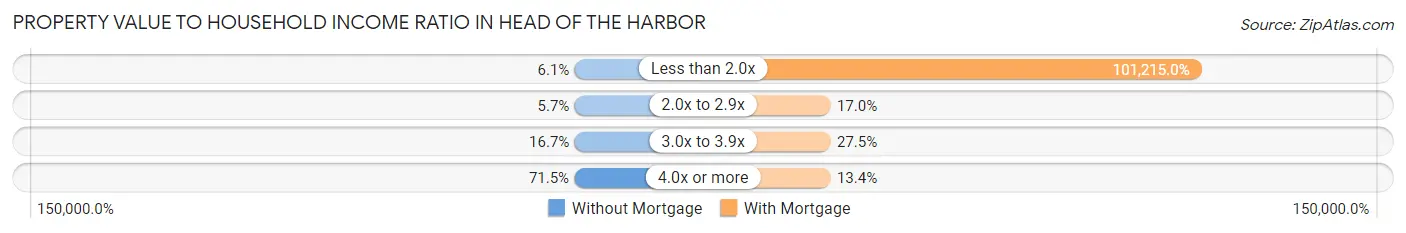
| Value-to-Income Ratio | Without Mortgage | With Mortgage |
| Less than 2.0x | 14 (6.1%) | 250,001 (101,215.0%) |
| 2.0x to 2.9x | 13 (5.7%) | 42 (17.0%) |
| 3.0x to 3.9x | 38 (16.7%) | 68 (27.5%) |
| 4.0x or more | 163 (71.5%) | 33 (13.4%) |
| Total | 228 (100.0%) | 247 (100.0%) |
Real Estate Taxes by Mortgage Status in Head of the Harbor
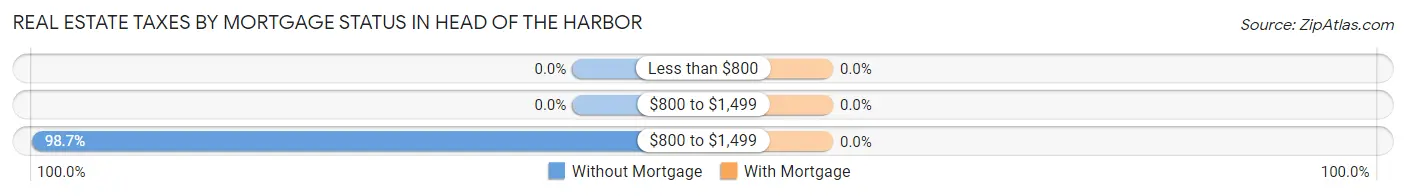
| Property Taxes | Without Mortgage | With Mortgage |
| Less than $800 | 0 (0.0%) | 0 (0.0%) |
| $800 to $1,499 | 0 (0.0%) | 0 (0.0%) |
| $800 to $1,499 | 225 (98.7%) | 0 (0.0%) |
| Total | 228 (100.0%) | 247 (100.0%) |
Health & Disability in Head of the Harbor
Health Insurance Coverage by Age in Head of the Harbor
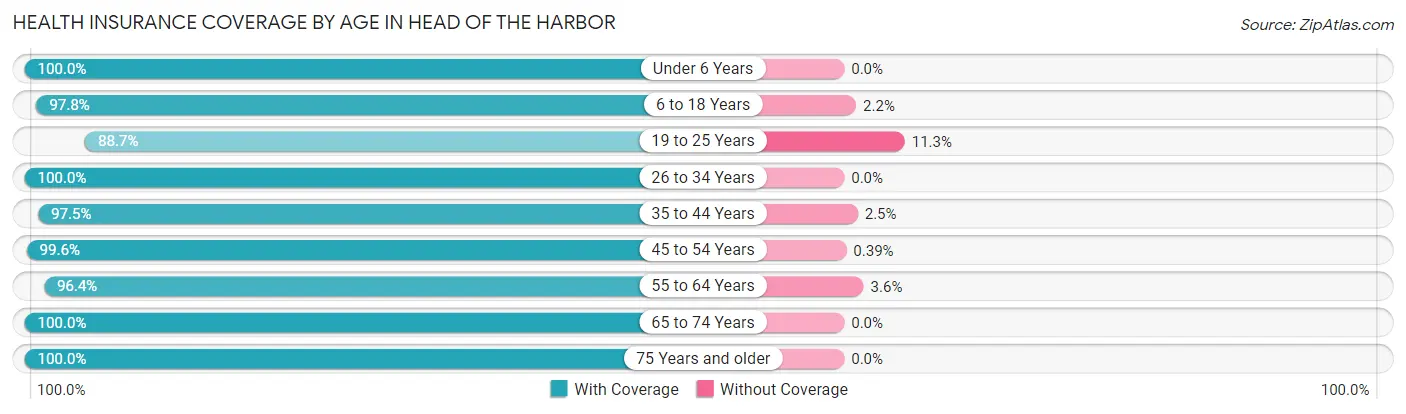
| Age Bracket | With Coverage | Without Coverage |
| Under 6 Years | 34 (100.0%) | 0 (0.0%) |
| 6 to 18 Years | 310 (97.8%) | 7 (2.2%) |
| 19 to 25 Years | 118 (88.7%) | 15 (11.3%) |
| 26 to 34 Years | 109 (100.0%) | 0 (0.0%) |
| 35 to 44 Years | 116 (97.5%) | 3 (2.5%) |
| 45 to 54 Years | 257 (99.6%) | 1 (0.4%) |
| 55 to 64 Years | 267 (96.4%) | 10 (3.6%) |
| 65 to 74 Years | 123 (100.0%) | 0 (0.0%) |
| 75 Years and older | 130 (100.0%) | 0 (0.0%) |
| Total | 1,464 (97.6%) | 36 (2.4%) |
Health Insurance Coverage by Citizenship Status in Head of the Harbor
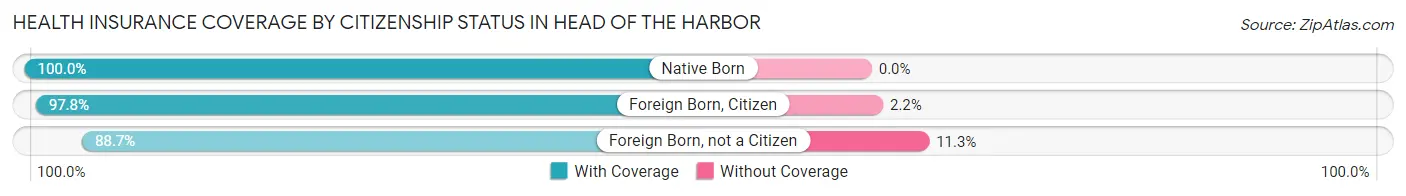
| Citizenship Status | With Coverage | Without Coverage |
| Native Born | 34 (100.0%) | 0 (0.0%) |
| Foreign Born, Citizen | 310 (97.8%) | 7 (2.2%) |
| Foreign Born, not a Citizen | 118 (88.7%) | 15 (11.3%) |
Health Insurance Coverage by Household Income in Head of the Harbor
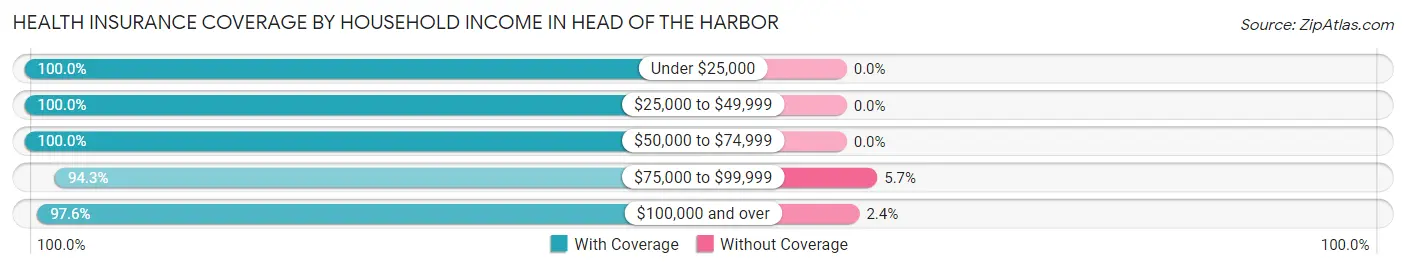
| Household Income | With Coverage | Without Coverage |
| Under $25,000 | 29 (100.0%) | 0 (0.0%) |
| $25,000 to $49,999 | 8 (100.0%) | 0 (0.0%) |
| $50,000 to $74,999 | 41 (100.0%) | 0 (0.0%) |
| $75,000 to $99,999 | 66 (94.3%) | 4 (5.7%) |
| $100,000 and over | 1,320 (97.6%) | 32 (2.4%) |
Public vs Private Health Insurance Coverage by Age in Head of the Harbor
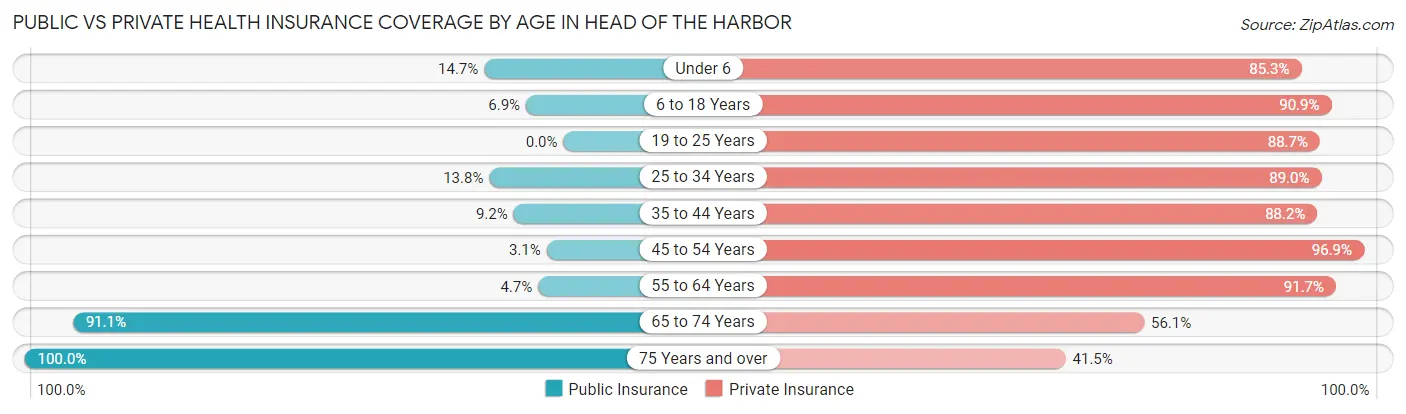
| Age Bracket | Public Insurance | Private Insurance |
| Under 6 | 5 (14.7%) | 29 (85.3%) |
| 6 to 18 Years | 22 (6.9%) | 288 (90.8%) |
| 19 to 25 Years | 0 (0.0%) | 118 (88.7%) |
| 25 to 34 Years | 15 (13.8%) | 97 (89.0%) |
| 35 to 44 Years | 11 (9.2%) | 105 (88.2%) |
| 45 to 54 Years | 8 (3.1%) | 250 (96.9%) |
| 55 to 64 Years | 13 (4.7%) | 254 (91.7%) |
| 65 to 74 Years | 112 (91.1%) | 69 (56.1%) |
| 75 Years and over | 130 (100.0%) | 54 (41.5%) |
| Total | 316 (21.1%) | 1,264 (84.3%) |
Disability Status by Sex by Age in Head of the Harbor
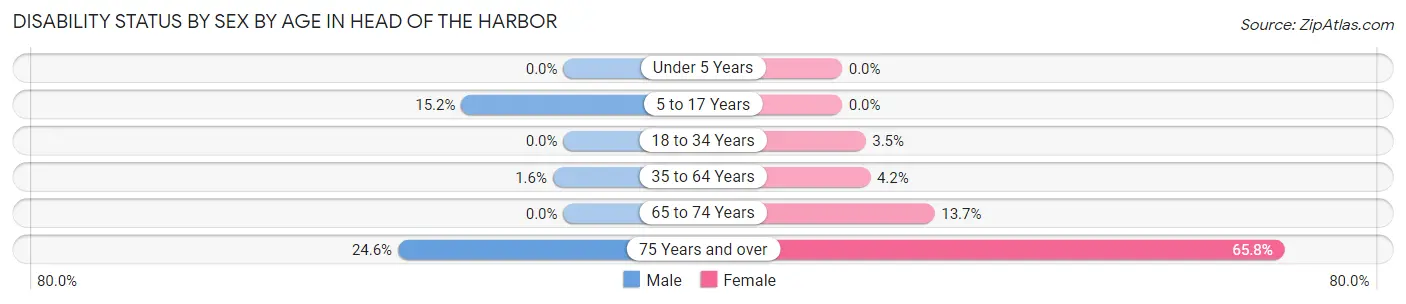
| Age Bracket | Male | Female |
| Under 5 Years | 0 (0.0%) | 0 (0.0%) |
| 5 to 17 Years | 30 (15.1%) | 0 (0.0%) |
| 18 to 34 Years | 0 (0.0%) | 6 (3.5%) |
| 35 to 64 Years | 5 (1.6%) | 14 (4.2%) |
| 65 to 74 Years | 0 (0.0%) | 7 (13.7%) |
| 75 Years and over | 14 (24.6%) | 48 (65.7%) |
Disability Class by Sex by Age in Head of the Harbor
Disability Class: Hearing Difficulty
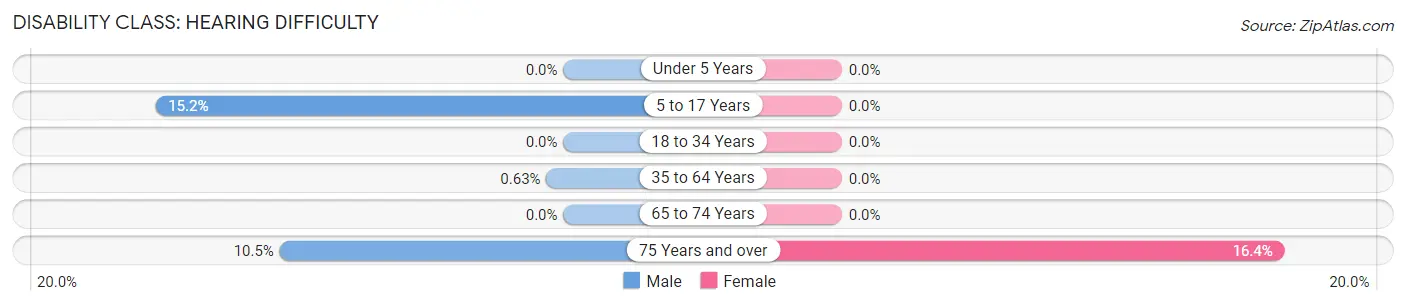
| Age Bracket | Male | Female |
| Under 5 Years | 0 (0.0%) | 0 (0.0%) |
| 5 to 17 Years | 30 (15.1%) | 0 (0.0%) |
| 18 to 34 Years | 0 (0.0%) | 0 (0.0%) |
| 35 to 64 Years | 2 (0.6%) | 0 (0.0%) |
| 65 to 74 Years | 0 (0.0%) | 0 (0.0%) |
| 75 Years and over | 6 (10.5%) | 12 (16.4%) |
Disability Class: Vision Difficulty
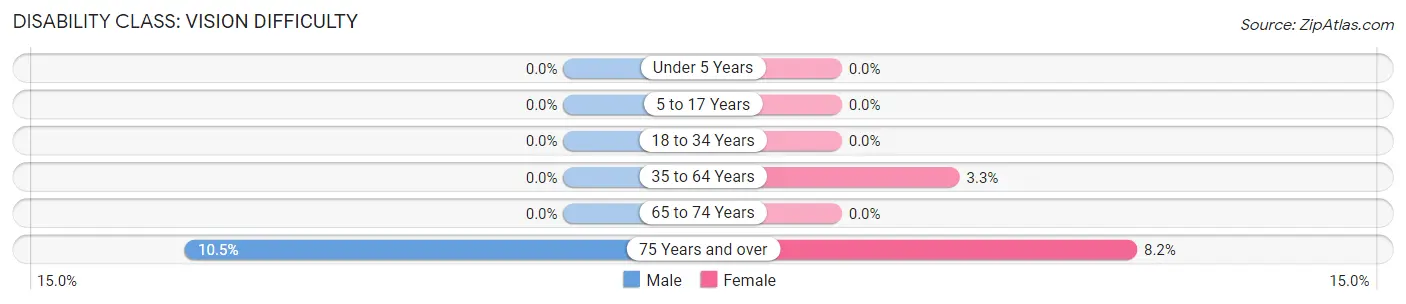
| Age Bracket | Male | Female |
| Under 5 Years | 0 (0.0%) | 0 (0.0%) |
| 5 to 17 Years | 0 (0.0%) | 0 (0.0%) |
| 18 to 34 Years | 0 (0.0%) | 0 (0.0%) |
| 35 to 64 Years | 0 (0.0%) | 11 (3.3%) |
| 65 to 74 Years | 0 (0.0%) | 0 (0.0%) |
| 75 Years and over | 6 (10.5%) | 6 (8.2%) |
Disability Class: Cognitive Difficulty
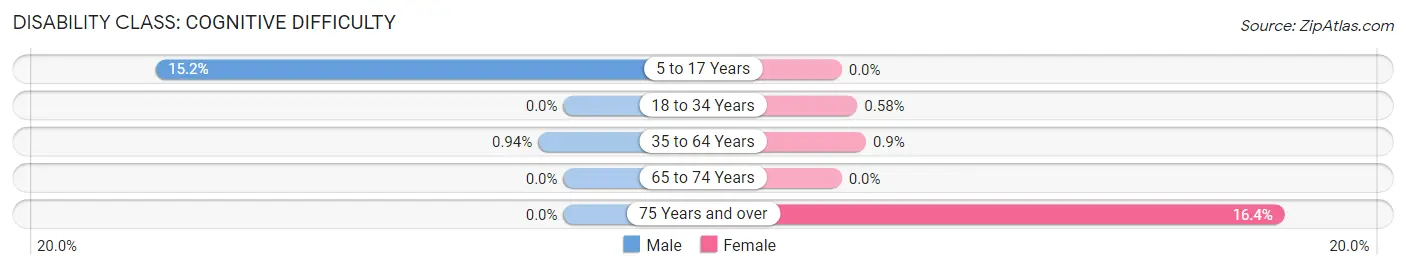
| Age Bracket | Male | Female |
| 5 to 17 Years | 30 (15.1%) | 0 (0.0%) |
| 18 to 34 Years | 0 (0.0%) | 1 (0.6%) |
| 35 to 64 Years | 3 (0.9%) | 3 (0.9%) |
| 65 to 74 Years | 0 (0.0%) | 0 (0.0%) |
| 75 Years and over | 0 (0.0%) | 12 (16.4%) |
Disability Class: Ambulatory Difficulty
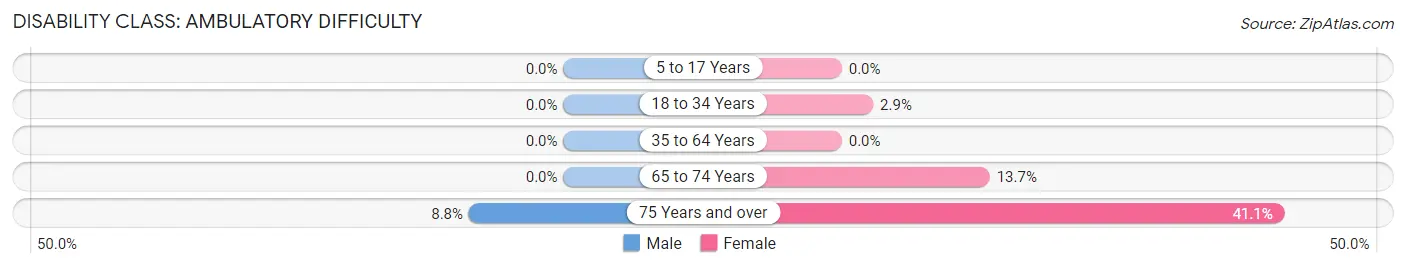
| Age Bracket | Male | Female |
| 5 to 17 Years | 0 (0.0%) | 0 (0.0%) |
| 18 to 34 Years | 0 (0.0%) | 5 (2.9%) |
| 35 to 64 Years | 0 (0.0%) | 0 (0.0%) |
| 65 to 74 Years | 0 (0.0%) | 7 (13.7%) |
| 75 Years and over | 5 (8.8%) | 30 (41.1%) |
Disability Class: Self-Care Difficulty
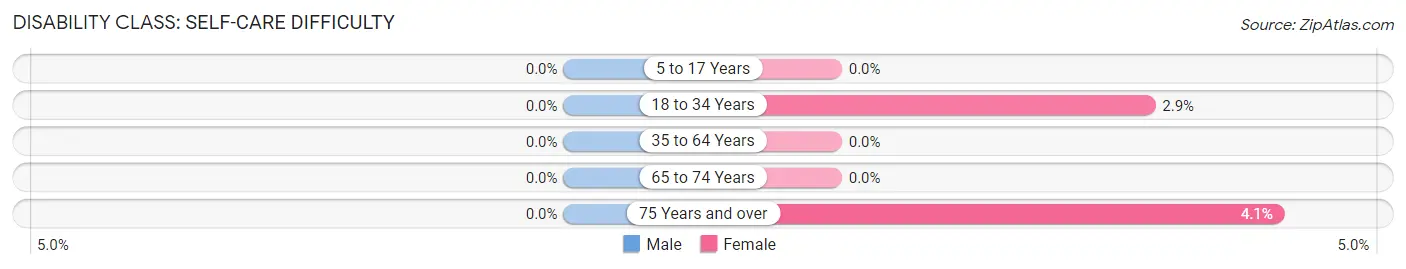
| Age Bracket | Male | Female |
| 5 to 17 Years | 0 (0.0%) | 0 (0.0%) |
| 18 to 34 Years | 0 (0.0%) | 5 (2.9%) |
| 35 to 64 Years | 0 (0.0%) | 0 (0.0%) |
| 65 to 74 Years | 0 (0.0%) | 0 (0.0%) |
| 75 Years and over | 0 (0.0%) | 3 (4.1%) |
Technology Access in Head of the Harbor
Computing Device Access in Head of the Harbor
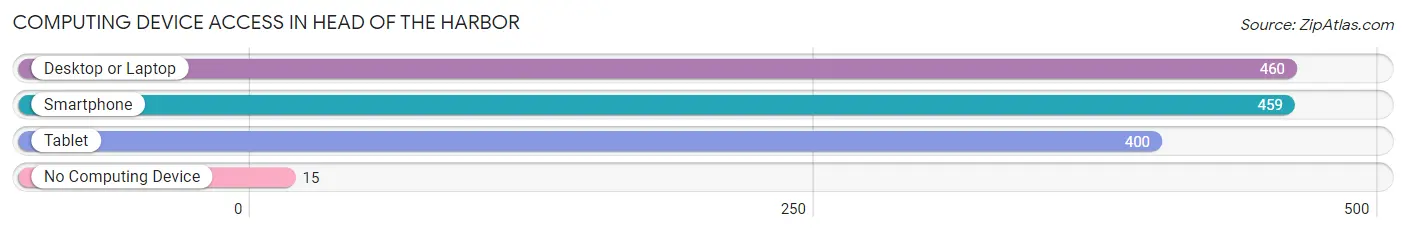
| Device Type | # Households | % Households |
| Desktop or Laptop | 460 | 93.9% |
| Smartphone | 459 | 93.7% |
| Tablet | 400 | 81.6% |
| No Computing Device | 15 | 3.1% |
| Total | 490 | 100.0% |
Internet Access in Head of the Harbor
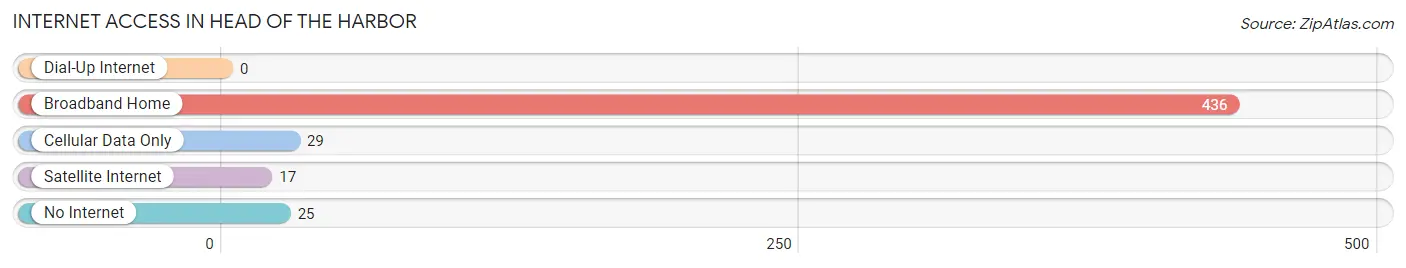
| Internet Type | # Households | % Households |
| Dial-Up Internet | 0 | 0.0% |
| Broadband Home | 436 | 89.0% |
| Cellular Data Only | 29 | 5.9% |
| Satellite Internet | 17 | 3.5% |
| No Internet | 25 | 5.1% |
| Total | 490 | 100.0% |
Head of the Harbor Summary
Head of the Harbor is a village located in Suffolk County, New York, United States. The village is located within the Town of Smithtown and is situated on the north shore of Long Island. As of the 2010 census, the village had a population of 1,837.
History
The area that is now Head of the Harbor was originally inhabited by the Secatogue Indians, a branch of the Algonquin tribe. The Secatogue Indians were a peaceful tribe that lived off the land and the waters of Long Island. The first European settlers arrived in the area in the 1650s. The area was originally known as “Head of the Harbor” because it was the head of the harbor of Stony Brook.
In 1790, the village was officially incorporated as the Village of Head of the Harbor. The village was named after the harbor at the head of Stony Brook. The village was a popular summer resort destination for wealthy New Yorkers in the late 19th and early 20th centuries.
Geography
Head of the Harbor is located at 40°52'25" North, 73°10'45" West (40.873611, -73.179167). The village is located on the north shore of Long Island, approximately 40 miles east of New York City. The village is bordered by the Town of Smithtown to the west, the Town of Brookhaven to the east, and the Long Island Sound to the north.
The village has a total area of 1.2 square miles, all of which is land. The village is located on a peninsula that juts out into the Long Island Sound. The village is home to several parks, including Head of the Harbor Park, which offers views of the Long Island Sound.
Economy
The economy of Head of the Harbor is largely based on tourism and retail. The village is home to several restaurants, shops, and other businesses. The village is also home to several marinas, which offer boat rentals and other services.
The village is also home to several corporate offices, including the headquarters of the Long Island Power Authority. The village is also home to several financial services companies, including Morgan Stanley and UBS.
Demographics
As of the 2010 census, there were 1,837 people, 745 households, and 517 families residing in the village. The population density was 1,521.7 people per square mile. The racial makeup of the village was 94.2% White, 1.2% African American, 0.2% Native American, 1.7% Asian, 0.1% Pacific Islander, 1.2% from other races, and 1.6% from two or more races. Hispanic or Latino of any race were 4.2% of the population.
The median income for a household in the village was $107,917, and the median income for a family was $125,917. The per capita income for the village was $50,917. About 2.2% of families and 3.2% of the population were below the poverty line, including 4.2% of those under age 18 and 0.9% of those age 65 or over.
Head of the Harbor is a small village with a rich history and a vibrant economy. The village is home to several businesses, parks, and marinas, and is a popular destination for tourists and locals alike. The village has a diverse population and a strong sense of community.
Common Questions
What is Per Capita Income in Head of the Harbor?
Per Capita income in Head of the Harbor is $104,246.
What is the Median Family Income in Head of the Harbor?
Median Family Income in Head of the Harbor is $250,001.
What is the Median Household income in Head of the Harbor?
Median Household Income in Head of the Harbor is $250,001.
What is Income or Wage Gap in Head of the Harbor?
Income or Wage Gap in Head of the Harbor is 59.9%.
Women in Head of the Harbor earn 40.1 cents for every dollar earned by a man.
What is Inequality or Gini Index in Head of the Harbor?
Inequality or Gini Index in Head of the Harbor is 0.41.
What is the Total Population of Head of the Harbor?
Total Population of Head of the Harbor is 1,501.
What is the Total Male Population of Head of the Harbor?
Total Male Population of Head of the Harbor is 743.
What is the Total Female Population of Head of the Harbor?
Total Female Population of Head of the Harbor is 758.
What is the Ratio of Males per 100 Females in Head of the Harbor?
There are 98.02 Males per 100 Females in Head of the Harbor.
What is the Ratio of Females per 100 Males in Head of the Harbor?
There are 102.02 Females per 100 Males in Head of the Harbor.
What is the Median Population Age in Head of the Harbor?
Median Population Age in Head of the Harbor is 46.8 Years.
What is the Average Family Size in Head of the Harbor
Average Family Size in Head of the Harbor is 3.3 People.
What is the Average Household Size in Head of the Harbor
Average Household Size in Head of the Harbor is 3.1 People.
How Large is the Labor Force in Head of the Harbor?
There are 859 People in the Labor Forcein in Head of the Harbor.
What is the Percentage of People in the Labor Force in Head of the Harbor?
69.8% of People are in the Labor Force in Head of the Harbor.
What is the Unemployment Rate in Head of the Harbor?
Unemployment Rate in Head of the Harbor is 2.9%.