Flower Hill, NY Map & Demographics
Flower Hill Map
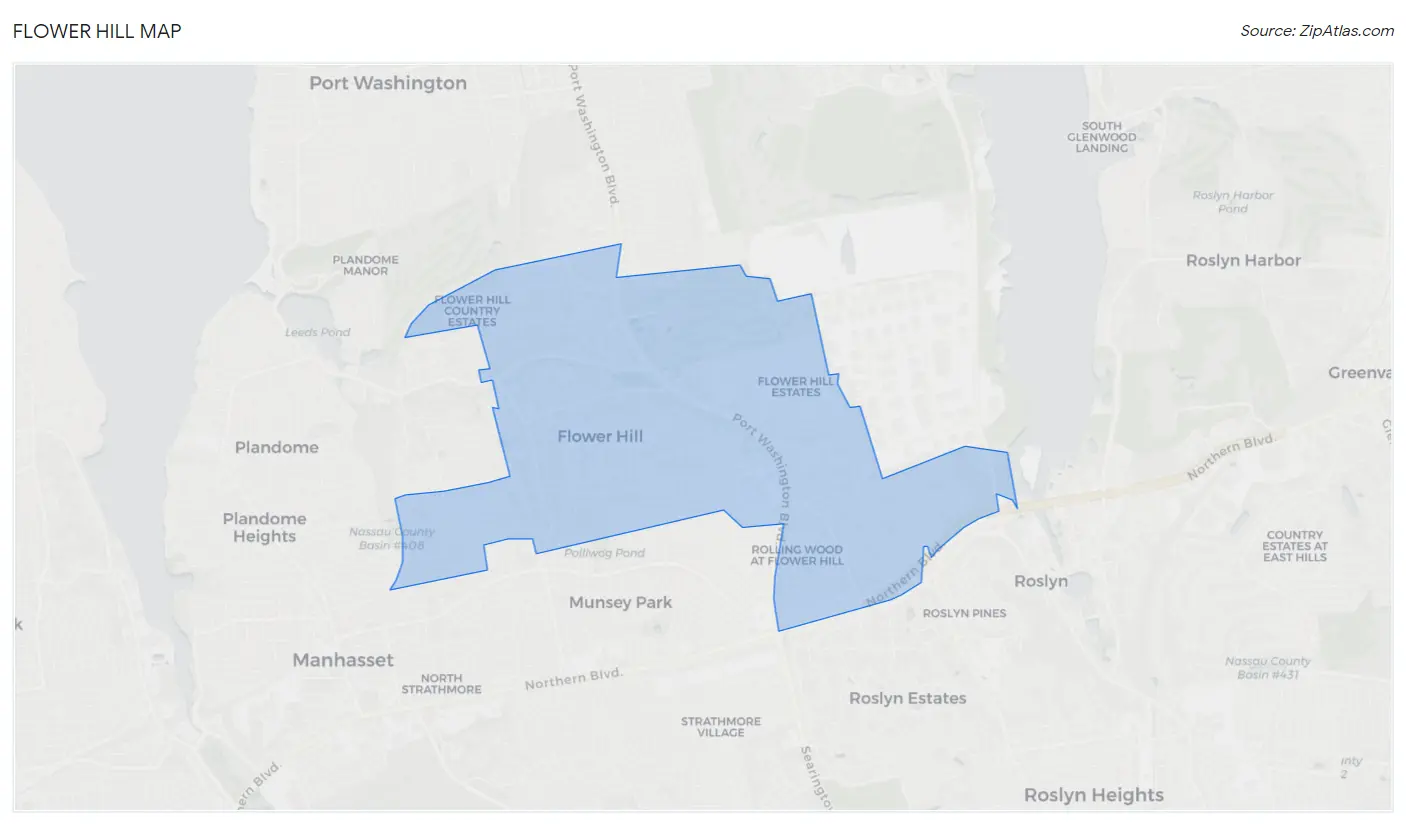
Flower Hill Overview
$127,955
PER CAPITA INCOME
$250,001
AVG FAMILY INCOME
$250,001
AVG HOUSEHOLD INCOME
62.9%
WAGE / INCOME GAP [ % ]
37.1¢/ $1
WAGE / INCOME GAP [ $ ]
0.48
INEQUALITY / GINI INDEX
4,787
TOTAL POPULATION
2,592
MALE POPULATION
2,195
FEMALE POPULATION
118.09
MALES / 100 FEMALES
84.68
FEMALES / 100 MALES
46.8
MEDIAN AGE
3.2
AVG FAMILY SIZE
3.0
AVG HOUSEHOLD SIZE
2,514
LABOR FORCE [ PEOPLE ]
65.6%
PERCENT IN LABOR FORCE
3.2%
UNEMPLOYMENT RATE
Income in Flower Hill
Income Overview in Flower Hill
Per Capita Income in Flower Hill is $127,955, while median incomes of families and households are $250,001 and $250,001 respectively.
| Characteristic | Number | Measure |
| Per Capita Income | 4,787 | $127,955 |
| Median Family Income | 1,421 | $250,001 |
| Mean Family Income | 1,421 | $393,168 |
| Median Household Income | 1,604 | $250,001 |
| Mean Household Income | 1,604 | $362,766 |
| Income Deficit | 1,421 | $0 |
| Wage / Income Gap (%) | 4,787 | 62.87% |
| Wage / Income Gap ($) | 4,787 | 37.13¢ per $1 |
| Gini / Inequality Index | 4,787 | 0.48 |
Earnings by Sex in Flower Hill
Average Earnings in Flower Hill are $130,357, $221,250 for men and $82,159 for women, a difference of 62.9%.
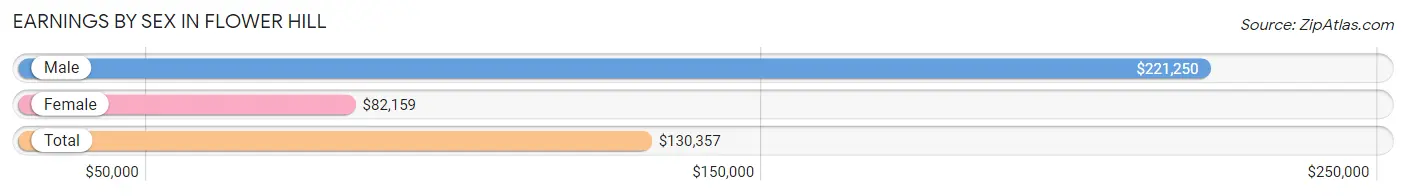
| Sex | Number | Average Earnings |
| Male | 1,614 (62.0%) | $221,250 |
| Female | 988 (38.0%) | $82,159 |
| Total | 2,602 (100.0%) | $130,357 |
Earnings by Sex by Income Bracket in Flower Hill
The most common earnings brackets in Flower Hill are $100,000+ for men (1,044 | 64.7%) and $100,000+ for women (419 | 42.4%).
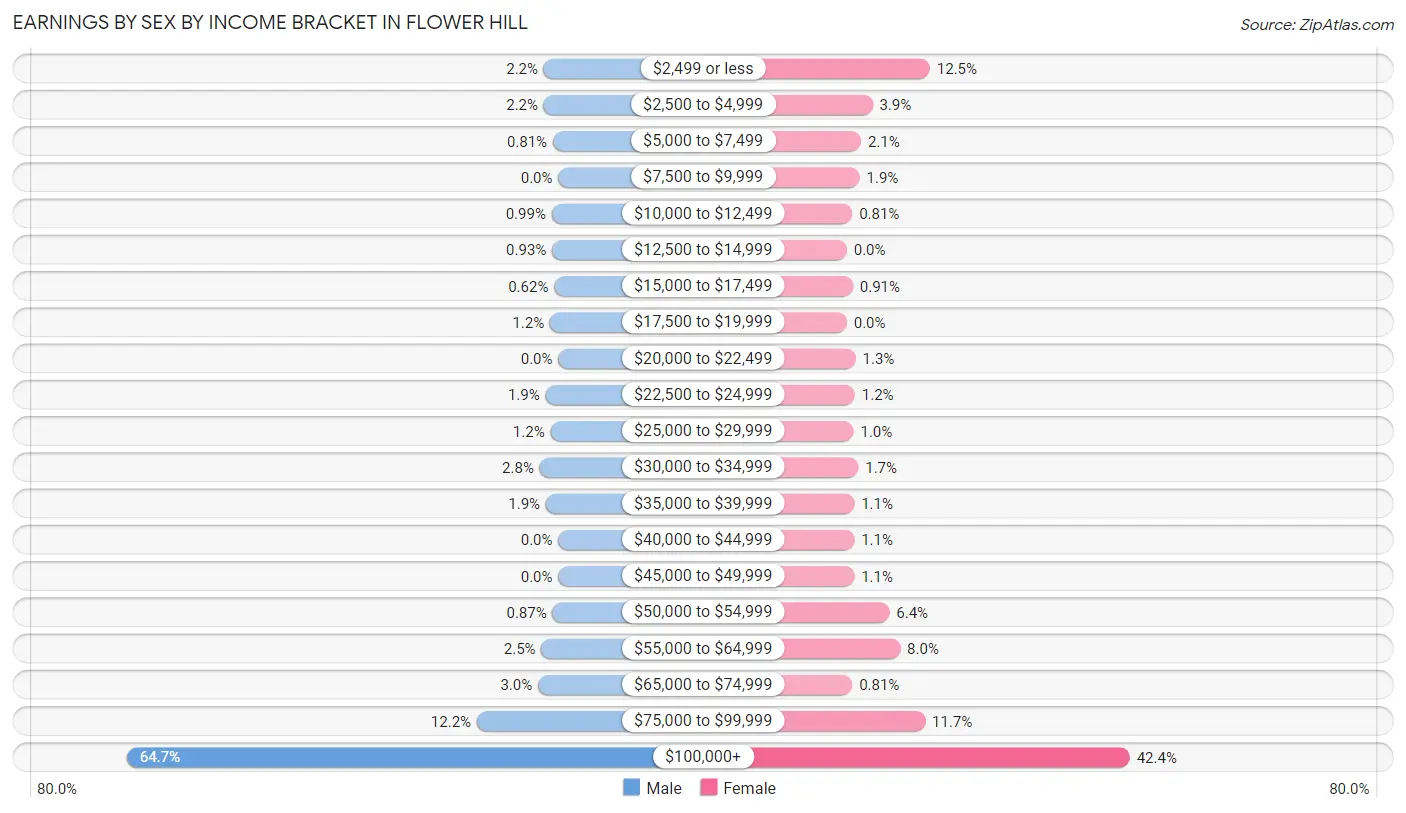
| Income | Male | Female |
| $2,499 or less | 35 (2.2%) | 123 (12.4%) |
| $2,500 to $4,999 | 35 (2.2%) | 38 (3.8%) |
| $5,000 to $7,499 | 13 (0.8%) | 21 (2.1%) |
| $7,500 to $9,999 | 0 (0.0%) | 19 (1.9%) |
| $10,000 to $12,499 | 16 (1.0%) | 8 (0.8%) |
| $12,500 to $14,999 | 15 (0.9%) | 0 (0.0%) |
| $15,000 to $17,499 | 10 (0.6%) | 9 (0.9%) |
| $17,500 to $19,999 | 20 (1.2%) | 0 (0.0%) |
| $20,000 to $22,499 | 0 (0.0%) | 13 (1.3%) |
| $22,500 to $24,999 | 31 (1.9%) | 12 (1.2%) |
| $25,000 to $29,999 | 19 (1.2%) | 10 (1.0%) |
| $30,000 to $34,999 | 45 (2.8%) | 17 (1.7%) |
| $35,000 to $39,999 | 30 (1.9%) | 11 (1.1%) |
| $40,000 to $44,999 | 0 (0.0%) | 11 (1.1%) |
| $45,000 to $49,999 | 0 (0.0%) | 11 (1.1%) |
| $50,000 to $54,999 | 14 (0.9%) | 63 (6.4%) |
| $55,000 to $64,999 | 41 (2.5%) | 79 (8.0%) |
| $65,000 to $74,999 | 49 (3.0%) | 8 (0.8%) |
| $75,000 to $99,999 | 197 (12.2%) | 116 (11.7%) |
| $100,000+ | 1,044 (64.7%) | 419 (42.4%) |
| Total | 1,614 (100.0%) | 988 (100.0%) |
Earnings by Sex by Educational Attainment in Flower Hill
Average earnings in Flower Hill are $250,001 for men and $105,577 for women, a difference of 57.8%. Men with an educational attainment of graduate degree enjoy the highest average annual earnings of $250,001, while those with college or associate's degree education earn the least with $76,023. Women with an educational attainment of bachelor's degree earn the most with the average annual earnings of $118,750, while those with high school diploma education have the smallest earnings of $23,438.
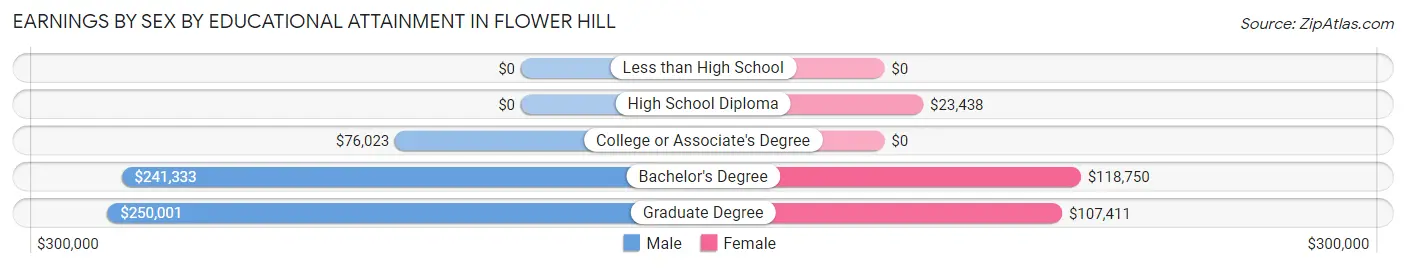
| Educational Attainment | Male Income | Female Income |
| Less than High School | - | - |
| High School Diploma | - | - |
| College or Associate's Degree | $76,023 | $0 |
| Bachelor's Degree | $241,333 | $118,750 |
| Graduate Degree | $250,001 | $107,411 |
| Total | $250,001 | $105,577 |
Family Income in Flower Hill
Family Income Brackets in Flower Hill
According to the Flower Hill family income data, there are 936 families falling into the $200,000+ income range, which is the most common income bracket and makes up 65.9% of all families.
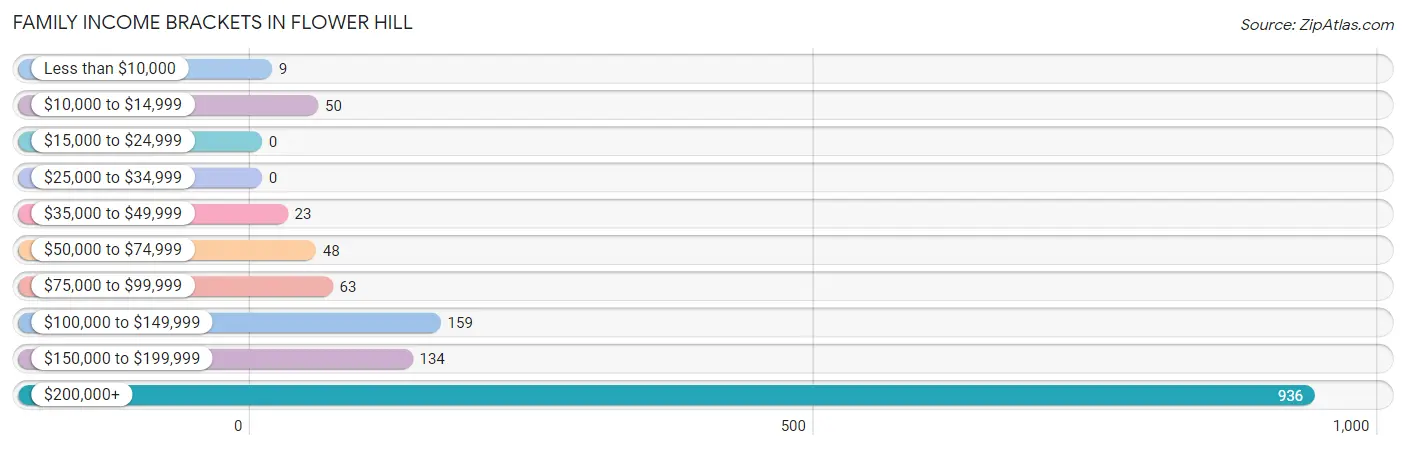
| Income Bracket | # Families | % Families |
| Less than $10,000 | 9 | 0.6% |
| $10,000 to $14,999 | 50 | 3.5% |
| $15,000 to $24,999 | 0 | 0.0% |
| $25,000 to $34,999 | 0 | 0.0% |
| $35,000 to $49,999 | 23 | 1.6% |
| $50,000 to $74,999 | 48 | 3.4% |
| $75,000 to $99,999 | 63 | 4.4% |
| $100,000 to $149,999 | 159 | 11.2% |
| $150,000 to $199,999 | 134 | 9.4% |
| $200,000+ | 936 | 65.9% |
Family Income by Famaliy Size in Flower Hill
3-person families (310 | 21.8%) account for the highest median family income in Flower Hill with $250,001 per family, while 2-person families (619 | 43.6%) have the highest median income of $111,648 per family member.
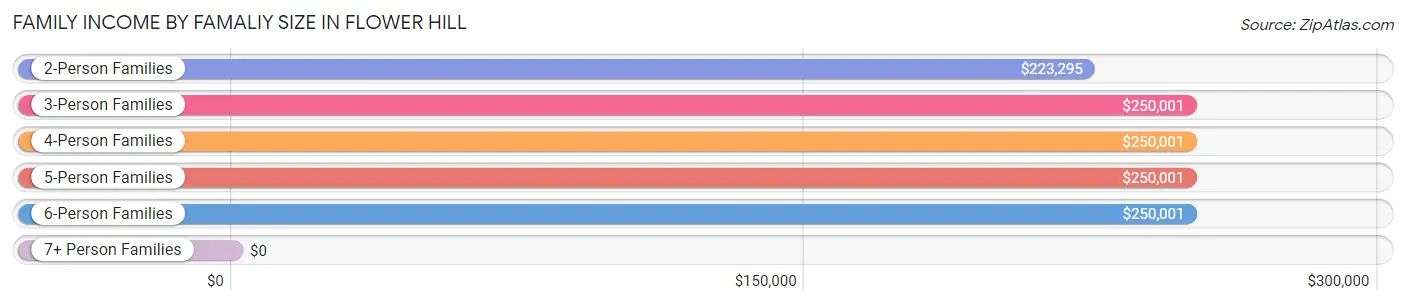
| Income Bracket | # Families | Median Income |
| 2-Person Families | 619 (43.6%) | $223,295 |
| 3-Person Families | 310 (21.8%) | $250,001 |
| 4-Person Families | 355 (25.0%) | $250,001 |
| 5-Person Families | 98 (6.9%) | $250,001 |
| 6-Person Families | 39 (2.7%) | $250,001 |
| 7+ Person Families | 0 (0.0%) | $0 |
| Total | 1,421 (100.0%) | $250,001 |
Family Income by Number of Earners in Flower Hill
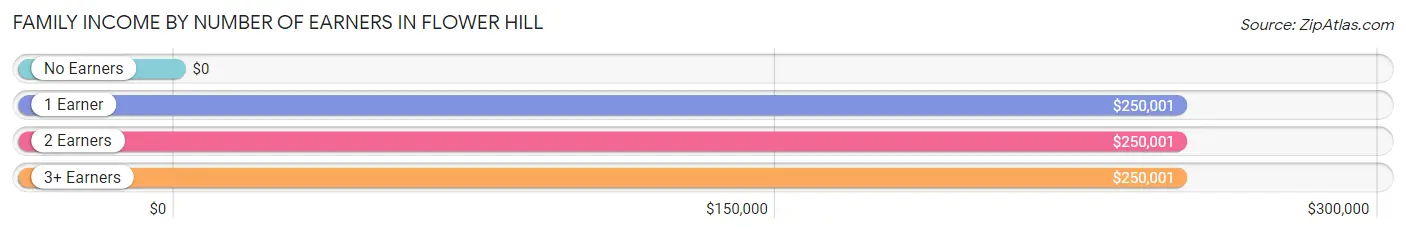
| Number of Earners | # Families | Median Income |
| No Earners | 119 (8.4%) | $0 |
| 1 Earner | 446 (31.4%) | $250,001 |
| 2 Earners | 672 (47.3%) | $250,001 |
| 3+ Earners | 184 (13.0%) | $250,001 |
| Total | 1,421 (100.0%) | $250,001 |
Household Income in Flower Hill
Household Income Brackets in Flower Hill
With 950 households falling in the category, the $200,000+ income range is the most frequent in Flower Hill, accounting for 59.2% of all households. In contrast, only 13 households (0.8%) fall into the $15,000 to $24,999 income bracket, making it the least populous group.
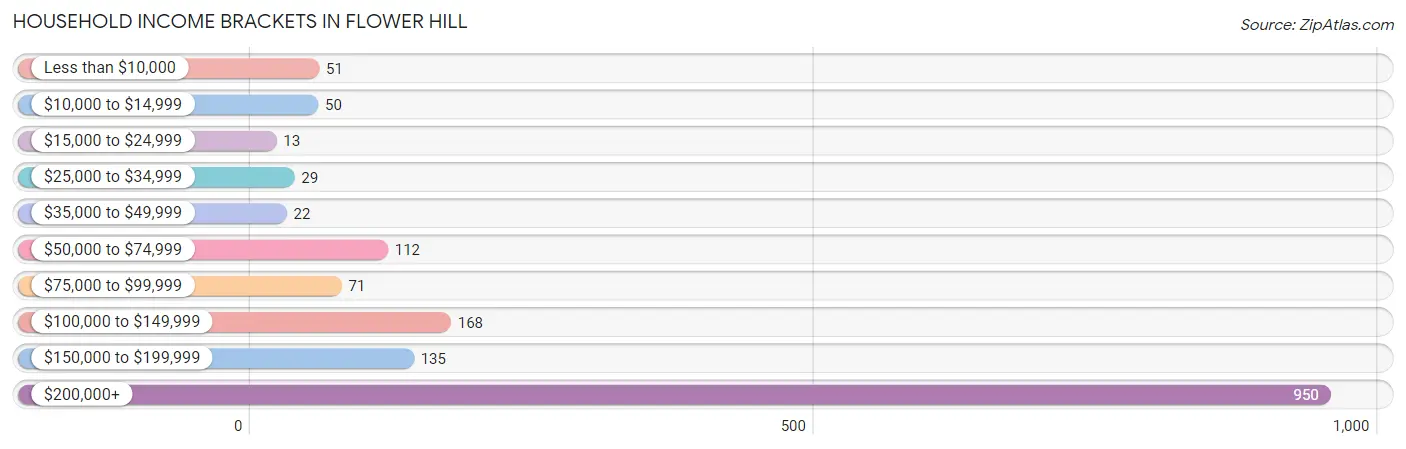
| Income Bracket | # Households | % Households |
| Less than $10,000 | 51 | 3.2% |
| $10,000 to $14,999 | 50 | 3.1% |
| $15,000 to $24,999 | 13 | 0.8% |
| $25,000 to $34,999 | 29 | 1.8% |
| $35,000 to $49,999 | 22 | 1.4% |
| $50,000 to $74,999 | 112 | 7.0% |
| $75,000 to $99,999 | 71 | 4.4% |
| $100,000 to $149,999 | 168 | 10.5% |
| $150,000 to $199,999 | 135 | 8.4% |
| $200,000+ | 950 | 59.2% |
Household Income by Householder Age in Flower Hill
The median household income in Flower Hill is $250,001, with the highest median household income of $250,001 found in the 25 to 44 years age bracket for the primary householder. A total of 293 households (18.3%) fall into this category.
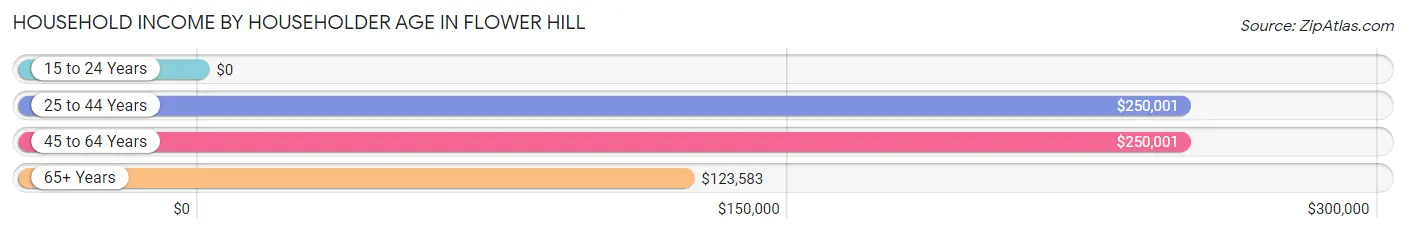
| Income Bracket | # Households | Median Income |
| 15 to 24 Years | 0 (0.0%) | $0 |
| 25 to 44 Years | 293 (18.3%) | $250,001 |
| 45 to 64 Years | 902 (56.2%) | $250,001 |
| 65+ Years | 409 (25.5%) | $123,583 |
| Total | 1,604 (100.0%) | $250,001 |
Poverty in Flower Hill
Income Below Poverty by Sex and Age in Flower Hill
With 3.2% poverty level for males and 4.8% for females among the residents of Flower Hill, 75 year old and over males and 75 year old and over females are the most vulnerable to poverty, with 51 males (34.5%) and 59 females (39.3%) in their respective age groups living below the poverty level.
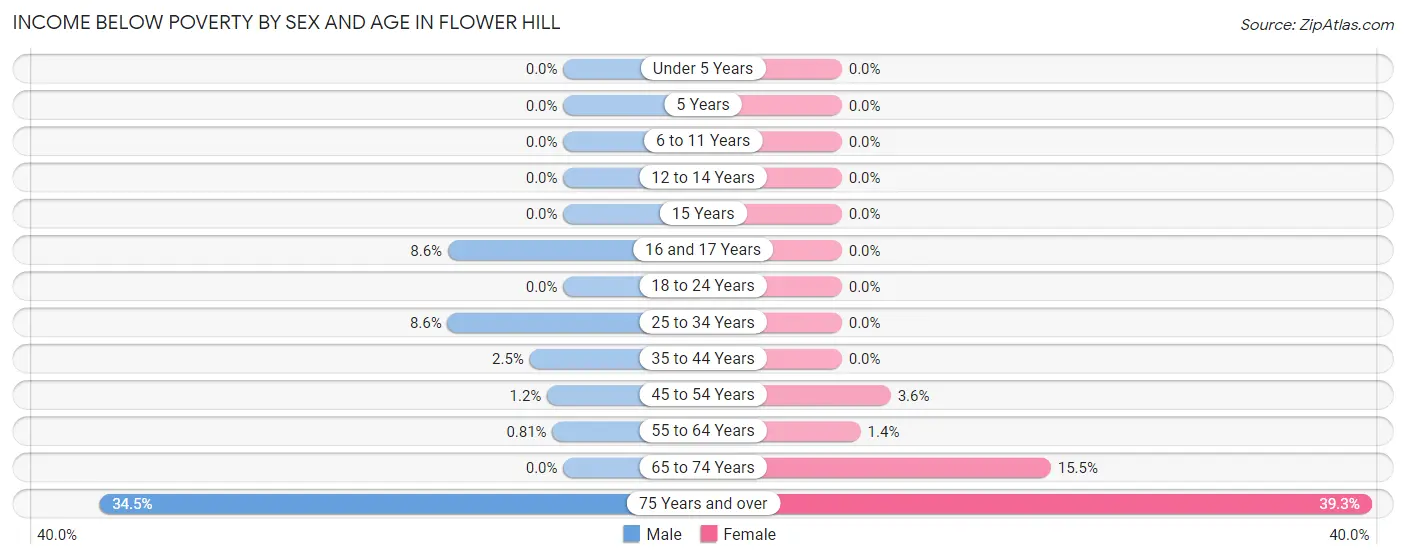
| Age Bracket | Male | Female |
| Under 5 Years | 0 (0.0%) | 0 (0.0%) |
| 5 Years | 0 (0.0%) | 0 (0.0%) |
| 6 to 11 Years | 0 (0.0%) | 0 (0.0%) |
| 12 to 14 Years | 0 (0.0%) | 0 (0.0%) |
| 15 Years | 0 (0.0%) | 0 (0.0%) |
| 16 and 17 Years | 9 (8.6%) | 0 (0.0%) |
| 18 to 24 Years | 0 (0.0%) | 0 (0.0%) |
| 25 to 34 Years | 8 (8.6%) | 0 (0.0%) |
| 35 to 44 Years | 6 (2.5%) | 0 (0.0%) |
| 45 to 54 Years | 6 (1.2%) | 14 (3.6%) |
| 55 to 64 Years | 4 (0.8%) | 6 (1.4%) |
| 65 to 74 Years | 0 (0.0%) | 27 (15.5%) |
| 75 Years and over | 51 (34.5%) | 59 (39.3%) |
| Total | 84 (3.2%) | 106 (4.8%) |
Income Above Poverty by Sex and Age in Flower Hill
According to the poverty statistics in Flower Hill, males aged under 5 years and females aged under 5 years are the age groups that are most secure financially, with 100.0% of males and 100.0% of females in these age groups living above the poverty line.
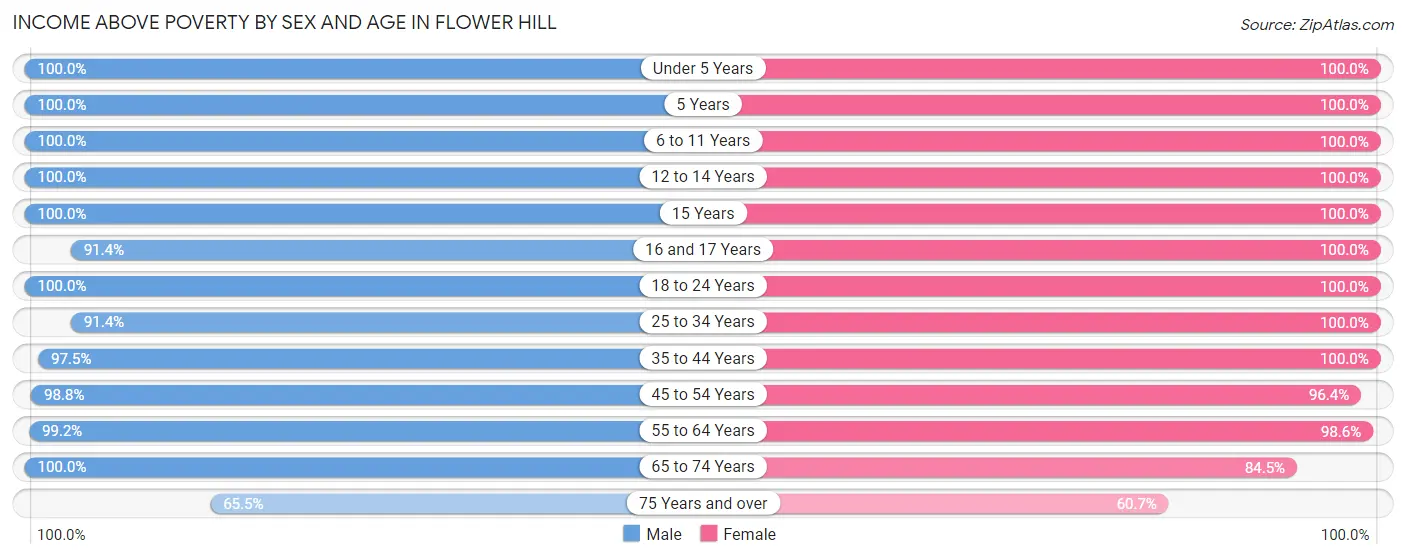
| Age Bracket | Male | Female |
| Under 5 Years | 30 (100.0%) | 104 (100.0%) |
| 5 Years | 121 (100.0%) | 7 (100.0%) |
| 6 to 11 Years | 226 (100.0%) | 173 (100.0%) |
| 12 to 14 Years | 158 (100.0%) | 70 (100.0%) |
| 15 Years | 32 (100.0%) | 33 (100.0%) |
| 16 and 17 Years | 96 (91.4%) | 158 (100.0%) |
| 18 to 24 Years | 269 (100.0%) | 134 (100.0%) |
| 25 to 34 Years | 85 (91.4%) | 35 (100.0%) |
| 35 to 44 Years | 234 (97.5%) | 342 (100.0%) |
| 45 to 54 Years | 496 (98.8%) | 372 (96.4%) |
| 55 to 64 Years | 490 (99.2%) | 423 (98.6%) |
| 65 to 74 Years | 174 (100.0%) | 147 (84.5%) |
| 75 Years and over | 97 (65.5%) | 91 (60.7%) |
| Total | 2,508 (96.8%) | 2,089 (95.2%) |
Income Below Poverty Among Married-Couple Families in Flower Hill
The poverty statistics for married-couple families in Flower Hill show that 3.9% or 50 of the total 1,296 families live below the poverty line. Families with no children have the highest poverty rate of 7.1%, comprising of 50 families. On the other hand, families with 1 or 2 children have the lowest poverty rate of 0.0%, which includes 0 families.
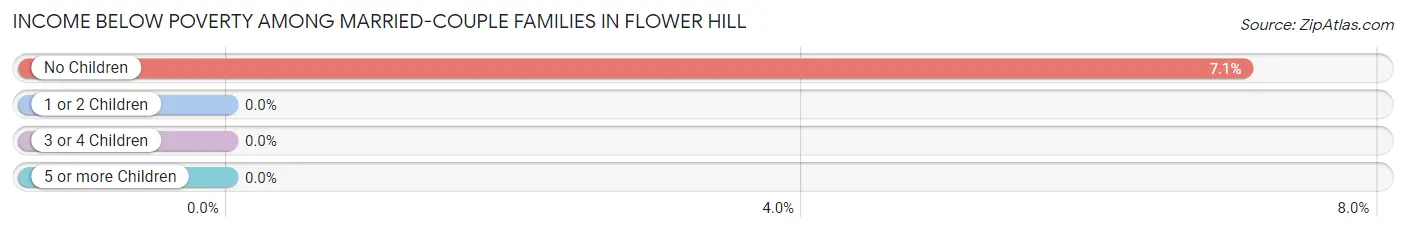
| Children | Above Poverty | Below Poverty |
| No Children | 657 (92.9%) | 50 (7.1%) |
| 1 or 2 Children | 511 (100.0%) | 0 (0.0%) |
| 3 or 4 Children | 78 (100.0%) | 0 (0.0%) |
| 5 or more Children | 0 (0.0%) | 0 (0.0%) |
| Total | 1,246 (96.1%) | 50 (3.9%) |
Income Below Poverty Among Single-Parent Households in Flower Hill
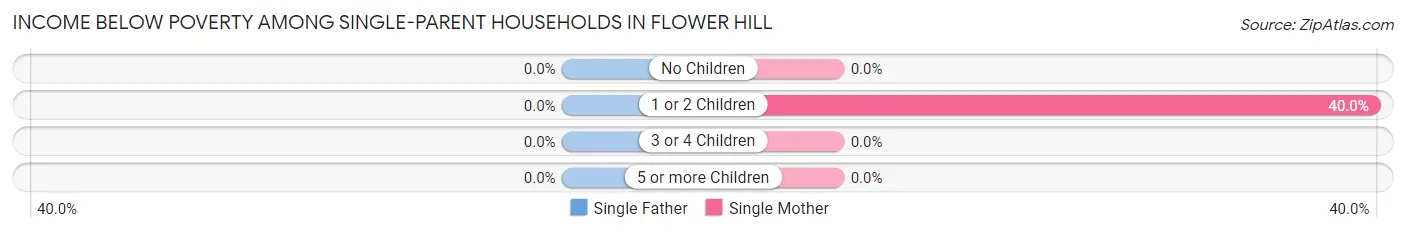
| Children | Single Father | Single Mother |
| No Children | 0 (0.0%) | 0 (0.0%) |
| 1 or 2 Children | 0 (0.0%) | 8 (40.0%) |
| 3 or 4 Children | 0 (0.0%) | 0 (0.0%) |
| 5 or more Children | 0 (0.0%) | 0 (0.0%) |
| Total | 0 (0.0%) | 8 (13.3%) |
Income Below Poverty Among Married-Couple vs Single-Parent Households in Flower Hill
The poverty data for Flower Hill shows that 50 of the married-couple family households (3.9%) and 8 of the single-parent households (6.4%) are living below the poverty level. Within the married-couple family households, those with no children have the highest poverty rate, with 50 households (7.1%) falling below the poverty line. Among the single-parent households, those with 1 or 2 children have the highest poverty rate, with 8 household (19.5%) living below poverty.
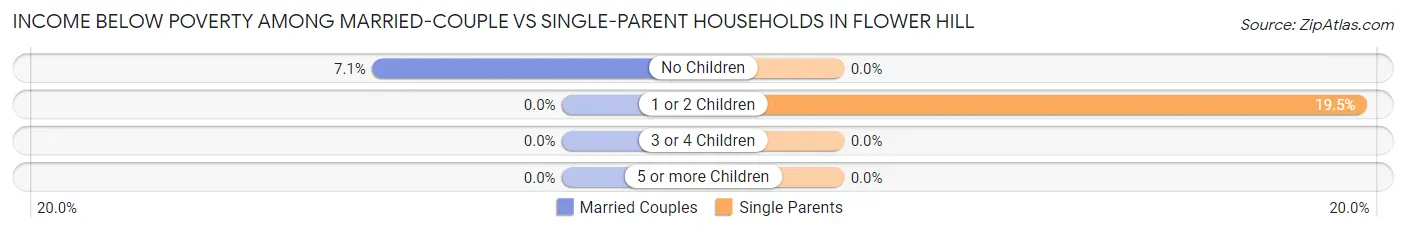
| Children | Married-Couple Families | Single-Parent Households |
| No Children | 50 (7.1%) | 0 (0.0%) |
| 1 or 2 Children | 0 (0.0%) | 8 (19.5%) |
| 3 or 4 Children | 0 (0.0%) | 0 (0.0%) |
| 5 or more Children | 0 (0.0%) | 0 (0.0%) |
| Total | 50 (3.9%) | 8 (6.4%) |
Race in Flower Hill
The most populous races in Flower Hill are White / Caucasian (3,705 | 77.4%), Asian (605 | 12.6%), and Hispanic or Latino (488 | 10.2%).
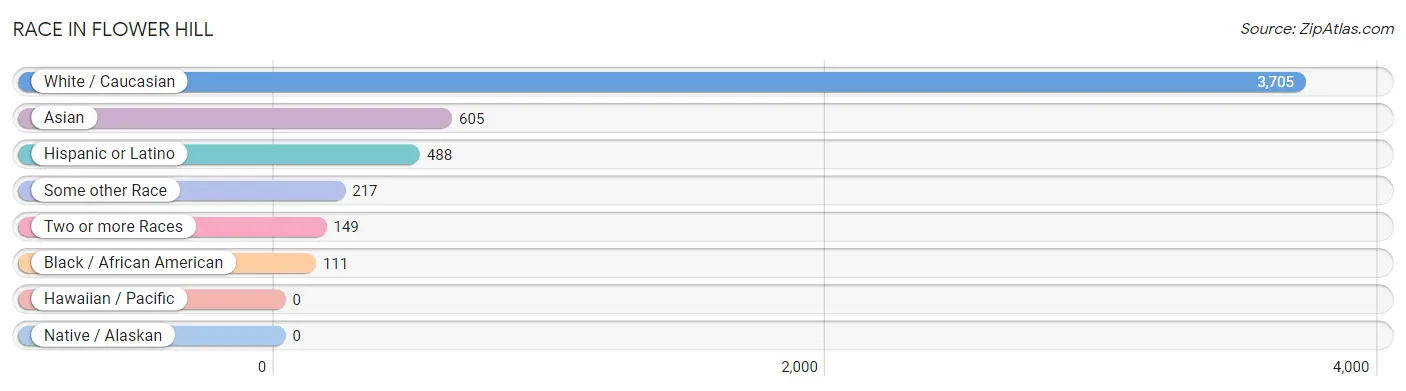
| Race | # Population | % Population |
| Asian | 605 | 12.6% |
| Black / African American | 111 | 2.3% |
| Hawaiian / Pacific | 0 | 0.0% |
| Hispanic or Latino | 488 | 10.2% |
| Native / Alaskan | 0 | 0.0% |
| White / Caucasian | 3,705 | 77.4% |
| Two or more Races | 149 | 3.1% |
| Some other Race | 217 | 4.5% |
| Total | 4,787 | 100.0% |
Ancestry in Flower Hill
The most populous ancestries reported in Flower Hill are Italian (1,053 | 22.0%), Irish (686 | 14.3%), Polish (428 | 8.9%), German (412 | 8.6%), and Indian (Asian) (382 | 8.0%), together accounting for 61.9% of all Flower Hill residents.
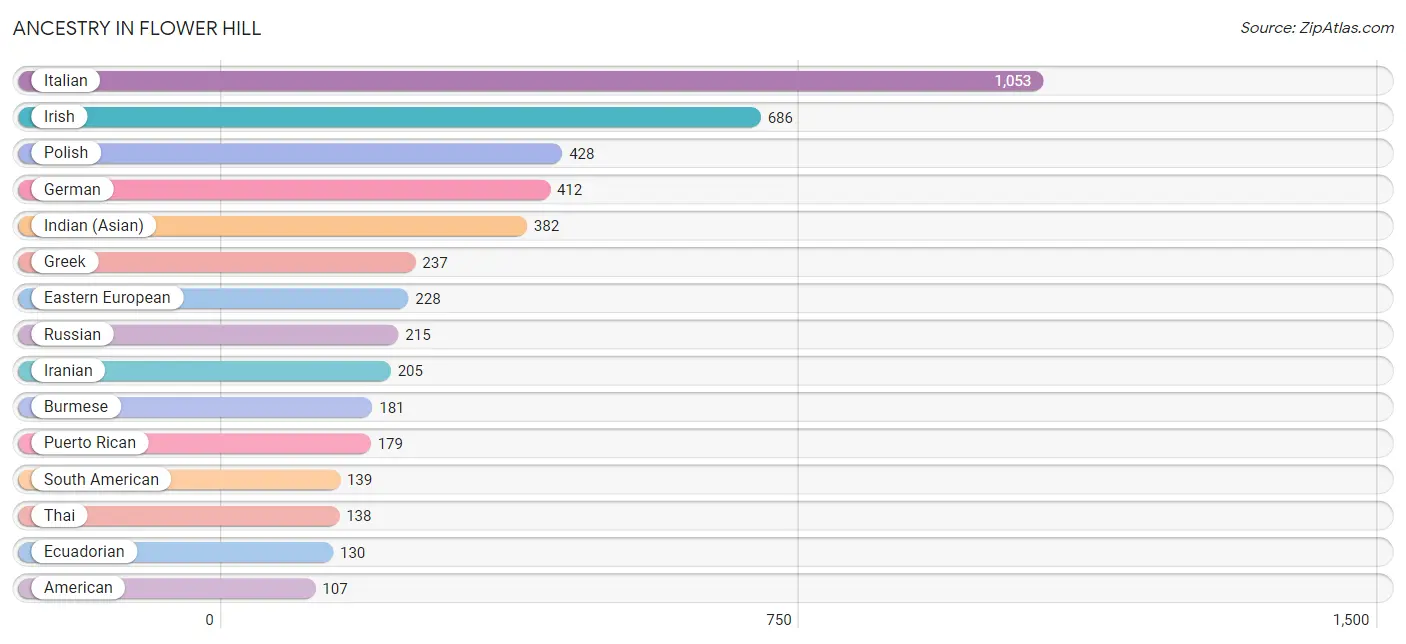
| Ancestry | # Population | % Population |
| American | 107 | 2.2% |
| Arab | 61 | 1.3% |
| Australian | 29 | 0.6% |
| Austrian | 105 | 2.2% |
| Bhutanese | 23 | 0.5% |
| Brazilian | 30 | 0.6% |
| British | 29 | 0.6% |
| Bulgarian | 9 | 0.2% |
| Burmese | 181 | 3.8% |
| Colombian | 9 | 0.2% |
| Croatian | 11 | 0.2% |
| Czech | 20 | 0.4% |
| Danish | 10 | 0.2% |
| Dominican | 40 | 0.8% |
| Eastern European | 228 | 4.8% |
| Ecuadorian | 130 | 2.7% |
| English | 56 | 1.2% |
| European | 33 | 0.7% |
| Finnish | 13 | 0.3% |
| French | 22 | 0.5% |
| German | 412 | 8.6% |
| Greek | 237 | 5.0% |
| Guyanese | 18 | 0.4% |
| Hungarian | 29 | 0.6% |
| Indian (Asian) | 382 | 8.0% |
| Iranian | 205 | 4.3% |
| Irish | 686 | 14.3% |
| Italian | 1,053 | 22.0% |
| Jamaican | 16 | 0.3% |
| Korean | 16 | 0.3% |
| Lithuanian | 51 | 1.1% |
| Mexican | 94 | 2.0% |
| Norwegian | 16 | 0.3% |
| Polish | 428 | 8.9% |
| Puerto Rican | 179 | 3.7% |
| Romanian | 95 | 2.0% |
| Russian | 215 | 4.5% |
| Scotch-Irish | 40 | 0.8% |
| Scottish | 12 | 0.3% |
| Slovak | 11 | 0.2% |
| South American | 139 | 2.9% |
| Swedish | 12 | 0.3% |
| Syrian | 28 | 0.6% |
| Thai | 138 | 2.9% |
| Trinidadian and Tobagonian | 26 | 0.5% |
| West Indian | 23 | 0.5% | View All 46 Rows |
Immigrants in Flower Hill
The most numerous immigrant groups reported in Flower Hill came from Asia (383 | 8.0%), Eastern Asia (243 | 5.1%), Europe (148 | 3.1%), South Central Asia (131 | 2.7%), and China (124 | 2.6%), together accounting for 21.5% of all Flower Hill residents.
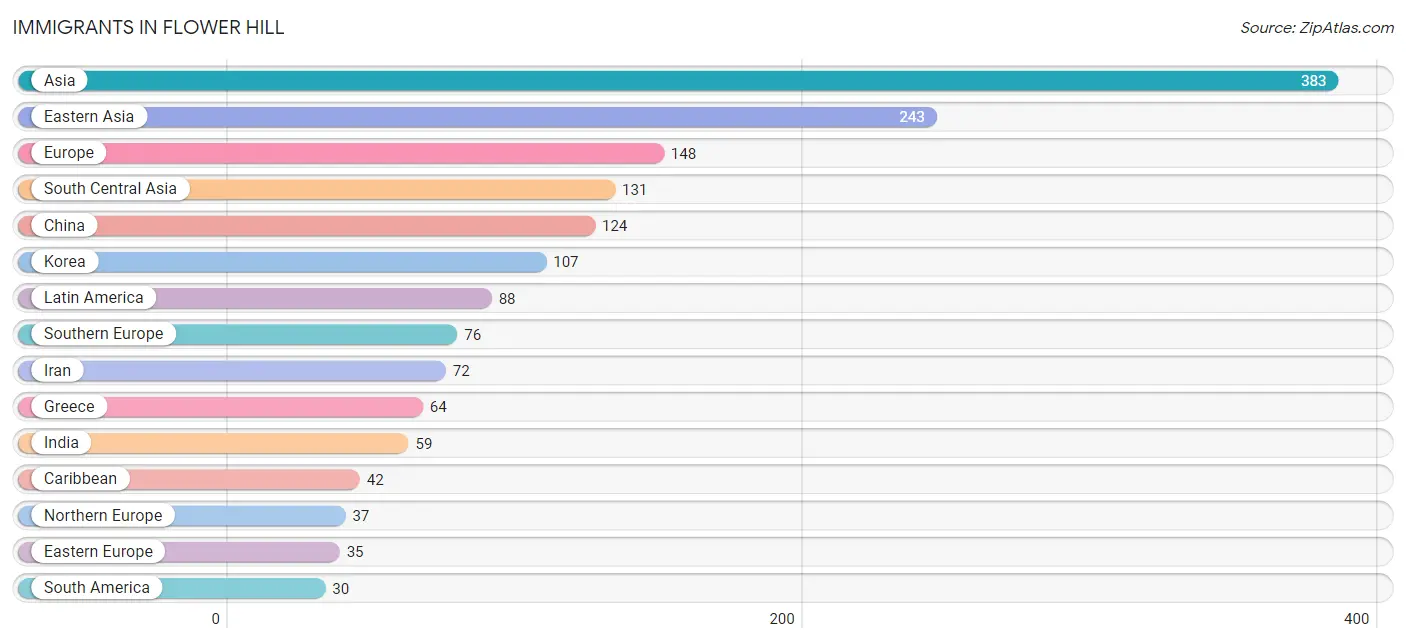
| Immigration Origin | # Population | % Population |
| Africa | 10 | 0.2% |
| Asia | 383 | 8.0% |
| Brazil | 12 | 0.3% |
| Bulgaria | 9 | 0.2% |
| Canada | 9 | 0.2% |
| Caribbean | 42 | 0.9% |
| Central America | 16 | 0.3% |
| China | 124 | 2.6% |
| Colombia | 9 | 0.2% |
| Eastern Asia | 243 | 5.1% |
| Eastern Europe | 35 | 0.7% |
| England | 13 | 0.3% |
| Europe | 148 | 3.1% |
| Greece | 64 | 1.3% |
| Guyana | 9 | 0.2% |
| Hong Kong | 23 | 0.5% |
| India | 59 | 1.2% |
| Iran | 72 | 1.5% |
| Ireland | 24 | 0.5% |
| Italy | 12 | 0.3% |
| Jamaica | 16 | 0.3% |
| Japan | 12 | 0.3% |
| Korea | 107 | 2.2% |
| Latin America | 88 | 1.8% |
| Mexico | 16 | 0.3% |
| Nigeria | 10 | 0.2% |
| Northern Europe | 37 | 0.8% |
| Poland | 12 | 0.3% |
| Russia | 14 | 0.3% |
| South America | 30 | 0.6% |
| South Central Asia | 131 | 2.7% |
| Southern Europe | 76 | 1.6% |
| Taiwan | 27 | 0.6% |
| Trinidad and Tobago | 26 | 0.5% |
| Western Africa | 10 | 0.2% |
| Western Asia | 9 | 0.2% | View All 36 Rows |
Sex and Age in Flower Hill
Sex and Age in Flower Hill
The most populous age groups in Flower Hill are 60 to 64 Years (382 | 14.7%) for men and 15 to 19 Years (230 | 10.5%) for women.
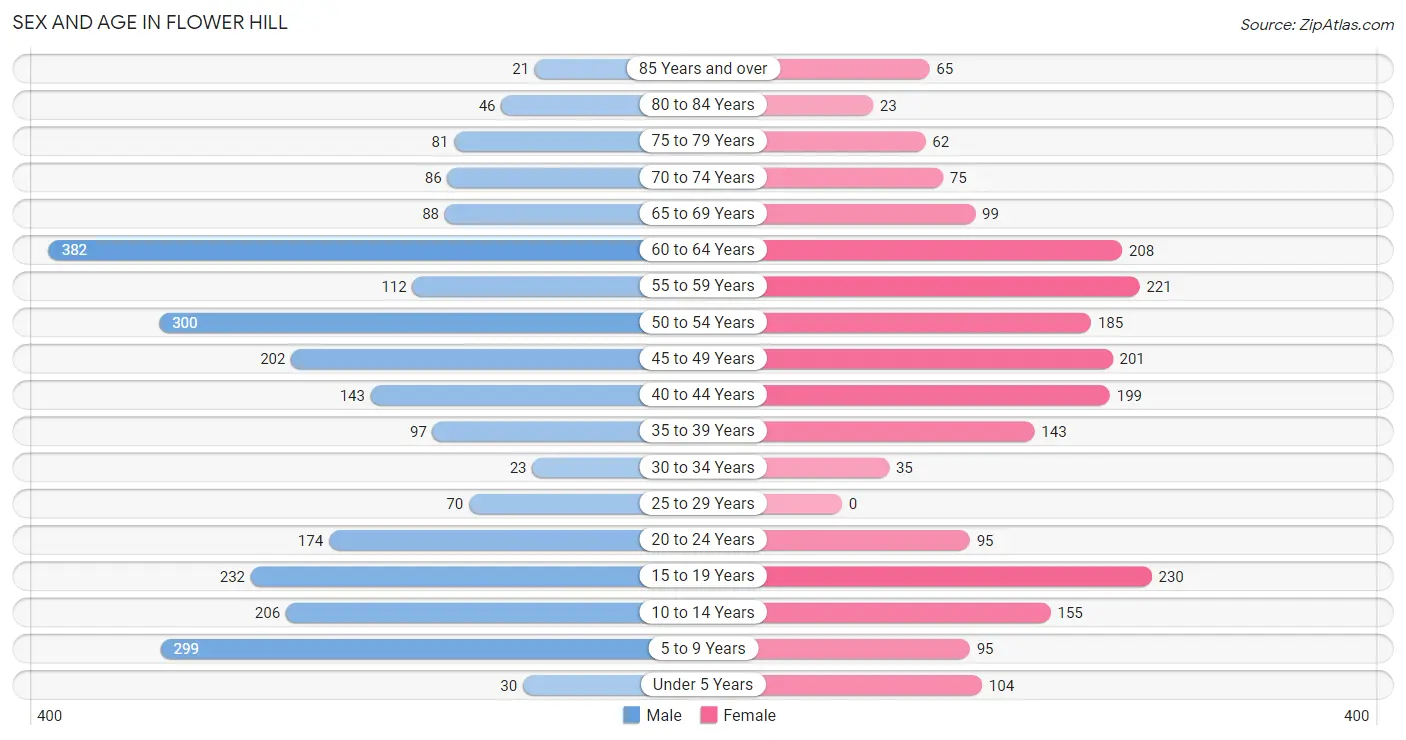
| Age Bracket | Male | Female |
| Under 5 Years | 30 (1.2%) | 104 (4.7%) |
| 5 to 9 Years | 299 (11.5%) | 95 (4.3%) |
| 10 to 14 Years | 206 (8.0%) | 155 (7.1%) |
| 15 to 19 Years | 232 (8.9%) | 230 (10.5%) |
| 20 to 24 Years | 174 (6.7%) | 95 (4.3%) |
| 25 to 29 Years | 70 (2.7%) | 0 (0.0%) |
| 30 to 34 Years | 23 (0.9%) | 35 (1.6%) |
| 35 to 39 Years | 97 (3.7%) | 143 (6.5%) |
| 40 to 44 Years | 143 (5.5%) | 199 (9.1%) |
| 45 to 49 Years | 202 (7.8%) | 201 (9.2%) |
| 50 to 54 Years | 300 (11.6%) | 185 (8.4%) |
| 55 to 59 Years | 112 (4.3%) | 221 (10.1%) |
| 60 to 64 Years | 382 (14.7%) | 208 (9.5%) |
| 65 to 69 Years | 88 (3.4%) | 99 (4.5%) |
| 70 to 74 Years | 86 (3.3%) | 75 (3.4%) |
| 75 to 79 Years | 81 (3.1%) | 62 (2.8%) |
| 80 to 84 Years | 46 (1.8%) | 23 (1.1%) |
| 85 Years and over | 21 (0.8%) | 65 (3.0%) |
| Total | 2,592 (100.0%) | 2,195 (100.0%) |
Families and Households in Flower Hill
Median Family Size in Flower Hill
The median family size in Flower Hill is 3.20 persons per family, with single female/mother families (60 | 4.2%) accounting for the largest median family size of 3.33 persons per family. On the other hand, single male/father families (65 | 4.6%) represent the smallest median family size with 2.95 persons per family.
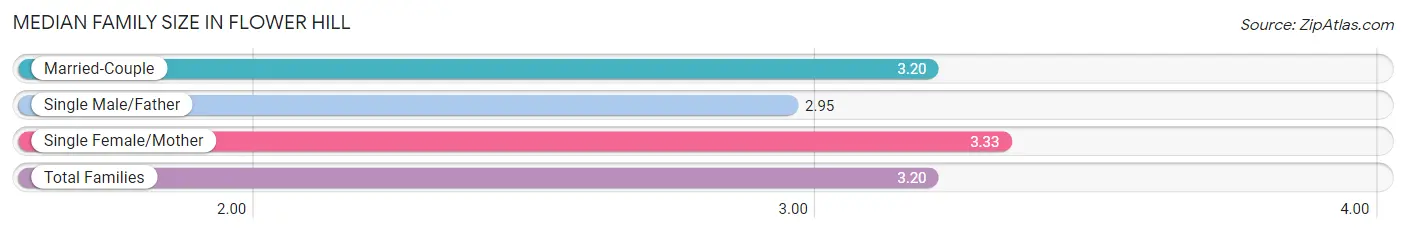
| Family Type | # Families | Family Size |
| Married-Couple | 1,296 (91.2%) | 3.20 |
| Single Male/Father | 65 (4.6%) | 2.95 |
| Single Female/Mother | 60 (4.2%) | 3.33 |
| Total Families | 1,421 (100.0%) | 3.20 |
Median Household Size in Flower Hill
The median household size in Flower Hill is 2.97 persons per household, with single female/mother households (60 | 3.7%) accounting for the largest median household size of 3.33 persons per household. non-family households (183 | 11.4%) represent the smallest median household size with 1.07 persons per household.
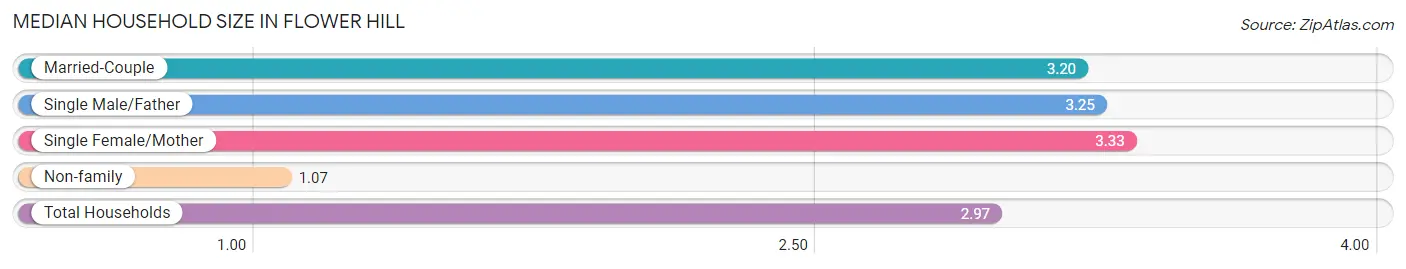
| Household Type | # Households | Household Size |
| Married-Couple | 1,296 (80.8%) | 3.20 |
| Single Male/Father | 65 (4.1%) | 3.25 |
| Single Female/Mother | 60 (3.7%) | 3.33 |
| Non-family | 183 (11.4%) | 1.07 |
| Total Households | 1,604 (100.0%) | 2.97 |
Household Size by Marriage Status in Flower Hill
Out of a total of 1,604 households in Flower Hill, 1,421 (88.6%) are family households, while 183 (11.4%) are nonfamily households. The most numerous type of family households are 2-person households, comprising 610, and the most common type of nonfamily households are 1-person households, comprising 169.
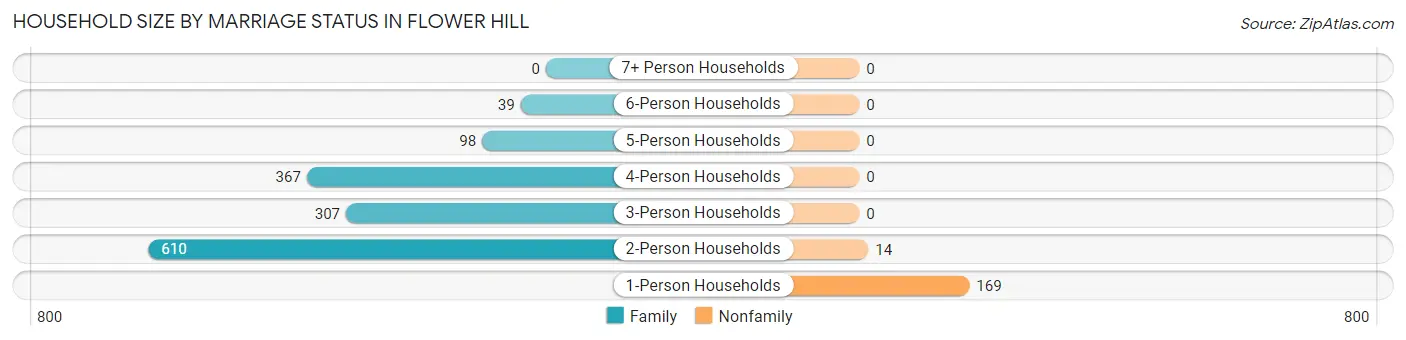
| Household Size | Family Households | Nonfamily Households |
| 1-Person Households | - | 169 (10.5%) |
| 2-Person Households | 610 (38.0%) | 14 (0.9%) |
| 3-Person Households | 307 (19.1%) | 0 (0.0%) |
| 4-Person Households | 367 (22.9%) | 0 (0.0%) |
| 5-Person Households | 98 (6.1%) | 0 (0.0%) |
| 6-Person Households | 39 (2.4%) | 0 (0.0%) |
| 7+ Person Households | 0 (0.0%) | 0 (0.0%) |
| Total | 1,421 (88.6%) | 183 (11.4%) |
Female Fertility in Flower Hill
Fertility by Age in Flower Hill
| Age Bracket | Women with Births | Births / 1,000 Women |
| 15 to 19 years | 0 (0.0%) | 0.0 |
| 20 to 34 years | 0 (0.0%) | 0.0 |
| 35 to 50 years | 0 (0.0%) | 0.0 |
| Total | 0 (0.0%) | 0.0 |
Fertility by Age by Marriage Status in Flower Hill
| Age Bracket | Married | Unmarried |
| 15 to 19 years | 0 (0.0%) | 0 (0.0%) |
| 20 to 34 years | 0 (0.0%) | 0 (0.0%) |
| 35 to 50 years | 0 (0.0%) | 0 (0.0%) |
| Total | 0 (0.0%) | 0 (0.0%) |
Fertility by Education in Flower Hill
| Educational Attainment | Women with Births | Births / 1,000 Women |
| Less than High School | 0 (0.0%) | 0.0 |
| High School Diploma | 0 (0.0%) | 0.0 |
| College or Associate's Degree | 0 (0.0%) | 0.0 |
| Bachelor's Degree | 0 (0.0%) | 0.0 |
| Graduate Degree | 0 (0.0%) | 0.0 |
| Total | 0 (0.0%) | 0.0 |
Fertility by Education by Marriage Status in Flower Hill
| Educational Attainment | Married | Unmarried |
| Less than High School | 0 (0.0%) | 0 (0.0%) |
| High School Diploma | 0 (0.0%) | 0 (0.0%) |
| College or Associate's Degree | 0 (0.0%) | 0 (0.0%) |
| Bachelor's Degree | 0 (0.0%) | 0 (0.0%) |
| Graduate Degree | 0 (0.0%) | 0 (0.0%) |
| Total | 0 (0.0%) | 0 (0.0%) |
Employment Characteristics in Flower Hill
Employment by Class of Employer in Flower Hill
Among the 2,423 employed individuals in Flower Hill, private company employees (1,898 | 78.3%), self-employed (incorporated) (195 | 8.1%), and local government employees (152 | 6.3%) make up the most common classes of employment.
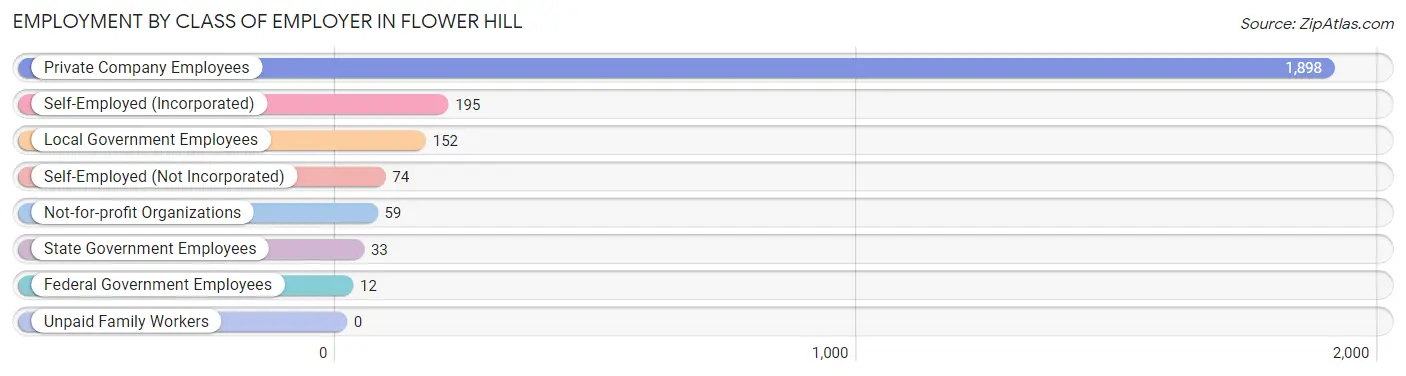
| Employer Class | # Employees | % Employees |
| Private Company Employees | 1,898 | 78.3% |
| Self-Employed (Incorporated) | 195 | 8.1% |
| Self-Employed (Not Incorporated) | 74 | 3.0% |
| Not-for-profit Organizations | 59 | 2.4% |
| Local Government Employees | 152 | 6.3% |
| State Government Employees | 33 | 1.4% |
| Federal Government Employees | 12 | 0.5% |
| Unpaid Family Workers | 0 | 0.0% |
| Total | 2,423 | 100.0% |
Employment Status by Age in Flower Hill
According to the labor force statistics for Flower Hill, out of the total population over 16 years of age (3,833), 65.6% or 2,514 individuals are in the labor force, with 3.2% or 80 of them unemployed. The age group with the highest labor force participation rate is 60 to 64 years, with 87.8% or 518 individuals in the labor force. Within the labor force, the 55 to 59 years age range has the highest percentage of unemployed individuals, with 19.5% or 48 of them being unemployed.
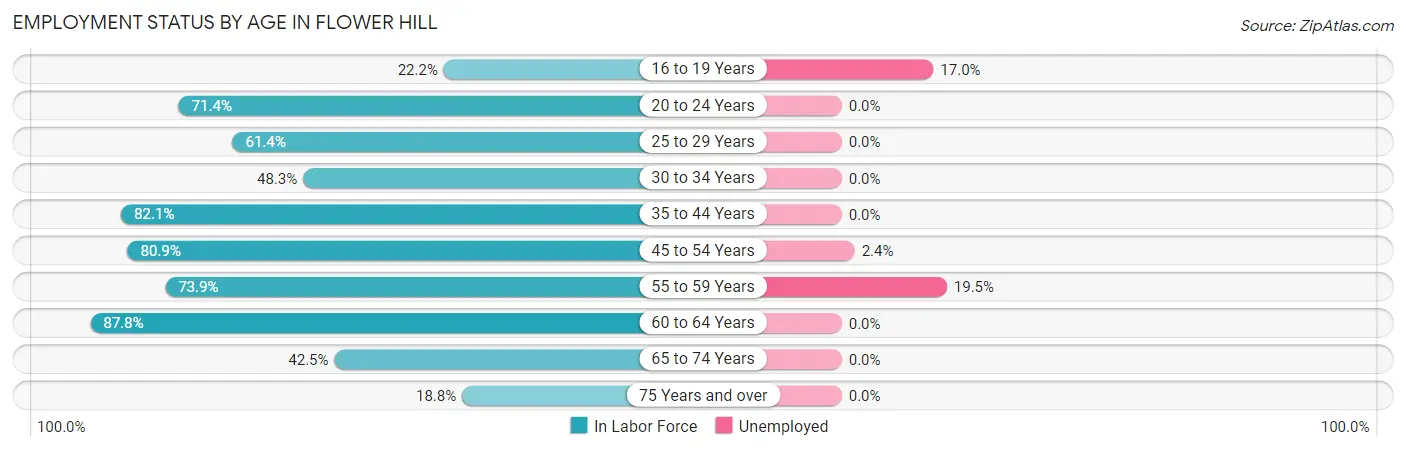
| Age Bracket | In Labor Force | Unemployed |
| 16 to 19 Years | 88 (22.2%) | 15 (17.0%) |
| 20 to 24 Years | 192 (71.4%) | 0 (0.0%) |
| 25 to 29 Years | 43 (61.4%) | 0 (0.0%) |
| 30 to 34 Years | 28 (48.3%) | 0 (0.0%) |
| 35 to 44 Years | 478 (82.1%) | 0 (0.0%) |
| 45 to 54 Years | 718 (80.9%) | 17 (2.4%) |
| 55 to 59 Years | 246 (73.9%) | 48 (19.5%) |
| 60 to 64 Years | 518 (87.8%) | 0 (0.0%) |
| 65 to 74 Years | 148 (42.5%) | 0 (0.0%) |
| 75 Years and over | 56 (18.8%) | 0 (0.0%) |
| Total | 2,514 (65.6%) | 80 (3.2%) |
Employment Status by Educational Attainment in Flower Hill
According to labor force statistics for Flower Hill, 80.6% of individuals (2,032) out of the total population between 25 and 64 years of age (2,521) are in the labor force, with 3.2% or 65 of them being unemployed. The group with the highest labor force participation rate are those with the educational attainment of bachelor's degree or higher, with 83.7% or 1,753 individuals in the labor force. Within the labor force, individuals with bachelor's degree or higher education have the highest percentage of unemployment, with 3.7% or 65 of them being unemployed.
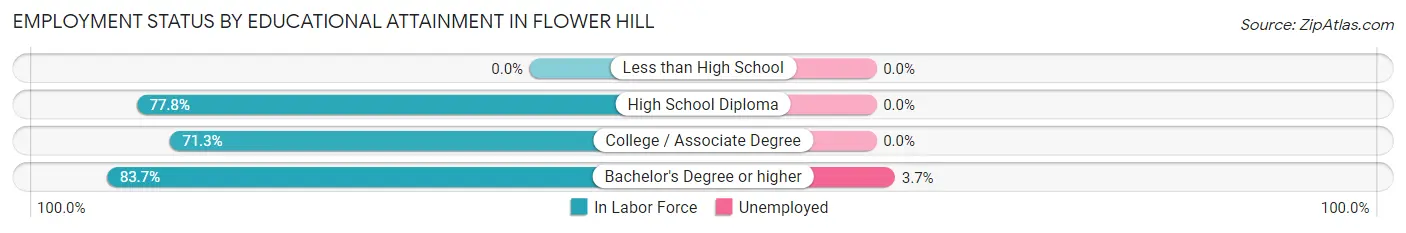
| Educational Attainment | In Labor Force | Unemployed |
| Less than High School | 0 (0.0%) | 0 (0.0%) |
| High School Diploma | 130 (77.8%) | 0 (0.0%) |
| College / Associate Degree | 149 (71.3%) | 0 (0.0%) |
| Bachelor's Degree or higher | 1,753 (83.7%) | 77 (3.7%) |
| Total | 2,032 (80.6%) | 81 (3.2%) |
Employment Occupations by Sex in Flower Hill
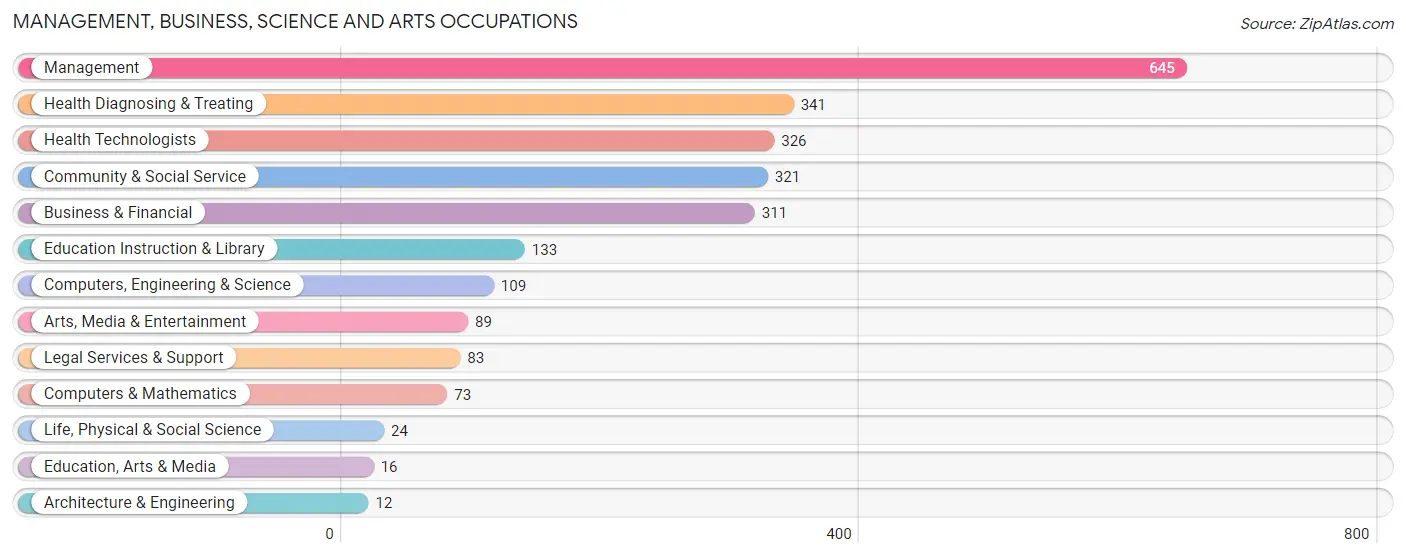
Management, Business, Science and Arts Occupations
The most common Management, Business, Science and Arts occupations in Flower Hill are Management (645 | 26.5%), Health Diagnosing & Treating (341 | 14.0%), Health Technologists (326 | 13.4%), Community & Social Service (321 | 13.2%), and Business & Financial (311 | 12.8%).
Management, Business, Science and Arts Occupations by Sex
Within the Management, Business, Science and Arts occupations in Flower Hill, the most male-oriented occupations are Architecture & Engineering (100.0%), Management (89.1%), and Computers & Mathematics (89.0%), while the most female-oriented occupations are Education, Arts & Media (100.0%), Arts, Media & Entertainment (100.0%), and Education Instruction & Library (74.4%).
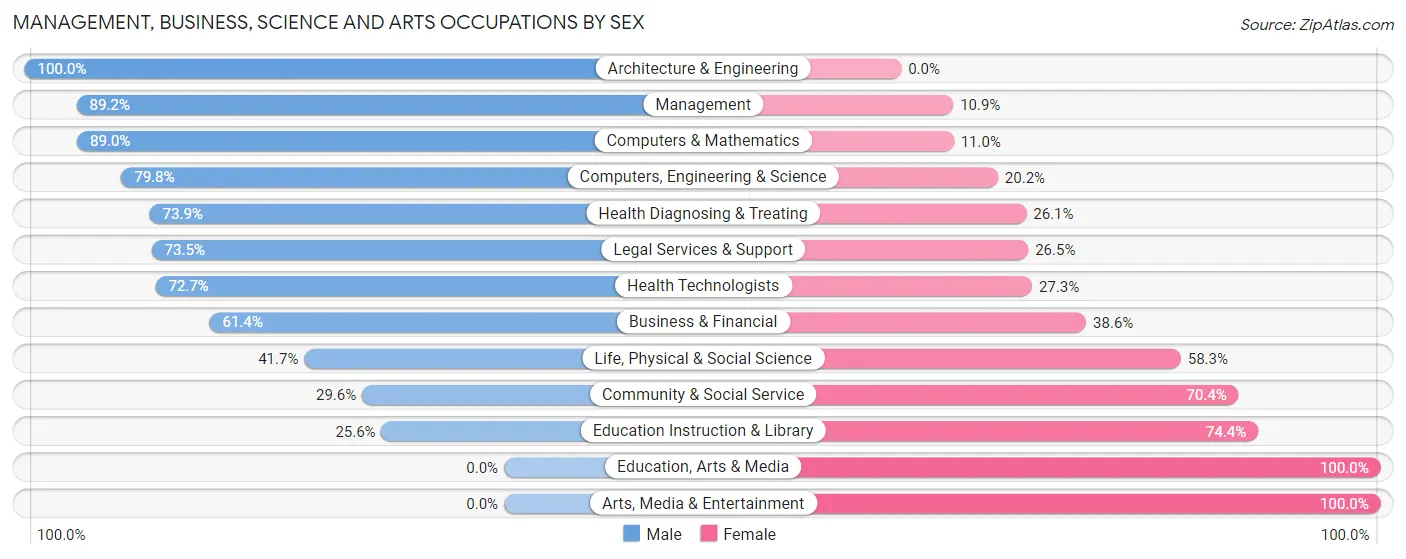
| Occupation | Male | Female |
| Management | 575 (89.1%) | 70 (10.8%) |
| Business & Financial | 191 (61.4%) | 120 (38.6%) |
| Computers, Engineering & Science | 87 (79.8%) | 22 (20.2%) |
| Computers & Mathematics | 65 (89.0%) | 8 (11.0%) |
| Architecture & Engineering | 12 (100.0%) | 0 (0.0%) |
| Life, Physical & Social Science | 10 (41.7%) | 14 (58.3%) |
| Community & Social Service | 95 (29.6%) | 226 (70.4%) |
| Education, Arts & Media | 0 (0.0%) | 16 (100.0%) |
| Legal Services & Support | 61 (73.5%) | 22 (26.5%) |
| Education Instruction & Library | 34 (25.6%) | 99 (74.4%) |
| Arts, Media & Entertainment | 0 (0.0%) | 89 (100.0%) |
| Health Diagnosing & Treating | 252 (73.9%) | 89 (26.1%) |
| Health Technologists | 237 (72.7%) | 89 (27.3%) |
| Total (Category) | 1,200 (69.5%) | 527 (30.5%) |
| Total (Overall) | 1,537 (63.1%) | 898 (36.9%) |
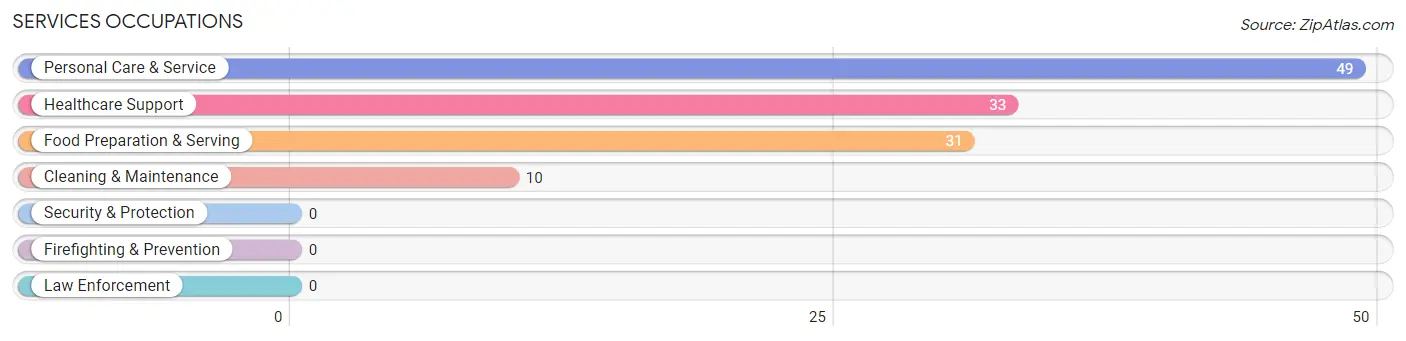
Services Occupations
The most common Services occupations in Flower Hill are Personal Care & Service (49 | 2.0%), Healthcare Support (33 | 1.4%), Food Preparation & Serving (31 | 1.3%), and Cleaning & Maintenance (10 | 0.4%).
Services Occupations by Sex
Within the Services occupations in Flower Hill, the most male-oriented occupations are Cleaning & Maintenance (100.0%), Personal Care & Service (46.9%), and Healthcare Support (30.3%), while the most female-oriented occupations are Food Preparation & Serving (100.0%), Healthcare Support (69.7%), and Personal Care & Service (53.1%).
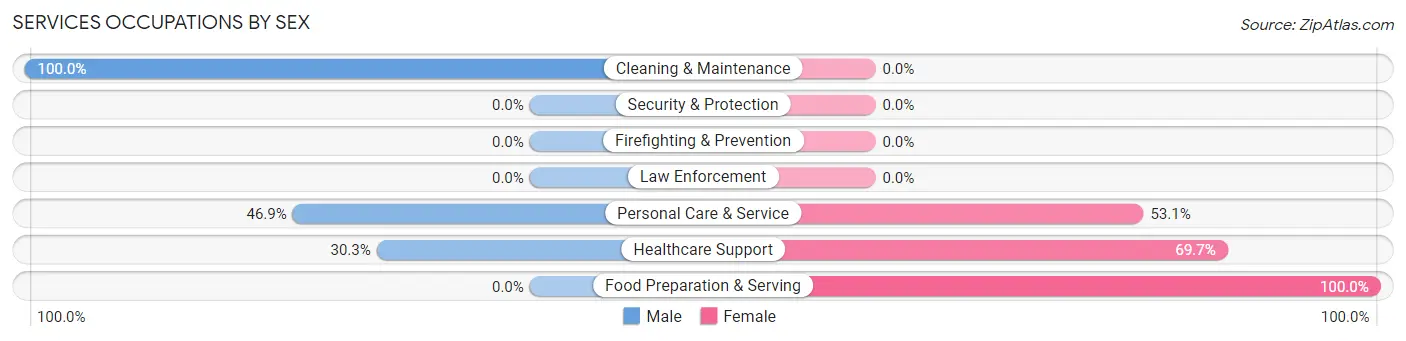
| Occupation | Male | Female |
| Healthcare Support | 10 (30.3%) | 23 (69.7%) |
| Security & Protection | 0 (0.0%) | 0 (0.0%) |
| Firefighting & Prevention | 0 (0.0%) | 0 (0.0%) |
| Law Enforcement | 0 (0.0%) | 0 (0.0%) |
| Food Preparation & Serving | 0 (0.0%) | 31 (100.0%) |
| Cleaning & Maintenance | 10 (100.0%) | 0 (0.0%) |
| Personal Care & Service | 23 (46.9%) | 26 (53.1%) |
| Total (Category) | 43 (35.0%) | 80 (65.0%) |
| Total (Overall) | 1,537 (63.1%) | 898 (36.9%) |
Sales and Office Occupations
The most common Sales and Office occupations in Flower Hill are Sales & Related (415 | 17.0%), and Office & Administration (81 | 3.3%).

Sales and Office Occupations by Sex
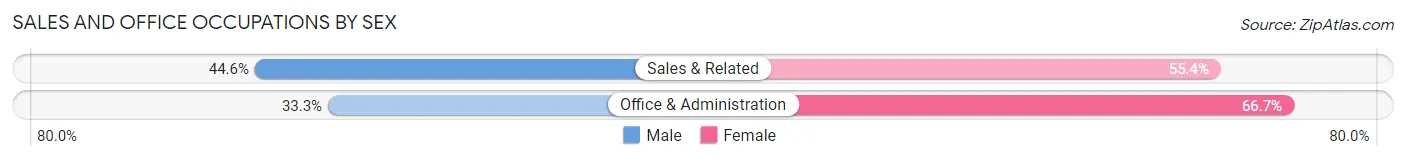
| Occupation | Male | Female |
| Sales & Related | 185 (44.6%) | 230 (55.4%) |
| Office & Administration | 27 (33.3%) | 54 (66.7%) |
| Total (Category) | 212 (42.7%) | 284 (57.3%) |
| Total (Overall) | 1,537 (63.1%) | 898 (36.9%) |
Natural Resources, Construction and Maintenance Occupations
The most common Natural Resources, Construction and Maintenance occupations in Flower Hill are , and Construction & Extraction (12 | 0.5%).
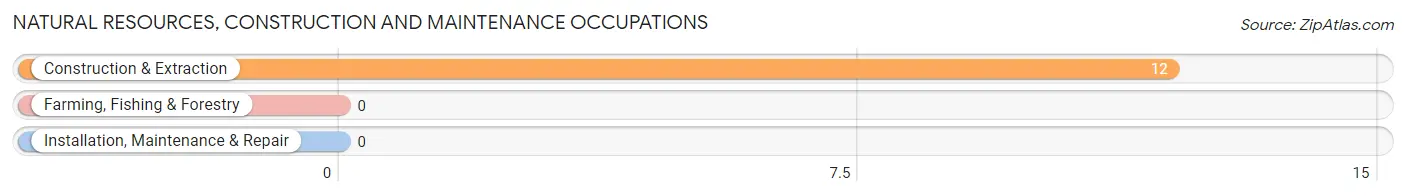
Natural Resources, Construction and Maintenance Occupations by Sex
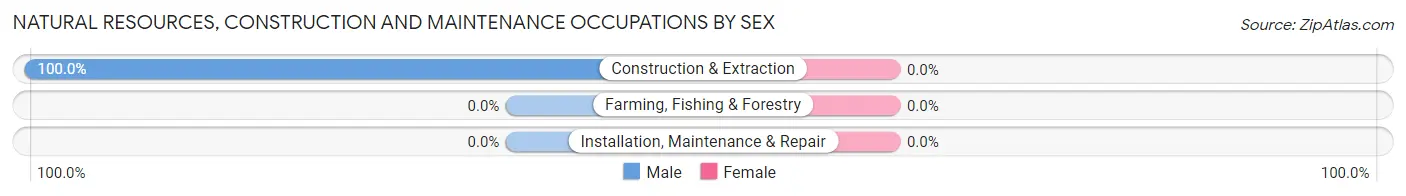
| Occupation | Male | Female |
| Farming, Fishing & Forestry | 0 (0.0%) | 0 (0.0%) |
| Construction & Extraction | 12 (100.0%) | 0 (0.0%) |
| Installation, Maintenance & Repair | 0 (0.0%) | 0 (0.0%) |
| Total (Category) | 12 (100.0%) | 0 (0.0%) |
| Total (Overall) | 1,537 (63.1%) | 898 (36.9%) |
Production, Transportation and Moving Occupations
The most common Production, Transportation and Moving occupations in Flower Hill are Material Moving (50 | 2.1%), Transportation (19 | 0.8%), and Production (8 | 0.3%).
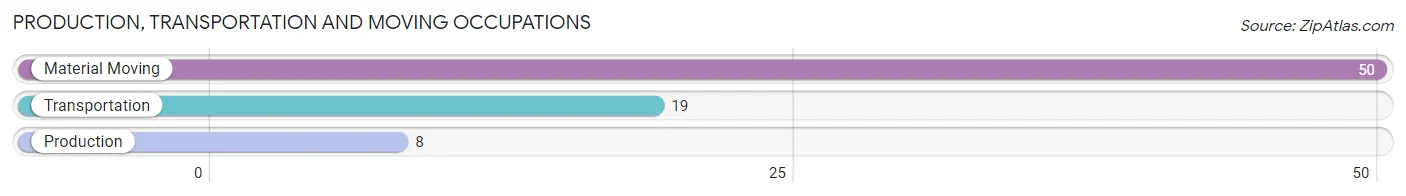
Production, Transportation and Moving Occupations by Sex
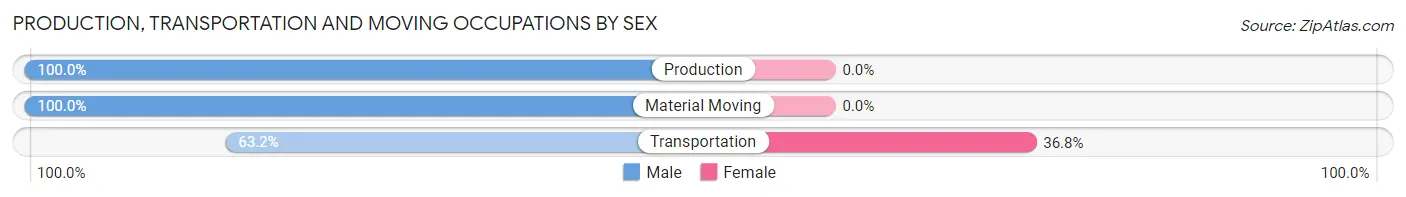
| Occupation | Male | Female |
| Production | 8 (100.0%) | 0 (0.0%) |
| Transportation | 12 (63.2%) | 7 (36.8%) |
| Material Moving | 50 (100.0%) | 0 (0.0%) |
| Total (Category) | 70 (90.9%) | 7 (9.1%) |
| Total (Overall) | 1,537 (63.1%) | 898 (36.9%) |
Employment Industries by Sex in Flower Hill
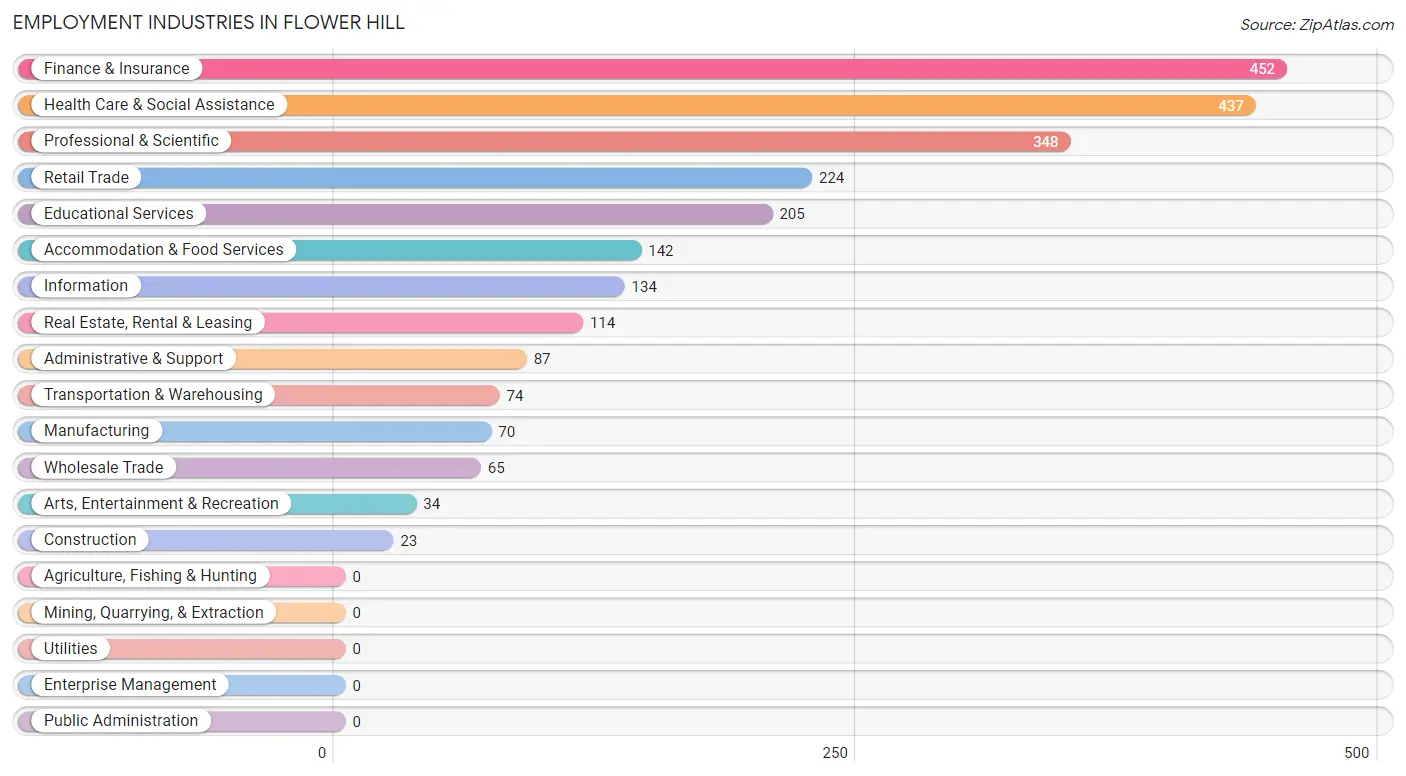
Employment Industries in Flower Hill
The major employment industries in Flower Hill include Finance & Insurance (452 | 18.6%), Health Care & Social Assistance (437 | 17.9%), Professional & Scientific (348 | 14.3%), Retail Trade (224 | 9.2%), and Educational Services (205 | 8.4%).
Employment Industries by Sex in Flower Hill
The Flower Hill industries that see more men than women are Construction (100.0%), Manufacturing (100.0%), and Transportation & Warehousing (90.5%), whereas the industries that tend to have a higher number of women are Educational Services (78.5%), Retail Trade (73.7%), and Accommodation & Food Services (44.4%).
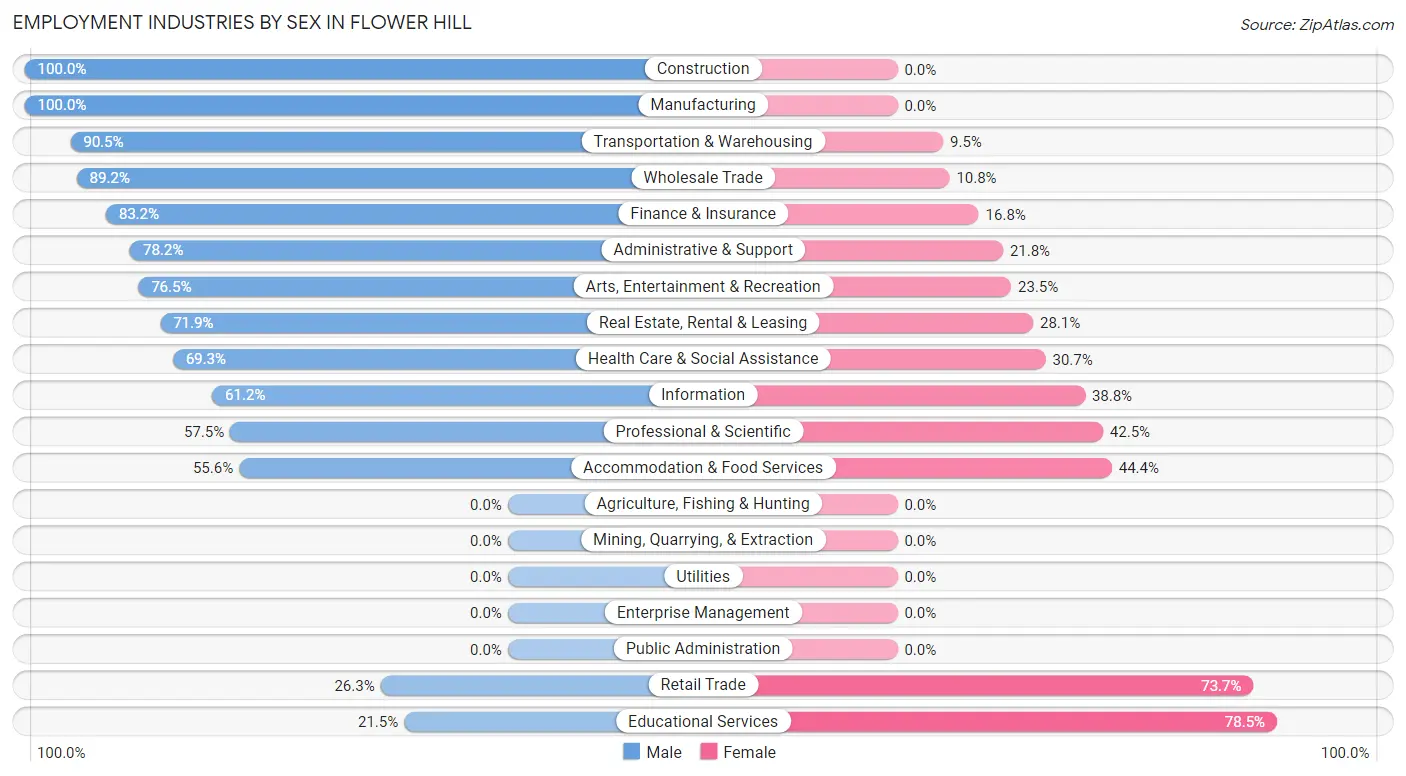
| Industry | Male | Female |
| Agriculture, Fishing & Hunting | 0 (0.0%) | 0 (0.0%) |
| Mining, Quarrying, & Extraction | 0 (0.0%) | 0 (0.0%) |
| Construction | 23 (100.0%) | 0 (0.0%) |
| Manufacturing | 70 (100.0%) | 0 (0.0%) |
| Wholesale Trade | 58 (89.2%) | 7 (10.8%) |
| Retail Trade | 59 (26.3%) | 165 (73.7%) |
| Transportation & Warehousing | 67 (90.5%) | 7 (9.5%) |
| Utilities | 0 (0.0%) | 0 (0.0%) |
| Information | 82 (61.2%) | 52 (38.8%) |
| Finance & Insurance | 376 (83.2%) | 76 (16.8%) |
| Real Estate, Rental & Leasing | 82 (71.9%) | 32 (28.1%) |
| Professional & Scientific | 200 (57.5%) | 148 (42.5%) |
| Enterprise Management | 0 (0.0%) | 0 (0.0%) |
| Administrative & Support | 68 (78.2%) | 19 (21.8%) |
| Educational Services | 44 (21.5%) | 161 (78.5%) |
| Health Care & Social Assistance | 303 (69.3%) | 134 (30.7%) |
| Arts, Entertainment & Recreation | 26 (76.5%) | 8 (23.5%) |
| Accommodation & Food Services | 79 (55.6%) | 63 (44.4%) |
| Public Administration | 0 (0.0%) | 0 (0.0%) |
| Total | 1,537 (63.1%) | 898 (36.9%) |
Education in Flower Hill
School Enrollment in Flower Hill
The most common levels of schooling among the 1,403 students in Flower Hill are high school (413 | 29.4%), middle school (316 | 22.5%), and elementary school (295 | 21.0%).
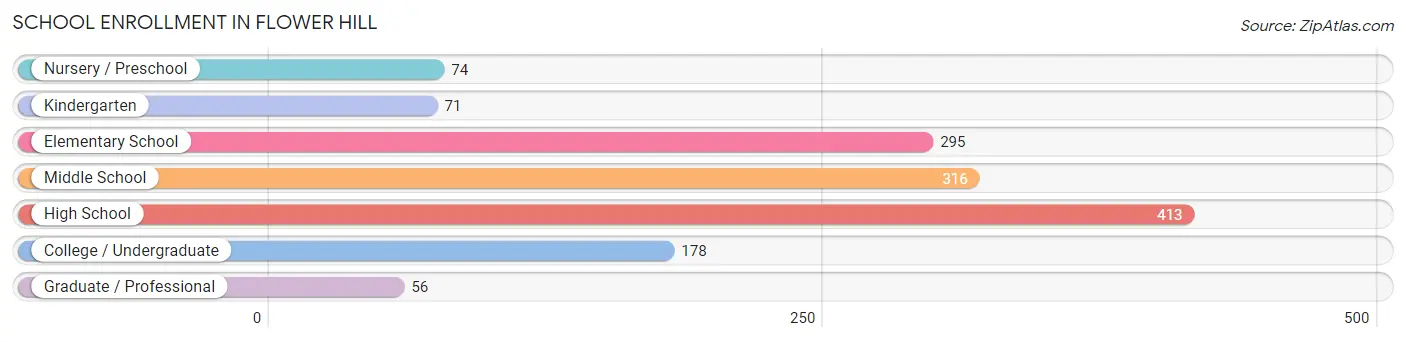
| School Level | # Students | % Students |
| Nursery / Preschool | 74 | 5.3% |
| Kindergarten | 71 | 5.1% |
| Elementary School | 295 | 21.0% |
| Middle School | 316 | 22.5% |
| High School | 413 | 29.4% |
| College / Undergraduate | 178 | 12.7% |
| Graduate / Professional | 56 | 4.0% |
| Total | 1,403 | 100.0% |
School Enrollment by Age by Funding Source in Flower Hill
Out of a total of 1,403 students who are enrolled in schools in Flower Hill, 421 (30.0%) attend a private institution, while the remaining 982 (70.0%) are enrolled in public schools. The age group of 3 to 4 year olds has the highest likelihood of being enrolled in private schools, with 37 (100.0% in the age bracket) enrolled. Conversely, the age group of 10 to 14 year olds has the lowest likelihood of being enrolled in a private school, with 328 (90.9% in the age bracket) attending a public institution.
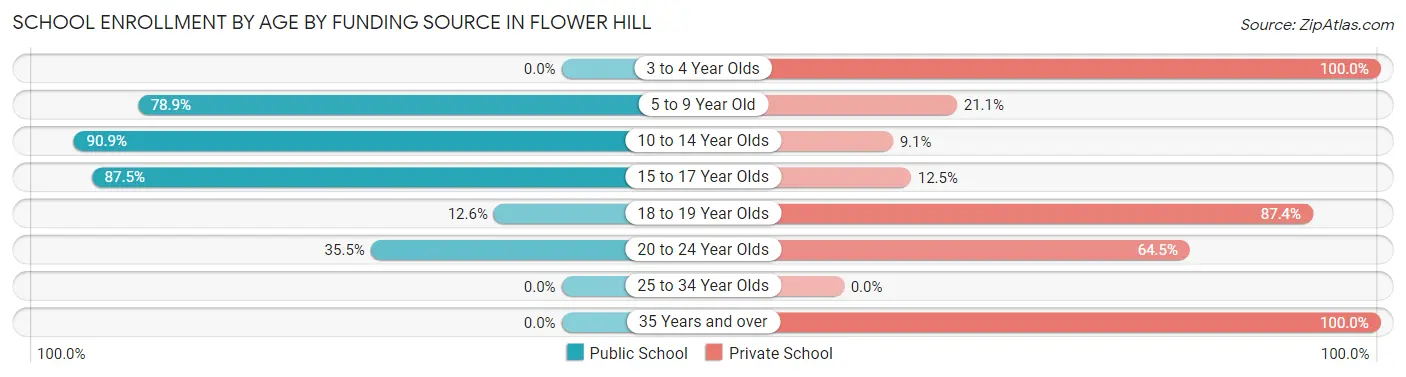
| Age Bracket | Public School | Private School |
| 3 to 4 Year Olds | 0 (0.0%) | 37 (100.0%) |
| 5 to 9 Year Old | 311 (78.9%) | 83 (21.1%) |
| 10 to 14 Year Olds | 328 (90.9%) | 33 (9.1%) |
| 15 to 17 Year Olds | 287 (87.5%) | 41 (12.5%) |
| 18 to 19 Year Olds | 13 (12.6%) | 90 (87.4%) |
| 20 to 24 Year Olds | 43 (35.5%) | 78 (64.5%) |
| 25 to 34 Year Olds | 0 (0.0%) | 0 (0.0%) |
| 35 Years and over | 0 (0.0%) | 59 (100.0%) |
| Total | 982 (70.0%) | 421 (30.0%) |
Educational Attainment by Field of Study in Flower Hill
Business (898 | 33.9%), education (294 | 11.1%), physical & health sciences (267 | 10.1%), social sciences (242 | 9.1%), and bio, nature & agricultural (225 | 8.5%) are the most common fields of study among 2,651 individuals in Flower Hill who have obtained a bachelor's degree or higher.
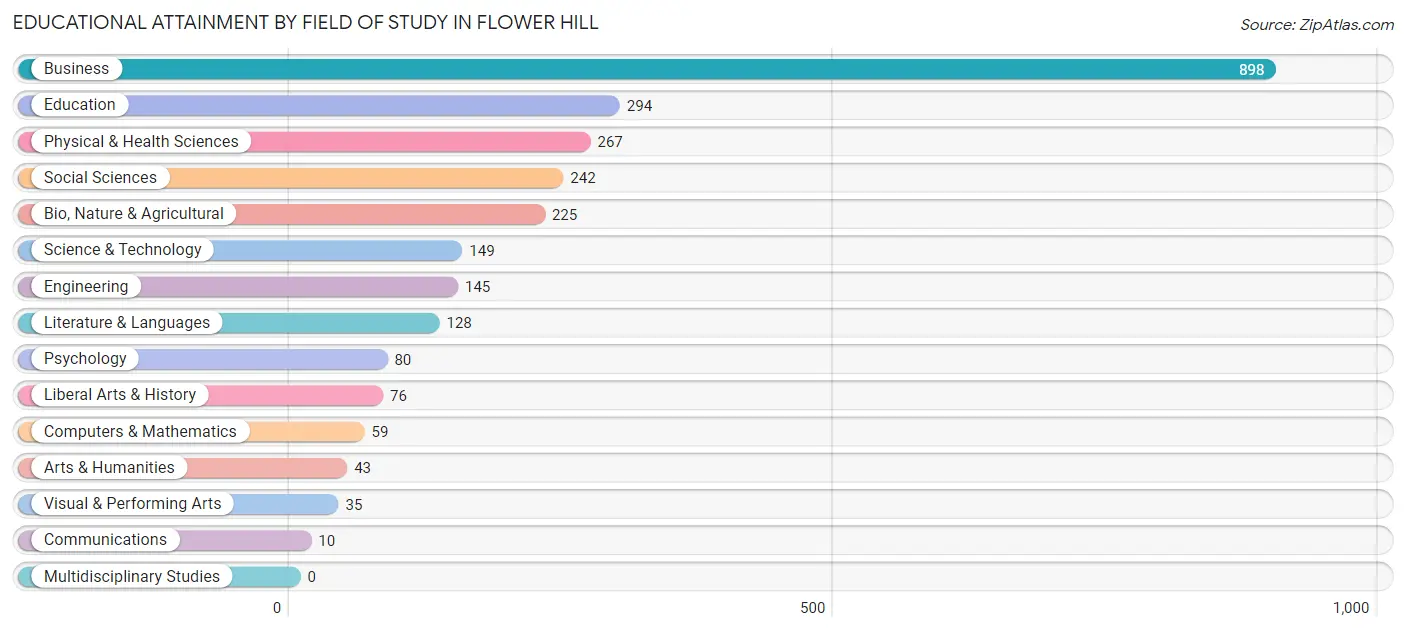
| Field of Study | # Graduates | % Graduates |
| Computers & Mathematics | 59 | 2.2% |
| Bio, Nature & Agricultural | 225 | 8.5% |
| Physical & Health Sciences | 267 | 10.1% |
| Psychology | 80 | 3.0% |
| Social Sciences | 242 | 9.1% |
| Engineering | 145 | 5.5% |
| Multidisciplinary Studies | 0 | 0.0% |
| Science & Technology | 149 | 5.6% |
| Business | 898 | 33.9% |
| Education | 294 | 11.1% |
| Literature & Languages | 128 | 4.8% |
| Liberal Arts & History | 76 | 2.9% |
| Visual & Performing Arts | 35 | 1.3% |
| Communications | 10 | 0.4% |
| Arts & Humanities | 43 | 1.6% |
| Total | 2,651 | 100.0% |
Transportation & Commute in Flower Hill
Vehicle Availability by Sex in Flower Hill
The most prevalent vehicle ownership categories in Flower Hill are males with 2 vehicles (951, accounting for 61.9%) and females with 2 vehicles (510, making up 107.3%).
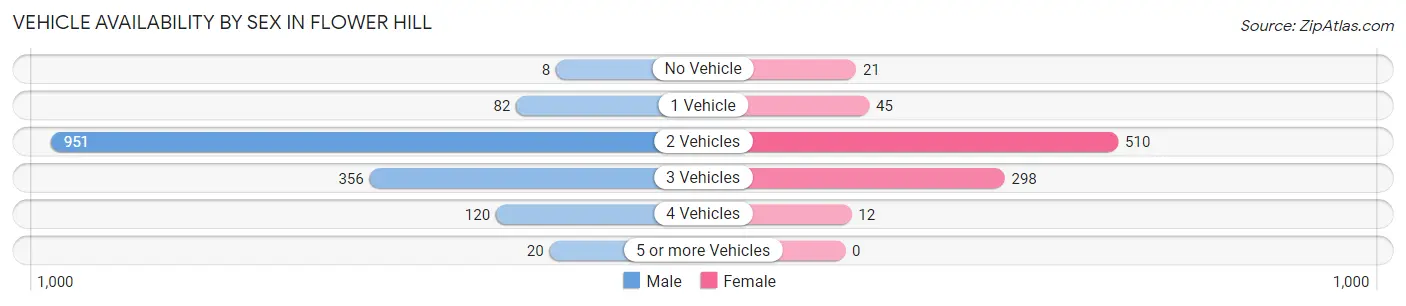
| Vehicles Available | Male | Female |
| No Vehicle | 8 (0.5%) | 21 (2.4%) |
| 1 Vehicle | 82 (5.3%) | 45 (5.1%) |
| 2 Vehicles | 951 (61.9%) | 510 (57.6%) |
| 3 Vehicles | 356 (23.2%) | 298 (33.6%) |
| 4 Vehicles | 120 (7.8%) | 12 (1.3%) |
| 5 or more Vehicles | 20 (1.3%) | 0 (0.0%) |
| Total | 1,537 (100.0%) | 886 (100.0%) |
Commute Time in Flower Hill
The most frequently occuring commute durations in Flower Hill are 60 to 89 minutes (497 commuters, 23.5%), 10 to 14 minutes (329 commuters, 15.6%), and 30 to 34 minutes (291 commuters, 13.8%).
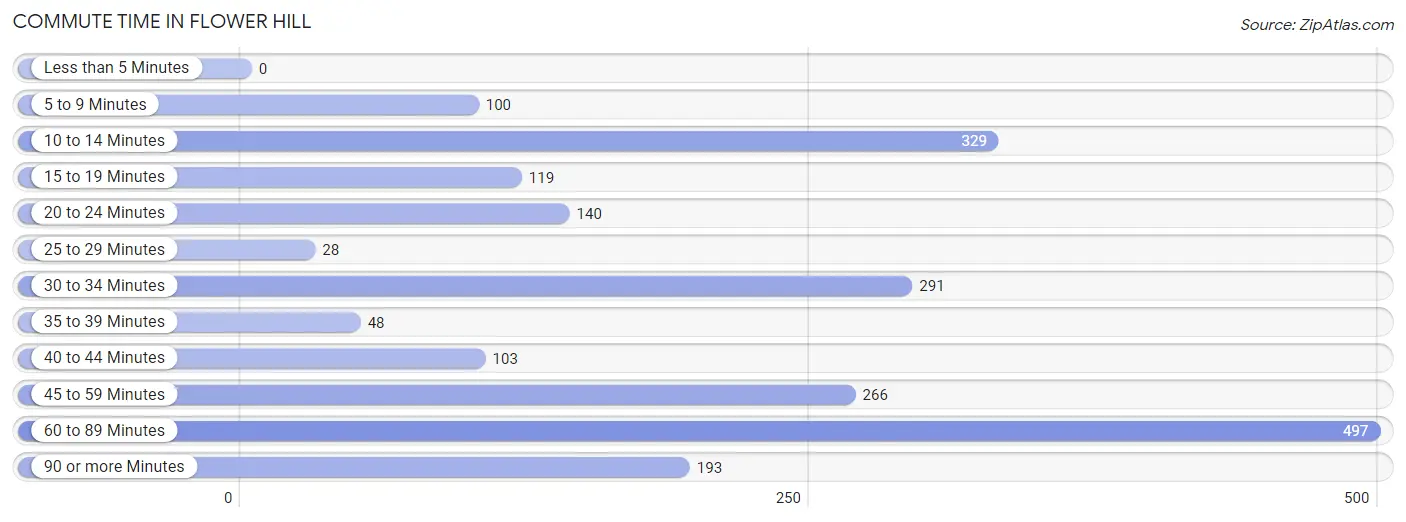
| Commute Time | # Commuters | % Commuters |
| Less than 5 Minutes | 0 | 0.0% |
| 5 to 9 Minutes | 100 | 4.7% |
| 10 to 14 Minutes | 329 | 15.6% |
| 15 to 19 Minutes | 119 | 5.6% |
| 20 to 24 Minutes | 140 | 6.6% |
| 25 to 29 Minutes | 28 | 1.3% |
| 30 to 34 Minutes | 291 | 13.8% |
| 35 to 39 Minutes | 48 | 2.3% |
| 40 to 44 Minutes | 103 | 4.9% |
| 45 to 59 Minutes | 266 | 12.6% |
| 60 to 89 Minutes | 497 | 23.5% |
| 90 or more Minutes | 193 | 9.1% |
Commute Time by Sex in Flower Hill
The most common commute times in Flower Hill are 60 to 89 minutes (404 commuters, 28.7%) for males and 30 to 34 minutes (133 commuters, 18.8%) for females.
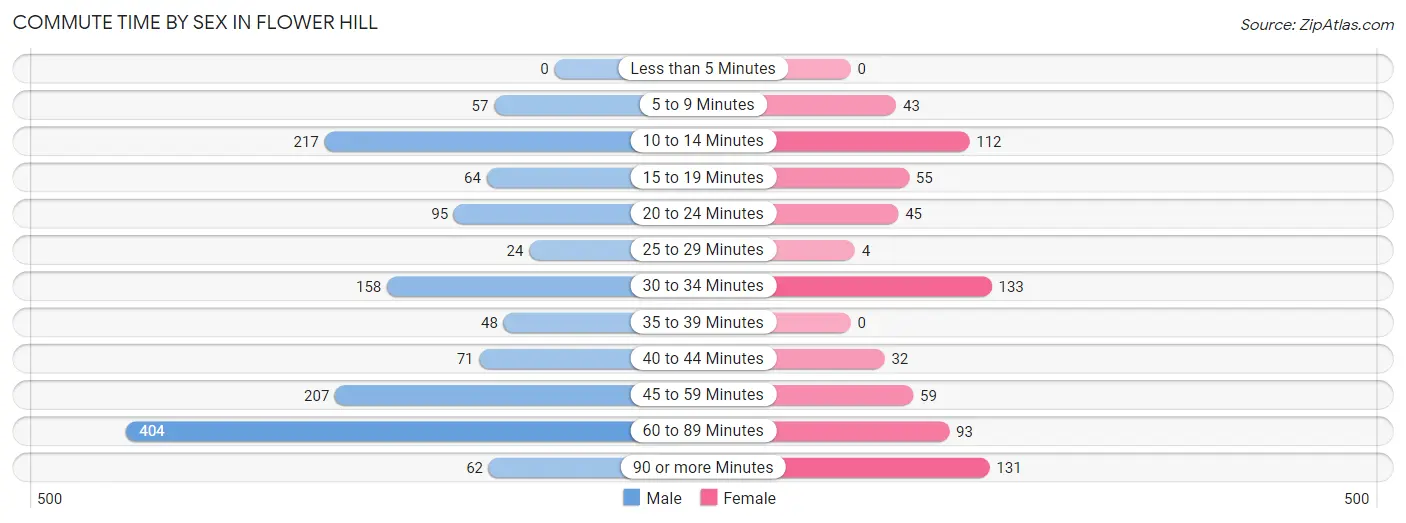
| Commute Time | Male | Female |
| Less than 5 Minutes | 0 (0.0%) | 0 (0.0%) |
| 5 to 9 Minutes | 57 (4.1%) | 43 (6.1%) |
| 10 to 14 Minutes | 217 (15.4%) | 112 (15.8%) |
| 15 to 19 Minutes | 64 (4.5%) | 55 (7.8%) |
| 20 to 24 Minutes | 95 (6.8%) | 45 (6.4%) |
| 25 to 29 Minutes | 24 (1.7%) | 4 (0.6%) |
| 30 to 34 Minutes | 158 (11.2%) | 133 (18.8%) |
| 35 to 39 Minutes | 48 (3.4%) | 0 (0.0%) |
| 40 to 44 Minutes | 71 (5.1%) | 32 (4.5%) |
| 45 to 59 Minutes | 207 (14.7%) | 59 (8.4%) |
| 60 to 89 Minutes | 404 (28.7%) | 93 (13.2%) |
| 90 or more Minutes | 62 (4.4%) | 131 (18.5%) |
Time of Departure to Work by Sex in Flower Hill
The most frequent times of departure to work in Flower Hill are 6:30 AM to 6:59 AM (445, 31.6%) for males and 9:00 AM to 9:59 AM (187, 26.5%) for females.
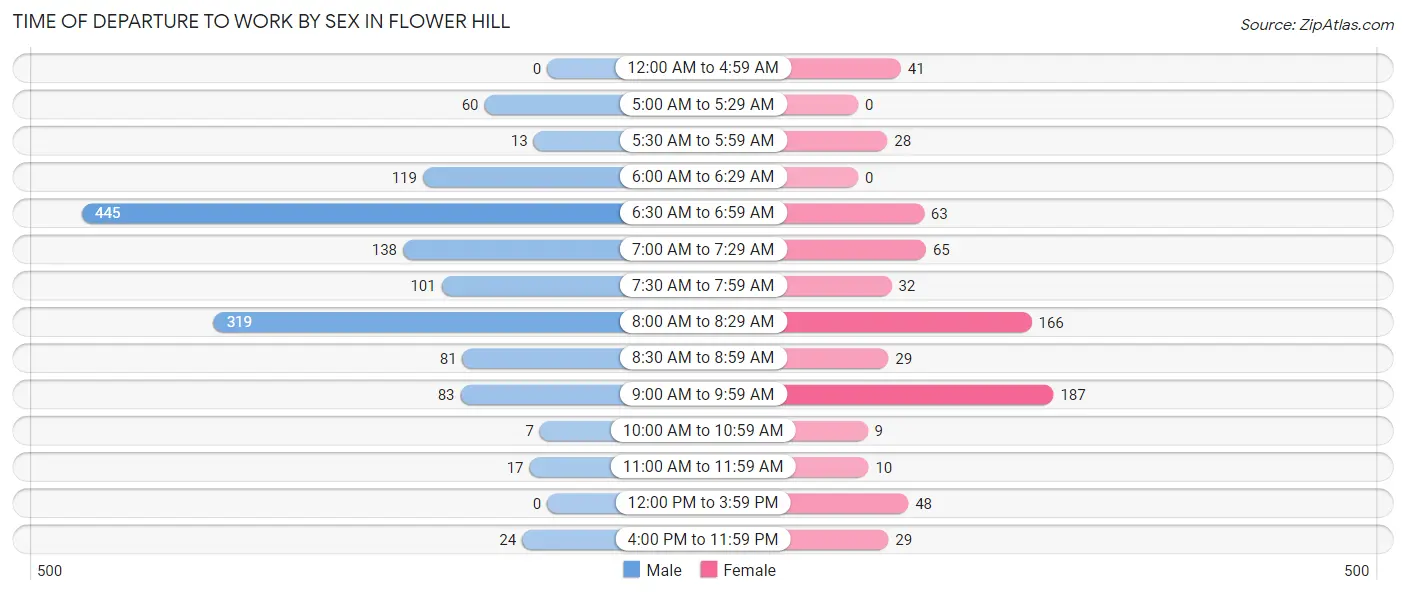
| Time of Departure | Male | Female |
| 12:00 AM to 4:59 AM | 0 (0.0%) | 41 (5.8%) |
| 5:00 AM to 5:29 AM | 60 (4.3%) | 0 (0.0%) |
| 5:30 AM to 5:59 AM | 13 (0.9%) | 28 (4.0%) |
| 6:00 AM to 6:29 AM | 119 (8.5%) | 0 (0.0%) |
| 6:30 AM to 6:59 AM | 445 (31.6%) | 63 (8.9%) |
| 7:00 AM to 7:29 AM | 138 (9.8%) | 65 (9.2%) |
| 7:30 AM to 7:59 AM | 101 (7.2%) | 32 (4.5%) |
| 8:00 AM to 8:29 AM | 319 (22.7%) | 166 (23.5%) |
| 8:30 AM to 8:59 AM | 81 (5.8%) | 29 (4.1%) |
| 9:00 AM to 9:59 AM | 83 (5.9%) | 187 (26.5%) |
| 10:00 AM to 10:59 AM | 7 (0.5%) | 9 (1.3%) |
| 11:00 AM to 11:59 AM | 17 (1.2%) | 10 (1.4%) |
| 12:00 PM to 3:59 PM | 0 (0.0%) | 48 (6.8%) |
| 4:00 PM to 11:59 PM | 24 (1.7%) | 29 (4.1%) |
| Total | 1,407 (100.0%) | 707 (100.0%) |
Housing Occupancy in Flower Hill
Occupancy by Ownership in Flower Hill
Of the total 1,604 dwellings in Flower Hill, owner-occupied units account for 1,411 (88.0%), while renter-occupied units make up 193 (12.0%).
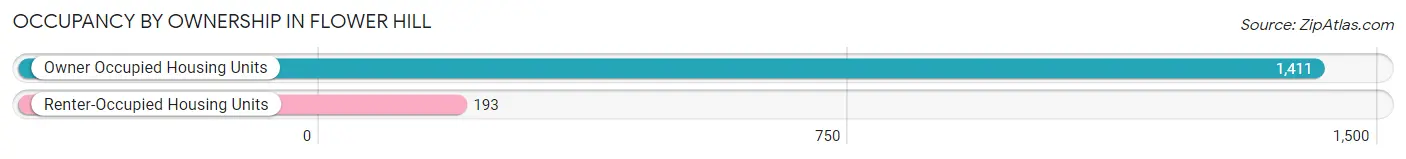
| Occupancy | # Housing Units | % Housing Units |
| Owner Occupied Housing Units | 1,411 | 88.0% |
| Renter-Occupied Housing Units | 193 | 12.0% |
| Total Occupied Housing Units | 1,604 | 100.0% |
Occupancy by Household Size in Flower Hill
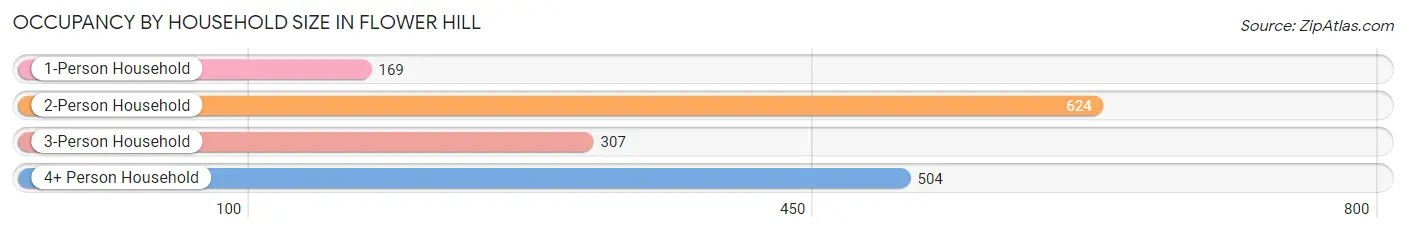
| Household Size | # Housing Units | % Housing Units |
| 1-Person Household | 169 | 10.5% |
| 2-Person Household | 624 | 38.9% |
| 3-Person Household | 307 | 19.1% |
| 4+ Person Household | 504 | 31.4% |
| Total Housing Units | 1,604 | 100.0% |
Occupancy by Ownership by Household Size in Flower Hill
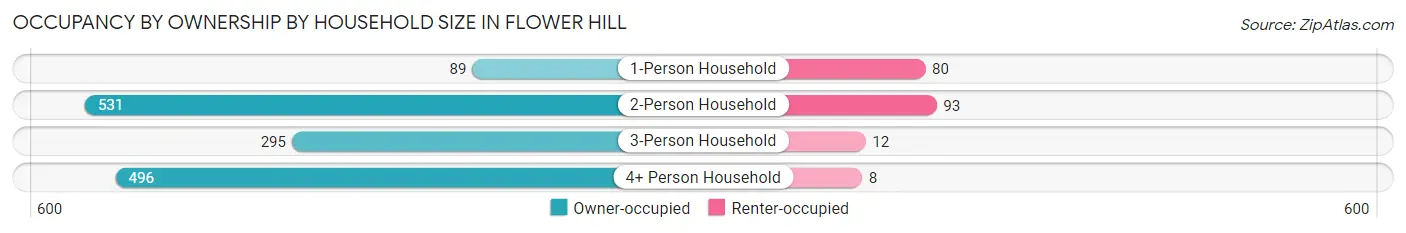
| Household Size | Owner-occupied | Renter-occupied |
| 1-Person Household | 89 (52.7%) | 80 (47.3%) |
| 2-Person Household | 531 (85.1%) | 93 (14.9%) |
| 3-Person Household | 295 (96.1%) | 12 (3.9%) |
| 4+ Person Household | 496 (98.4%) | 8 (1.6%) |
| Total Housing Units | 1,411 (88.0%) | 193 (12.0%) |
Occupancy by Educational Attainment in Flower Hill
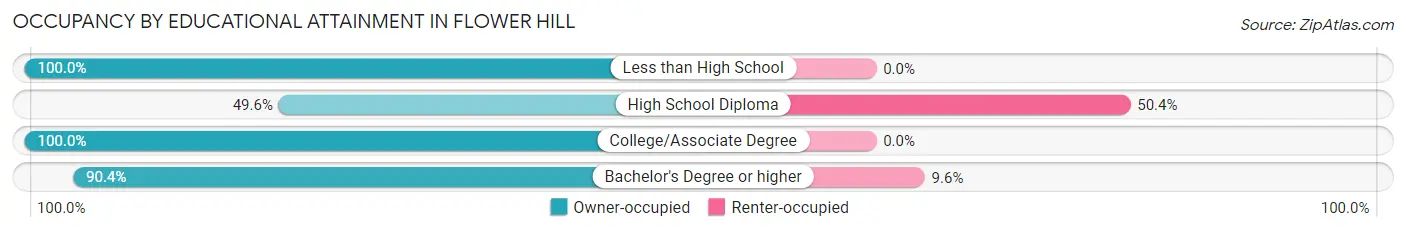
| Household Size | Owner-occupied | Renter-occupied |
| Less than High School | 23 (100.0%) | 0 (0.0%) |
| High School Diploma | 64 (49.6%) | 65 (50.4%) |
| College/Associate Degree | 120 (100.0%) | 0 (0.0%) |
| Bachelor's Degree or higher | 1,204 (90.4%) | 128 (9.6%) |
Occupancy by Age of Householder in Flower Hill
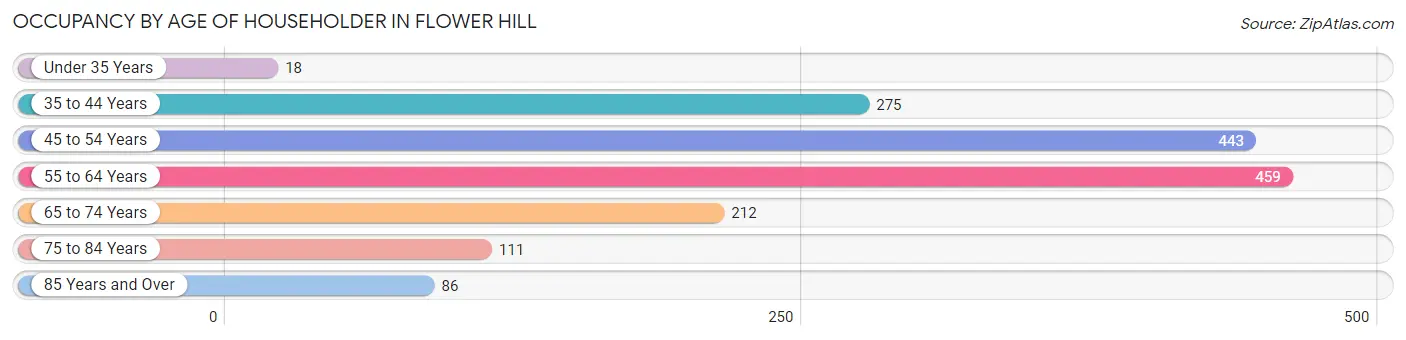
| Age Bracket | # Households | % Households |
| Under 35 Years | 18 | 1.1% |
| 35 to 44 Years | 275 | 17.1% |
| 45 to 54 Years | 443 | 27.6% |
| 55 to 64 Years | 459 | 28.6% |
| 65 to 74 Years | 212 | 13.2% |
| 75 to 84 Years | 111 | 6.9% |
| 85 Years and Over | 86 | 5.4% |
| Total | 1,604 | 100.0% |
Housing Finances in Flower Hill
Median Income by Occupancy in Flower Hill
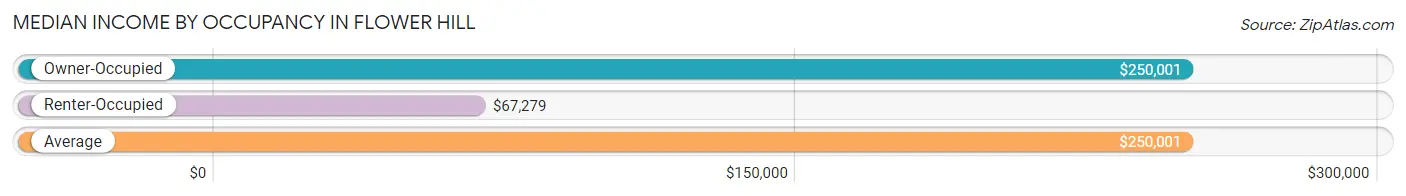
| Occupancy Type | # Households | Median Income |
| Owner-Occupied | 1,411 (88.0%) | $250,001 |
| Renter-Occupied | 193 (12.0%) | $67,279 |
| Average | 1,604 (100.0%) | $250,001 |
Occupancy by Householder Income Bracket in Flower Hill
| Income Bracket | Owner-occupied | Renter-occupied |
| Less than $5,000 | 42 (3.0%) | 0 (0.0%) |
| $5,000 to $9,999 | 10 (0.7%) | 0 (0.0%) |
| $10,000 to $14,999 | 23 (1.6%) | 27 (14.0%) |
| $15,000 to $19,999 | 0 (0.0%) | 13 (6.7%) |
| $20,000 to $24,999 | 0 (0.0%) | 0 (0.0%) |
| $25,000 to $34,999 | 0 (0.0%) | 29 (15.0%) |
| $35,000 to $49,999 | 23 (1.6%) | 0 (0.0%) |
| $50,000 to $74,999 | 58 (4.1%) | 55 (28.5%) |
| $75,000 to $99,999 | 63 (4.5%) | 8 (4.2%) |
| $100,000 to $149,999 | 169 (12.0%) | 0 (0.0%) |
| $150,000 or more | 1,023 (72.5%) | 61 (31.6%) |
| Total | 1,411 (100.0%) | 193 (100.0%) |
Monthly Housing Cost Tiers in Flower Hill
| Monthly Cost | Owner-occupied | Renter-occupied |
| Less than $300 | 0 (0.0%) | 0 (0.0%) |
| $300 to $499 | 0 (0.0%) | 0 (0.0%) |
| $500 to $799 | 10 (0.7%) | 0 (0.0%) |
| $800 to $999 | 0 (0.0%) | 13 (6.7%) |
| $1,000 to $1,499 | 45 (3.2%) | 12 (6.2%) |
| $1,500 to $1,999 | 61 (4.3%) | 69 (35.7%) |
| $2,000 to $2,499 | 41 (2.9%) | 26 (13.5%) |
| $2,500 to $2,999 | 160 (11.3%) | 44 (22.8%) |
| $3,000 or more | 1,094 (77.5%) | 29 (15.0%) |
| Total | 1,411 (100.0%) | 193 (100.0%) |
Physical Housing Characteristics in Flower Hill
Housing Structures in Flower Hill
| Structure Type | # Housing Units | % Housing Units |
| Single Unit, Detached | 1,386 | 86.4% |
| Single Unit, Attached | 54 | 3.4% |
| 2 Unit Apartments | 0 | 0.0% |
| 3 or 4 Unit Apartments | 0 | 0.0% |
| 5 to 9 Unit Apartments | 0 | 0.0% |
| 10 or more Apartments | 164 | 10.2% |
| Mobile Home / Other | 0 | 0.0% |
| Total | 1,604 | 100.0% |
Housing Structures by Occupancy in Flower Hill
| Structure Type | Owner-occupied | Renter-occupied |
| Single Unit, Detached | 1,357 (97.9%) | 29 (2.1%) |
| Single Unit, Attached | 54 (100.0%) | 0 (0.0%) |
| 2 Unit Apartments | 0 (0.0%) | 0 (0.0%) |
| 3 or 4 Unit Apartments | 0 (0.0%) | 0 (0.0%) |
| 5 to 9 Unit Apartments | 0 (0.0%) | 0 (0.0%) |
| 10 or more Apartments | 0 (0.0%) | 164 (100.0%) |
| Mobile Home / Other | 0 (0.0%) | 0 (0.0%) |
| Total | 1,411 (88.0%) | 193 (12.0%) |
Housing Structures by Number of Rooms in Flower Hill
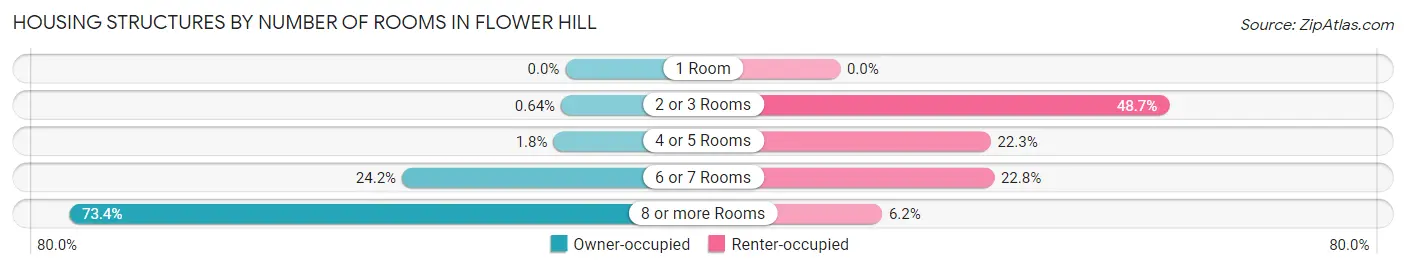
| Number of Rooms | Owner-occupied | Renter-occupied |
| 1 Room | 0 (0.0%) | 0 (0.0%) |
| 2 or 3 Rooms | 9 (0.6%) | 94 (48.7%) |
| 4 or 5 Rooms | 25 (1.8%) | 43 (22.3%) |
| 6 or 7 Rooms | 341 (24.2%) | 44 (22.8%) |
| 8 or more Rooms | 1,036 (73.4%) | 12 (6.2%) |
| Total | 1,411 (100.0%) | 193 (100.0%) |
Housing Structure by Heating Type in Flower Hill
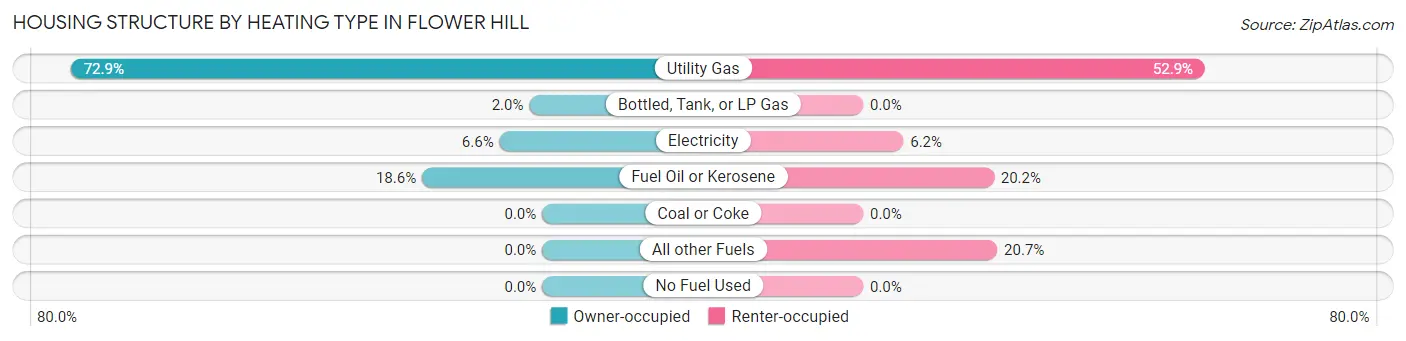
| Heating Type | Owner-occupied | Renter-occupied |
| Utility Gas | 1,028 (72.9%) | 102 (52.8%) |
| Bottled, Tank, or LP Gas | 28 (2.0%) | 0 (0.0%) |
| Electricity | 93 (6.6%) | 12 (6.2%) |
| Fuel Oil or Kerosene | 262 (18.6%) | 39 (20.2%) |
| Coal or Coke | 0 (0.0%) | 0 (0.0%) |
| All other Fuels | 0 (0.0%) | 40 (20.7%) |
| No Fuel Used | 0 (0.0%) | 0 (0.0%) |
| Total | 1,411 (100.0%) | 193 (100.0%) |
Household Vehicle Usage in Flower Hill
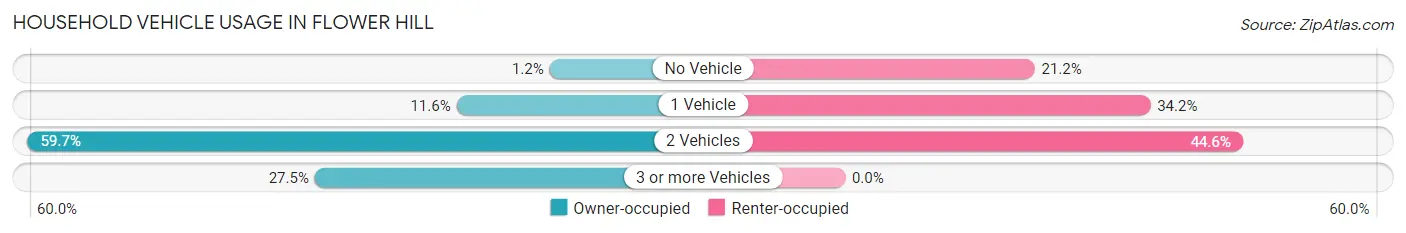
| Vehicles per Household | Owner-occupied | Renter-occupied |
| No Vehicle | 17 (1.2%) | 41 (21.2%) |
| 1 Vehicle | 164 (11.6%) | 66 (34.2%) |
| 2 Vehicles | 842 (59.7%) | 86 (44.6%) |
| 3 or more Vehicles | 388 (27.5%) | 0 (0.0%) |
| Total | 1,411 (100.0%) | 193 (100.0%) |
Real Estate & Mortgages in Flower Hill
Real Estate and Mortgage Overview in Flower Hill
| Characteristic | Without Mortgage | With Mortgage |
| Housing Units | 544 | 867 |
| Median Property Value | $1,885,100 | $1,995,000 |
| Median Household Income | $250,001 | $665 |
| Monthly Housing Costs | $1,501 | $819 |
| Real Estate Taxes | $10,001 | $0 |
Property Value by Mortgage Status in Flower Hill
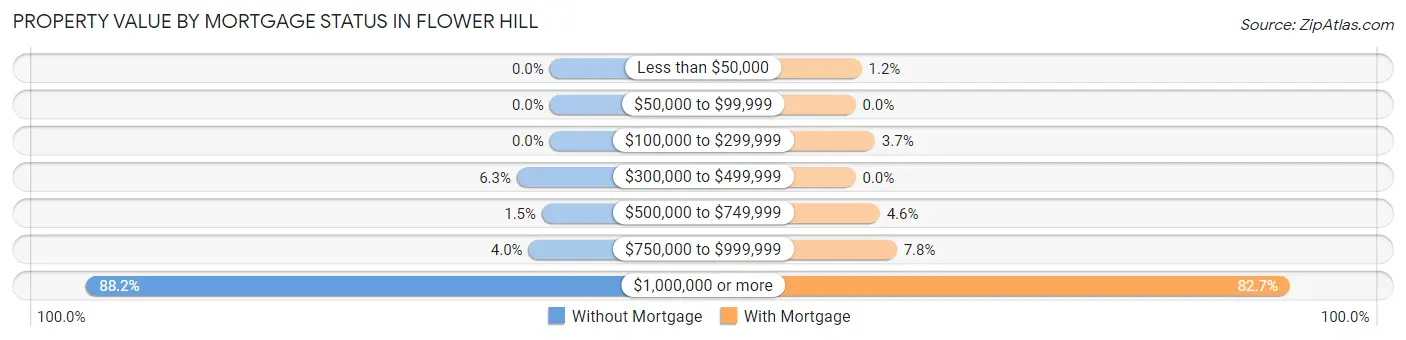
| Property Value | Without Mortgage | With Mortgage |
| Less than $50,000 | 0 (0.0%) | 10 (1.1%) |
| $50,000 to $99,999 | 0 (0.0%) | 0 (0.0%) |
| $100,000 to $299,999 | 0 (0.0%) | 32 (3.7%) |
| $300,000 to $499,999 | 34 (6.2%) | 0 (0.0%) |
| $500,000 to $749,999 | 8 (1.5%) | 40 (4.6%) |
| $750,000 to $999,999 | 22 (4.0%) | 68 (7.8%) |
| $1,000,000 or more | 480 (88.2%) | 717 (82.7%) |
| Total | 544 (100.0%) | 867 (100.0%) |
Household Income by Mortgage Status in Flower Hill
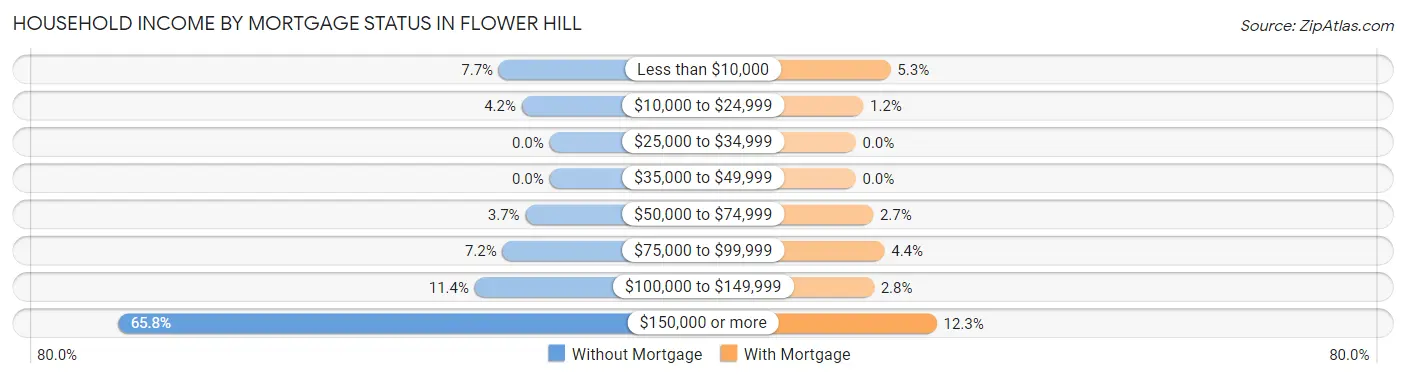
| Household Income | Without Mortgage | With Mortgage |
| Less than $10,000 | 42 (7.7%) | 46 (5.3%) |
| $10,000 to $24,999 | 23 (4.2%) | 10 (1.1%) |
| $25,000 to $34,999 | 0 (0.0%) | 0 (0.0%) |
| $35,000 to $49,999 | 0 (0.0%) | 0 (0.0%) |
| $50,000 to $74,999 | 20 (3.7%) | 23 (2.6%) |
| $75,000 to $99,999 | 39 (7.2%) | 38 (4.4%) |
| $100,000 to $149,999 | 62 (11.4%) | 24 (2.8%) |
| $150,000 or more | 358 (65.8%) | 107 (12.3%) |
| Total | 544 (100.0%) | 867 (100.0%) |
Property Value to Household Income Ratio in Flower Hill
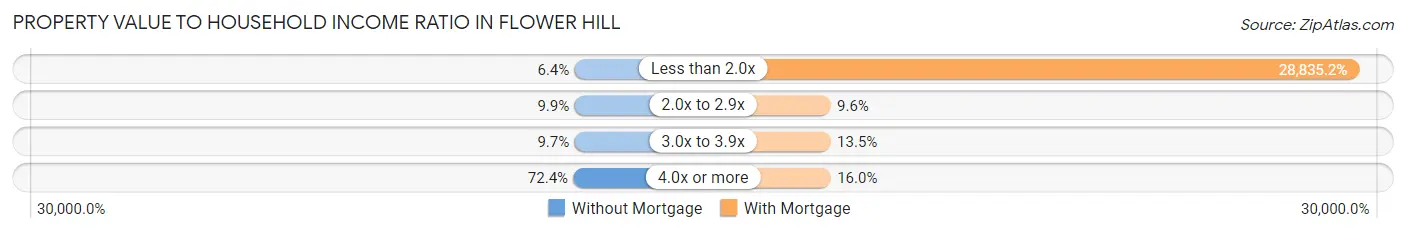
| Value-to-Income Ratio | Without Mortgage | With Mortgage |
| Less than 2.0x | 35 (6.4%) | 250,001 (28,835.2%) |
| 2.0x to 2.9x | 54 (9.9%) | 83 (9.6%) |
| 3.0x to 3.9x | 53 (9.7%) | 117 (13.5%) |
| 4.0x or more | 394 (72.4%) | 139 (16.0%) |
| Total | 544 (100.0%) | 867 (100.0%) |
Real Estate Taxes by Mortgage Status in Flower Hill
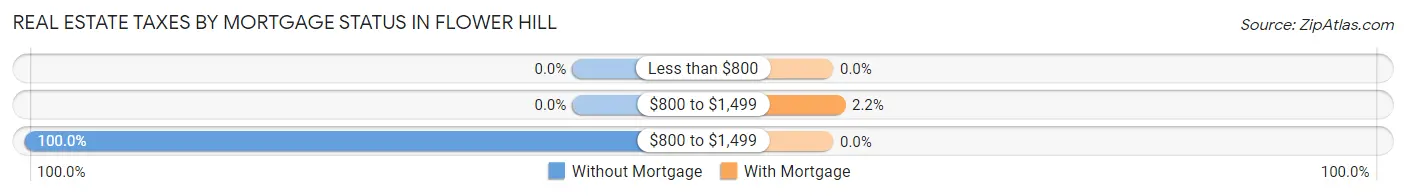
| Property Taxes | Without Mortgage | With Mortgage |
| Less than $800 | 0 (0.0%) | 0 (0.0%) |
| $800 to $1,499 | 0 (0.0%) | 19 (2.2%) |
| $800 to $1,499 | 544 (100.0%) | 0 (0.0%) |
| Total | 544 (100.0%) | 867 (100.0%) |
Health & Disability in Flower Hill
Health Insurance Coverage by Age in Flower Hill
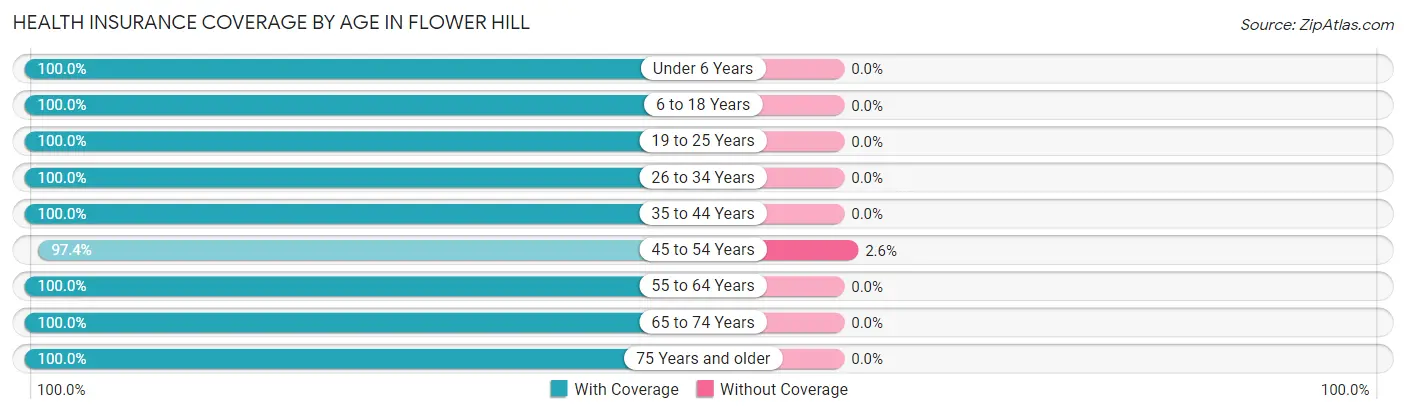
| Age Bracket | With Coverage | Without Coverage |
| Under 6 Years | 262 (100.0%) | 0 (0.0%) |
| 6 to 18 Years | 1,004 (100.0%) | 0 (0.0%) |
| 19 to 25 Years | 373 (100.0%) | 0 (0.0%) |
| 26 to 34 Years | 109 (100.0%) | 0 (0.0%) |
| 35 to 44 Years | 582 (100.0%) | 0 (0.0%) |
| 45 to 54 Years | 865 (97.4%) | 23 (2.6%) |
| 55 to 64 Years | 923 (100.0%) | 0 (0.0%) |
| 65 to 74 Years | 348 (100.0%) | 0 (0.0%) |
| 75 Years and older | 298 (100.0%) | 0 (0.0%) |
| Total | 4,764 (99.5%) | 23 (0.5%) |
Health Insurance Coverage by Citizenship Status in Flower Hill
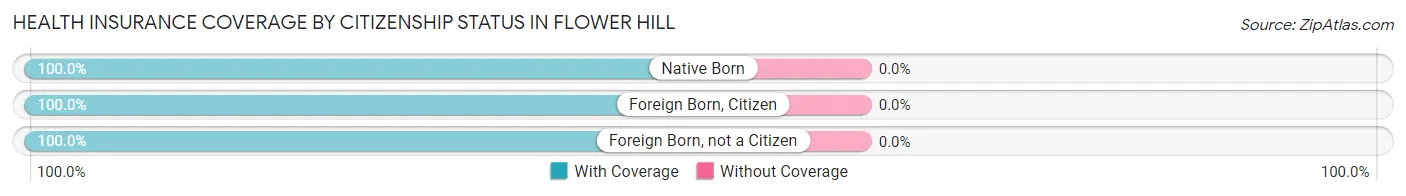
| Citizenship Status | With Coverage | Without Coverage |
| Native Born | 262 (100.0%) | 0 (0.0%) |
| Foreign Born, Citizen | 1,004 (100.0%) | 0 (0.0%) |
| Foreign Born, not a Citizen | 373 (100.0%) | 0 (0.0%) |
Health Insurance Coverage by Household Income in Flower Hill
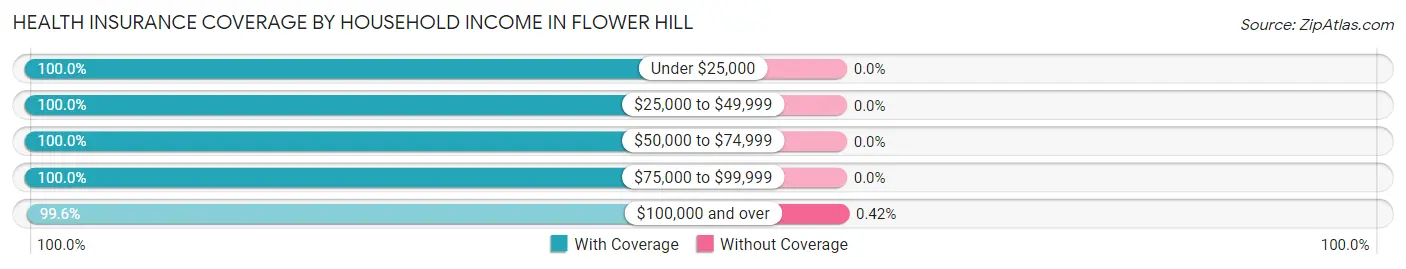
| Household Income | With Coverage | Without Coverage |
| Under $25,000 | 175 (100.0%) | 0 (0.0%) |
| $25,000 to $49,999 | 97 (100.0%) | 0 (0.0%) |
| $50,000 to $74,999 | 203 (100.0%) | 0 (0.0%) |
| $75,000 to $99,999 | 232 (100.0%) | 0 (0.0%) |
| $100,000 and over | 4,035 (99.6%) | 17 (0.4%) |
Public vs Private Health Insurance Coverage by Age in Flower Hill
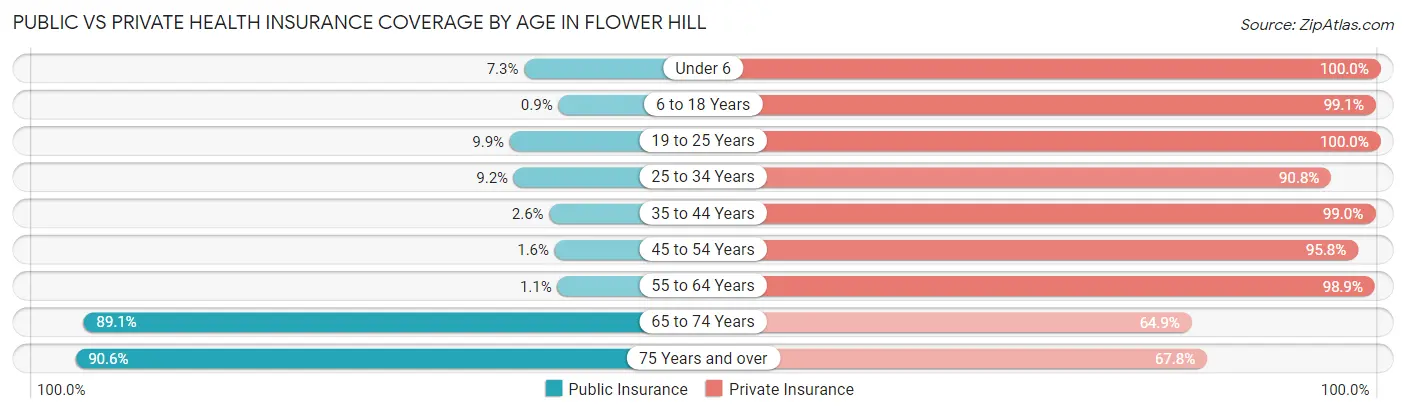
| Age Bracket | Public Insurance | Private Insurance |
| Under 6 | 19 (7.2%) | 262 (100.0%) |
| 6 to 18 Years | 9 (0.9%) | 995 (99.1%) |
| 19 to 25 Years | 37 (9.9%) | 373 (100.0%) |
| 25 to 34 Years | 10 (9.2%) | 99 (90.8%) |
| 35 to 44 Years | 15 (2.6%) | 576 (99.0%) |
| 45 to 54 Years | 14 (1.6%) | 851 (95.8%) |
| 55 to 64 Years | 10 (1.1%) | 913 (98.9%) |
| 65 to 74 Years | 310 (89.1%) | 226 (64.9%) |
| 75 Years and over | 270 (90.6%) | 202 (67.8%) |
| Total | 694 (14.5%) | 4,497 (93.9%) |
Disability Status by Sex by Age in Flower Hill
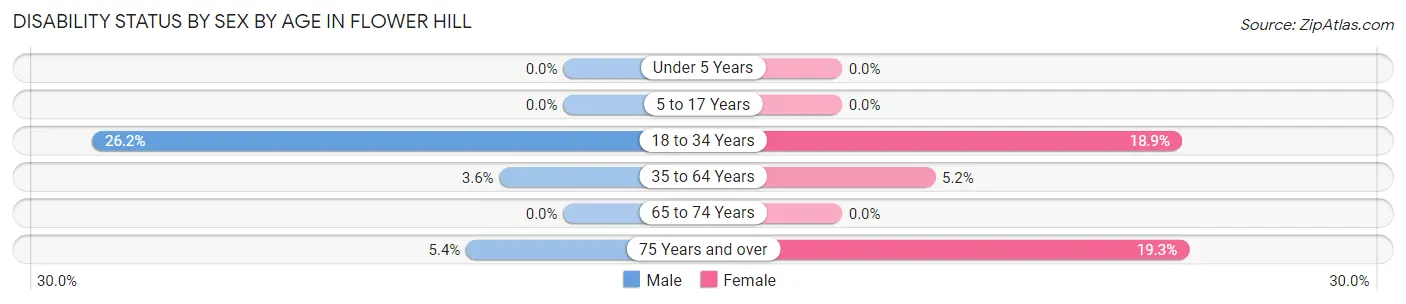
| Age Bracket | Male | Female |
| Under 5 Years | 0 (0.0%) | 0 (0.0%) |
| 5 to 17 Years | 0 (0.0%) | 0 (0.0%) |
| 18 to 34 Years | 95 (26.2%) | 32 (18.9%) |
| 35 to 64 Years | 44 (3.6%) | 60 (5.2%) |
| 65 to 74 Years | 0 (0.0%) | 0 (0.0%) |
| 75 Years and over | 8 (5.4%) | 29 (19.3%) |
Disability Class by Sex by Age in Flower Hill
Disability Class: Hearing Difficulty
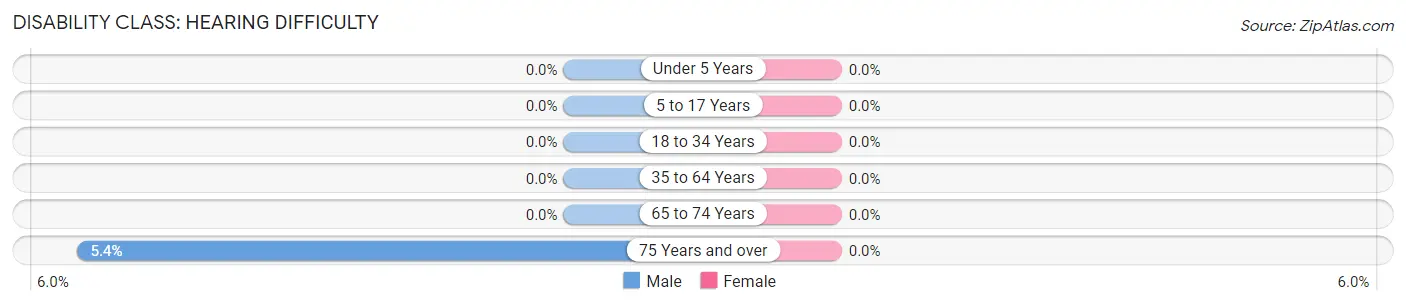
| Age Bracket | Male | Female |
| Under 5 Years | 0 (0.0%) | 0 (0.0%) |
| 5 to 17 Years | 0 (0.0%) | 0 (0.0%) |
| 18 to 34 Years | 0 (0.0%) | 0 (0.0%) |
| 35 to 64 Years | 0 (0.0%) | 0 (0.0%) |
| 65 to 74 Years | 0 (0.0%) | 0 (0.0%) |
| 75 Years and over | 8 (5.4%) | 0 (0.0%) |
Disability Class: Vision Difficulty
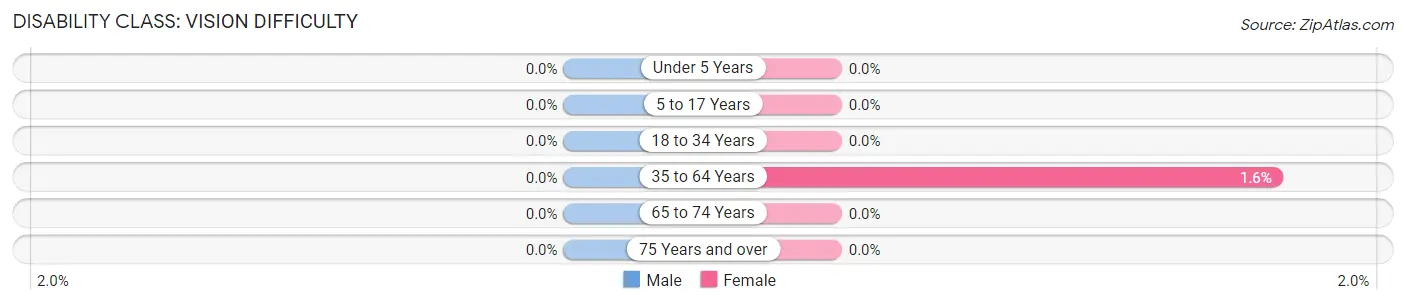
| Age Bracket | Male | Female |
| Under 5 Years | 0 (0.0%) | 0 (0.0%) |
| 5 to 17 Years | 0 (0.0%) | 0 (0.0%) |
| 18 to 34 Years | 0 (0.0%) | 0 (0.0%) |
| 35 to 64 Years | 0 (0.0%) | 19 (1.6%) |
| 65 to 74 Years | 0 (0.0%) | 0 (0.0%) |
| 75 Years and over | 0 (0.0%) | 0 (0.0%) |
Disability Class: Cognitive Difficulty
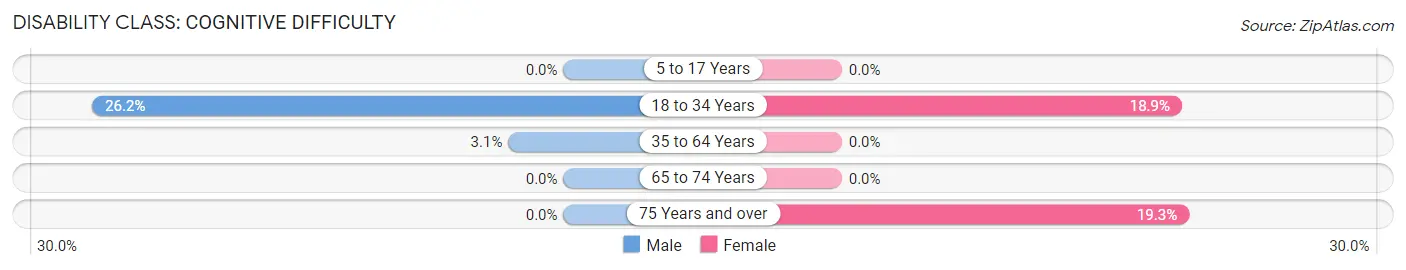
| Age Bracket | Male | Female |
| 5 to 17 Years | 0 (0.0%) | 0 (0.0%) |
| 18 to 34 Years | 95 (26.2%) | 32 (18.9%) |
| 35 to 64 Years | 38 (3.1%) | 0 (0.0%) |
| 65 to 74 Years | 0 (0.0%) | 0 (0.0%) |
| 75 Years and over | 0 (0.0%) | 29 (19.3%) |
Disability Class: Ambulatory Difficulty
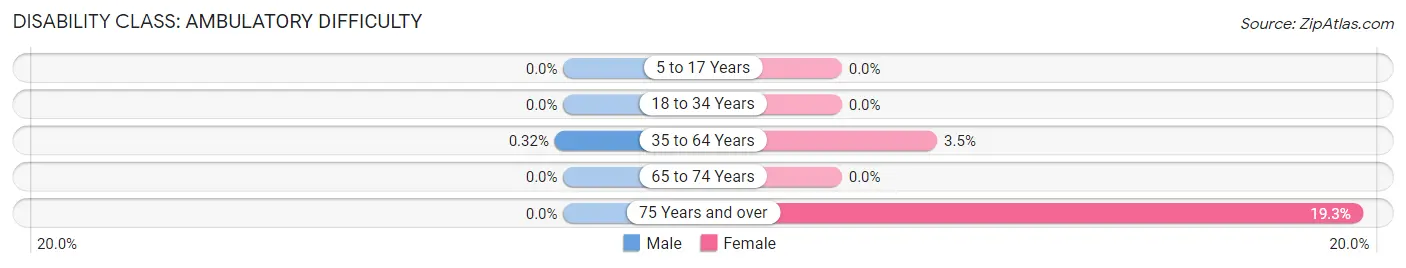
| Age Bracket | Male | Female |
| 5 to 17 Years | 0 (0.0%) | 0 (0.0%) |
| 18 to 34 Years | 0 (0.0%) | 0 (0.0%) |
| 35 to 64 Years | 4 (0.3%) | 41 (3.5%) |
| 65 to 74 Years | 0 (0.0%) | 0 (0.0%) |
| 75 Years and over | 0 (0.0%) | 29 (19.3%) |
Disability Class: Self-Care Difficulty
| Age Bracket | Male | Female |
| 5 to 17 Years | 0 (0.0%) | 0 (0.0%) |
| 18 to 34 Years | 37 (10.2%) | 0 (0.0%) |
| 35 to 64 Years | 10 (0.8%) | 0 (0.0%) |
| 65 to 74 Years | 0 (0.0%) | 0 (0.0%) |
| 75 Years and over | 8 (5.4%) | 29 (19.3%) |
Technology Access in Flower Hill
Computing Device Access in Flower Hill
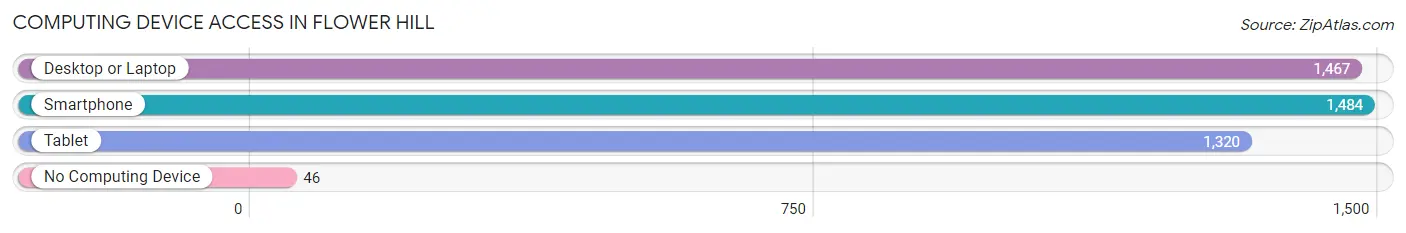
| Device Type | # Households | % Households |
| Desktop or Laptop | 1,467 | 91.5% |
| Smartphone | 1,484 | 92.5% |
| Tablet | 1,320 | 82.3% |
| No Computing Device | 46 | 2.9% |
| Total | 1,604 | 100.0% |
Internet Access in Flower Hill
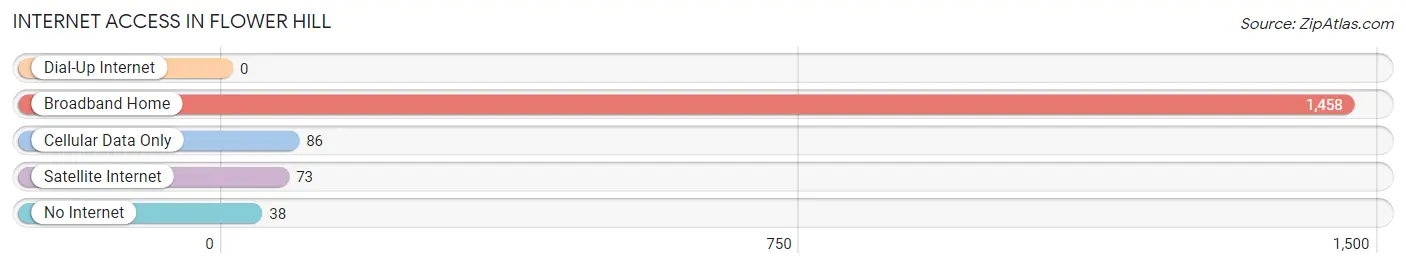
| Internet Type | # Households | % Households |
| Dial-Up Internet | 0 | 0.0% |
| Broadband Home | 1,458 | 90.9% |
| Cellular Data Only | 86 | 5.4% |
| Satellite Internet | 73 | 4.5% |
| No Internet | 38 | 2.4% |
| Total | 1,604 | 100.0% |
Flower Hill Summary
Flower Hill is a village located in Nassau County, New York, United States. The population was 4,842 at the 2010 census. Flower Hill is located in the Town of North Hempstead.
History
Flower Hill was originally part of the Matinecock Native American tribe's land. The area was first settled by Europeans in the mid-17th century. The village was incorporated in 1931.
Geography
Flower Hill is located at 40 48 17 North 73 41 17 West 40 804722 73 688056
According to the United States Census Bureau, the village has a total area of 0.7 square miles (1.8 km2), all of it land.
Economy
Flower Hill is a primarily residential community. The village is home to several small businesses, including a few restaurants, a bakery, a florist, and a few retail stores.
Demographics
As of the census of 2000, there were 4,842 people, 1,717 households, and 1,346 families residing in the village. The population density was 6,945.2 people per square mile (2,683.2/km2). There were 1,764 housing units at an average density of 2,521.2 per square mile (972.2/km2). The racial makeup of the village was 92.45% White, 0.90% African American, 0.02% Native American, 5.45% Asian, 0.02% Pacific Islander, 0.37% from other races, and 0.79% from two or more races. Hispanic or Latino of any race were 2.45% of the population.
There were 1,717 households, out of which 37.2% had children under the age of 18 living with them, 68.2% were married couples living together, 6.2% had a female householder with no husband present, and 23.2% were non-families. 19.2% of all households were made up of individuals, and 9.2% had someone living alone who was 65 years of age or older. The average household size was 2.81 and the average family size was 3.26.
In the village, the population was spread out, with 25.7% under the age of 18, 4.2% from 18 to 24, 28.2% from 25 to 44, 25.2% from 45 to 64, and 16.7% who were 65 years of age or older. The median age was 40 years. For every 100 females, there were 93.2 males. For every 100 females age 18 and over, there were 89.7 males.
The median income for a household in the village was $100,945, and the median income for a family was $118,945. Males had a median income of $81,945 versus $50,945 for females. The per capita income for the village was $50,945. About 1.2% of families and 2.2% of the population were below the poverty line, including 1.7% of those under age 18 and 2.2% of those age 65 or over.
Common Questions
What is Per Capita Income in Flower Hill?
Per Capita income in Flower Hill is $127,955.
What is the Median Family Income in Flower Hill?
Median Family Income in Flower Hill is $250,001.
What is the Median Household income in Flower Hill?
Median Household Income in Flower Hill is $250,001.
What is Income or Wage Gap in Flower Hill?
Income or Wage Gap in Flower Hill is 62.9%.
Women in Flower Hill earn 37.1 cents for every dollar earned by a man.
What is Inequality or Gini Index in Flower Hill?
Inequality or Gini Index in Flower Hill is 0.48.
What is the Total Population of Flower Hill?
Total Population of Flower Hill is 4,787.
What is the Total Male Population of Flower Hill?
Total Male Population of Flower Hill is 2,592.
What is the Total Female Population of Flower Hill?
Total Female Population of Flower Hill is 2,195.
What is the Ratio of Males per 100 Females in Flower Hill?
There are 118.09 Males per 100 Females in Flower Hill.
What is the Ratio of Females per 100 Males in Flower Hill?
There are 84.68 Females per 100 Males in Flower Hill.
What is the Median Population Age in Flower Hill?
Median Population Age in Flower Hill is 46.8 Years.
What is the Average Family Size in Flower Hill
Average Family Size in Flower Hill is 3.2 People.
What is the Average Household Size in Flower Hill
Average Household Size in Flower Hill is 3.0 People.
How Large is the Labor Force in Flower Hill?
There are 2,514 People in the Labor Forcein in Flower Hill.
What is the Percentage of People in the Labor Force in Flower Hill?
65.6% of People are in the Labor Force in Flower Hill.
What is the Unemployment Rate in Flower Hill?
Unemployment Rate in Flower Hill is 3.2%.