Water Mill, NY Map & Demographics
Water Mill Map
Water Mill Overview
$143,860
PER CAPITA INCOME
$250,001
AVG FAMILY INCOME
$174,919
AVG HOUSEHOLD INCOME
43.0%
WAGE / INCOME GAP [ % ]
57.0¢/ $1
WAGE / INCOME GAP [ $ ]
0.53
INEQUALITY / GINI INDEX
2,308
TOTAL POPULATION
1,142
MALE POPULATION
1,166
FEMALE POPULATION
97.94
MALES / 100 FEMALES
102.10
FEMALES / 100 MALES
54.9
MEDIAN AGE
2.4
AVG FAMILY SIZE
2.0
AVG HOUSEHOLD SIZE
1,463
LABOR FORCE [ PEOPLE ]
70.2%
PERCENT IN LABOR FORCE
10.9%
UNEMPLOYMENT RATE
Water Mill Zip Codes
Water Mill Area Codes
Income in Water Mill
Income Overview in Water Mill
Per Capita Income in Water Mill is $143,860, while median incomes of families and households are $250,001 and $174,919 respectively.
| Characteristic | Number | Measure |
| Per Capita Income | 2,308 | $143,860 |
| Median Family Income | 776 | $250,001 |
| Mean Family Income | 776 | $343,369 |
| Median Household Income | 1,116 | $174,919 |
| Mean Household Income | 1,116 | $295,228 |
| Income Deficit | 776 | $0 |
| Wage / Income Gap (%) | 2,308 | 43.04% |
| Wage / Income Gap ($) | 2,308 | 56.96¢ per $1 |
| Gini / Inequality Index | 2,308 | 0.53 |
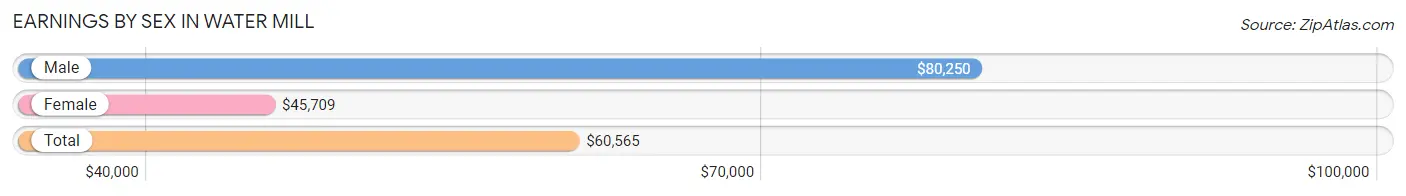
Earnings by Sex in Water Mill
Average Earnings in Water Mill are $60,565, $80,250 for men and $45,709 for women, a difference of 43.0%.
| Sex | Number | Average Earnings |
| Male | 867 (59.1%) | $80,250 |
| Female | 599 (40.9%) | $45,709 |
| Total | 1,466 (100.0%) | $60,565 |
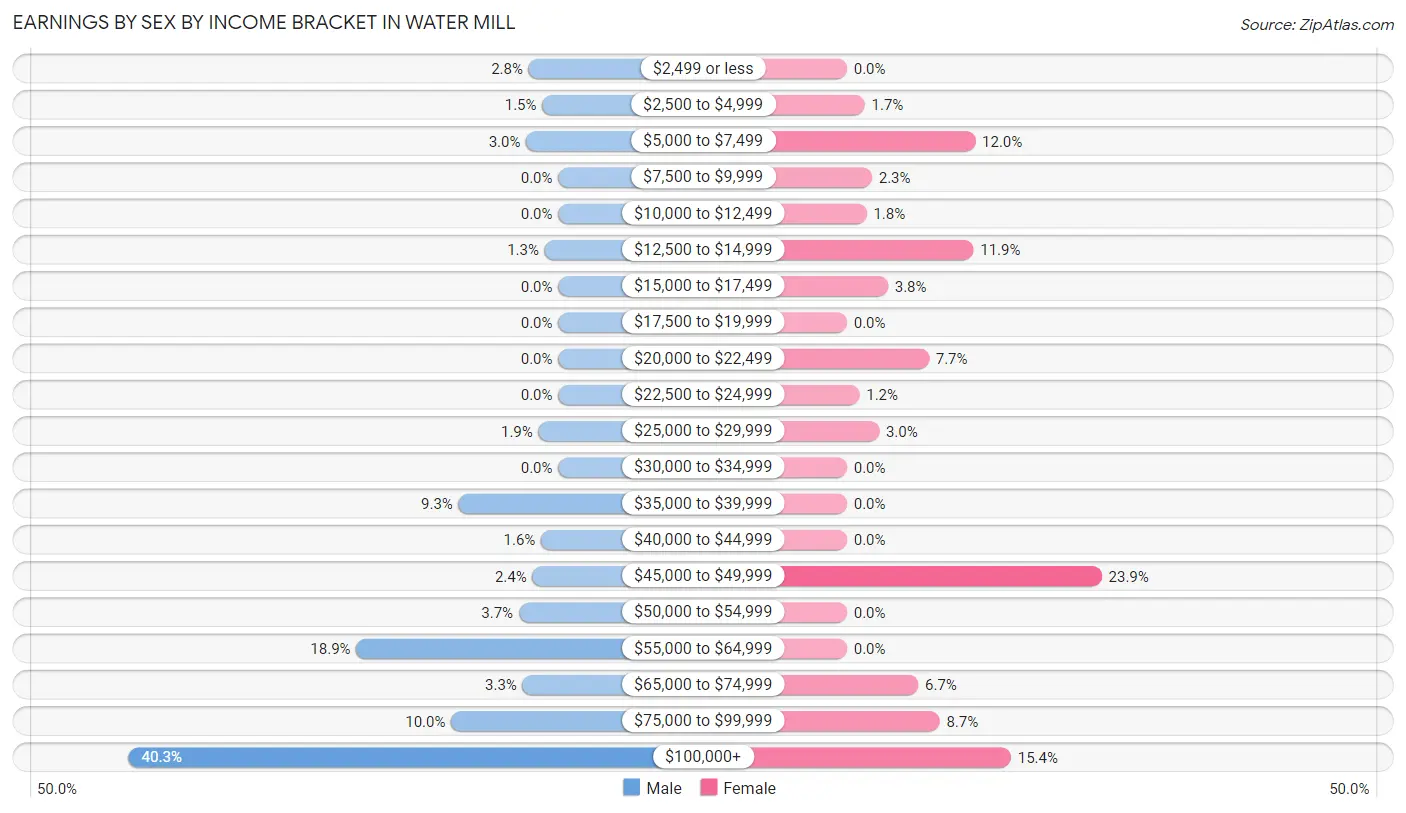
Earnings by Sex by Income Bracket in Water Mill
The most common earnings brackets in Water Mill are $100,000+ for men (349 | 40.3%) and $45,000 to $49,999 for women (143 | 23.9%).
| Income | Male | Female |
| $2,499 or less | 24 (2.8%) | 0 (0.0%) |
| $2,500 to $4,999 | 13 (1.5%) | 10 (1.7%) |
| $5,000 to $7,499 | 26 (3.0%) | 72 (12.0%) |
| $7,500 to $9,999 | 0 (0.0%) | 14 (2.3%) |
| $10,000 to $12,499 | 0 (0.0%) | 11 (1.8%) |
| $12,500 to $14,999 | 11 (1.3%) | 71 (11.8%) |
| $15,000 to $17,499 | 0 (0.0%) | 23 (3.8%) |
| $17,500 to $19,999 | 0 (0.0%) | 0 (0.0%) |
| $20,000 to $22,499 | 0 (0.0%) | 46 (7.7%) |
| $22,500 to $24,999 | 0 (0.0%) | 7 (1.2%) |
| $25,000 to $29,999 | 16 (1.8%) | 18 (3.0%) |
| $30,000 to $34,999 | 0 (0.0%) | 0 (0.0%) |
| $35,000 to $39,999 | 81 (9.3%) | 0 (0.0%) |
| $40,000 to $44,999 | 14 (1.6%) | 0 (0.0%) |
| $45,000 to $49,999 | 21 (2.4%) | 143 (23.9%) |
| $50,000 to $54,999 | 32 (3.7%) | 0 (0.0%) |
| $55,000 to $64,999 | 164 (18.9%) | 0 (0.0%) |
| $65,000 to $74,999 | 29 (3.3%) | 40 (6.7%) |
| $75,000 to $99,999 | 87 (10.0%) | 52 (8.7%) |
| $100,000+ | 349 (40.3%) | 92 (15.4%) |
| Total | 867 (100.0%) | 599 (100.0%) |
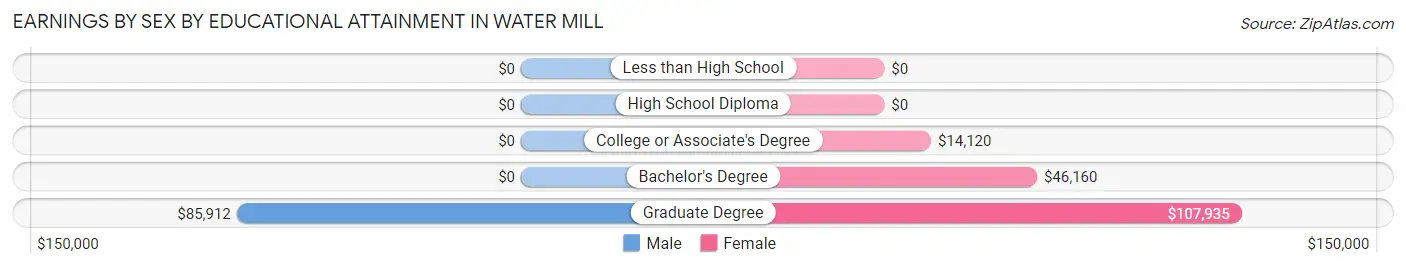
Earnings by Sex by Educational Attainment in Water Mill
Average earnings in Water Mill are $80,700 for men and $46,314 for women, a difference of 42.6%. Men with an educational attainment of graduate degree enjoy the highest average annual earnings of $85,912, while those with graduate degree education earn the least with $85,912. Women with an educational attainment of graduate degree earn the most with the average annual earnings of $107,935, while those with college or associate's degree education have the smallest earnings of $14,120.
| Educational Attainment | Male Income | Female Income |
| Less than High School | - | - |
| High School Diploma | - | - |
| College or Associate's Degree | - | - |
| Bachelor's Degree | - | - |
| Graduate Degree | $85,912 | $107,935 |
| Total | $80,700 | $46,314 |
Family Income in Water Mill
Family Income Brackets in Water Mill
According to the Water Mill family income data, there are 472 families falling into the $200,000+ income range, which is the most common income bracket and makes up 60.8% of all families.
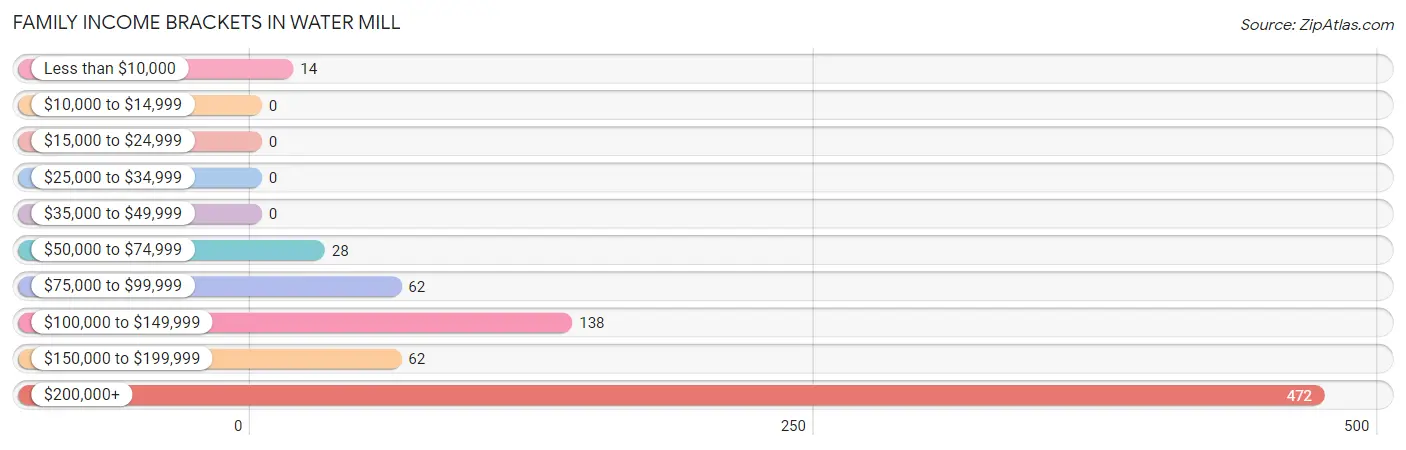
| Income Bracket | # Families | % Families |
| Less than $10,000 | 14 | 1.8% |
| $10,000 to $14,999 | 0 | 0.0% |
| $15,000 to $24,999 | 0 | 0.0% |
| $25,000 to $34,999 | 0 | 0.0% |
| $35,000 to $49,999 | 0 | 0.0% |
| $50,000 to $74,999 | 28 | 3.6% |
| $75,000 to $99,999 | 62 | 8.0% |
| $100,000 to $149,999 | 138 | 17.8% |
| $150,000 to $199,999 | 62 | 8.0% |
| $200,000+ | 472 | 60.8% |
Family Income by Famaliy Size in Water Mill
2-person families (580 | 74.7%) account for the highest median family income in Water Mill with $250,001 per family, while 2-person families (580 | 74.7%) have the highest median income of $125,000 per family member.
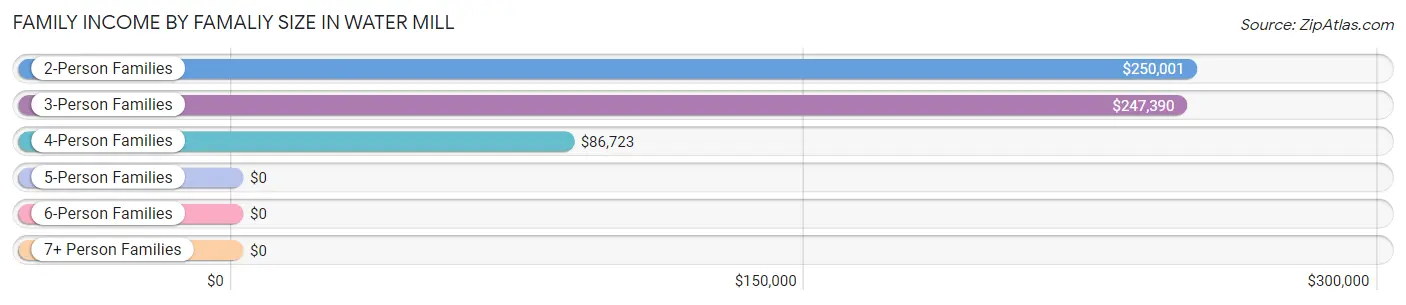
| Income Bracket | # Families | Median Income |
| 2-Person Families | 580 (74.7%) | $250,001 |
| 3-Person Families | 121 (15.6%) | $247,390 |
| 4-Person Families | 75 (9.7%) | $86,723 |
| 5-Person Families | 0 (0.0%) | $0 |
| 6-Person Families | 0 (0.0%) | $0 |
| 7+ Person Families | 0 (0.0%) | $0 |
| Total | 776 (100.0%) | $250,001 |
Family Income by Number of Earners in Water Mill
The median family income in Water Mill is $250,001, with families comprising no earners (85) having the highest median family income of $250,001, while families with 1 earner (237) have the lowest median family income of $128,650, accounting for 11.0% and 30.5% of families, respectively.
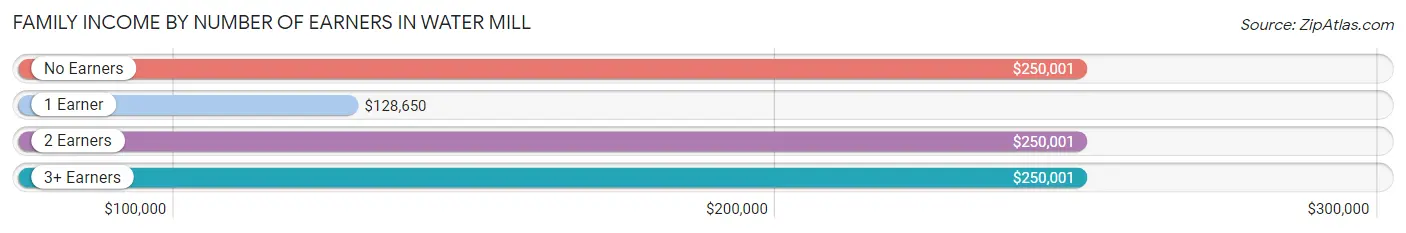
| Number of Earners | # Families | Median Income |
| No Earners | 85 (11.0%) | $250,001 |
| 1 Earner | 237 (30.5%) | $128,650 |
| 2 Earners | 408 (52.6%) | $250,001 |
| 3+ Earners | 46 (5.9%) | $250,001 |
| Total | 776 (100.0%) | $250,001 |
Household Income in Water Mill
Household Income Brackets in Water Mill
With 527 households falling in the category, the $200,000+ income range is the most frequent in Water Mill, accounting for 47.2% of all households.
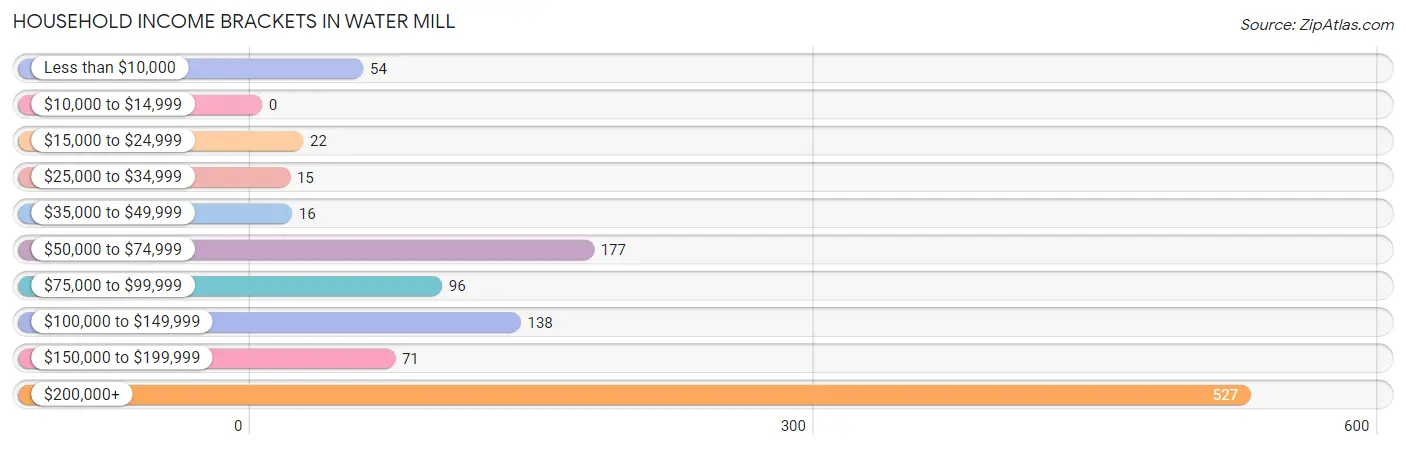
| Income Bracket | # Households | % Households |
| Less than $10,000 | 54 | 4.8% |
| $10,000 to $14,999 | 0 | 0.0% |
| $15,000 to $24,999 | 22 | 2.0% |
| $25,000 to $34,999 | 15 | 1.3% |
| $35,000 to $49,999 | 16 | 1.4% |
| $50,000 to $74,999 | 177 | 15.9% |
| $75,000 to $99,999 | 96 | 8.6% |
| $100,000 to $149,999 | 138 | 12.4% |
| $150,000 to $199,999 | 71 | 6.4% |
| $200,000+ | 527 | 47.2% |
Household Income by Householder Age in Water Mill
The median household income in Water Mill is $174,919, with the highest median household income of $250,001 found in the 25 to 44 years age bracket for the primary householder. A total of 256 households (22.9%) fall into this category. Meanwhile, the 15 to 24 years age bracket for the primary householder has the lowest median household income of $0, with 24 households (2.1%) in this group.
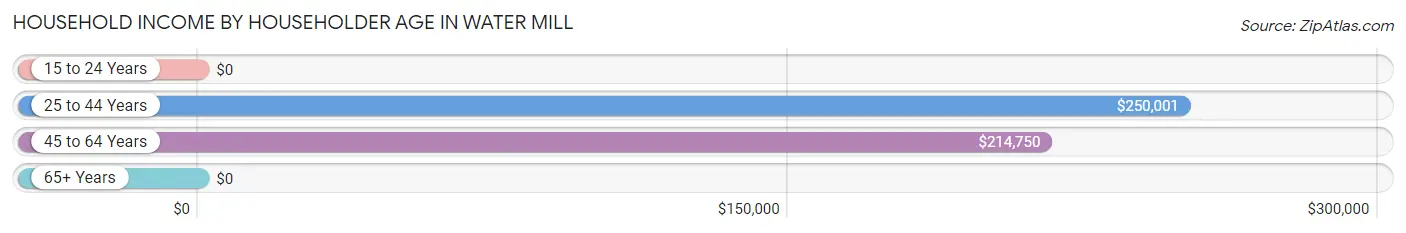
| Income Bracket | # Households | Median Income |
| 15 to 24 Years | 24 (2.1%) | $0 |
| 25 to 44 Years | 256 (22.9%) | $250,001 |
| 45 to 64 Years | 518 (46.4%) | $214,750 |
| 65+ Years | 318 (28.5%) | $0 |
| Total | 1,116 (100.0%) | $174,919 |
Poverty in Water Mill
Income Below Poverty by Sex and Age in Water Mill
With 0.8% poverty level for males and 13.0% for females among the residents of Water Mill, 75 year old and over males and 45 to 54 year old females are the most vulnerable to poverty, with 3 males (4.3%) and 74 females (33.8%) in their respective age groups living below the poverty level.
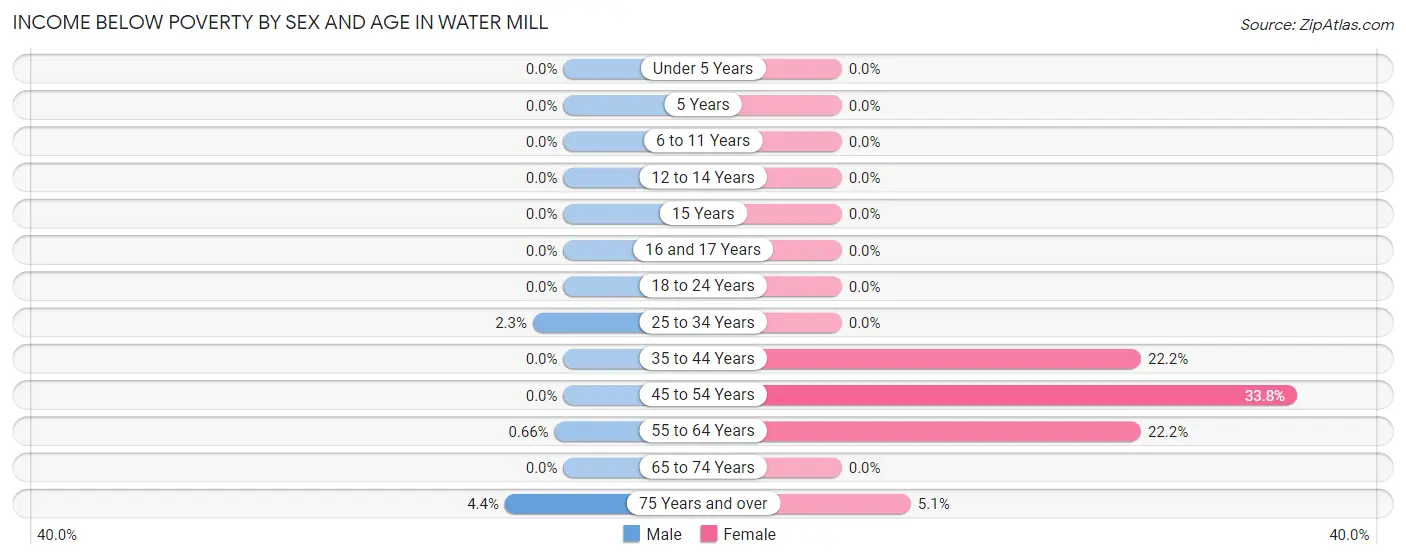
| Age Bracket | Male | Female |
| Under 5 Years | 0 (0.0%) | 0 (0.0%) |
| 5 Years | 0 (0.0%) | 0 (0.0%) |
| 6 to 11 Years | 0 (0.0%) | 0 (0.0%) |
| 12 to 14 Years | 0 (0.0%) | 0 (0.0%) |
| 15 Years | 0 (0.0%) | 0 (0.0%) |
| 16 and 17 Years | 0 (0.0%) | 0 (0.0%) |
| 18 to 24 Years | 0 (0.0%) | 0 (0.0%) |
| 25 to 34 Years | 3 (2.3%) | 0 (0.0%) |
| 35 to 44 Years | 0 (0.0%) | 14 (22.2%) |
| 45 to 54 Years | 0 (0.0%) | 74 (33.8%) |
| 55 to 64 Years | 3 (0.7%) | 54 (22.2%) |
| 65 to 74 Years | 0 (0.0%) | 0 (0.0%) |
| 75 Years and over | 3 (4.3%) | 10 (5.1%) |
| Total | 9 (0.8%) | 152 (13.0%) |
Income Above Poverty by Sex and Age in Water Mill
According to the poverty statistics in Water Mill, males aged under 5 years and females aged under 5 years are the age groups that are most secure financially, with 100.0% of males and 100.0% of females in these age groups living above the poverty line.
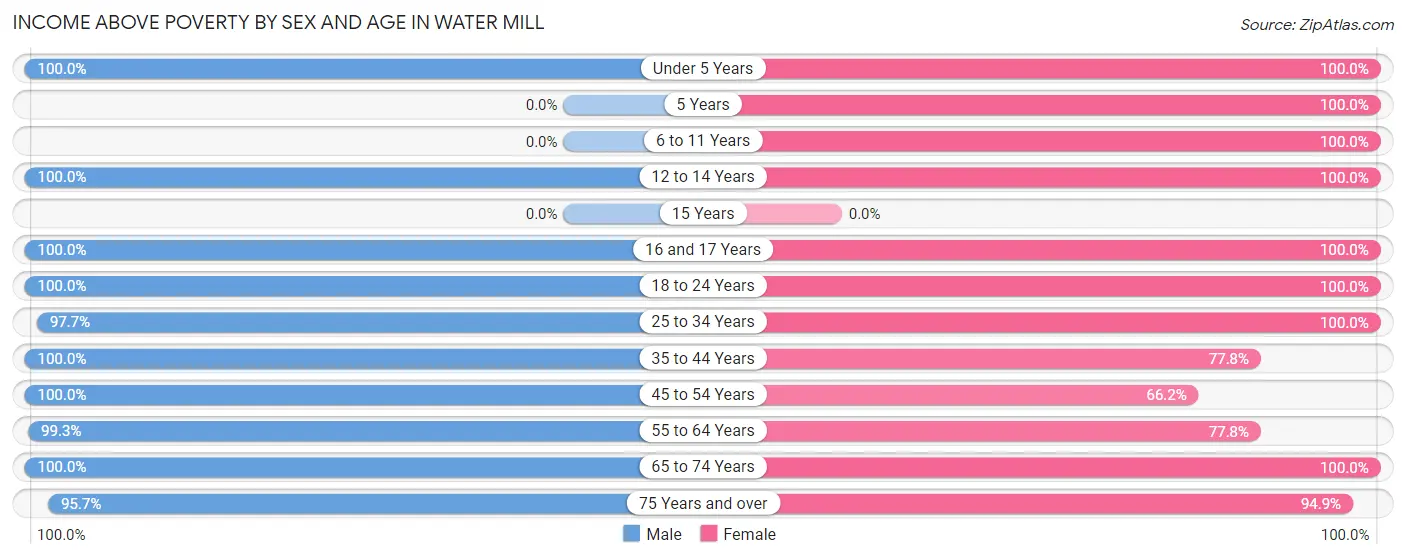
| Age Bracket | Male | Female |
| Under 5 Years | 69 (100.0%) | 20 (100.0%) |
| 5 Years | 0 (0.0%) | 11 (100.0%) |
| 6 to 11 Years | 0 (0.0%) | 65 (100.0%) |
| 12 to 14 Years | 34 (100.0%) | 25 (100.0%) |
| 15 Years | 0 (0.0%) | 0 (0.0%) |
| 16 and 17 Years | 11 (100.0%) | 21 (100.0%) |
| 18 to 24 Years | 18 (100.0%) | 47 (100.0%) |
| 25 to 34 Years | 129 (97.7%) | 146 (100.0%) |
| 35 to 44 Years | 164 (100.0%) | 49 (77.8%) |
| 45 to 54 Years | 112 (100.0%) | 145 (66.2%) |
| 55 to 64 Years | 450 (99.3%) | 189 (77.8%) |
| 65 to 74 Years | 80 (100.0%) | 111 (100.0%) |
| 75 Years and over | 66 (95.7%) | 185 (94.9%) |
| Total | 1,133 (99.2%) | 1,014 (87.0%) |
Income Below Poverty Among Married-Couple Families in Water Mill
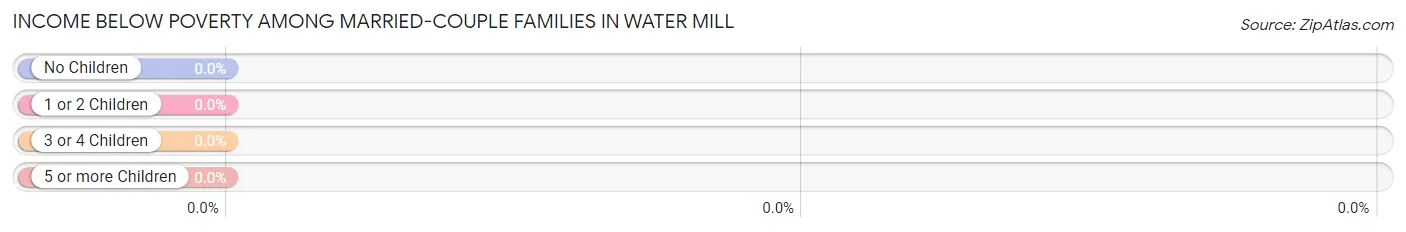
| Children | Above Poverty | Below Poverty |
| No Children | 468 (100.0%) | 0 (0.0%) |
| 1 or 2 Children | 141 (100.0%) | 0 (0.0%) |
| 3 or 4 Children | 0 (0.0%) | 0 (0.0%) |
| 5 or more Children | 0 (0.0%) | 0 (0.0%) |
| Total | 609 (100.0%) | 0 (0.0%) |
Income Below Poverty Among Single-Parent Households in Water Mill

| Children | Single Father | Single Mother |
| No Children | 0 (0.0%) | 14 (56.0%) |
| 1 or 2 Children | 0 (0.0%) | 0 (0.0%) |
| 3 or 4 Children | 0 (0.0%) | 0 (0.0%) |
| 5 or more Children | 0 (0.0%) | 0 (0.0%) |
| Total | 0 (0.0%) | 14 (29.2%) |
Income Below Poverty Among Married-Couple vs Single-Parent Households in Water Mill
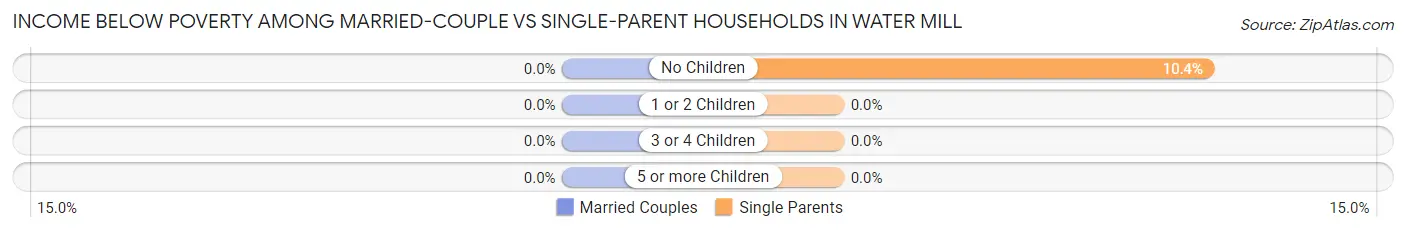
| Children | Married-Couple Families | Single-Parent Households |
| No Children | 0 (0.0%) | 14 (10.4%) |
| 1 or 2 Children | 0 (0.0%) | 0 (0.0%) |
| 3 or 4 Children | 0 (0.0%) | 0 (0.0%) |
| 5 or more Children | 0 (0.0%) | 0 (0.0%) |
| Total | 0 (0.0%) | 14 (8.4%) |
Race in Water Mill
The most populous races in Water Mill are White / Caucasian (2,032 | 88.0%), Two or more Races (226 | 9.8%), and Hispanic or Latino (207 | 9.0%).
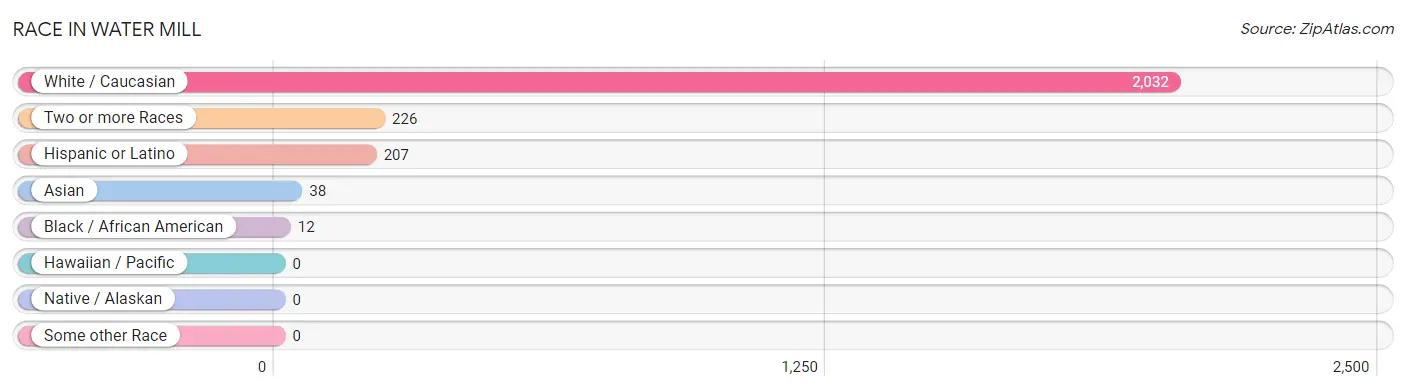
| Race | # Population | % Population |
| Asian | 38 | 1.7% |
| Black / African American | 12 | 0.5% |
| Hawaiian / Pacific | 0 | 0.0% |
| Hispanic or Latino | 207 | 9.0% |
| Native / Alaskan | 0 | 0.0% |
| White / Caucasian | 2,032 | 88.0% |
| Two or more Races | 226 | 9.8% |
| Some other Race | 0 | 0.0% |
| Total | 2,308 | 100.0% |
Ancestry in Water Mill
The most populous ancestries reported in Water Mill are German (328 | 14.2%), Irish (309 | 13.4%), Polish (282 | 12.2%), Russian (264 | 11.4%), and Eastern European (224 | 9.7%), together accounting for 61.0% of all Water Mill residents.
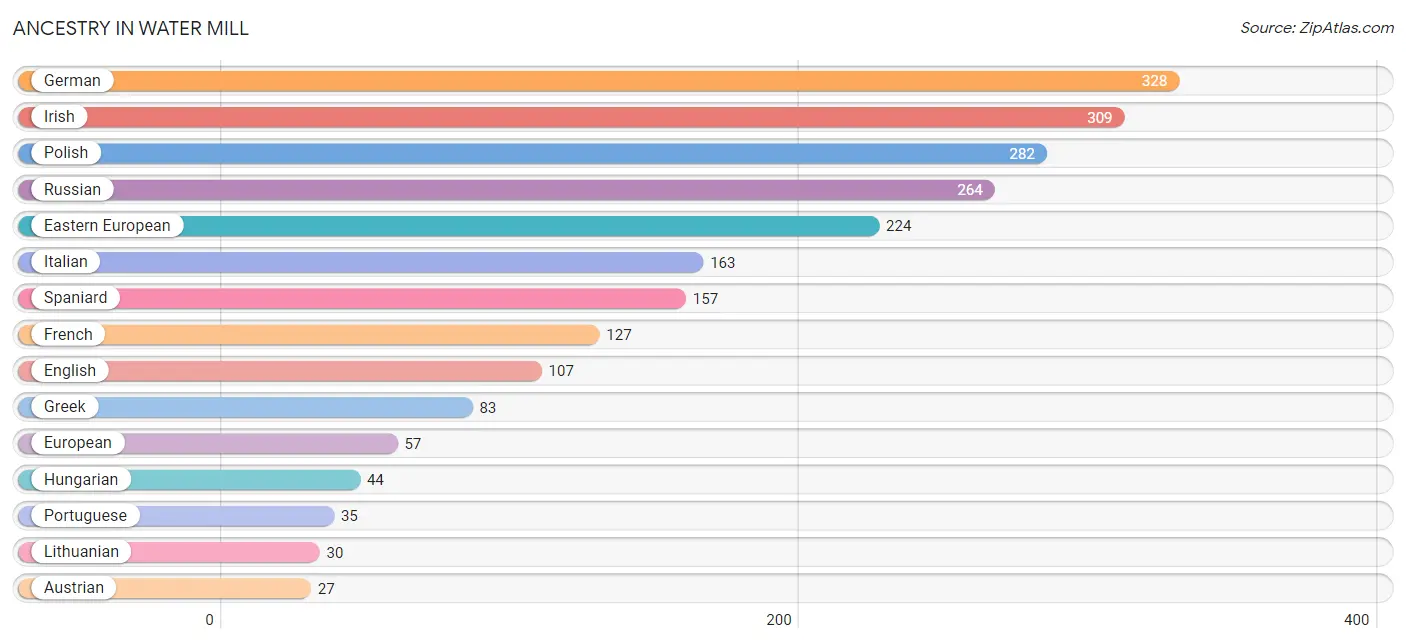
| Ancestry | # Population | % Population |
| American | 18 | 0.8% |
| Argentinean | 24 | 1.0% |
| Austrian | 27 | 1.2% |
| British | 12 | 0.5% |
| Central American | 3 | 0.1% |
| Eastern European | 224 | 9.7% |
| English | 107 | 4.6% |
| European | 57 | 2.5% |
| French | 127 | 5.5% |
| French Canadian | 20 | 0.9% |
| German | 328 | 14.2% |
| Greek | 83 | 3.6% |
| Haitian | 9 | 0.4% |
| Hungarian | 44 | 1.9% |
| Indian (Asian) | 13 | 0.6% |
| Irish | 309 | 13.4% |
| Italian | 163 | 7.1% |
| Korean | 2 | 0.1% |
| Lithuanian | 30 | 1.3% |
| Mexican | 22 | 0.9% |
| Polish | 282 | 12.2% |
| Portuguese | 35 | 1.5% |
| Puerto Rican | 1 | 0.0% |
| Romanian | 16 | 0.7% |
| Russian | 264 | 11.4% |
| Salvadoran | 3 | 0.1% |
| Scottish | 22 | 0.9% |
| Slavic | 5 | 0.2% |
| South American | 24 | 1.0% |
| Spaniard | 157 | 6.8% |
| Swedish | 13 | 0.6% |
| Thai | 23 | 1.0% | View All 32 Rows |
Immigrants in Water Mill
The most numerous immigrant groups reported in Water Mill came from Europe (234 | 10.1%), Southern Europe (99 | 4.3%), Spain (99 | 4.3%), Eastern Europe (71 | 3.1%), and Russia (71 | 3.1%), together accounting for 24.9% of all Water Mill residents.
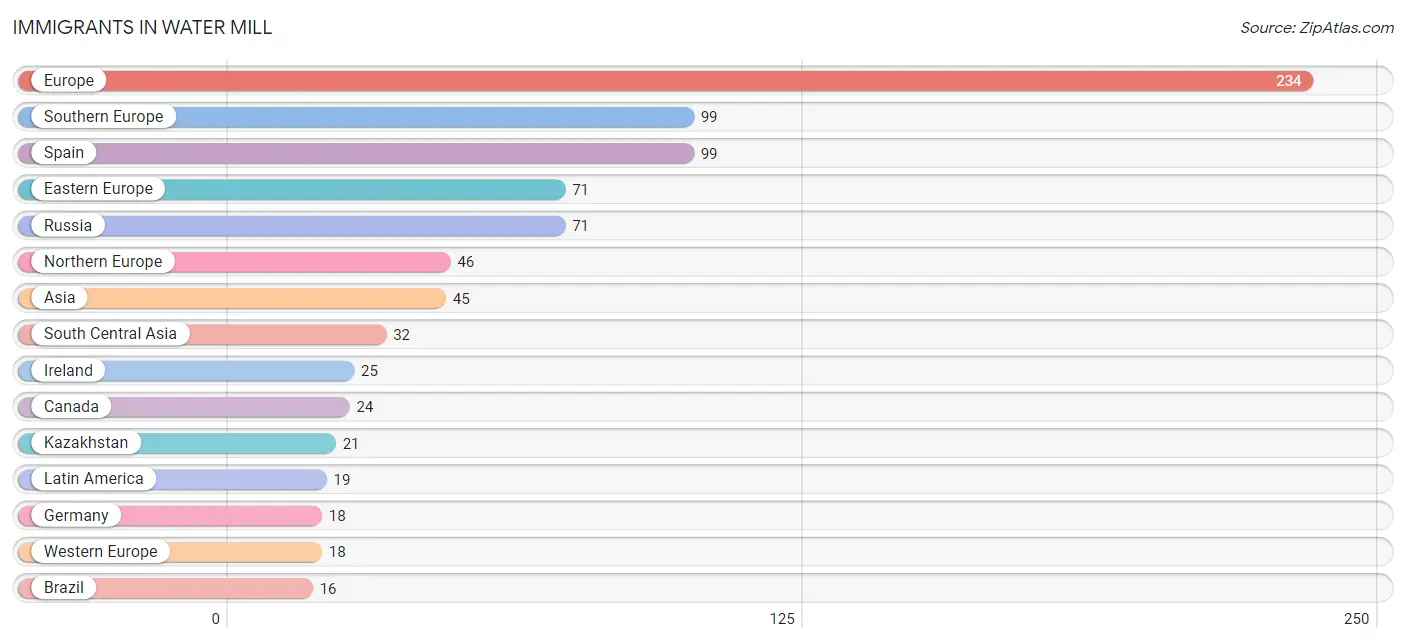
| Immigration Origin | # Population | % Population |
| Asia | 45 | 1.9% |
| Brazil | 16 | 0.7% |
| Canada | 24 | 1.0% |
| Central America | 3 | 0.1% |
| China | 13 | 0.6% |
| Eastern Asia | 13 | 0.6% |
| Eastern Europe | 71 | 3.1% |
| El Salvador | 3 | 0.1% |
| Europe | 234 | 10.1% |
| Germany | 18 | 0.8% |
| Hong Kong | 6 | 0.3% |
| India | 11 | 0.5% |
| Ireland | 25 | 1.1% |
| Kazakhstan | 21 | 0.9% |
| Latin America | 19 | 0.8% |
| Northern Europe | 46 | 2.0% |
| Russia | 71 | 3.1% |
| Scotland | 12 | 0.5% |
| South America | 16 | 0.7% |
| South Central Asia | 32 | 1.4% |
| Southern Europe | 99 | 4.3% |
| Spain | 99 | 4.3% |
| Taiwan | 7 | 0.3% |
| Western Europe | 18 | 0.8% | View All 24 Rows |
Sex and Age in Water Mill
Sex and Age in Water Mill
The most populous age groups in Water Mill are 55 to 59 Years (251 | 22.0%) for men and 45 to 49 Years (151 | 13.0%) for women.
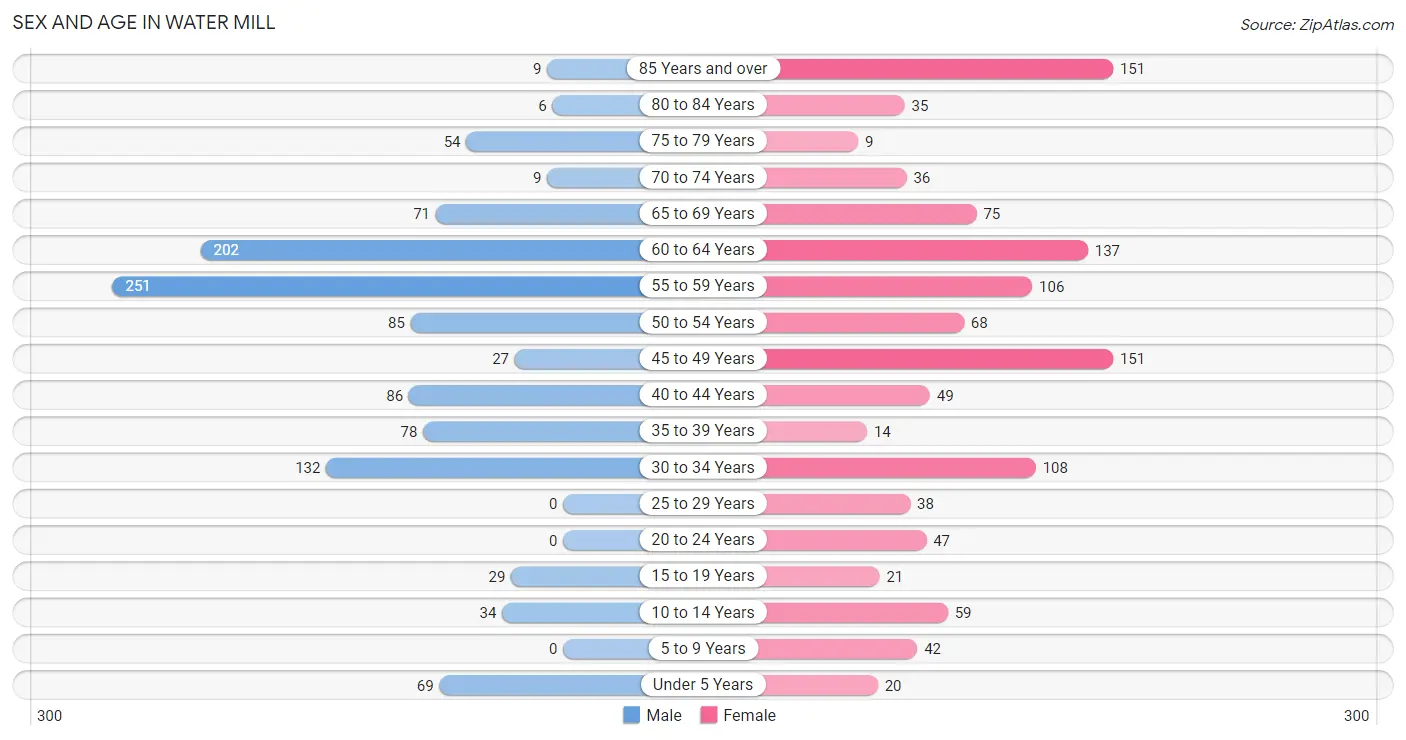
| Age Bracket | Male | Female |
| Under 5 Years | 69 (6.0%) | 20 (1.7%) |
| 5 to 9 Years | 0 (0.0%) | 42 (3.6%) |
| 10 to 14 Years | 34 (3.0%) | 59 (5.1%) |
| 15 to 19 Years | 29 (2.5%) | 21 (1.8%) |
| 20 to 24 Years | 0 (0.0%) | 47 (4.0%) |
| 25 to 29 Years | 0 (0.0%) | 38 (3.3%) |
| 30 to 34 Years | 132 (11.6%) | 108 (9.3%) |
| 35 to 39 Years | 78 (6.8%) | 14 (1.2%) |
| 40 to 44 Years | 86 (7.5%) | 49 (4.2%) |
| 45 to 49 Years | 27 (2.4%) | 151 (13.0%) |
| 50 to 54 Years | 85 (7.4%) | 68 (5.8%) |
| 55 to 59 Years | 251 (22.0%) | 106 (9.1%) |
| 60 to 64 Years | 202 (17.7%) | 137 (11.7%) |
| 65 to 69 Years | 71 (6.2%) | 75 (6.4%) |
| 70 to 74 Years | 9 (0.8%) | 36 (3.1%) |
| 75 to 79 Years | 54 (4.7%) | 9 (0.8%) |
| 80 to 84 Years | 6 (0.5%) | 35 (3.0%) |
| 85 Years and over | 9 (0.8%) | 151 (13.0%) |
| Total | 1,142 (100.0%) | 1,166 (100.0%) |
Families and Households in Water Mill
Median Family Size in Water Mill
The median family size in Water Mill is 2.39 persons per family, with married-couple families (609 | 78.5%) accounting for the largest median family size of 2.45 persons per family. On the other hand, single female/mother families (48 | 6.2%) represent the smallest median family size with 2.06 persons per family.
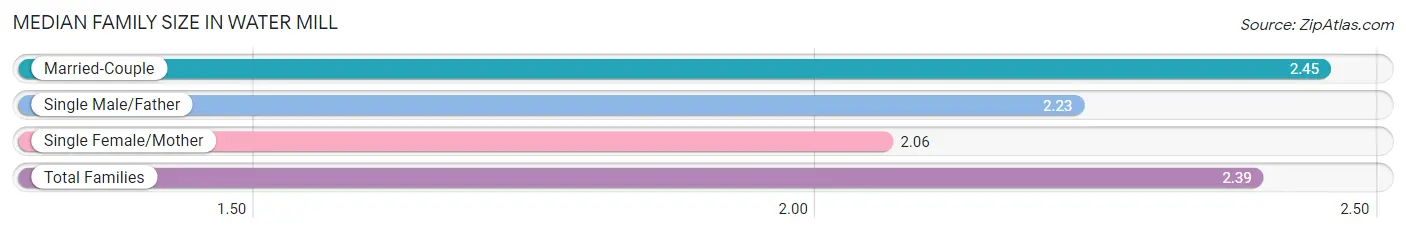
| Family Type | # Families | Family Size |
| Married-Couple | 609 (78.5%) | 2.45 |
| Single Male/Father | 119 (15.3%) | 2.23 |
| Single Female/Mother | 48 (6.2%) | 2.06 |
| Total Families | 776 (100.0%) | 2.39 |
Median Household Size in Water Mill
The median household size in Water Mill is 2.05 persons per household, with single male/father households (119 | 10.7%) accounting for the largest median household size of 2.82 persons per household. non-family households (340 | 30.5%) represent the smallest median household size with 1.08 persons per household.
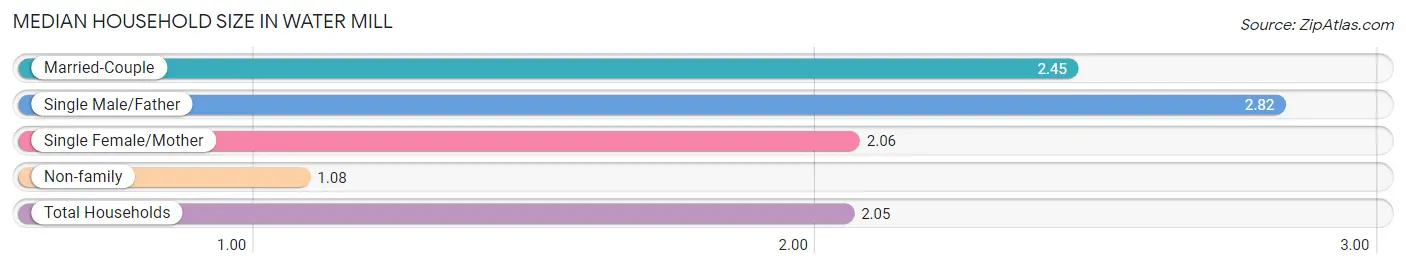
| Household Type | # Households | Household Size |
| Married-Couple | 609 (54.6%) | 2.45 |
| Single Male/Father | 119 (10.7%) | 2.82 |
| Single Female/Mother | 48 (4.3%) | 2.06 |
| Non-family | 340 (30.5%) | 1.08 |
| Total Households | 1,116 (100.0%) | 2.05 |
Household Size by Marriage Status in Water Mill
Out of a total of 1,116 households in Water Mill, 776 (69.5%) are family households, while 340 (30.5%) are nonfamily households. The most numerous type of family households are 2-person households, comprising 508, and the most common type of nonfamily households are 1-person households, comprising 310.
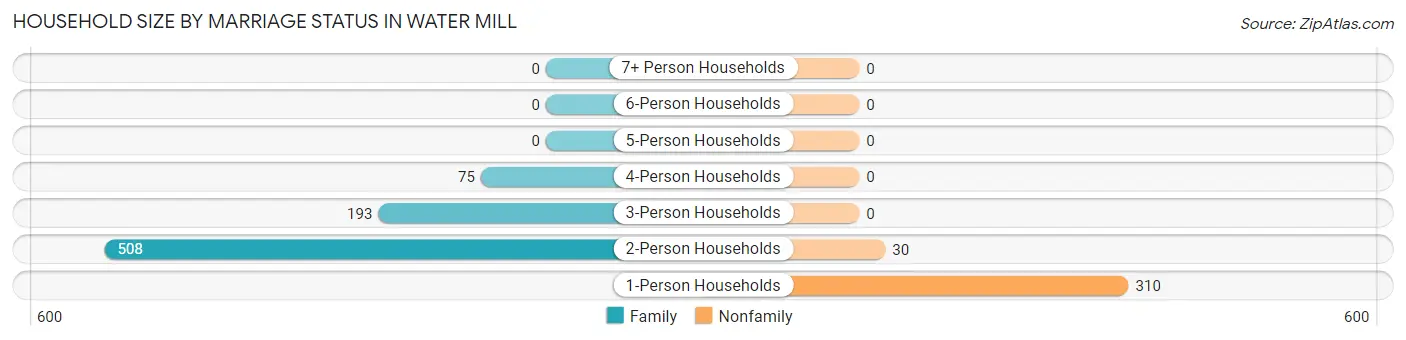
| Household Size | Family Households | Nonfamily Households |
| 1-Person Households | - | 310 (27.8%) |
| 2-Person Households | 508 (45.5%) | 30 (2.7%) |
| 3-Person Households | 193 (17.3%) | 0 (0.0%) |
| 4-Person Households | 75 (6.7%) | 0 (0.0%) |
| 5-Person Households | 0 (0.0%) | 0 (0.0%) |
| 6-Person Households | 0 (0.0%) | 0 (0.0%) |
| 7+ Person Households | 0 (0.0%) | 0 (0.0%) |
| Total | 776 (69.5%) | 340 (30.5%) |
Female Fertility in Water Mill
Fertility by Age in Water Mill
Average fertility rate in Water Mill is 122.0 births per 1,000 women. Women in the age bracket of 35 to 50 years have the highest fertility rate with 131.0 births per 1,000 women. Women in the age bracket of 35 to 50 years acount for 56.4% of all women with births.
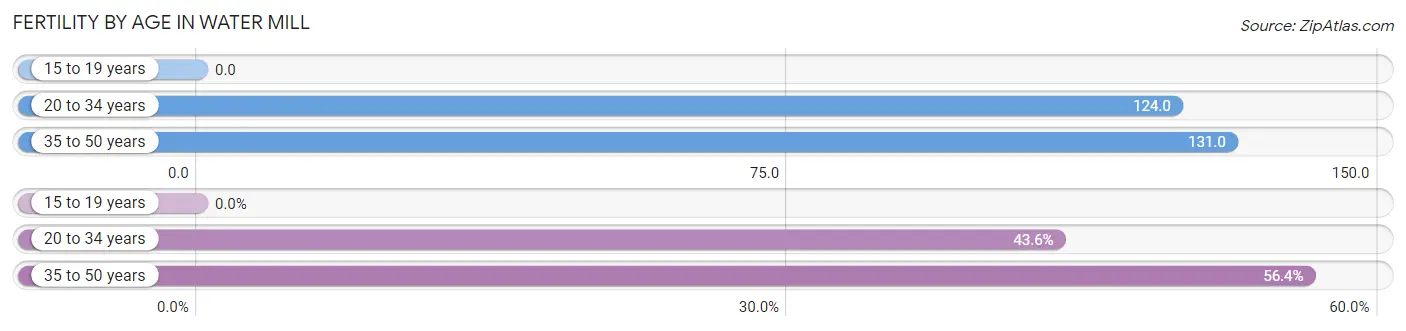
| Age Bracket | Women with Births | Births / 1,000 Women |
| 15 to 19 years | 0 (0.0%) | 0.0 |
| 20 to 34 years | 24 (43.6%) | 124.0 |
| 35 to 50 years | 31 (56.4%) | 131.0 |
| Total | 55 (100.0%) | 122.0 |
Fertility by Age by Marriage Status in Water Mill
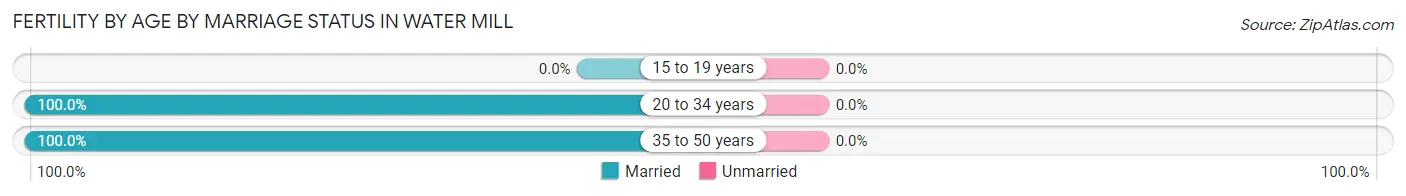
| Age Bracket | Married | Unmarried |
| 15 to 19 years | 0 (0.0%) | 0 (0.0%) |
| 20 to 34 years | 24 (100.0%) | 0 (0.0%) |
| 35 to 50 years | 31 (100.0%) | 0 (0.0%) |
| Total | 55 (100.0%) | 0 (0.0%) |
Fertility by Education in Water Mill
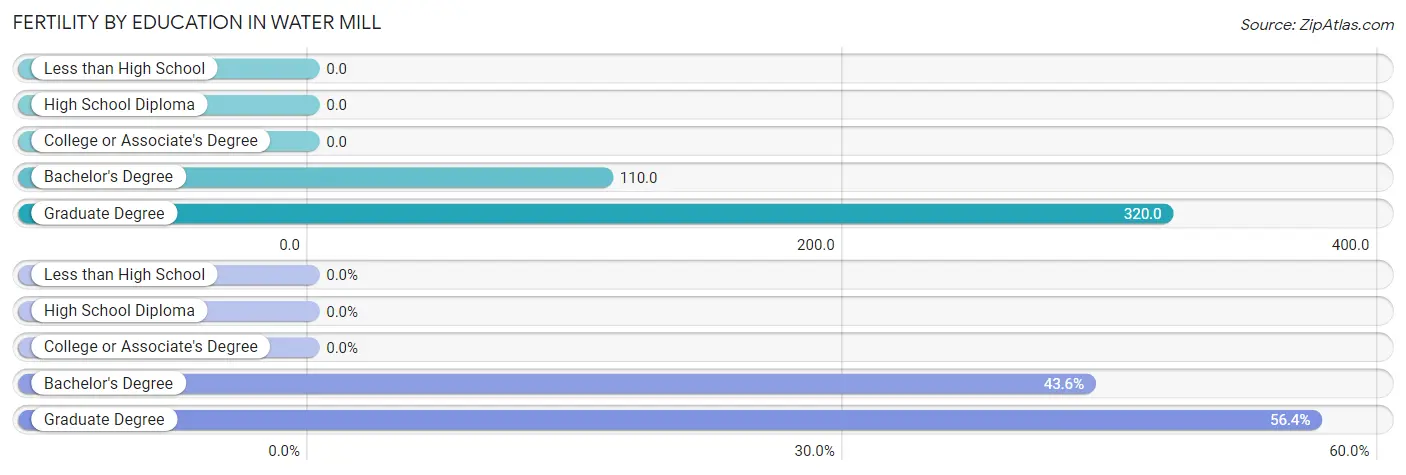
| Educational Attainment | Women with Births | Births / 1,000 Women |
| Less than High School | 0 (0.0%) | 0.0 |
| High School Diploma | 0 (0.0%) | 0.0 |
| College or Associate's Degree | 0 (0.0%) | 0.0 |
| Bachelor's Degree | 24 (43.6%) | 110.0 |
| Graduate Degree | 31 (56.4%) | 320.0 |
| Total | 55 (100.0%) | 122.0 |
Fertility by Education by Marriage Status in Water Mill
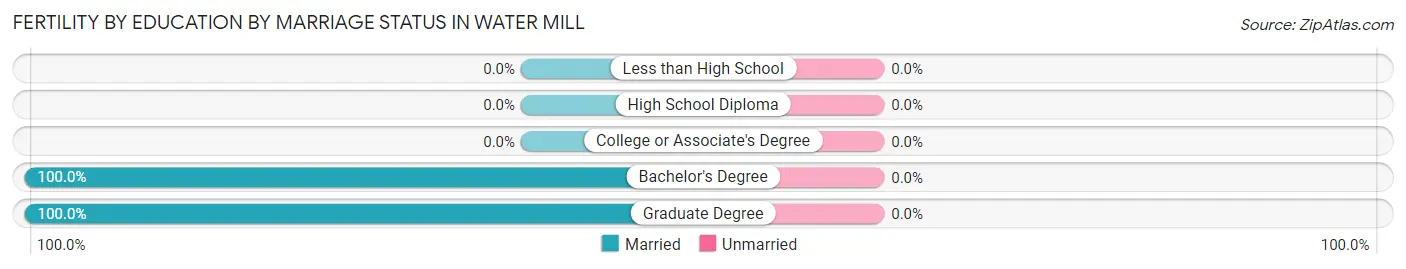
| Educational Attainment | Married | Unmarried |
| Less than High School | 0 (0.0%) | 0 (0.0%) |
| High School Diploma | 0 (0.0%) | 0 (0.0%) |
| College or Associate's Degree | 0 (0.0%) | 0 (0.0%) |
| Bachelor's Degree | 24 (100.0%) | 0 (0.0%) |
| Graduate Degree | 31 (100.0%) | 0 (0.0%) |
| Total | 55 (100.0%) | 0 (0.0%) |
Employment Characteristics in Water Mill
Employment by Class of Employer in Water Mill
Among the 1,209 employed individuals in Water Mill, private company employees (828 | 68.5%), self-employed (not incorporated) (175 | 14.5%), and not-for-profit organizations (93 | 7.7%) make up the most common classes of employment.
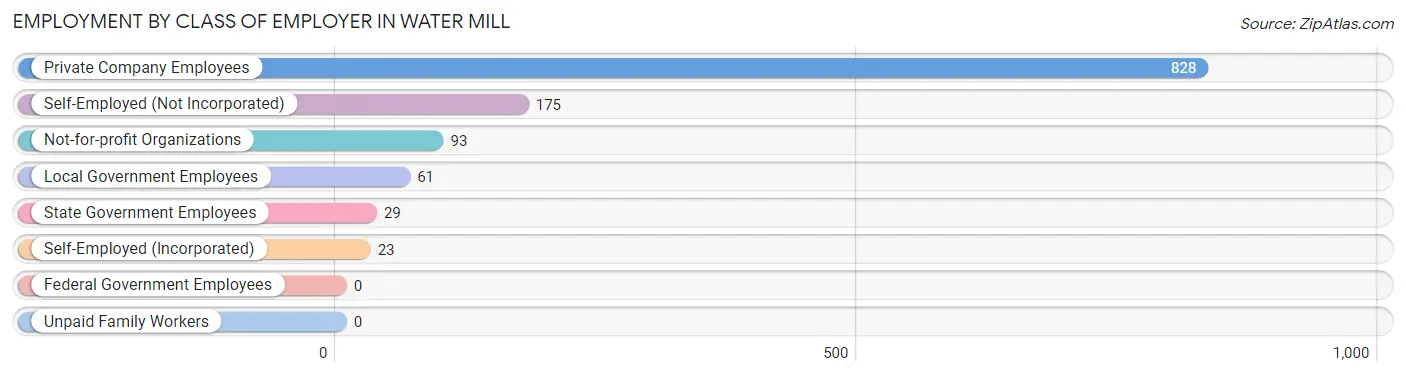
| Employer Class | # Employees | % Employees |
| Private Company Employees | 828 | 68.5% |
| Self-Employed (Incorporated) | 23 | 1.9% |
| Self-Employed (Not Incorporated) | 175 | 14.5% |
| Not-for-profit Organizations | 93 | 7.7% |
| Local Government Employees | 61 | 5.1% |
| State Government Employees | 29 | 2.4% |
| Federal Government Employees | 0 | 0.0% |
| Unpaid Family Workers | 0 | 0.0% |
| Total | 1,209 | 100.0% |
Employment Status by Age in Water Mill
According to the labor force statistics for Water Mill, out of the total population over 16 years of age (2,084), 70.2% or 1,463 individuals are in the labor force, with 10.9% or 159 of them unemployed. The age group with the highest labor force participation rate is 20 to 24 years, with 100.0% or 47 individuals in the labor force. Within the labor force, the 60 to 64 years age range has the highest percentage of unemployed individuals, with 45.1% or 111 of them being unemployed.
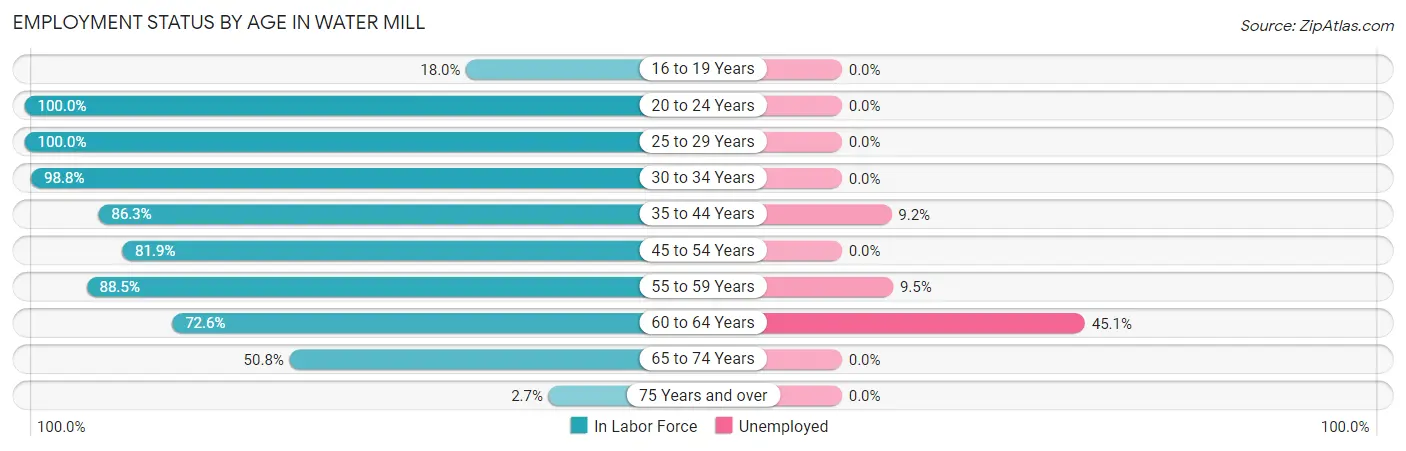
| Age Bracket | In Labor Force | Unemployed |
| 16 to 19 Years | 9 (18.0%) | 0 (0.0%) |
| 20 to 24 Years | 47 (100.0%) | 0 (0.0%) |
| 25 to 29 Years | 38 (100.0%) | 0 (0.0%) |
| 30 to 34 Years | 237 (98.8%) | 0 (0.0%) |
| 35 to 44 Years | 196 (86.3%) | 18 (9.2%) |
| 45 to 54 Years | 271 (81.9%) | 0 (0.0%) |
| 55 to 59 Years | 316 (88.5%) | 30 (9.5%) |
| 60 to 64 Years | 246 (72.6%) | 111 (45.1%) |
| 65 to 74 Years | 97 (50.8%) | 0 (0.0%) |
| 75 Years and over | 7 (2.7%) | 0 (0.0%) |
| Total | 1,463 (70.2%) | 159 (10.9%) |
Employment Status by Educational Attainment in Water Mill
According to labor force statistics for Water Mill, 85.1% of individuals (1,304) out of the total population between 25 and 64 years of age (1,532) are in the labor force, with 12.2% or 159 of them being unemployed. The group with the highest labor force participation rate are those with the educational attainment of college / associate degree, with 89.4% or 161 individuals in the labor force. Within the labor force, individuals with high school diploma education have the highest percentage of unemployment, with 41.9% or 31 of them being unemployed.
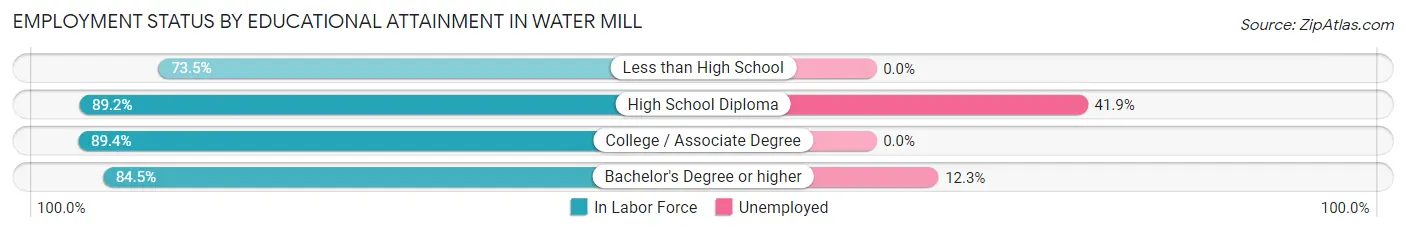
| Educational Attainment | In Labor Force | Unemployed |
| Less than High School | 25 (73.5%) | 0 (0.0%) |
| High School Diploma | 74 (89.2%) | 35 (41.9%) |
| College / Associate Degree | 161 (89.4%) | 0 (0.0%) |
| Bachelor's Degree or higher | 1,044 (84.5%) | 152 (12.3%) |
| Total | 1,304 (85.1%) | 187 (12.2%) |
Employment Occupations by Sex in Water Mill
Management, Business, Science and Arts Occupations
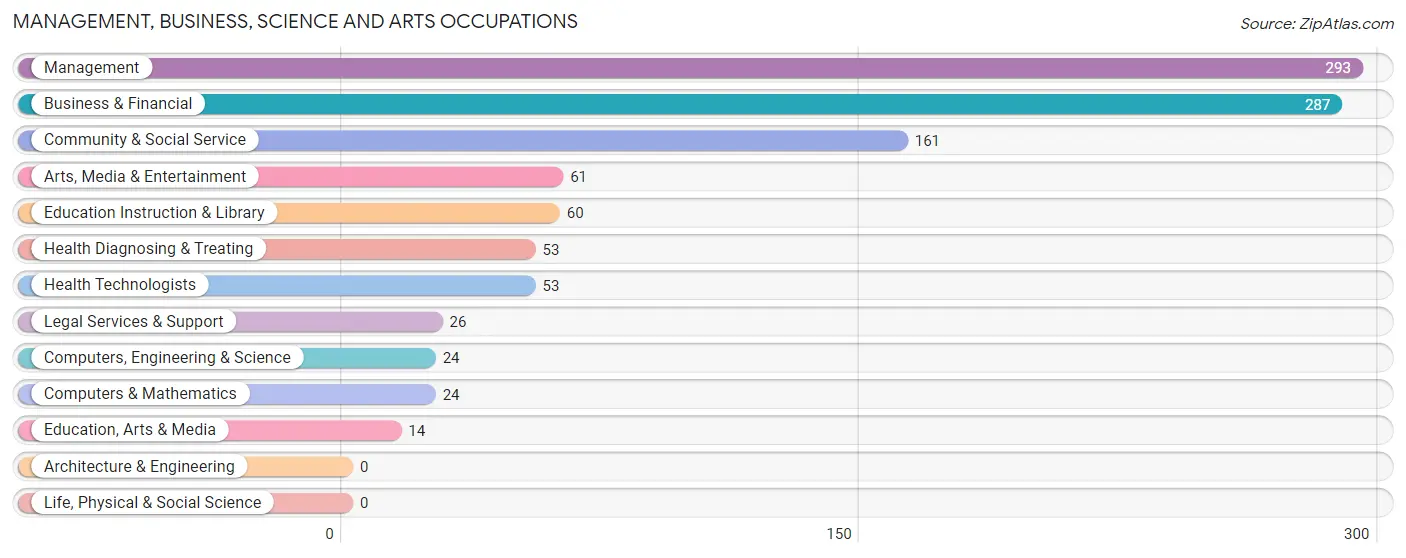
The most common Management, Business, Science and Arts occupations in Water Mill are Management (293 | 22.5%), Business & Financial (287 | 22.0%), Community & Social Service (161 | 12.3%), Arts, Media & Entertainment (61 | 4.7%), and Education Instruction & Library (60 | 4.6%).
Management, Business, Science and Arts Occupations by Sex
Within the Management, Business, Science and Arts occupations in Water Mill, the most male-oriented occupations are Computers, Engineering & Science (100.0%), Computers & Mathematics (100.0%), and Legal Services & Support (73.1%), while the most female-oriented occupations are Education Instruction & Library (100.0%), Education, Arts & Media (85.7%), and Health Diagnosing & Treating (83.0%).
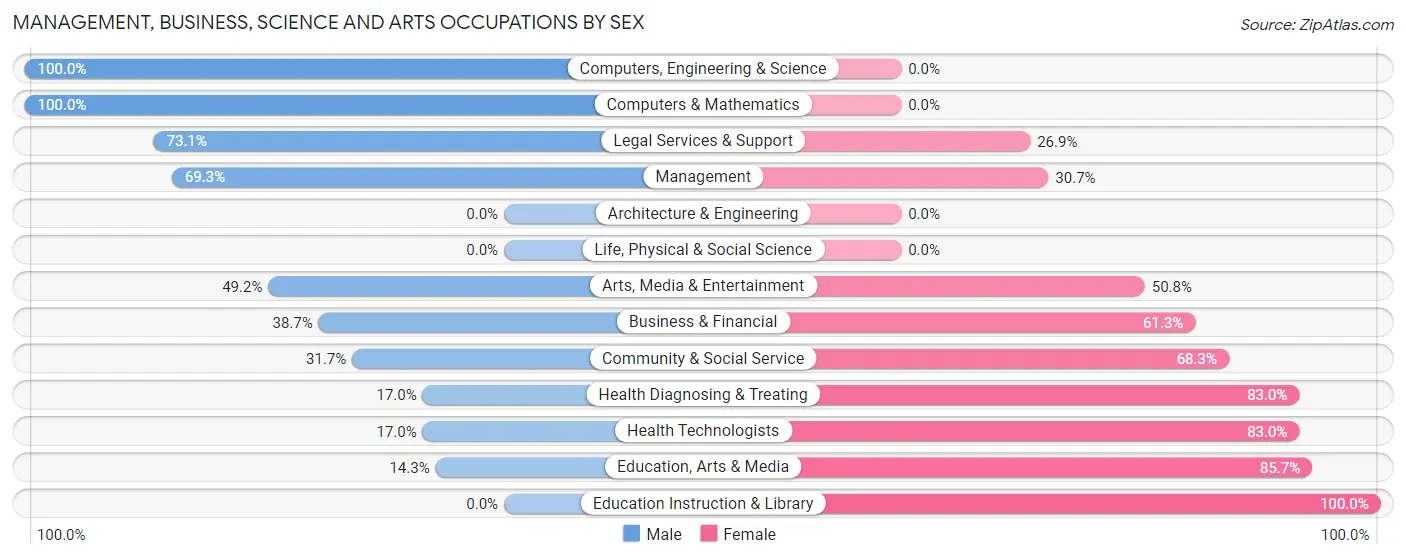
| Occupation | Male | Female |
| Management | 203 (69.3%) | 90 (30.7%) |
| Business & Financial | 111 (38.7%) | 176 (61.3%) |
| Computers, Engineering & Science | 24 (100.0%) | 0 (0.0%) |
| Computers & Mathematics | 24 (100.0%) | 0 (0.0%) |
| Architecture & Engineering | 0 (0.0%) | 0 (0.0%) |
| Life, Physical & Social Science | 0 (0.0%) | 0 (0.0%) |
| Community & Social Service | 51 (31.7%) | 110 (68.3%) |
| Education, Arts & Media | 2 (14.3%) | 12 (85.7%) |
| Legal Services & Support | 19 (73.1%) | 7 (26.9%) |
| Education Instruction & Library | 0 (0.0%) | 60 (100.0%) |
| Arts, Media & Entertainment | 30 (49.2%) | 31 (50.8%) |
| Health Diagnosing & Treating | 9 (17.0%) | 44 (83.0%) |
| Health Technologists | 9 (17.0%) | 44 (83.0%) |
| Total (Category) | 398 (48.7%) | 420 (51.3%) |
| Total (Overall) | 734 (56.2%) | 571 (43.8%) |
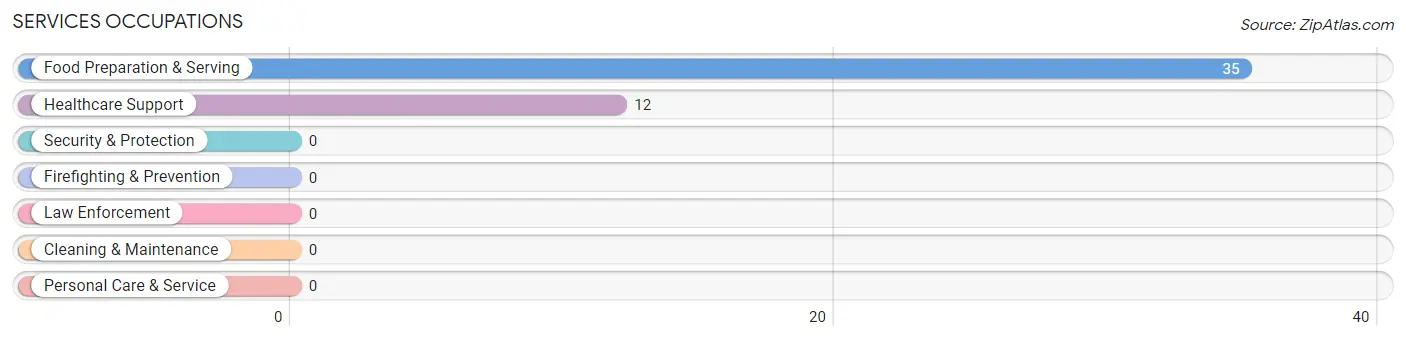
Services Occupations
The most common Services occupations in Water Mill are Food Preparation & Serving (35 | 2.7%), and Healthcare Support (12 | 0.9%).
Services Occupations by Sex
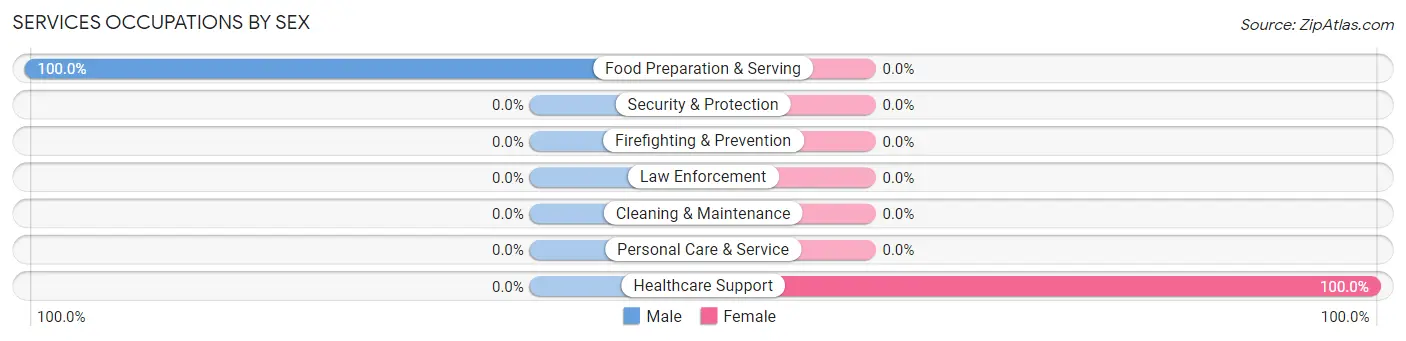
| Occupation | Male | Female |
| Healthcare Support | 0 (0.0%) | 12 (100.0%) |
| Security & Protection | 0 (0.0%) | 0 (0.0%) |
| Firefighting & Prevention | 0 (0.0%) | 0 (0.0%) |
| Law Enforcement | 0 (0.0%) | 0 (0.0%) |
| Food Preparation & Serving | 35 (100.0%) | 0 (0.0%) |
| Cleaning & Maintenance | 0 (0.0%) | 0 (0.0%) |
| Personal Care & Service | 0 (0.0%) | 0 (0.0%) |
| Total (Category) | 35 (74.5%) | 12 (25.5%) |
| Total (Overall) | 734 (56.2%) | 571 (43.8%) |
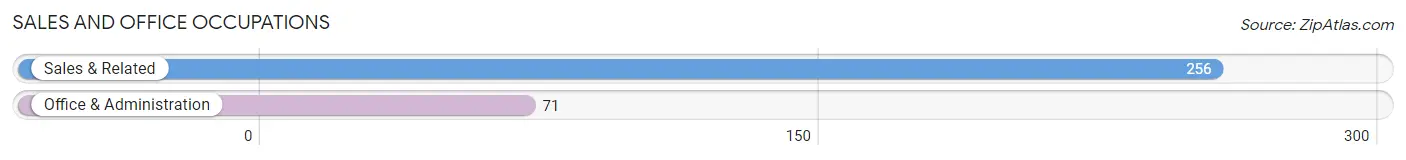
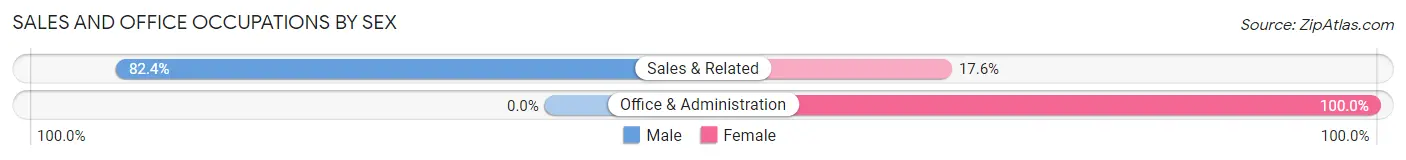
Sales and Office Occupations
The most common Sales and Office occupations in Water Mill are Sales & Related (256 | 19.6%), and Office & Administration (71 | 5.4%).
Sales and Office Occupations by Sex
| Occupation | Male | Female |
| Sales & Related | 211 (82.4%) | 45 (17.6%) |
| Office & Administration | 0 (0.0%) | 71 (100.0%) |
| Total (Category) | 211 (64.5%) | 116 (35.5%) |
| Total (Overall) | 734 (56.2%) | 571 (43.8%) |
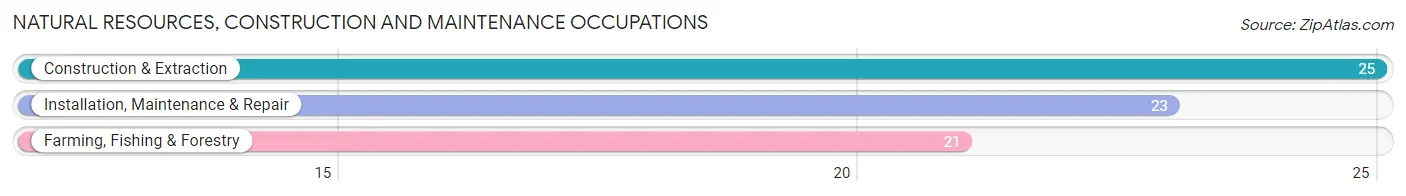
Natural Resources, Construction and Maintenance Occupations
The most common Natural Resources, Construction and Maintenance occupations in Water Mill are Construction & Extraction (25 | 1.9%), Installation, Maintenance & Repair (23 | 1.8%), and Farming, Fishing & Forestry (21 | 1.6%).
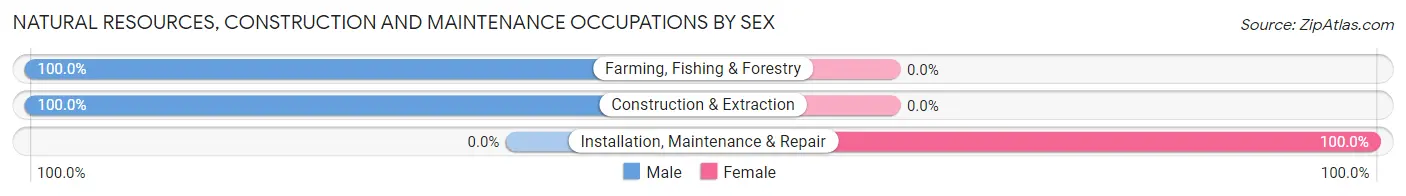
Natural Resources, Construction and Maintenance Occupations by Sex
| Occupation | Male | Female |
| Farming, Fishing & Forestry | 21 (100.0%) | 0 (0.0%) |
| Construction & Extraction | 25 (100.0%) | 0 (0.0%) |
| Installation, Maintenance & Repair | 0 (0.0%) | 23 (100.0%) |
| Total (Category) | 46 (66.7%) | 23 (33.3%) |
| Total (Overall) | 734 (56.2%) | 571 (43.8%) |
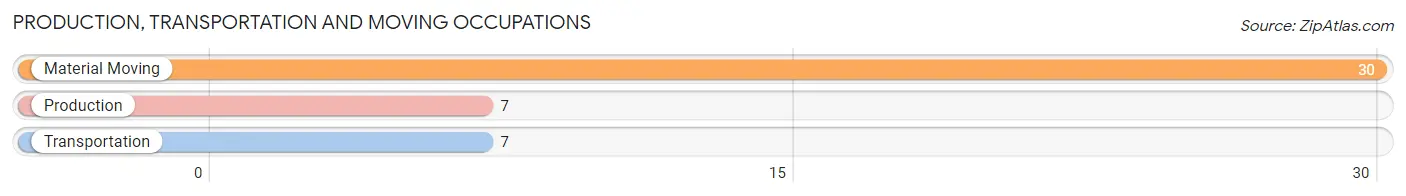
Production, Transportation and Moving Occupations
The most common Production, Transportation and Moving occupations in Water Mill are Material Moving (30 | 2.3%), Production (7 | 0.5%), and Transportation (7 | 0.5%).
Production, Transportation and Moving Occupations by Sex
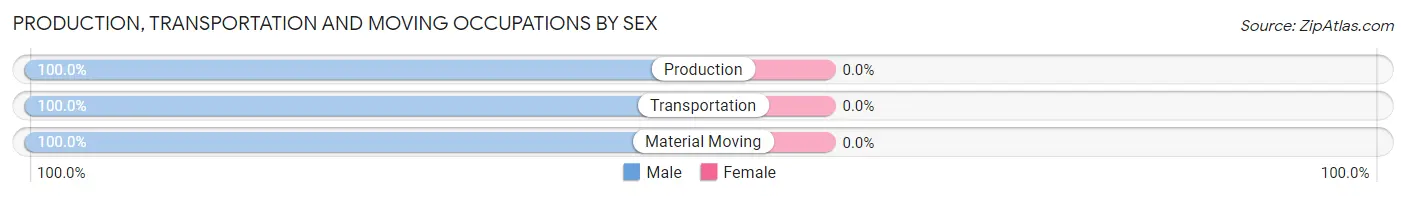
| Occupation | Male | Female |
| Production | 7 (100.0%) | 0 (0.0%) |
| Transportation | 7 (100.0%) | 0 (0.0%) |
| Material Moving | 30 (100.0%) | 0 (0.0%) |
| Total (Category) | 44 (100.0%) | 0 (0.0%) |
| Total (Overall) | 734 (56.2%) | 571 (43.8%) |
Employment Industries by Sex in Water Mill
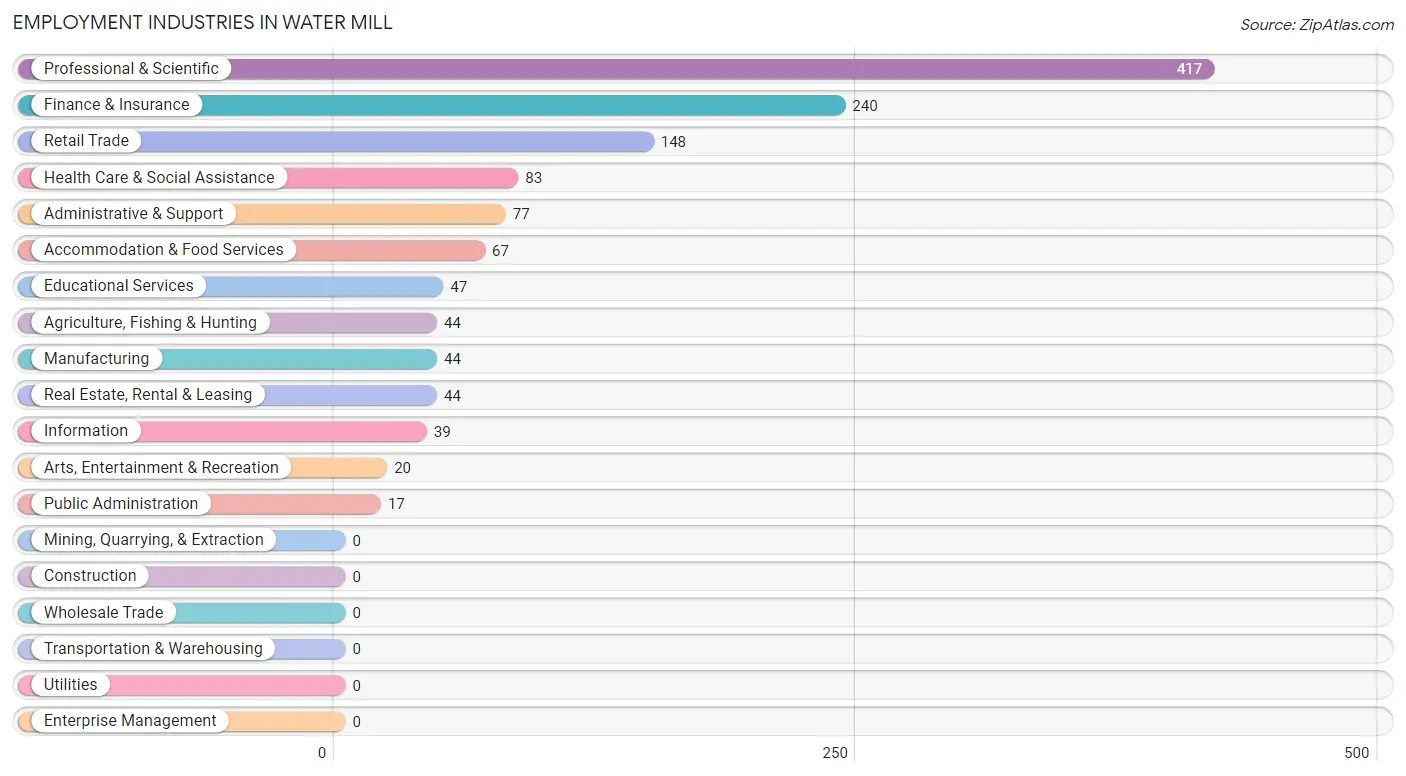
Employment Industries in Water Mill
The major employment industries in Water Mill include Professional & Scientific (417 | 32.0%), Finance & Insurance (240 | 18.4%), Retail Trade (148 | 11.3%), Health Care & Social Assistance (83 | 6.4%), and Administrative & Support (77 | 5.9%).
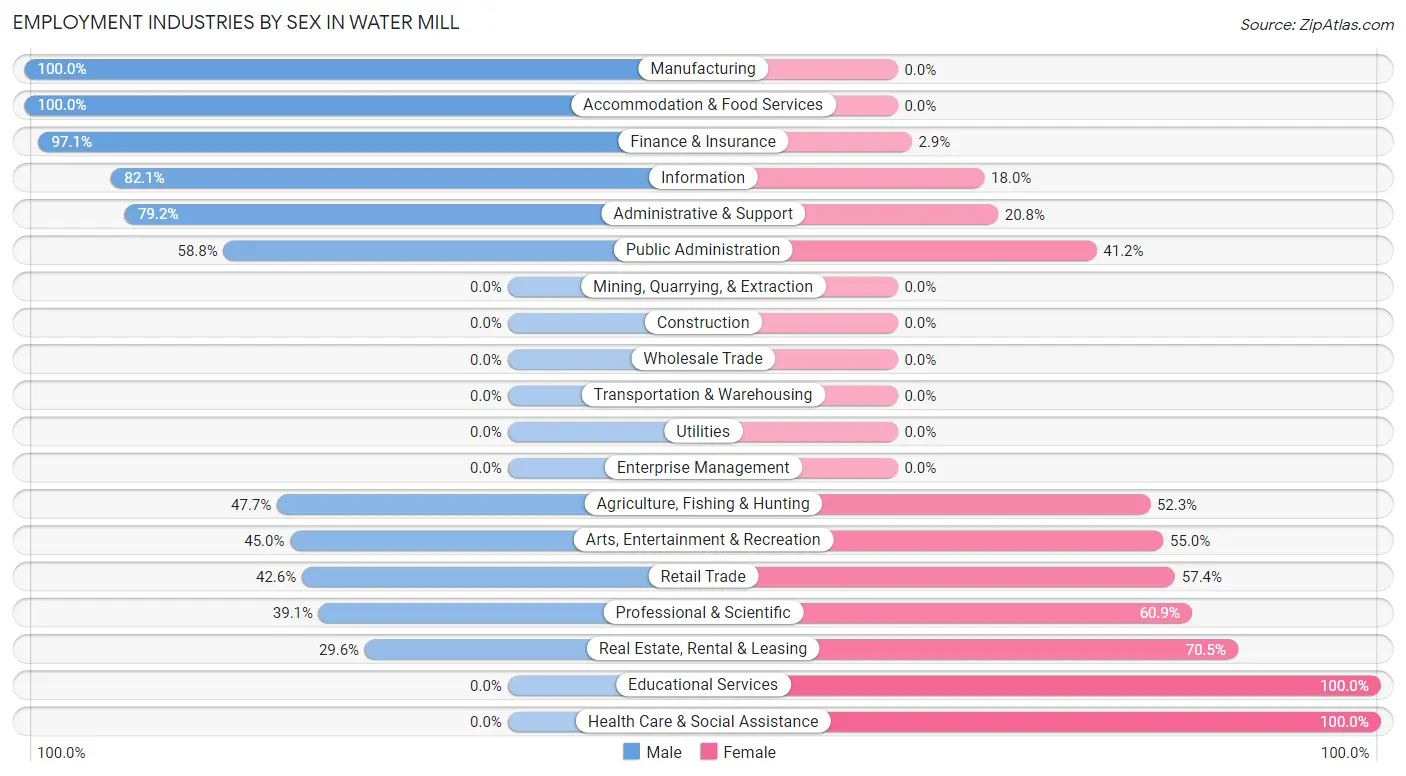
Employment Industries by Sex in Water Mill
The Water Mill industries that see more men than women are Manufacturing (100.0%), Accommodation & Food Services (100.0%), and Finance & Insurance (97.1%), whereas the industries that tend to have a higher number of women are Educational Services (100.0%), Health Care & Social Assistance (100.0%), and Real Estate, Rental & Leasing (70.5%).
| Industry | Male | Female |
| Agriculture, Fishing & Hunting | 21 (47.7%) | 23 (52.3%) |
| Mining, Quarrying, & Extraction | 0 (0.0%) | 0 (0.0%) |
| Construction | 0 (0.0%) | 0 (0.0%) |
| Manufacturing | 44 (100.0%) | 0 (0.0%) |
| Wholesale Trade | 0 (0.0%) | 0 (0.0%) |
| Retail Trade | 63 (42.6%) | 85 (57.4%) |
| Transportation & Warehousing | 0 (0.0%) | 0 (0.0%) |
| Utilities | 0 (0.0%) | 0 (0.0%) |
| Information | 32 (82.1%) | 7 (17.9%) |
| Finance & Insurance | 233 (97.1%) | 7 (2.9%) |
| Real Estate, Rental & Leasing | 13 (29.5%) | 31 (70.5%) |
| Professional & Scientific | 163 (39.1%) | 254 (60.9%) |
| Enterprise Management | 0 (0.0%) | 0 (0.0%) |
| Administrative & Support | 61 (79.2%) | 16 (20.8%) |
| Educational Services | 0 (0.0%) | 47 (100.0%) |
| Health Care & Social Assistance | 0 (0.0%) | 83 (100.0%) |
| Arts, Entertainment & Recreation | 9 (45.0%) | 11 (55.0%) |
| Accommodation & Food Services | 67 (100.0%) | 0 (0.0%) |
| Public Administration | 10 (58.8%) | 7 (41.2%) |
| Total | 734 (56.2%) | 571 (43.8%) |
Education in Water Mill
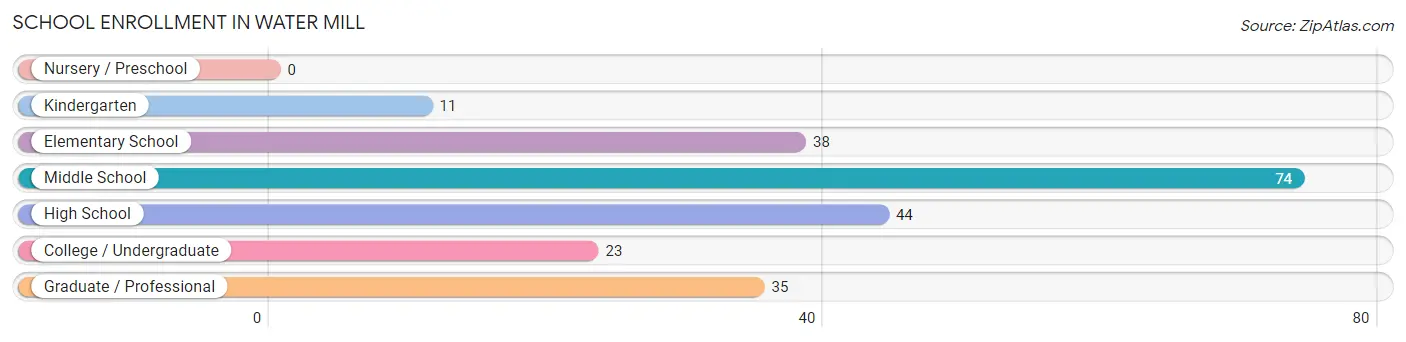
School Enrollment in Water Mill
The most common levels of schooling among the 225 students in Water Mill are middle school (74 | 32.9%), high school (44 | 19.6%), and elementary school (38 | 16.9%).
| School Level | # Students | % Students |
| Nursery / Preschool | 0 | 0.0% |
| Kindergarten | 11 | 4.9% |
| Elementary School | 38 | 16.9% |
| Middle School | 74 | 32.9% |
| High School | 44 | 19.6% |
| College / Undergraduate | 23 | 10.2% |
| Graduate / Professional | 35 | 15.6% |
| Total | 225 | 100.0% |
School Enrollment by Age by Funding Source in Water Mill
Out of a total of 225 students who are enrolled in schools in Water Mill, 106 (47.1%) attend a private institution, while the remaining 119 (52.9%) are enrolled in public schools. The age group of 5 to 9 year old has the highest likelihood of being enrolled in private schools, with 42 (100.0% in the age bracket) enrolled. Conversely, the age group of 18 to 19 year olds has the lowest likelihood of being enrolled in a private school, with 9 (100.0% in the age bracket) attending a public institution.
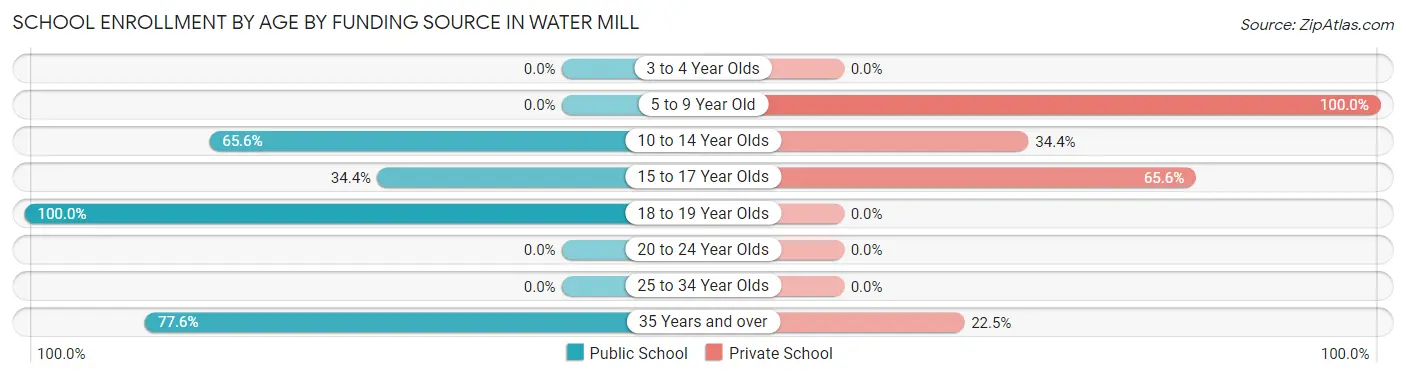
| Age Bracket | Public School | Private School |
| 3 to 4 Year Olds | 0 (0.0%) | 0 (0.0%) |
| 5 to 9 Year Old | 0 (0.0%) | 42 (100.0%) |
| 10 to 14 Year Olds | 61 (65.6%) | 32 (34.4%) |
| 15 to 17 Year Olds | 11 (34.4%) | 21 (65.6%) |
| 18 to 19 Year Olds | 9 (100.0%) | 0 (0.0%) |
| 20 to 24 Year Olds | 0 (0.0%) | 0 (0.0%) |
| 25 to 34 Year Olds | 0 (0.0%) | 0 (0.0%) |
| 35 Years and over | 38 (77.5%) | 11 (22.5%) |
| Total | 119 (52.9%) | 106 (47.1%) |
Educational Attainment by Field of Study in Water Mill
Business (581 | 36.4%), engineering (163 | 10.2%), social sciences (146 | 9.1%), arts & humanities (125 | 7.8%), and education (118 | 7.4%) are the most common fields of study among 1,596 individuals in Water Mill who have obtained a bachelor's degree or higher.
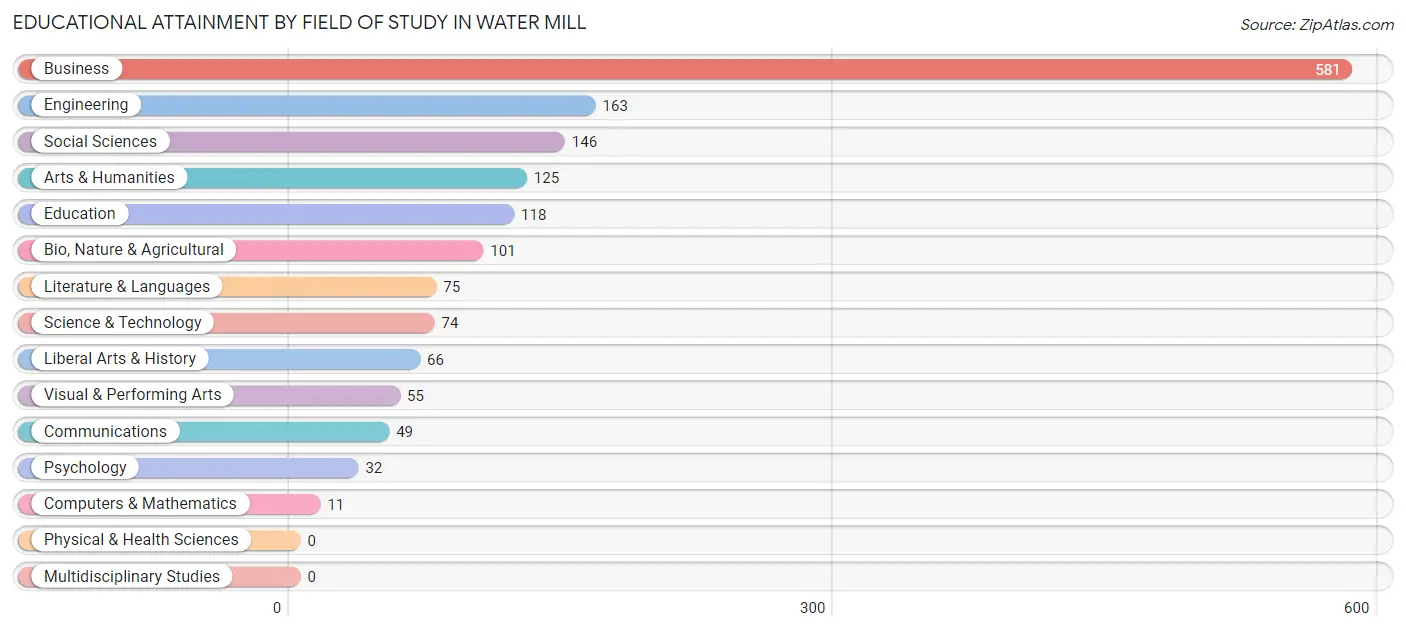
| Field of Study | # Graduates | % Graduates |
| Computers & Mathematics | 11 | 0.7% |
| Bio, Nature & Agricultural | 101 | 6.3% |
| Physical & Health Sciences | 0 | 0.0% |
| Psychology | 32 | 2.0% |
| Social Sciences | 146 | 9.1% |
| Engineering | 163 | 10.2% |
| Multidisciplinary Studies | 0 | 0.0% |
| Science & Technology | 74 | 4.6% |
| Business | 581 | 36.4% |
| Education | 118 | 7.4% |
| Literature & Languages | 75 | 4.7% |
| Liberal Arts & History | 66 | 4.1% |
| Visual & Performing Arts | 55 | 3.5% |
| Communications | 49 | 3.1% |
| Arts & Humanities | 125 | 7.8% |
| Total | 1,596 | 100.0% |
Transportation & Commute in Water Mill
Vehicle Availability by Sex in Water Mill
The most prevalent vehicle ownership categories in Water Mill are males with 2 vehicles (273, accounting for 41.4%) and females with 2 vehicles (216, making up 49.9%).
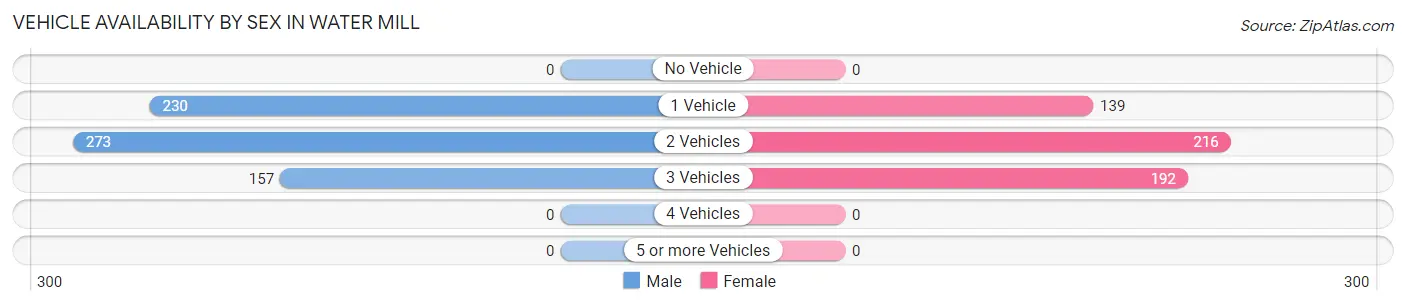
| Vehicles Available | Male | Female |
| No Vehicle | 0 (0.0%) | 0 (0.0%) |
| 1 Vehicle | 230 (34.8%) | 139 (25.4%) |
| 2 Vehicles | 273 (41.4%) | 216 (39.5%) |
| 3 Vehicles | 157 (23.8%) | 192 (35.1%) |
| 4 Vehicles | 0 (0.0%) | 0 (0.0%) |
| 5 or more Vehicles | 0 (0.0%) | 0 (0.0%) |
| Total | 660 (100.0%) | 547 (100.0%) |
Commute Time in Water Mill
The most frequently occuring commute durations in Water Mill are 5 to 9 minutes (229 commuters, 34.1%), 15 to 19 minutes (129 commuters, 19.2%), and less than 5 minutes (74 commuters, 11.0%).
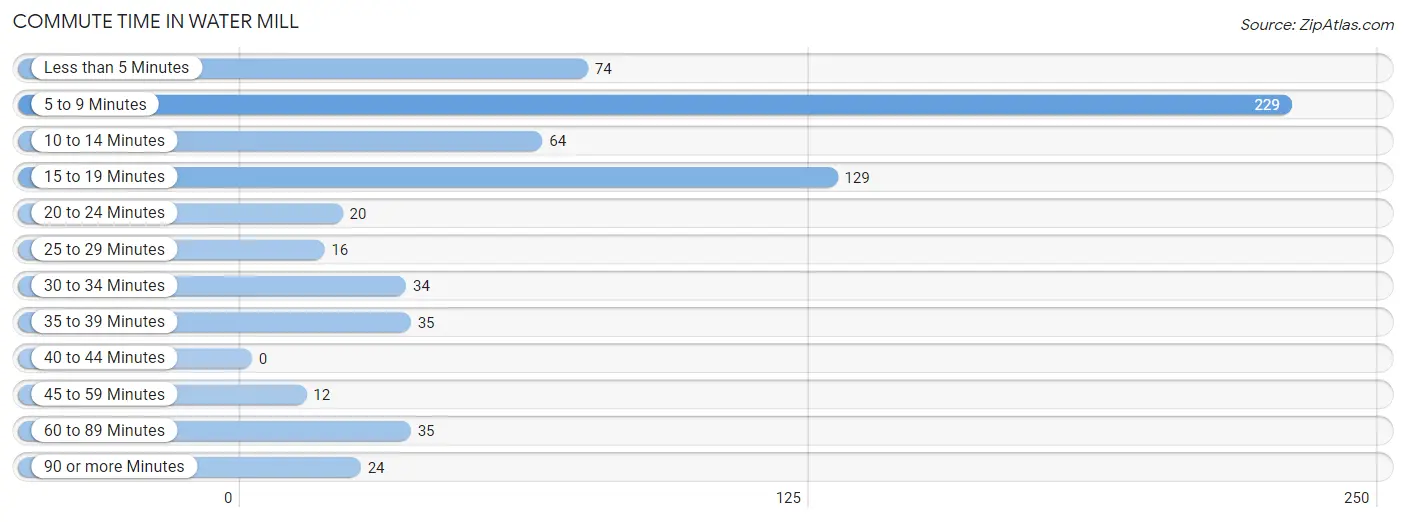
| Commute Time | # Commuters | % Commuters |
| Less than 5 Minutes | 74 | 11.0% |
| 5 to 9 Minutes | 229 | 34.1% |
| 10 to 14 Minutes | 64 | 9.5% |
| 15 to 19 Minutes | 129 | 19.2% |
| 20 to 24 Minutes | 20 | 3.0% |
| 25 to 29 Minutes | 16 | 2.4% |
| 30 to 34 Minutes | 34 | 5.1% |
| 35 to 39 Minutes | 35 | 5.2% |
| 40 to 44 Minutes | 0 | 0.0% |
| 45 to 59 Minutes | 12 | 1.8% |
| 60 to 89 Minutes | 35 | 5.2% |
| 90 or more Minutes | 24 | 3.6% |
Commute Time by Sex in Water Mill
The most common commute times in Water Mill are 5 to 9 minutes (206 commuters, 43.5%) for males and 15 to 19 minutes (67 commuters, 33.8%) for females.
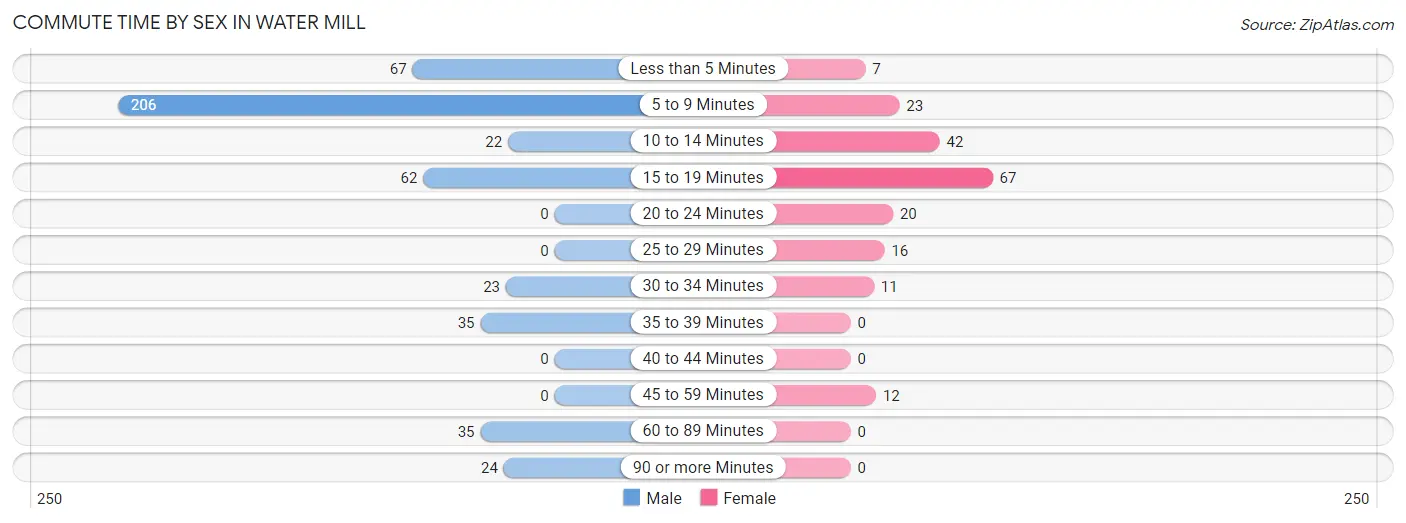
| Commute Time | Male | Female |
| Less than 5 Minutes | 67 (14.1%) | 7 (3.5%) |
| 5 to 9 Minutes | 206 (43.5%) | 23 (11.6%) |
| 10 to 14 Minutes | 22 (4.6%) | 42 (21.2%) |
| 15 to 19 Minutes | 62 (13.1%) | 67 (33.8%) |
| 20 to 24 Minutes | 0 (0.0%) | 20 (10.1%) |
| 25 to 29 Minutes | 0 (0.0%) | 16 (8.1%) |
| 30 to 34 Minutes | 23 (4.9%) | 11 (5.6%) |
| 35 to 39 Minutes | 35 (7.4%) | 0 (0.0%) |
| 40 to 44 Minutes | 0 (0.0%) | 0 (0.0%) |
| 45 to 59 Minutes | 0 (0.0%) | 12 (6.1%) |
| 60 to 89 Minutes | 35 (7.4%) | 0 (0.0%) |
| 90 or more Minutes | 24 (5.1%) | 0 (0.0%) |
Time of Departure to Work by Sex in Water Mill
The most frequent times of departure to work in Water Mill are 8:00 AM to 8:29 AM (145, 30.6%) for males and 8:00 AM to 8:29 AM (47, 23.7%) for females.
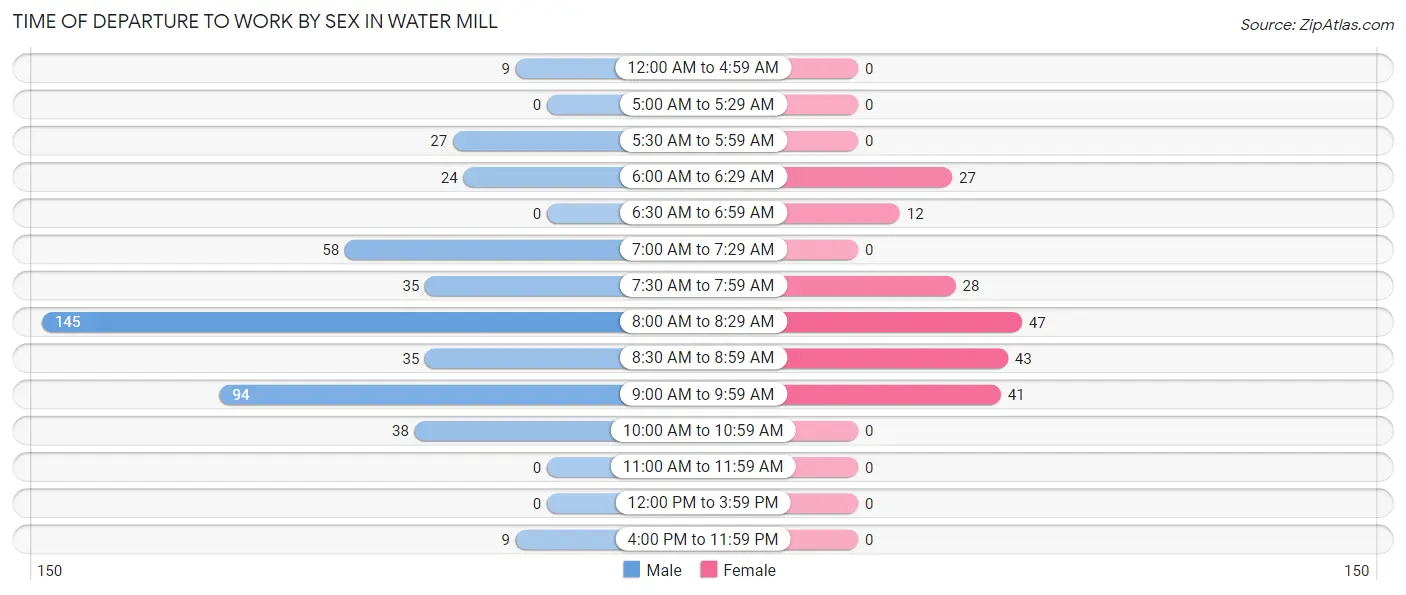
| Time of Departure | Male | Female |
| 12:00 AM to 4:59 AM | 9 (1.9%) | 0 (0.0%) |
| 5:00 AM to 5:29 AM | 0 (0.0%) | 0 (0.0%) |
| 5:30 AM to 5:59 AM | 27 (5.7%) | 0 (0.0%) |
| 6:00 AM to 6:29 AM | 24 (5.1%) | 27 (13.6%) |
| 6:30 AM to 6:59 AM | 0 (0.0%) | 12 (6.1%) |
| 7:00 AM to 7:29 AM | 58 (12.2%) | 0 (0.0%) |
| 7:30 AM to 7:59 AM | 35 (7.4%) | 28 (14.1%) |
| 8:00 AM to 8:29 AM | 145 (30.6%) | 47 (23.7%) |
| 8:30 AM to 8:59 AM | 35 (7.4%) | 43 (21.7%) |
| 9:00 AM to 9:59 AM | 94 (19.8%) | 41 (20.7%) |
| 10:00 AM to 10:59 AM | 38 (8.0%) | 0 (0.0%) |
| 11:00 AM to 11:59 AM | 0 (0.0%) | 0 (0.0%) |
| 12:00 PM to 3:59 PM | 0 (0.0%) | 0 (0.0%) |
| 4:00 PM to 11:59 PM | 9 (1.9%) | 0 (0.0%) |
| Total | 474 (100.0%) | 198 (100.0%) |
Housing Occupancy in Water Mill
Occupancy by Ownership in Water Mill
Of the total 1,116 dwellings in Water Mill, owner-occupied units account for 1,022 (91.6%), while renter-occupied units make up 94 (8.4%).
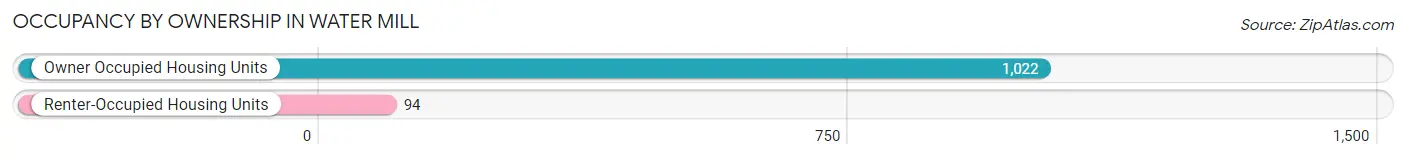
| Occupancy | # Housing Units | % Housing Units |
| Owner Occupied Housing Units | 1,022 | 91.6% |
| Renter-Occupied Housing Units | 94 | 8.4% |
| Total Occupied Housing Units | 1,116 | 100.0% |
Occupancy by Household Size in Water Mill
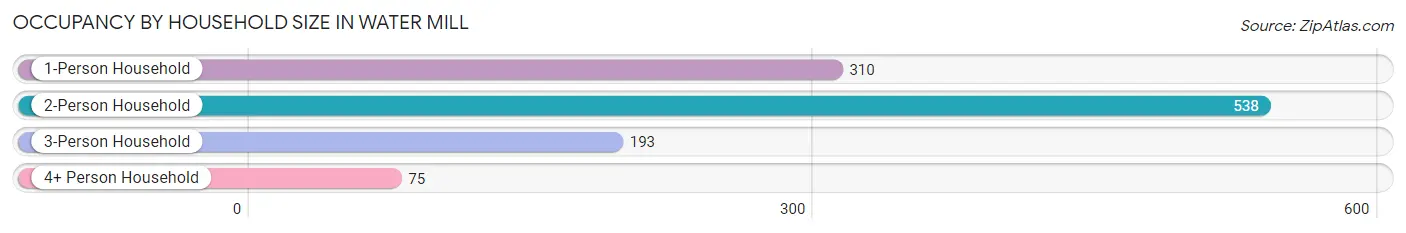
| Household Size | # Housing Units | % Housing Units |
| 1-Person Household | 310 | 27.8% |
| 2-Person Household | 538 | 48.2% |
| 3-Person Household | 193 | 17.3% |
| 4+ Person Household | 75 | 6.7% |
| Total Housing Units | 1,116 | 100.0% |
Occupancy by Ownership by Household Size in Water Mill
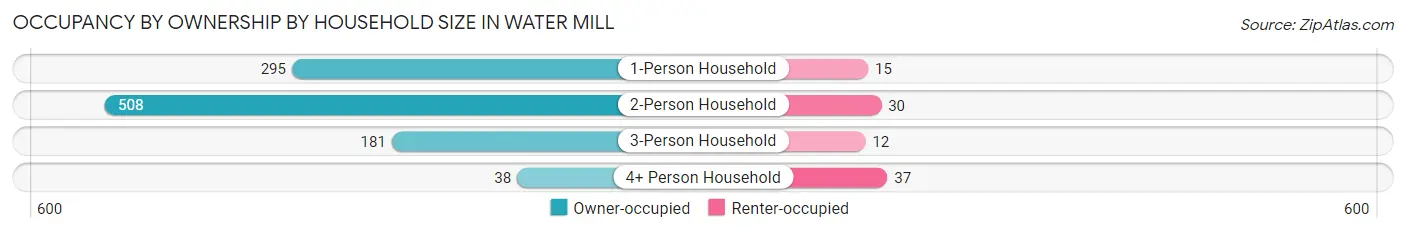
| Household Size | Owner-occupied | Renter-occupied |
| 1-Person Household | 295 (95.2%) | 15 (4.8%) |
| 2-Person Household | 508 (94.4%) | 30 (5.6%) |
| 3-Person Household | 181 (93.8%) | 12 (6.2%) |
| 4+ Person Household | 38 (50.7%) | 37 (49.3%) |
| Total Housing Units | 1,022 (91.6%) | 94 (8.4%) |
Occupancy by Educational Attainment in Water Mill
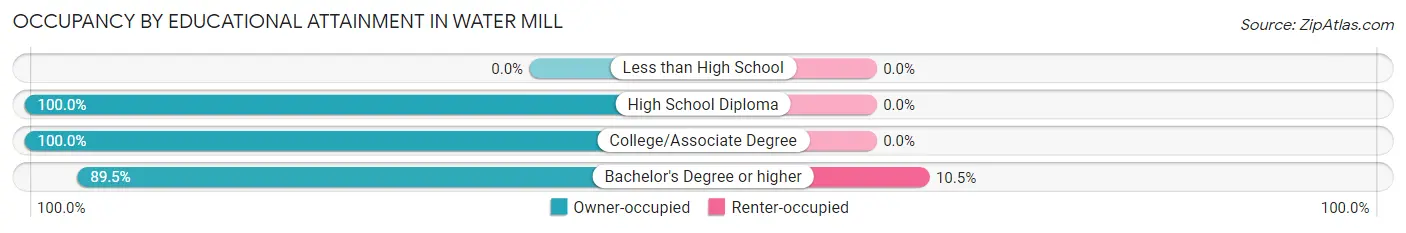
| Household Size | Owner-occupied | Renter-occupied |
| Less than High School | 0 (0.0%) | 0 (0.0%) |
| High School Diploma | 159 (100.0%) | 0 (0.0%) |
| College/Associate Degree | 59 (100.0%) | 0 (0.0%) |
| Bachelor's Degree or higher | 804 (89.5%) | 94 (10.5%) |
Occupancy by Age of Householder in Water Mill
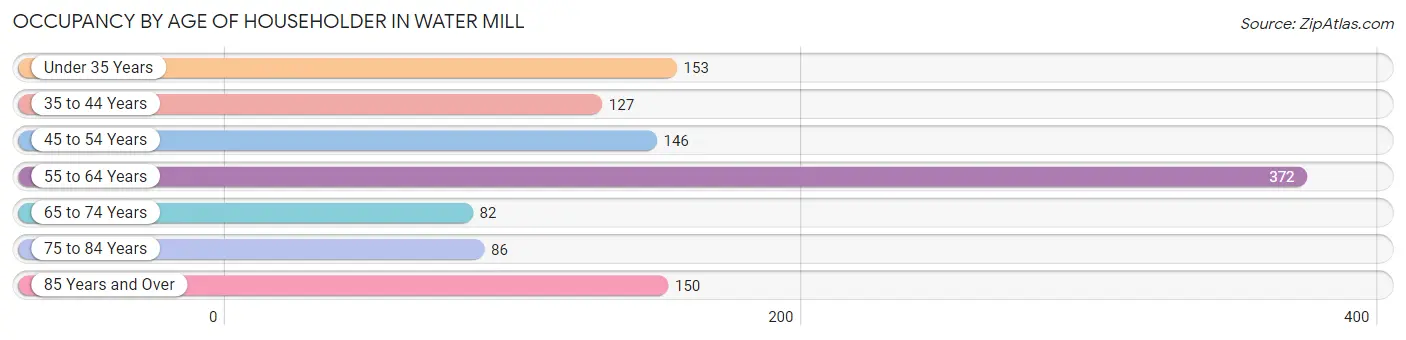
| Age Bracket | # Households | % Households |
| Under 35 Years | 153 | 13.7% |
| 35 to 44 Years | 127 | 11.4% |
| 45 to 54 Years | 146 | 13.1% |
| 55 to 64 Years | 372 | 33.3% |
| 65 to 74 Years | 82 | 7.3% |
| 75 to 84 Years | 86 | 7.7% |
| 85 Years and Over | 150 | 13.4% |
| Total | 1,116 | 100.0% |
Housing Finances in Water Mill
Median Income by Occupancy in Water Mill
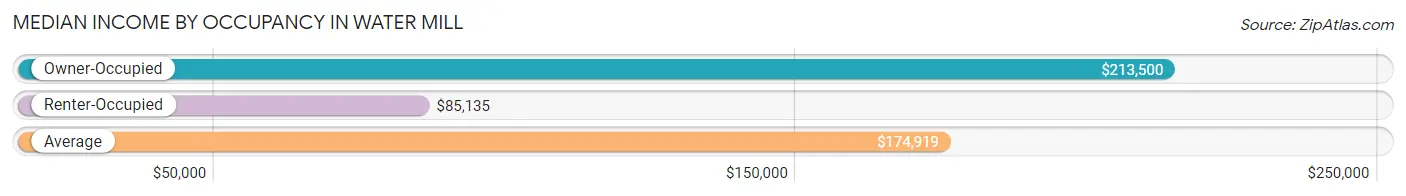
| Occupancy Type | # Households | Median Income |
| Owner-Occupied | 1,022 (91.6%) | $213,500 |
| Renter-Occupied | 94 (8.4%) | $85,135 |
| Average | 1,116 (100.0%) | $174,919 |
Occupancy by Householder Income Bracket in Water Mill
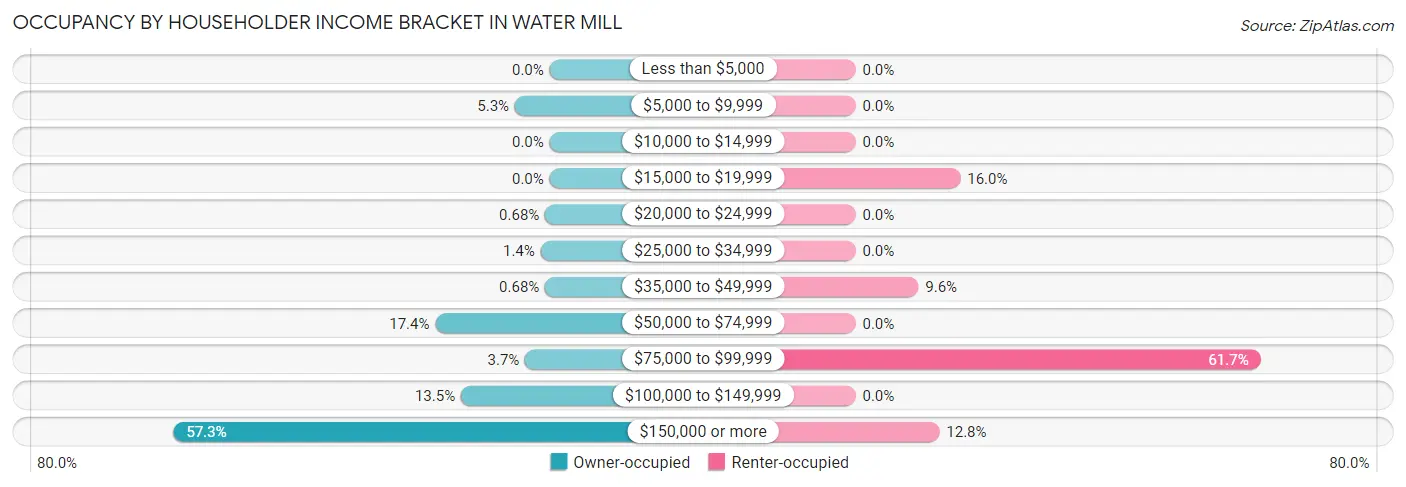
| Income Bracket | Owner-occupied | Renter-occupied |
| Less than $5,000 | 0 (0.0%) | 0 (0.0%) |
| $5,000 to $9,999 | 54 (5.3%) | 0 (0.0%) |
| $10,000 to $14,999 | 0 (0.0%) | 0 (0.0%) |
| $15,000 to $19,999 | 0 (0.0%) | 15 (16.0%) |
| $20,000 to $24,999 | 7 (0.7%) | 0 (0.0%) |
| $25,000 to $34,999 | 14 (1.4%) | 0 (0.0%) |
| $35,000 to $49,999 | 7 (0.7%) | 9 (9.6%) |
| $50,000 to $74,999 | 178 (17.4%) | 0 (0.0%) |
| $75,000 to $99,999 | 38 (3.7%) | 58 (61.7%) |
| $100,000 to $149,999 | 138 (13.5%) | 0 (0.0%) |
| $150,000 or more | 586 (57.3%) | 12 (12.8%) |
| Total | 1,022 (100.0%) | 94 (100.0%) |
Monthly Housing Cost Tiers in Water Mill
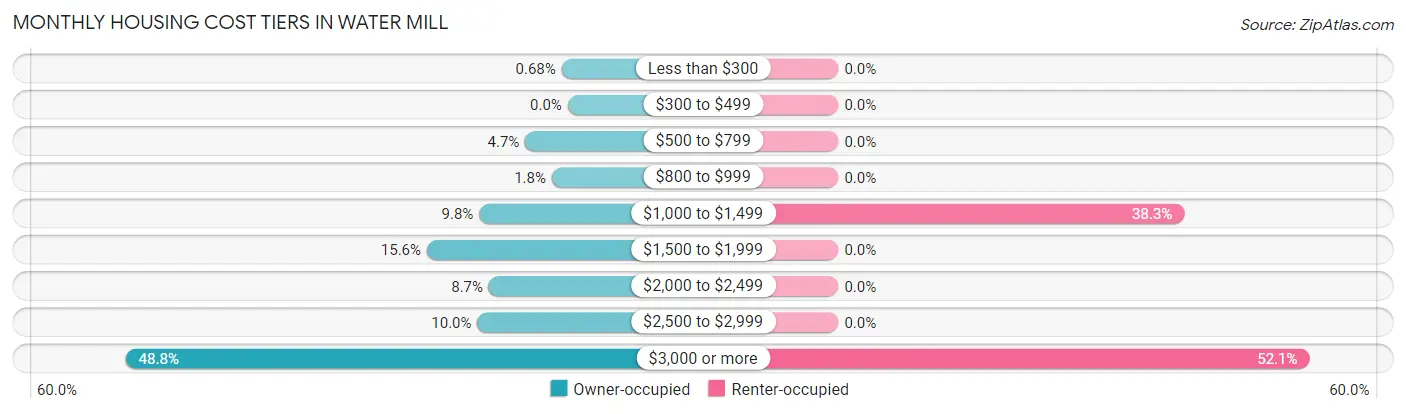
| Monthly Cost | Owner-occupied | Renter-occupied |
| Less than $300 | 7 (0.7%) | 0 (0.0%) |
| $300 to $499 | 0 (0.0%) | 0 (0.0%) |
| $500 to $799 | 48 (4.7%) | 0 (0.0%) |
| $800 to $999 | 18 (1.8%) | 0 (0.0%) |
| $1,000 to $1,499 | 100 (9.8%) | 36 (38.3%) |
| $1,500 to $1,999 | 159 (15.6%) | 0 (0.0%) |
| $2,000 to $2,499 | 89 (8.7%) | 0 (0.0%) |
| $2,500 to $2,999 | 102 (10.0%) | 0 (0.0%) |
| $3,000 or more | 499 (48.8%) | 49 (52.1%) |
| Total | 1,022 (100.0%) | 94 (100.0%) |
Physical Housing Characteristics in Water Mill
Housing Structures in Water Mill
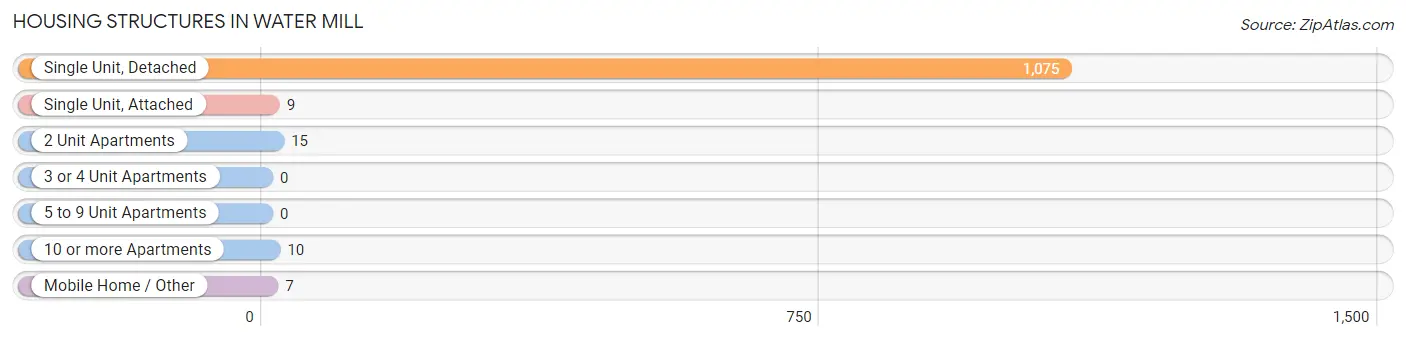
| Structure Type | # Housing Units | % Housing Units |
| Single Unit, Detached | 1,075 | 96.3% |
| Single Unit, Attached | 9 | 0.8% |
| 2 Unit Apartments | 15 | 1.3% |
| 3 or 4 Unit Apartments | 0 | 0.0% |
| 5 to 9 Unit Apartments | 0 | 0.0% |
| 10 or more Apartments | 10 | 0.9% |
| Mobile Home / Other | 7 | 0.6% |
| Total | 1,116 | 100.0% |
Housing Structures by Occupancy in Water Mill
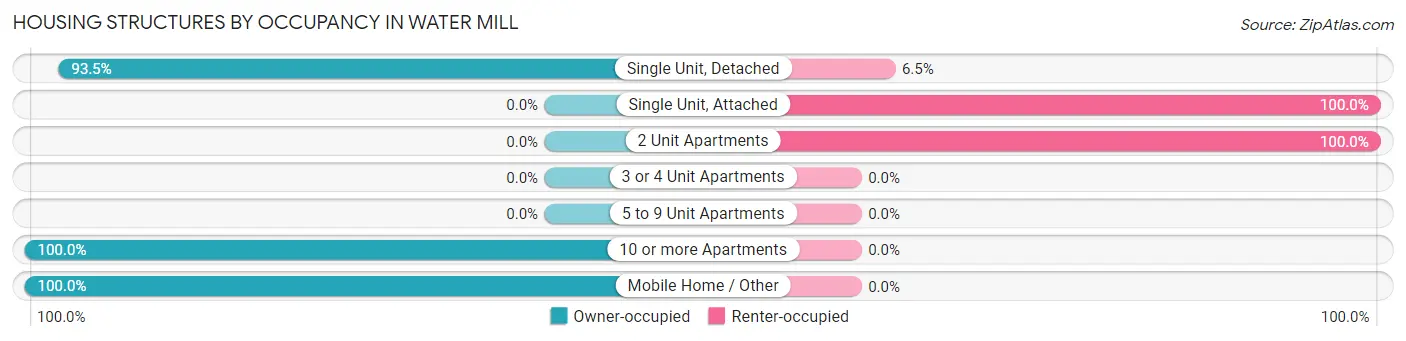
| Structure Type | Owner-occupied | Renter-occupied |
| Single Unit, Detached | 1,005 (93.5%) | 70 (6.5%) |
| Single Unit, Attached | 0 (0.0%) | 9 (100.0%) |
| 2 Unit Apartments | 0 (0.0%) | 15 (100.0%) |
| 3 or 4 Unit Apartments | 0 (0.0%) | 0 (0.0%) |
| 5 to 9 Unit Apartments | 0 (0.0%) | 0 (0.0%) |
| 10 or more Apartments | 10 (100.0%) | 0 (0.0%) |
| Mobile Home / Other | 7 (100.0%) | 0 (0.0%) |
| Total | 1,022 (91.6%) | 94 (8.4%) |
Housing Structures by Number of Rooms in Water Mill
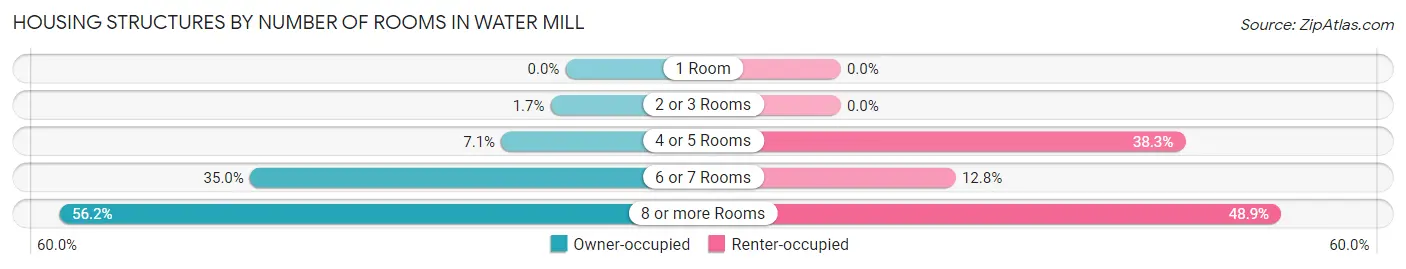
| Number of Rooms | Owner-occupied | Renter-occupied |
| 1 Room | 0 (0.0%) | 0 (0.0%) |
| 2 or 3 Rooms | 17 (1.7%) | 0 (0.0%) |
| 4 or 5 Rooms | 73 (7.1%) | 36 (38.3%) |
| 6 or 7 Rooms | 358 (35.0%) | 12 (12.8%) |
| 8 or more Rooms | 574 (56.2%) | 46 (48.9%) |
| Total | 1,022 (100.0%) | 94 (100.0%) |
Housing Structure by Heating Type in Water Mill
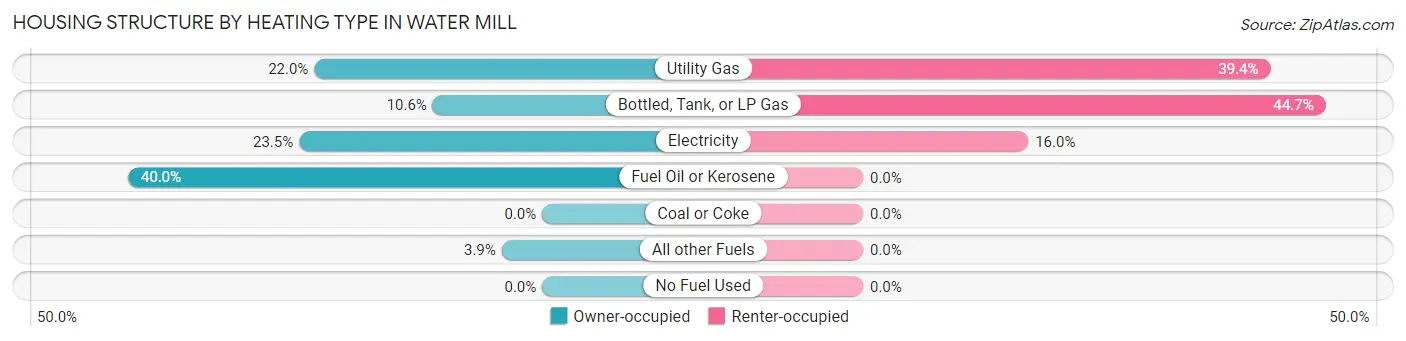
| Heating Type | Owner-occupied | Renter-occupied |
| Utility Gas | 225 (22.0%) | 37 (39.4%) |
| Bottled, Tank, or LP Gas | 108 (10.6%) | 42 (44.7%) |
| Electricity | 240 (23.5%) | 15 (16.0%) |
| Fuel Oil or Kerosene | 409 (40.0%) | 0 (0.0%) |
| Coal or Coke | 0 (0.0%) | 0 (0.0%) |
| All other Fuels | 40 (3.9%) | 0 (0.0%) |
| No Fuel Used | 0 (0.0%) | 0 (0.0%) |
| Total | 1,022 (100.0%) | 94 (100.0%) |
Household Vehicle Usage in Water Mill
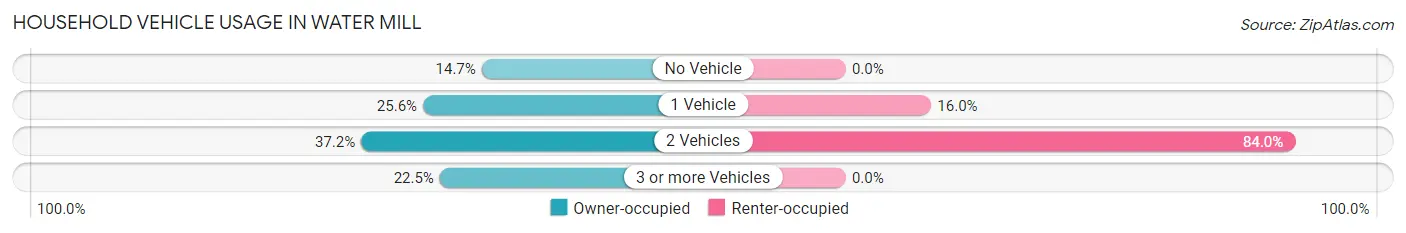
| Vehicles per Household | Owner-occupied | Renter-occupied |
| No Vehicle | 150 (14.7%) | 0 (0.0%) |
| 1 Vehicle | 262 (25.6%) | 15 (16.0%) |
| 2 Vehicles | 380 (37.2%) | 79 (84.0%) |
| 3 or more Vehicles | 230 (22.5%) | 0 (0.0%) |
| Total | 1,022 (100.0%) | 94 (100.0%) |
Real Estate & Mortgages in Water Mill
Real Estate and Mortgage Overview in Water Mill
| Characteristic | Without Mortgage | With Mortgage |
| Housing Units | 583 | 439 |
| Median Property Value | $2,000,001 | $1,776,500 |
| Median Household Income | $250,001 | $241 |
| Monthly Housing Costs | $1,501 | $276 |
| Real Estate Taxes | $10,001 | $0 |
Property Value by Mortgage Status in Water Mill
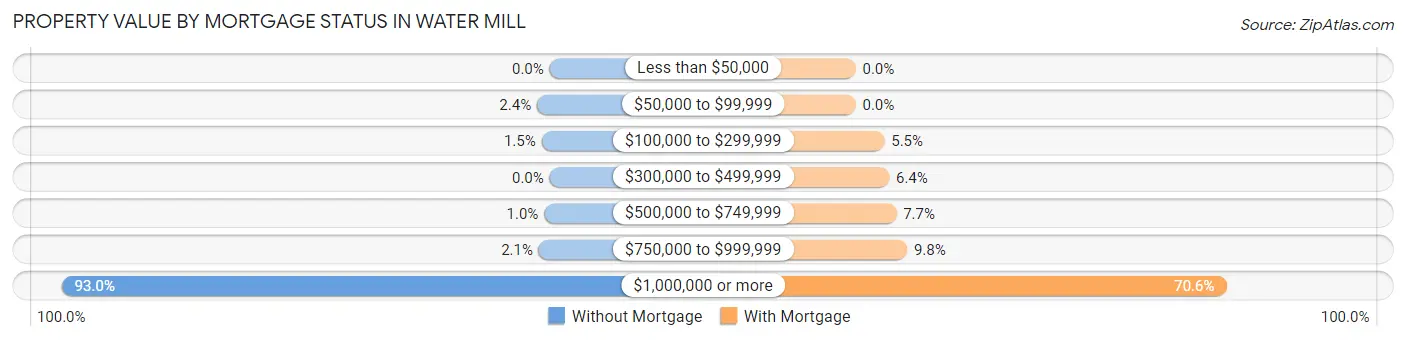
| Property Value | Without Mortgage | With Mortgage |
| Less than $50,000 | 0 (0.0%) | 0 (0.0%) |
| $50,000 to $99,999 | 14 (2.4%) | 0 (0.0%) |
| $100,000 to $299,999 | 9 (1.5%) | 24 (5.5%) |
| $300,000 to $499,999 | 0 (0.0%) | 28 (6.4%) |
| $500,000 to $749,999 | 6 (1.0%) | 34 (7.7%) |
| $750,000 to $999,999 | 12 (2.1%) | 43 (9.8%) |
| $1,000,000 or more | 542 (93.0%) | 310 (70.6%) |
| Total | 583 (100.0%) | 439 (100.0%) |
Household Income by Mortgage Status in Water Mill
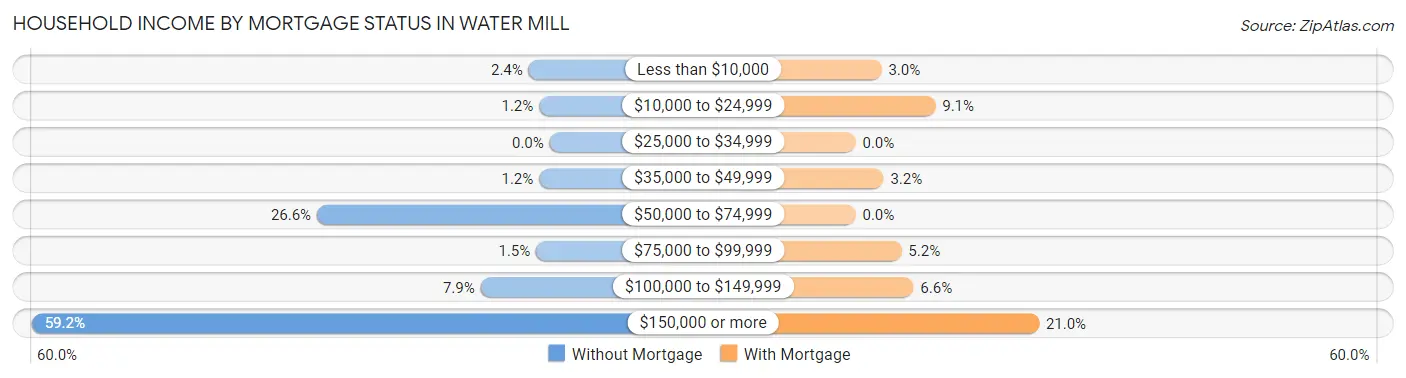
| Household Income | Without Mortgage | With Mortgage |
| Less than $10,000 | 14 (2.4%) | 13 (3.0%) |
| $10,000 to $24,999 | 7 (1.2%) | 40 (9.1%) |
| $25,000 to $34,999 | 0 (0.0%) | 0 (0.0%) |
| $35,000 to $49,999 | 7 (1.2%) | 14 (3.2%) |
| $50,000 to $74,999 | 155 (26.6%) | 0 (0.0%) |
| $75,000 to $99,999 | 9 (1.5%) | 23 (5.2%) |
| $100,000 to $149,999 | 46 (7.9%) | 29 (6.6%) |
| $150,000 or more | 345 (59.2%) | 92 (21.0%) |
| Total | 583 (100.0%) | 439 (100.0%) |
Property Value to Household Income Ratio in Water Mill
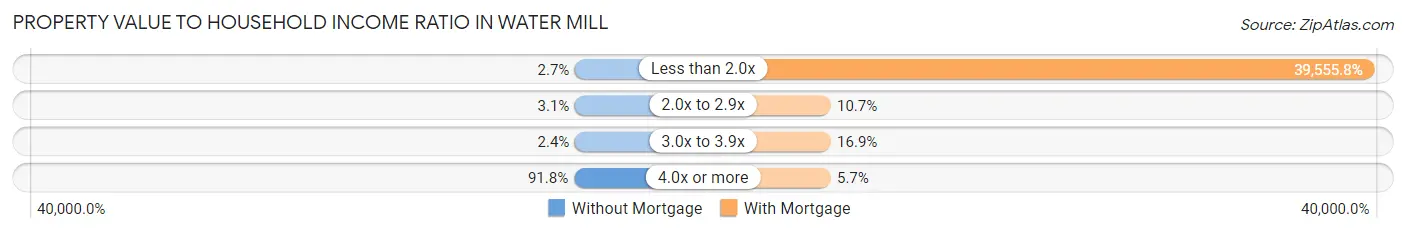
| Value-to-Income Ratio | Without Mortgage | With Mortgage |
| Less than 2.0x | 16 (2.7%) | 173,650 (39,555.8%) |
| 2.0x to 2.9x | 18 (3.1%) | 47 (10.7%) |
| 3.0x to 3.9x | 14 (2.4%) | 74 (16.9%) |
| 4.0x or more | 535 (91.8%) | 25 (5.7%) |
| Total | 583 (100.0%) | 439 (100.0%) |
Real Estate Taxes by Mortgage Status in Water Mill
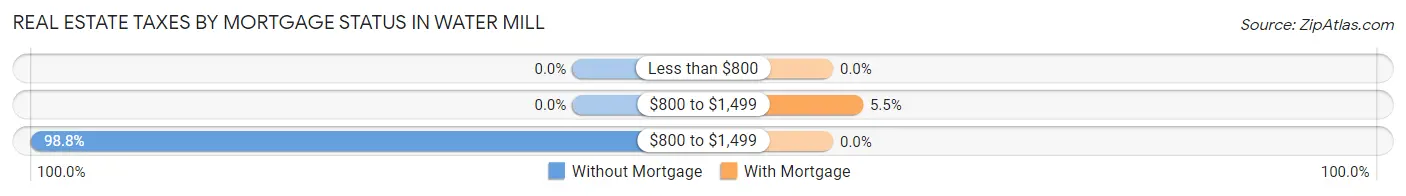
| Property Taxes | Without Mortgage | With Mortgage |
| Less than $800 | 0 (0.0%) | 0 (0.0%) |
| $800 to $1,499 | 0 (0.0%) | 24 (5.5%) |
| $800 to $1,499 | 576 (98.8%) | 0 (0.0%) |
| Total | 583 (100.0%) | 439 (100.0%) |
Health & Disability in Water Mill
Health Insurance Coverage by Age in Water Mill
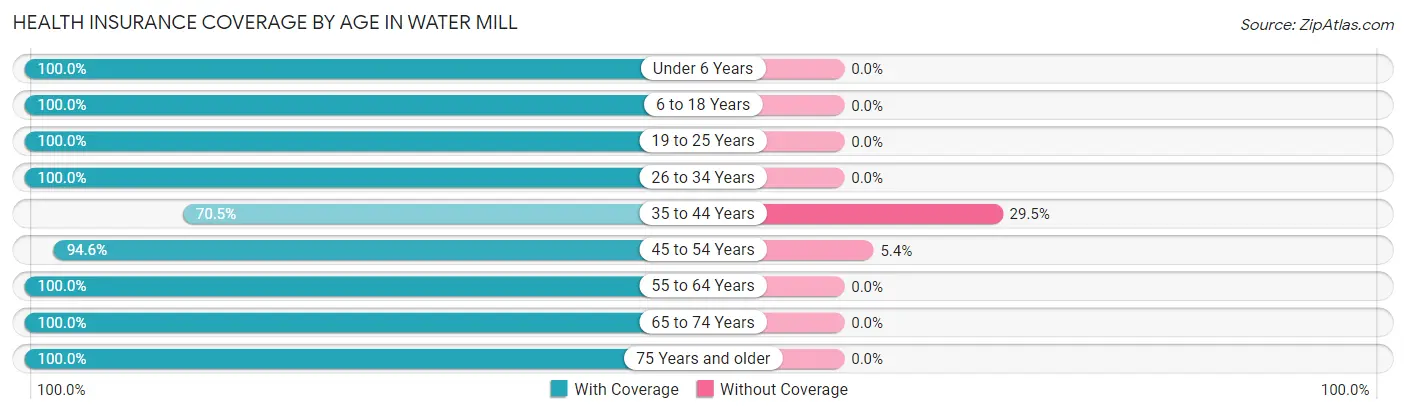
| Age Bracket | With Coverage | Without Coverage |
| Under 6 Years | 100 (100.0%) | 0 (0.0%) |
| 6 to 18 Years | 156 (100.0%) | 0 (0.0%) |
| 19 to 25 Years | 65 (100.0%) | 0 (0.0%) |
| 26 to 34 Years | 278 (100.0%) | 0 (0.0%) |
| 35 to 44 Years | 160 (70.5%) | 67 (29.5%) |
| 45 to 54 Years | 313 (94.6%) | 18 (5.4%) |
| 55 to 64 Years | 696 (100.0%) | 0 (0.0%) |
| 65 to 74 Years | 191 (100.0%) | 0 (0.0%) |
| 75 Years and older | 264 (100.0%) | 0 (0.0%) |
| Total | 2,223 (96.3%) | 85 (3.7%) |
Health Insurance Coverage by Citizenship Status in Water Mill
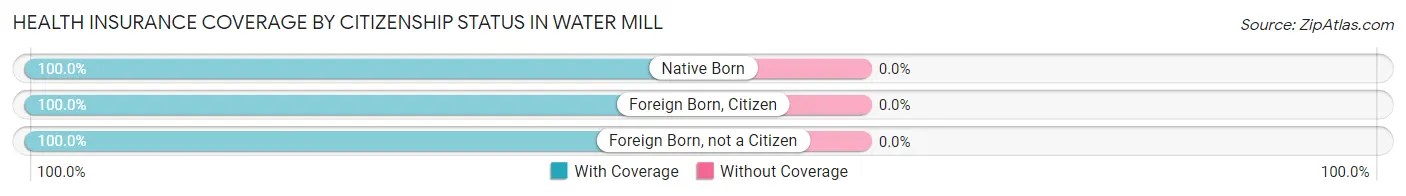
| Citizenship Status | With Coverage | Without Coverage |
| Native Born | 100 (100.0%) | 0 (0.0%) |
| Foreign Born, Citizen | 156 (100.0%) | 0 (0.0%) |
| Foreign Born, not a Citizen | 65 (100.0%) | 0 (0.0%) |
Health Insurance Coverage by Household Income in Water Mill
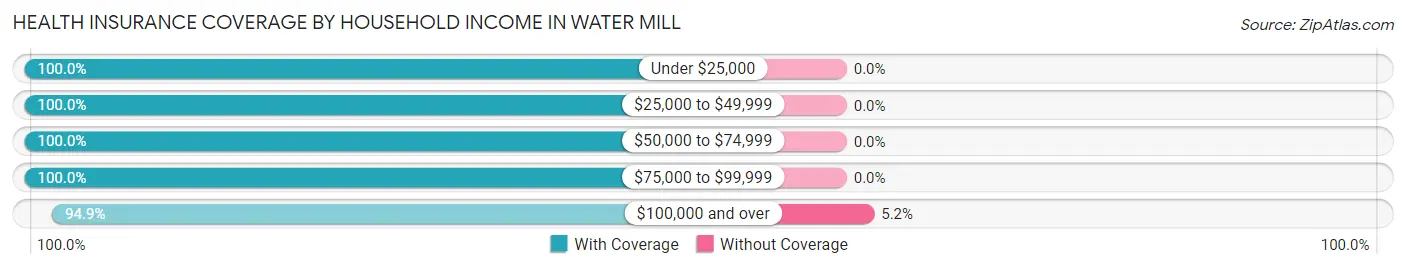
| Household Income | With Coverage | Without Coverage |
| Under $25,000 | 90 (100.0%) | 0 (0.0%) |
| $25,000 to $49,999 | 39 (100.0%) | 0 (0.0%) |
| $50,000 to $74,999 | 231 (100.0%) | 0 (0.0%) |
| $75,000 to $99,999 | 282 (100.0%) | 0 (0.0%) |
| $100,000 and over | 1,566 (94.9%) | 85 (5.1%) |
Public vs Private Health Insurance Coverage by Age in Water Mill
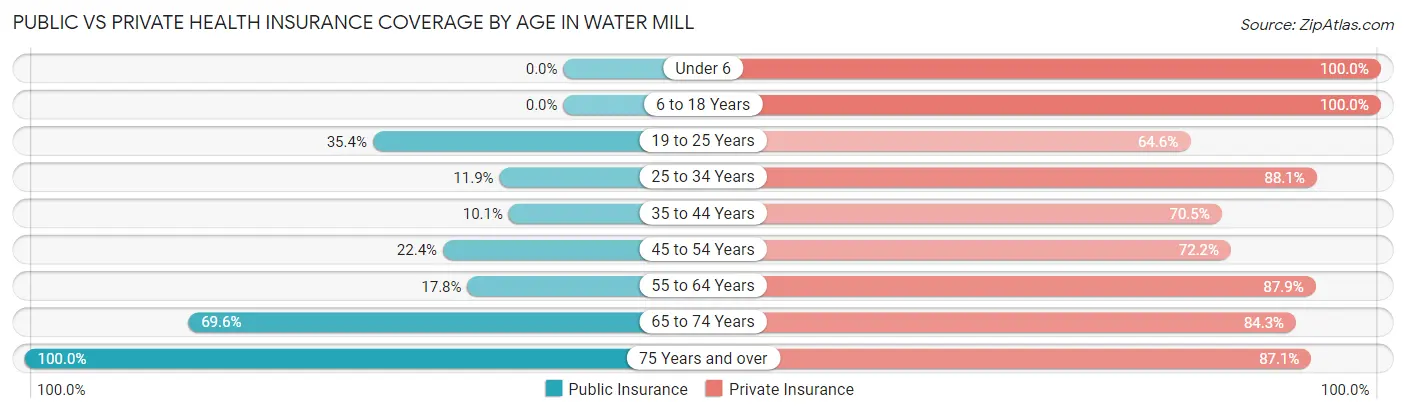
| Age Bracket | Public Insurance | Private Insurance |
| Under 6 | 0 (0.0%) | 100 (100.0%) |
| 6 to 18 Years | 0 (0.0%) | 156 (100.0%) |
| 19 to 25 Years | 23 (35.4%) | 42 (64.6%) |
| 25 to 34 Years | 33 (11.9%) | 245 (88.1%) |
| 35 to 44 Years | 23 (10.1%) | 160 (70.5%) |
| 45 to 54 Years | 74 (22.4%) | 239 (72.2%) |
| 55 to 64 Years | 124 (17.8%) | 612 (87.9%) |
| 65 to 74 Years | 133 (69.6%) | 161 (84.3%) |
| 75 Years and over | 264 (100.0%) | 230 (87.1%) |
| Total | 674 (29.2%) | 1,945 (84.3%) |
Disability Status by Sex by Age in Water Mill
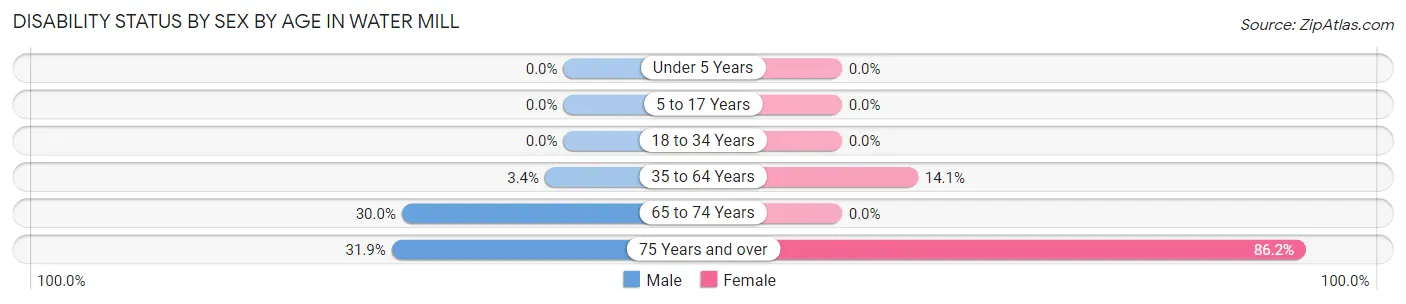
| Age Bracket | Male | Female |
| Under 5 Years | 0 (0.0%) | 0 (0.0%) |
| 5 to 17 Years | 0 (0.0%) | 0 (0.0%) |
| 18 to 34 Years | 0 (0.0%) | 0 (0.0%) |
| 35 to 64 Years | 25 (3.4%) | 74 (14.1%) |
| 65 to 74 Years | 24 (30.0%) | 0 (0.0%) |
| 75 Years and over | 22 (31.9%) | 168 (86.2%) |
Disability Class by Sex by Age in Water Mill
Disability Class: Hearing Difficulty
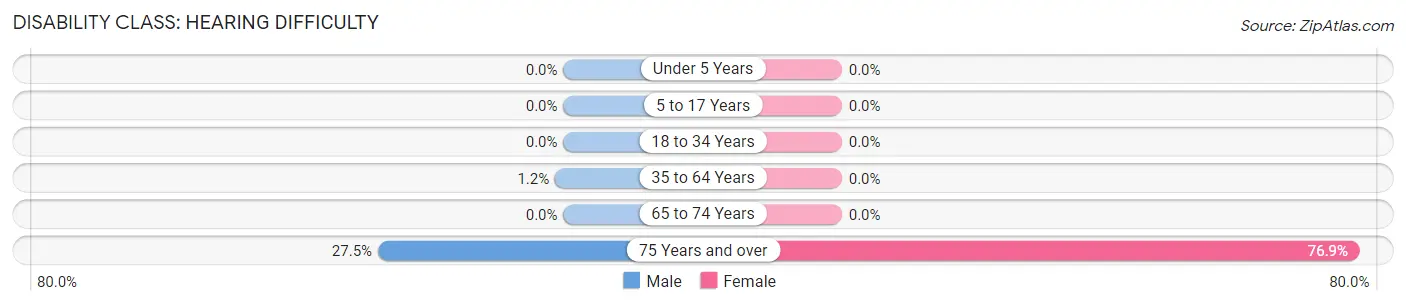
| Age Bracket | Male | Female |
| Under 5 Years | 0 (0.0%) | 0 (0.0%) |
| 5 to 17 Years | 0 (0.0%) | 0 (0.0%) |
| 18 to 34 Years | 0 (0.0%) | 0 (0.0%) |
| 35 to 64 Years | 9 (1.2%) | 0 (0.0%) |
| 65 to 74 Years | 0 (0.0%) | 0 (0.0%) |
| 75 Years and over | 19 (27.5%) | 150 (76.9%) |
Disability Class: Vision Difficulty
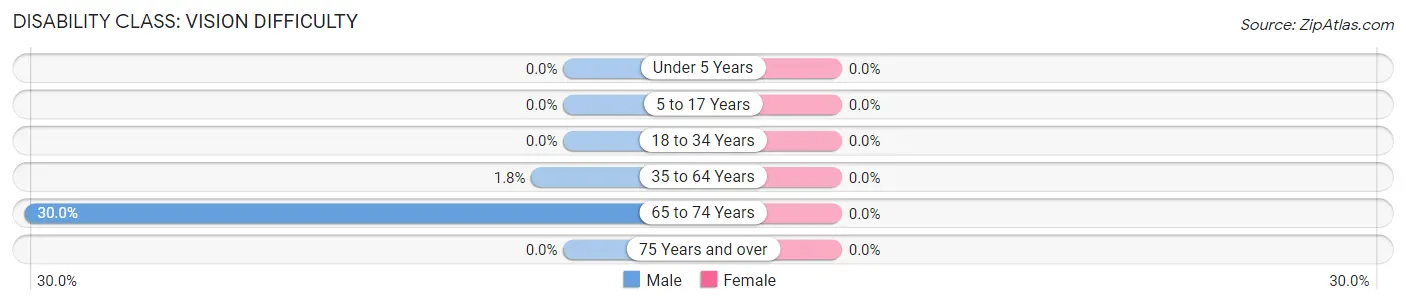
| Age Bracket | Male | Female |
| Under 5 Years | 0 (0.0%) | 0 (0.0%) |
| 5 to 17 Years | 0 (0.0%) | 0 (0.0%) |
| 18 to 34 Years | 0 (0.0%) | 0 (0.0%) |
| 35 to 64 Years | 13 (1.8%) | 0 (0.0%) |
| 65 to 74 Years | 24 (30.0%) | 0 (0.0%) |
| 75 Years and over | 0 (0.0%) | 0 (0.0%) |
Disability Class: Cognitive Difficulty
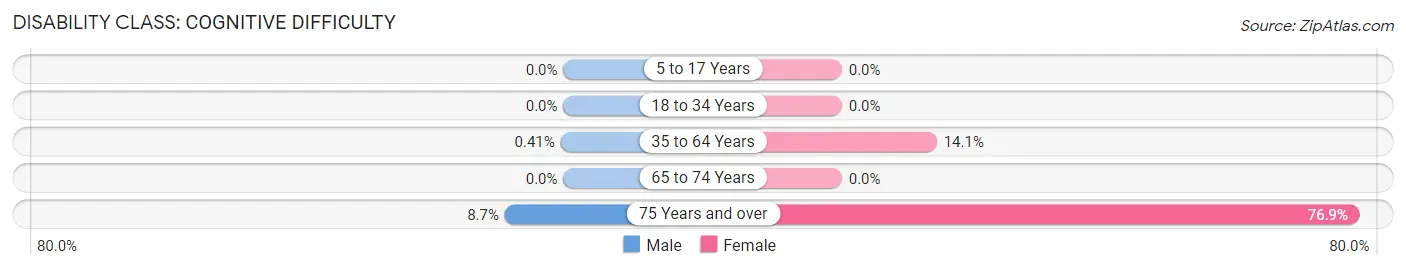
| Age Bracket | Male | Female |
| 5 to 17 Years | 0 (0.0%) | 0 (0.0%) |
| 18 to 34 Years | 0 (0.0%) | 0 (0.0%) |
| 35 to 64 Years | 3 (0.4%) | 74 (14.1%) |
| 65 to 74 Years | 0 (0.0%) | 0 (0.0%) |
| 75 Years and over | 6 (8.7%) | 150 (76.9%) |
Disability Class: Ambulatory Difficulty
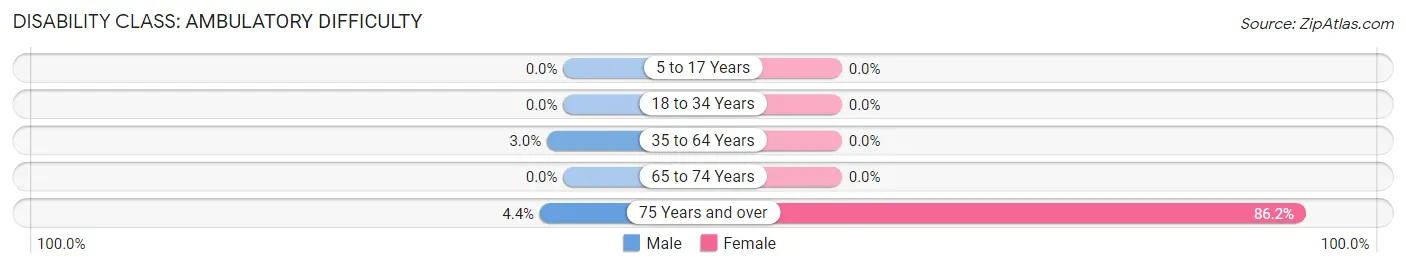
| Age Bracket | Male | Female |
| 5 to 17 Years | 0 (0.0%) | 0 (0.0%) |
| 18 to 34 Years | 0 (0.0%) | 0 (0.0%) |
| 35 to 64 Years | 22 (3.0%) | 0 (0.0%) |
| 65 to 74 Years | 0 (0.0%) | 0 (0.0%) |
| 75 Years and over | 3 (4.3%) | 168 (86.2%) |
Disability Class: Self-Care Difficulty
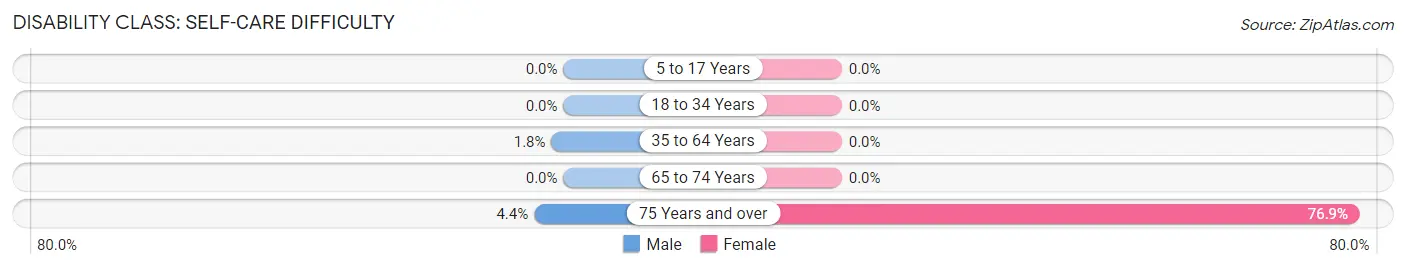
| Age Bracket | Male | Female |
| 5 to 17 Years | 0 (0.0%) | 0 (0.0%) |
| 18 to 34 Years | 0 (0.0%) | 0 (0.0%) |
| 35 to 64 Years | 13 (1.8%) | 0 (0.0%) |
| 65 to 74 Years | 0 (0.0%) | 0 (0.0%) |
| 75 Years and over | 3 (4.3%) | 150 (76.9%) |
Technology Access in Water Mill
Computing Device Access in Water Mill
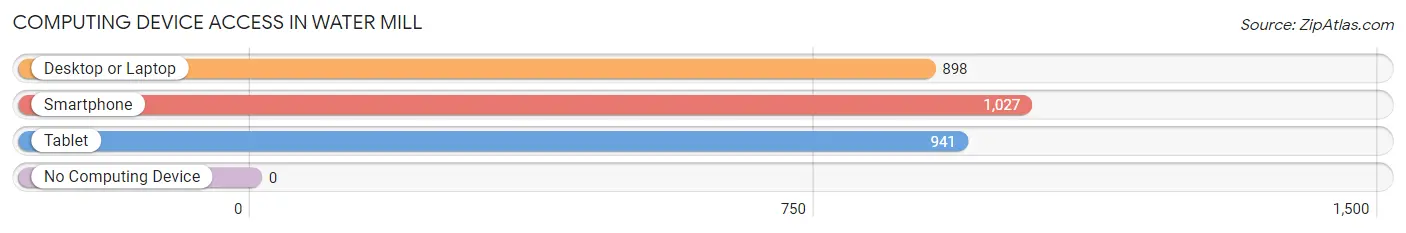
| Device Type | # Households | % Households |
| Desktop or Laptop | 898 | 80.5% |
| Smartphone | 1,027 | 92.0% |
| Tablet | 941 | 84.3% |
| No Computing Device | 0 | 0.0% |
| Total | 1,116 | 100.0% |
Internet Access in Water Mill
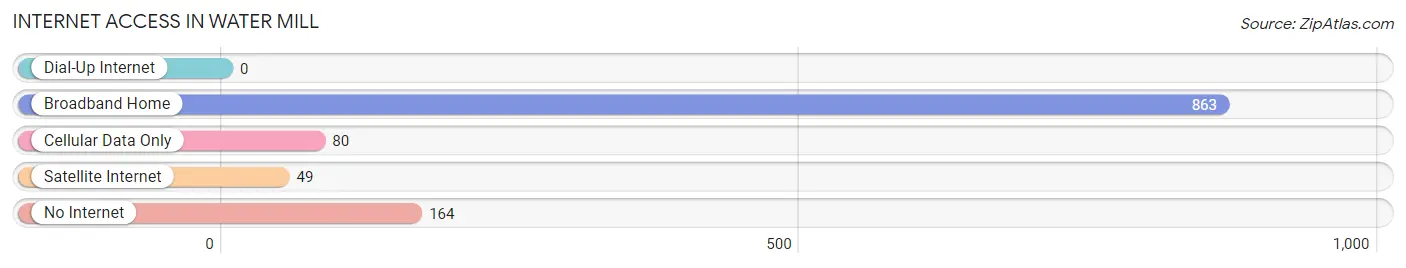
| Internet Type | # Households | % Households |
| Dial-Up Internet | 0 | 0.0% |
| Broadband Home | 863 | 77.3% |
| Cellular Data Only | 80 | 7.2% |
| Satellite Internet | 49 | 4.4% |
| No Internet | 164 | 14.7% |
| Total | 1,116 | 100.0% |
Water Mill Summary
History
Water Mill is a hamlet located in the Town of Southampton in Suffolk County, New York. It is located on the south shore of Long Island, approximately 80 miles east of New York City. The hamlet was first settled in 1644 by English settlers, and was originally known as “Old Town”. The name was changed to Water Mill in 1795, when a grist mill was built on the site. The mill was powered by a water wheel, which was fed by a stream that ran through the area.
The hamlet was a popular summer destination for wealthy New Yorkers in the late 19th and early 20th centuries. The area was home to several large estates, including the estate of John Jacob Astor IV, which was built in 1882. The estate was later purchased by the U.S. government and is now part of the Sagamore Hill National Historic Site.
Geography
Water Mill is located in the Town of Southampton in Suffolk County, New York. It is located on the south shore of Long Island, approximately 80 miles east of New York City. The hamlet is bordered to the north by the hamlet of Bridgehampton, to the east by the hamlet of Sagaponack, to the south by the hamlet of Noyack, and to the west by the hamlet of Water Mill.
The hamlet is situated on a peninsula that juts out into the Atlantic Ocean. The peninsula is bordered by Mecox Bay to the west and Noyack Bay to the east. The area is characterized by rolling hills, woodlands, and wetlands.
Economy
Water Mill is a primarily residential community, and the local economy is largely based on tourism and real estate. The hamlet is home to several upscale restaurants, boutique shops, and art galleries. The area is also home to several wineries, including the Wölffer Estate Vineyard and the Channing Daughters Winery.
The hamlet is also home to several large estates, including the estate of John Jacob Astor IV, which is now part of the Sagamore Hill National Historic Site. The area is also home to several golf courses, including the Sebonack Golf Club and the National Golf Links of America.
Demographics
As of the 2010 census, Water Mill had a population of 1,559. The population was spread out, with 48.3% male and 51.7% female. The median age was 48.2 years. The median household income was $125,000, and the median family income was $150,000.
The racial makeup of the hamlet was 94.2% White, 1.2% African American, 0.3% Native American, 1.2% Asian, 0.1% Pacific Islander, 0.7% from other races, and 2.3% from two or more races. Hispanic or Latino of any race were 4.2% of the population.
The majority of the population (90.2%) was born in the United States, with the remaining 9.8% born abroad. The most common ancestries were German (20.2%), Irish (17.2%), English (15.2%), Italian (13.2%), and Polish (7.2%).
Common Questions
What is Per Capita Income in Water Mill?
Per Capita income in Water Mill is $143,860.
What is the Median Family Income in Water Mill?
Median Family Income in Water Mill is $250,001.
What is the Median Household income in Water Mill?
Median Household Income in Water Mill is $174,919.
What is Income or Wage Gap in Water Mill?
Income or Wage Gap in Water Mill is 43.0%.
Women in Water Mill earn 57.0 cents for every dollar earned by a man.
What is Inequality or Gini Index in Water Mill?
Inequality or Gini Index in Water Mill is 0.53.
What is the Total Population of Water Mill?
Total Population of Water Mill is 2,308.
What is the Total Male Population of Water Mill?
Total Male Population of Water Mill is 1,142.
What is the Total Female Population of Water Mill?
Total Female Population of Water Mill is 1,166.
What is the Ratio of Males per 100 Females in Water Mill?
There are 97.94 Males per 100 Females in Water Mill.
What is the Ratio of Females per 100 Males in Water Mill?
There are 102.10 Females per 100 Males in Water Mill.
What is the Median Population Age in Water Mill?
Median Population Age in Water Mill is 54.9 Years.
What is the Average Family Size in Water Mill
Average Family Size in Water Mill is 2.4 People.
What is the Average Household Size in Water Mill
Average Household Size in Water Mill is 2.0 People.
How Large is the Labor Force in Water Mill?
There are 1,463 People in the Labor Forcein in Water Mill.
What is the Percentage of People in the Labor Force in Water Mill?
70.2% of People are in the Labor Force in Water Mill.
What is the Unemployment Rate in Water Mill?
Unemployment Rate in Water Mill is 10.9%.