Muttontown, NY Map & Demographics
Muttontown Map
Muttontown Overview
$112,324
PER CAPITA INCOME
$250,001
AVG FAMILY INCOME
$226,477
AVG HOUSEHOLD INCOME
40.8%
WAGE / INCOME GAP [ % ]
59.2¢/ $1
WAGE / INCOME GAP [ $ ]
0.52
INEQUALITY / GINI INDEX
3,499
TOTAL POPULATION
1,822
MALE POPULATION
1,677
FEMALE POPULATION
108.65
MALES / 100 FEMALES
92.04
FEMALES / 100 MALES
46.9
MEDIAN AGE
3.3
AVG FAMILY SIZE
3.1
AVG HOUSEHOLD SIZE
1,716
LABOR FORCE [ PEOPLE ]
62.9%
PERCENT IN LABOR FORCE
7.2%
UNEMPLOYMENT RATE
Income in Muttontown
Income Overview in Muttontown
Per Capita Income in Muttontown is $112,324, while median incomes of families and households are $250,001 and $226,477 respectively.
| Characteristic | Number | Measure |
| Per Capita Income | 3,499 | $112,324 |
| Median Family Income | 988 | $250,001 |
| Mean Family Income | 988 | $380,940 |
| Median Household Income | 1,133 | $226,477 |
| Mean Household Income | 1,133 | $359,201 |
| Income Deficit | 988 | $0 |
| Wage / Income Gap (%) | 3,499 | 40.80% |
| Wage / Income Gap ($) | 3,499 | 59.20¢ per $1 |
| Gini / Inequality Index | 3,499 | 0.52 |
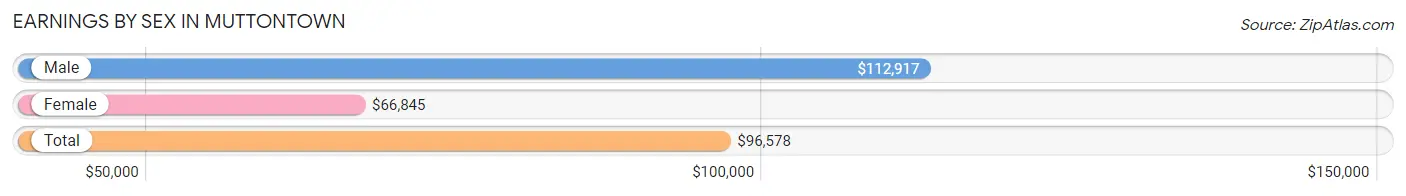
Earnings by Sex in Muttontown
Average Earnings in Muttontown are $96,578, $112,917 for men and $66,845 for women, a difference of 40.8%.
| Sex | Number | Average Earnings |
| Male | 1,054 (61.0%) | $112,917 |
| Female | 675 (39.0%) | $66,845 |
| Total | 1,729 (100.0%) | $96,578 |
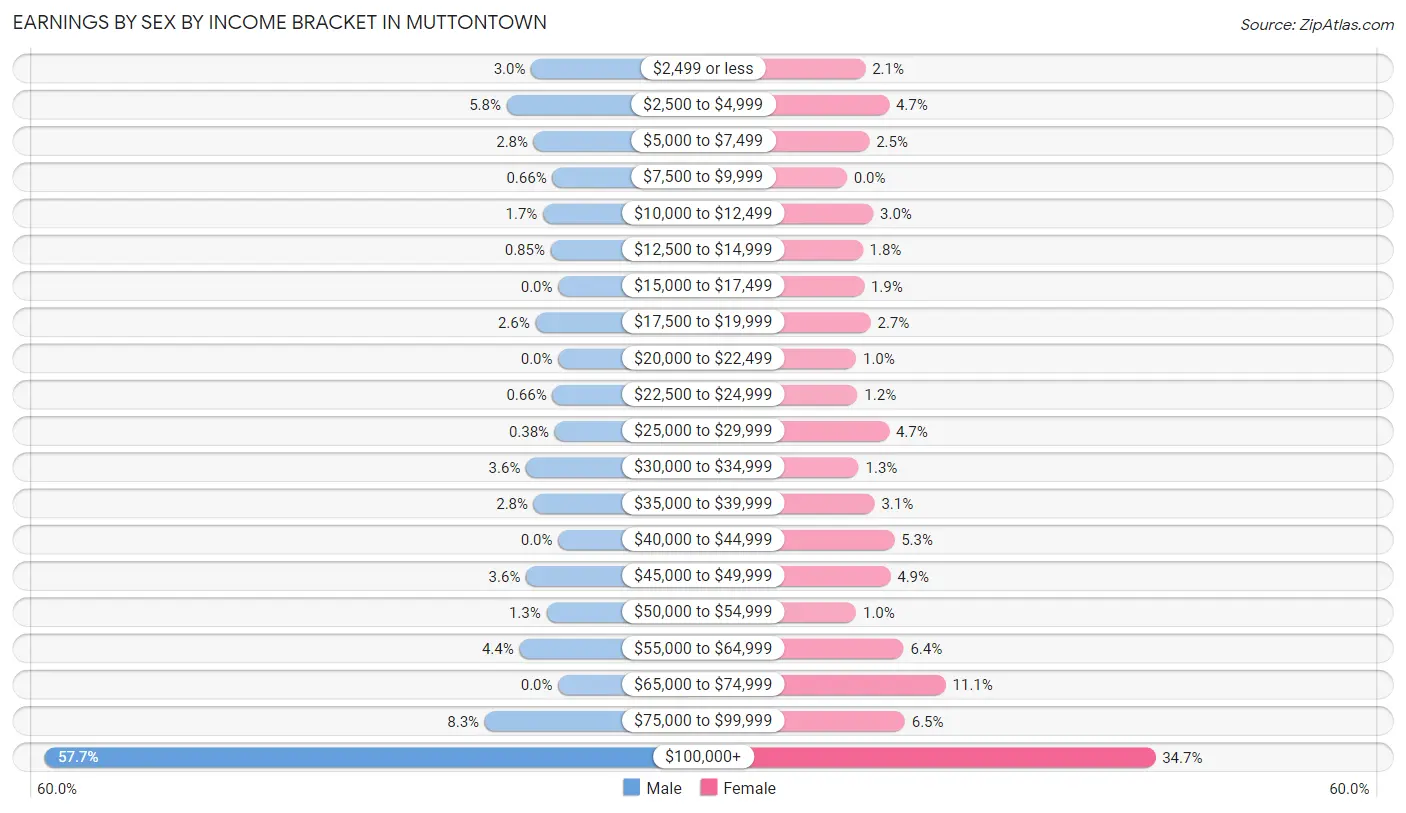
Earnings by Sex by Income Bracket in Muttontown
The most common earnings brackets in Muttontown are $100,000+ for men (608 | 57.7%) and $100,000+ for women (234 | 34.7%).
| Income | Male | Female |
| $2,499 or less | 32 (3.0%) | 14 (2.1%) |
| $2,500 to $4,999 | 61 (5.8%) | 32 (4.7%) |
| $5,000 to $7,499 | 29 (2.8%) | 17 (2.5%) |
| $7,500 to $9,999 | 7 (0.7%) | 0 (0.0%) |
| $10,000 to $12,499 | 18 (1.7%) | 20 (3.0%) |
| $12,500 to $14,999 | 9 (0.9%) | 12 (1.8%) |
| $15,000 to $17,499 | 0 (0.0%) | 13 (1.9%) |
| $17,500 to $19,999 | 27 (2.6%) | 18 (2.7%) |
| $20,000 to $22,499 | 0 (0.0%) | 7 (1.0%) |
| $22,500 to $24,999 | 7 (0.7%) | 8 (1.2%) |
| $25,000 to $29,999 | 4 (0.4%) | 32 (4.7%) |
| $30,000 to $34,999 | 38 (3.6%) | 9 (1.3%) |
| $35,000 to $39,999 | 29 (2.8%) | 21 (3.1%) |
| $40,000 to $44,999 | 0 (0.0%) | 36 (5.3%) |
| $45,000 to $49,999 | 38 (3.6%) | 33 (4.9%) |
| $50,000 to $54,999 | 14 (1.3%) | 7 (1.0%) |
| $55,000 to $64,999 | 46 (4.4%) | 43 (6.4%) |
| $65,000 to $74,999 | 0 (0.0%) | 75 (11.1%) |
| $75,000 to $99,999 | 87 (8.3%) | 44 (6.5%) |
| $100,000+ | 608 (57.7%) | 234 (34.7%) |
| Total | 1,054 (100.0%) | 675 (100.0%) |
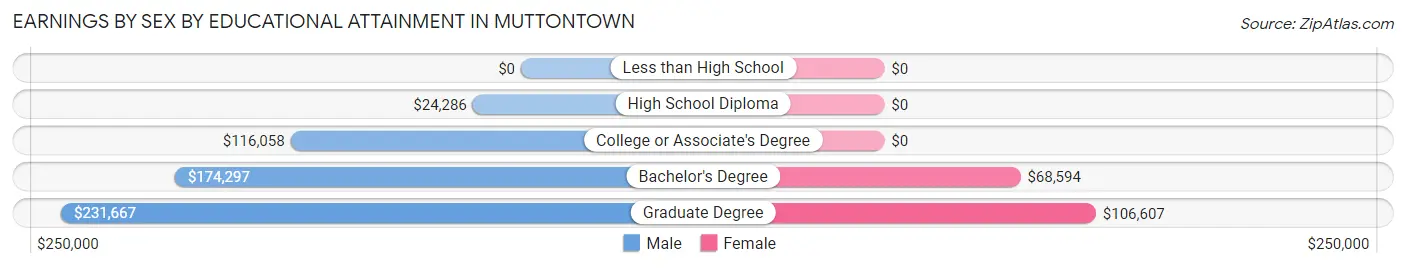
Earnings by Sex by Educational Attainment in Muttontown
Average earnings in Muttontown are $149,643 for men and $70,862 for women, a difference of 52.6%. Men with an educational attainment of graduate degree enjoy the highest average annual earnings of $231,667, while those with high school diploma education earn the least with $24,286. Women with an educational attainment of graduate degree earn the most with the average annual earnings of $106,607, while those with bachelor's degree education have the smallest earnings of $68,594.
| Educational Attainment | Male Income | Female Income |
| Less than High School | - | - |
| High School Diploma | $24,286 | $0 |
| College or Associate's Degree | $116,058 | $0 |
| Bachelor's Degree | $174,297 | $68,594 |
| Graduate Degree | $231,667 | $106,607 |
| Total | $149,643 | $70,862 |
Family Income in Muttontown
Family Income Brackets in Muttontown
According to the Muttontown family income data, there are 579 families falling into the $200,000+ income range, which is the most common income bracket and makes up 58.6% of all families.
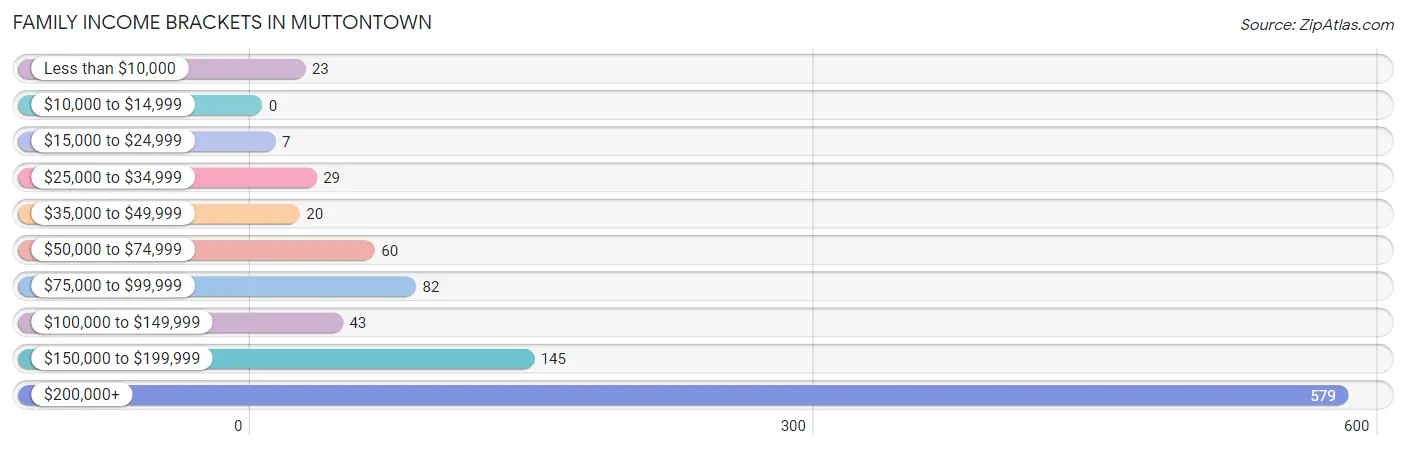
| Income Bracket | # Families | % Families |
| Less than $10,000 | 23 | 2.3% |
| $10,000 to $14,999 | 0 | 0.0% |
| $15,000 to $24,999 | 7 | 0.7% |
| $25,000 to $34,999 | 29 | 2.9% |
| $35,000 to $49,999 | 20 | 2.0% |
| $50,000 to $74,999 | 60 | 6.1% |
| $75,000 to $99,999 | 82 | 8.3% |
| $100,000 to $149,999 | 43 | 4.4% |
| $150,000 to $199,999 | 145 | 14.7% |
| $200,000+ | 579 | 58.6% |
Family Income by Famaliy Size in Muttontown
6-person families (53 | 5.4%) account for the highest median family income in Muttontown with $250,001 per family, while 2-person families (334 | 33.8%) have the highest median income of $123,928 per family member.
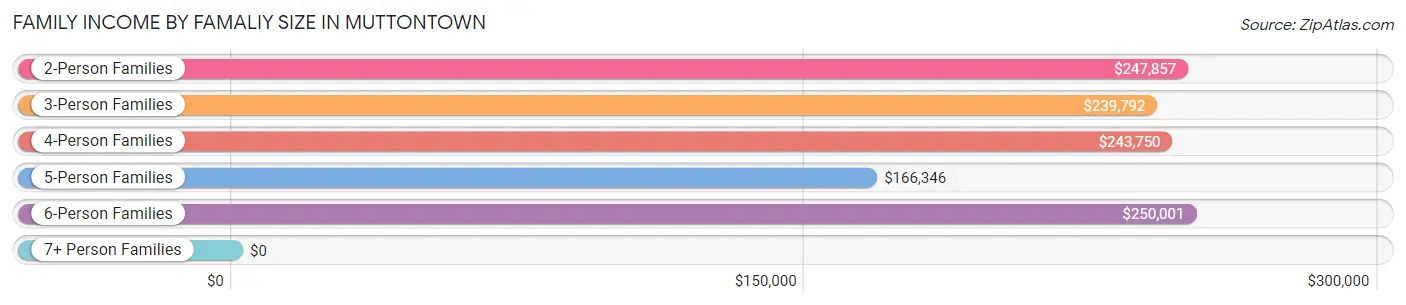
| Income Bracket | # Families | Median Income |
| 2-Person Families | 334 (33.8%) | $247,857 |
| 3-Person Families | 195 (19.7%) | $239,792 |
| 4-Person Families | 327 (33.1%) | $243,750 |
| 5-Person Families | 64 (6.5%) | $166,346 |
| 6-Person Families | 53 (5.4%) | $250,001 |
| 7+ Person Families | 15 (1.5%) | $0 |
| Total | 988 (100.0%) | $250,001 |
Family Income by Number of Earners in Muttontown
The median family income in Muttontown is $250,001, with families comprising 2 earners (484) having the highest median family income of $250,001, while families with no earners (110) have the lowest median family income of $67,500, accounting for 49.0% and 11.1% of families, respectively.
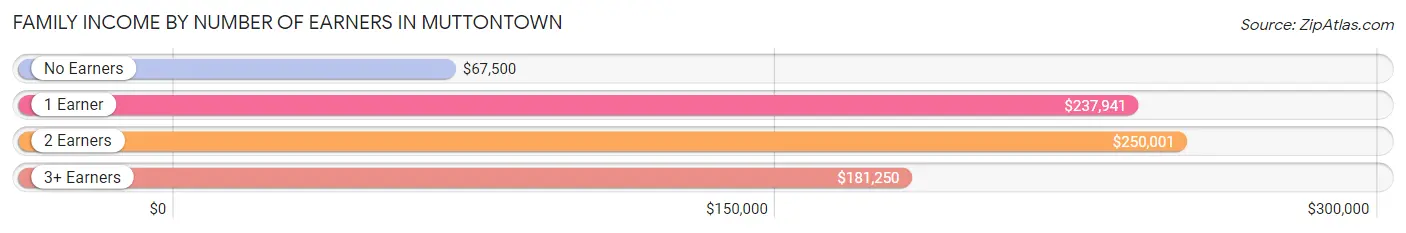
| Number of Earners | # Families | Median Income |
| No Earners | 110 (11.1%) | $67,500 |
| 1 Earner | 254 (25.7%) | $237,941 |
| 2 Earners | 484 (49.0%) | $250,001 |
| 3+ Earners | 140 (14.2%) | $181,250 |
| Total | 988 (100.0%) | $250,001 |
Household Income in Muttontown
Household Income Brackets in Muttontown
With 614 households falling in the category, the $200,000+ income range is the most frequent in Muttontown, accounting for 54.2% of all households.
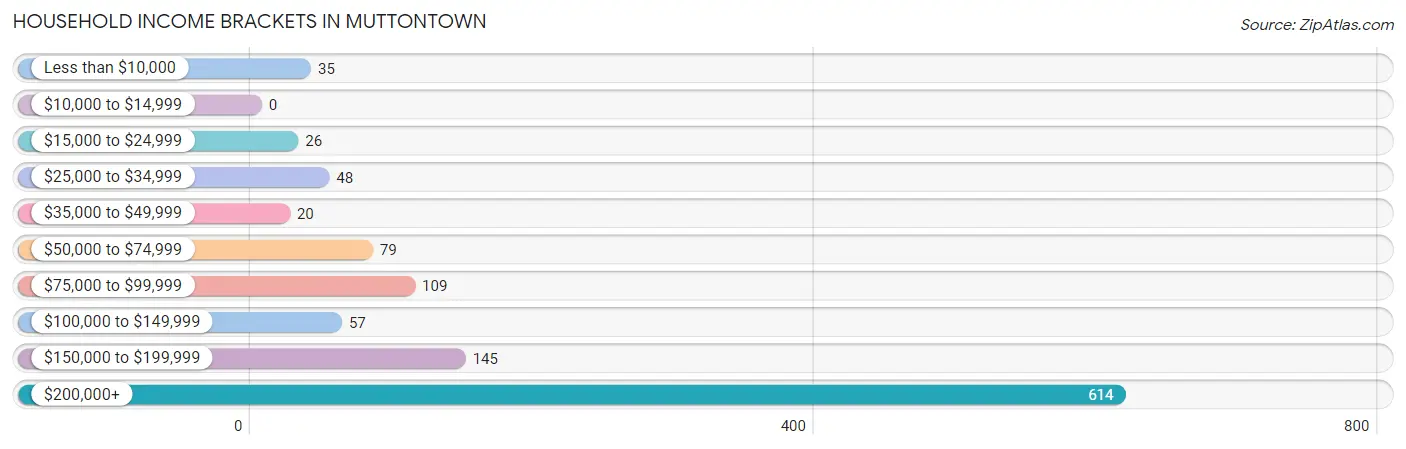
| Income Bracket | # Households | % Households |
| Less than $10,000 | 35 | 3.1% |
| $10,000 to $14,999 | 0 | 0.0% |
| $15,000 to $24,999 | 26 | 2.3% |
| $25,000 to $34,999 | 48 | 4.2% |
| $35,000 to $49,999 | 20 | 1.8% |
| $50,000 to $74,999 | 79 | 7.0% |
| $75,000 to $99,999 | 109 | 9.6% |
| $100,000 to $149,999 | 57 | 5.0% |
| $150,000 to $199,999 | 145 | 12.8% |
| $200,000+ | 614 | 54.2% |
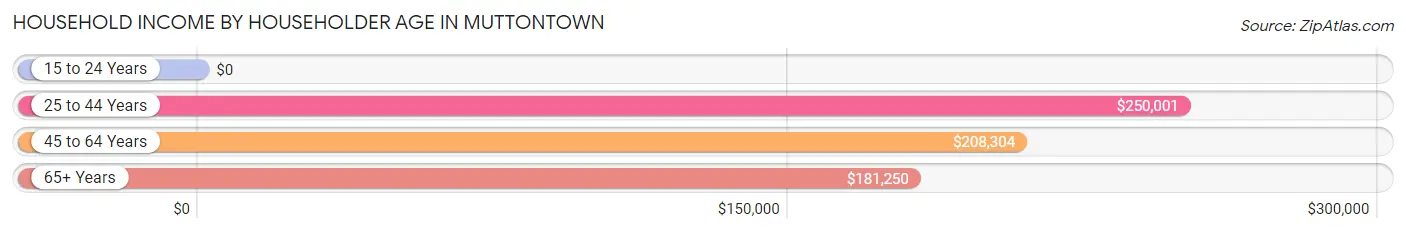
Household Income by Householder Age in Muttontown
The median household income in Muttontown is $226,477, with the highest median household income of $250,001 found in the 25 to 44 years age bracket for the primary householder. A total of 136 households (12.0%) fall into this category.
| Income Bracket | # Households | Median Income |
| 15 to 24 Years | 0 (0.0%) | $0 |
| 25 to 44 Years | 136 (12.0%) | $250,001 |
| 45 to 64 Years | 645 (56.9%) | $208,304 |
| 65+ Years | 352 (31.1%) | $181,250 |
| Total | 1,133 (100.0%) | $226,477 |
Poverty in Muttontown
Income Below Poverty by Sex and Age in Muttontown
With 3.0% poverty level for males and 4.3% for females among the residents of Muttontown, 65 to 74 year old males and 18 to 24 year old females are the most vulnerable to poverty, with 29 males (14.8%) and 11 females (13.8%) in their respective age groups living below the poverty level.
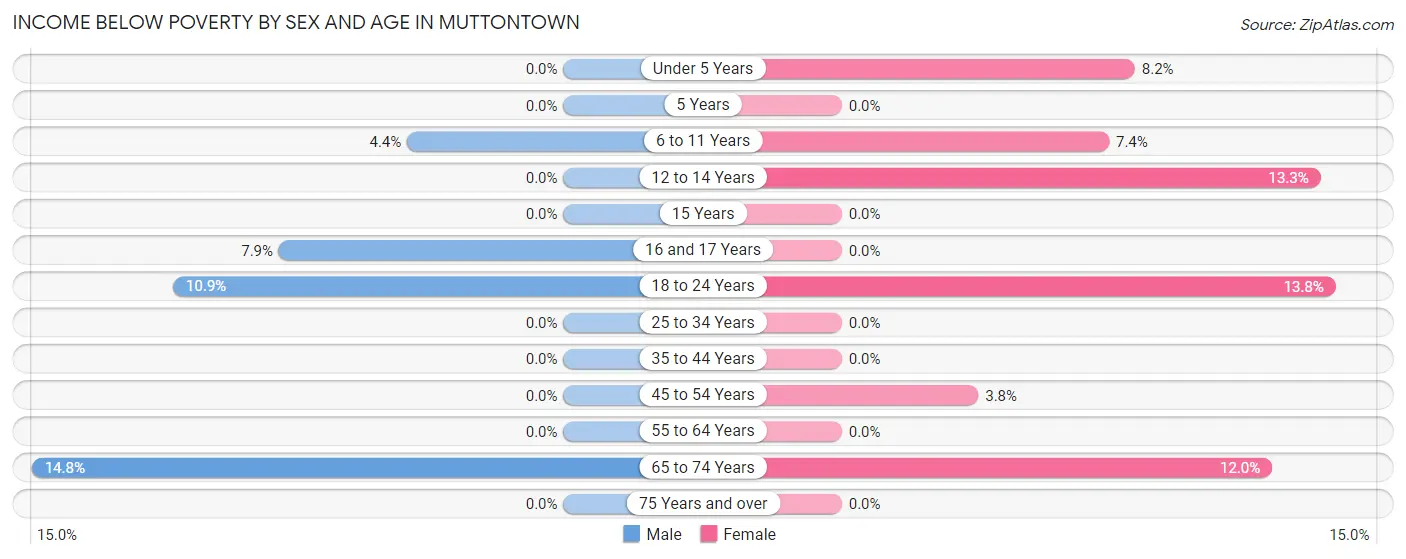
| Age Bracket | Male | Female |
| Under 5 Years | 0 (0.0%) | 8 (8.2%) |
| 5 Years | 0 (0.0%) | 0 (0.0%) |
| 6 to 11 Years | 8 (4.3%) | 16 (7.4%) |
| 12 to 14 Years | 0 (0.0%) | 8 (13.3%) |
| 15 Years | 0 (0.0%) | 0 (0.0%) |
| 16 and 17 Years | 8 (7.9%) | 0 (0.0%) |
| 18 to 24 Years | 10 (10.9%) | 11 (13.8%) |
| 25 to 34 Years | 0 (0.0%) | 0 (0.0%) |
| 35 to 44 Years | 0 (0.0%) | 0 (0.0%) |
| 45 to 54 Years | 0 (0.0%) | 7 (3.8%) |
| 55 to 64 Years | 0 (0.0%) | 0 (0.0%) |
| 65 to 74 Years | 29 (14.8%) | 23 (12.0%) |
| 75 Years and over | 0 (0.0%) | 0 (0.0%) |
| Total | 55 (3.0%) | 73 (4.3%) |
Income Above Poverty by Sex and Age in Muttontown
According to the poverty statistics in Muttontown, males aged under 5 years and females aged 5 years are the age groups that are most secure financially, with 100.0% of males and 100.0% of females in these age groups living above the poverty line.

| Age Bracket | Male | Female |
| Under 5 Years | 64 (100.0%) | 90 (91.8%) |
| 5 Years | 17 (100.0%) | 6 (100.0%) |
| 6 to 11 Years | 176 (95.7%) | 199 (92.6%) |
| 12 to 14 Years | 87 (100.0%) | 52 (86.7%) |
| 15 Years | 26 (100.0%) | 14 (100.0%) |
| 16 and 17 Years | 93 (92.1%) | 15 (100.0%) |
| 18 to 24 Years | 82 (89.1%) | 69 (86.3%) |
| 25 to 34 Years | 91 (100.0%) | 138 (100.0%) |
| 35 to 44 Years | 167 (100.0%) | 161 (100.0%) |
| 45 to 54 Years | 278 (100.0%) | 177 (96.2%) |
| 55 to 64 Years | 358 (100.0%) | 388 (100.0%) |
| 65 to 74 Years | 167 (85.2%) | 169 (88.0%) |
| 75 Years and over | 161 (100.0%) | 126 (100.0%) |
| Total | 1,767 (97.0%) | 1,604 (95.7%) |
Income Below Poverty Among Married-Couple Families in Muttontown
The poverty statistics for married-couple families in Muttontown show that 1.7% or 16 of the total 933 families live below the poverty line. Families with no children have the highest poverty rate of 3.2%, comprising of 16 families. On the other hand, families with 1 or 2 children have the lowest poverty rate of 0.0%, which includes 0 families.
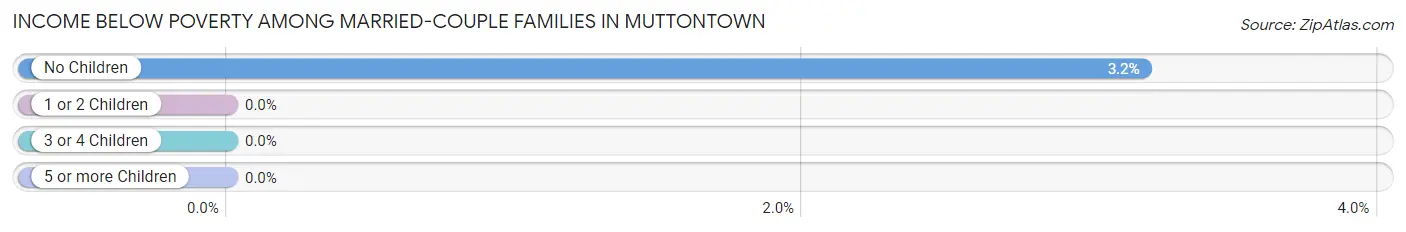
| Children | Above Poverty | Below Poverty |
| No Children | 487 (96.8%) | 16 (3.2%) |
| 1 or 2 Children | 401 (100.0%) | 0 (0.0%) |
| 3 or 4 Children | 29 (100.0%) | 0 (0.0%) |
| 5 or more Children | 0 (0.0%) | 0 (0.0%) |
| Total | 917 (98.3%) | 16 (1.7%) |
Income Below Poverty Among Single-Parent Households in Muttontown
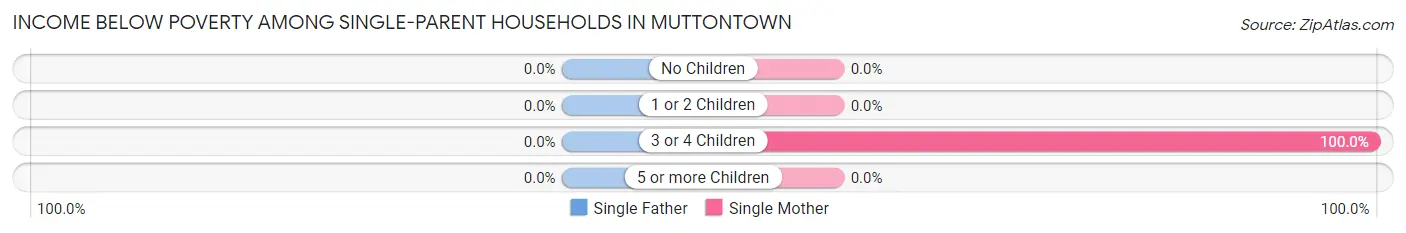
| Children | Single Father | Single Mother |
| No Children | 0 (0.0%) | 0 (0.0%) |
| 1 or 2 Children | 0 (0.0%) | 0 (0.0%) |
| 3 or 4 Children | 0 (0.0%) | 14 (100.0%) |
| 5 or more Children | 0 (0.0%) | 0 (0.0%) |
| Total | 0 (0.0%) | 14 (41.2%) |
Income Below Poverty Among Married-Couple vs Single-Parent Households in Muttontown
The poverty data for Muttontown shows that 16 of the married-couple family households (1.7%) and 14 of the single-parent households (25.5%) are living below the poverty level. Within the married-couple family households, those with no children have the highest poverty rate, with 16 households (3.2%) falling below the poverty line. Among the single-parent households, those with 3 or 4 children have the highest poverty rate, with 14 household (48.3%) living below poverty.
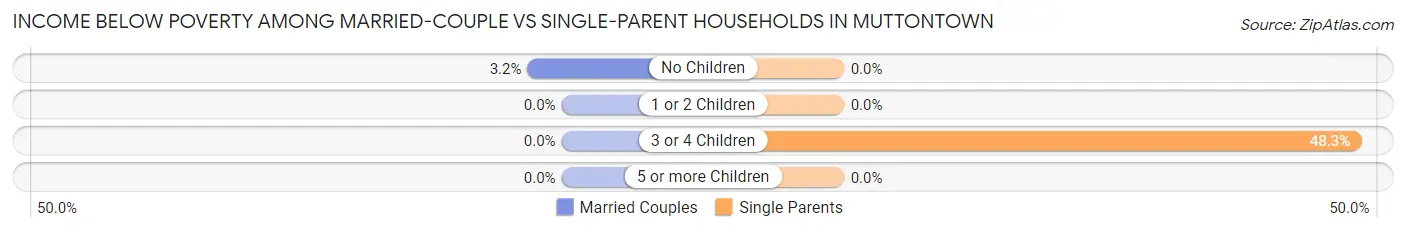
| Children | Married-Couple Families | Single-Parent Households |
| No Children | 16 (3.2%) | 0 (0.0%) |
| 1 or 2 Children | 0 (0.0%) | 0 (0.0%) |
| 3 or 4 Children | 0 (0.0%) | 14 (48.3%) |
| 5 or more Children | 0 (0.0%) | 0 (0.0%) |
| Total | 16 (1.7%) | 14 (25.5%) |
Race in Muttontown
The most populous races in Muttontown are White / Caucasian (2,038 | 58.3%), Asian (1,163 | 33.2%), and Hispanic or Latino (183 | 5.2%).
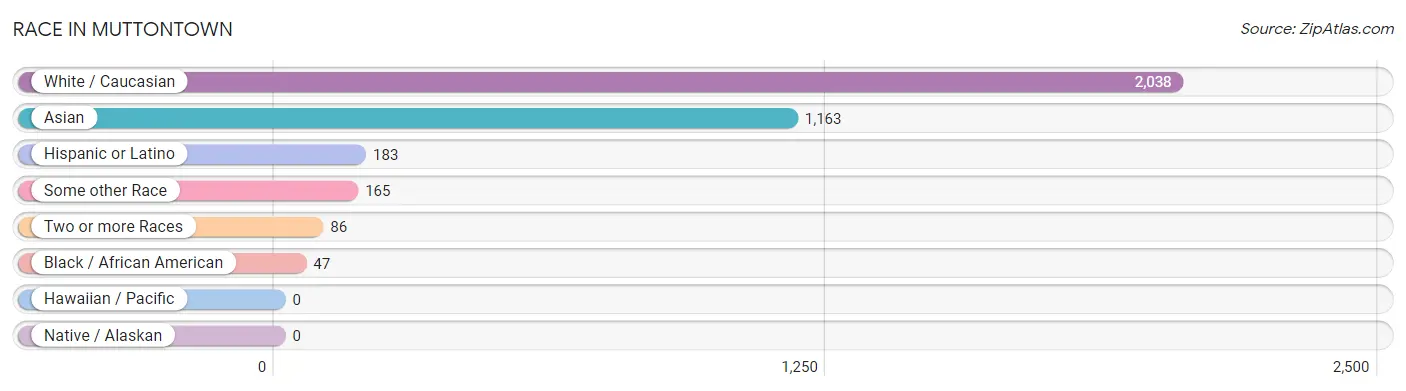
| Race | # Population | % Population |
| Asian | 1,163 | 33.2% |
| Black / African American | 47 | 1.3% |
| Hawaiian / Pacific | 0 | 0.0% |
| Hispanic or Latino | 183 | 5.2% |
| Native / Alaskan | 0 | 0.0% |
| White / Caucasian | 2,038 | 58.3% |
| Two or more Races | 86 | 2.5% |
| Some other Race | 165 | 4.7% |
| Total | 3,499 | 100.0% |
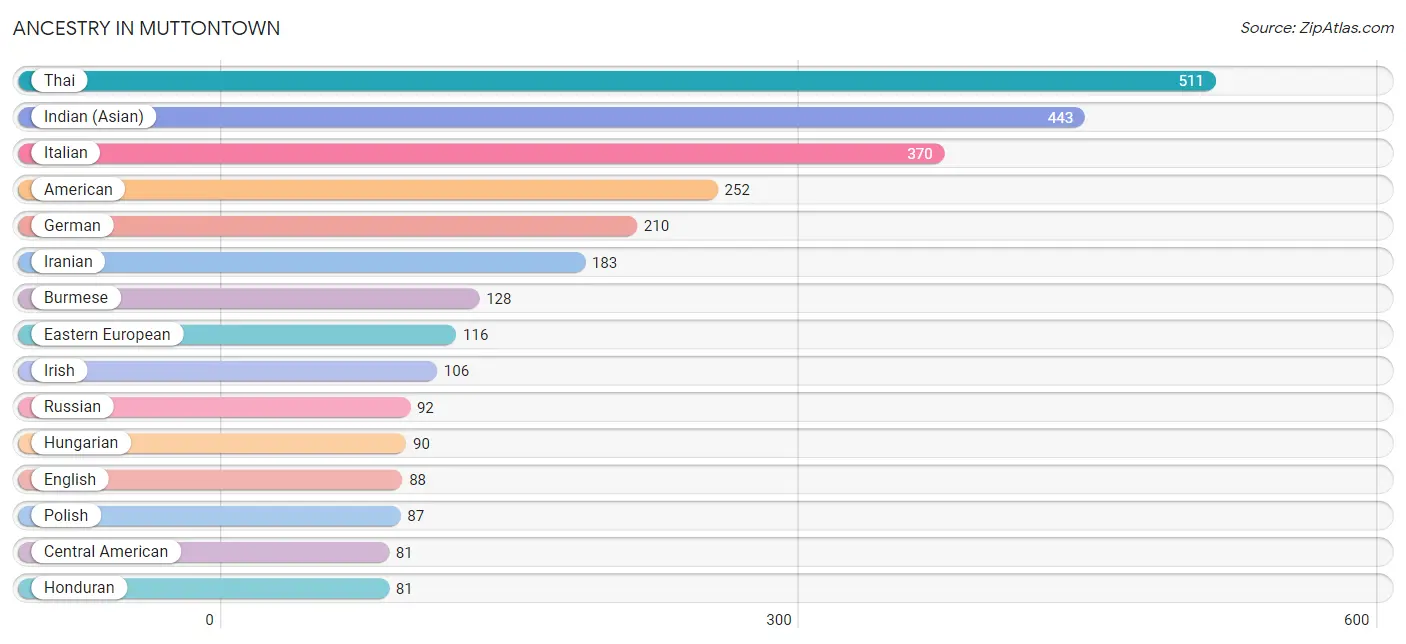
Ancestry in Muttontown
The most populous ancestries reported in Muttontown are Thai (511 | 14.6%), Indian (Asian) (443 | 12.7%), Italian (370 | 10.6%), American (252 | 7.2%), and German (210 | 6.0%), together accounting for 51.0% of all Muttontown residents.
| Ancestry | # Population | % Population |
| Afghan | 34 | 1.0% |
| American | 252 | 7.2% |
| Arab | 13 | 0.4% |
| Austrian | 38 | 1.1% |
| Bhutanese | 79 | 2.3% |
| British | 16 | 0.5% |
| Burmese | 128 | 3.7% |
| Canadian | 12 | 0.3% |
| Central American | 81 | 2.3% |
| Colombian | 11 | 0.3% |
| Cuban | 8 | 0.2% |
| Dominican | 39 | 1.1% |
| Eastern European | 116 | 3.3% |
| Ecuadorian | 33 | 0.9% |
| English | 88 | 2.5% |
| European | 78 | 2.2% |
| French | 20 | 0.6% |
| French Canadian | 8 | 0.2% |
| German | 210 | 6.0% |
| Honduran | 81 | 2.3% |
| Hungarian | 90 | 2.6% |
| Indian (Asian) | 443 | 12.7% |
| Iranian | 183 | 5.2% |
| Irish | 106 | 3.0% |
| Israeli | 15 | 0.4% |
| Italian | 370 | 10.6% |
| Korean | 12 | 0.3% |
| Latvian | 6 | 0.2% |
| Maltese | 7 | 0.2% |
| Mexican | 11 | 0.3% |
| Mongolian | 8 | 0.2% |
| Moroccan | 13 | 0.4% |
| Polish | 87 | 2.5% |
| Russian | 92 | 2.6% |
| Scottish | 16 | 0.5% |
| South American | 44 | 1.3% |
| Sri Lankan | 25 | 0.7% |
| Swedish | 18 | 0.5% |
| Thai | 511 | 14.6% |
| Ukrainian | 23 | 0.7% |
| Welsh | 11 | 0.3% | View All 41 Rows |
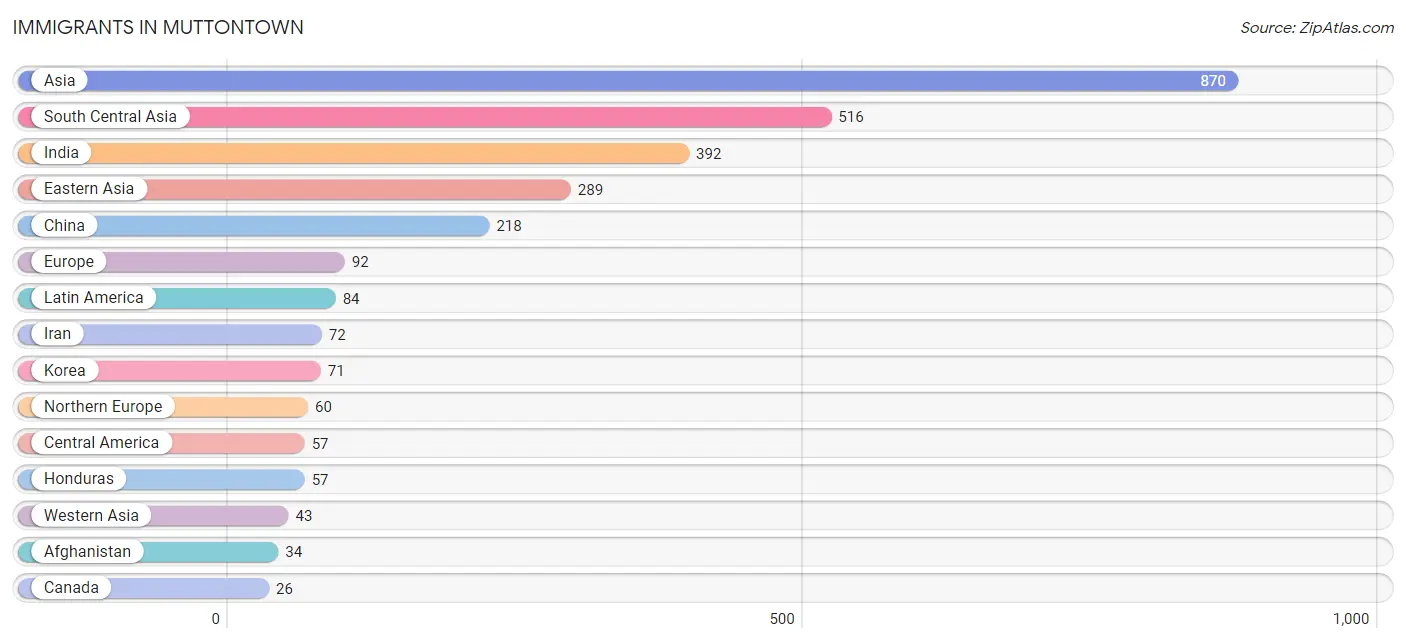
Immigrants in Muttontown
The most numerous immigrant groups reported in Muttontown came from Asia (870 | 24.9%), South Central Asia (516 | 14.7%), India (392 | 11.2%), Eastern Asia (289 | 8.3%), and China (218 | 6.2%), together accounting for 65.3% of all Muttontown residents.
| Immigration Origin | # Population | % Population |
| Afghanistan | 34 | 1.0% |
| Africa | 10 | 0.3% |
| Asia | 870 | 24.9% |
| Canada | 26 | 0.7% |
| Caribbean | 8 | 0.2% |
| Central America | 57 | 1.6% |
| China | 218 | 6.2% |
| Colombia | 11 | 0.3% |
| Dominican Republic | 8 | 0.2% |
| Eastern Africa | 10 | 0.3% |
| Eastern Asia | 289 | 8.3% |
| Eastern Europe | 16 | 0.5% |
| Ecuador | 8 | 0.2% |
| England | 7 | 0.2% |
| Europe | 92 | 2.6% |
| Honduras | 57 | 1.6% |
| Hong Kong | 15 | 0.4% |
| India | 392 | 11.2% |
| Iran | 72 | 2.1% |
| Ireland | 8 | 0.2% |
| Israel | 26 | 0.7% |
| Italy | 6 | 0.2% |
| Kenya | 10 | 0.3% |
| Korea | 71 | 2.0% |
| Latin America | 84 | 2.4% |
| Malaysia | 8 | 0.2% |
| Northern Europe | 60 | 1.7% |
| Pakistan | 18 | 0.5% |
| Poland | 16 | 0.5% |
| South America | 19 | 0.5% |
| South Central Asia | 516 | 14.7% |
| South Eastern Asia | 22 | 0.6% |
| Southern Europe | 16 | 0.5% |
| Spain | 10 | 0.3% |
| Taiwan | 24 | 0.7% |
| Vietnam | 14 | 0.4% |
| Western Asia | 43 | 1.2% | View All 37 Rows |
Sex and Age in Muttontown
Sex and Age in Muttontown
The most populous age groups in Muttontown are 55 to 59 Years (208 | 11.4%) for men and 60 to 64 Years (197 | 11.7%) for women.
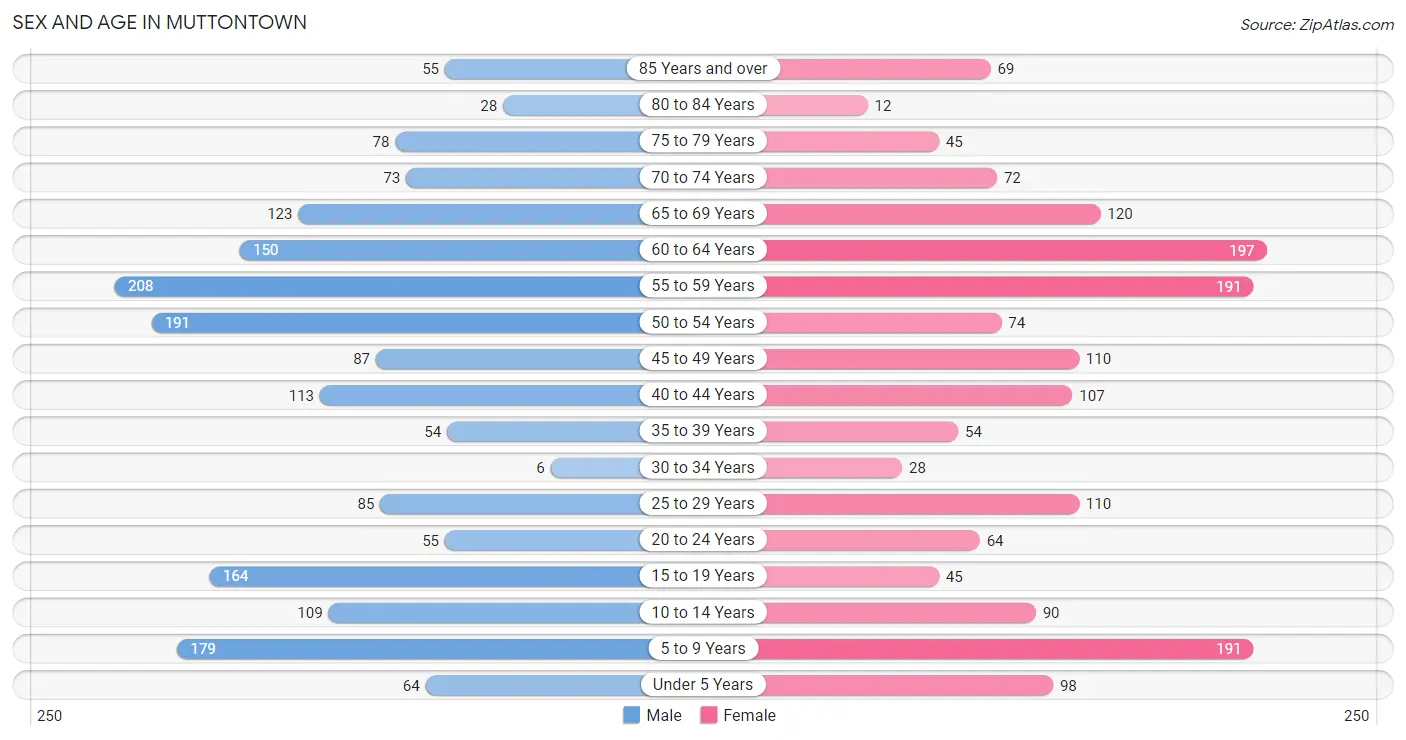
| Age Bracket | Male | Female |
| Under 5 Years | 64 (3.5%) | 98 (5.8%) |
| 5 to 9 Years | 179 (9.8%) | 191 (11.4%) |
| 10 to 14 Years | 109 (6.0%) | 90 (5.4%) |
| 15 to 19 Years | 164 (9.0%) | 45 (2.7%) |
| 20 to 24 Years | 55 (3.0%) | 64 (3.8%) |
| 25 to 29 Years | 85 (4.7%) | 110 (6.6%) |
| 30 to 34 Years | 6 (0.3%) | 28 (1.7%) |
| 35 to 39 Years | 54 (3.0%) | 54 (3.2%) |
| 40 to 44 Years | 113 (6.2%) | 107 (6.4%) |
| 45 to 49 Years | 87 (4.8%) | 110 (6.6%) |
| 50 to 54 Years | 191 (10.5%) | 74 (4.4%) |
| 55 to 59 Years | 208 (11.4%) | 191 (11.4%) |
| 60 to 64 Years | 150 (8.2%) | 197 (11.7%) |
| 65 to 69 Years | 123 (6.8%) | 120 (7.2%) |
| 70 to 74 Years | 73 (4.0%) | 72 (4.3%) |
| 75 to 79 Years | 78 (4.3%) | 45 (2.7%) |
| 80 to 84 Years | 28 (1.5%) | 12 (0.7%) |
| 85 Years and over | 55 (3.0%) | 69 (4.1%) |
| Total | 1,822 (100.0%) | 1,677 (100.0%) |
Families and Households in Muttontown
Median Family Size in Muttontown
The median family size in Muttontown is 3.31 persons per family, with single male/father families (21 | 2.1%) accounting for the largest median family size of 5.33 persons per family. On the other hand, married-couple families (933 | 94.4%) represent the smallest median family size with 3.25 persons per family.
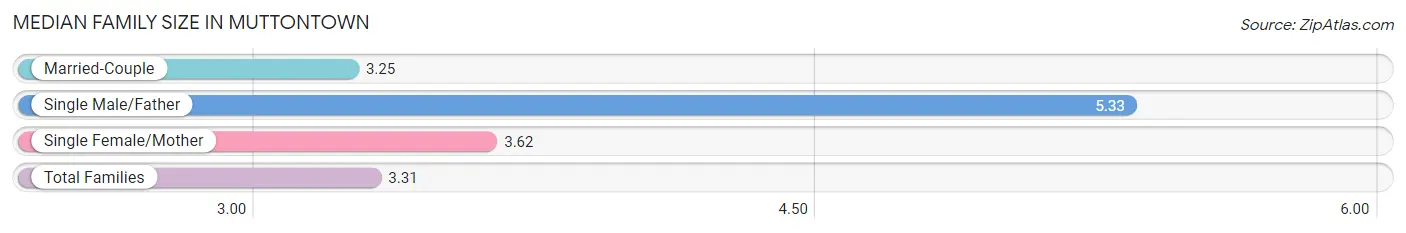
| Family Type | # Families | Family Size |
| Married-Couple | 933 (94.4%) | 3.25 |
| Single Male/Father | 21 (2.1%) | 5.33 |
| Single Female/Mother | 34 (3.4%) | 3.62 |
| Total Families | 988 (100.0%) | 3.31 |
Median Household Size in Muttontown
The median household size in Muttontown is 3.09 persons per household, with single male/father households (21 | 1.8%) accounting for the largest median household size of 5.33 persons per household. non-family households (145 | 12.8%) represent the smallest median household size with 1.40 persons per household.
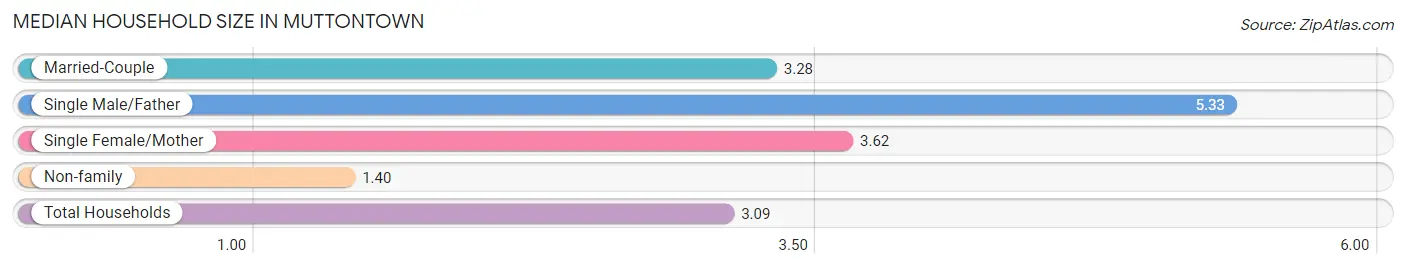
| Household Type | # Households | Household Size |
| Married-Couple | 933 (82.4%) | 3.28 |
| Single Male/Father | 21 (1.8%) | 5.33 |
| Single Female/Mother | 34 (3.0%) | 3.62 |
| Non-family | 145 (12.8%) | 1.40 |
| Total Households | 1,133 (100.0%) | 3.09 |
Household Size by Marriage Status in Muttontown
Out of a total of 1,133 households in Muttontown, 988 (87.2%) are family households, while 145 (12.8%) are nonfamily households. The most numerous type of family households are 2-person households, comprising 327, and the most common type of nonfamily households are 1-person households, comprising 102.
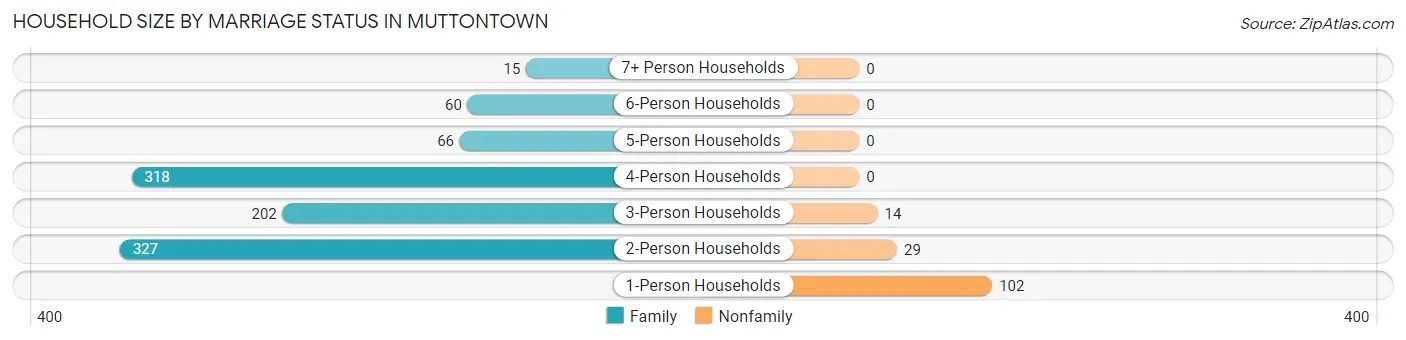
| Household Size | Family Households | Nonfamily Households |
| 1-Person Households | - | 102 (9.0%) |
| 2-Person Households | 327 (28.9%) | 29 (2.6%) |
| 3-Person Households | 202 (17.8%) | 14 (1.2%) |
| 4-Person Households | 318 (28.1%) | 0 (0.0%) |
| 5-Person Households | 66 (5.8%) | 0 (0.0%) |
| 6-Person Households | 60 (5.3%) | 0 (0.0%) |
| 7+ Person Households | 15 (1.3%) | 0 (0.0%) |
| Total | 988 (87.2%) | 145 (12.8%) |
Female Fertility in Muttontown
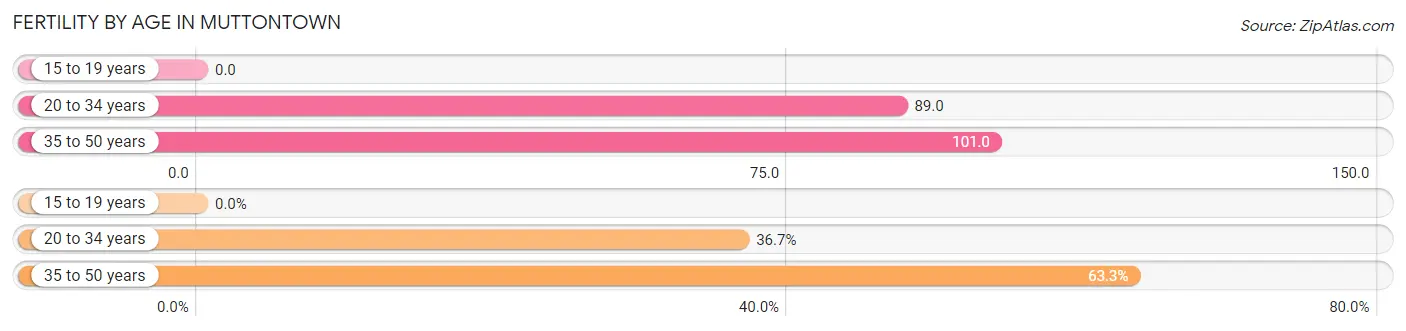
Fertility by Age in Muttontown
Average fertility rate in Muttontown is 89.0 births per 1,000 women. Women in the age bracket of 35 to 50 years have the highest fertility rate with 101.0 births per 1,000 women. Women in the age bracket of 35 to 50 years acount for 63.3% of all women with births.
| Age Bracket | Women with Births | Births / 1,000 Women |
| 15 to 19 years | 0 (0.0%) | 0.0 |
| 20 to 34 years | 18 (36.7%) | 89.0 |
| 35 to 50 years | 31 (63.3%) | 101.0 |
| Total | 49 (100.0%) | 89.0 |
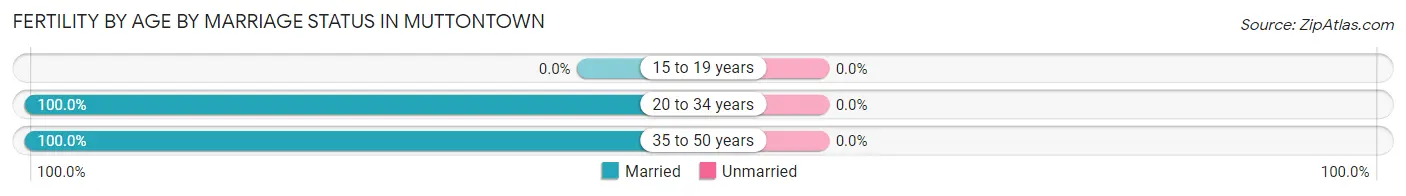
Fertility by Age by Marriage Status in Muttontown
| Age Bracket | Married | Unmarried |
| 15 to 19 years | 0 (0.0%) | 0 (0.0%) |
| 20 to 34 years | 18 (100.0%) | 0 (0.0%) |
| 35 to 50 years | 31 (100.0%) | 0 (0.0%) |
| Total | 49 (100.0%) | 0 (0.0%) |
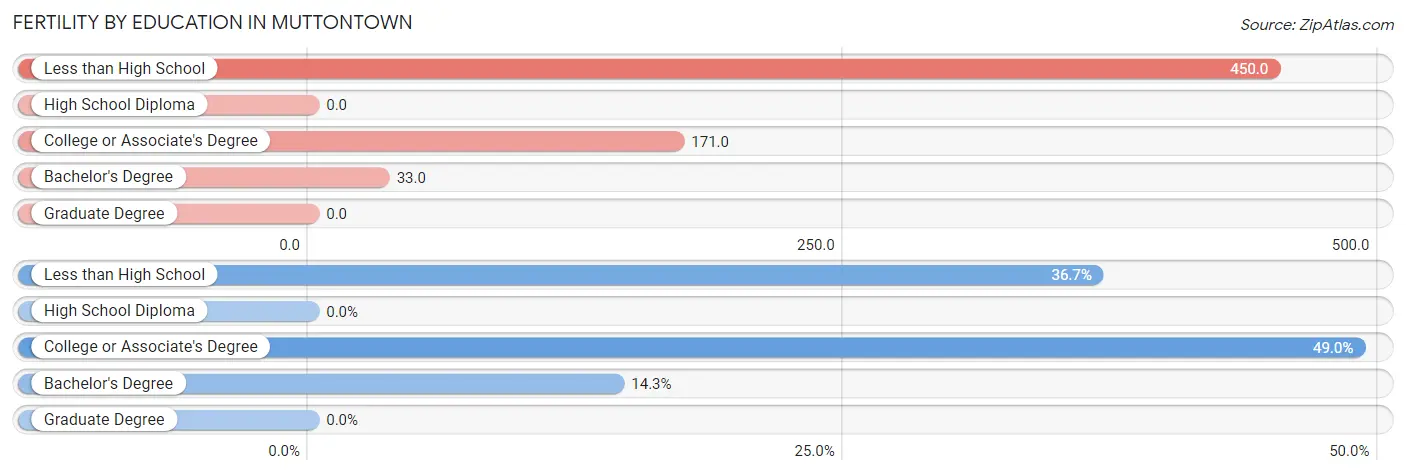
Fertility by Education in Muttontown
| Educational Attainment | Women with Births | Births / 1,000 Women |
| Less than High School | 18 (36.7%) | 450.0 |
| High School Diploma | 0 (0.0%) | 0.0 |
| College or Associate's Degree | 24 (49.0%) | 171.0 |
| Bachelor's Degree | 7 (14.3%) | 33.0 |
| Graduate Degree | 0 (0.0%) | 0.0 |
| Total | 49 (100.0%) | 89.0 |
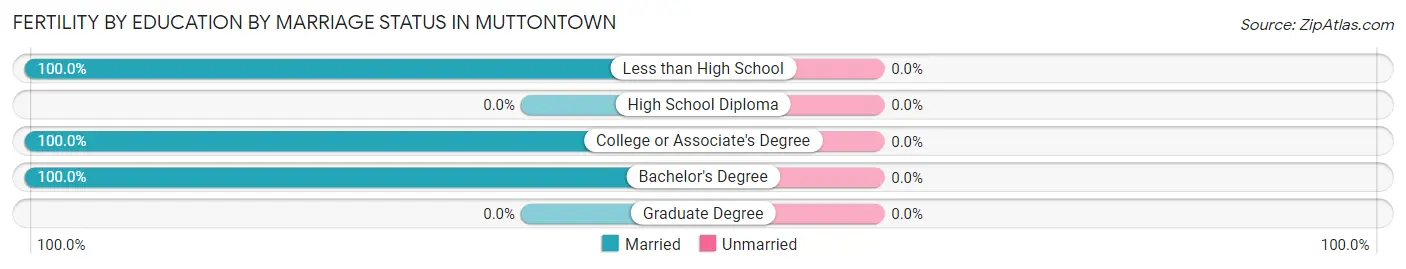
Fertility by Education by Marriage Status in Muttontown
| Educational Attainment | Married | Unmarried |
| Less than High School | 18 (100.0%) | 0 (0.0%) |
| High School Diploma | 0 (0.0%) | 0 (0.0%) |
| College or Associate's Degree | 24 (100.0%) | 0 (0.0%) |
| Bachelor's Degree | 7 (100.0%) | 0 (0.0%) |
| Graduate Degree | 0 (0.0%) | 0 (0.0%) |
| Total | 49 (100.0%) | 0 (0.0%) |
Employment Characteristics in Muttontown
Employment by Class of Employer in Muttontown
Among the 1,564 employed individuals in Muttontown, private company employees (951 | 60.8%), self-employed (incorporated) (252 | 16.1%), and not-for-profit organizations (183 | 11.7%) make up the most common classes of employment.
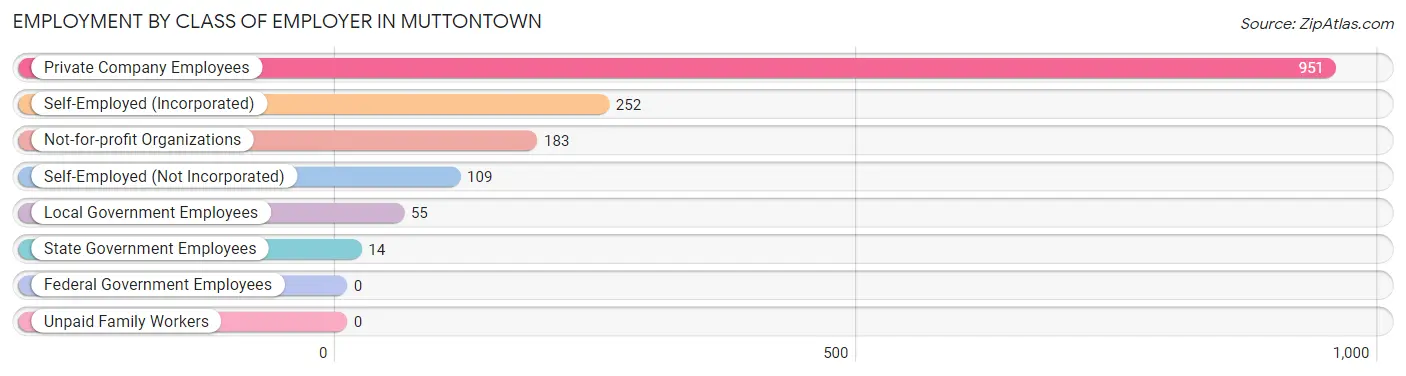
| Employer Class | # Employees | % Employees |
| Private Company Employees | 951 | 60.8% |
| Self-Employed (Incorporated) | 252 | 16.1% |
| Self-Employed (Not Incorporated) | 109 | 7.0% |
| Not-for-profit Organizations | 183 | 11.7% |
| Local Government Employees | 55 | 3.5% |
| State Government Employees | 14 | 0.9% |
| Federal Government Employees | 0 | 0.0% |
| Unpaid Family Workers | 0 | 0.0% |
| Total | 1,564 | 100.0% |
Employment Status by Age in Muttontown
According to the labor force statistics for Muttontown, out of the total population over 16 years of age (2,728), 62.9% or 1,716 individuals are in the labor force, with 7.2% or 124 of them unemployed. The age group with the highest labor force participation rate is 25 to 29 years, with 100.0% or 195 individuals in the labor force. Within the labor force, the 30 to 34 years age range has the highest percentage of unemployed individuals, with 30.0% or 6 of them being unemployed.
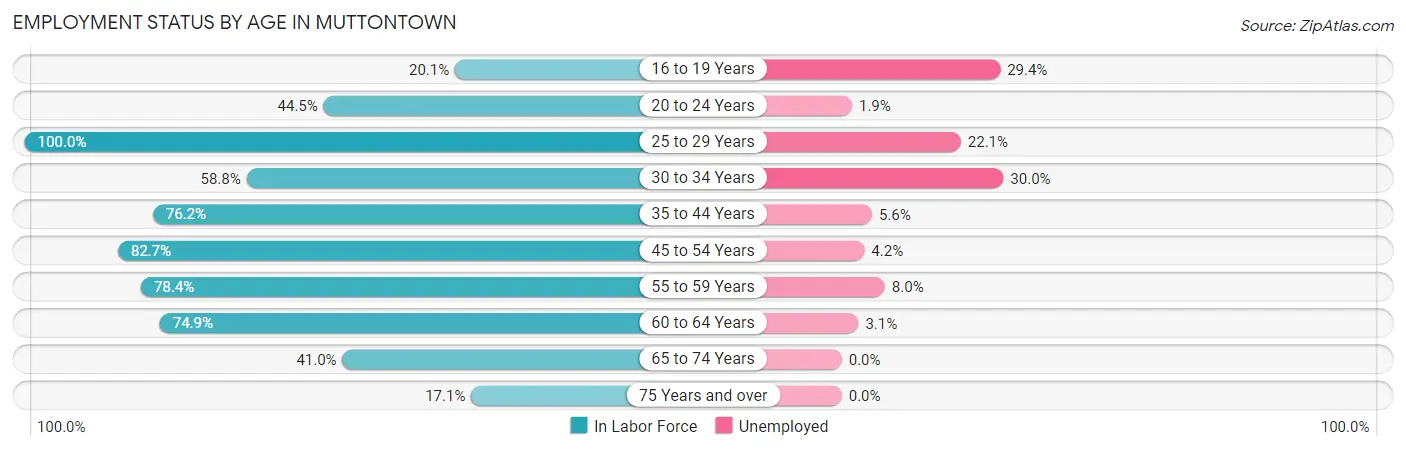
| Age Bracket | In Labor Force | Unemployed |
| 16 to 19 Years | 34 (20.1%) | 10 (29.4%) |
| 20 to 24 Years | 53 (44.5%) | 1 (1.9%) |
| 25 to 29 Years | 195 (100.0%) | 43 (22.1%) |
| 30 to 34 Years | 20 (58.8%) | 6 (30.0%) |
| 35 to 44 Years | 250 (76.2%) | 14 (5.6%) |
| 45 to 54 Years | 382 (82.7%) | 16 (4.2%) |
| 55 to 59 Years | 313 (78.4%) | 25 (8.0%) |
| 60 to 64 Years | 260 (74.9%) | 8 (3.1%) |
| 65 to 74 Years | 159 (41.0%) | 0 (0.0%) |
| 75 Years and over | 49 (17.1%) | 0 (0.0%) |
| Total | 1,716 (62.9%) | 124 (7.2%) |
Employment Status by Educational Attainment in Muttontown
According to labor force statistics for Muttontown, 80.5% of individuals (1,421) out of the total population between 25 and 64 years of age (1,765) are in the labor force, with 7.9% or 112 of them being unemployed. The group with the highest labor force participation rate are those with the educational attainment of less than high school, with 100.0% or 50 individuals in the labor force. Within the labor force, individuals with less than high school education have the highest percentage of unemployment, with 36.0% or 18 of them being unemployed.
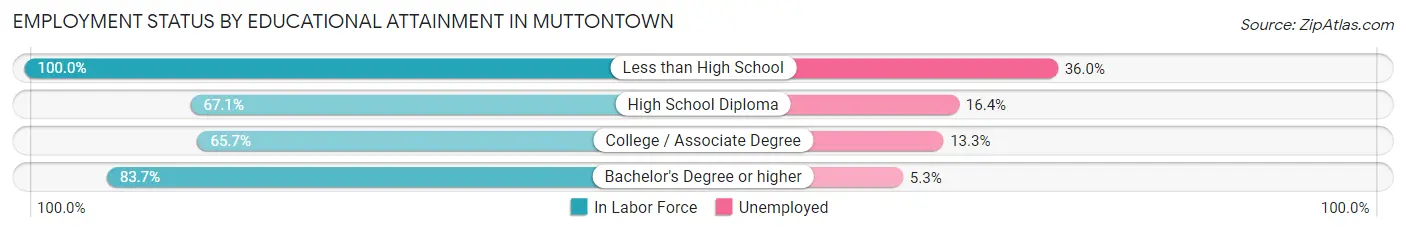
| Educational Attainment | In Labor Force | Unemployed |
| Less than High School | 50 (100.0%) | 18 (36.0%) |
| High School Diploma | 55 (67.1%) | 13 (16.4%) |
| College / Associate Degree | 188 (65.7%) | 38 (13.3%) |
| Bachelor's Degree or higher | 1,127 (83.7%) | 71 (5.3%) |
| Total | 1,421 (80.5%) | 139 (7.9%) |
Employment Occupations by Sex in Muttontown
Management, Business, Science and Arts Occupations
The most common Management, Business, Science and Arts occupations in Muttontown are Health Diagnosing & Treating (370 | 23.2%), Health Technologists (342 | 21.5%), Management (298 | 18.7%), Business & Financial (206 | 12.9%), and Community & Social Service (189 | 11.9%).
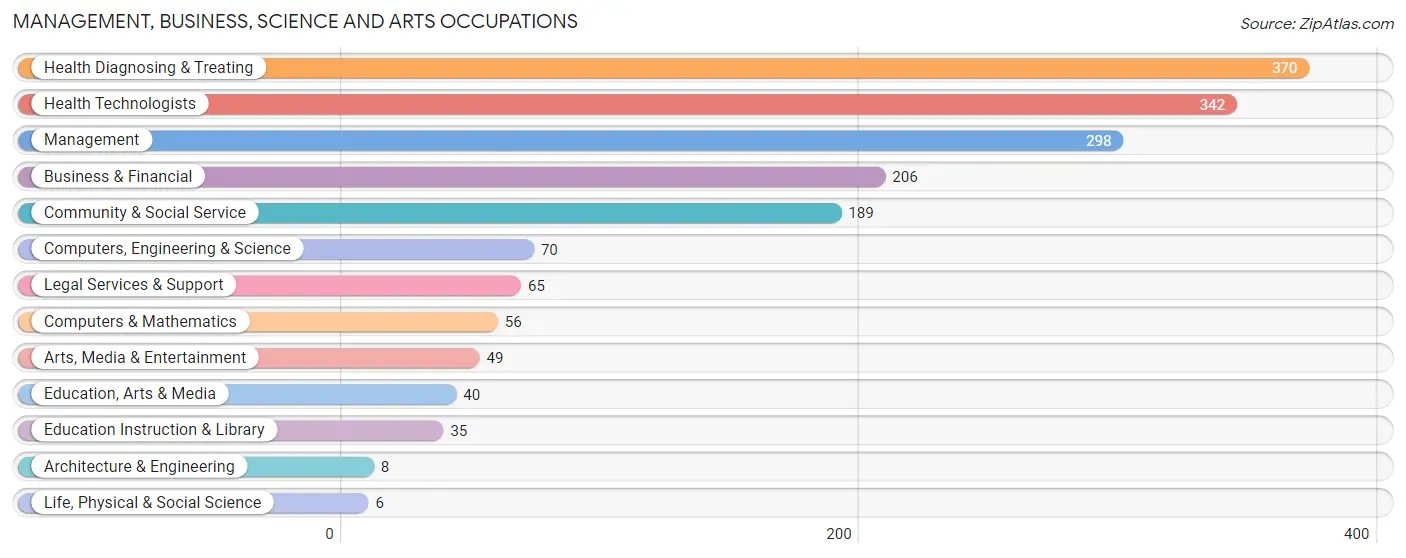
Management, Business, Science and Arts Occupations by Sex
Within the Management, Business, Science and Arts occupations in Muttontown, the most male-oriented occupations are Architecture & Engineering (100.0%), Life, Physical & Social Science (100.0%), and Education, Arts & Media (100.0%), while the most female-oriented occupations are Arts, Media & Entertainment (100.0%), Education Instruction & Library (65.7%), and Community & Social Service (48.1%).
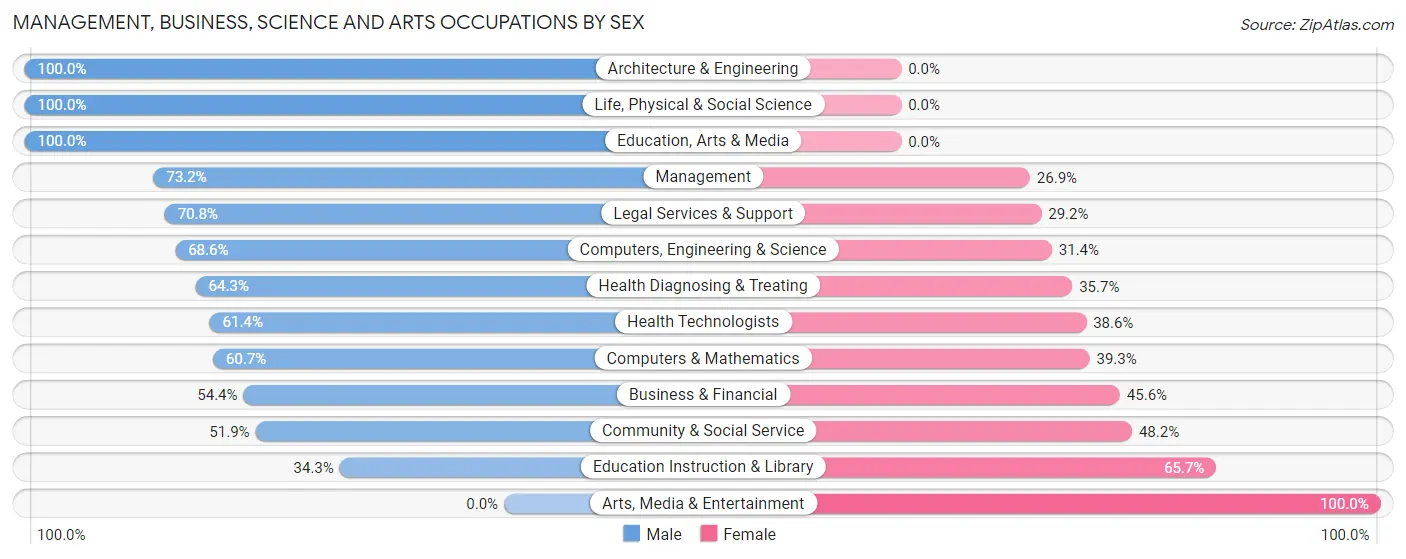
| Occupation | Male | Female |
| Management | 218 (73.2%) | 80 (26.9%) |
| Business & Financial | 112 (54.4%) | 94 (45.6%) |
| Computers, Engineering & Science | 48 (68.6%) | 22 (31.4%) |
| Computers & Mathematics | 34 (60.7%) | 22 (39.3%) |
| Architecture & Engineering | 8 (100.0%) | 0 (0.0%) |
| Life, Physical & Social Science | 6 (100.0%) | 0 (0.0%) |
| Community & Social Service | 98 (51.8%) | 91 (48.1%) |
| Education, Arts & Media | 40 (100.0%) | 0 (0.0%) |
| Legal Services & Support | 46 (70.8%) | 19 (29.2%) |
| Education Instruction & Library | 12 (34.3%) | 23 (65.7%) |
| Arts, Media & Entertainment | 0 (0.0%) | 49 (100.0%) |
| Health Diagnosing & Treating | 238 (64.3%) | 132 (35.7%) |
| Health Technologists | 210 (61.4%) | 132 (38.6%) |
| Total (Category) | 714 (63.0%) | 419 (37.0%) |
| Total (Overall) | 961 (60.4%) | 631 (39.6%) |
Services Occupations
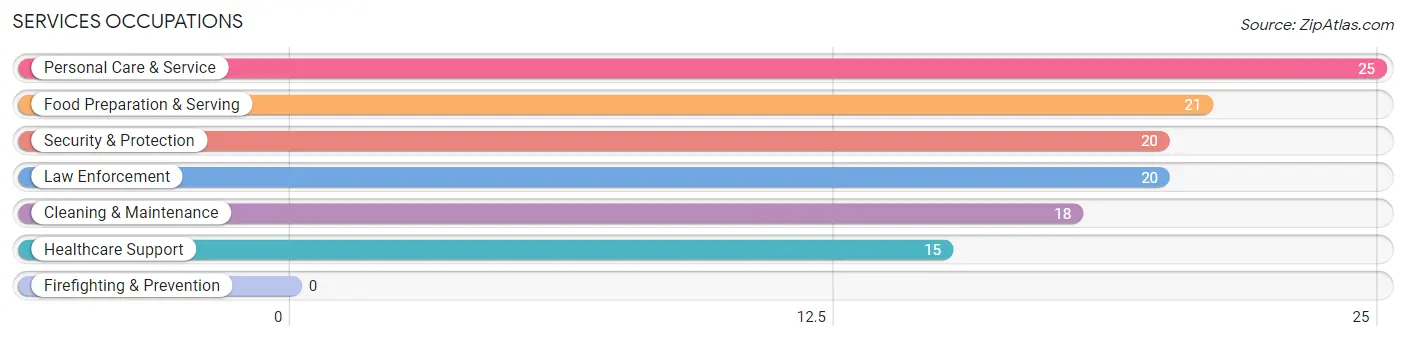
The most common Services occupations in Muttontown are Personal Care & Service (25 | 1.6%), Food Preparation & Serving (21 | 1.3%), Security & Protection (20 | 1.3%), Law Enforcement (20 | 1.3%), and Cleaning & Maintenance (18 | 1.1%).
Services Occupations by Sex
Within the Services occupations in Muttontown, the most male-oriented occupations are Security & Protection (100.0%), Law Enforcement (100.0%), and Personal Care & Service (56.0%), while the most female-oriented occupations are Healthcare Support (100.0%), Food Preparation & Serving (52.4%), and Cleaning & Maintenance (44.4%).
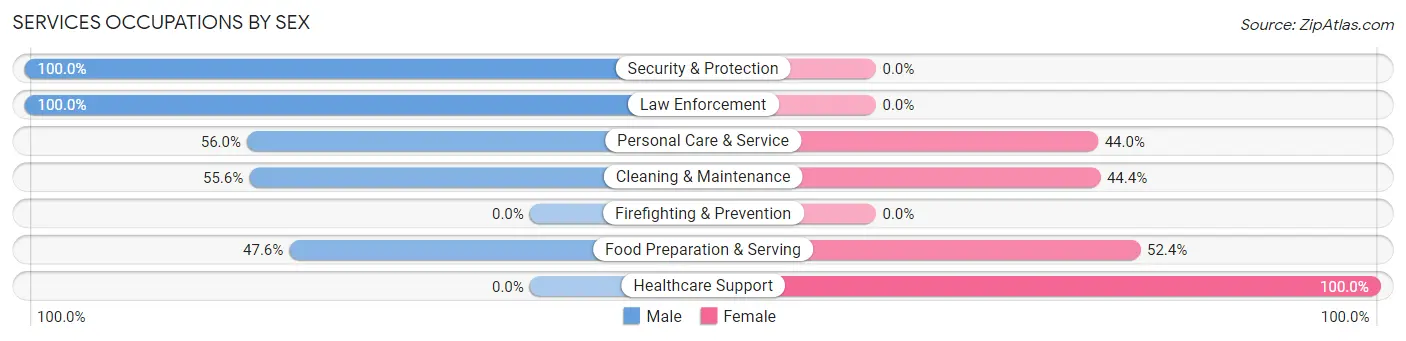
| Occupation | Male | Female |
| Healthcare Support | 0 (0.0%) | 15 (100.0%) |
| Security & Protection | 20 (100.0%) | 0 (0.0%) |
| Firefighting & Prevention | 0 (0.0%) | 0 (0.0%) |
| Law Enforcement | 20 (100.0%) | 0 (0.0%) |
| Food Preparation & Serving | 10 (47.6%) | 11 (52.4%) |
| Cleaning & Maintenance | 10 (55.6%) | 8 (44.4%) |
| Personal Care & Service | 14 (56.0%) | 11 (44.0%) |
| Total (Category) | 54 (54.5%) | 45 (45.5%) |
| Total (Overall) | 961 (60.4%) | 631 (39.6%) |
Sales and Office Occupations
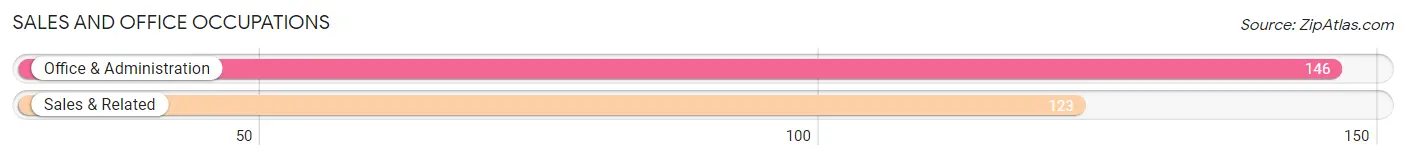
The most common Sales and Office occupations in Muttontown are Office & Administration (146 | 9.2%), and Sales & Related (123 | 7.7%).
Sales and Office Occupations by Sex
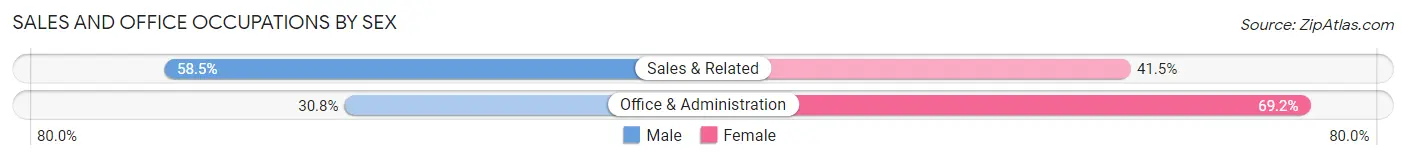
| Occupation | Male | Female |
| Sales & Related | 72 (58.5%) | 51 (41.5%) |
| Office & Administration | 45 (30.8%) | 101 (69.2%) |
| Total (Category) | 117 (43.5%) | 152 (56.5%) |
| Total (Overall) | 961 (60.4%) | 631 (39.6%) |
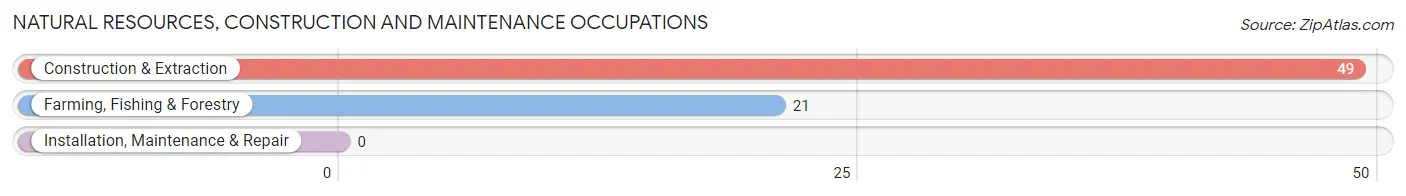
Natural Resources, Construction and Maintenance Occupations
The most common Natural Resources, Construction and Maintenance occupations in Muttontown are Construction & Extraction (49 | 3.1%), and Farming, Fishing & Forestry (21 | 1.3%).
Natural Resources, Construction and Maintenance Occupations by Sex
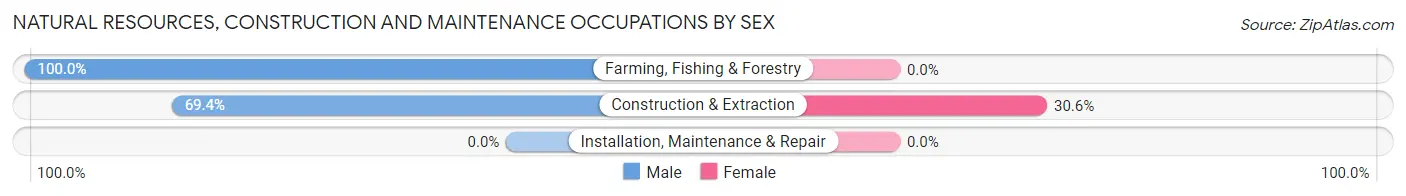
| Occupation | Male | Female |
| Farming, Fishing & Forestry | 21 (100.0%) | 0 (0.0%) |
| Construction & Extraction | 34 (69.4%) | 15 (30.6%) |
| Installation, Maintenance & Repair | 0 (0.0%) | 0 (0.0%) |
| Total (Category) | 55 (78.6%) | 15 (21.4%) |
| Total (Overall) | 961 (60.4%) | 631 (39.6%) |
Production, Transportation and Moving Occupations
The most common Production, Transportation and Moving occupations in Muttontown are , and Production (21 | 1.3%).
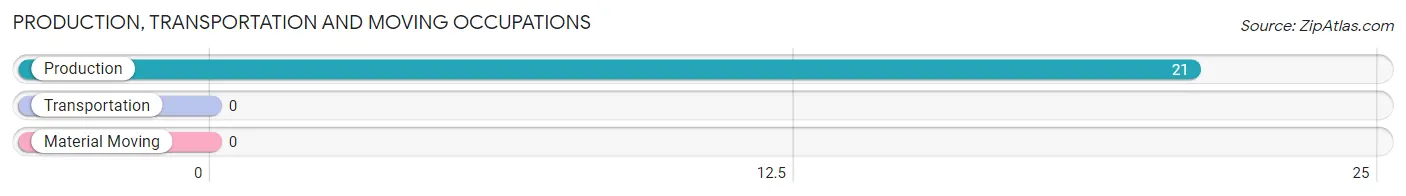
Production, Transportation and Moving Occupations by Sex
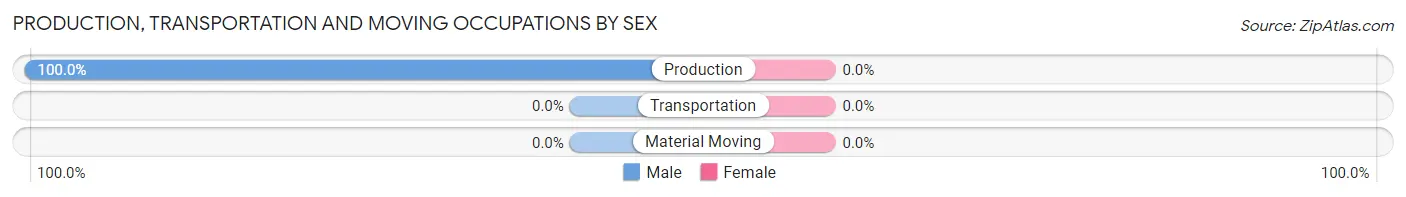
| Occupation | Male | Female |
| Production | 21 (100.0%) | 0 (0.0%) |
| Transportation | 0 (0.0%) | 0 (0.0%) |
| Material Moving | 0 (0.0%) | 0 (0.0%) |
| Total (Category) | 21 (100.0%) | 0 (0.0%) |
| Total (Overall) | 961 (60.4%) | 631 (39.6%) |
Employment Industries by Sex in Muttontown
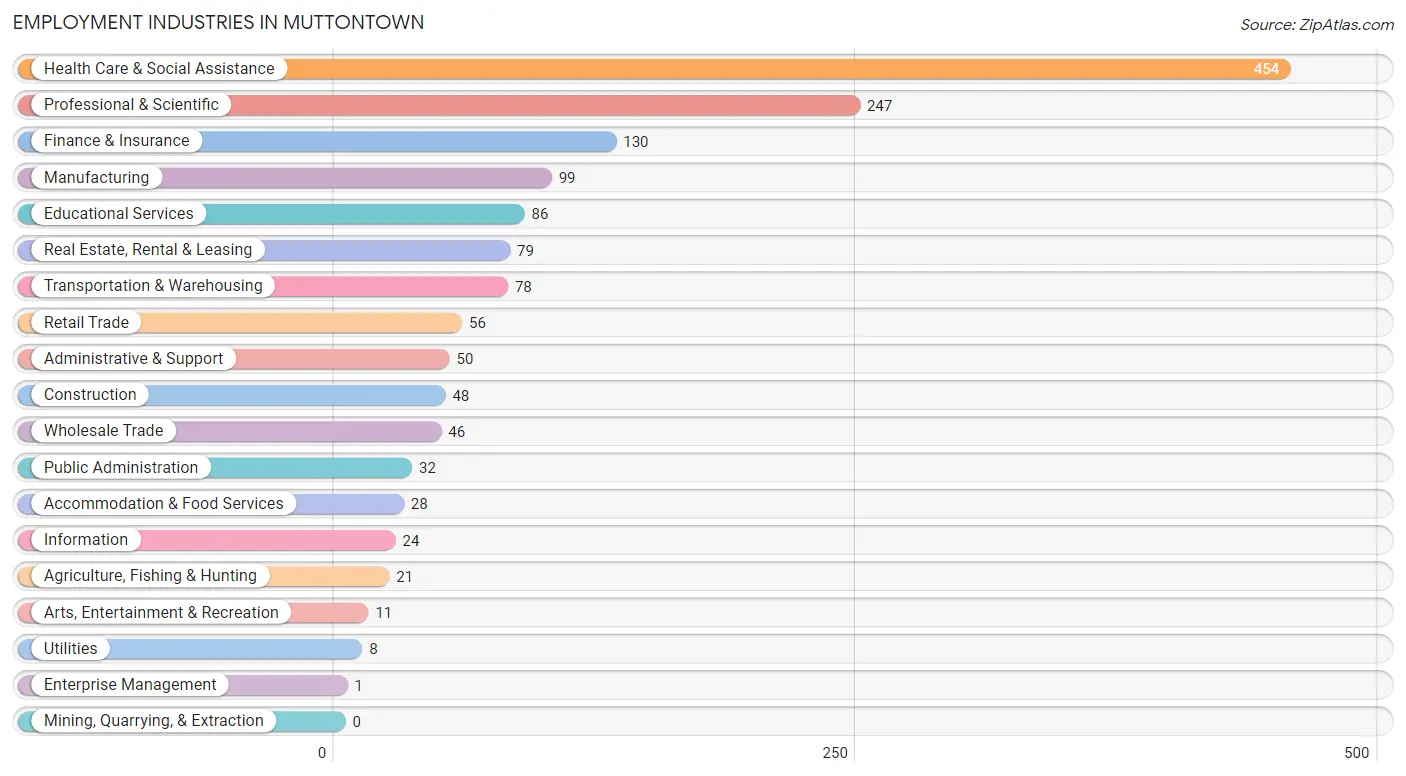
Employment Industries in Muttontown
The major employment industries in Muttontown include Health Care & Social Assistance (454 | 28.5%), Professional & Scientific (247 | 15.5%), Finance & Insurance (130 | 8.2%), Manufacturing (99 | 6.2%), and Educational Services (86 | 5.4%).
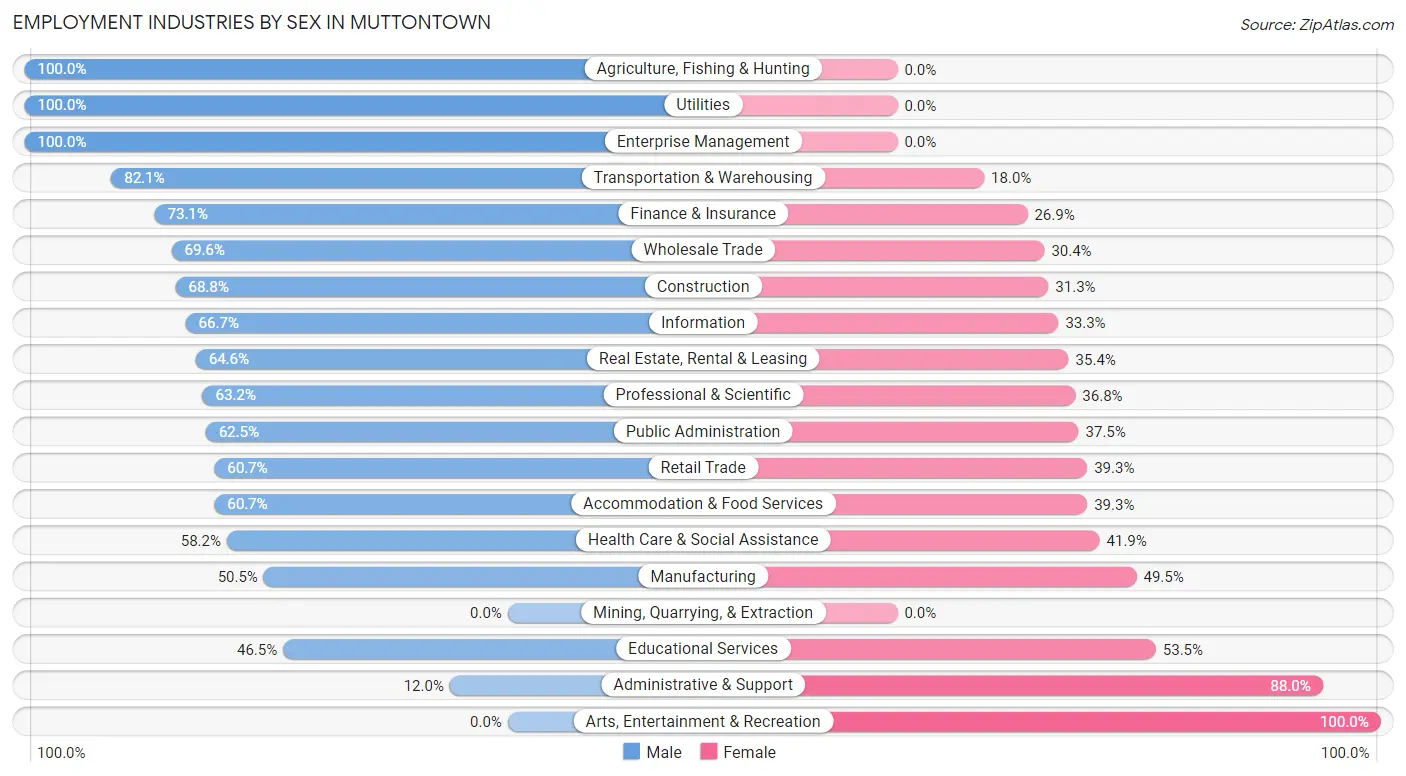
Employment Industries by Sex in Muttontown
The Muttontown industries that see more men than women are Agriculture, Fishing & Hunting (100.0%), Utilities (100.0%), and Enterprise Management (100.0%), whereas the industries that tend to have a higher number of women are Arts, Entertainment & Recreation (100.0%), Administrative & Support (88.0%), and Educational Services (53.5%).
| Industry | Male | Female |
| Agriculture, Fishing & Hunting | 21 (100.0%) | 0 (0.0%) |
| Mining, Quarrying, & Extraction | 0 (0.0%) | 0 (0.0%) |
| Construction | 33 (68.8%) | 15 (31.2%) |
| Manufacturing | 50 (50.5%) | 49 (49.5%) |
| Wholesale Trade | 32 (69.6%) | 14 (30.4%) |
| Retail Trade | 34 (60.7%) | 22 (39.3%) |
| Transportation & Warehousing | 64 (82.1%) | 14 (17.9%) |
| Utilities | 8 (100.0%) | 0 (0.0%) |
| Information | 16 (66.7%) | 8 (33.3%) |
| Finance & Insurance | 95 (73.1%) | 35 (26.9%) |
| Real Estate, Rental & Leasing | 51 (64.6%) | 28 (35.4%) |
| Professional & Scientific | 156 (63.2%) | 91 (36.8%) |
| Enterprise Management | 1 (100.0%) | 0 (0.0%) |
| Administrative & Support | 6 (12.0%) | 44 (88.0%) |
| Educational Services | 40 (46.5%) | 46 (53.5%) |
| Health Care & Social Assistance | 264 (58.2%) | 190 (41.8%) |
| Arts, Entertainment & Recreation | 0 (0.0%) | 11 (100.0%) |
| Accommodation & Food Services | 17 (60.7%) | 11 (39.3%) |
| Public Administration | 20 (62.5%) | 12 (37.5%) |
| Total | 961 (60.4%) | 631 (39.6%) |
Education in Muttontown
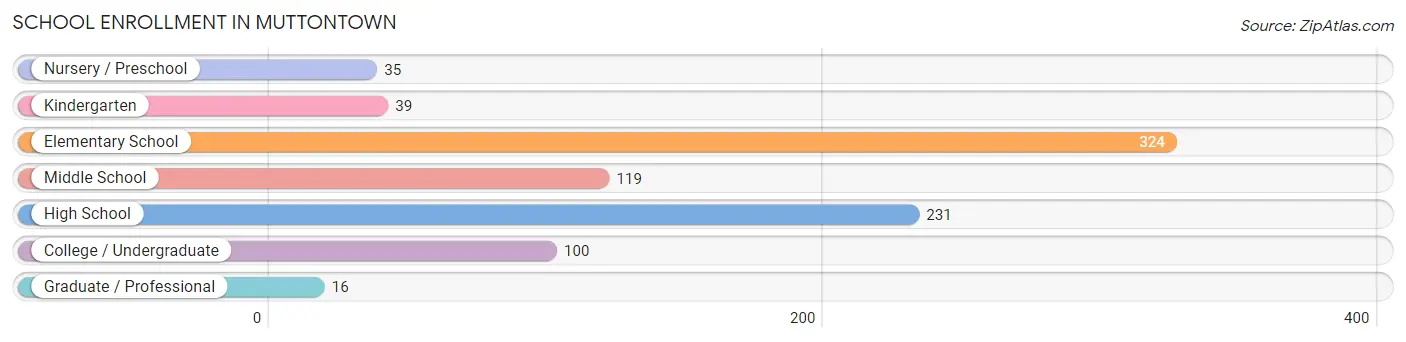
School Enrollment in Muttontown
The most common levels of schooling among the 864 students in Muttontown are elementary school (324 | 37.5%), high school (231 | 26.7%), and middle school (119 | 13.8%).
| School Level | # Students | % Students |
| Nursery / Preschool | 35 | 4.1% |
| Kindergarten | 39 | 4.5% |
| Elementary School | 324 | 37.5% |
| Middle School | 119 | 13.8% |
| High School | 231 | 26.7% |
| College / Undergraduate | 100 | 11.6% |
| Graduate / Professional | 16 | 1.8% |
| Total | 864 | 100.0% |
School Enrollment by Age by Funding Source in Muttontown
Out of a total of 864 students who are enrolled in schools in Muttontown, 208 (24.1%) attend a private institution, while the remaining 656 (75.9%) are enrolled in public schools. The age group of 35 years and over has the highest likelihood of being enrolled in private schools, with 6 (100.0% in the age bracket) enrolled. Conversely, the age group of 18 to 19 year olds has the lowest likelihood of being enrolled in a private school, with 46 (86.8% in the age bracket) attending a public institution.
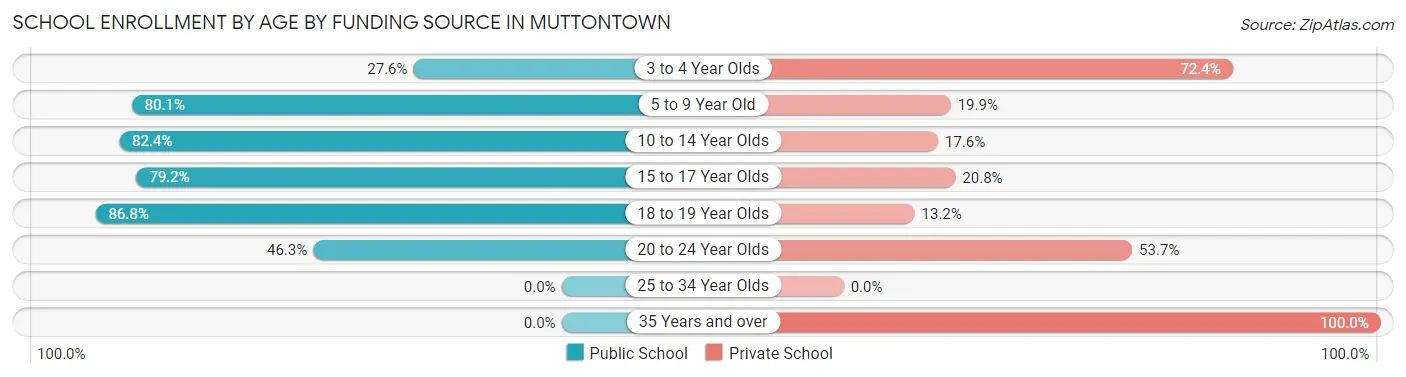
| Age Bracket | Public School | Private School |
| 3 to 4 Year Olds | 8 (27.6%) | 21 (72.4%) |
| 5 to 9 Year Old | 289 (80.1%) | 72 (19.9%) |
| 10 to 14 Year Olds | 164 (82.4%) | 35 (17.6%) |
| 15 to 17 Year Olds | 118 (79.2%) | 31 (20.8%) |
| 18 to 19 Year Olds | 46 (86.8%) | 7 (13.2%) |
| 20 to 24 Year Olds | 31 (46.3%) | 36 (53.7%) |
| 25 to 34 Year Olds | 0 (0.0%) | 0 (0.0%) |
| 35 Years and over | 0 (0.0%) | 6 (100.0%) |
| Total | 656 (75.9%) | 208 (24.1%) |
Educational Attainment by Field of Study in Muttontown
Business (522 | 26.3%), social sciences (186 | 9.4%), bio, nature & agricultural (171 | 8.6%), physical & health sciences (143 | 7.2%), and science & technology (135 | 6.8%) are the most common fields of study among 1,982 individuals in Muttontown who have obtained a bachelor's degree or higher.
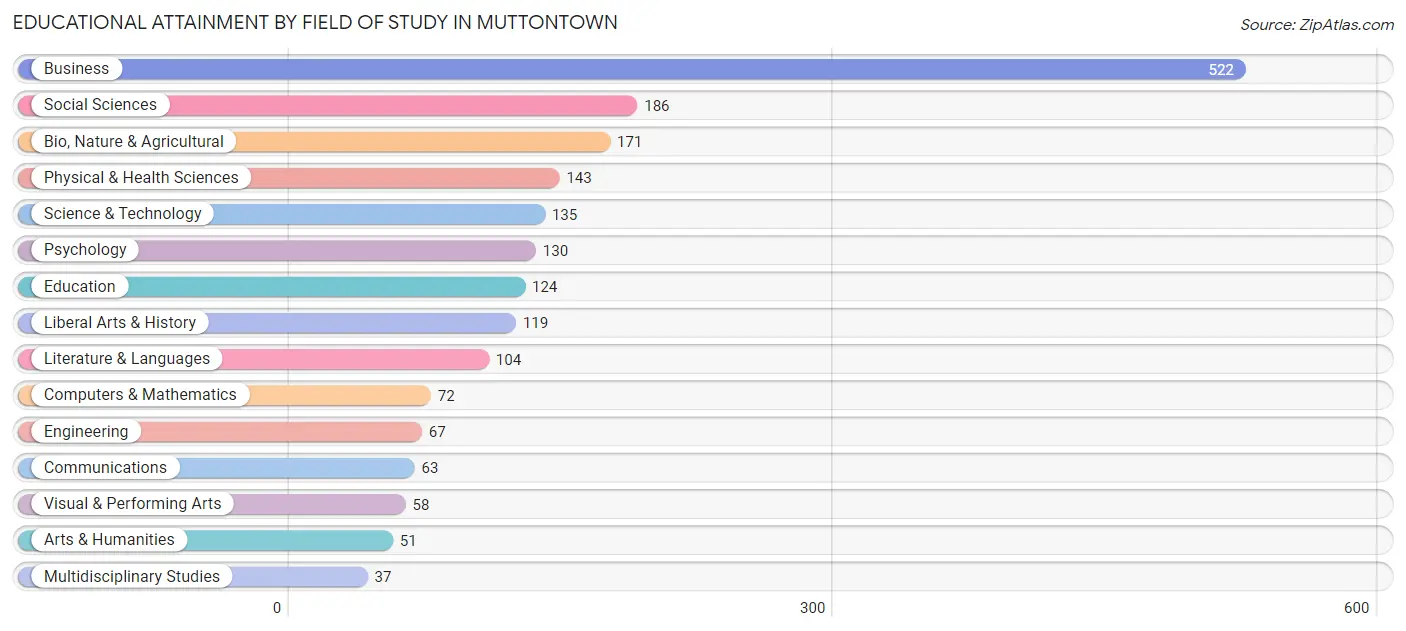
| Field of Study | # Graduates | % Graduates |
| Computers & Mathematics | 72 | 3.6% |
| Bio, Nature & Agricultural | 171 | 8.6% |
| Physical & Health Sciences | 143 | 7.2% |
| Psychology | 130 | 6.6% |
| Social Sciences | 186 | 9.4% |
| Engineering | 67 | 3.4% |
| Multidisciplinary Studies | 37 | 1.9% |
| Science & Technology | 135 | 6.8% |
| Business | 522 | 26.3% |
| Education | 124 | 6.3% |
| Literature & Languages | 104 | 5.2% |
| Liberal Arts & History | 119 | 6.0% |
| Visual & Performing Arts | 58 | 2.9% |
| Communications | 63 | 3.2% |
| Arts & Humanities | 51 | 2.6% |
| Total | 1,982 | 100.0% |
Transportation & Commute in Muttontown
Vehicle Availability by Sex in Muttontown
The most prevalent vehicle ownership categories in Muttontown are males with 3 vehicles (415, accounting for 43.8%) and females with 3 vehicles (293, making up 67.3%).
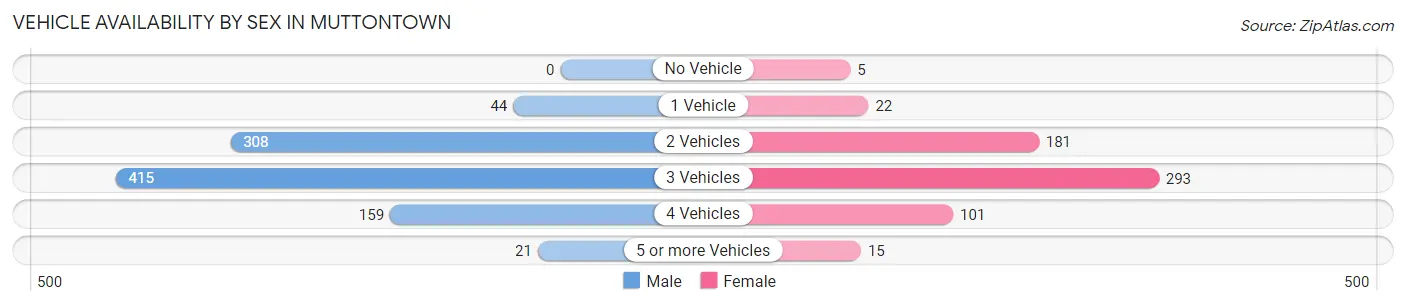
| Vehicles Available | Male | Female |
| No Vehicle | 0 (0.0%) | 5 (0.8%) |
| 1 Vehicle | 44 (4.6%) | 22 (3.6%) |
| 2 Vehicles | 308 (32.5%) | 181 (29.3%) |
| 3 Vehicles | 415 (43.8%) | 293 (47.5%) |
| 4 Vehicles | 159 (16.8%) | 101 (16.4%) |
| 5 or more Vehicles | 21 (2.2%) | 15 (2.4%) |
| Total | 947 (100.0%) | 617 (100.0%) |
Commute Time in Muttontown
The most frequently occuring commute durations in Muttontown are 20 to 24 minutes (261 commuters, 20.8%), 60 to 89 minutes (159 commuters, 12.7%), and 30 to 34 minutes (149 commuters, 11.9%).
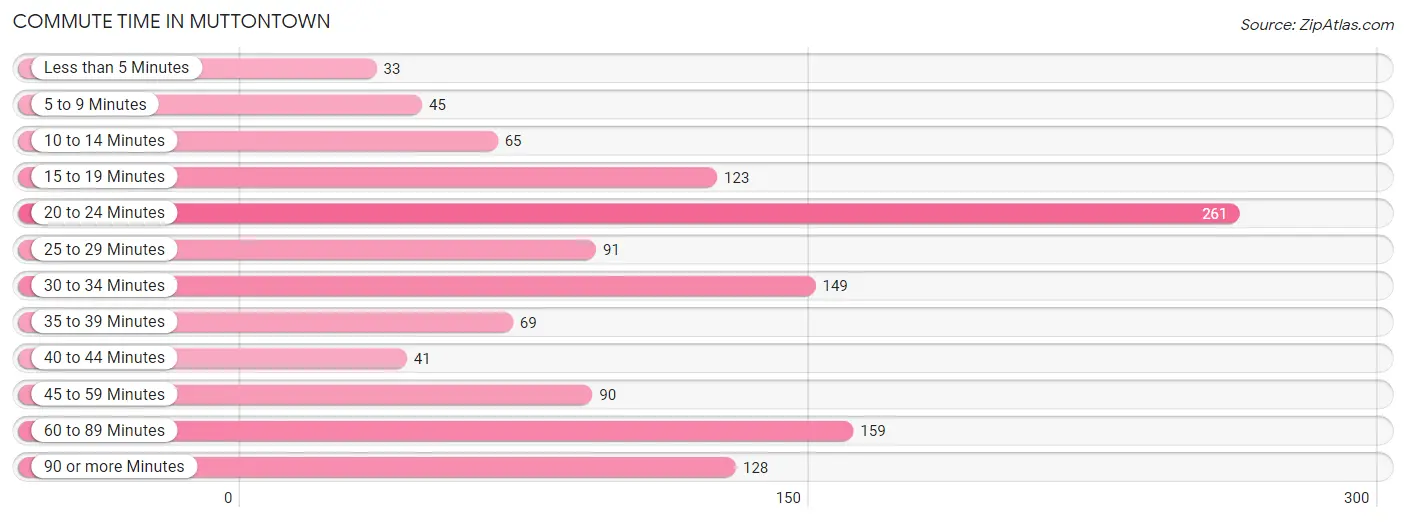
| Commute Time | # Commuters | % Commuters |
| Less than 5 Minutes | 33 | 2.6% |
| 5 to 9 Minutes | 45 | 3.6% |
| 10 to 14 Minutes | 65 | 5.2% |
| 15 to 19 Minutes | 123 | 9.8% |
| 20 to 24 Minutes | 261 | 20.8% |
| 25 to 29 Minutes | 91 | 7.3% |
| 30 to 34 Minutes | 149 | 11.9% |
| 35 to 39 Minutes | 69 | 5.5% |
| 40 to 44 Minutes | 41 | 3.3% |
| 45 to 59 Minutes | 90 | 7.2% |
| 60 to 89 Minutes | 159 | 12.7% |
| 90 or more Minutes | 128 | 10.2% |
Commute Time by Sex in Muttontown
The most common commute times in Muttontown are 20 to 24 minutes (145 commuters, 19.2%) for males and 20 to 24 minutes (116 commuters, 23.3%) for females.
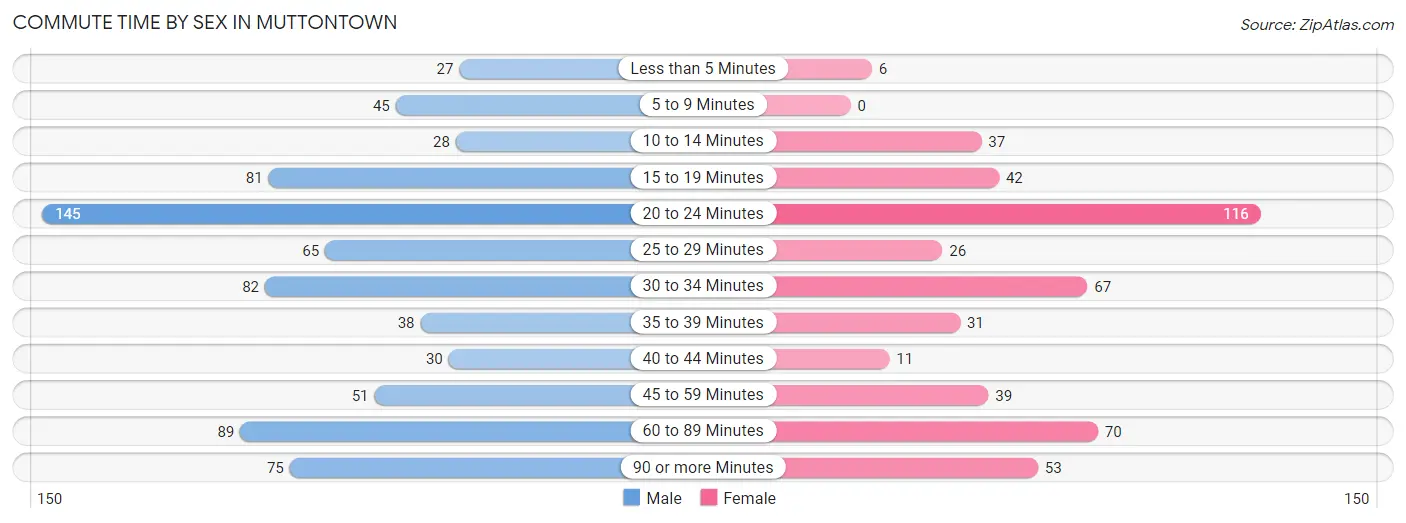
| Commute Time | Male | Female |
| Less than 5 Minutes | 27 (3.6%) | 6 (1.2%) |
| 5 to 9 Minutes | 45 (5.9%) | 0 (0.0%) |
| 10 to 14 Minutes | 28 (3.7%) | 37 (7.4%) |
| 15 to 19 Minutes | 81 (10.7%) | 42 (8.4%) |
| 20 to 24 Minutes | 145 (19.2%) | 116 (23.3%) |
| 25 to 29 Minutes | 65 (8.6%) | 26 (5.2%) |
| 30 to 34 Minutes | 82 (10.8%) | 67 (13.5%) |
| 35 to 39 Minutes | 38 (5.0%) | 31 (6.2%) |
| 40 to 44 Minutes | 30 (4.0%) | 11 (2.2%) |
| 45 to 59 Minutes | 51 (6.8%) | 39 (7.8%) |
| 60 to 89 Minutes | 89 (11.8%) | 70 (14.1%) |
| 90 or more Minutes | 75 (9.9%) | 53 (10.6%) |
Time of Departure to Work by Sex in Muttontown
The most frequent times of departure to work in Muttontown are 8:30 AM to 8:59 AM (144, 19.1%) for males and 8:30 AM to 8:59 AM (129, 25.9%) for females.
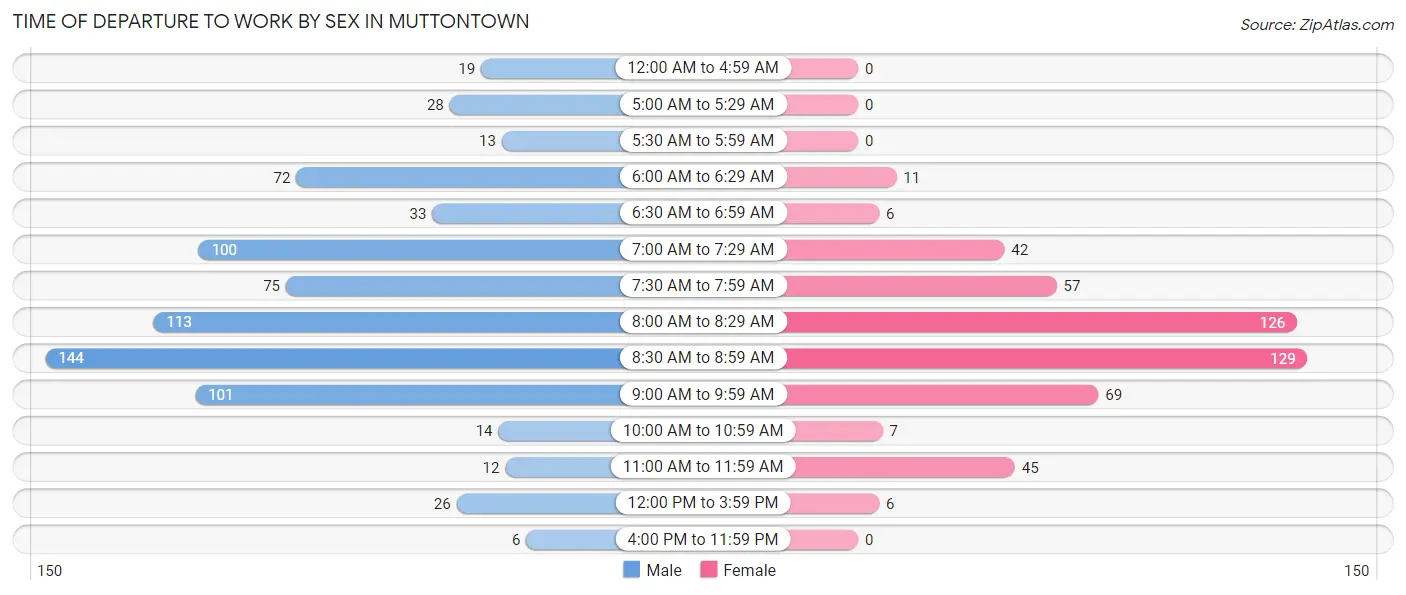
| Time of Departure | Male | Female |
| 12:00 AM to 4:59 AM | 19 (2.5%) | 0 (0.0%) |
| 5:00 AM to 5:29 AM | 28 (3.7%) | 0 (0.0%) |
| 5:30 AM to 5:59 AM | 13 (1.7%) | 0 (0.0%) |
| 6:00 AM to 6:29 AM | 72 (9.5%) | 11 (2.2%) |
| 6:30 AM to 6:59 AM | 33 (4.4%) | 6 (1.2%) |
| 7:00 AM to 7:29 AM | 100 (13.2%) | 42 (8.4%) |
| 7:30 AM to 7:59 AM | 75 (9.9%) | 57 (11.5%) |
| 8:00 AM to 8:29 AM | 113 (14.9%) | 126 (25.3%) |
| 8:30 AM to 8:59 AM | 144 (19.1%) | 129 (25.9%) |
| 9:00 AM to 9:59 AM | 101 (13.4%) | 69 (13.9%) |
| 10:00 AM to 10:59 AM | 14 (1.8%) | 7 (1.4%) |
| 11:00 AM to 11:59 AM | 12 (1.6%) | 45 (9.0%) |
| 12:00 PM to 3:59 PM | 26 (3.4%) | 6 (1.2%) |
| 4:00 PM to 11:59 PM | 6 (0.8%) | 0 (0.0%) |
| Total | 756 (100.0%) | 498 (100.0%) |
Housing Occupancy in Muttontown
Occupancy by Ownership in Muttontown
Of the total 1,133 dwellings in Muttontown, owner-occupied units account for 1,081 (95.4%), while renter-occupied units make up 52 (4.6%).
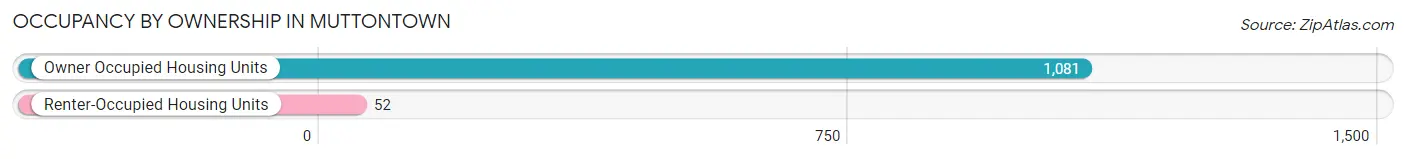
| Occupancy | # Housing Units | % Housing Units |
| Owner Occupied Housing Units | 1,081 | 95.4% |
| Renter-Occupied Housing Units | 52 | 4.6% |
| Total Occupied Housing Units | 1,133 | 100.0% |
Occupancy by Household Size in Muttontown
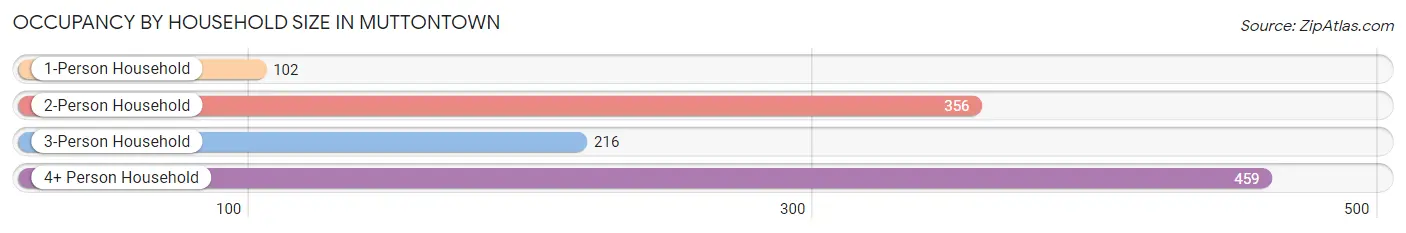
| Household Size | # Housing Units | % Housing Units |
| 1-Person Household | 102 | 9.0% |
| 2-Person Household | 356 | 31.4% |
| 3-Person Household | 216 | 19.1% |
| 4+ Person Household | 459 | 40.5% |
| Total Housing Units | 1,133 | 100.0% |
Occupancy by Ownership by Household Size in Muttontown
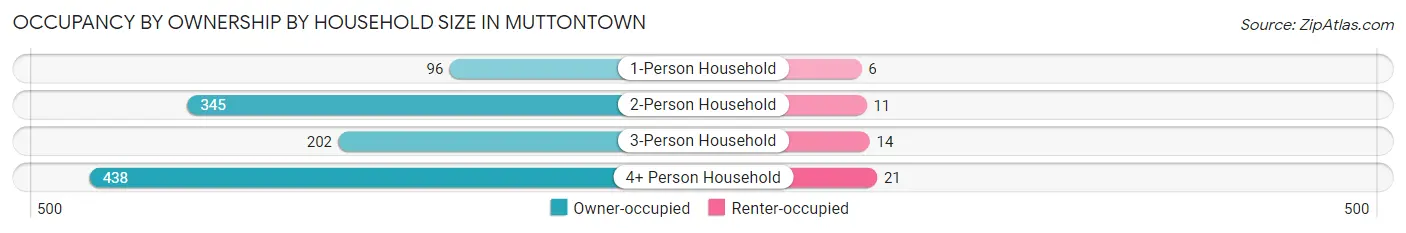
| Household Size | Owner-occupied | Renter-occupied |
| 1-Person Household | 96 (94.1%) | 6 (5.9%) |
| 2-Person Household | 345 (96.9%) | 11 (3.1%) |
| 3-Person Household | 202 (93.5%) | 14 (6.5%) |
| 4+ Person Household | 438 (95.4%) | 21 (4.6%) |
| Total Housing Units | 1,081 (95.4%) | 52 (4.6%) |
Occupancy by Educational Attainment in Muttontown
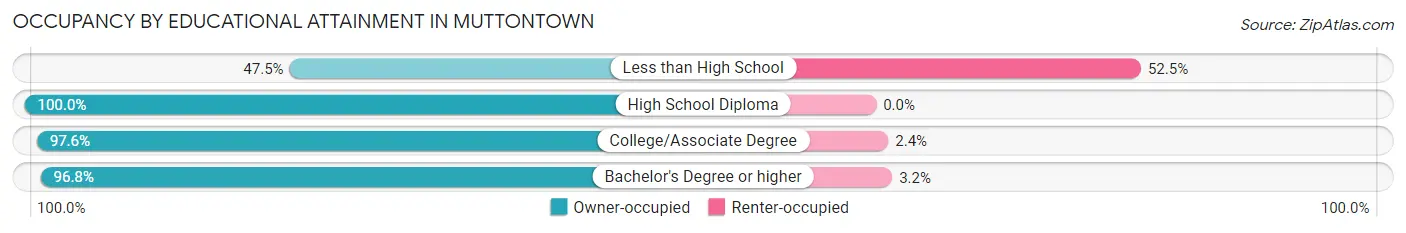
| Household Size | Owner-occupied | Renter-occupied |
| Less than High School | 19 (47.5%) | 21 (52.5%) |
| High School Diploma | 69 (100.0%) | 0 (0.0%) |
| College/Associate Degree | 202 (97.6%) | 5 (2.4%) |
| Bachelor's Degree or higher | 791 (96.8%) | 26 (3.2%) |
Occupancy by Age of Householder in Muttontown
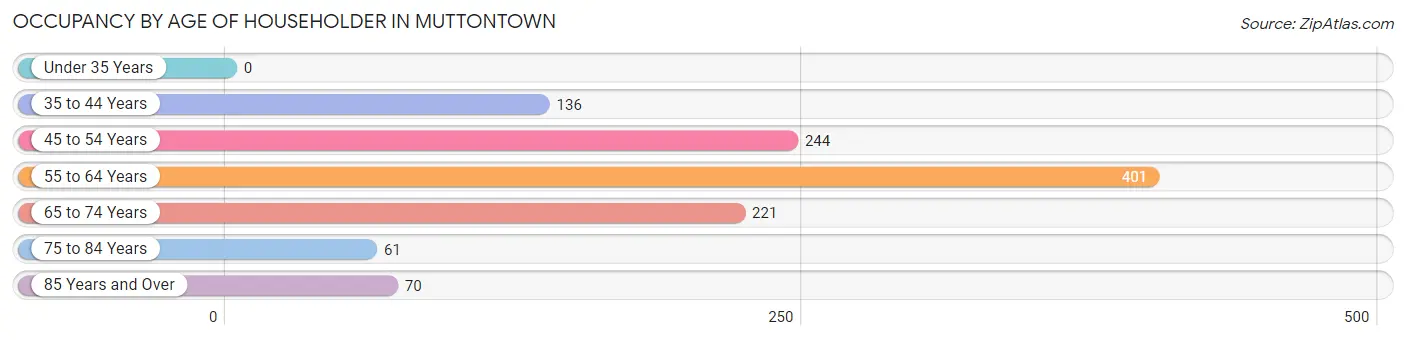
| Age Bracket | # Households | % Households |
| Under 35 Years | 0 | 0.0% |
| 35 to 44 Years | 136 | 12.0% |
| 45 to 54 Years | 244 | 21.5% |
| 55 to 64 Years | 401 | 35.4% |
| 65 to 74 Years | 221 | 19.5% |
| 75 to 84 Years | 61 | 5.4% |
| 85 Years and Over | 70 | 6.2% |
| Total | 1,133 | 100.0% |
Housing Finances in Muttontown
Median Income by Occupancy in Muttontown
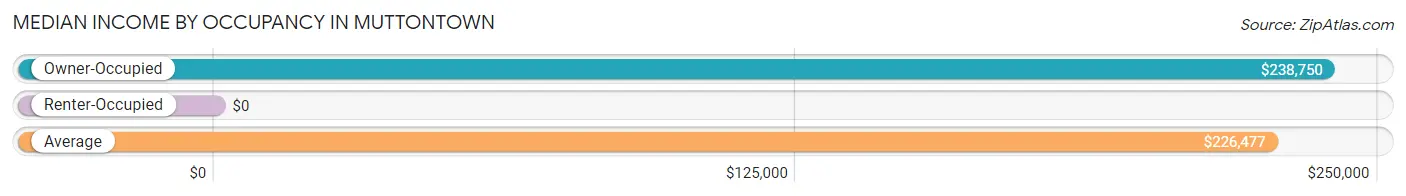
| Occupancy Type | # Households | Median Income |
| Owner-Occupied | 1,081 (95.4%) | $238,750 |
| Renter-Occupied | 52 (4.6%) | $0 |
| Average | 1,133 (100.0%) | $226,477 |
Occupancy by Householder Income Bracket in Muttontown
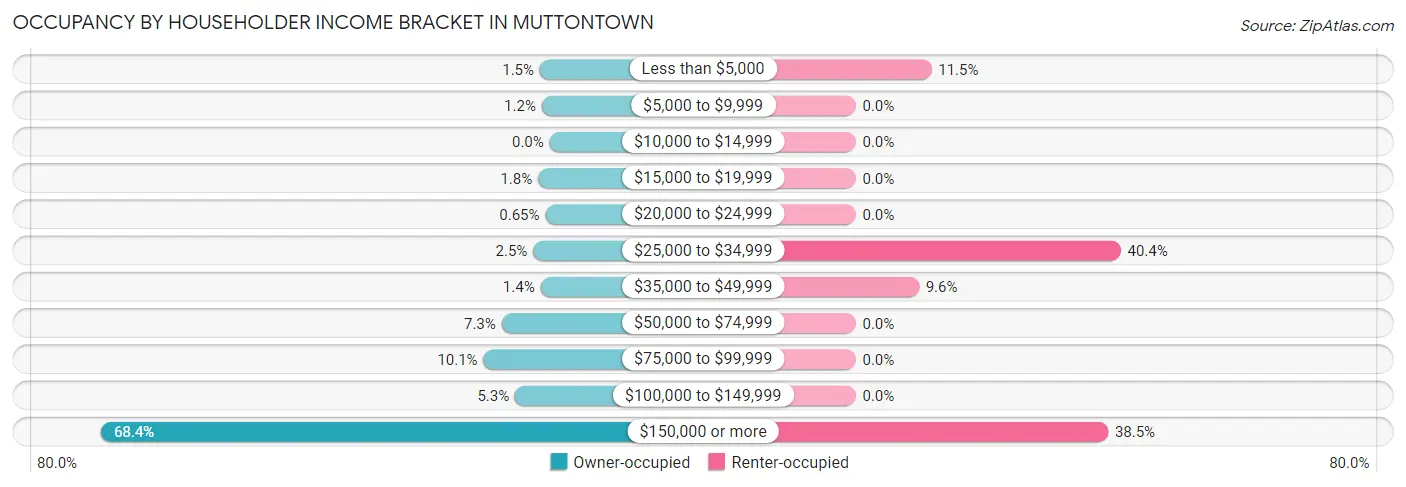
| Income Bracket | Owner-occupied | Renter-occupied |
| Less than $5,000 | 16 (1.5%) | 6 (11.5%) |
| $5,000 to $9,999 | 13 (1.2%) | 0 (0.0%) |
| $10,000 to $14,999 | 0 (0.0%) | 0 (0.0%) |
| $15,000 to $19,999 | 19 (1.8%) | 0 (0.0%) |
| $20,000 to $24,999 | 7 (0.6%) | 0 (0.0%) |
| $25,000 to $34,999 | 27 (2.5%) | 21 (40.4%) |
| $35,000 to $49,999 | 15 (1.4%) | 5 (9.6%) |
| $50,000 to $74,999 | 79 (7.3%) | 0 (0.0%) |
| $75,000 to $99,999 | 109 (10.1%) | 0 (0.0%) |
| $100,000 to $149,999 | 57 (5.3%) | 0 (0.0%) |
| $150,000 or more | 739 (68.4%) | 20 (38.5%) |
| Total | 1,081 (100.0%) | 52 (100.0%) |
Monthly Housing Cost Tiers in Muttontown
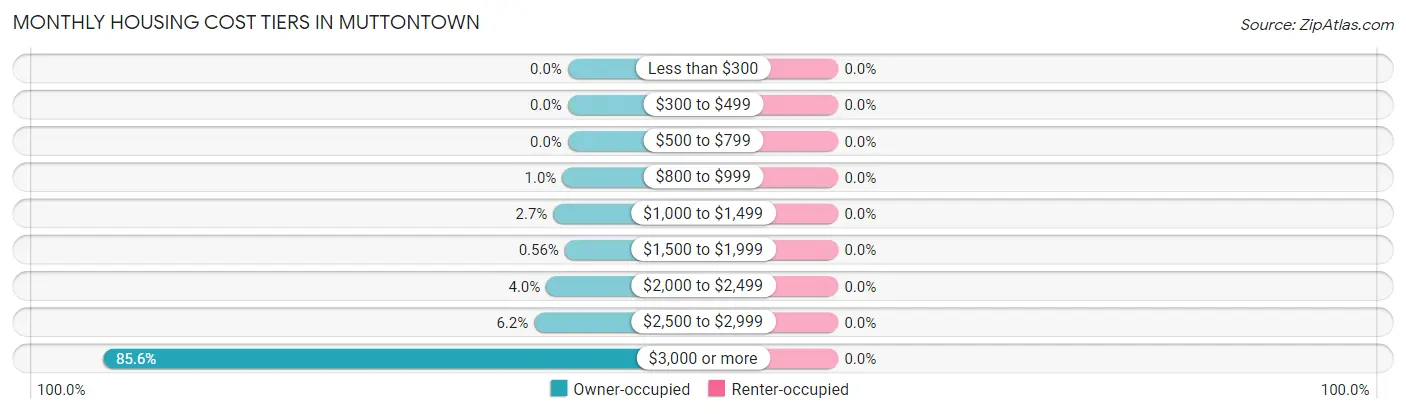
| Monthly Cost | Owner-occupied | Renter-occupied |
| Less than $300 | 0 (0.0%) | 0 (0.0%) |
| $300 to $499 | 0 (0.0%) | 0 (0.0%) |
| $500 to $799 | 0 (0.0%) | 0 (0.0%) |
| $800 to $999 | 11 (1.0%) | 0 (0.0%) |
| $1,000 to $1,499 | 29 (2.7%) | 0 (0.0%) |
| $1,500 to $1,999 | 6 (0.6%) | 0 (0.0%) |
| $2,000 to $2,499 | 43 (4.0%) | 0 (0.0%) |
| $2,500 to $2,999 | 67 (6.2%) | 0 (0.0%) |
| $3,000 or more | 925 (85.6%) | 0 (0.0%) |
| Total | 1,081 (100.0%) | 52 (100.0%) |
Physical Housing Characteristics in Muttontown
Housing Structures in Muttontown
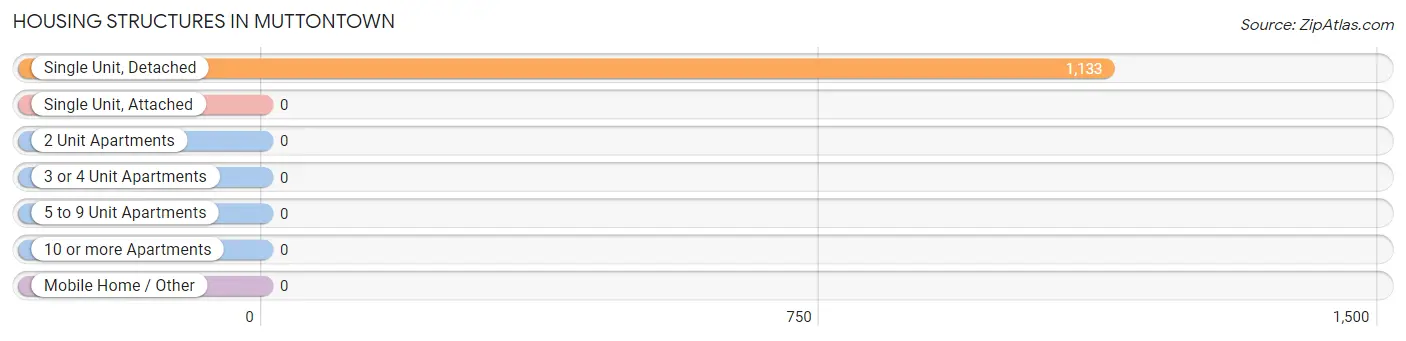
| Structure Type | # Housing Units | % Housing Units |
| Single Unit, Detached | 1,133 | 100.0% |
| Single Unit, Attached | 0 | 0.0% |
| 2 Unit Apartments | 0 | 0.0% |
| 3 or 4 Unit Apartments | 0 | 0.0% |
| 5 to 9 Unit Apartments | 0 | 0.0% |
| 10 or more Apartments | 0 | 0.0% |
| Mobile Home / Other | 0 | 0.0% |
| Total | 1,133 | 100.0% |
Housing Structures by Occupancy in Muttontown
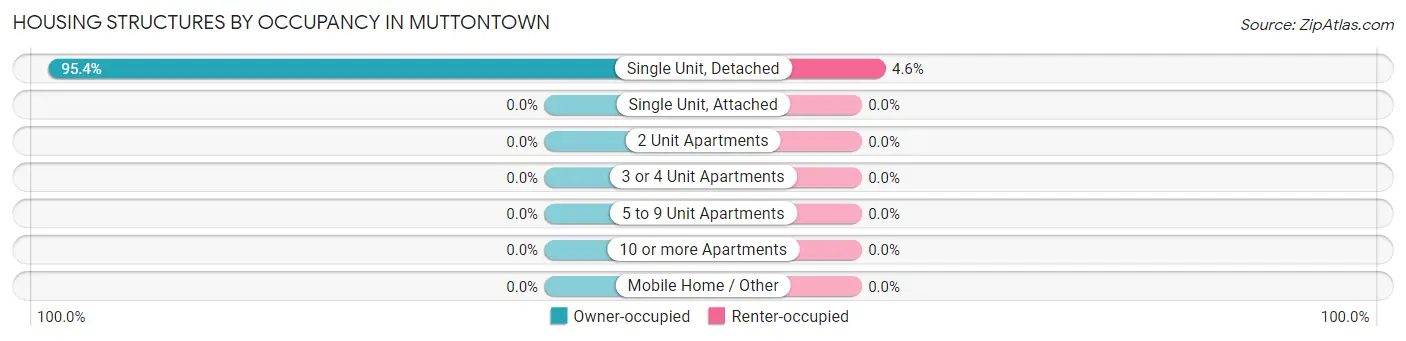
| Structure Type | Owner-occupied | Renter-occupied |
| Single Unit, Detached | 1,081 (95.4%) | 52 (4.6%) |
| Single Unit, Attached | 0 (0.0%) | 0 (0.0%) |
| 2 Unit Apartments | 0 (0.0%) | 0 (0.0%) |
| 3 or 4 Unit Apartments | 0 (0.0%) | 0 (0.0%) |
| 5 to 9 Unit Apartments | 0 (0.0%) | 0 (0.0%) |
| 10 or more Apartments | 0 (0.0%) | 0 (0.0%) |
| Mobile Home / Other | 0 (0.0%) | 0 (0.0%) |
| Total | 1,081 (95.4%) | 52 (4.6%) |
Housing Structures by Number of Rooms in Muttontown
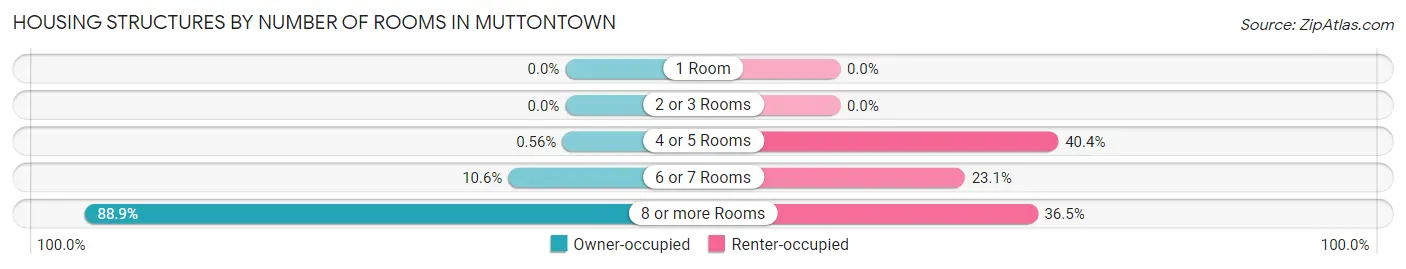
| Number of Rooms | Owner-occupied | Renter-occupied |
| 1 Room | 0 (0.0%) | 0 (0.0%) |
| 2 or 3 Rooms | 0 (0.0%) | 0 (0.0%) |
| 4 or 5 Rooms | 6 (0.6%) | 21 (40.4%) |
| 6 or 7 Rooms | 114 (10.5%) | 12 (23.1%) |
| 8 or more Rooms | 961 (88.9%) | 19 (36.5%) |
| Total | 1,081 (100.0%) | 52 (100.0%) |
Housing Structure by Heating Type in Muttontown
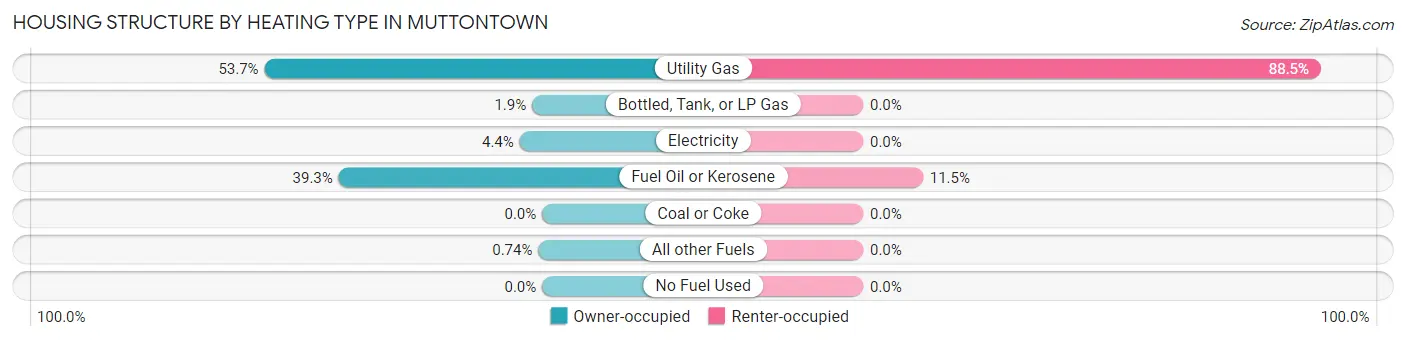
| Heating Type | Owner-occupied | Renter-occupied |
| Utility Gas | 580 (53.6%) | 46 (88.5%) |
| Bottled, Tank, or LP Gas | 21 (1.9%) | 0 (0.0%) |
| Electricity | 47 (4.3%) | 0 (0.0%) |
| Fuel Oil or Kerosene | 425 (39.3%) | 6 (11.5%) |
| Coal or Coke | 0 (0.0%) | 0 (0.0%) |
| All other Fuels | 8 (0.7%) | 0 (0.0%) |
| No Fuel Used | 0 (0.0%) | 0 (0.0%) |
| Total | 1,081 (100.0%) | 52 (100.0%) |
Household Vehicle Usage in Muttontown
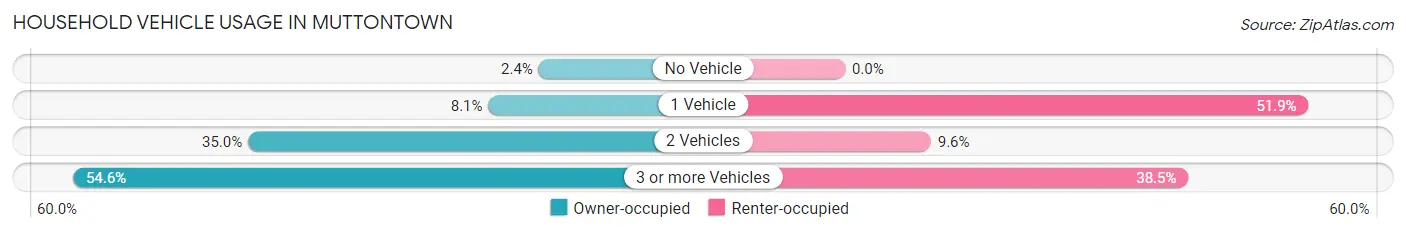
| Vehicles per Household | Owner-occupied | Renter-occupied |
| No Vehicle | 26 (2.4%) | 0 (0.0%) |
| 1 Vehicle | 87 (8.1%) | 27 (51.9%) |
| 2 Vehicles | 378 (35.0%) | 5 (9.6%) |
| 3 or more Vehicles | 590 (54.6%) | 20 (38.5%) |
| Total | 1,081 (100.0%) | 52 (100.0%) |
Real Estate & Mortgages in Muttontown
Real Estate and Mortgage Overview in Muttontown
| Characteristic | Without Mortgage | With Mortgage |
| Housing Units | 477 | 604 |
| Median Property Value | $1,714,800 | $1,745,000 |
| Median Household Income | $153,250 | $499 |
| Monthly Housing Costs | $1,501 | $591 |
| Real Estate Taxes | $10,001 | $0 |
Property Value by Mortgage Status in Muttontown
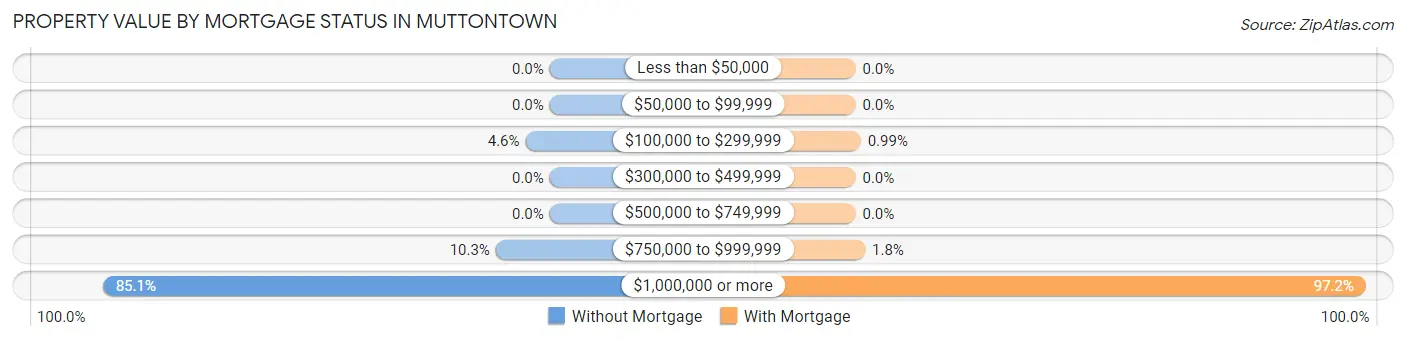
| Property Value | Without Mortgage | With Mortgage |
| Less than $50,000 | 0 (0.0%) | 0 (0.0%) |
| $50,000 to $99,999 | 0 (0.0%) | 0 (0.0%) |
| $100,000 to $299,999 | 22 (4.6%) | 6 (1.0%) |
| $300,000 to $499,999 | 0 (0.0%) | 0 (0.0%) |
| $500,000 to $749,999 | 0 (0.0%) | 0 (0.0%) |
| $750,000 to $999,999 | 49 (10.3%) | 11 (1.8%) |
| $1,000,000 or more | 406 (85.1%) | 587 (97.2%) |
| Total | 477 (100.0%) | 604 (100.0%) |
Household Income by Mortgage Status in Muttontown
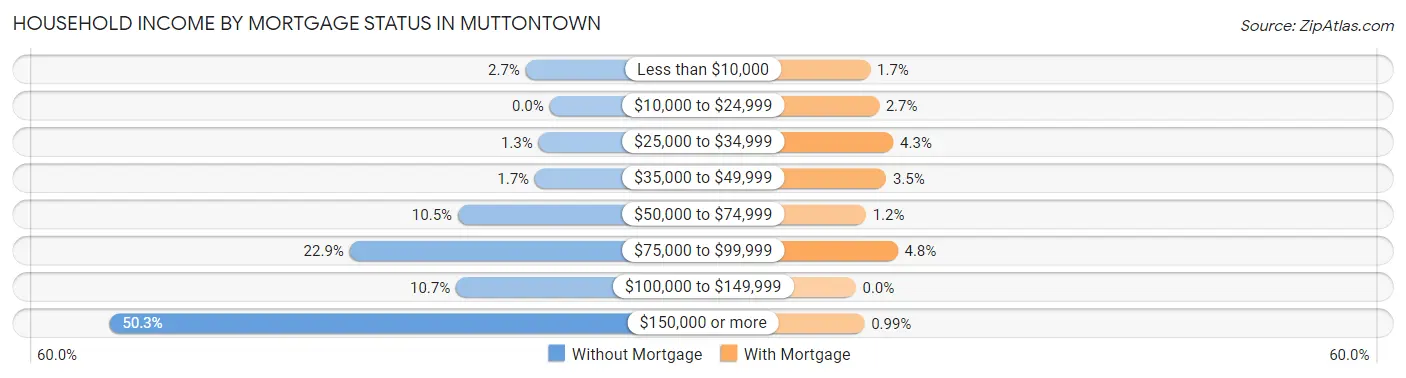
| Household Income | Without Mortgage | With Mortgage |
| Less than $10,000 | 13 (2.7%) | 10 (1.7%) |
| $10,000 to $24,999 | 0 (0.0%) | 16 (2.6%) |
| $25,000 to $34,999 | 6 (1.3%) | 26 (4.3%) |
| $35,000 to $49,999 | 8 (1.7%) | 21 (3.5%) |
| $50,000 to $74,999 | 50 (10.5%) | 7 (1.2%) |
| $75,000 to $99,999 | 109 (22.9%) | 29 (4.8%) |
| $100,000 to $149,999 | 51 (10.7%) | 0 (0.0%) |
| $150,000 or more | 240 (50.3%) | 6 (1.0%) |
| Total | 477 (100.0%) | 604 (100.0%) |
Property Value to Household Income Ratio in Muttontown
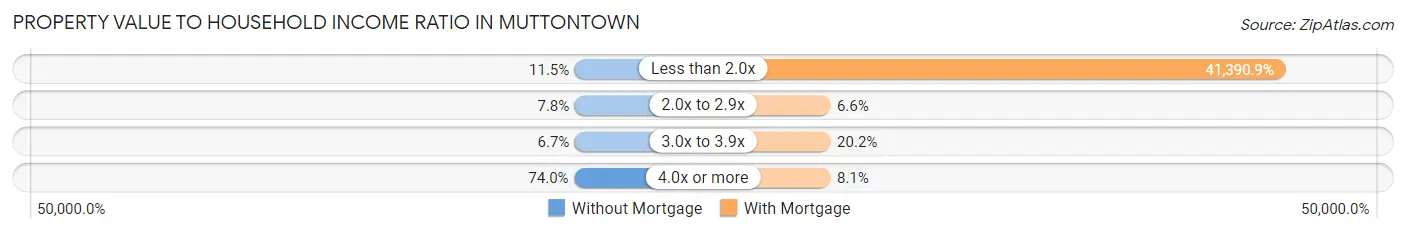
| Value-to-Income Ratio | Without Mortgage | With Mortgage |
| Less than 2.0x | 55 (11.5%) | 250,001 (41,390.9%) |
| 2.0x to 2.9x | 37 (7.8%) | 40 (6.6%) |
| 3.0x to 3.9x | 32 (6.7%) | 122 (20.2%) |
| 4.0x or more | 353 (74.0%) | 49 (8.1%) |
| Total | 477 (100.0%) | 604 (100.0%) |
Real Estate Taxes by Mortgage Status in Muttontown
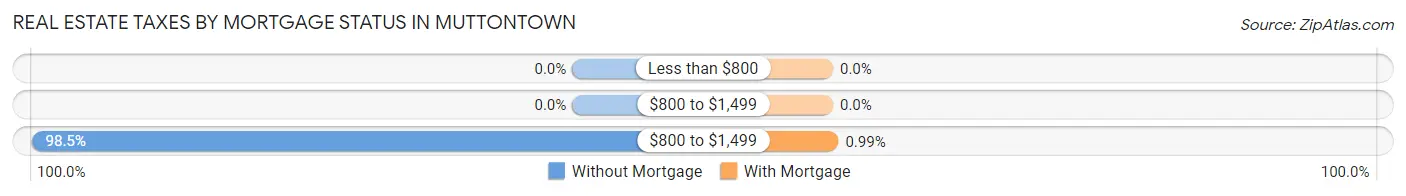
| Property Taxes | Without Mortgage | With Mortgage |
| Less than $800 | 0 (0.0%) | 0 (0.0%) |
| $800 to $1,499 | 0 (0.0%) | 0 (0.0%) |
| $800 to $1,499 | 470 (98.5%) | 6 (1.0%) |
| Total | 477 (100.0%) | 604 (100.0%) |
Health & Disability in Muttontown
Health Insurance Coverage by Age in Muttontown
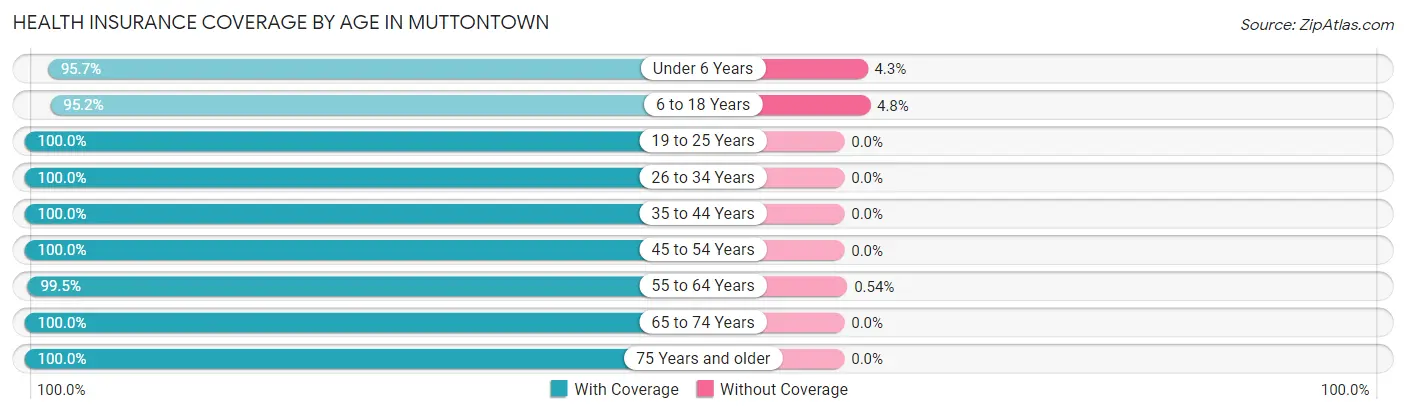
| Age Bracket | With Coverage | Without Coverage |
| Under 6 Years | 177 (95.7%) | 8 (4.3%) |
| 6 to 18 Years | 694 (95.2%) | 35 (4.8%) |
| 19 to 25 Years | 196 (100.0%) | 0 (0.0%) |
| 26 to 34 Years | 178 (100.0%) | 0 (0.0%) |
| 35 to 44 Years | 328 (100.0%) | 0 (0.0%) |
| 45 to 54 Years | 462 (100.0%) | 0 (0.0%) |
| 55 to 64 Years | 742 (99.5%) | 4 (0.5%) |
| 65 to 74 Years | 388 (100.0%) | 0 (0.0%) |
| 75 Years and older | 287 (100.0%) | 0 (0.0%) |
| Total | 3,452 (98.7%) | 47 (1.3%) |
Health Insurance Coverage by Citizenship Status in Muttontown
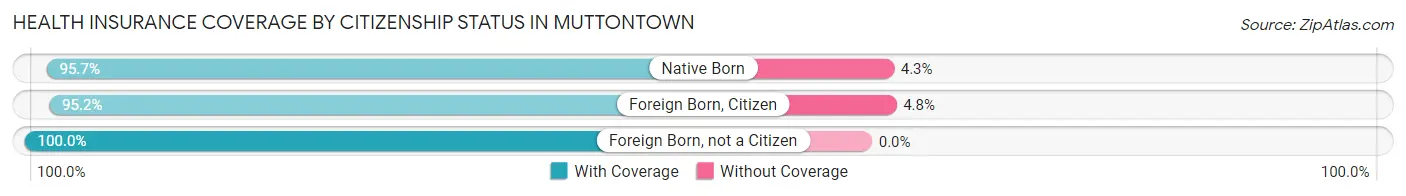
| Citizenship Status | With Coverage | Without Coverage |
| Native Born | 177 (95.7%) | 8 (4.3%) |
| Foreign Born, Citizen | 694 (95.2%) | 35 (4.8%) |
| Foreign Born, not a Citizen | 196 (100.0%) | 0 (0.0%) |
Health Insurance Coverage by Household Income in Muttontown
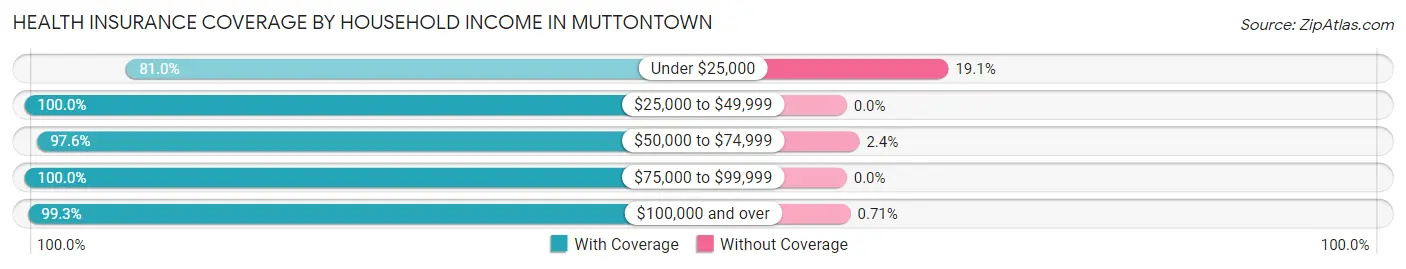
| Household Income | With Coverage | Without Coverage |
| Under $25,000 | 102 (80.9%) | 24 (19.1%) |
| $25,000 to $49,999 | 173 (100.0%) | 0 (0.0%) |
| $50,000 to $74,999 | 165 (97.6%) | 4 (2.4%) |
| $75,000 to $99,999 | 336 (100.0%) | 0 (0.0%) |
| $100,000 and over | 2,676 (99.3%) | 19 (0.7%) |
Public vs Private Health Insurance Coverage by Age in Muttontown
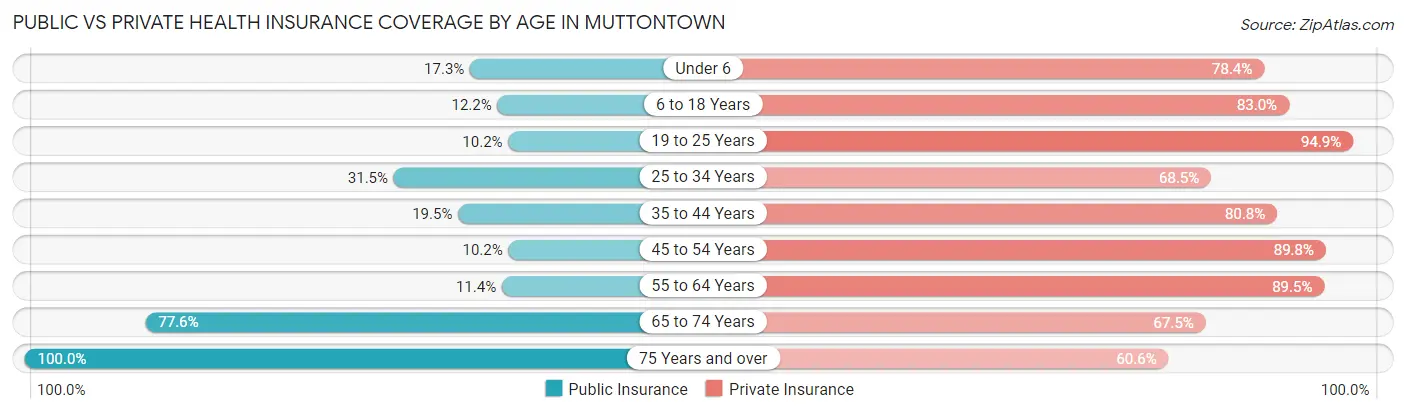
| Age Bracket | Public Insurance | Private Insurance |
| Under 6 | 32 (17.3%) | 145 (78.4%) |
| 6 to 18 Years | 89 (12.2%) | 605 (83.0%) |
| 19 to 25 Years | 20 (10.2%) | 186 (94.9%) |
| 25 to 34 Years | 56 (31.5%) | 122 (68.5%) |
| 35 to 44 Years | 64 (19.5%) | 265 (80.8%) |
| 45 to 54 Years | 47 (10.2%) | 415 (89.8%) |
| 55 to 64 Years | 85 (11.4%) | 668 (89.5%) |
| 65 to 74 Years | 301 (77.6%) | 262 (67.5%) |
| 75 Years and over | 287 (100.0%) | 174 (60.6%) |
| Total | 981 (28.0%) | 2,842 (81.2%) |
Disability Status by Sex by Age in Muttontown
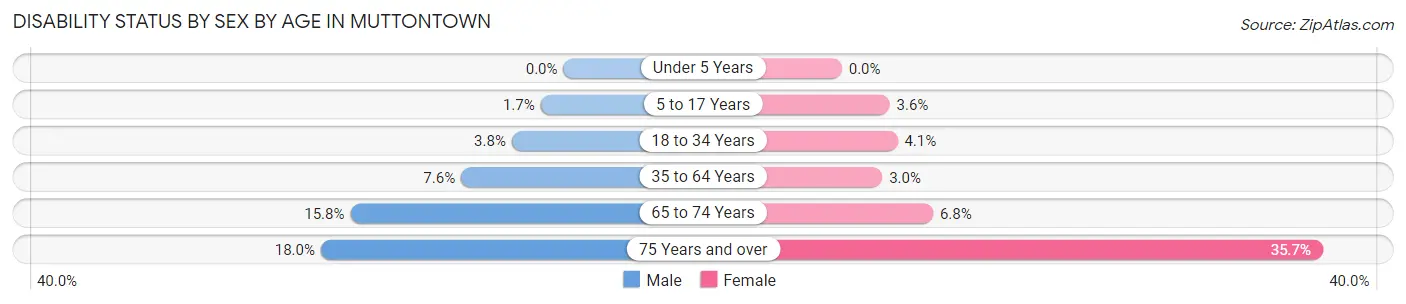
| Age Bracket | Male | Female |
| Under 5 Years | 0 (0.0%) | 0 (0.0%) |
| 5 to 17 Years | 7 (1.7%) | 11 (3.5%) |
| 18 to 34 Years | 7 (3.8%) | 9 (4.1%) |
| 35 to 64 Years | 61 (7.6%) | 22 (3.0%) |
| 65 to 74 Years | 31 (15.8%) | 13 (6.8%) |
| 75 Years and over | 29 (18.0%) | 45 (35.7%) |
Disability Class by Sex by Age in Muttontown
Disability Class: Hearing Difficulty
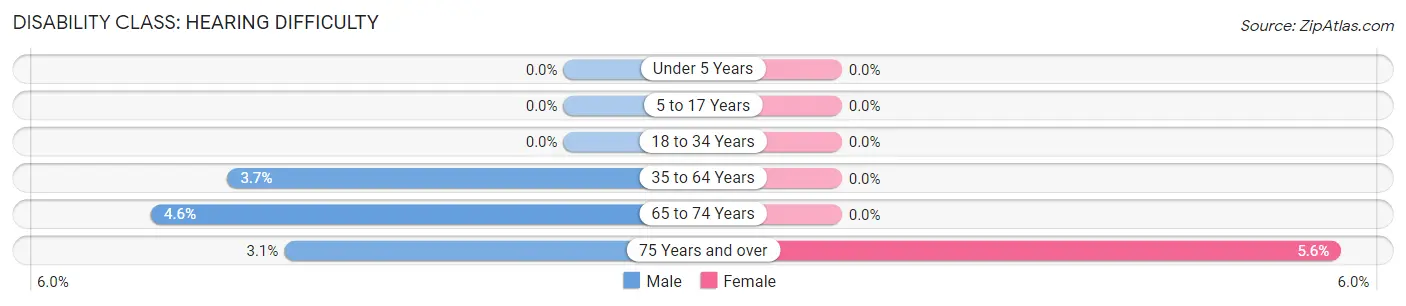
| Age Bracket | Male | Female |
| Under 5 Years | 0 (0.0%) | 0 (0.0%) |
| 5 to 17 Years | 0 (0.0%) | 0 (0.0%) |
| 18 to 34 Years | 0 (0.0%) | 0 (0.0%) |
| 35 to 64 Years | 30 (3.7%) | 0 (0.0%) |
| 65 to 74 Years | 9 (4.6%) | 0 (0.0%) |
| 75 Years and over | 5 (3.1%) | 7 (5.6%) |
Disability Class: Vision Difficulty
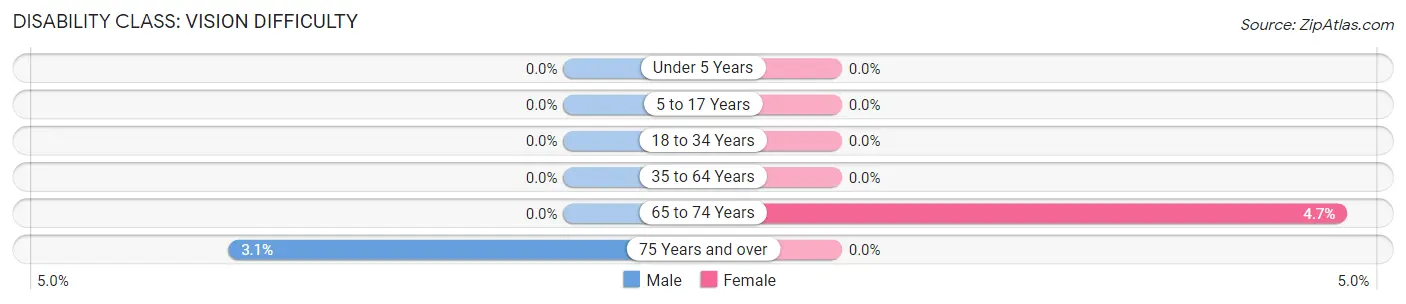
| Age Bracket | Male | Female |
| Under 5 Years | 0 (0.0%) | 0 (0.0%) |
| 5 to 17 Years | 0 (0.0%) | 0 (0.0%) |
| 18 to 34 Years | 0 (0.0%) | 0 (0.0%) |
| 35 to 64 Years | 0 (0.0%) | 0 (0.0%) |
| 65 to 74 Years | 0 (0.0%) | 9 (4.7%) |
| 75 Years and over | 5 (3.1%) | 0 (0.0%) |
Disability Class: Cognitive Difficulty
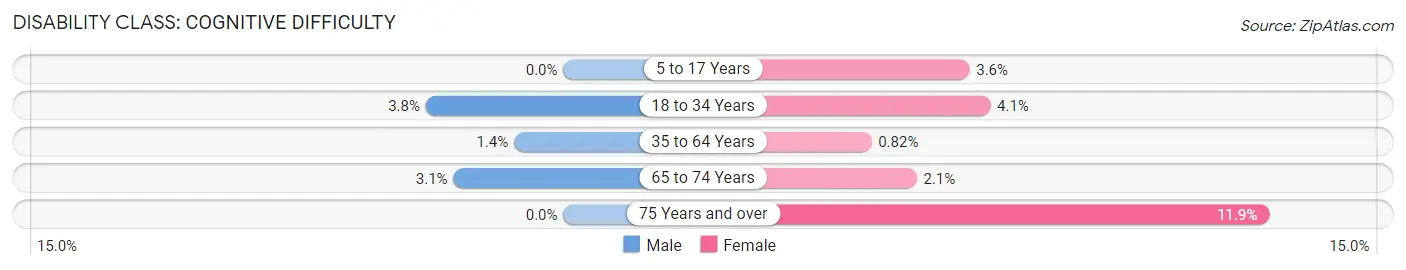
| Age Bracket | Male | Female |
| 5 to 17 Years | 0 (0.0%) | 11 (3.5%) |
| 18 to 34 Years | 7 (3.8%) | 9 (4.1%) |
| 35 to 64 Years | 11 (1.4%) | 6 (0.8%) |
| 65 to 74 Years | 6 (3.1%) | 4 (2.1%) |
| 75 Years and over | 0 (0.0%) | 15 (11.9%) |
Disability Class: Ambulatory Difficulty
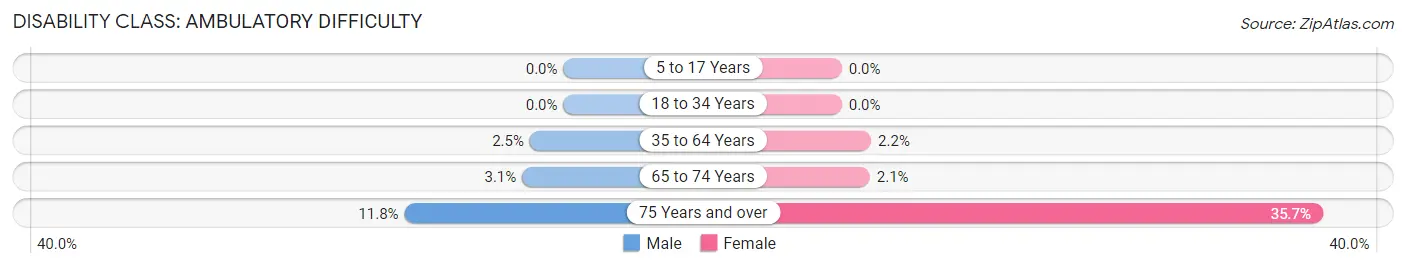
| Age Bracket | Male | Female |
| 5 to 17 Years | 0 (0.0%) | 0 (0.0%) |
| 18 to 34 Years | 0 (0.0%) | 0 (0.0%) |
| 35 to 64 Years | 20 (2.5%) | 16 (2.2%) |
| 65 to 74 Years | 6 (3.1%) | 4 (2.1%) |
| 75 Years and over | 19 (11.8%) | 45 (35.7%) |
Disability Class: Self-Care Difficulty
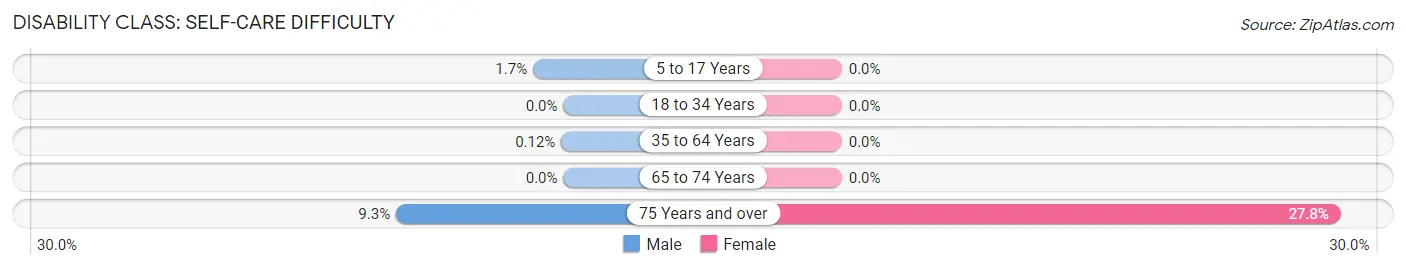
| Age Bracket | Male | Female |
| 5 to 17 Years | 7 (1.7%) | 0 (0.0%) |
| 18 to 34 Years | 0 (0.0%) | 0 (0.0%) |
| 35 to 64 Years | 1 (0.1%) | 0 (0.0%) |
| 65 to 74 Years | 0 (0.0%) | 0 (0.0%) |
| 75 Years and over | 15 (9.3%) | 35 (27.8%) |
Technology Access in Muttontown
Computing Device Access in Muttontown
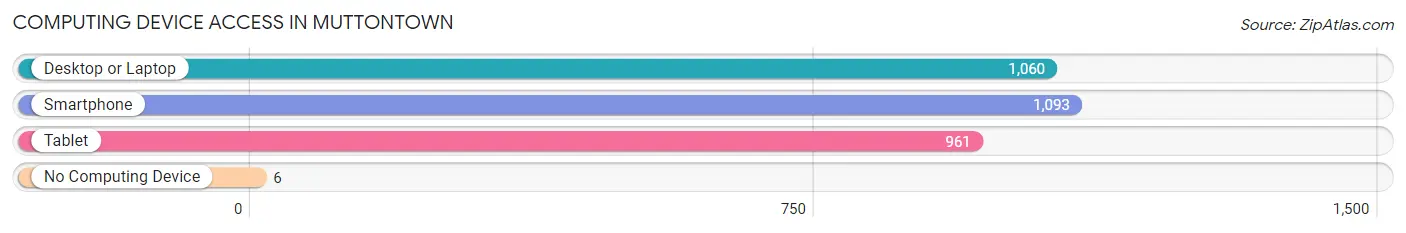
| Device Type | # Households | % Households |
| Desktop or Laptop | 1,060 | 93.6% |
| Smartphone | 1,093 | 96.5% |
| Tablet | 961 | 84.8% |
| No Computing Device | 6 | 0.5% |
| Total | 1,133 | 100.0% |
Internet Access in Muttontown
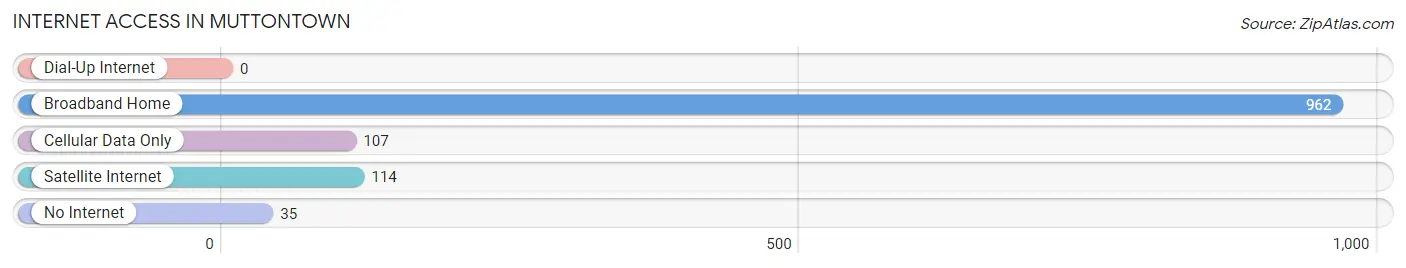
| Internet Type | # Households | % Households |
| Dial-Up Internet | 0 | 0.0% |
| Broadband Home | 962 | 84.9% |
| Cellular Data Only | 107 | 9.4% |
| Satellite Internet | 114 | 10.1% |
| No Internet | 35 | 3.1% |
| Total | 1,133 | 100.0% |
Muttontown Summary
Muttontown is a hamlet located in the Town of Oyster Bay in Nassau County, New York. It is located on the North Shore of Long Island, approximately 25 miles east of Manhattan. The hamlet is known for its large estates and is home to many prominent residents.
History
Muttontown was originally inhabited by the Matinecock Native American tribe. The area was first settled by Europeans in the mid-17th century. The hamlet was originally known as “Muttontown” due to the large number of sheep that grazed in the area. In the late 19th century, the area became a popular summer destination for wealthy New Yorkers. Many of these wealthy individuals built large estates in the area, which still stand today.
Geography
Muttontown is located in the Town of Oyster Bay in Nassau County, New York. It is located on the North Shore of Long Island, approximately 25 miles east of Manhattan. The hamlet is bordered by the hamlets of East Norwich to the west, Oyster Bay to the south, and Brookville to the east. The hamlet is located in the Nassau-Suffolk border region and is part of the North Shore of Long Island.
The hamlet is mostly residential, with a few commercial establishments. The area is known for its large estates, many of which are located on the Muttontown Preserve. The preserve is a 545-acre nature preserve that is owned and managed by the Nassau County Department of Parks, Recreation, and Historic Preservation.
Economy
Muttontown is a primarily residential area, with a few commercial establishments. The hamlet is home to many wealthy residents, and the local economy is largely driven by the real estate market. The area is known for its large estates, many of which are located on the Muttontown Preserve. The preserve is a 545-acre nature preserve that is owned and managed by the Nassau County Department of Parks, Recreation, and Historic Preservation.
Demographics
As of the 2010 census, the population of Muttontown was 5,859. The population is largely white (90.2%), with a small percentage of African Americans (2.3%), Asians (3.2%), and Hispanics (2.3%). The median household income is $164,846, and the median home value is $1,092,000.
Muttontown is a small hamlet located in the Town of Oyster Bay in Nassau County, New York. It is located on the North Shore of Long Island, approximately 25 miles east of Manhattan. The hamlet is known for its large estates and is home to many prominent residents. The area is mostly residential, with a few commercial establishments. The local economy is largely driven by the real estate market, and the population is largely white. The median household income is $164,846, and the median home value is $1,092,000.
Common Questions
What is Per Capita Income in Muttontown?
Per Capita income in Muttontown is $112,324.
What is the Median Family Income in Muttontown?
Median Family Income in Muttontown is $250,001.
What is the Median Household income in Muttontown?
Median Household Income in Muttontown is $226,477.
What is Income or Wage Gap in Muttontown?
Income or Wage Gap in Muttontown is 40.8%.
Women in Muttontown earn 59.2 cents for every dollar earned by a man.
What is Inequality or Gini Index in Muttontown?
Inequality or Gini Index in Muttontown is 0.52.
What is the Total Population of Muttontown?
Total Population of Muttontown is 3,499.
What is the Total Male Population of Muttontown?
Total Male Population of Muttontown is 1,822.
What is the Total Female Population of Muttontown?
Total Female Population of Muttontown is 1,677.
What is the Ratio of Males per 100 Females in Muttontown?
There are 108.65 Males per 100 Females in Muttontown.
What is the Ratio of Females per 100 Males in Muttontown?
There are 92.04 Females per 100 Males in Muttontown.
What is the Median Population Age in Muttontown?
Median Population Age in Muttontown is 46.9 Years.
What is the Average Family Size in Muttontown
Average Family Size in Muttontown is 3.3 People.
What is the Average Household Size in Muttontown
Average Household Size in Muttontown is 3.1 People.
How Large is the Labor Force in Muttontown?
There are 1,716 People in the Labor Forcein in Muttontown.
What is the Percentage of People in the Labor Force in Muttontown?
62.9% of People are in the Labor Force in Muttontown.
What is the Unemployment Rate in Muttontown?
Unemployment Rate in Muttontown is 7.2%.