Zip Codes with the Highest Percentage of Families with Income Above $200,000 in New York
RELATED REPORTS & OPTIONS
Family Income | $200k+
New York
Compare Zip Codes
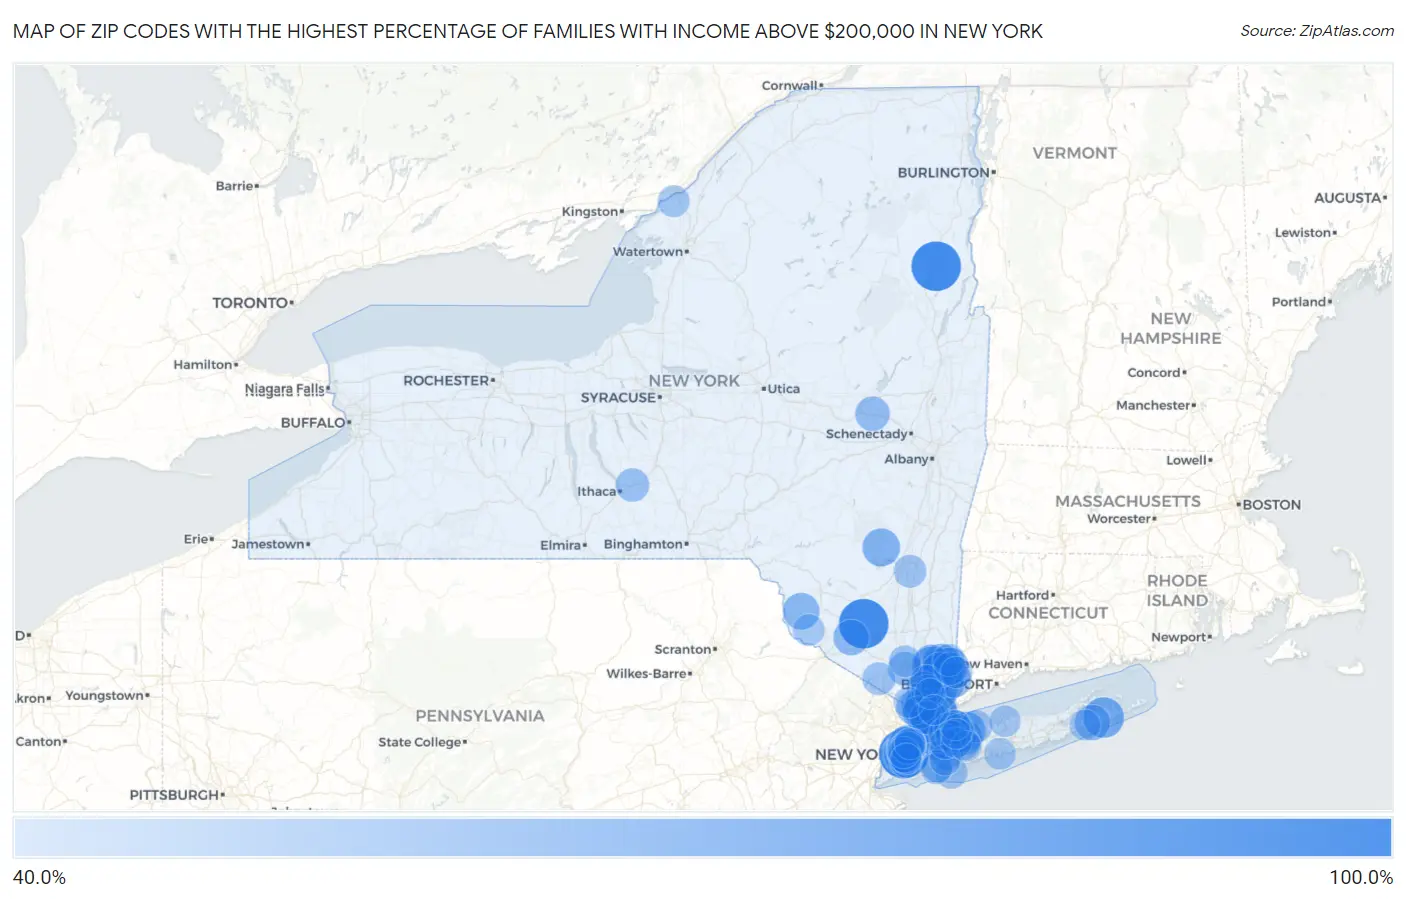
Map of Zip Codes with the Highest Percentage of Families with Income Above $200,000 in New York
40.0%
100.0%
Zip Codes with the Highest Percentage of Families with Income Above $200,000 in New York
| Zip Code | Families with Income > $200k | vs State | vs National | |
| 1. | 10279 | 100.0% | 19.2%(+80.8)#1 | 14.8%(+85.2)#16 |
| 2. | 12872 | 100.0% | 19.2%(+80.8)#2 | 14.8%(+85.2)#22 |
| 3. | 10985 | 100.0% | 19.2%(+80.8)#3 | 14.8%(+85.2)#36 |
| 4. | 10007 | 81.0% | 19.2%(+61.8)#4 | 14.8%(+66.2)#66 |
| 5. | 10004 | 77.7% | 19.2%(+58.5)#5 | 14.8%(+62.9)#72 |
| 6. | 11975 | 75.0% | 19.2%(+55.8)#6 | 14.8%(+60.2)#83 |
| 7. | 10577 | 73.4% | 19.2%(+54.2)#7 | 14.8%(+58.6)#88 |
| 8. | 10006 | 72.9% | 19.2%(+53.7)#8 | 14.8%(+58.1)#93 |
| 9. | 10526 | 70.4% | 19.2%(+51.2)#9 | 14.8%(+55.6)#117 |
| 10. | 11724 | 70.3% | 19.2%(+51.1)#10 | 14.8%(+55.5)#118 |
| 11. | 10506 | 70.0% | 19.2%(+50.8)#11 | 14.8%(+55.2)#121 |
| 12. | 10501 | 69.9% | 19.2%(+50.7)#12 | 14.8%(+55.1)#123 |
| 13. | 10580 | 69.1% | 19.2%(+49.9)#13 | 14.8%(+54.3)#132 |
| 14. | 10514 | 68.8% | 19.2%(+49.6)#14 | 14.8%(+54.0)#135 |
| 15. | 10028 | 68.7% | 19.2%(+49.5)#15 | 14.8%(+53.9)#136 |
| 16. | 10282 | 68.5% | 19.2%(+49.3)#16 | 14.8%(+53.7)#138 |
| 17. | 10502 | 67.6% | 19.2%(+48.4)#17 | 14.8%(+52.8)#148 |
| 18. | 10016 | 67.5% | 19.2%(+48.3)#18 | 14.8%(+52.7)#151 |
| 19. | 12448 | 67.4% | 19.2%(+48.2)#19 | 14.8%(+52.6)#154 |
| 20. | 10583 | 67.2% | 19.2%(+48.0)#20 | 14.8%(+52.4)#155 |
| 21. | 11030 | 66.3% | 19.2%(+47.1)#21 | 14.8%(+51.5)#169 |
| 22. | 10578 | 66.2% | 19.2%(+47.0)#22 | 14.8%(+51.4)#171 |
| 23. | 10597 | 66.0% | 19.2%(+46.8)#23 | 14.8%(+51.2)#174 |
| 24. | 12720 | 64.6% | 19.2%(+45.4)#24 | 14.8%(+49.8)#196 |
| 25. | 10504 | 64.4% | 19.2%(+45.2)#25 | 14.8%(+49.6)#199 |
| 26. | 11765 | 64.3% | 19.2%(+45.1)#26 | 14.8%(+49.5)#201 |
| 27. | 10538 | 64.1% | 19.2%(+44.9)#27 | 14.8%(+49.3)#204 |
| 28. | 11576 | 63.3% | 19.2%(+44.1)#28 | 14.8%(+48.5)#215 |
| 29. | 10003 | 62.9% | 19.2%(+43.7)#29 | 14.8%(+48.1)#222 |
| 30. | 10280 | 62.9% | 19.2%(+43.7)#30 | 14.8%(+48.1)#224 |
| 31. | 11568 | 62.4% | 19.2%(+43.2)#31 | 14.8%(+47.6)#236 |
| 32. | 10527 | 62.0% | 19.2%(+42.8)#32 | 14.8%(+47.2)#244 |
| 33. | 10932 | 61.9% | 19.2%(+42.7)#33 | 14.8%(+47.1)#246 |
| 34. | 10804 | 61.7% | 19.2%(+42.5)#34 | 14.8%(+46.9)#251 |
| 35. | 11976 | 61.4% | 19.2%(+42.2)#35 | 14.8%(+46.6)#261 |
| 36. | 10576 | 61.1% | 19.2%(+41.9)#36 | 14.8%(+46.3)#266 |
| 37. | 10803 | 60.8% | 19.2%(+41.6)#37 | 14.8%(+46.0)#270 |
| 38. | 10018 | 60.7% | 19.2%(+41.5)#38 | 14.8%(+45.9)#276 |
| 39. | 10022 | 60.6% | 19.2%(+41.4)#39 | 14.8%(+45.8)#282 |
| 40. | 10536 | 60.6% | 19.2%(+41.4)#40 | 14.8%(+45.8)#285 |
| 41. | 10023 | 60.5% | 19.2%(+41.3)#41 | 14.8%(+45.7)#288 |
| 42. | 10075 | 60.2% | 19.2%(+41.0)#42 | 14.8%(+45.4)#296 |
| 43. | 10503 | 60.0% | 19.2%(+40.8)#43 | 14.8%(+45.2)#301 |
| 44. | 11797 | 59.9% | 19.2%(+40.7)#44 | 14.8%(+45.1)#302 |
| 45. | 10011 | 59.5% | 19.2%(+40.3)#45 | 14.8%(+44.7)#309 |
| 46. | 10021 | 59.5% | 19.2%(+40.3)#46 | 14.8%(+44.7)#310 |
| 47. | 10024 | 59.2% | 19.2%(+40.0)#47 | 14.8%(+44.4)#320 |
| 48. | 10510 | 59.0% | 19.2%(+39.8)#48 | 14.8%(+44.2)#322 |
| 49. | 12069 | 58.9% | 19.2%(+39.7)#49 | 14.8%(+44.1)#326 |
| 50. | 10069 | 58.8% | 19.2%(+39.6)#50 | 14.8%(+44.0)#331 |
| 51. | 10964 | 58.8% | 19.2%(+39.6)#51 | 14.8%(+44.0)#332 |
| 52. | 10005 | 58.2% | 19.2%(+39.0)#52 | 14.8%(+43.4)#346 |
| 53. | 10010 | 58.0% | 19.2%(+38.8)#53 | 14.8%(+43.2)#348 |
| 54. | 10065 | 57.7% | 19.2%(+38.5)#54 | 14.8%(+42.9)#359 |
| 55. | 10014 | 57.6% | 19.2%(+38.4)#55 | 14.8%(+42.8)#366 |
| 56. | 11530 | 57.5% | 19.2%(+38.3)#56 | 14.8%(+42.7)#371 |
| 57. | 10986 | 57.0% | 19.2%(+37.8)#57 | 14.8%(+42.2)#386 |
| 58. | 13062 | 56.0% | 19.2%(+36.8)#58 | 14.8%(+41.2)#416 |
| 59. | 11109 | 55.9% | 19.2%(+36.7)#59 | 14.8%(+41.1)#418 |
| 60. | 10533 | 55.6% | 19.2%(+36.4)#60 | 14.8%(+40.8)#431 |
| 61. | 10570 | 54.9% | 19.2%(+35.7)#61 | 14.8%(+40.1)#456 |
| 62. | 10706 | 54.9% | 19.2%(+35.7)#62 | 14.8%(+40.1)#457 |
| 63. | 11215 | 54.8% | 19.2%(+35.6)#63 | 14.8%(+40.0)#458 |
| 64. | 11201 | 54.5% | 19.2%(+35.3)#64 | 14.8%(+39.7)#471 |
| 65. | 10709 | 54.4% | 19.2%(+35.2)#65 | 14.8%(+39.6)#482 |
| 66. | 10017 | 54.3% | 19.2%(+35.1)#66 | 14.8%(+39.5)#489 |
| 67. | 10987 | 54.2% | 19.2%(+35.0)#67 | 14.8%(+39.4)#492 |
| 68. | 10546 | 54.2% | 19.2%(+35.0)#68 | 14.8%(+39.4)#493 |
| 69. | 12574 | 54.1% | 19.2%(+34.9)#69 | 14.8%(+39.3)#496 |
| 70. | 10518 | 53.8% | 19.2%(+34.6)#70 | 14.8%(+39.0)#505 |
| 71. | 11791 | 53.7% | 19.2%(+34.5)#71 | 14.8%(+38.9)#507 |
| 72. | 11579 | 53.6% | 19.2%(+34.4)#72 | 14.8%(+38.8)#513 |
| 73. | 11560 | 53.3% | 19.2%(+34.1)#73 | 14.8%(+38.5)#523 |
| 74. | 11569 | 53.2% | 19.2%(+34.0)#74 | 14.8%(+38.4)#528 |
| 75. | 11721 | 52.7% | 19.2%(+33.5)#75 | 14.8%(+37.9)#548 |
| 76. | 10560 | 52.3% | 19.2%(+33.1)#76 | 14.8%(+37.5)#562 |
| 77. | 11598 | 52.0% | 19.2%(+32.8)#77 | 14.8%(+37.2)#574 |
| 78. | 11803 | 51.8% | 19.2%(+32.6)#78 | 14.8%(+37.0)#581 |
| 79. | 10922 | 51.5% | 19.2%(+32.3)#79 | 14.8%(+36.7)#593 |
| 80. | 13692 | 51.4% | 19.2%(+32.2)#80 | 14.8%(+36.6)#599 |
| 81. | 11771 | 51.3% | 19.2%(+32.1)#81 | 14.8%(+36.5)#604 |
| 82. | 12743 | 50.9% | 19.2%(+31.7)#82 | 14.8%(+36.1)#628 |
| 83. | 10013 | 50.7% | 19.2%(+31.5)#83 | 14.8%(+35.9)#634 |
| 84. | 10590 | 50.7% | 19.2%(+31.5)#84 | 14.8%(+35.9)#637 |
| 85. | 11739 | 50.7% | 19.2%(+31.5)#85 | 14.8%(+35.9)#638 |
| 86. | 11545 | 50.2% | 19.2%(+31.0)#86 | 14.8%(+35.4)#650 |
| 87. | 11733 | 50.0% | 19.2%(+30.8)#87 | 14.8%(+35.2)#655 |
| 88. | 10128 | 49.7% | 19.2%(+30.5)#88 | 14.8%(+34.9)#683 |
| 89. | 11559 | 49.4% | 19.2%(+30.2)#89 | 14.8%(+34.6)#699 |
| 90. | 11570 | 49.3% | 19.2%(+30.1)#90 | 14.8%(+34.5)#702 |
| 91. | 10962 | 48.9% | 19.2%(+29.7)#91 | 14.8%(+34.1)#719 |
| 92. | 11968 | 48.7% | 19.2%(+29.5)#92 | 14.8%(+33.9)#726 |
| 93. | 11217 | 48.6% | 19.2%(+29.4)#93 | 14.8%(+33.8)#730 |
| 94. | 11577 | 48.6% | 19.2%(+29.4)#94 | 14.8%(+33.8)#732 |
| 95. | 10594 | 48.5% | 19.2%(+29.3)#95 | 14.8%(+33.7)#738 |
| 96. | 11753 | 48.3% | 19.2%(+29.1)#96 | 14.8%(+33.5)#748 |
| 97. | 11804 | 48.1% | 19.2%(+28.9)#97 | 14.8%(+33.3)#756 |
| 98. | 11709 | 48.0% | 19.2%(+28.8)#98 | 14.8%(+33.2)#762 |
| 99. | 11732 | 47.8% | 19.2%(+28.6)#99 | 14.8%(+33.0)#776 |
| 100. | 10605 | 47.5% | 19.2%(+28.3)#100 | 14.8%(+32.7)#784 |
Common Questions
What are the Top 10 Zip Codes with the Highest Percentage of Families with Income Above $200,000 in New York?
Top 10 Zip Codes with the Highest Percentage of Families with Income Above $200,000 in New York are:
What zip code has the Highest Percentage of Families with Income Above $200,000 in New York?
10279 has the Highest Percentage of Families with Income Above $200,000 in New York with 100.0%.
What is the Percentage of Families with Income Above $200,000 in the State of New York?
Percentage of Families with Income Above $200,000 in New York is 19.2%.
What is the Percentage of Families with Income Above $200,000 in the United States?
Percentage of Families with Income Above $200,000 in the United States is 14.8%.