Gilgo, NY Map & Demographics
Gilgo Map
Gilgo Overview
$106,694
PER CAPITA INCOME
$250,001
AVG FAMILY INCOME
$250,001
AVG HOUSEHOLD INCOME
0.43
INEQUALITY / GINI INDEX
209
TOTAL POPULATION
115
MALE POPULATION
94
FEMALE POPULATION
122.34
MALES / 100 FEMALES
81.74
FEMALES / 100 MALES
60.5
MEDIAN AGE
3.0
AVG FAMILY SIZE
2.6
AVG HOUSEHOLD SIZE
96
LABOR FORCE [ PEOPLE ]
45.9%
PERCENT IN LABOR FORCE
Income in Gilgo
Income Overview in Gilgo
Per Capita Income in Gilgo is $106,694, while median incomes of families and households are $250,001 and $250,001 respectively.
| Characteristic | Number | Measure |
| Per Capita Income | 209 | $106,694 |
| Median Family Income | 57 | $250,001 |
| Mean Family Income | 57 | $0 |
| Median Household Income | 80 | $250,001 |
| Mean Household Income | 80 | $262,748 |
| Income Deficit | 57 | $0 |
| Wage / Income Gap (%) | 209 | 0.00% |
| Wage / Income Gap ($) | 209 | 100.00¢ per $1 |
| Gini / Inequality Index | 209 | 0.43 |
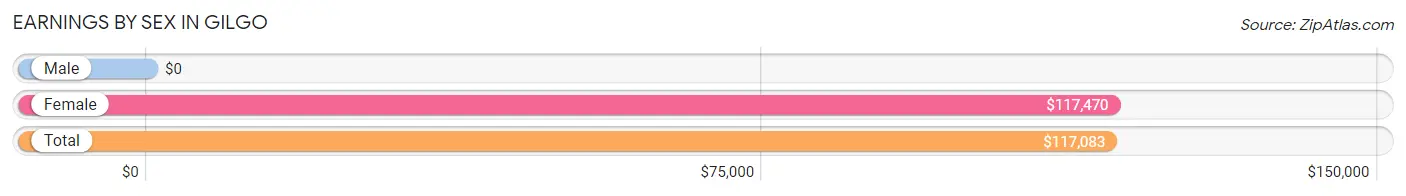
Earnings by Sex in Gilgo
| Sex | Number | Average Earnings |
| Male | 13 (13.5%) | $0 |
| Female | 83 (86.5%) | $117,470 |
| Total | 96 (100.0%) | $117,083 |
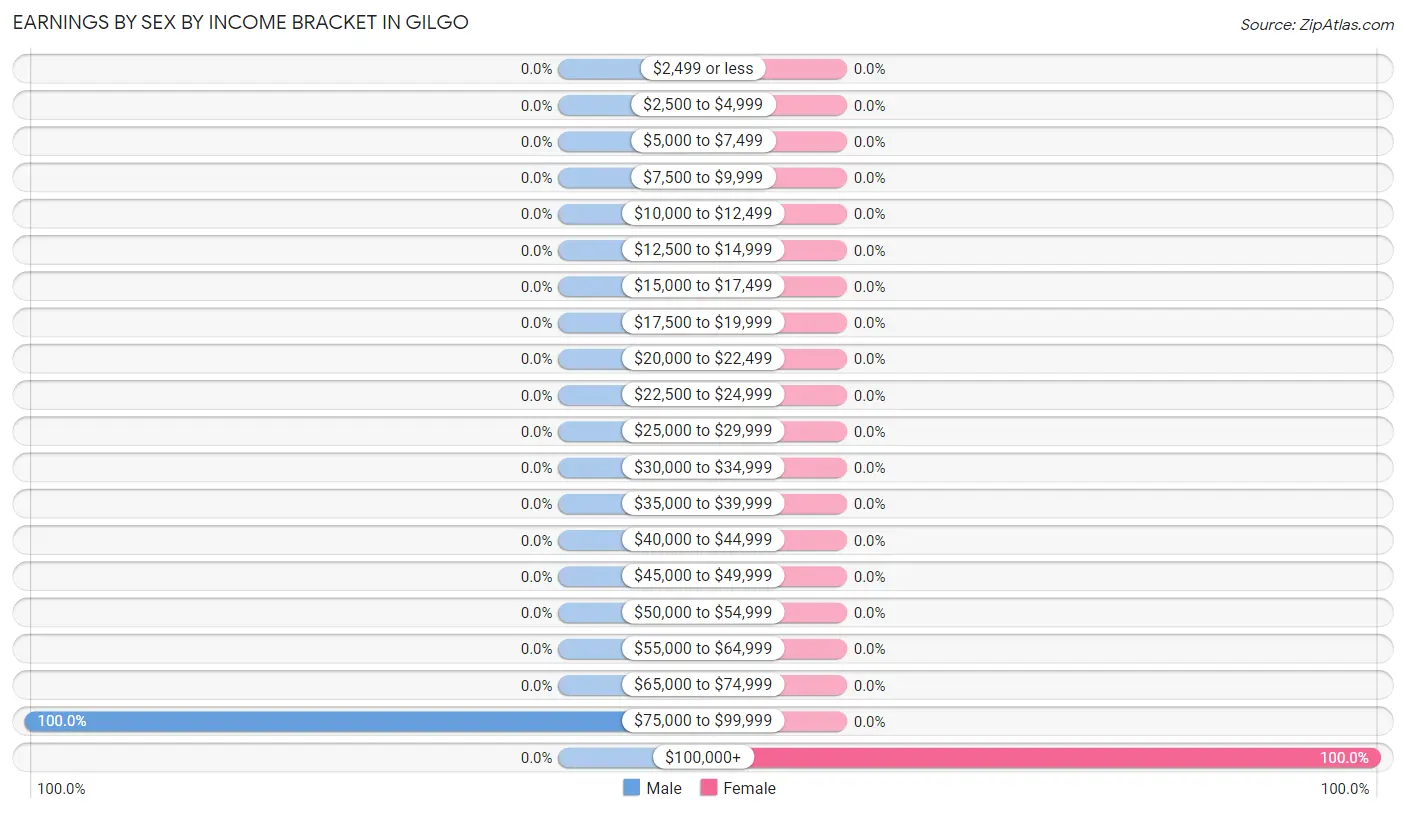
Earnings by Sex by Income Bracket in Gilgo
The most common earnings brackets in Gilgo are $75,000 to $99,999 for men (13 | 100.0%) and $100,000+ for women (83 | 100.0%).
| Income | Male | Female |
| $2,499 or less | 0 (0.0%) | 0 (0.0%) |
| $2,500 to $4,999 | 0 (0.0%) | 0 (0.0%) |
| $5,000 to $7,499 | 0 (0.0%) | 0 (0.0%) |
| $7,500 to $9,999 | 0 (0.0%) | 0 (0.0%) |
| $10,000 to $12,499 | 0 (0.0%) | 0 (0.0%) |
| $12,500 to $14,999 | 0 (0.0%) | 0 (0.0%) |
| $15,000 to $17,499 | 0 (0.0%) | 0 (0.0%) |
| $17,500 to $19,999 | 0 (0.0%) | 0 (0.0%) |
| $20,000 to $22,499 | 0 (0.0%) | 0 (0.0%) |
| $22,500 to $24,999 | 0 (0.0%) | 0 (0.0%) |
| $25,000 to $29,999 | 0 (0.0%) | 0 (0.0%) |
| $30,000 to $34,999 | 0 (0.0%) | 0 (0.0%) |
| $35,000 to $39,999 | 0 (0.0%) | 0 (0.0%) |
| $40,000 to $44,999 | 0 (0.0%) | 0 (0.0%) |
| $45,000 to $49,999 | 0 (0.0%) | 0 (0.0%) |
| $50,000 to $54,999 | 0 (0.0%) | 0 (0.0%) |
| $55,000 to $64,999 | 0 (0.0%) | 0 (0.0%) |
| $65,000 to $74,999 | 0 (0.0%) | 0 (0.0%) |
| $75,000 to $99,999 | 13 (100.0%) | 0 (0.0%) |
| $100,000+ | 0 (0.0%) | 83 (100.0%) |
| Total | 13 (100.0%) | 83 (100.0%) |
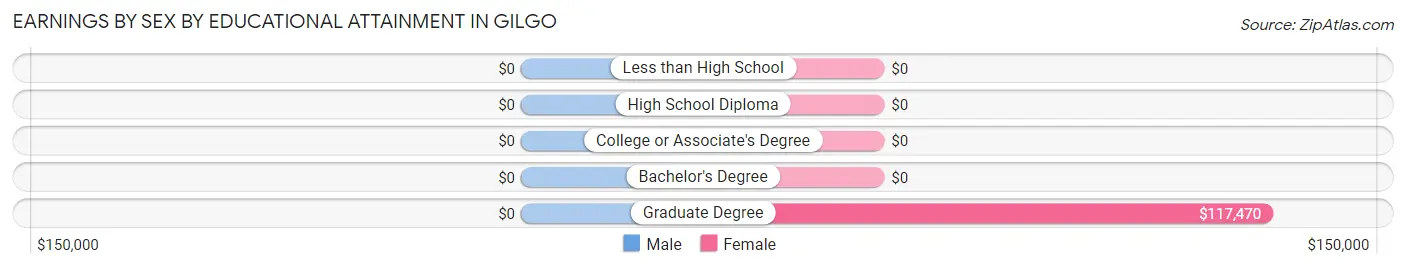
Earnings by Sex by Educational Attainment in Gilgo
| Educational Attainment | Male Income | Female Income |
| Less than High School | - | - |
| High School Diploma | - | - |
| College or Associate's Degree | - | - |
| Bachelor's Degree | - | - |
| Graduate Degree | - | - |
| Total | - | - |
Family Income in Gilgo
Family Income Brackets in Gilgo
According to the Gilgo family income data, there are 29 families falling into the $200,000+ income range, which is the most common income bracket and makes up 50.9% of all families.
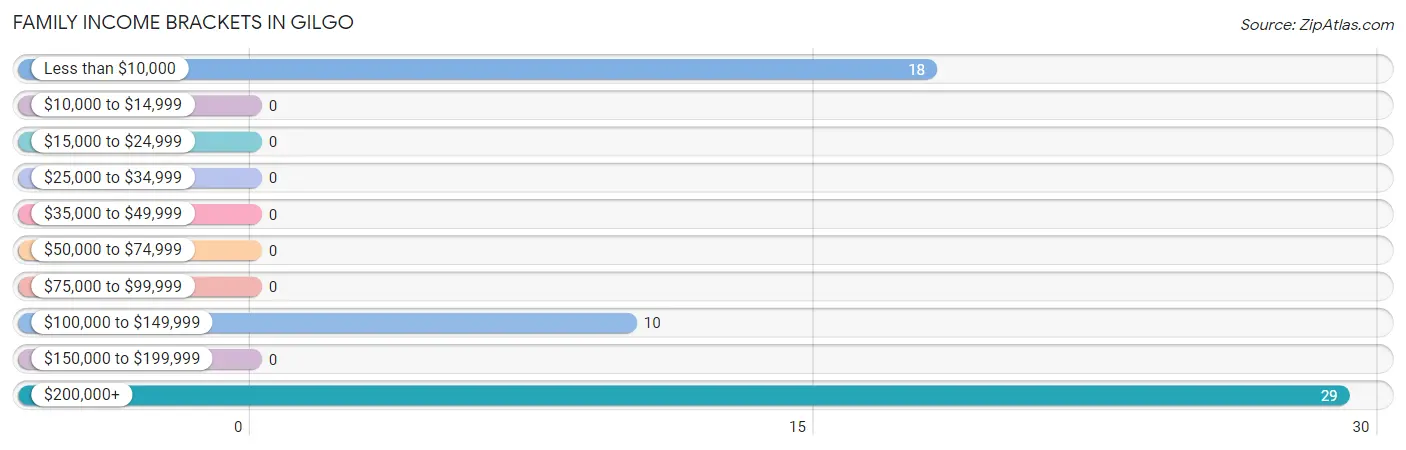
| Income Bracket | # Families | % Families |
| Less than $10,000 | 18 | 31.6% |
| $10,000 to $14,999 | 0 | 0.0% |
| $15,000 to $24,999 | 0 | 0.0% |
| $25,000 to $34,999 | 0 | 0.0% |
| $35,000 to $49,999 | 0 | 0.0% |
| $50,000 to $74,999 | 0 | 0.0% |
| $75,000 to $99,999 | 0 | 0.0% |
| $100,000 to $149,999 | 10 | 17.5% |
| $150,000 to $199,999 | 0 | 0.0% |
| $200,000+ | 29 | 50.9% |
Family Income by Famaliy Size in Gilgo
| Income Bracket | # Families | Median Income |
| 2-Person Families | 28 (49.1%) | $0 |
| 3-Person Families | 29 (50.9%) | $0 |
| 4-Person Families | 0 (0.0%) | $0 |
| 5-Person Families | 0 (0.0%) | $0 |
| 6-Person Families | 0 (0.0%) | $0 |
| 7+ Person Families | 0 (0.0%) | $0 |
| Total | 57 (100.0%) | $250,001 |
Family Income by Number of Earners in Gilgo
| Number of Earners | # Families | Median Income |
| No Earners | 28 (49.1%) | $0 |
| 1 Earner | 0 (0.0%) | $0 |
| 2 Earners | 29 (50.9%) | $0 |
| 3+ Earners | 0 (0.0%) | $0 |
| Total | 57 (100.0%) | $250,001 |
Household Income in Gilgo
Household Income Brackets in Gilgo
With 52 households falling in the category, the $200,000+ income range is the most frequent in Gilgo, accounting for 65.0% of all households.
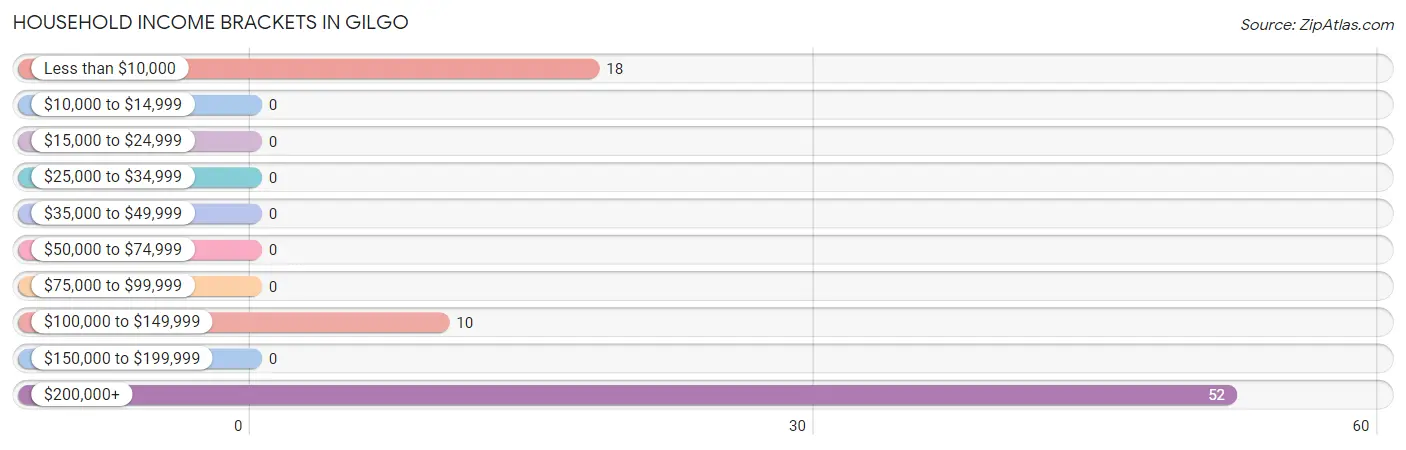
| Income Bracket | # Households | % Households |
| Less than $10,000 | 18 | 22.5% |
| $10,000 to $14,999 | 0 | 0.0% |
| $15,000 to $24,999 | 0 | 0.0% |
| $25,000 to $34,999 | 0 | 0.0% |
| $35,000 to $49,999 | 0 | 0.0% |
| $50,000 to $74,999 | 0 | 0.0% |
| $75,000 to $99,999 | 0 | 0.0% |
| $100,000 to $149,999 | 10 | 12.5% |
| $150,000 to $199,999 | 0 | 0.0% |
| $200,000+ | 52 | 65.0% |
Household Income by Householder Age in Gilgo
The median household income in Gilgo is $250,001, with the highest median household income of $250,001 found in the 65+ years age bracket for the primary householder. A total of 49 households (61.3%) fall into this category.
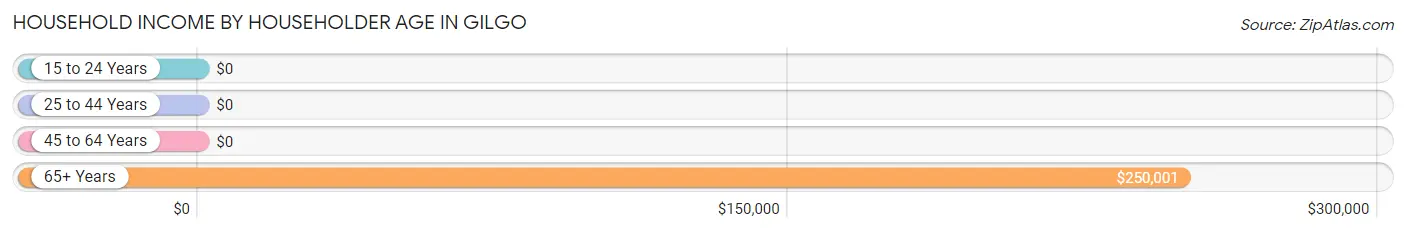
| Income Bracket | # Households | Median Income |
| 15 to 24 Years | 0 (0.0%) | $0 |
| 25 to 44 Years | 0 (0.0%) | $0 |
| 45 to 64 Years | 31 (38.8%) | $0 |
| 65+ Years | 49 (61.3%) | $250,001 |
| Total | 80 (100.0%) | $250,001 |
Poverty in Gilgo
Income Below Poverty by Sex and Age in Gilgo
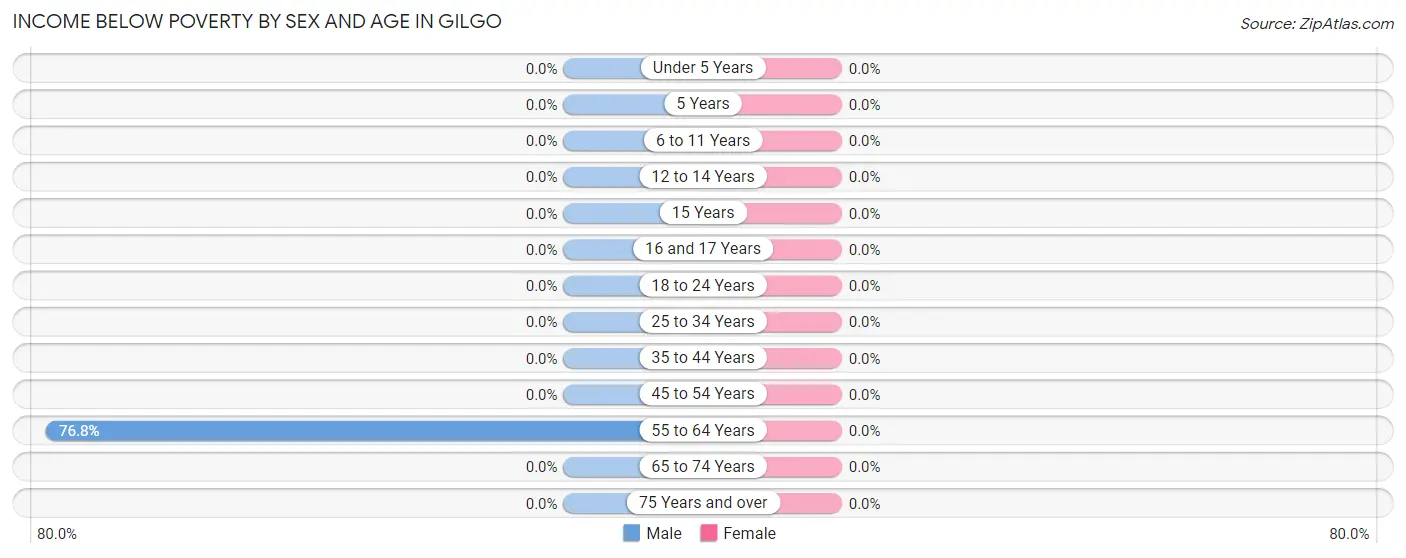
| Age Bracket | Male | Female |
| Under 5 Years | 0 (0.0%) | 0 (0.0%) |
| 5 Years | 0 (0.0%) | 0 (0.0%) |
| 6 to 11 Years | 0 (0.0%) | 0 (0.0%) |
| 12 to 14 Years | 0 (0.0%) | 0 (0.0%) |
| 15 Years | 0 (0.0%) | 0 (0.0%) |
| 16 and 17 Years | 0 (0.0%) | 0 (0.0%) |
| 18 to 24 Years | 0 (0.0%) | 0 (0.0%) |
| 25 to 34 Years | 0 (0.0%) | 0 (0.0%) |
| 35 to 44 Years | 0 (0.0%) | 0 (0.0%) |
| 45 to 54 Years | 0 (0.0%) | 0 (0.0%) |
| 55 to 64 Years | 43 (76.8%) | 0 (0.0%) |
| 65 to 74 Years | 0 (0.0%) | 0 (0.0%) |
| 75 Years and over | 0 (0.0%) | 0 (0.0%) |
| Total | 43 (37.4%) | 0 (0.0%) |
Income Above Poverty by Sex and Age in Gilgo
According to the poverty statistics in Gilgo, males aged 25 to 34 years and females aged 25 to 34 years are the age groups that are most secure financially, with 100.0% of males and 100.0% of females in these age groups living above the poverty line.
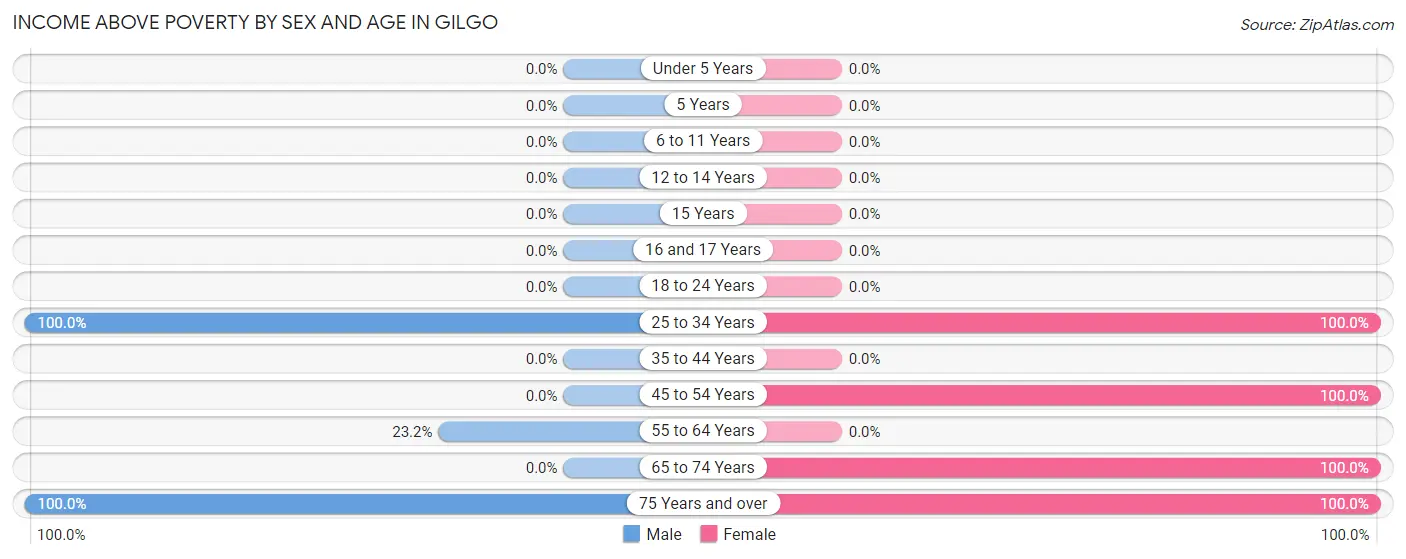
| Age Bracket | Male | Female |
| Under 5 Years | 0 (0.0%) | 0 (0.0%) |
| 5 Years | 0 (0.0%) | 0 (0.0%) |
| 6 to 11 Years | 0 (0.0%) | 0 (0.0%) |
| 12 to 14 Years | 0 (0.0%) | 0 (0.0%) |
| 15 Years | 0 (0.0%) | 0 (0.0%) |
| 16 and 17 Years | 0 (0.0%) | 0 (0.0%) |
| 18 to 24 Years | 0 (0.0%) | 0 (0.0%) |
| 25 to 34 Years | 39 (100.0%) | 42 (100.0%) |
| 35 to 44 Years | 0 (0.0%) | 0 (0.0%) |
| 45 to 54 Years | 0 (0.0%) | 12 (100.0%) |
| 55 to 64 Years | 13 (23.2%) | 0 (0.0%) |
| 65 to 74 Years | 0 (0.0%) | 29 (100.0%) |
| 75 Years and over | 20 (100.0%) | 11 (100.0%) |
| Total | 72 (62.6%) | 94 (100.0%) |
Income Below Poverty Among Married-Couple Families in Gilgo
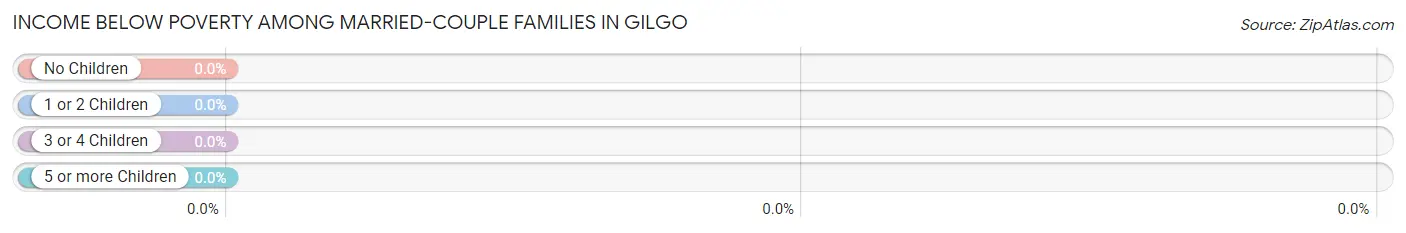
| Children | Above Poverty | Below Poverty |
| No Children | 10 (100.0%) | 0 (0.0%) |
| 1 or 2 Children | 0 (0.0%) | 0 (0.0%) |
| 3 or 4 Children | 0 (0.0%) | 0 (0.0%) |
| 5 or more Children | 0 (0.0%) | 0 (0.0%) |
| Total | 10 (100.0%) | 0 (0.0%) |
Income Below Poverty Among Single-Parent Households in Gilgo
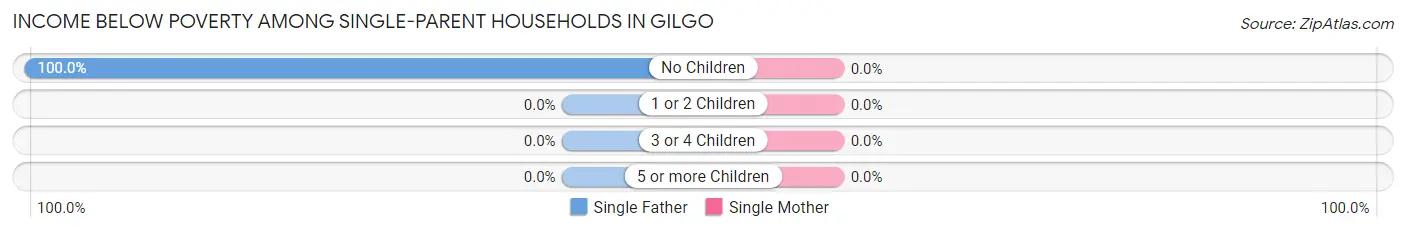
| Children | Single Father | Single Mother |
| No Children | 18 (100.0%) | 0 (0.0%) |
| 1 or 2 Children | 0 (0.0%) | 0 (0.0%) |
| 3 or 4 Children | 0 (0.0%) | 0 (0.0%) |
| 5 or more Children | 0 (0.0%) | 0 (0.0%) |
| Total | 18 (100.0%) | 0 (0.0%) |
Income Below Poverty Among Married-Couple vs Single-Parent Households in Gilgo
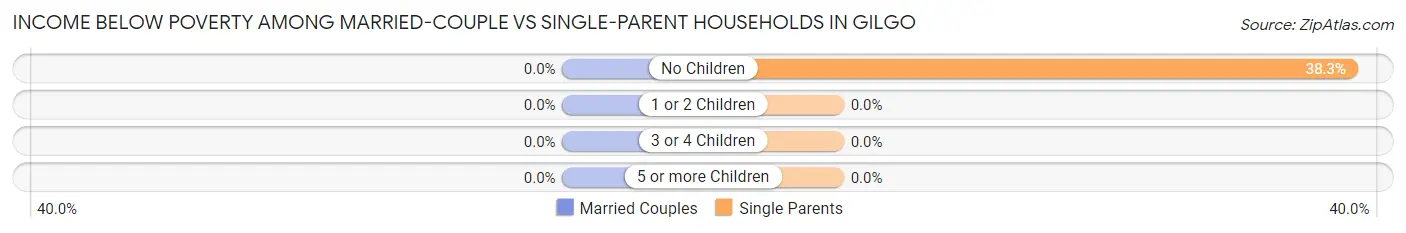
| Children | Married-Couple Families | Single-Parent Households |
| No Children | 0 (0.0%) | 18 (38.3%) |
| 1 or 2 Children | 0 (0.0%) | 0 (0.0%) |
| 3 or 4 Children | 0 (0.0%) | 0 (0.0%) |
| 5 or more Children | 0 (0.0%) | 0 (0.0%) |
| Total | 0 (0.0%) | 18 (38.3%) |
Race in Gilgo
The most populous races in Gilgo are , and White / Caucasian (209 | 100.0%).
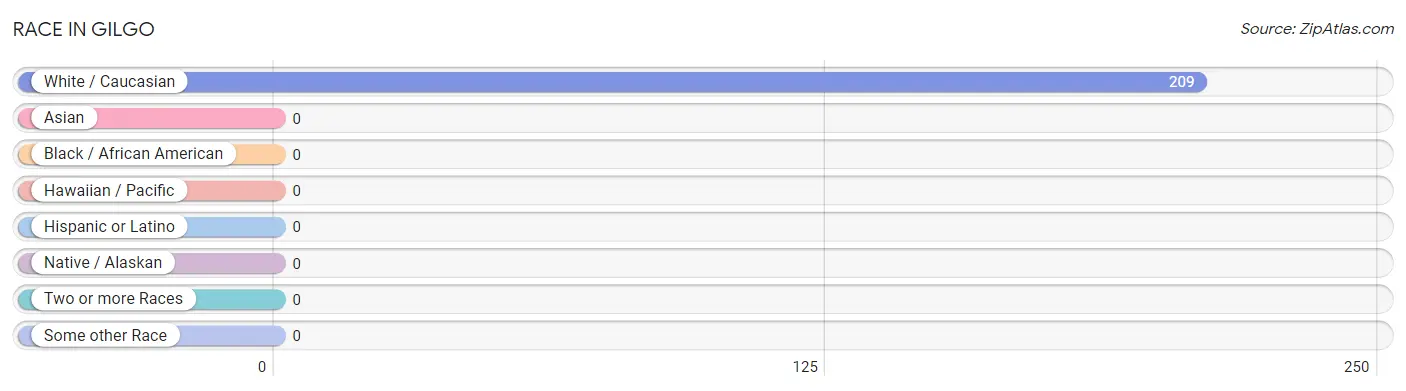
| Race | # Population | % Population |
| Asian | 0 | 0.0% |
| Black / African American | 0 | 0.0% |
| Hawaiian / Pacific | 0 | 0.0% |
| Hispanic or Latino | 0 | 0.0% |
| Native / Alaskan | 0 | 0.0% |
| White / Caucasian | 209 | 100.0% |
| Two or more Races | 0 | 0.0% |
| Some other Race | 0 | 0.0% |
| Total | 209 | 100.0% |
Ancestry in Gilgo
The most populous ancestries reported in Gilgo are English (116 | 55.5%), Lithuanian (68 | 32.5%), Italian (42 | 20.1%), German (40 | 19.1%), and Irish (28 | 13.4%), together accounting for 140.7% of all Gilgo residents.
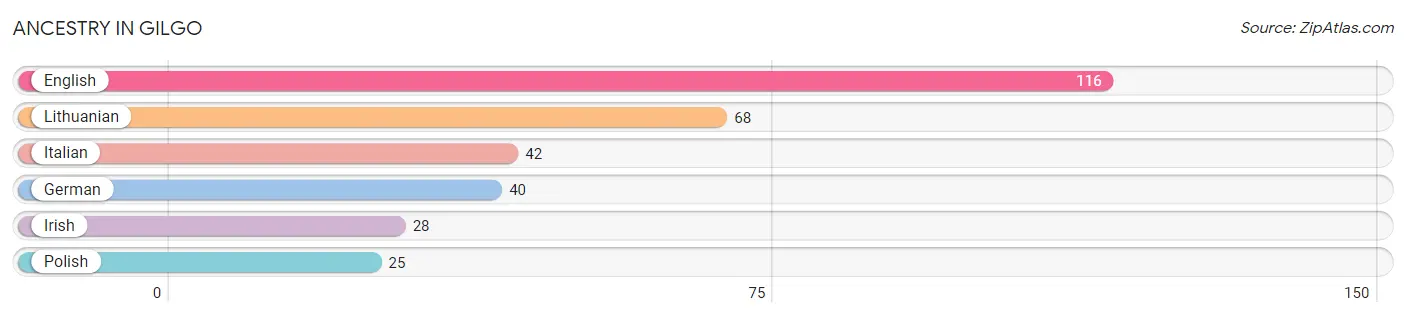
| Ancestry | # Population | % Population |
| English | 116 | 55.5% |
| German | 40 | 19.1% |
| Irish | 28 | 13.4% |
| Italian | 42 | 20.1% |
| Lithuanian | 68 | 32.5% |
| Polish | 25 | 12.0% | View All 6 Rows |
Immigrants in Gilgo

| Immigration Origin | # Population | % Population | View All 0 Rows |
Sex and Age in Gilgo
Sex and Age in Gilgo
The most populous age groups in Gilgo are 60 to 64 Years (56 | 48.7%) for men and 25 to 29 Years (42 | 44.7%) for women.
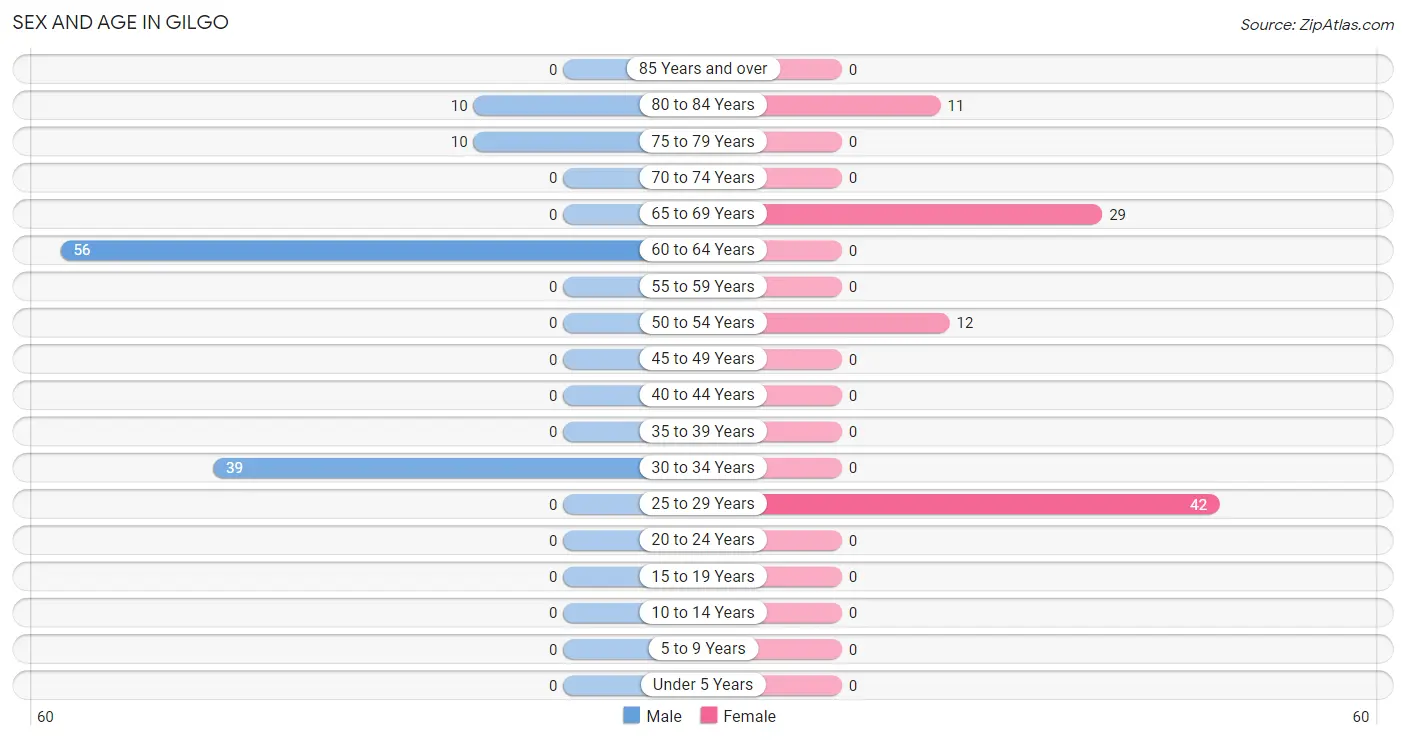
| Age Bracket | Male | Female |
| Under 5 Years | 0 (0.0%) | 0 (0.0%) |
| 5 to 9 Years | 0 (0.0%) | 0 (0.0%) |
| 10 to 14 Years | 0 (0.0%) | 0 (0.0%) |
| 15 to 19 Years | 0 (0.0%) | 0 (0.0%) |
| 20 to 24 Years | 0 (0.0%) | 0 (0.0%) |
| 25 to 29 Years | 0 (0.0%) | 42 (44.7%) |
| 30 to 34 Years | 39 (33.9%) | 0 (0.0%) |
| 35 to 39 Years | 0 (0.0%) | 0 (0.0%) |
| 40 to 44 Years | 0 (0.0%) | 0 (0.0%) |
| 45 to 49 Years | 0 (0.0%) | 0 (0.0%) |
| 50 to 54 Years | 0 (0.0%) | 12 (12.8%) |
| 55 to 59 Years | 0 (0.0%) | 0 (0.0%) |
| 60 to 64 Years | 56 (48.7%) | 0 (0.0%) |
| 65 to 69 Years | 0 (0.0%) | 29 (30.8%) |
| 70 to 74 Years | 0 (0.0%) | 0 (0.0%) |
| 75 to 79 Years | 10 (8.7%) | 0 (0.0%) |
| 80 to 84 Years | 10 (8.7%) | 11 (11.7%) |
| 85 Years and over | 0 (0.0%) | 0 (0.0%) |
| Total | 115 (100.0%) | 94 (100.0%) |
Families and Households in Gilgo
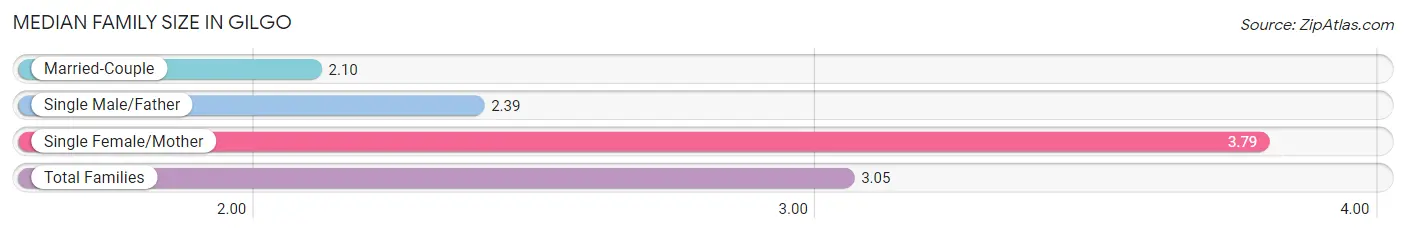
Median Family Size in Gilgo
The median family size in Gilgo is 3.05 persons per family, with single female/mother families (29 | 50.9%) accounting for the largest median family size of 3.79 persons per family. On the other hand, married-couple families (10 | 17.5%) represent the smallest median family size with 2.10 persons per family.
| Family Type | # Families | Family Size |
| Married-Couple | 10 (17.5%) | 2.10 |
| Single Male/Father | 18 (31.6%) | 2.39 |
| Single Female/Mother | 29 (50.9%) | 3.79 |
| Total Families | 57 (100.0%) | 3.05 |
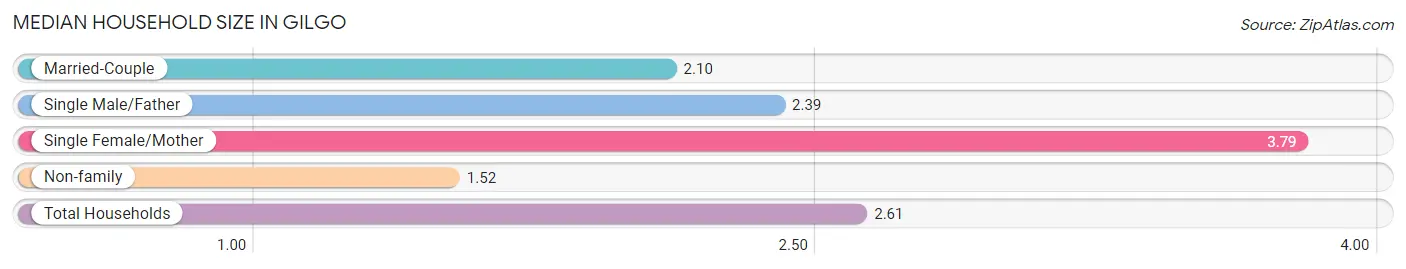
Median Household Size in Gilgo
The median household size in Gilgo is 2.61 persons per household, with single female/mother households (29 | 36.2%) accounting for the largest median household size of 3.79 persons per household. non-family households (23 | 28.7%) represent the smallest median household size with 1.52 persons per household.
| Household Type | # Households | Household Size |
| Married-Couple | 10 (12.5%) | 2.10 |
| Single Male/Father | 18 (22.5%) | 2.39 |
| Single Female/Mother | 29 (36.2%) | 3.79 |
| Non-family | 23 (28.7%) | 1.52 |
| Total Households | 80 (100.0%) | 2.61 |
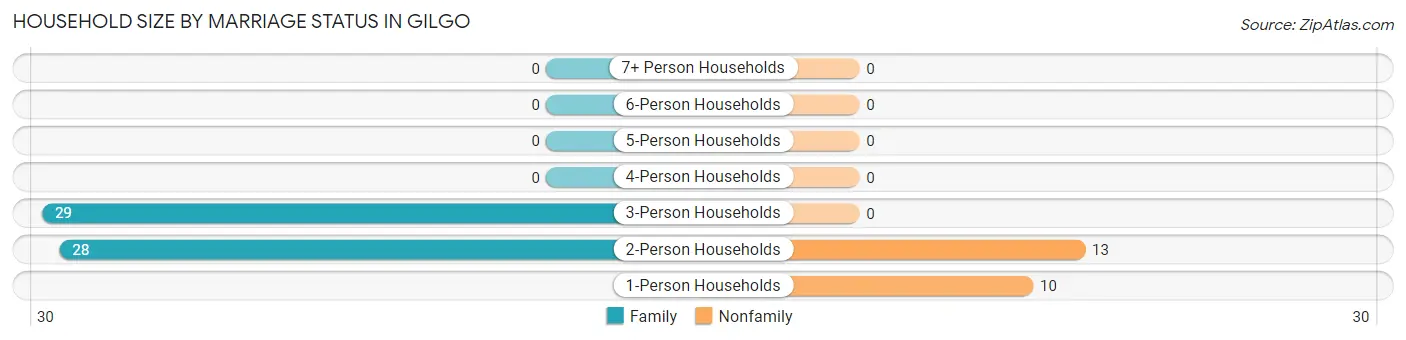
Household Size by Marriage Status in Gilgo
Out of a total of 80 households in Gilgo, 57 (71.3%) are family households, while 23 (28.7%) are nonfamily households. The most numerous type of family households are 3-person households, comprising 29, and the most common type of nonfamily households are 2-person households, comprising 13.
| Household Size | Family Households | Nonfamily Households |
| 1-Person Households | - | 10 (12.5%) |
| 2-Person Households | 28 (35.0%) | 13 (16.3%) |
| 3-Person Households | 29 (36.2%) | 0 (0.0%) |
| 4-Person Households | 0 (0.0%) | 0 (0.0%) |
| 5-Person Households | 0 (0.0%) | 0 (0.0%) |
| 6-Person Households | 0 (0.0%) | 0 (0.0%) |
| 7+ Person Households | 0 (0.0%) | 0 (0.0%) |
| Total | 57 (71.3%) | 23 (28.7%) |
Female Fertility in Gilgo
Fertility by Age in Gilgo

| Age Bracket | Women with Births | Births / 1,000 Women |
| 15 to 19 years | 0 (0.0%) | 0.0 |
| 20 to 34 years | 0 (0.0%) | 0.0 |
| 35 to 50 years | 0 (0.0%) | 0.0 |
| Total | 0 (0.0%) | 0.0 |
Fertility by Age by Marriage Status in Gilgo
| Age Bracket | Married | Unmarried |
| 15 to 19 years | 0 (0.0%) | 0 (0.0%) |
| 20 to 34 years | 0 (0.0%) | 0 (0.0%) |
| 35 to 50 years | 0 (0.0%) | 0 (0.0%) |
| Total | 0 (0.0%) | 0 (0.0%) |
Fertility by Education in Gilgo
| Educational Attainment | Women with Births | Births / 1,000 Women |
| Less than High School | 0 (0.0%) | 0.0 |
| High School Diploma | 0 (0.0%) | 0.0 |
| College or Associate's Degree | 0 (0.0%) | 0.0 |
| Bachelor's Degree | 0 (0.0%) | 0.0 |
| Graduate Degree | 0 (0.0%) | 0.0 |
| Total | 0 (0.0%) | 0.0 |
Fertility by Education by Marriage Status in Gilgo
| Educational Attainment | Married | Unmarried |
| Less than High School | 0 (0.0%) | 0 (0.0%) |
| High School Diploma | 0 (0.0%) | 0 (0.0%) |
| College or Associate's Degree | 0 (0.0%) | 0 (0.0%) |
| Bachelor's Degree | 0 (0.0%) | 0 (0.0%) |
| Graduate Degree | 0 (0.0%) | 0 (0.0%) |
| Total | 0 (0.0%) | 0 (0.0%) |
Employment Characteristics in Gilgo
Employment by Class of Employer in Gilgo
Among the 96 employed individuals in Gilgo, state government employees (42 | 43.8%), private company employees (29 | 30.2%), and self-employed (incorporated) (13 | 13.5%) make up the most common classes of employment.
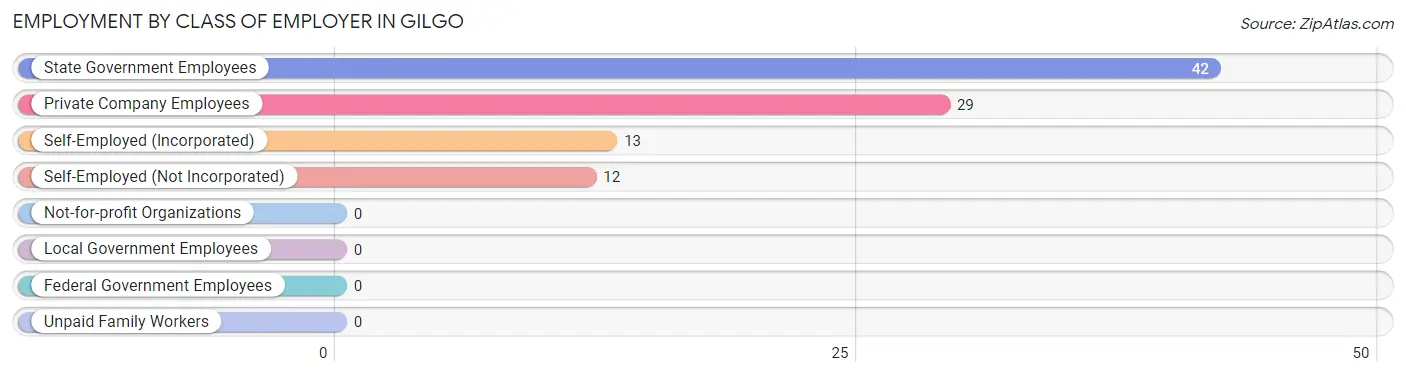
| Employer Class | # Employees | % Employees |
| Private Company Employees | 29 | 30.2% |
| Self-Employed (Incorporated) | 13 | 13.5% |
| Self-Employed (Not Incorporated) | 12 | 12.5% |
| Not-for-profit Organizations | 0 | 0.0% |
| Local Government Employees | 0 | 0.0% |
| State Government Employees | 42 | 43.8% |
| Federal Government Employees | 0 | 0.0% |
| Unpaid Family Workers | 0 | 0.0% |
| Total | 96 | 100.0% |
Employment Status by Age in Gilgo
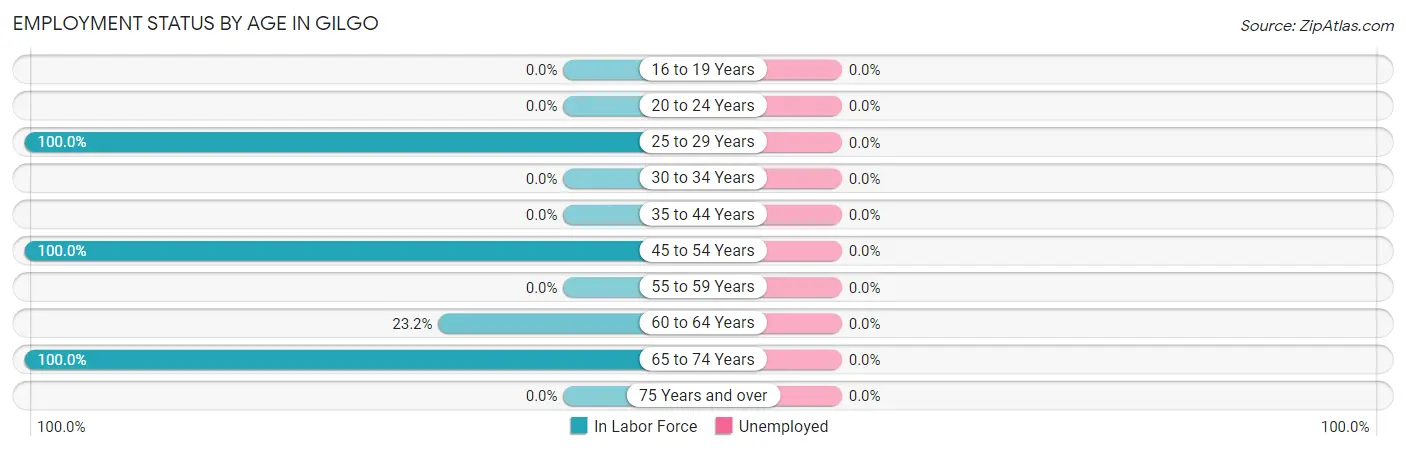
| Age Bracket | In Labor Force | Unemployed |
| 16 to 19 Years | 0 (0.0%) | 0 (0.0%) |
| 20 to 24 Years | 0 (0.0%) | 0 (0.0%) |
| 25 to 29 Years | 42 (100.0%) | 0 (0.0%) |
| 30 to 34 Years | 0 (0.0%) | 0 (0.0%) |
| 35 to 44 Years | 0 (0.0%) | 0 (0.0%) |
| 45 to 54 Years | 12 (100.0%) | 0 (0.0%) |
| 55 to 59 Years | 0 (0.0%) | 0 (0.0%) |
| 60 to 64 Years | 13 (23.2%) | 0 (0.0%) |
| 65 to 74 Years | 29 (100.0%) | 0 (0.0%) |
| 75 Years and over | 0 (0.0%) | 0 (0.0%) |
| Total | 96 (45.9%) | 0 (0.0%) |
Employment Status by Educational Attainment in Gilgo
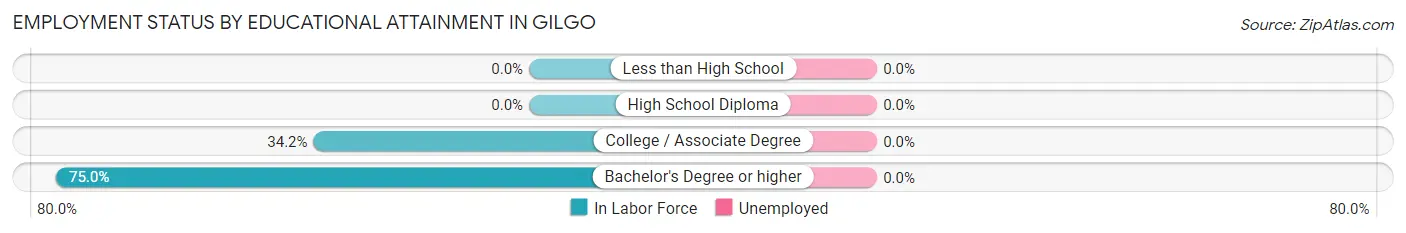
| Educational Attainment | In Labor Force | Unemployed |
| Less than High School | 0 (0.0%) | 0 (0.0%) |
| High School Diploma | 0 (0.0%) | 0 (0.0%) |
| College / Associate Degree | 13 (34.2%) | 0 (0.0%) |
| Bachelor's Degree or higher | 54 (75.0%) | 0 (0.0%) |
| Total | 67 (45.0%) | 0 (0.0%) |
Employment Occupations by Sex in Gilgo
Management, Business, Science and Arts Occupations
The most common Management, Business, Science and Arts occupations in Gilgo are Health Diagnosing & Treating (83 | 86.5%), and Health Technologists (83 | 86.5%).
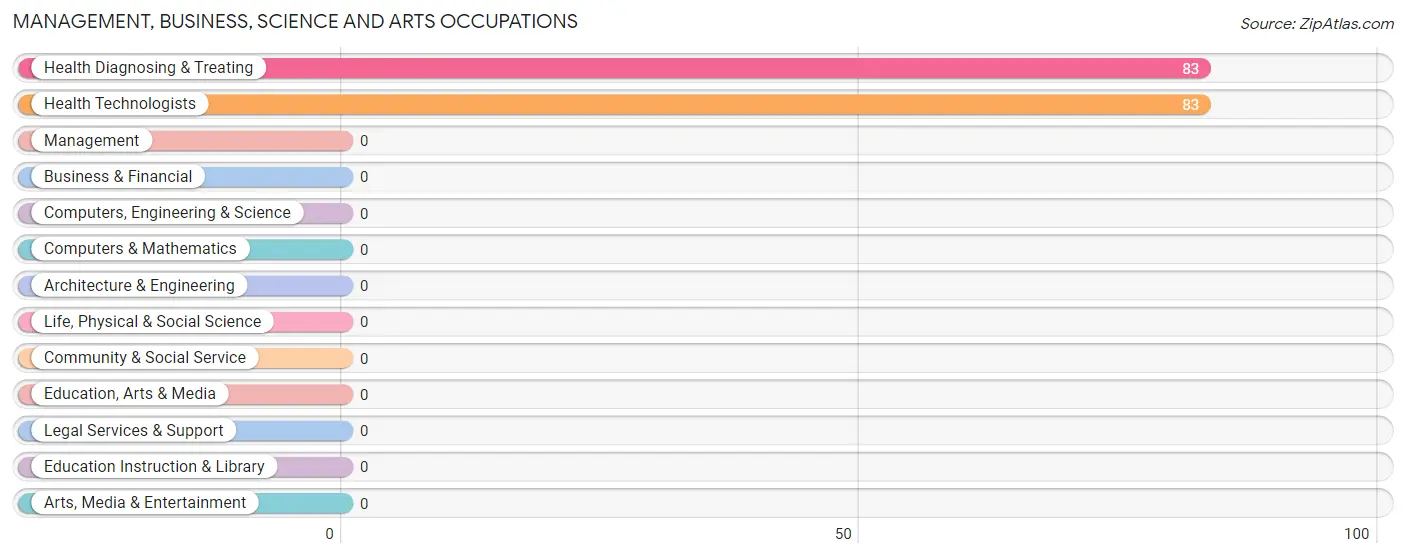
Management, Business, Science and Arts Occupations by Sex
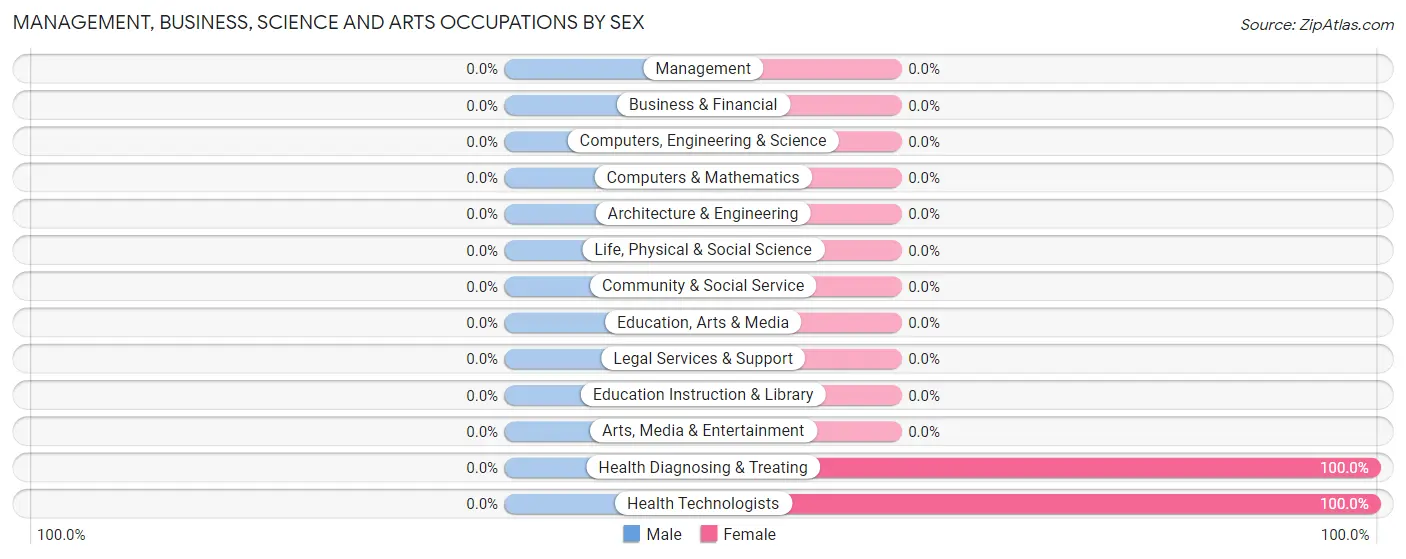
| Occupation | Male | Female |
| Management | 0 (0.0%) | 0 (0.0%) |
| Business & Financial | 0 (0.0%) | 0 (0.0%) |
| Computers, Engineering & Science | 0 (0.0%) | 0 (0.0%) |
| Computers & Mathematics | 0 (0.0%) | 0 (0.0%) |
| Architecture & Engineering | 0 (0.0%) | 0 (0.0%) |
| Life, Physical & Social Science | 0 (0.0%) | 0 (0.0%) |
| Community & Social Service | 0 (0.0%) | 0 (0.0%) |
| Education, Arts & Media | 0 (0.0%) | 0 (0.0%) |
| Legal Services & Support | 0 (0.0%) | 0 (0.0%) |
| Education Instruction & Library | 0 (0.0%) | 0 (0.0%) |
| Arts, Media & Entertainment | 0 (0.0%) | 0 (0.0%) |
| Health Diagnosing & Treating | 0 (0.0%) | 83 (100.0%) |
| Health Technologists | 0 (0.0%) | 83 (100.0%) |
| Total (Category) | 0 (0.0%) | 83 (100.0%) |
| Total (Overall) | 13 (13.5%) | 83 (86.5%) |
Services Occupations
Services Occupations by Sex
| Occupation | Male | Female |
| Healthcare Support | 0 (0.0%) | 0 (0.0%) |
| Security & Protection | 0 (0.0%) | 0 (0.0%) |
| Firefighting & Prevention | 0 (0.0%) | 0 (0.0%) |
| Law Enforcement | 0 (0.0%) | 0 (0.0%) |
| Food Preparation & Serving | 0 (0.0%) | 0 (0.0%) |
| Cleaning & Maintenance | 0 (0.0%) | 0 (0.0%) |
| Personal Care & Service | 0 (0.0%) | 0 (0.0%) |
| Total (Category) | 0 (0.0%) | 0 (0.0%) |
| Total (Overall) | 13 (13.5%) | 83 (86.5%) |
Sales and Office Occupations
The most common Sales and Office occupations in Gilgo are , and Sales & Related (13 | 13.5%).
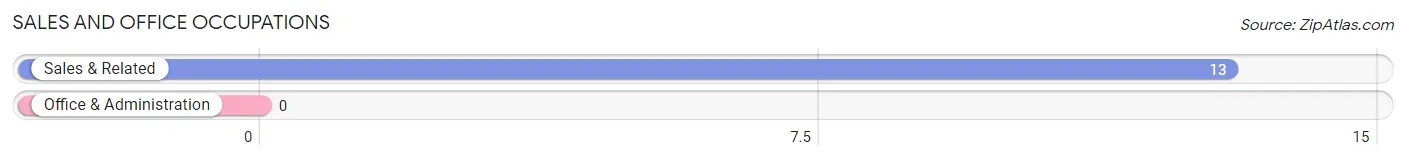
Sales and Office Occupations by Sex
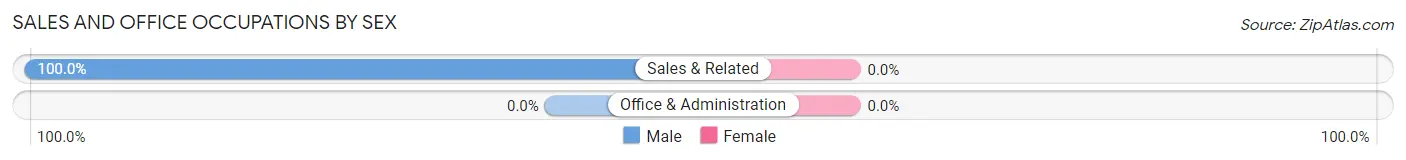
| Occupation | Male | Female |
| Sales & Related | 13 (100.0%) | 0 (0.0%) |
| Office & Administration | 0 (0.0%) | 0 (0.0%) |
| Total (Category) | 13 (100.0%) | 0 (0.0%) |
| Total (Overall) | 13 (13.5%) | 83 (86.5%) |
Natural Resources, Construction and Maintenance Occupations
Natural Resources, Construction and Maintenance Occupations by Sex

| Occupation | Male | Female |
| Farming, Fishing & Forestry | 0 (0.0%) | 0 (0.0%) |
| Construction & Extraction | 0 (0.0%) | 0 (0.0%) |
| Installation, Maintenance & Repair | 0 (0.0%) | 0 (0.0%) |
| Total (Category) | 0 (0.0%) | 0 (0.0%) |
| Total (Overall) | 13 (13.5%) | 83 (86.5%) |
Production, Transportation and Moving Occupations
Production, Transportation and Moving Occupations by Sex
| Occupation | Male | Female |
| Production | 0 (0.0%) | 0 (0.0%) |
| Transportation | 0 (0.0%) | 0 (0.0%) |
| Material Moving | 0 (0.0%) | 0 (0.0%) |
| Total (Category) | 0 (0.0%) | 0 (0.0%) |
| Total (Overall) | 13 (13.5%) | 83 (86.5%) |
Employment Industries by Sex in Gilgo
Employment Industries in Gilgo
The major employment industries in Gilgo include Health Care & Social Assistance (83 | 86.5%), and Information (13 | 13.5%).
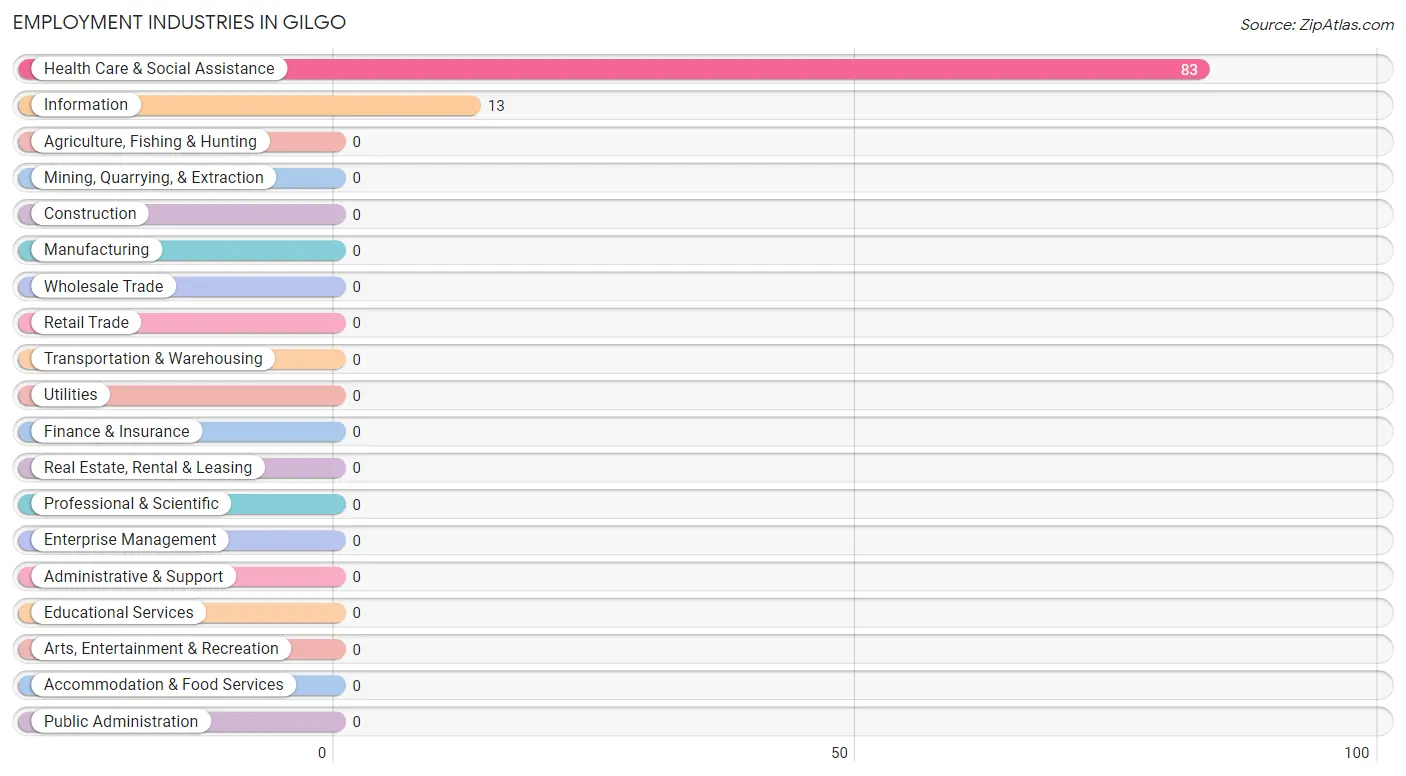
Employment Industries by Sex in Gilgo
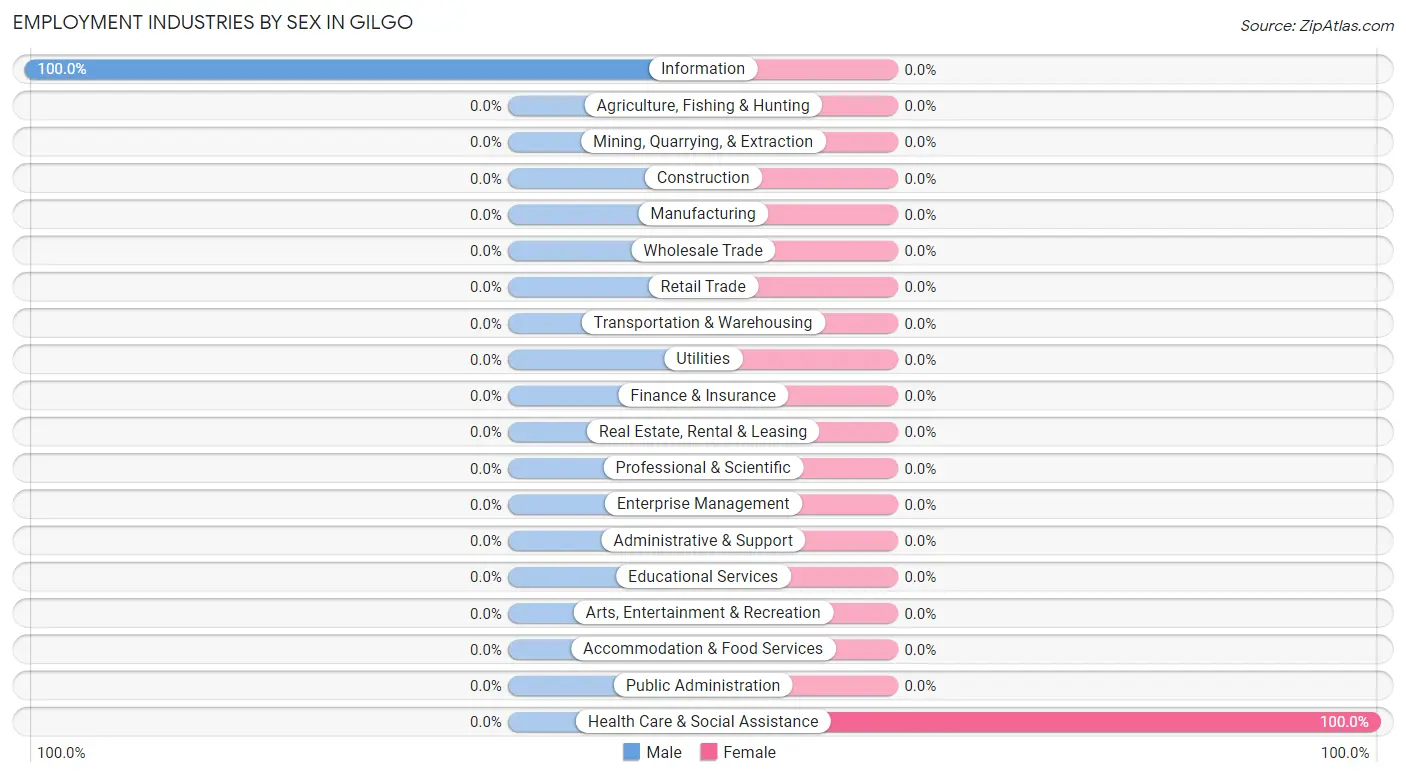
| Industry | Male | Female |
| Agriculture, Fishing & Hunting | 0 (0.0%) | 0 (0.0%) |
| Mining, Quarrying, & Extraction | 0 (0.0%) | 0 (0.0%) |
| Construction | 0 (0.0%) | 0 (0.0%) |
| Manufacturing | 0 (0.0%) | 0 (0.0%) |
| Wholesale Trade | 0 (0.0%) | 0 (0.0%) |
| Retail Trade | 0 (0.0%) | 0 (0.0%) |
| Transportation & Warehousing | 0 (0.0%) | 0 (0.0%) |
| Utilities | 0 (0.0%) | 0 (0.0%) |
| Information | 13 (100.0%) | 0 (0.0%) |
| Finance & Insurance | 0 (0.0%) | 0 (0.0%) |
| Real Estate, Rental & Leasing | 0 (0.0%) | 0 (0.0%) |
| Professional & Scientific | 0 (0.0%) | 0 (0.0%) |
| Enterprise Management | 0 (0.0%) | 0 (0.0%) |
| Administrative & Support | 0 (0.0%) | 0 (0.0%) |
| Educational Services | 0 (0.0%) | 0 (0.0%) |
| Health Care & Social Assistance | 0 (0.0%) | 83 (100.0%) |
| Arts, Entertainment & Recreation | 0 (0.0%) | 0 (0.0%) |
| Accommodation & Food Services | 0 (0.0%) | 0 (0.0%) |
| Public Administration | 0 (0.0%) | 0 (0.0%) |
| Total | 13 (13.5%) | 83 (86.5%) |
Education in Gilgo
School Enrollment in Gilgo
| School Level | # Students | % Students |
| Nursery / Preschool | 0 | 0.0% |
| Kindergarten | 0 | 0.0% |
| Elementary School | 0 | 0.0% |
| Middle School | 0 | 0.0% |
| High School | 0 | 0.0% |
| College / Undergraduate | 0 | 0.0% |
| Graduate / Professional | 0 | 0.0% |
| Total | 0 | 0.0% |
School Enrollment by Age by Funding Source in Gilgo
| Age Bracket | Public School | Private School |
| 3 to 4 Year Olds | 0 (0.0%) | 0 (0.0%) |
| 5 to 9 Year Old | 0 (0.0%) | 0 (0.0%) |
| 10 to 14 Year Olds | 0 (0.0%) | 0 (0.0%) |
| 15 to 17 Year Olds | 0 (0.0%) | 0 (0.0%) |
| 18 to 19 Year Olds | 0 (0.0%) | 0 (0.0%) |
| 20 to 24 Year Olds | 0 (0.0%) | 0 (0.0%) |
| 25 to 34 Year Olds | 0 (0.0%) | 0 (0.0%) |
| 35 Years and over | 0 (0.0%) | 0 (0.0%) |
| Total | 0 (0.0%) | 0 (0.0%) |
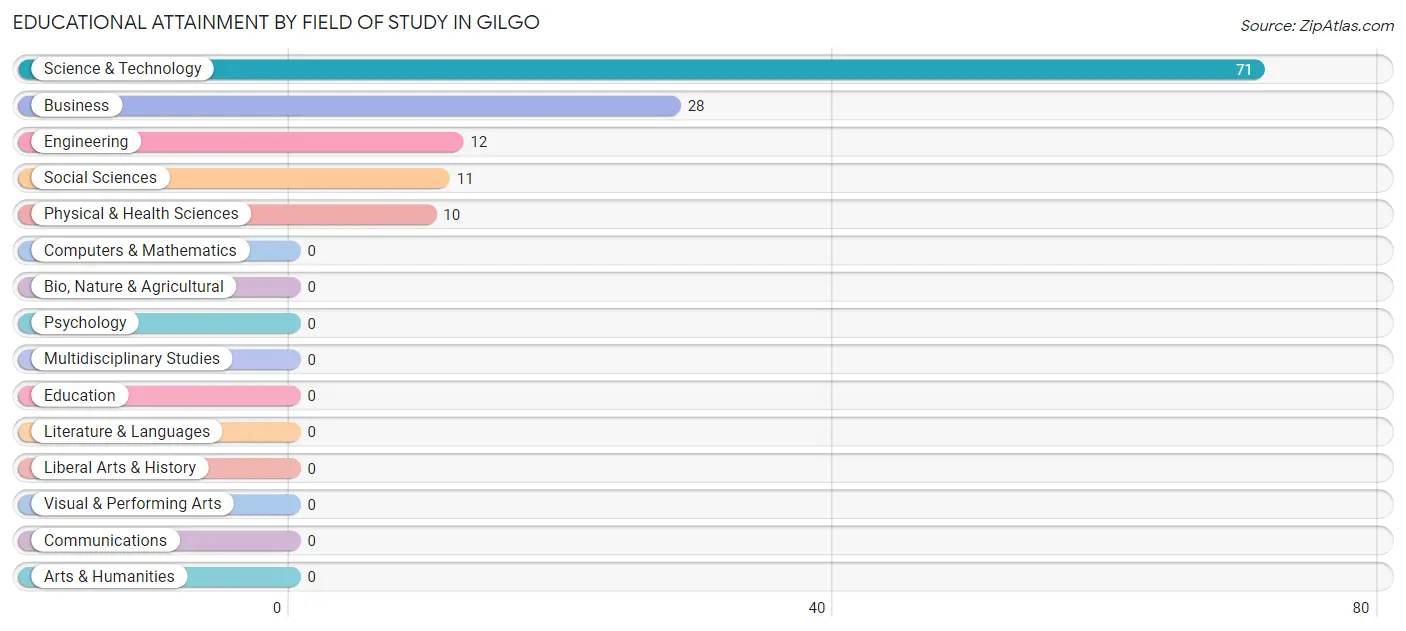
Educational Attainment by Field of Study in Gilgo
Science & technology (71 | 53.8%), business (28 | 21.2%), engineering (12 | 9.1%), social sciences (11 | 8.3%), and physical & health sciences (10 | 7.6%) are the most common fields of study among 132 individuals in Gilgo who have obtained a bachelor's degree or higher.
| Field of Study | # Graduates | % Graduates |
| Computers & Mathematics | 0 | 0.0% |
| Bio, Nature & Agricultural | 0 | 0.0% |
| Physical & Health Sciences | 10 | 7.6% |
| Psychology | 0 | 0.0% |
| Social Sciences | 11 | 8.3% |
| Engineering | 12 | 9.1% |
| Multidisciplinary Studies | 0 | 0.0% |
| Science & Technology | 71 | 53.8% |
| Business | 28 | 21.2% |
| Education | 0 | 0.0% |
| Literature & Languages | 0 | 0.0% |
| Liberal Arts & History | 0 | 0.0% |
| Visual & Performing Arts | 0 | 0.0% |
| Communications | 0 | 0.0% |
| Arts & Humanities | 0 | 0.0% |
| Total | 132 | 100.0% |
Transportation & Commute in Gilgo
Vehicle Availability by Sex in Gilgo
The most prevalent vehicle ownership categories in Gilgo are males with 2 vehicles (13, accounting for 100.0%) and females with 2 vehicles (83, making up 15.7%).
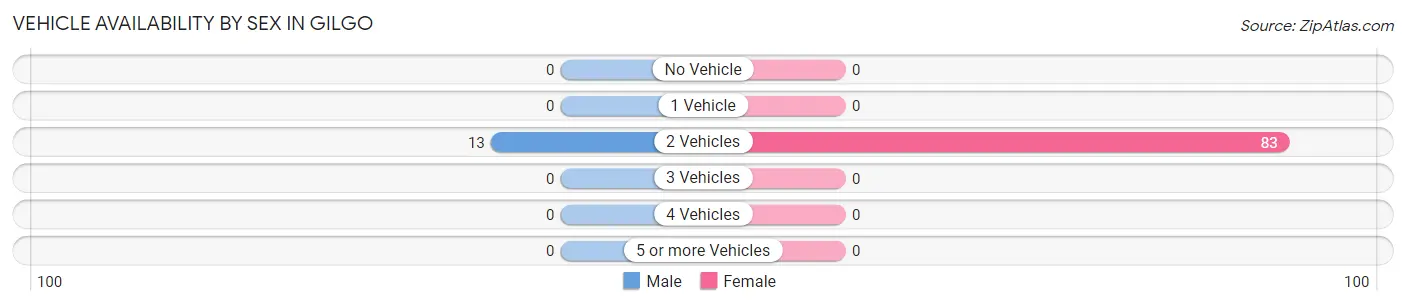
| Vehicles Available | Male | Female |
| No Vehicle | 0 (0.0%) | 0 (0.0%) |
| 1 Vehicle | 0 (0.0%) | 0 (0.0%) |
| 2 Vehicles | 13 (100.0%) | 83 (100.0%) |
| 3 Vehicles | 0 (0.0%) | 0 (0.0%) |
| 4 Vehicles | 0 (0.0%) | 0 (0.0%) |
| 5 or more Vehicles | 0 (0.0%) | 0 (0.0%) |
| Total | 13 (100.0%) | 83 (100.0%) |
Commute Time in Gilgo
The most frequently occuring commute durations in Gilgo are 30 to 34 minutes (84 commuters, 87.5%), 60 to 89 minutes (12 commuters, 12.5%), and less than 5 minutes (0 commuters, 0.0%).
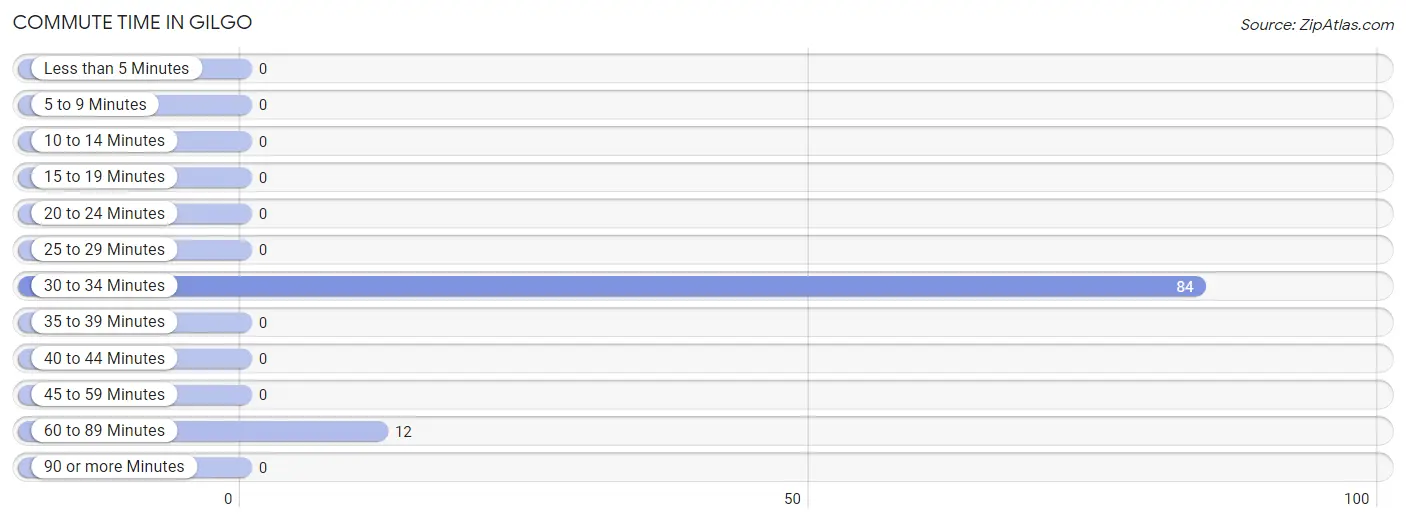
| Commute Time | # Commuters | % Commuters |
| Less than 5 Minutes | 0 | 0.0% |
| 5 to 9 Minutes | 0 | 0.0% |
| 10 to 14 Minutes | 0 | 0.0% |
| 15 to 19 Minutes | 0 | 0.0% |
| 20 to 24 Minutes | 0 | 0.0% |
| 25 to 29 Minutes | 0 | 0.0% |
| 30 to 34 Minutes | 84 | 87.5% |
| 35 to 39 Minutes | 0 | 0.0% |
| 40 to 44 Minutes | 0 | 0.0% |
| 45 to 59 Minutes | 0 | 0.0% |
| 60 to 89 Minutes | 12 | 12.5% |
| 90 or more Minutes | 0 | 0.0% |
Commute Time by Sex in Gilgo
The most common commute times in Gilgo are 30 to 34 minutes (13 commuters, 100.0%) for males and 30 to 34 minutes (71 commuters, 85.5%) for females.
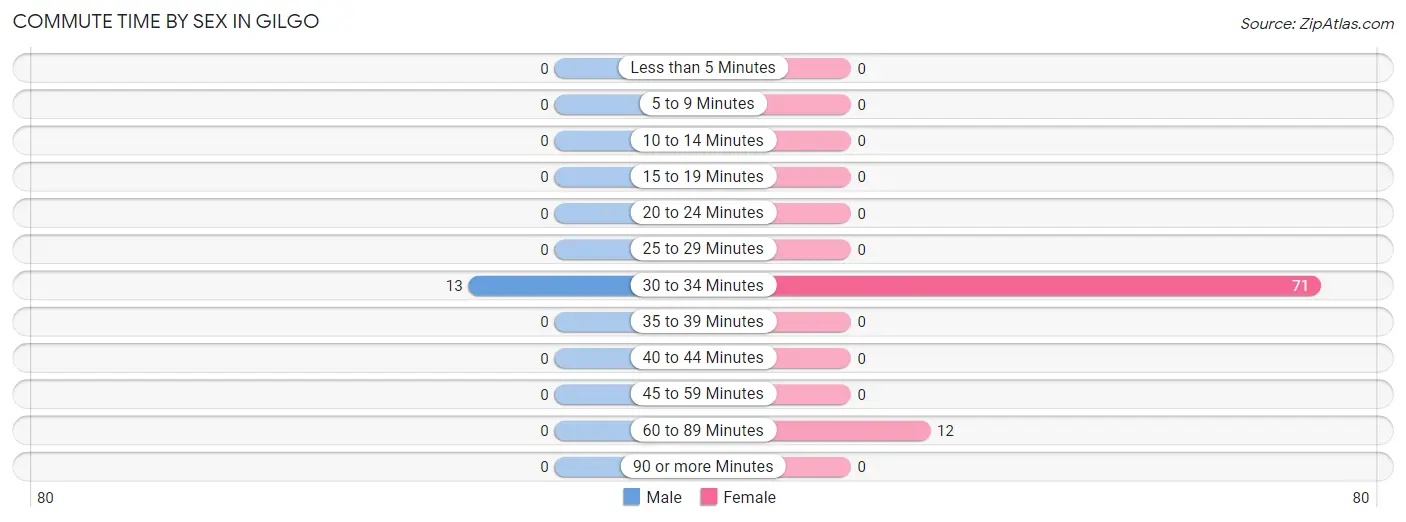
| Commute Time | Male | Female |
| Less than 5 Minutes | 0 (0.0%) | 0 (0.0%) |
| 5 to 9 Minutes | 0 (0.0%) | 0 (0.0%) |
| 10 to 14 Minutes | 0 (0.0%) | 0 (0.0%) |
| 15 to 19 Minutes | 0 (0.0%) | 0 (0.0%) |
| 20 to 24 Minutes | 0 (0.0%) | 0 (0.0%) |
| 25 to 29 Minutes | 0 (0.0%) | 0 (0.0%) |
| 30 to 34 Minutes | 13 (100.0%) | 71 (85.5%) |
| 35 to 39 Minutes | 0 (0.0%) | 0 (0.0%) |
| 40 to 44 Minutes | 0 (0.0%) | 0 (0.0%) |
| 45 to 59 Minutes | 0 (0.0%) | 0 (0.0%) |
| 60 to 89 Minutes | 0 (0.0%) | 12 (14.5%) |
| 90 or more Minutes | 0 (0.0%) | 0 (0.0%) |
Time of Departure to Work by Sex in Gilgo
The most frequent times of departure to work in Gilgo are 10:00 AM to 10:59 AM (13, 100.0%) for males and 4:00 PM to 11:59 PM (42, 50.6%) for females.
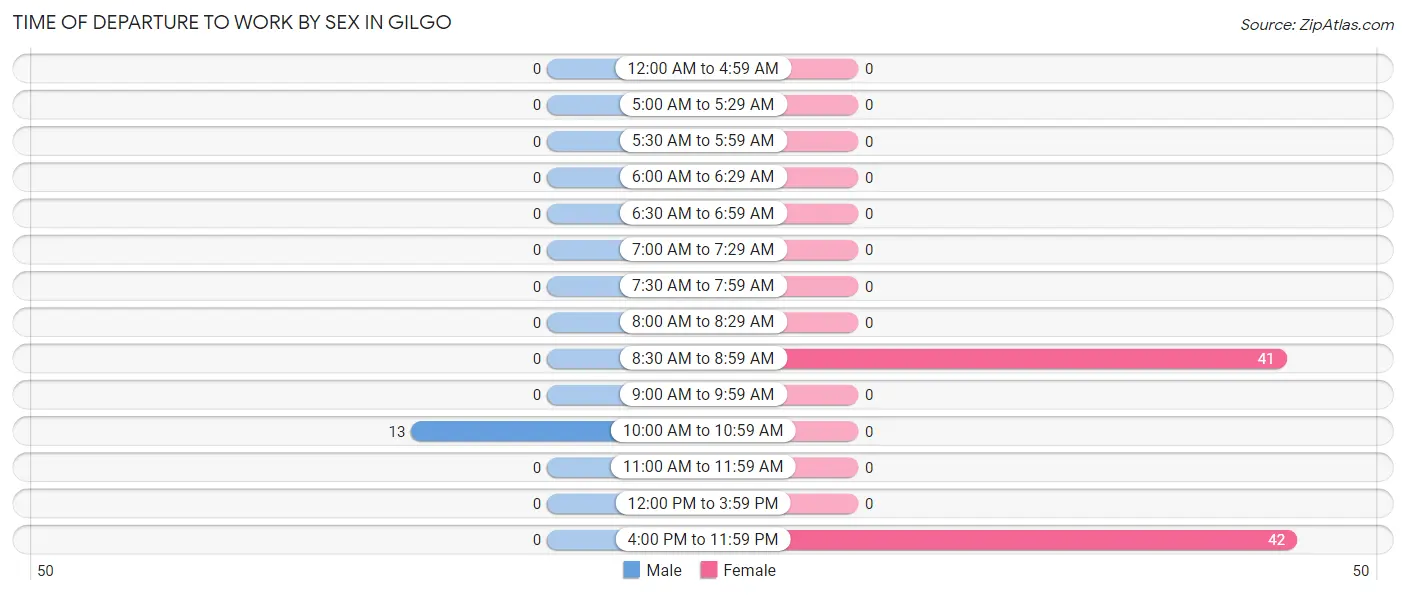
| Time of Departure | Male | Female |
| 12:00 AM to 4:59 AM | 0 (0.0%) | 0 (0.0%) |
| 5:00 AM to 5:29 AM | 0 (0.0%) | 0 (0.0%) |
| 5:30 AM to 5:59 AM | 0 (0.0%) | 0 (0.0%) |
| 6:00 AM to 6:29 AM | 0 (0.0%) | 0 (0.0%) |
| 6:30 AM to 6:59 AM | 0 (0.0%) | 0 (0.0%) |
| 7:00 AM to 7:29 AM | 0 (0.0%) | 0 (0.0%) |
| 7:30 AM to 7:59 AM | 0 (0.0%) | 0 (0.0%) |
| 8:00 AM to 8:29 AM | 0 (0.0%) | 0 (0.0%) |
| 8:30 AM to 8:59 AM | 0 (0.0%) | 41 (49.4%) |
| 9:00 AM to 9:59 AM | 0 (0.0%) | 0 (0.0%) |
| 10:00 AM to 10:59 AM | 13 (100.0%) | 0 (0.0%) |
| 11:00 AM to 11:59 AM | 0 (0.0%) | 0 (0.0%) |
| 12:00 PM to 3:59 PM | 0 (0.0%) | 0 (0.0%) |
| 4:00 PM to 11:59 PM | 0 (0.0%) | 42 (50.6%) |
| Total | 13 (100.0%) | 83 (100.0%) |
Housing Occupancy in Gilgo
Occupancy by Ownership in Gilgo
Of the total 80 dwellings in Gilgo, owner-occupied units account for 80 (100.0%), while renter-occupied units make up 0 (0.0%).
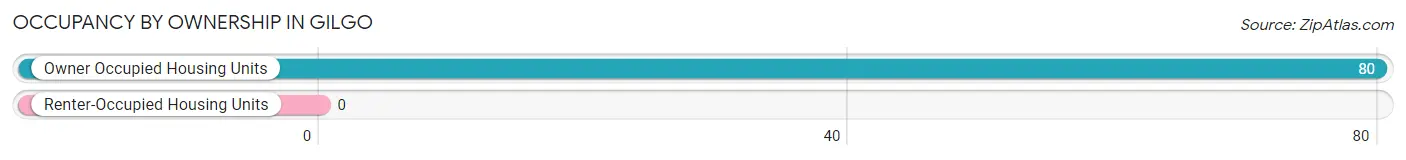
| Occupancy | # Housing Units | % Housing Units |
| Owner Occupied Housing Units | 80 | 100.0% |
| Renter-Occupied Housing Units | 0 | 0.0% |
| Total Occupied Housing Units | 80 | 100.0% |
Occupancy by Household Size in Gilgo
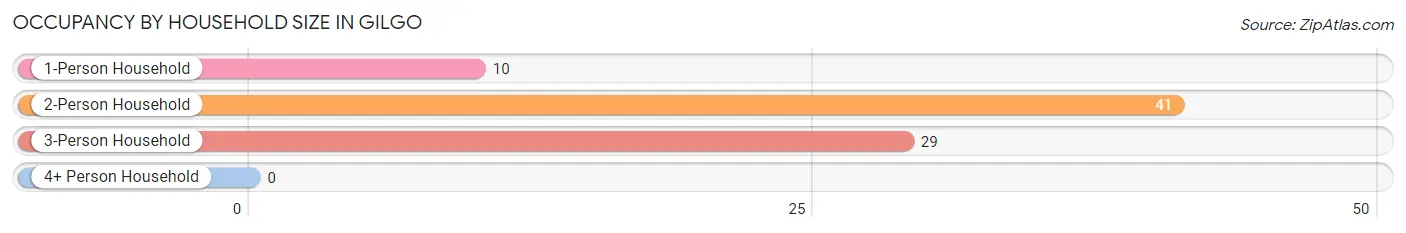
| Household Size | # Housing Units | % Housing Units |
| 1-Person Household | 10 | 12.5% |
| 2-Person Household | 41 | 51.2% |
| 3-Person Household | 29 | 36.2% |
| 4+ Person Household | 0 | 0.0% |
| Total Housing Units | 80 | 100.0% |
Occupancy by Ownership by Household Size in Gilgo
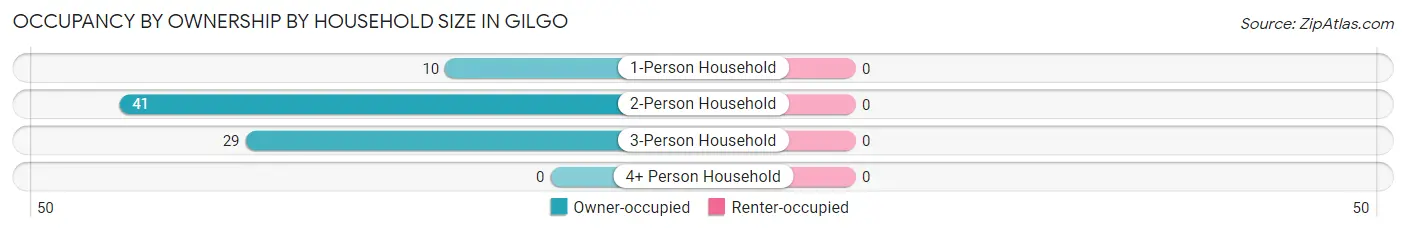
| Household Size | Owner-occupied | Renter-occupied |
| 1-Person Household | 10 (100.0%) | 0 (0.0%) |
| 2-Person Household | 41 (100.0%) | 0 (0.0%) |
| 3-Person Household | 29 (100.0%) | 0 (0.0%) |
| 4+ Person Household | 0 (0.0%) | 0 (0.0%) |
| Total Housing Units | 80 (100.0%) | 0 (0.0%) |
Occupancy by Educational Attainment in Gilgo
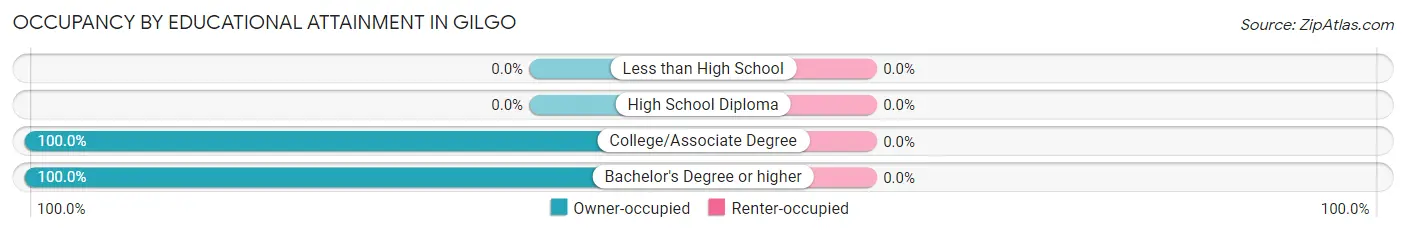
| Household Size | Owner-occupied | Renter-occupied |
| Less than High School | 0 (0.0%) | 0 (0.0%) |
| High School Diploma | 0 (0.0%) | 0 (0.0%) |
| College/Associate Degree | 13 (100.0%) | 0 (0.0%) |
| Bachelor's Degree or higher | 67 (100.0%) | 0 (0.0%) |
Occupancy by Age of Householder in Gilgo
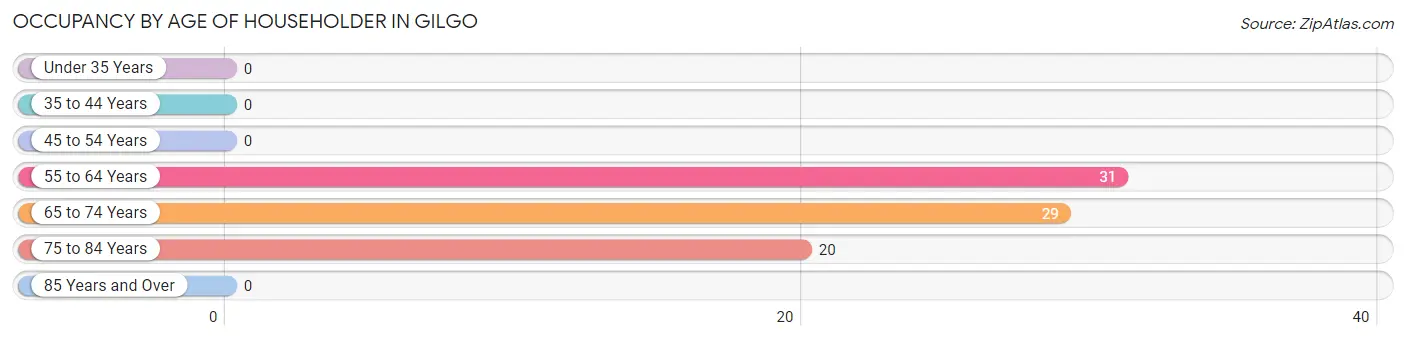
| Age Bracket | # Households | % Households |
| Under 35 Years | 0 | 0.0% |
| 35 to 44 Years | 0 | 0.0% |
| 45 to 54 Years | 0 | 0.0% |
| 55 to 64 Years | 31 | 38.8% |
| 65 to 74 Years | 29 | 36.2% |
| 75 to 84 Years | 20 | 25.0% |
| 85 Years and Over | 0 | 0.0% |
| Total | 80 | 100.0% |
Housing Finances in Gilgo
Median Income by Occupancy in Gilgo
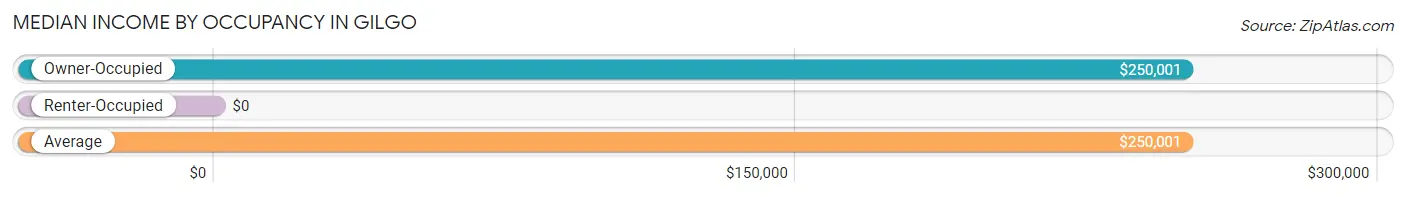
| Occupancy Type | # Households | Median Income |
| Owner-Occupied | 80 (100.0%) | $250,001 |
| Renter-Occupied | 0 (0.0%) | $0 |
| Average | 80 (100.0%) | $250,001 |
Occupancy by Householder Income Bracket in Gilgo
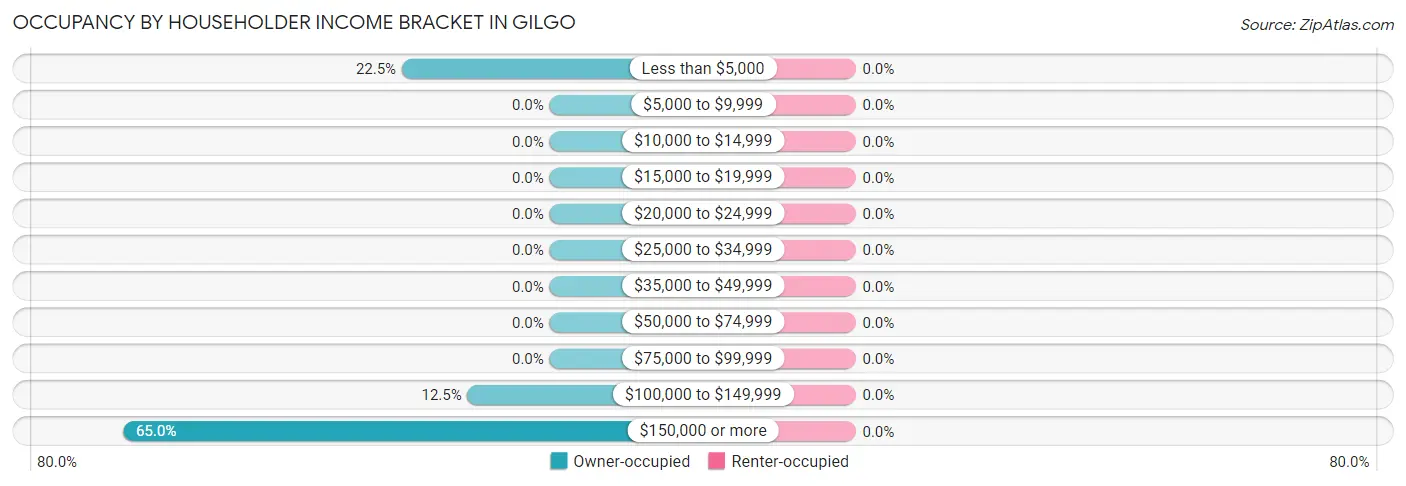
| Income Bracket | Owner-occupied | Renter-occupied |
| Less than $5,000 | 18 (22.5%) | 0 (0.0%) |
| $5,000 to $9,999 | 0 (0.0%) | 0 (0.0%) |
| $10,000 to $14,999 | 0 (0.0%) | 0 (0.0%) |
| $15,000 to $19,999 | 0 (0.0%) | 0 (0.0%) |
| $20,000 to $24,999 | 0 (0.0%) | 0 (0.0%) |
| $25,000 to $34,999 | 0 (0.0%) | 0 (0.0%) |
| $35,000 to $49,999 | 0 (0.0%) | 0 (0.0%) |
| $50,000 to $74,999 | 0 (0.0%) | 0 (0.0%) |
| $75,000 to $99,999 | 0 (0.0%) | 0 (0.0%) |
| $100,000 to $149,999 | 10 (12.5%) | 0 (0.0%) |
| $150,000 or more | 52 (65.0%) | 0 (0.0%) |
| Total | 80 (100.0%) | 0 (0.0%) |
Monthly Housing Cost Tiers in Gilgo
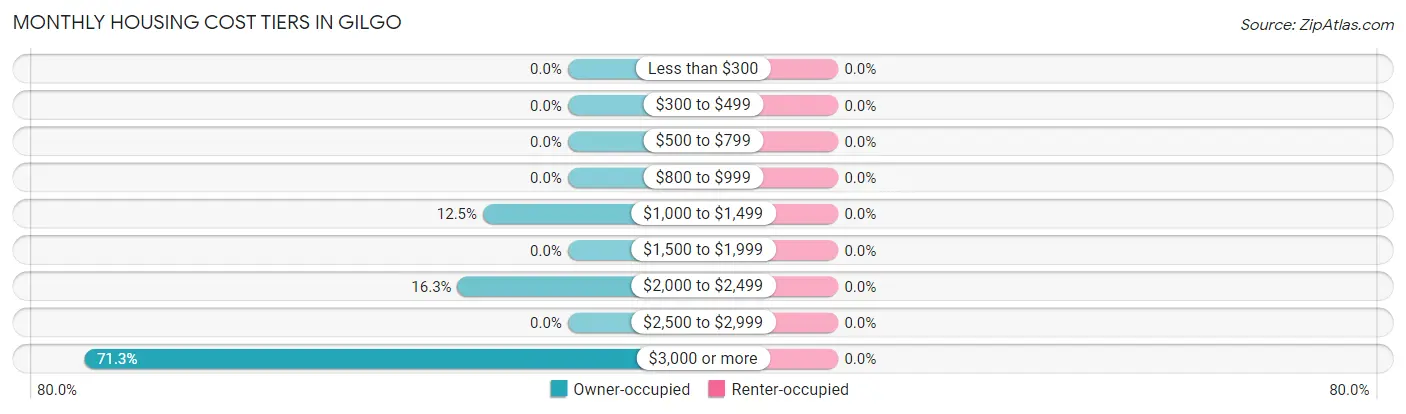
| Monthly Cost | Owner-occupied | Renter-occupied |
| Less than $300 | 0 (0.0%) | 0 (0.0%) |
| $300 to $499 | 0 (0.0%) | 0 (0.0%) |
| $500 to $799 | 0 (0.0%) | 0 (0.0%) |
| $800 to $999 | 0 (0.0%) | 0 (0.0%) |
| $1,000 to $1,499 | 10 (12.5%) | 0 (0.0%) |
| $1,500 to $1,999 | 0 (0.0%) | 0 (0.0%) |
| $2,000 to $2,499 | 13 (16.3%) | 0 (0.0%) |
| $2,500 to $2,999 | 0 (0.0%) | 0 (0.0%) |
| $3,000 or more | 57 (71.3%) | 0 (0.0%) |
| Total | 80 (100.0%) | 0 (0.0%) |
Physical Housing Characteristics in Gilgo
Housing Structures in Gilgo
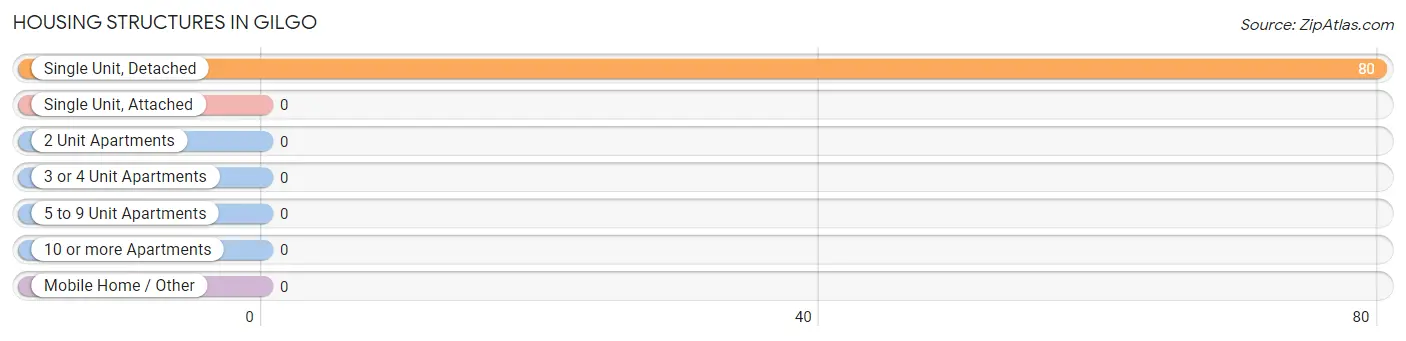
| Structure Type | # Housing Units | % Housing Units |
| Single Unit, Detached | 80 | 100.0% |
| Single Unit, Attached | 0 | 0.0% |
| 2 Unit Apartments | 0 | 0.0% |
| 3 or 4 Unit Apartments | 0 | 0.0% |
| 5 to 9 Unit Apartments | 0 | 0.0% |
| 10 or more Apartments | 0 | 0.0% |
| Mobile Home / Other | 0 | 0.0% |
| Total | 80 | 100.0% |
Housing Structures by Occupancy in Gilgo
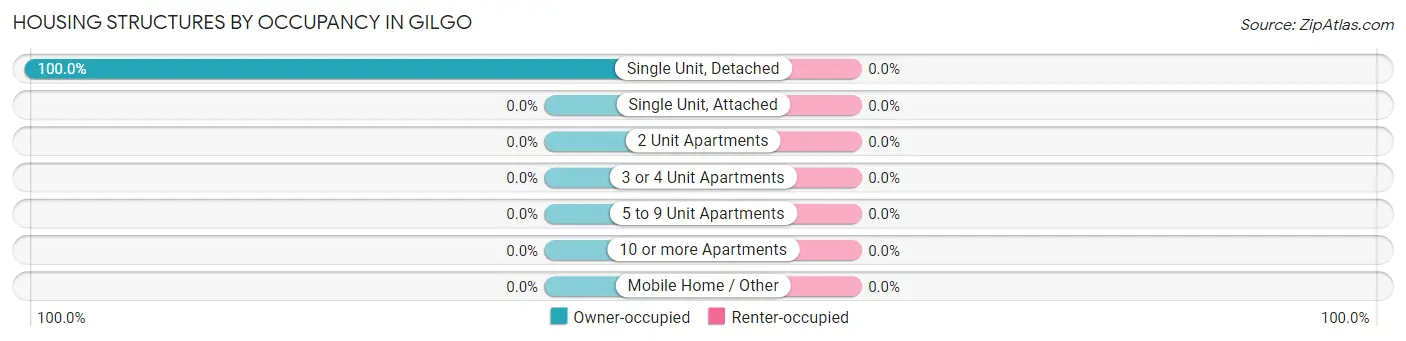
| Structure Type | Owner-occupied | Renter-occupied |
| Single Unit, Detached | 80 (100.0%) | 0 (0.0%) |
| Single Unit, Attached | 0 (0.0%) | 0 (0.0%) |
| 2 Unit Apartments | 0 (0.0%) | 0 (0.0%) |
| 3 or 4 Unit Apartments | 0 (0.0%) | 0 (0.0%) |
| 5 to 9 Unit Apartments | 0 (0.0%) | 0 (0.0%) |
| 10 or more Apartments | 0 (0.0%) | 0 (0.0%) |
| Mobile Home / Other | 0 (0.0%) | 0 (0.0%) |
| Total | 80 (100.0%) | 0 (0.0%) |
Housing Structures by Number of Rooms in Gilgo
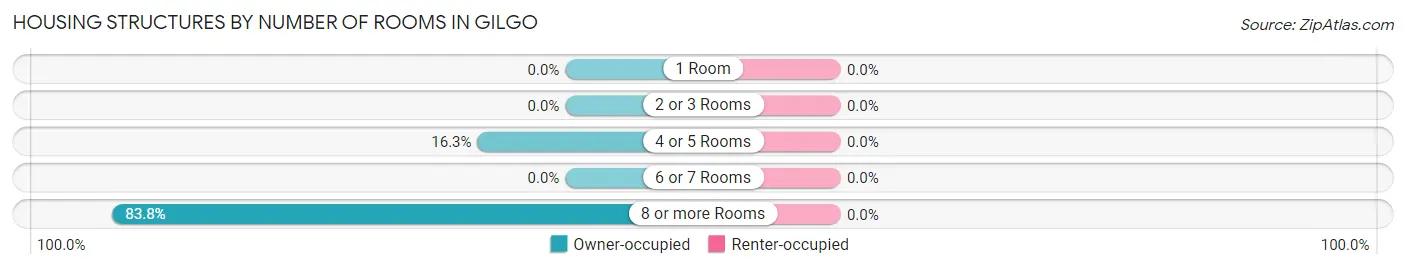
| Number of Rooms | Owner-occupied | Renter-occupied |
| 1 Room | 0 (0.0%) | 0 (0.0%) |
| 2 or 3 Rooms | 0 (0.0%) | 0 (0.0%) |
| 4 or 5 Rooms | 13 (16.3%) | 0 (0.0%) |
| 6 or 7 Rooms | 0 (0.0%) | 0 (0.0%) |
| 8 or more Rooms | 67 (83.8%) | 0 (0.0%) |
| Total | 80 (100.0%) | 0 (0.0%) |
Housing Structure by Heating Type in Gilgo
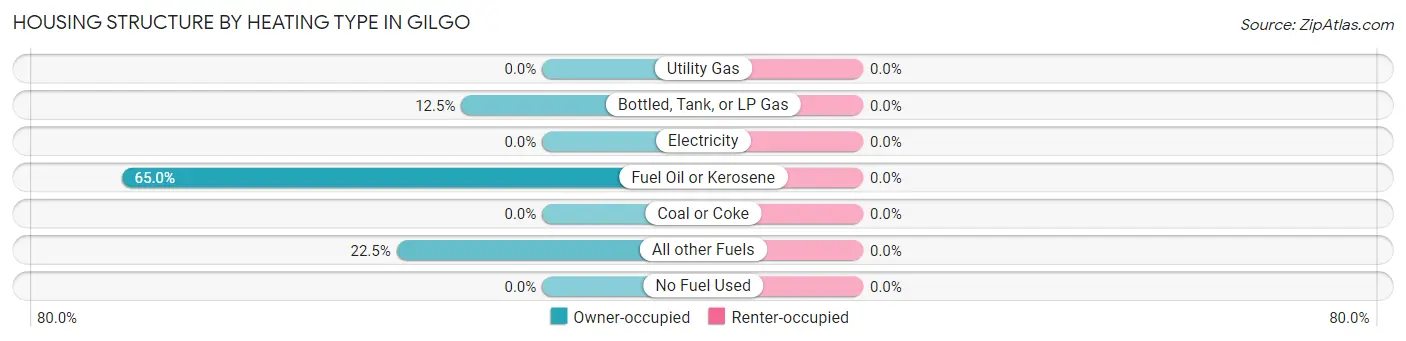
| Heating Type | Owner-occupied | Renter-occupied |
| Utility Gas | 0 (0.0%) | 0 (0.0%) |
| Bottled, Tank, or LP Gas | 10 (12.5%) | 0 (0.0%) |
| Electricity | 0 (0.0%) | 0 (0.0%) |
| Fuel Oil or Kerosene | 52 (65.0%) | 0 (0.0%) |
| Coal or Coke | 0 (0.0%) | 0 (0.0%) |
| All other Fuels | 18 (22.5%) | 0 (0.0%) |
| No Fuel Used | 0 (0.0%) | 0 (0.0%) |
| Total | 80 (100.0%) | 0 (0.0%) |
Household Vehicle Usage in Gilgo
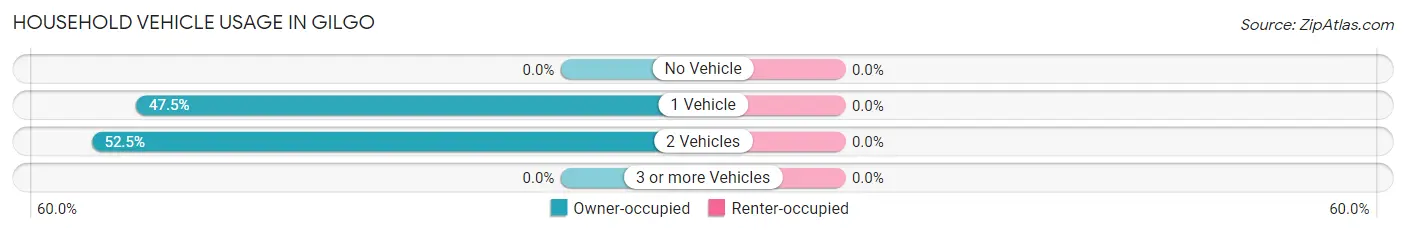
| Vehicles per Household | Owner-occupied | Renter-occupied |
| No Vehicle | 0 (0.0%) | 0 (0.0%) |
| 1 Vehicle | 38 (47.5%) | 0 (0.0%) |
| 2 Vehicles | 42 (52.5%) | 0 (0.0%) |
| 3 or more Vehicles | 0 (0.0%) | 0 (0.0%) |
| Total | 80 (100.0%) | 0 (0.0%) |
Real Estate & Mortgages in Gilgo
Real Estate and Mortgage Overview in Gilgo
| Characteristic | Without Mortgage | With Mortgage |
| Housing Units | 33 | 47 |
| Median Property Value | $875,000 | $0 |
| Median Household Income | $250,001 | $29 |
| Monthly Housing Costs | $1,501 | $47 |
| Real Estate Taxes | $10,001 | $0 |
Property Value by Mortgage Status in Gilgo
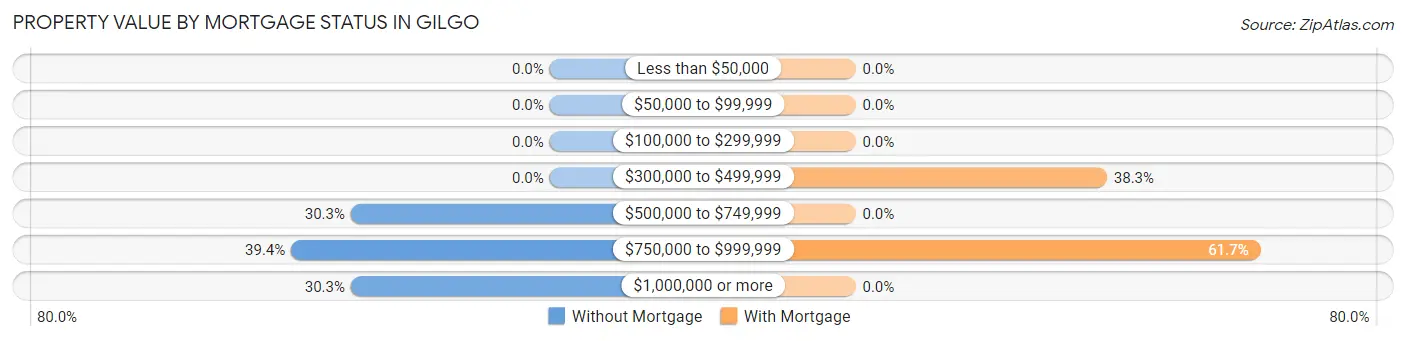
| Property Value | Without Mortgage | With Mortgage |
| Less than $50,000 | 0 (0.0%) | 0 (0.0%) |
| $50,000 to $99,999 | 0 (0.0%) | 0 (0.0%) |
| $100,000 to $299,999 | 0 (0.0%) | 0 (0.0%) |
| $300,000 to $499,999 | 0 (0.0%) | 18 (38.3%) |
| $500,000 to $749,999 | 10 (30.3%) | 0 (0.0%) |
| $750,000 to $999,999 | 13 (39.4%) | 29 (61.7%) |
| $1,000,000 or more | 10 (30.3%) | 0 (0.0%) |
| Total | 33 (100.0%) | 47 (100.0%) |
Household Income by Mortgage Status in Gilgo
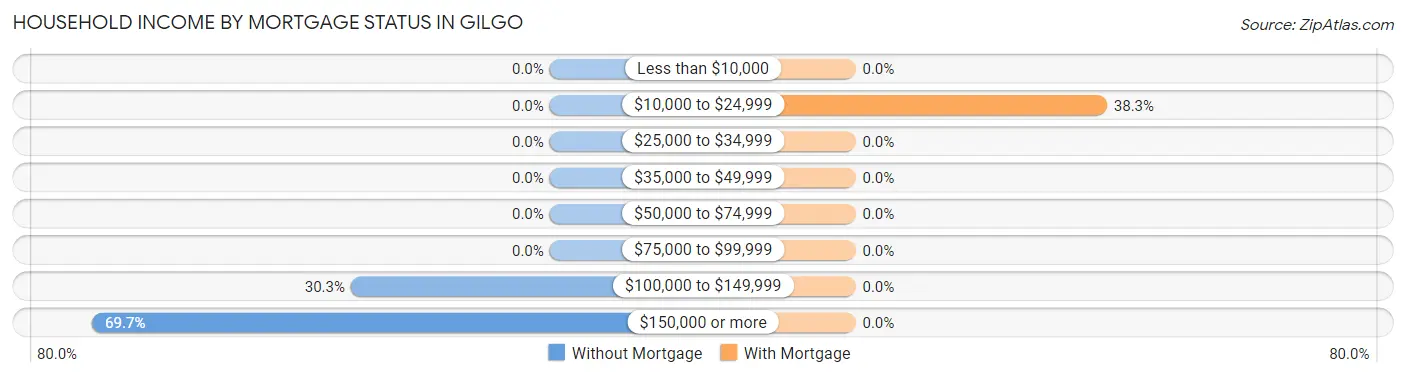
| Household Income | Without Mortgage | With Mortgage |
| Less than $10,000 | 0 (0.0%) | 0 (0.0%) |
| $10,000 to $24,999 | 0 (0.0%) | 18 (38.3%) |
| $25,000 to $34,999 | 0 (0.0%) | 0 (0.0%) |
| $35,000 to $49,999 | 0 (0.0%) | 0 (0.0%) |
| $50,000 to $74,999 | 0 (0.0%) | 0 (0.0%) |
| $75,000 to $99,999 | 0 (0.0%) | 0 (0.0%) |
| $100,000 to $149,999 | 10 (30.3%) | 0 (0.0%) |
| $150,000 or more | 23 (69.7%) | 0 (0.0%) |
| Total | 33 (100.0%) | 47 (100.0%) |
Property Value to Household Income Ratio in Gilgo
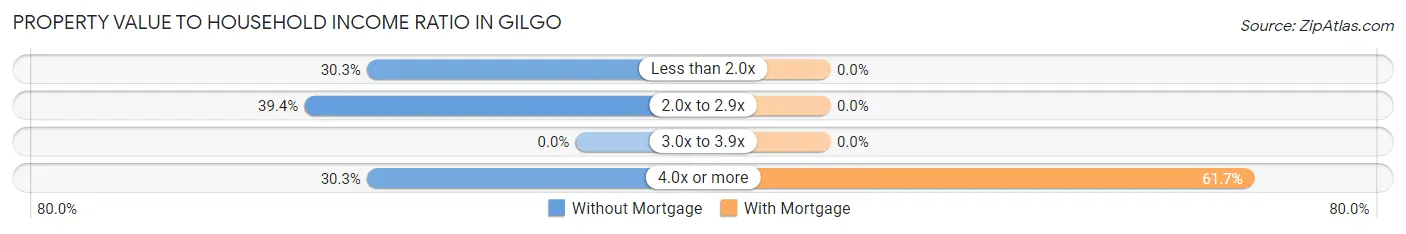
| Value-to-Income Ratio | Without Mortgage | With Mortgage |
| Less than 2.0x | 10 (30.3%) | 0 (0.0%) |
| 2.0x to 2.9x | 13 (39.4%) | 0 (0.0%) |
| 3.0x to 3.9x | 0 (0.0%) | 0 (0.0%) |
| 4.0x or more | 10 (30.3%) | 29 (61.7%) |
| Total | 33 (100.0%) | 47 (100.0%) |
Real Estate Taxes by Mortgage Status in Gilgo
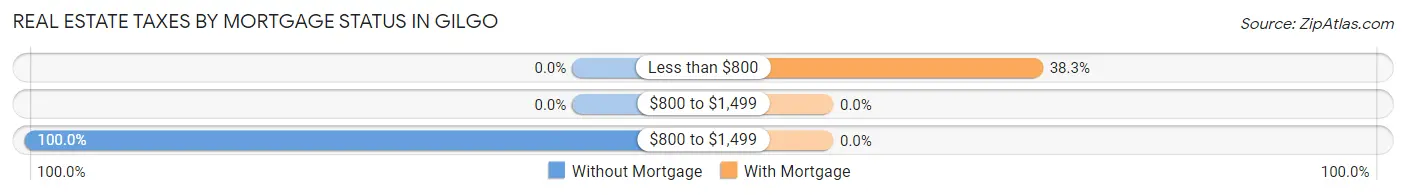
| Property Taxes | Without Mortgage | With Mortgage |
| Less than $800 | 0 (0.0%) | 18 (38.3%) |
| $800 to $1,499 | 0 (0.0%) | 0 (0.0%) |
| $800 to $1,499 | 33 (100.0%) | 0 (0.0%) |
| Total | 33 (100.0%) | 47 (100.0%) |
Health & Disability in Gilgo
Health Insurance Coverage by Age in Gilgo
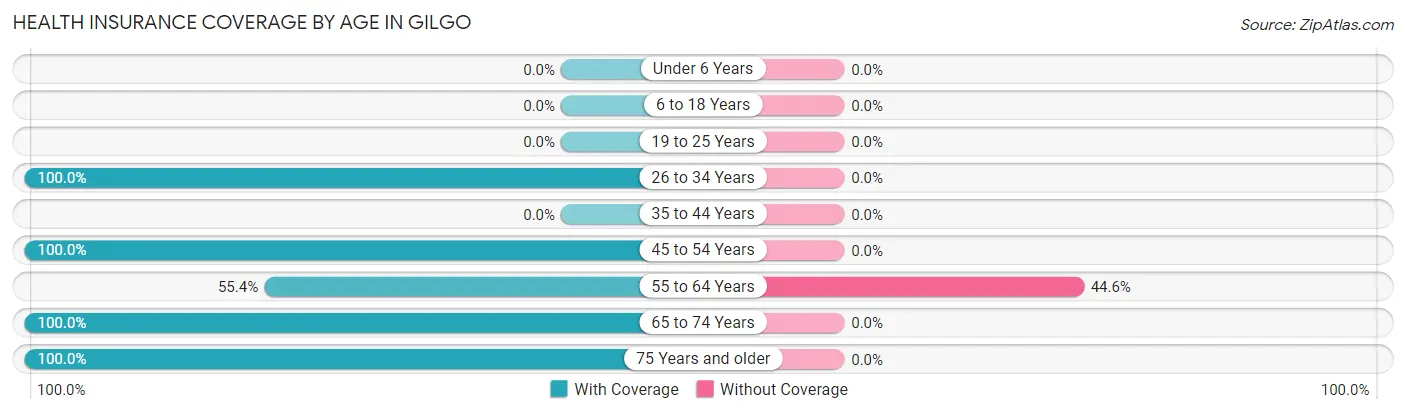
| Age Bracket | With Coverage | Without Coverage |
| Under 6 Years | 0 (0.0%) | 0 (0.0%) |
| 6 to 18 Years | 0 (0.0%) | 0 (0.0%) |
| 19 to 25 Years | 0 (0.0%) | 0 (0.0%) |
| 26 to 34 Years | 81 (100.0%) | 0 (0.0%) |
| 35 to 44 Years | 0 (0.0%) | 0 (0.0%) |
| 45 to 54 Years | 12 (100.0%) | 0 (0.0%) |
| 55 to 64 Years | 31 (55.4%) | 25 (44.6%) |
| 65 to 74 Years | 29 (100.0%) | 0 (0.0%) |
| 75 Years and older | 31 (100.0%) | 0 (0.0%) |
| Total | 184 (88.0%) | 25 (12.0%) |
Health Insurance Coverage by Citizenship Status in Gilgo
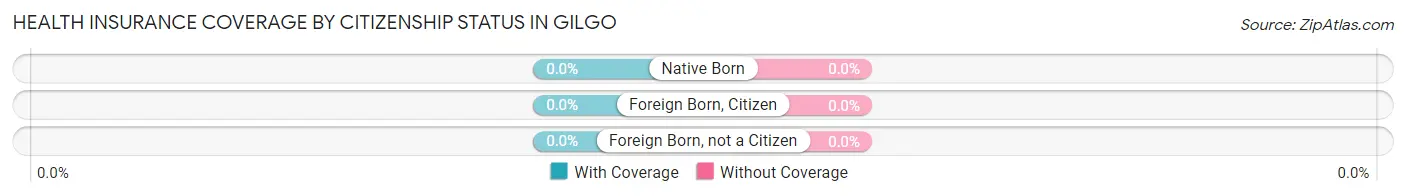
| Citizenship Status | With Coverage | Without Coverage |
| Native Born | 0 (0.0%) | 0 (0.0%) |
| Foreign Born, Citizen | 0 (0.0%) | 0 (0.0%) |
| Foreign Born, not a Citizen | 0 (0.0%) | 0 (0.0%) |
Health Insurance Coverage by Household Income in Gilgo
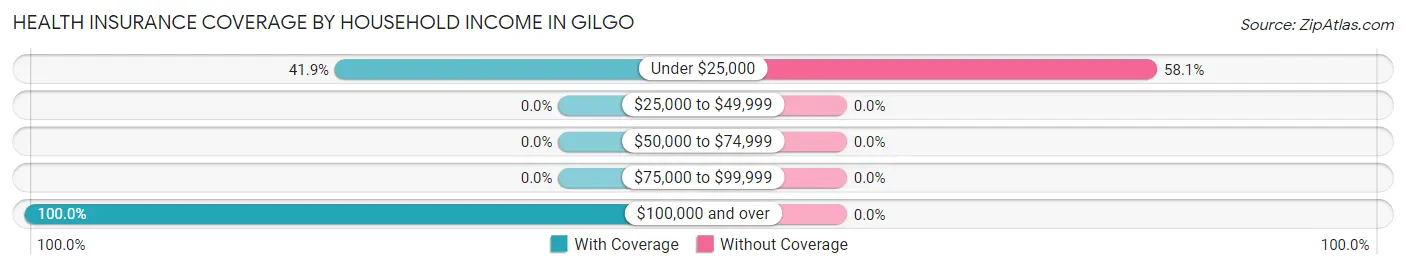
| Household Income | With Coverage | Without Coverage |
| Under $25,000 | 18 (41.9%) | 25 (58.1%) |
| $25,000 to $49,999 | 0 (0.0%) | 0 (0.0%) |
| $50,000 to $74,999 | 0 (0.0%) | 0 (0.0%) |
| $75,000 to $99,999 | 0 (0.0%) | 0 (0.0%) |
| $100,000 and over | 166 (100.0%) | 0 (0.0%) |
Public vs Private Health Insurance Coverage by Age in Gilgo
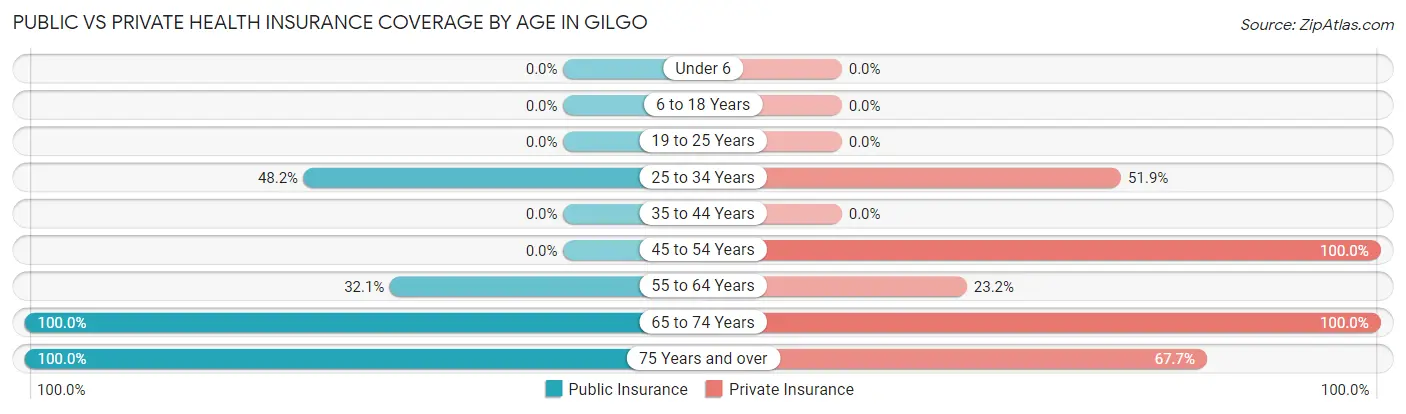
| Age Bracket | Public Insurance | Private Insurance |
| Under 6 | 0 (0.0%) | 0 (0.0%) |
| 6 to 18 Years | 0 (0.0%) | 0 (0.0%) |
| 19 to 25 Years | 0 (0.0%) | 0 (0.0%) |
| 25 to 34 Years | 39 (48.1%) | 42 (51.8%) |
| 35 to 44 Years | 0 (0.0%) | 0 (0.0%) |
| 45 to 54 Years | 0 (0.0%) | 12 (100.0%) |
| 55 to 64 Years | 18 (32.1%) | 13 (23.2%) |
| 65 to 74 Years | 29 (100.0%) | 29 (100.0%) |
| 75 Years and over | 31 (100.0%) | 21 (67.7%) |
| Total | 117 (56.0%) | 117 (56.0%) |
Disability Status by Sex by Age in Gilgo
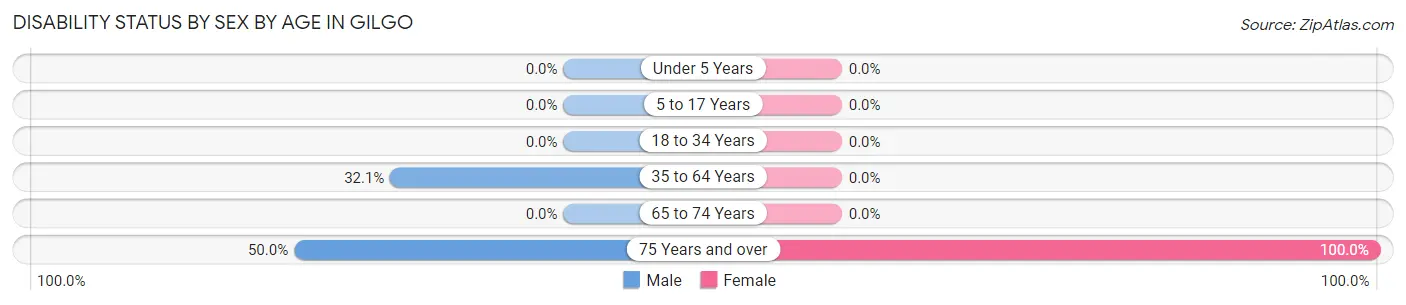
| Age Bracket | Male | Female |
| Under 5 Years | 0 (0.0%) | 0 (0.0%) |
| 5 to 17 Years | 0 (0.0%) | 0 (0.0%) |
| 18 to 34 Years | 0 (0.0%) | 0 (0.0%) |
| 35 to 64 Years | 18 (32.1%) | 0 (0.0%) |
| 65 to 74 Years | 0 (0.0%) | 0 (0.0%) |
| 75 Years and over | 10 (50.0%) | 11 (100.0%) |
Disability Class by Sex by Age in Gilgo
Disability Class: Hearing Difficulty
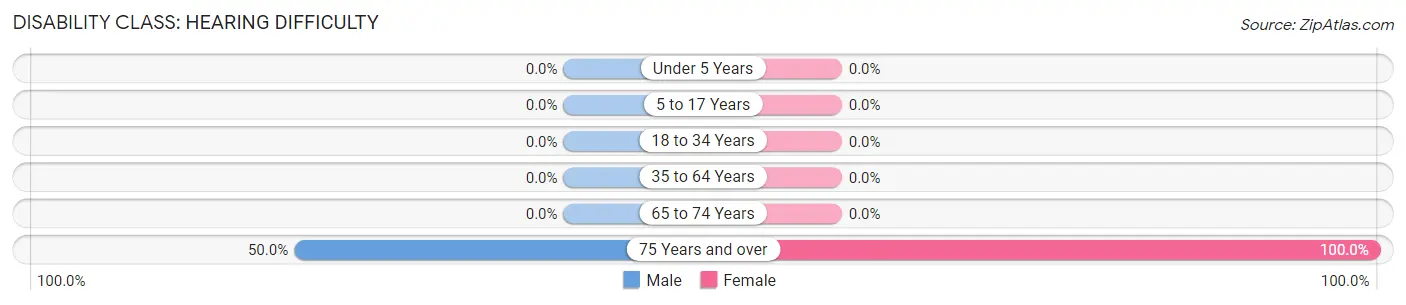
| Age Bracket | Male | Female |
| Under 5 Years | 0 (0.0%) | 0 (0.0%) |
| 5 to 17 Years | 0 (0.0%) | 0 (0.0%) |
| 18 to 34 Years | 0 (0.0%) | 0 (0.0%) |
| 35 to 64 Years | 0 (0.0%) | 0 (0.0%) |
| 65 to 74 Years | 0 (0.0%) | 0 (0.0%) |
| 75 Years and over | 10 (50.0%) | 11 (100.0%) |
Disability Class: Vision Difficulty
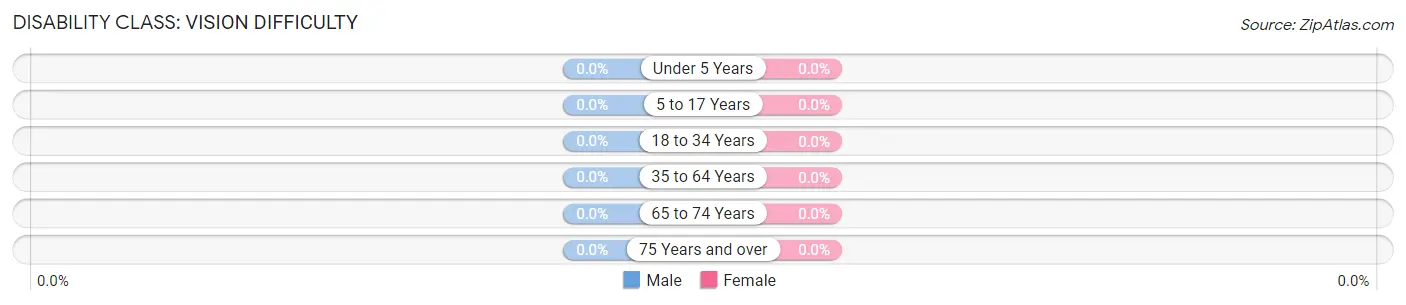
| Age Bracket | Male | Female |
| Under 5 Years | 0 (0.0%) | 0 (0.0%) |
| 5 to 17 Years | 0 (0.0%) | 0 (0.0%) |
| 18 to 34 Years | 0 (0.0%) | 0 (0.0%) |
| 35 to 64 Years | 0 (0.0%) | 0 (0.0%) |
| 65 to 74 Years | 0 (0.0%) | 0 (0.0%) |
| 75 Years and over | 0 (0.0%) | 0 (0.0%) |
Disability Class: Cognitive Difficulty
| Age Bracket | Male | Female |
| 5 to 17 Years | 0 (0.0%) | 0 (0.0%) |
| 18 to 34 Years | 0 (0.0%) | 0 (0.0%) |
| 35 to 64 Years | 0 (0.0%) | 0 (0.0%) |
| 65 to 74 Years | 0 (0.0%) | 0 (0.0%) |
| 75 Years and over | 0 (0.0%) | 0 (0.0%) |
Disability Class: Ambulatory Difficulty
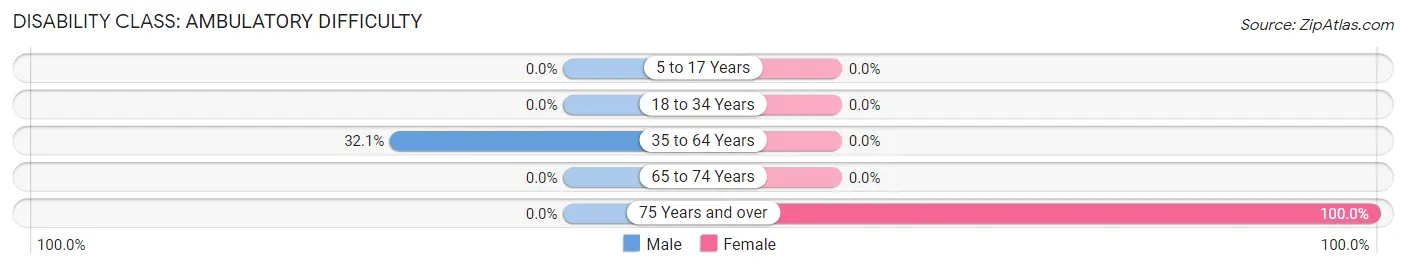
| Age Bracket | Male | Female |
| 5 to 17 Years | 0 (0.0%) | 0 (0.0%) |
| 18 to 34 Years | 0 (0.0%) | 0 (0.0%) |
| 35 to 64 Years | 18 (32.1%) | 0 (0.0%) |
| 65 to 74 Years | 0 (0.0%) | 0 (0.0%) |
| 75 Years and over | 0 (0.0%) | 11 (100.0%) |
Disability Class: Self-Care Difficulty

| Age Bracket | Male | Female |
| 5 to 17 Years | 0 (0.0%) | 0 (0.0%) |
| 18 to 34 Years | 0 (0.0%) | 0 (0.0%) |
| 35 to 64 Years | 0 (0.0%) | 0 (0.0%) |
| 65 to 74 Years | 0 (0.0%) | 0 (0.0%) |
| 75 Years and over | 0 (0.0%) | 0 (0.0%) |
Technology Access in Gilgo
Computing Device Access in Gilgo
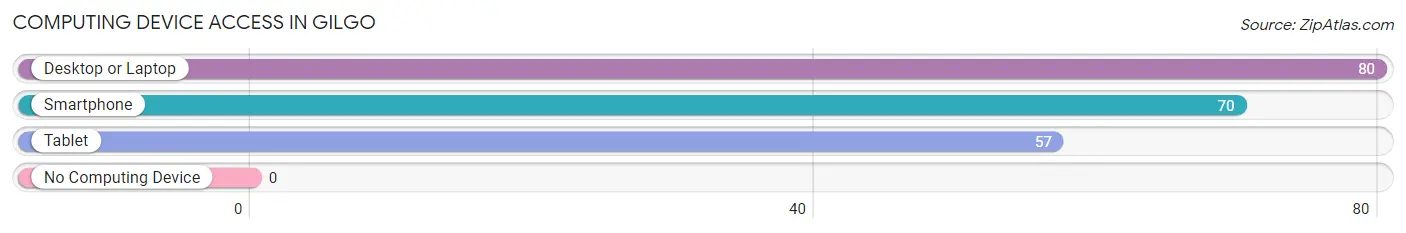
| Device Type | # Households | % Households |
| Desktop or Laptop | 80 | 100.0% |
| Smartphone | 70 | 87.5% |
| Tablet | 57 | 71.3% |
| No Computing Device | 0 | 0.0% |
| Total | 80 | 100.0% |
Internet Access in Gilgo
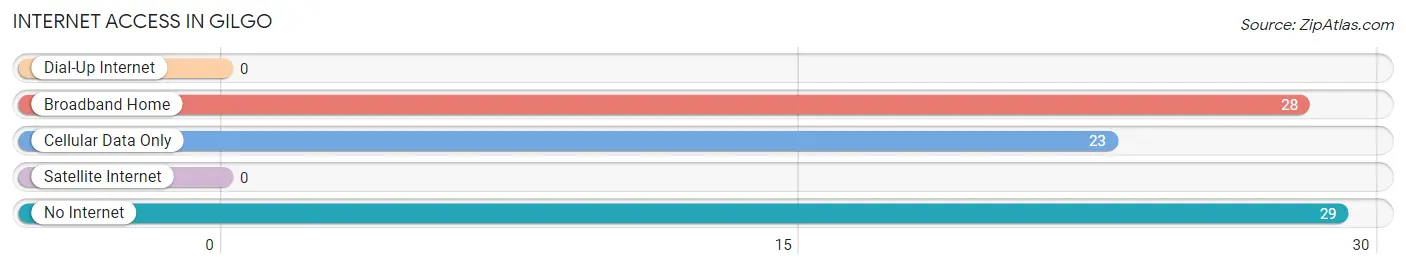
| Internet Type | # Households | % Households |
| Dial-Up Internet | 0 | 0.0% |
| Broadband Home | 28 | 35.0% |
| Cellular Data Only | 23 | 28.7% |
| Satellite Internet | 0 | 0.0% |
| No Internet | 29 | 36.2% |
| Total | 80 | 100.0% |
Gilgo Summary
Gilgo, NY is a small hamlet located in the Town of Babylon in Suffolk County, New York. It is situated on the south shore of Long Island, approximately 40 miles east of New York City. The hamlet is bordered by the Great South Bay to the north, the Atlantic Ocean to the south, and the Fire Island National Seashore to the east. Gilgo is a popular summer destination for beachgoers, and is home to a variety of recreational activities, including fishing, boating, and swimming.
History
The area now known as Gilgo was originally inhabited by the Secatogue Indians, a sub-tribe of the Montaukett Indians. The Secatogue Indians were a peaceful tribe who lived off the land and the bounty of the sea. They were known for their skill in fishing and hunting, and were also known for their hospitality.
In 1660, the Secatogue Indians sold the land that is now Gilgo to English settlers. The settlers named the area Gilgo, after the Secatogue Indian chief, Gilgo. The settlers built a small fishing village, and the area quickly became a popular destination for fishermen and beachgoers.
In the late 19th century, Gilgo began to attract wealthy vacationers from New York City. The area was known for its beautiful beaches and luxurious hotels. In the early 20th century, the area was further developed with the construction of a boardwalk and amusement park.
Geography
Gilgo is located on the south shore of Long Island, approximately 40 miles east of New York City. The hamlet is bordered by the Great South Bay to the north, the Atlantic Ocean to the south, and the Fire Island National Seashore to the east. Gilgo is situated on a barrier island, and is connected to the mainland by a causeway.
The area is characterized by sandy beaches, dunes, and wetlands. The beaches are popular for swimming, sunbathing, and fishing. The wetlands are home to a variety of wildlife, including birds, fish, and turtles.
Economy
The economy of Gilgo is largely based on tourism. The area is a popular summer destination for beachgoers, and is home to a variety of recreational activities, including fishing, boating, and swimming. The area is also home to several restaurants, bars, and shops.
In addition to tourism, Gilgo is home to a variety of businesses, including boat repair shops, marinas, and seafood markets. The area is also home to a number of real estate offices, as well as a number of small businesses.
Demographics
As of the 2010 census, the population of Gilgo was 1,845. The population is predominantly white (94.3%), with a small percentage of African Americans (2.2%) and Hispanics (2.5%). The median household income is $77,917, and the median age is 44.
Conclusion
Gilgo, NY is a small hamlet located in the Town of Babylon in Suffolk County, New York. It is situated on the south shore of Long Island, approximately 40 miles east of New York City. The hamlet is bordered by the Great South Bay to the north, the Atlantic Ocean to the south, and the Fire Island National Seashore to the east. Gilgo is a popular summer destination for beachgoers, and is home to a variety of recreational activities, including fishing, boating, and swimming. The economy of Gilgo is largely based on tourism, and the population is predominantly white. Gilgo is a beautiful and peaceful area, and is a great place to visit or live.
Common Questions
What is Per Capita Income in Gilgo?
Per Capita income in Gilgo is $106,694.
What is the Median Family Income in Gilgo?
Median Family Income in Gilgo is $250,001.
What is the Median Household income in Gilgo?
Median Household Income in Gilgo is $250,001.
What is Inequality or Gini Index in Gilgo?
Inequality or Gini Index in Gilgo is 0.43.
What is the Total Population of Gilgo?
Total Population of Gilgo is 209.
What is the Total Male Population of Gilgo?
Total Male Population of Gilgo is 115.
What is the Total Female Population of Gilgo?
Total Female Population of Gilgo is 94.
What is the Ratio of Males per 100 Females in Gilgo?
There are 122.34 Males per 100 Females in Gilgo.
What is the Ratio of Females per 100 Males in Gilgo?
There are 81.74 Females per 100 Males in Gilgo.
What is the Median Population Age in Gilgo?
Median Population Age in Gilgo is 60.5 Years.
What is the Average Family Size in Gilgo
Average Family Size in Gilgo is 3.0 People.
What is the Average Household Size in Gilgo
Average Household Size in Gilgo is 2.6 People.
How Large is the Labor Force in Gilgo?
There are 96 People in the Labor Forcein in Gilgo.
What is the Percentage of People in the Labor Force in Gilgo?
45.9% of People are in the Labor Force in Gilgo.