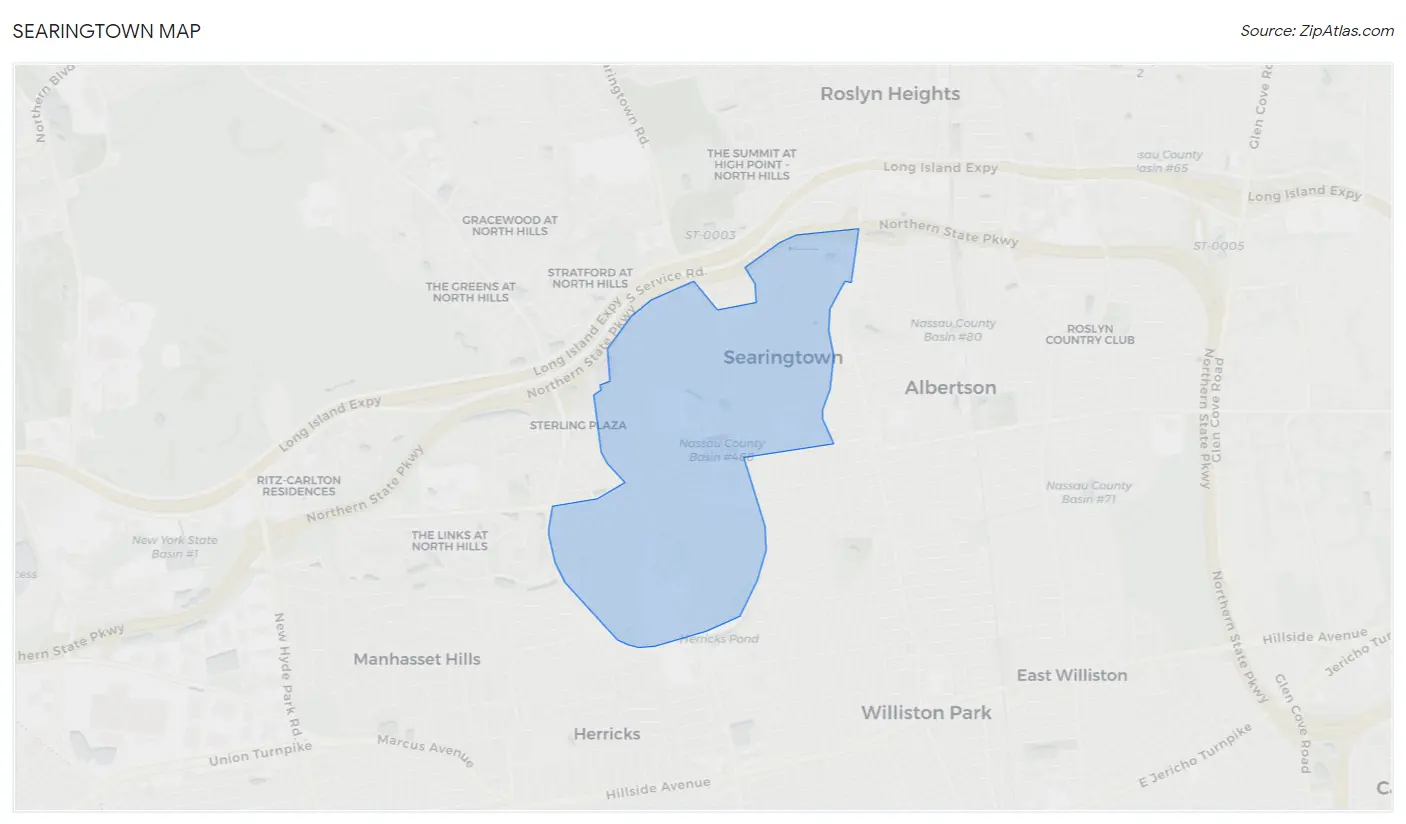
Searingtown, NY Map & Demographics
Searingtown Map
Searingtown Overview
$82,856
PER CAPITA INCOME
$209,773
AVG FAMILY INCOME
$199,524
AVG HOUSEHOLD INCOME
17.4%
WAGE / INCOME GAP [ % ]
82.6¢/ $1
WAGE / INCOME GAP [ $ ]
0.41
INEQUALITY / GINI INDEX
4,700
TOTAL POPULATION
2,305
MALE POPULATION
2,395
FEMALE POPULATION
96.24
MALES / 100 FEMALES
103.90
FEMALES / 100 MALES
50.8
MEDIAN AGE
3.1
AVG FAMILY SIZE
3.0
AVG HOUSEHOLD SIZE
2,479
LABOR FORCE [ PEOPLE ]
61.6%
PERCENT IN LABOR FORCE
3.9%
UNEMPLOYMENT RATE
Income in Searingtown
Income Overview in Searingtown
Per Capita Income in Searingtown is $82,856, while median incomes of families and households are $209,773 and $199,524 respectively.
| Characteristic | Number | Measure |
| Per Capita Income | 4,700 | $82,856 |
| Median Family Income | 1,452 | $209,773 |
| Mean Family Income | 1,452 | $259,727 |
| Median Household Income | 1,572 | $199,524 |
| Mean Household Income | 1,572 | $249,625 |
| Income Deficit | 1,452 | $0 |
| Wage / Income Gap (%) | 4,700 | 17.42% |
| Wage / Income Gap ($) | 4,700 | 82.58¢ per $1 |
| Gini / Inequality Index | 4,700 | 0.41 |
Earnings by Sex in Searingtown
Average Earnings in Searingtown are $86,793, $94,413 for men and $77,965 for women, a difference of 17.4%.
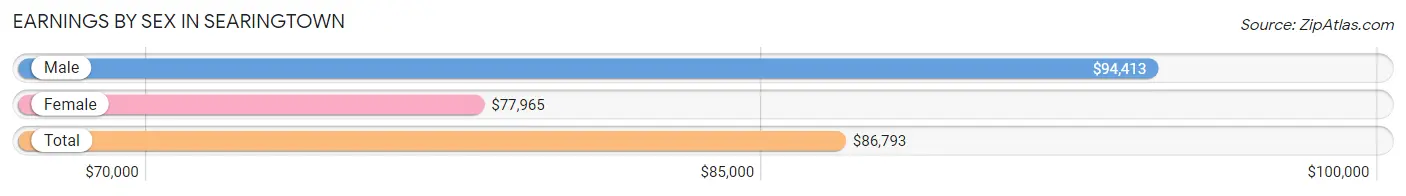
| Sex | Number | Average Earnings |
| Male | 1,381 (53.5%) | $94,413 |
| Female | 1,198 (46.5%) | $77,965 |
| Total | 2,579 (100.0%) | $86,793 |
Earnings by Sex by Income Bracket in Searingtown
The most common earnings brackets in Searingtown are $100,000+ for men (679 | 49.2%) and $100,000+ for women (458 | 38.2%).
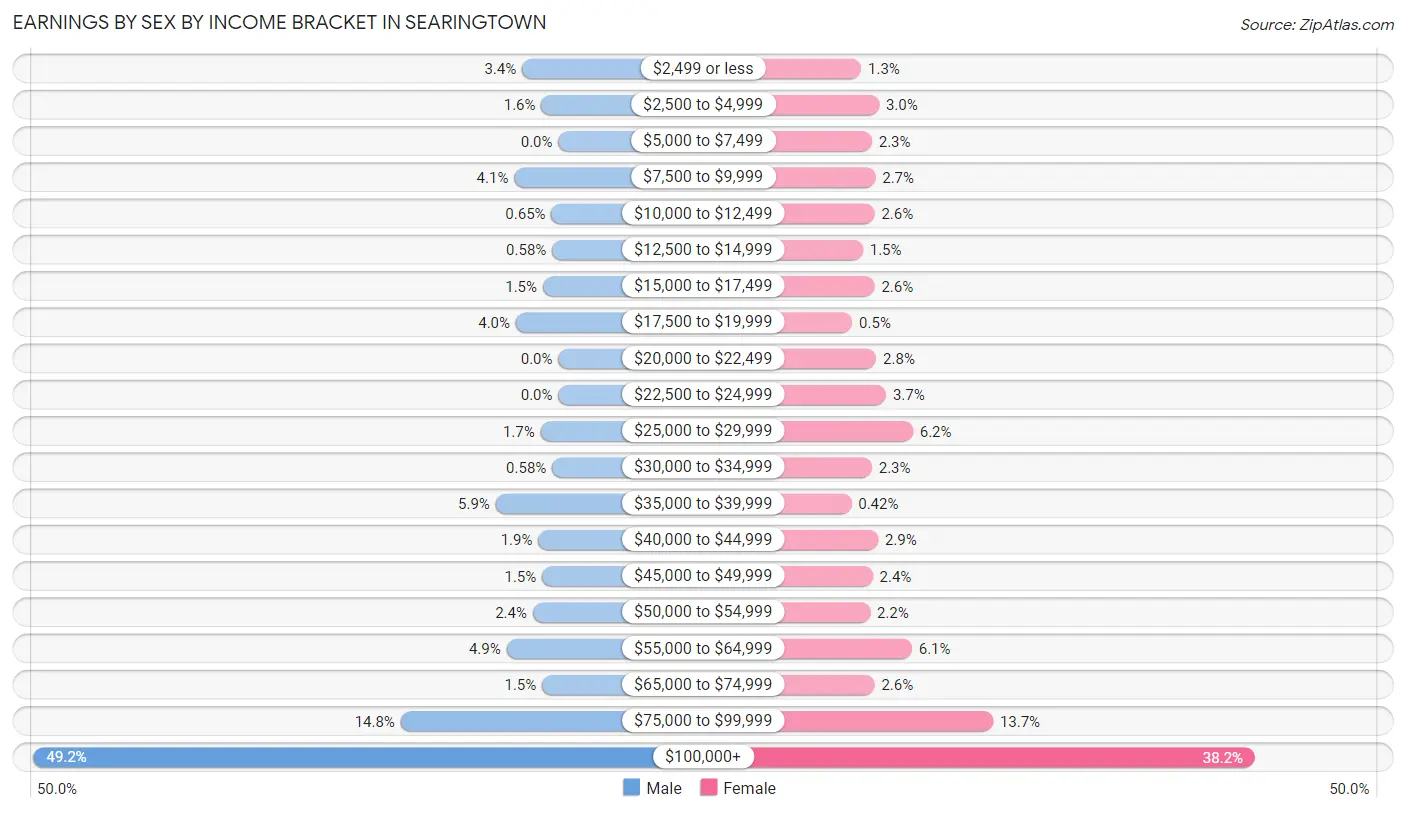
| Income | Male | Female |
| $2,499 or less | 47 (3.4%) | 16 (1.3%) |
| $2,500 to $4,999 | 22 (1.6%) | 36 (3.0%) |
| $5,000 to $7,499 | 0 (0.0%) | 28 (2.3%) |
| $7,500 to $9,999 | 57 (4.1%) | 32 (2.7%) |
| $10,000 to $12,499 | 9 (0.6%) | 31 (2.6%) |
| $12,500 to $14,999 | 8 (0.6%) | 18 (1.5%) |
| $15,000 to $17,499 | 20 (1.5%) | 31 (2.6%) |
| $17,500 to $19,999 | 55 (4.0%) | 6 (0.5%) |
| $20,000 to $22,499 | 0 (0.0%) | 33 (2.8%) |
| $22,500 to $24,999 | 0 (0.0%) | 44 (3.7%) |
| $25,000 to $29,999 | 23 (1.7%) | 74 (6.2%) |
| $30,000 to $34,999 | 8 (0.6%) | 28 (2.3%) |
| $35,000 to $39,999 | 81 (5.9%) | 5 (0.4%) |
| $40,000 to $44,999 | 26 (1.9%) | 35 (2.9%) |
| $45,000 to $49,999 | 21 (1.5%) | 29 (2.4%) |
| $50,000 to $54,999 | 33 (2.4%) | 26 (2.2%) |
| $55,000 to $64,999 | 67 (4.9%) | 73 (6.1%) |
| $65,000 to $74,999 | 21 (1.5%) | 31 (2.6%) |
| $75,000 to $99,999 | 204 (14.8%) | 164 (13.7%) |
| $100,000+ | 679 (49.2%) | 458 (38.2%) |
| Total | 1,381 (100.0%) | 1,198 (100.0%) |
Earnings by Sex by Educational Attainment in Searingtown
Average earnings in Searingtown are $104,356 for men and $88,421 for women, a difference of 15.3%. Men with an educational attainment of graduate degree enjoy the highest average annual earnings of $170,645, while those with bachelor's degree education earn the least with $92,550. Women with an educational attainment of graduate degree earn the most with the average annual earnings of $139,706, while those with high school diploma education have the smallest earnings of $23,906.
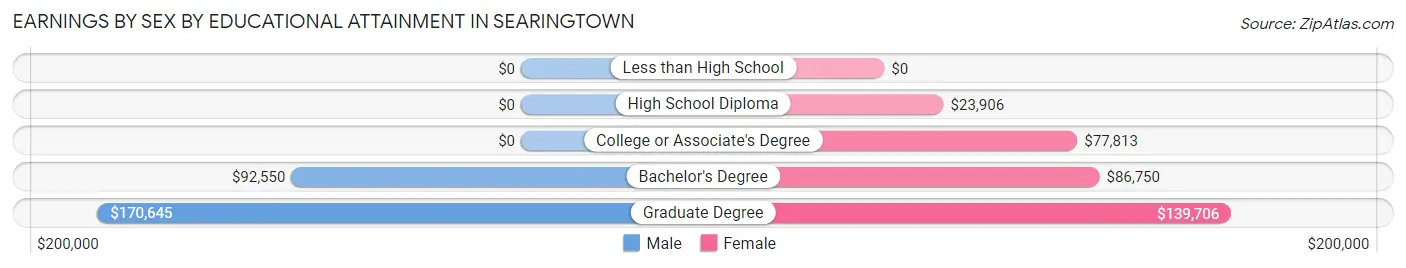
| Educational Attainment | Male Income | Female Income |
| Less than High School | - | - |
| High School Diploma | - | - |
| College or Associate's Degree | - | - |
| Bachelor's Degree | $92,550 | $86,750 |
| Graduate Degree | $170,645 | $139,706 |
| Total | $104,356 | $88,421 |
Family Income in Searingtown
Family Income Brackets in Searingtown
According to the Searingtown family income data, there are 775 families falling into the $200,000+ income range, which is the most common income bracket and makes up 53.4% of all families.
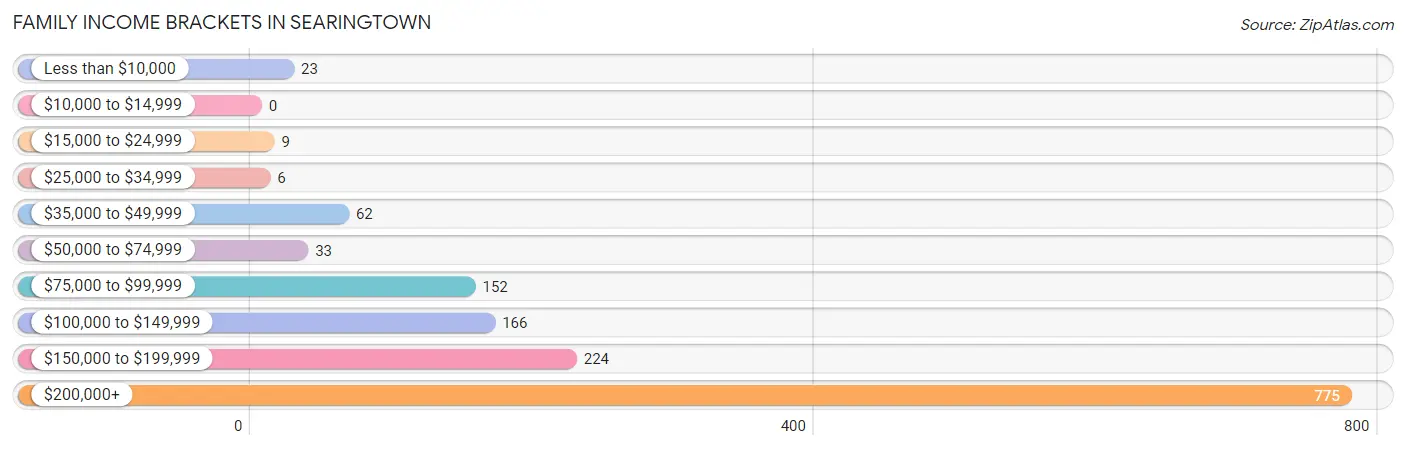
| Income Bracket | # Families | % Families |
| Less than $10,000 | 23 | 1.6% |
| $10,000 to $14,999 | 0 | 0.0% |
| $15,000 to $24,999 | 9 | 0.6% |
| $25,000 to $34,999 | 6 | 0.4% |
| $35,000 to $49,999 | 62 | 4.3% |
| $50,000 to $74,999 | 33 | 2.3% |
| $75,000 to $99,999 | 152 | 10.5% |
| $100,000 to $149,999 | 166 | 11.4% |
| $150,000 to $199,999 | 224 | 15.4% |
| $200,000+ | 775 | 53.4% |
Family Income by Famaliy Size in Searingtown
4-person families (303 | 20.9%) account for the highest median family income in Searingtown with $250,001 per family, while 2-person families (549 | 37.8%) have the highest median income of $63,025 per family member.
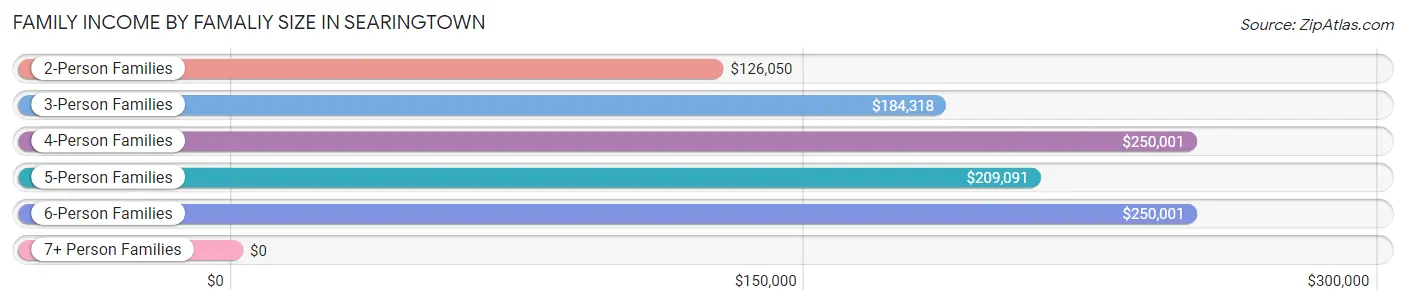
| Income Bracket | # Families | Median Income |
| 2-Person Families | 549 (37.8%) | $126,050 |
| 3-Person Families | 322 (22.2%) | $184,318 |
| 4-Person Families | 303 (20.9%) | $250,001 |
| 5-Person Families | 118 (8.1%) | $209,091 |
| 6-Person Families | 144 (9.9%) | $250,001 |
| 7+ Person Families | 16 (1.1%) | $0 |
| Total | 1,452 (100.0%) | $209,773 |
Family Income by Number of Earners in Searingtown
The median family income in Searingtown is $209,773, with families comprising 3+ earners (350) having the highest median family income of $250,001, while families with no earners (200) have the lowest median family income of $142,500, accounting for 24.1% and 13.8% of families, respectively.
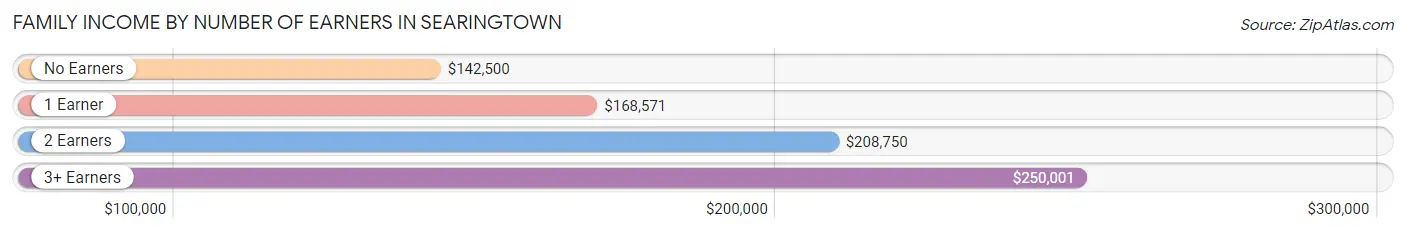
| Number of Earners | # Families | Median Income |
| No Earners | 200 (13.8%) | $142,500 |
| 1 Earner | 370 (25.5%) | $168,571 |
| 2 Earners | 532 (36.6%) | $208,750 |
| 3+ Earners | 350 (24.1%) | $250,001 |
| Total | 1,452 (100.0%) | $209,773 |
Household Income in Searingtown
Household Income Brackets in Searingtown
With 781 households falling in the category, the $200,000+ income range is the most frequent in Searingtown, accounting for 49.7% of all households. In contrast, only 6 households (0.4%) fall into the $10,000 to $14,999 income bracket, making it the least populous group.
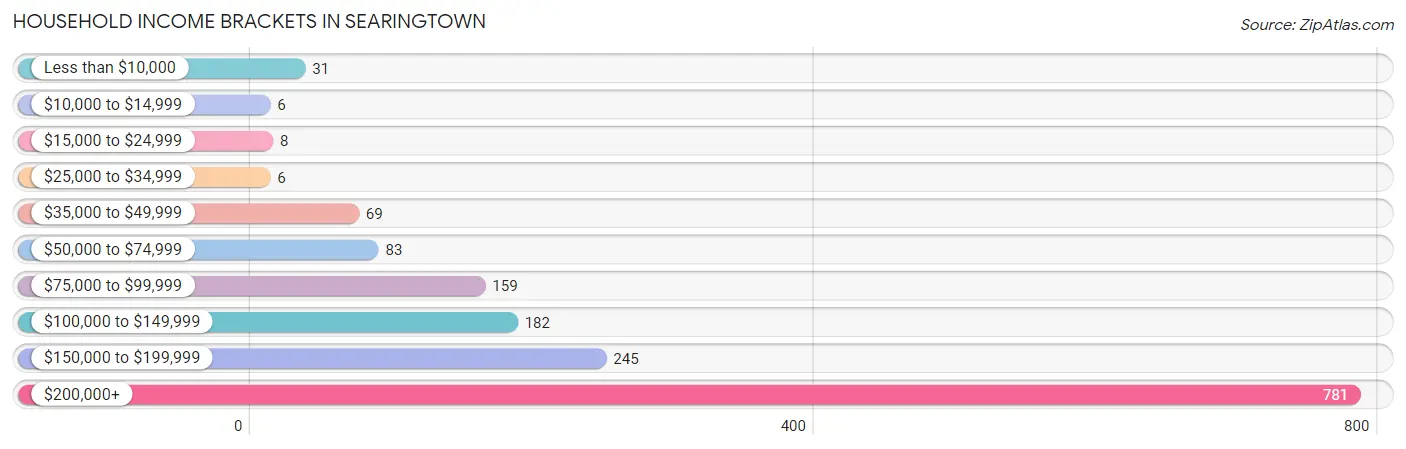
| Income Bracket | # Households | % Households |
| Less than $10,000 | 31 | 2.0% |
| $10,000 to $14,999 | 6 | 0.4% |
| $15,000 to $24,999 | 8 | 0.5% |
| $25,000 to $34,999 | 6 | 0.4% |
| $35,000 to $49,999 | 69 | 4.4% |
| $50,000 to $74,999 | 83 | 5.3% |
| $75,000 to $99,999 | 159 | 10.1% |
| $100,000 to $149,999 | 182 | 11.6% |
| $150,000 to $199,999 | 245 | 15.6% |
| $200,000+ | 781 | 49.7% |
Household Income by Householder Age in Searingtown
The median household income in Searingtown is $199,524, with the highest median household income of $217,273 found in the 45 to 64 years age bracket for the primary householder. A total of 920 households (58.5%) fall into this category.
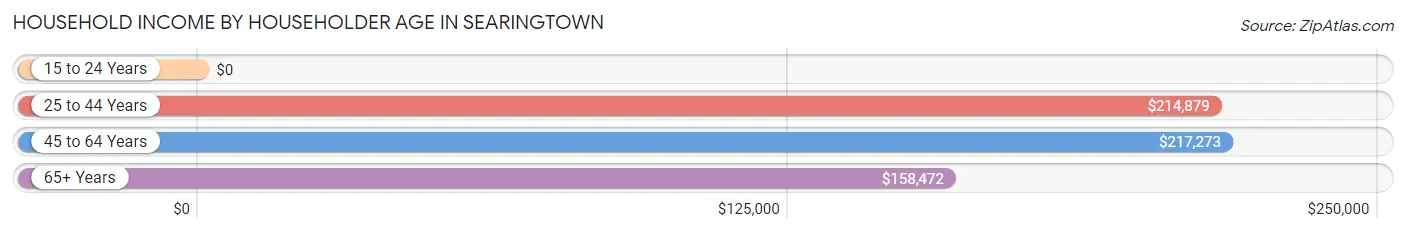
| Income Bracket | # Households | Median Income |
| 15 to 24 Years | 0 (0.0%) | $0 |
| 25 to 44 Years | 161 (10.2%) | $214,879 |
| 45 to 64 Years | 920 (58.5%) | $217,273 |
| 65+ Years | 491 (31.2%) | $158,472 |
| Total | 1,572 (100.0%) | $199,524 |
Poverty in Searingtown
Income Below Poverty by Sex and Age in Searingtown
With 1.7% poverty level for males and 1.5% for females among the residents of Searingtown, 65 to 74 year old males and 65 to 74 year old females are the most vulnerable to poverty, with 31 males (10.5%) and 20 females (6.2%) in their respective age groups living below the poverty level.
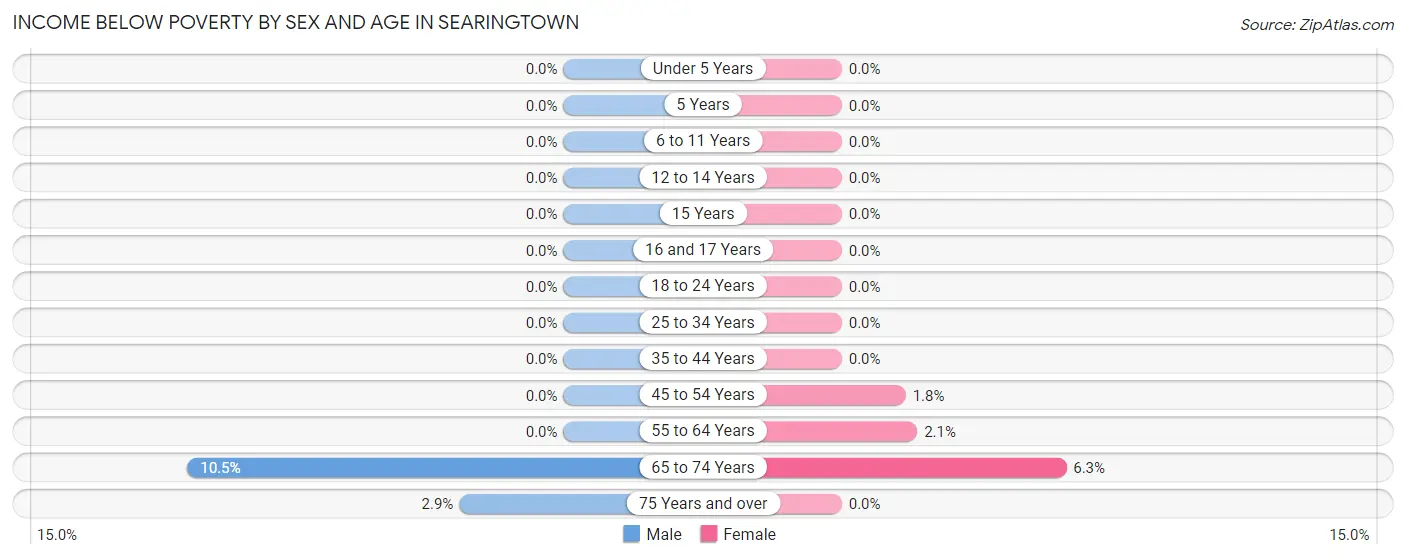
| Age Bracket | Male | Female |
| Under 5 Years | 0 (0.0%) | 0 (0.0%) |
| 5 Years | 0 (0.0%) | 0 (0.0%) |
| 6 to 11 Years | 0 (0.0%) | 0 (0.0%) |
| 12 to 14 Years | 0 (0.0%) | 0 (0.0%) |
| 15 Years | 0 (0.0%) | 0 (0.0%) |
| 16 and 17 Years | 0 (0.0%) | 0 (0.0%) |
| 18 to 24 Years | 0 (0.0%) | 0 (0.0%) |
| 25 to 34 Years | 0 (0.0%) | 0 (0.0%) |
| 35 to 44 Years | 0 (0.0%) | 0 (0.0%) |
| 45 to 54 Years | 0 (0.0%) | 8 (1.8%) |
| 55 to 64 Years | 0 (0.0%) | 9 (2.1%) |
| 65 to 74 Years | 31 (10.5%) | 20 (6.2%) |
| 75 Years and over | 7 (2.9%) | 0 (0.0%) |
| Total | 38 (1.7%) | 37 (1.5%) |
Income Above Poverty by Sex and Age in Searingtown
According to the poverty statistics in Searingtown, males aged under 5 years and females aged under 5 years are the age groups that are most secure financially, with 100.0% of males and 100.0% of females in these age groups living above the poverty line.
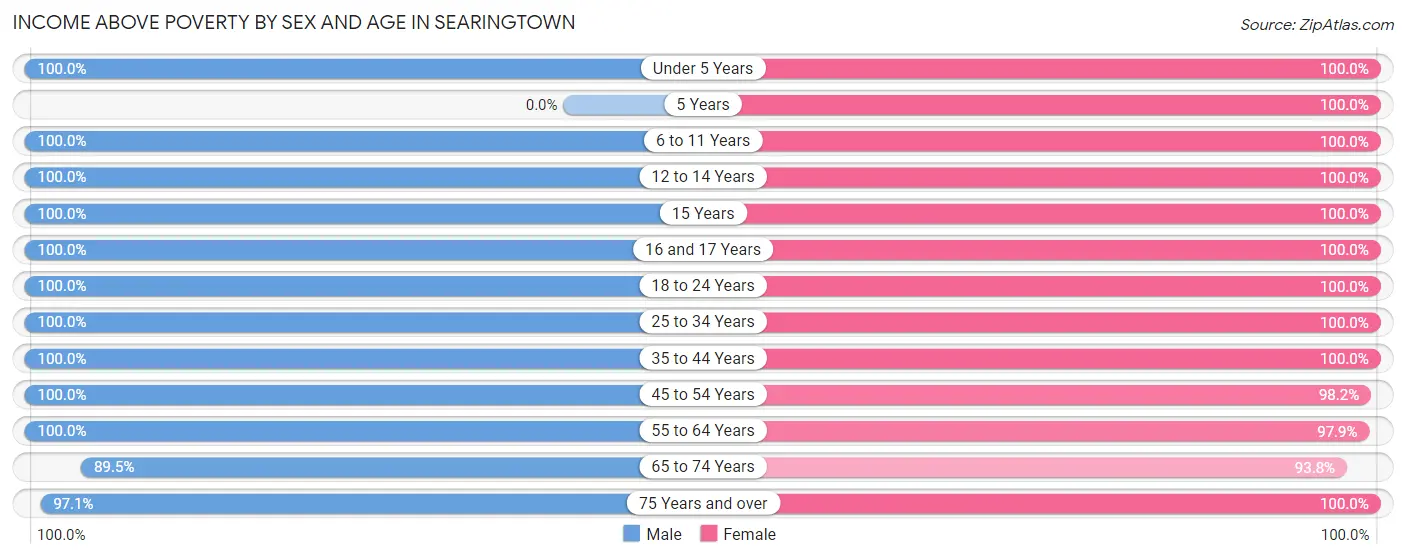
| Age Bracket | Male | Female |
| Under 5 Years | 105 (100.0%) | 53 (100.0%) |
| 5 Years | 0 (0.0%) | 43 (100.0%) |
| 6 to 11 Years | 120 (100.0%) | 95 (100.0%) |
| 12 to 14 Years | 114 (100.0%) | 98 (100.0%) |
| 15 Years | 14 (100.0%) | 34 (100.0%) |
| 16 and 17 Years | 86 (100.0%) | 68 (100.0%) |
| 18 to 24 Years | 153 (100.0%) | 231 (100.0%) |
| 25 to 34 Years | 227 (100.0%) | 170 (100.0%) |
| 35 to 44 Years | 97 (100.0%) | 209 (100.0%) |
| 45 to 54 Years | 392 (100.0%) | 441 (98.2%) |
| 55 to 64 Years | 460 (100.0%) | 419 (97.9%) |
| 65 to 74 Years | 265 (89.5%) | 300 (93.8%) |
| 75 Years and over | 234 (97.1%) | 197 (100.0%) |
| Total | 2,267 (98.4%) | 2,358 (98.5%) |
Income Below Poverty Among Married-Couple Families in Searingtown
The poverty statistics for married-couple families in Searingtown show that 2.4% or 31 of the total 1,309 families live below the poverty line. Families with no children have the highest poverty rate of 4.1%, comprising of 31 families. On the other hand, families with 1 or 2 children have the lowest poverty rate of 0.0%, which includes 0 families.
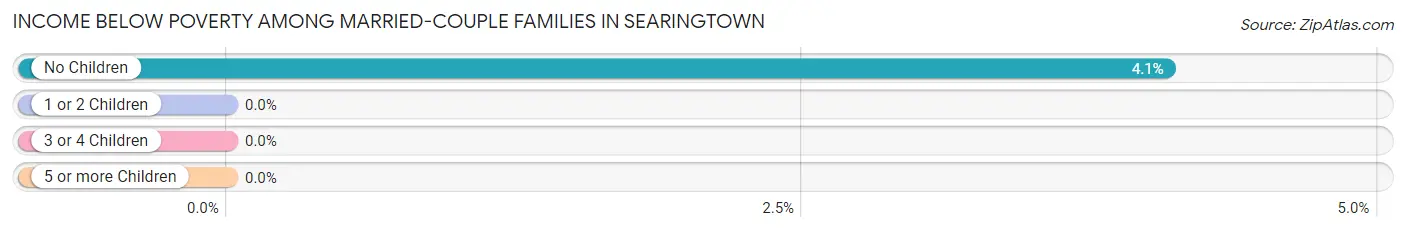
| Children | Above Poverty | Below Poverty |
| No Children | 728 (95.9%) | 31 (4.1%) |
| 1 or 2 Children | 507 (100.0%) | 0 (0.0%) |
| 3 or 4 Children | 27 (100.0%) | 0 (0.0%) |
| 5 or more Children | 16 (100.0%) | 0 (0.0%) |
| Total | 1,278 (97.6%) | 31 (2.4%) |
Income Below Poverty Among Single-Parent Households in Searingtown
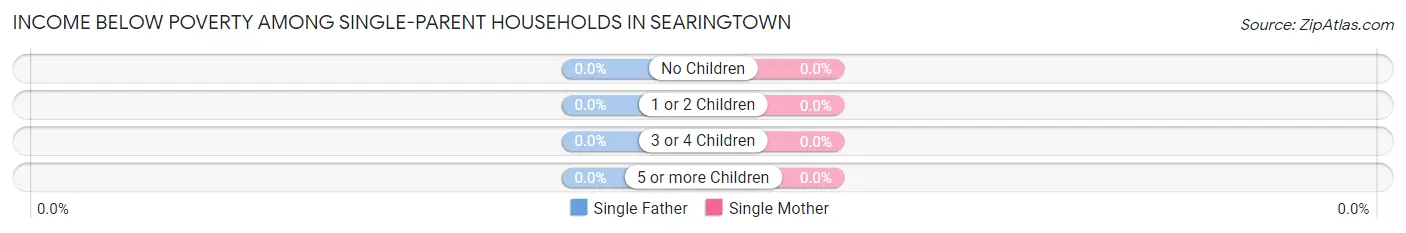
| Children | Single Father | Single Mother |
| No Children | 0 (0.0%) | 0 (0.0%) |
| 1 or 2 Children | 0 (0.0%) | 0 (0.0%) |
| 3 or 4 Children | 0 (0.0%) | 0 (0.0%) |
| 5 or more Children | 0 (0.0%) | 0 (0.0%) |
| Total | 0 (0.0%) | 0 (0.0%) |
Income Below Poverty Among Married-Couple vs Single-Parent Households in Searingtown
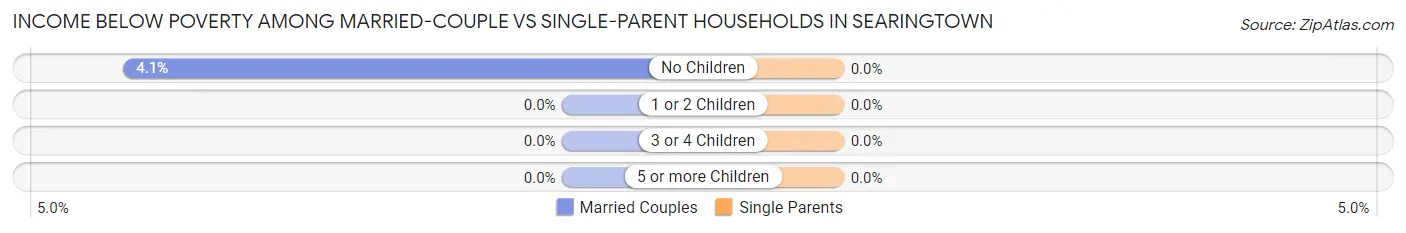
| Children | Married-Couple Families | Single-Parent Households |
| No Children | 31 (4.1%) | 0 (0.0%) |
| 1 or 2 Children | 0 (0.0%) | 0 (0.0%) |
| 3 or 4 Children | 0 (0.0%) | 0 (0.0%) |
| 5 or more Children | 0 (0.0%) | 0 (0.0%) |
| Total | 31 (2.4%) | 0 (0.0%) |
Race in Searingtown
The most populous races in Searingtown are Asian (2,281 | 48.5%), White / Caucasian (1,948 | 41.4%), and Some other Race (208 | 4.4%).
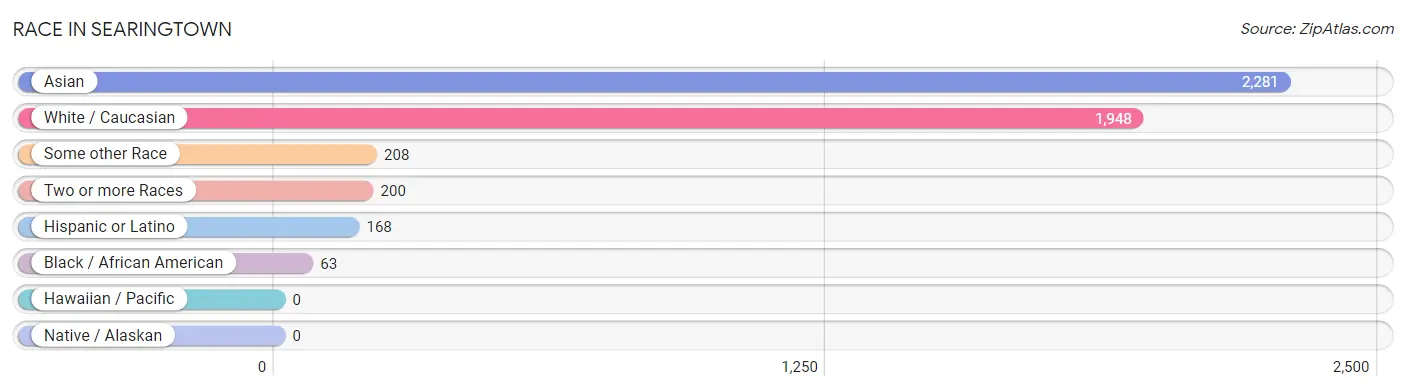
| Race | # Population | % Population |
| Asian | 2,281 | 48.5% |
| Black / African American | 63 | 1.3% |
| Hawaiian / Pacific | 0 | 0.0% |
| Hispanic or Latino | 168 | 3.6% |
| Native / Alaskan | 0 | 0.0% |
| White / Caucasian | 1,948 | 41.4% |
| Two or more Races | 200 | 4.3% |
| Some other Race | 208 | 4.4% |
| Total | 4,700 | 100.0% |
Ancestry in Searingtown
The most populous ancestries reported in Searingtown are Thai (980 | 20.8%), Indian (Asian) (627 | 13.3%), Burmese (541 | 11.5%), Italian (278 | 5.9%), and Arab (197 | 4.2%), together accounting for 55.8% of all Searingtown residents.
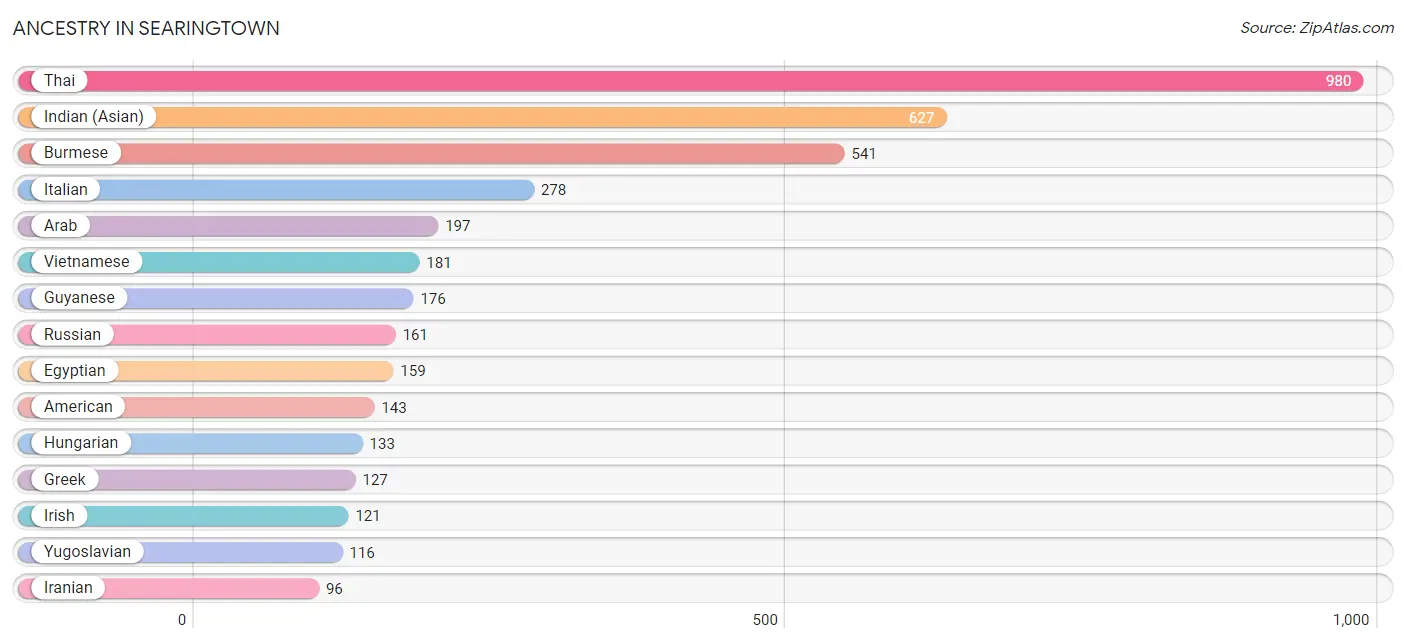
| Ancestry | # Population | % Population |
| African | 40 | 0.9% |
| American | 143 | 3.0% |
| Arab | 197 | 4.2% |
| Austrian | 71 | 1.5% |
| Burmese | 541 | 11.5% |
| Central American | 43 | 0.9% |
| Croatian | 85 | 1.8% |
| Czech | 25 | 0.5% |
| Dominican | 69 | 1.5% |
| Eastern European | 61 | 1.3% |
| Egyptian | 159 | 3.4% |
| English | 15 | 0.3% |
| French | 19 | 0.4% |
| German | 70 | 1.5% |
| Greek | 127 | 2.7% |
| Guyanese | 176 | 3.7% |
| Hungarian | 133 | 2.8% |
| Indian (Asian) | 627 | 13.3% |
| Iranian | 96 | 2.0% |
| Iraqi | 19 | 0.4% |
| Irish | 121 | 2.6% |
| Israeli | 20 | 0.4% |
| Italian | 278 | 5.9% |
| Korean | 16 | 0.3% |
| Lithuanian | 7 | 0.2% |
| Mexican | 8 | 0.2% |
| Norwegian | 31 | 0.7% |
| Panamanian | 24 | 0.5% |
| Polish | 44 | 0.9% |
| Puerto Rican | 36 | 0.8% |
| Romanian | 23 | 0.5% |
| Russian | 161 | 3.4% |
| Salvadoran | 19 | 0.4% |
| Scottish | 7 | 0.2% |
| Slavic | 14 | 0.3% |
| South American | 12 | 0.3% |
| Subsaharan African | 40 | 0.9% |
| Thai | 980 | 20.8% |
| Ukrainian | 28 | 0.6% |
| Venezuelan | 12 | 0.3% |
| Vietnamese | 181 | 3.8% |
| West Indian | 20 | 0.4% |
| Yugoslavian | 116 | 2.5% | View All 43 Rows |
Immigrants in Searingtown
The most numerous immigrant groups reported in Searingtown came from Asia (1,671 | 35.5%), South Central Asia (888 | 18.9%), Eastern Asia (667 | 14.2%), India (663 | 14.1%), and China (423 | 9.0%), together accounting for 91.7% of all Searingtown residents.
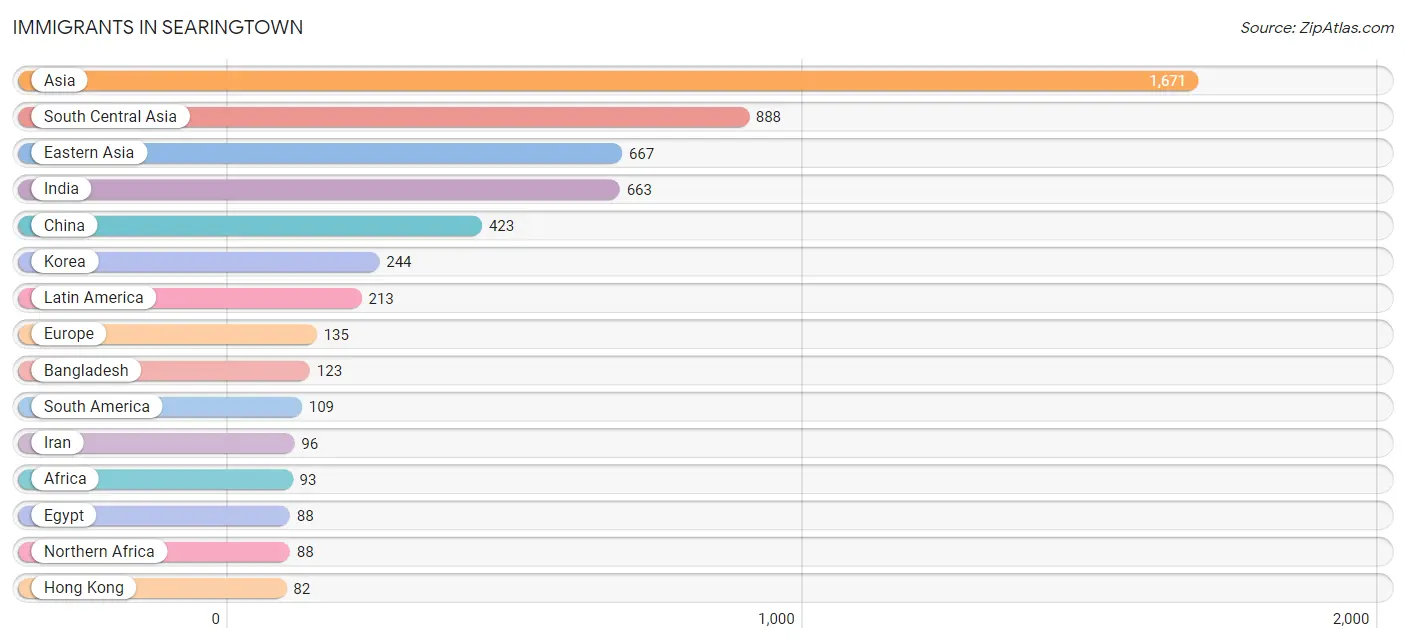
| Immigration Origin | # Population | % Population |
| Africa | 93 | 2.0% |
| Asia | 1,671 | 35.5% |
| Bangladesh | 123 | 2.6% |
| Caribbean | 80 | 1.7% |
| Central America | 24 | 0.5% |
| China | 423 | 9.0% |
| Dominican Republic | 40 | 0.9% |
| Eastern Africa | 5 | 0.1% |
| Eastern Asia | 667 | 14.2% |
| Eastern Europe | 71 | 1.5% |
| Egypt | 88 | 1.9% |
| Europe | 135 | 2.9% |
| France | 16 | 0.3% |
| Germany | 7 | 0.2% |
| Guyana | 77 | 1.6% |
| Haiti | 40 | 0.9% |
| Hong Kong | 82 | 1.7% |
| India | 663 | 14.1% |
| Indonesia | 10 | 0.2% |
| Iran | 96 | 2.0% |
| Iraq | 22 | 0.5% |
| Israel | 20 | 0.4% |
| Italy | 27 | 0.6% |
| Kenya | 5 | 0.1% |
| Korea | 244 | 5.2% |
| Latin America | 213 | 4.5% |
| Northern Africa | 88 | 1.9% |
| Pakistan | 6 | 0.1% |
| Panama | 24 | 0.5% |
| Philippines | 28 | 0.6% |
| Romania | 16 | 0.3% |
| Saudi Arabia | 19 | 0.4% |
| South America | 109 | 2.3% |
| South Central Asia | 888 | 18.9% |
| South Eastern Asia | 55 | 1.2% |
| Southern Europe | 27 | 0.6% |
| Ukraine | 18 | 0.4% |
| Venezuela | 32 | 0.7% |
| Western Asia | 61 | 1.3% |
| Western Europe | 23 | 0.5% | View All 40 Rows |
Sex and Age in Searingtown
Sex and Age in Searingtown
The most populous age groups in Searingtown are 60 to 64 Years (256 | 11.1%) for men and 50 to 54 Years (273 | 11.4%) for women.
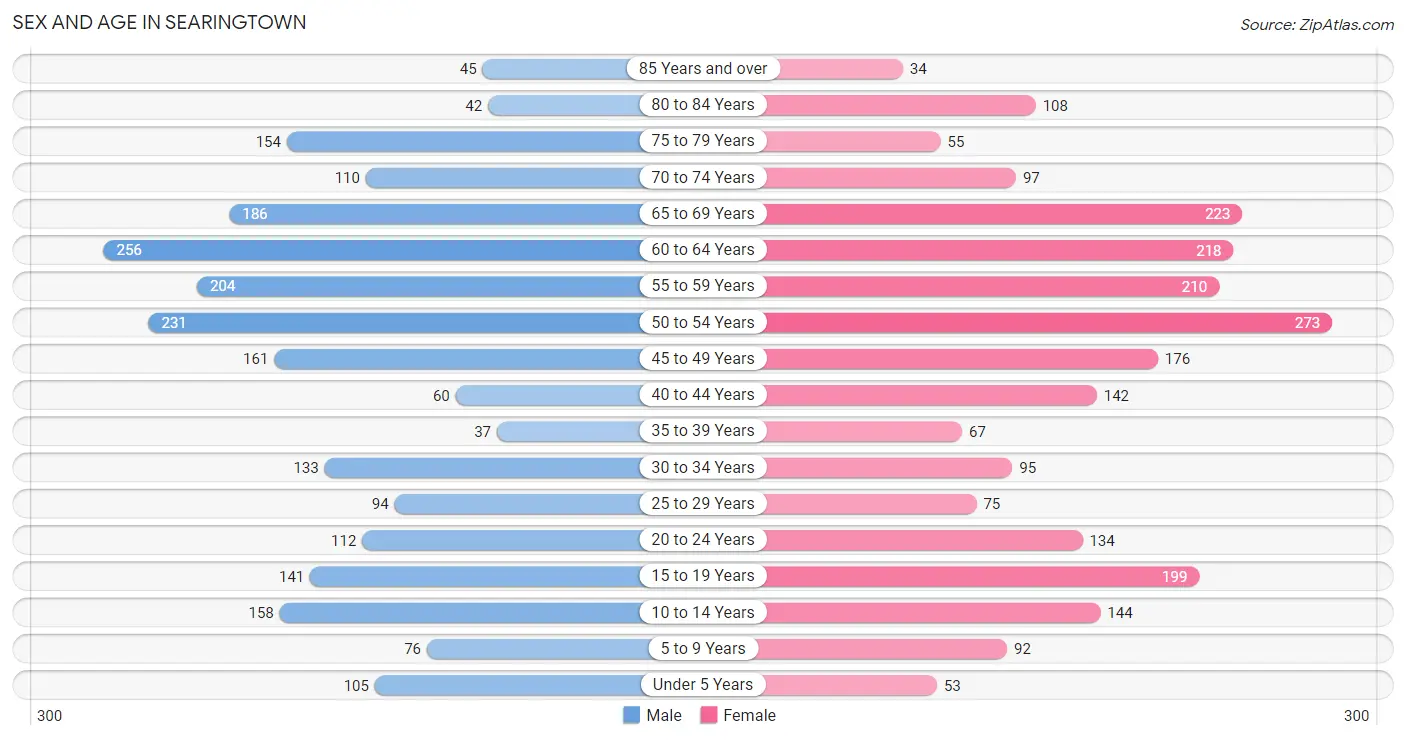
| Age Bracket | Male | Female |
| Under 5 Years | 105 (4.6%) | 53 (2.2%) |
| 5 to 9 Years | 76 (3.3%) | 92 (3.8%) |
| 10 to 14 Years | 158 (6.9%) | 144 (6.0%) |
| 15 to 19 Years | 141 (6.1%) | 199 (8.3%) |
| 20 to 24 Years | 112 (4.9%) | 134 (5.6%) |
| 25 to 29 Years | 94 (4.1%) | 75 (3.1%) |
| 30 to 34 Years | 133 (5.8%) | 95 (4.0%) |
| 35 to 39 Years | 37 (1.6%) | 67 (2.8%) |
| 40 to 44 Years | 60 (2.6%) | 142 (5.9%) |
| 45 to 49 Years | 161 (7.0%) | 176 (7.3%) |
| 50 to 54 Years | 231 (10.0%) | 273 (11.4%) |
| 55 to 59 Years | 204 (8.8%) | 210 (8.8%) |
| 60 to 64 Years | 256 (11.1%) | 218 (9.1%) |
| 65 to 69 Years | 186 (8.1%) | 223 (9.3%) |
| 70 to 74 Years | 110 (4.8%) | 97 (4.1%) |
| 75 to 79 Years | 154 (6.7%) | 55 (2.3%) |
| 80 to 84 Years | 42 (1.8%) | 108 (4.5%) |
| 85 Years and over | 45 (1.9%) | 34 (1.4%) |
| Total | 2,305 (100.0%) | 2,395 (100.0%) |
Families and Households in Searingtown
Median Family Size in Searingtown
The median family size in Searingtown is 3.14 persons per family, with married-couple families (1,309 | 90.1%) accounting for the largest median family size of 3.19 persons per family. On the other hand, single male/father families (23 | 1.6%) represent the smallest median family size with 2.26 persons per family.
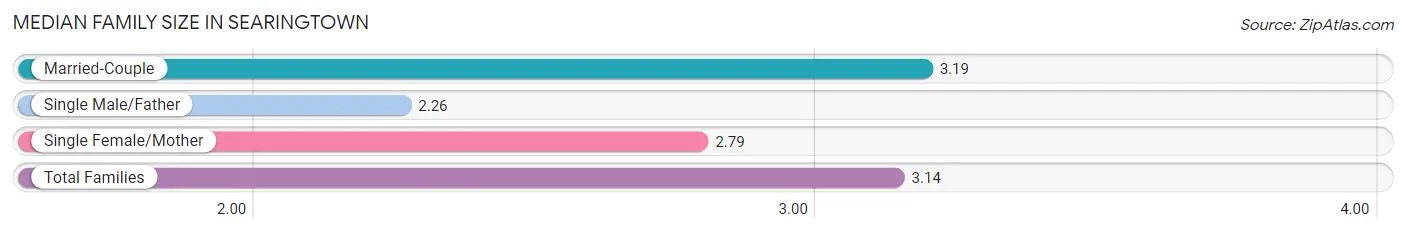
| Family Type | # Families | Family Size |
| Married-Couple | 1,309 (90.1%) | 3.19 |
| Single Male/Father | 23 (1.6%) | 2.26 |
| Single Female/Mother | 120 (8.3%) | 2.79 |
| Total Families | 1,452 (100.0%) | 3.14 |
Median Household Size in Searingtown
The median household size in Searingtown is 2.99 persons per household, with married-couple households (1,309 | 83.3%) accounting for the largest median household size of 3.19 persons per household. non-family households (120 | 7.6%) represent the smallest median household size with 1.11 persons per household.
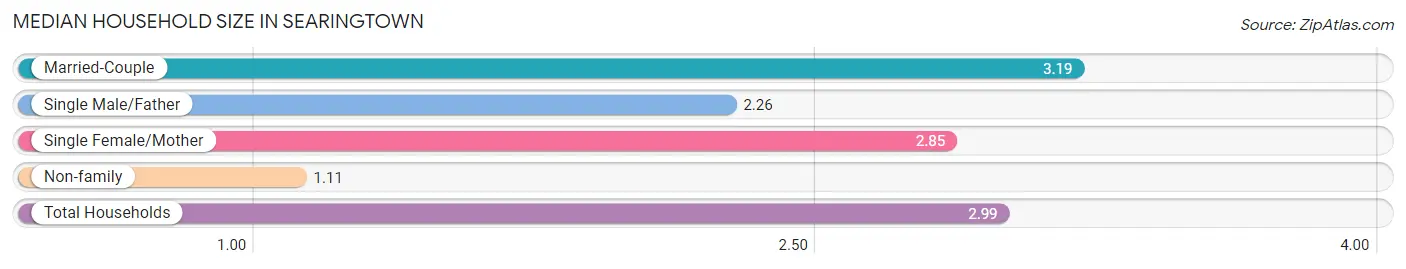
| Household Type | # Households | Household Size |
| Married-Couple | 1,309 (83.3%) | 3.19 |
| Single Male/Father | 23 (1.5%) | 2.26 |
| Single Female/Mother | 120 (7.6%) | 2.85 |
| Non-family | 120 (7.6%) | 1.11 |
| Total Households | 1,572 (100.0%) | 2.99 |
Household Size by Marriage Status in Searingtown
Out of a total of 1,572 households in Searingtown, 1,452 (92.4%) are family households, while 120 (7.6%) are nonfamily households. The most numerous type of family households are 2-person households, comprising 549, and the most common type of nonfamily households are 1-person households, comprising 107.
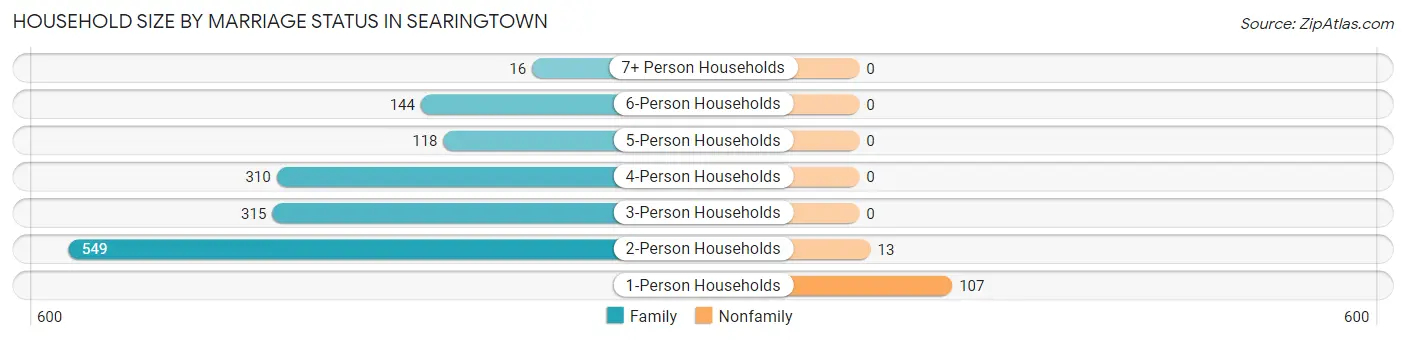
| Household Size | Family Households | Nonfamily Households |
| 1-Person Households | - | 107 (6.8%) |
| 2-Person Households | 549 (34.9%) | 13 (0.8%) |
| 3-Person Households | 315 (20.0%) | 0 (0.0%) |
| 4-Person Households | 310 (19.7%) | 0 (0.0%) |
| 5-Person Households | 118 (7.5%) | 0 (0.0%) |
| 6-Person Households | 144 (9.2%) | 0 (0.0%) |
| 7+ Person Households | 16 (1.0%) | 0 (0.0%) |
| Total | 1,452 (92.4%) | 120 (7.6%) |
Female Fertility in Searingtown
Fertility by Age in Searingtown
Average fertility rate in Searingtown is 22.0 births per 1,000 women. Women in the age bracket of 35 to 50 years have the highest fertility rate with 30.0 births per 1,000 women. Women in the age bracket of 35 to 50 years acount for 66.7% of all women with births.
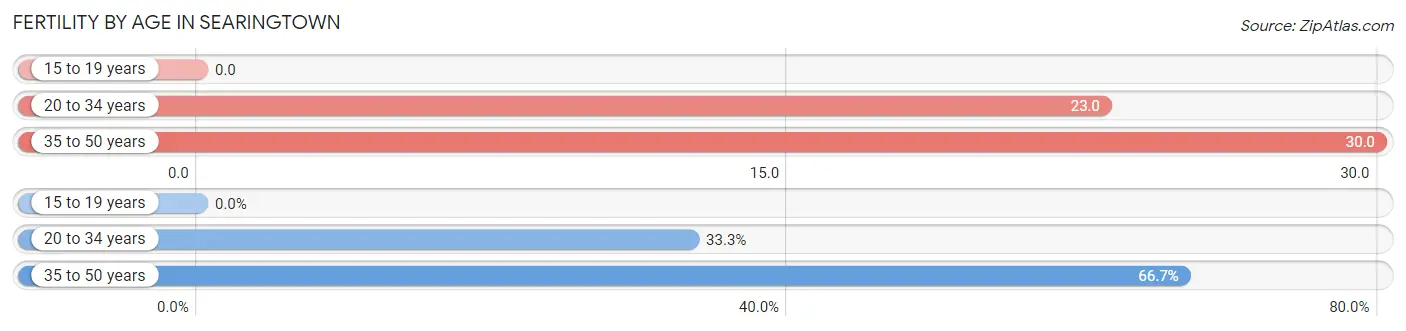
| Age Bracket | Women with Births | Births / 1,000 Women |
| 15 to 19 years | 0 (0.0%) | 0.0 |
| 20 to 34 years | 7 (33.3%) | 23.0 |
| 35 to 50 years | 14 (66.7%) | 30.0 |
| Total | 21 (100.0%) | 22.0 |
Fertility by Age by Marriage Status in Searingtown
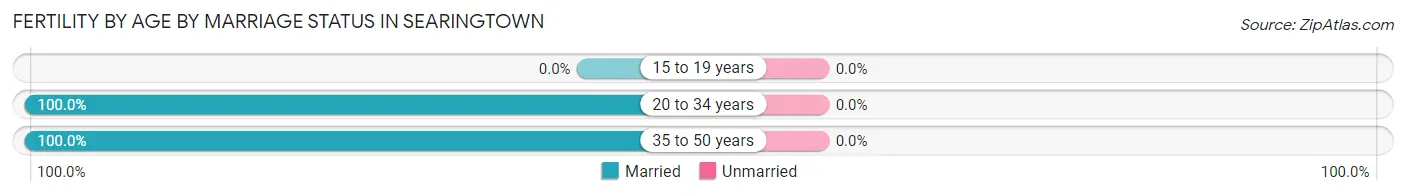
| Age Bracket | Married | Unmarried |
| 15 to 19 years | 0 (0.0%) | 0 (0.0%) |
| 20 to 34 years | 7 (100.0%) | 0 (0.0%) |
| 35 to 50 years | 14 (100.0%) | 0 (0.0%) |
| Total | 21 (100.0%) | 0 (0.0%) |
Fertility by Education in Searingtown
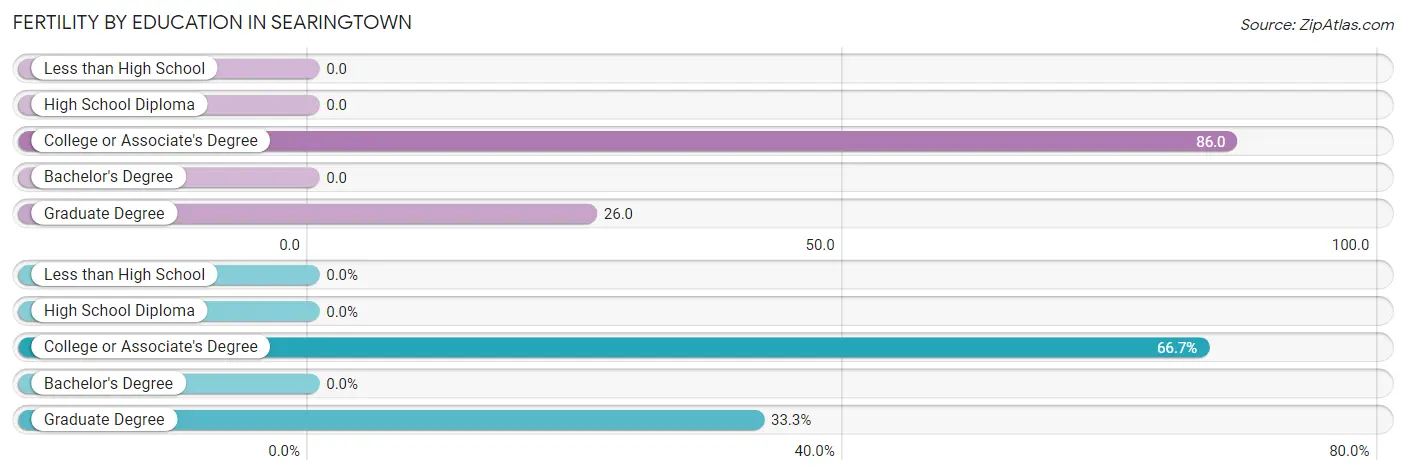
| Educational Attainment | Women with Births | Births / 1,000 Women |
| Less than High School | 0 (0.0%) | 0.0 |
| High School Diploma | 0 (0.0%) | 0.0 |
| College or Associate's Degree | 14 (66.7%) | 86.0 |
| Bachelor's Degree | 0 (0.0%) | 0.0 |
| Graduate Degree | 7 (33.3%) | 26.0 |
| Total | 21 (100.0%) | 22.0 |
Fertility by Education by Marriage Status in Searingtown
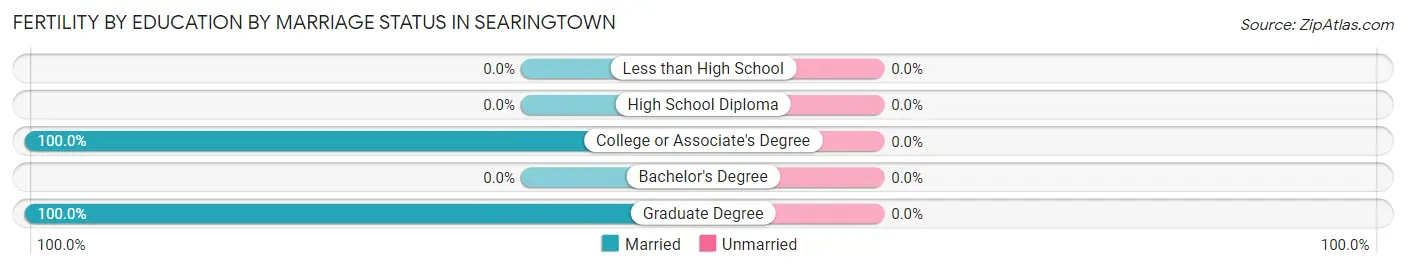
| Educational Attainment | Married | Unmarried |
| Less than High School | 0 (0.0%) | 0 (0.0%) |
| High School Diploma | 0 (0.0%) | 0 (0.0%) |
| College or Associate's Degree | 14 (100.0%) | 0 (0.0%) |
| Bachelor's Degree | 0 (0.0%) | 0 (0.0%) |
| Graduate Degree | 7 (100.0%) | 0 (0.0%) |
| Total | 21 (100.0%) | 0 (0.0%) |
Employment Characteristics in Searingtown
Employment by Class of Employer in Searingtown
Among the 2,355 employed individuals in Searingtown, private company employees (1,005 | 42.7%), self-employed (incorporated) (473 | 20.1%), and not-for-profit organizations (295 | 12.5%) make up the most common classes of employment.
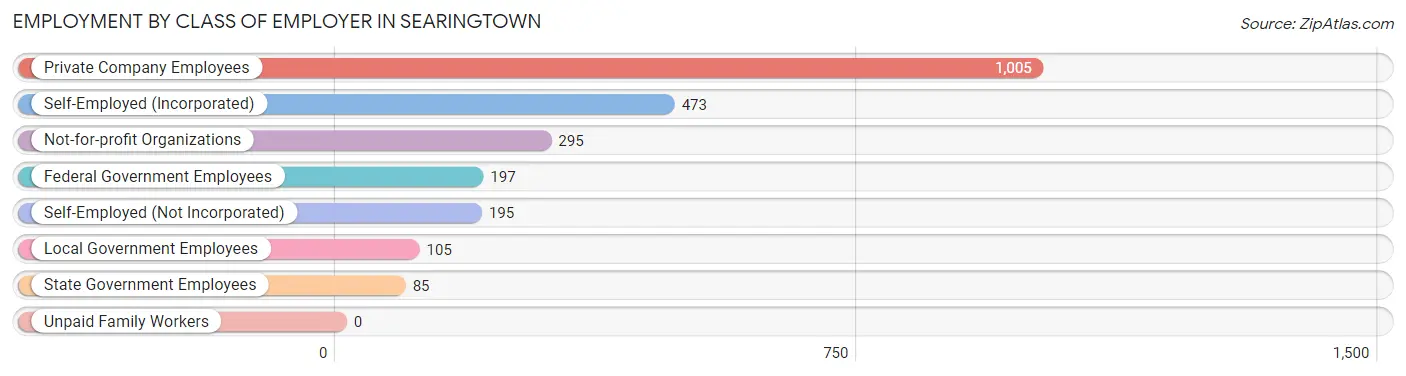
| Employer Class | # Employees | % Employees |
| Private Company Employees | 1,005 | 42.7% |
| Self-Employed (Incorporated) | 473 | 20.1% |
| Self-Employed (Not Incorporated) | 195 | 8.3% |
| Not-for-profit Organizations | 295 | 12.5% |
| Local Government Employees | 105 | 4.5% |
| State Government Employees | 85 | 3.6% |
| Federal Government Employees | 197 | 8.4% |
| Unpaid Family Workers | 0 | 0.0% |
| Total | 2,355 | 100.0% |
Employment Status by Age in Searingtown
According to the labor force statistics for Searingtown, out of the total population over 16 years of age (4,024), 61.6% or 2,479 individuals are in the labor force, with 3.9% or 97 of them unemployed. The age group with the highest labor force participation rate is 30 to 34 years, with 94.3% or 215 individuals in the labor force. Within the labor force, the 16 to 19 years age range has the highest percentage of unemployed individuals, with 37.0% or 10 of them being unemployed.
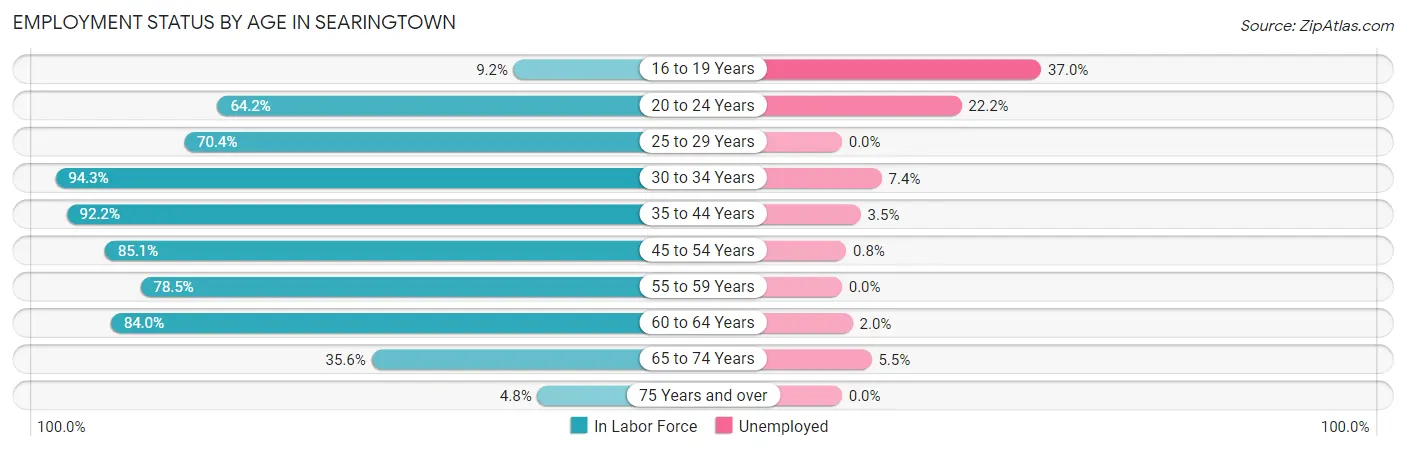
| Age Bracket | In Labor Force | Unemployed |
| 16 to 19 Years | 27 (9.2%) | 10 (37.0%) |
| 20 to 24 Years | 158 (64.2%) | 35 (22.2%) |
| 25 to 29 Years | 119 (70.4%) | 0 (0.0%) |
| 30 to 34 Years | 215 (94.3%) | 16 (7.4%) |
| 35 to 44 Years | 282 (92.2%) | 10 (3.5%) |
| 45 to 54 Years | 716 (85.1%) | 6 (0.8%) |
| 55 to 59 Years | 325 (78.5%) | 0 (0.0%) |
| 60 to 64 Years | 398 (84.0%) | 8 (2.0%) |
| 65 to 74 Years | 219 (35.6%) | 12 (5.5%) |
| 75 Years and over | 21 (4.8%) | 0 (0.0%) |
| Total | 2,479 (61.6%) | 97 (3.9%) |
Employment Status by Educational Attainment in Searingtown
According to labor force statistics for Searingtown, 84.5% of individuals (2,055) out of the total population between 25 and 64 years of age (2,432) are in the labor force, with 1.9% or 39 of them being unemployed. The group with the highest labor force participation rate are those with the educational attainment of less than high school, with 97.1% or 34 individuals in the labor force. Within the labor force, individuals with bachelor's degree or higher education have the highest percentage of unemployment, with 2.4% or 39 of them being unemployed.
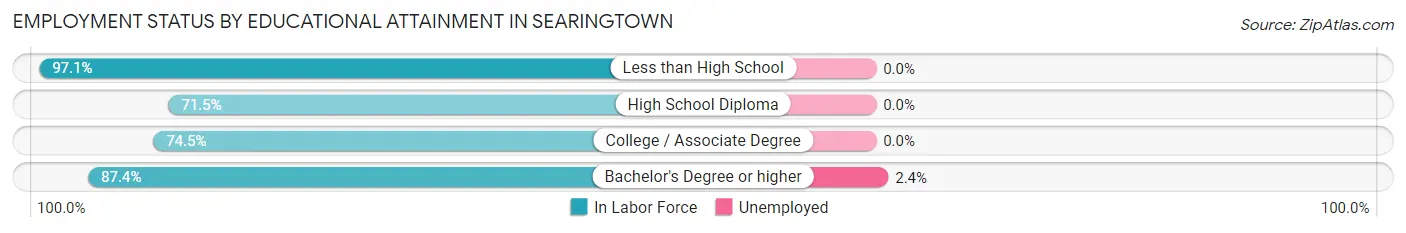
| Educational Attainment | In Labor Force | Unemployed |
| Less than High School | 34 (97.1%) | 0 (0.0%) |
| High School Diploma | 148 (71.5%) | 0 (0.0%) |
| College / Associate Degree | 237 (74.5%) | 0 (0.0%) |
| Bachelor's Degree or higher | 1,636 (87.4%) | 45 (2.4%) |
| Total | 2,055 (84.5%) | 46 (1.9%) |
Employment Occupations by Sex in Searingtown
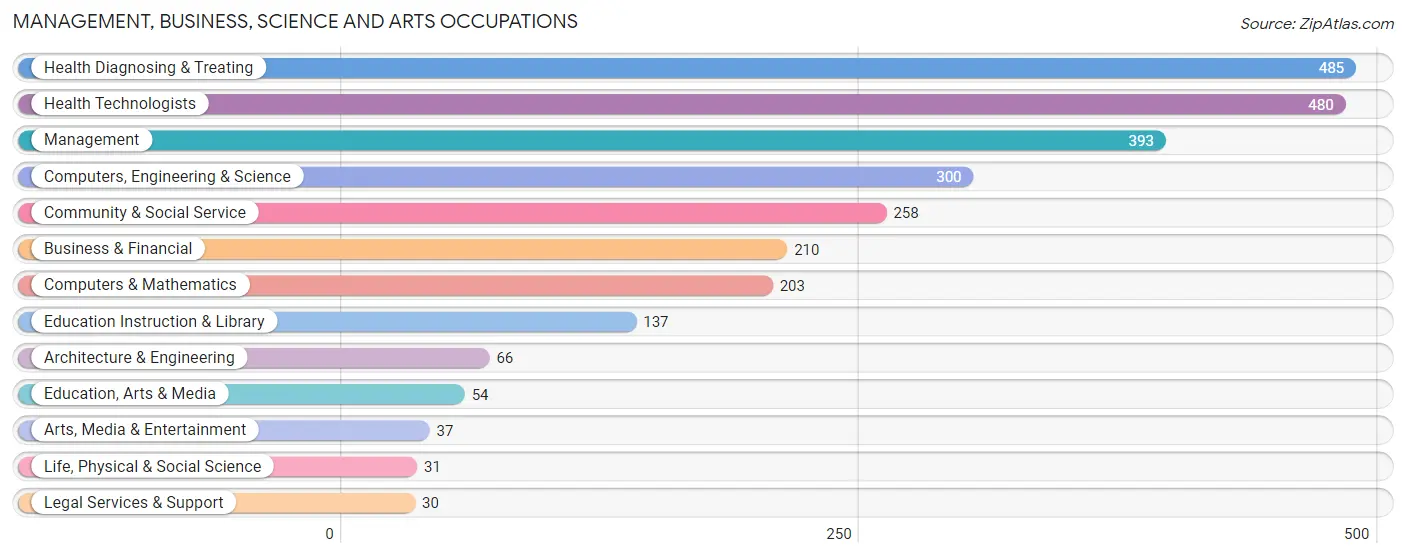
Management, Business, Science and Arts Occupations
The most common Management, Business, Science and Arts occupations in Searingtown are Health Diagnosing & Treating (485 | 20.3%), Health Technologists (480 | 20.1%), Management (393 | 16.5%), Computers, Engineering & Science (300 | 12.6%), and Community & Social Service (258 | 10.8%).
Management, Business, Science and Arts Occupations by Sex
Within the Management, Business, Science and Arts occupations in Searingtown, the most male-oriented occupations are Architecture & Engineering (100.0%), Computers & Mathematics (89.7%), and Legal Services & Support (83.3%), while the most female-oriented occupations are Life, Physical & Social Science (100.0%), Arts, Media & Entertainment (78.4%), and Health Technologists (69.2%).
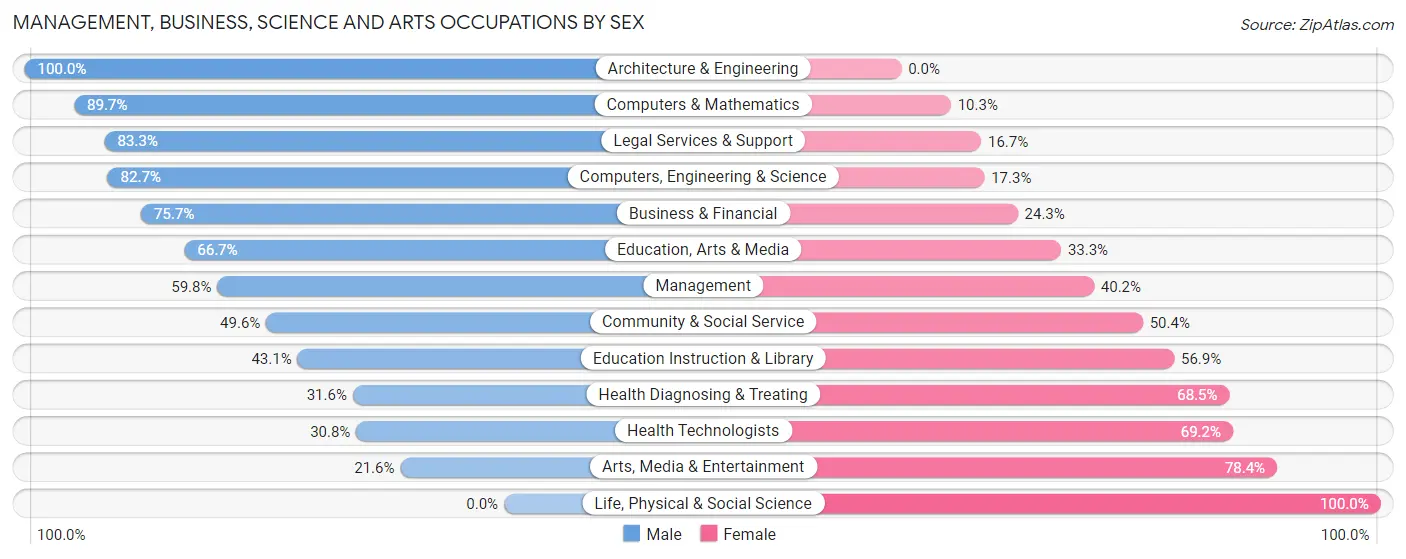
| Occupation | Male | Female |
| Management | 235 (59.8%) | 158 (40.2%) |
| Business & Financial | 159 (75.7%) | 51 (24.3%) |
| Computers, Engineering & Science | 248 (82.7%) | 52 (17.3%) |
| Computers & Mathematics | 182 (89.7%) | 21 (10.3%) |
| Architecture & Engineering | 66 (100.0%) | 0 (0.0%) |
| Life, Physical & Social Science | 0 (0.0%) | 31 (100.0%) |
| Community & Social Service | 128 (49.6%) | 130 (50.4%) |
| Education, Arts & Media | 36 (66.7%) | 18 (33.3%) |
| Legal Services & Support | 25 (83.3%) | 5 (16.7%) |
| Education Instruction & Library | 59 (43.1%) | 78 (56.9%) |
| Arts, Media & Entertainment | 8 (21.6%) | 29 (78.4%) |
| Health Diagnosing & Treating | 153 (31.6%) | 332 (68.4%) |
| Health Technologists | 148 (30.8%) | 332 (69.2%) |
| Total (Category) | 923 (56.1%) | 723 (43.9%) |
| Total (Overall) | 1,263 (53.0%) | 1,120 (47.0%) |
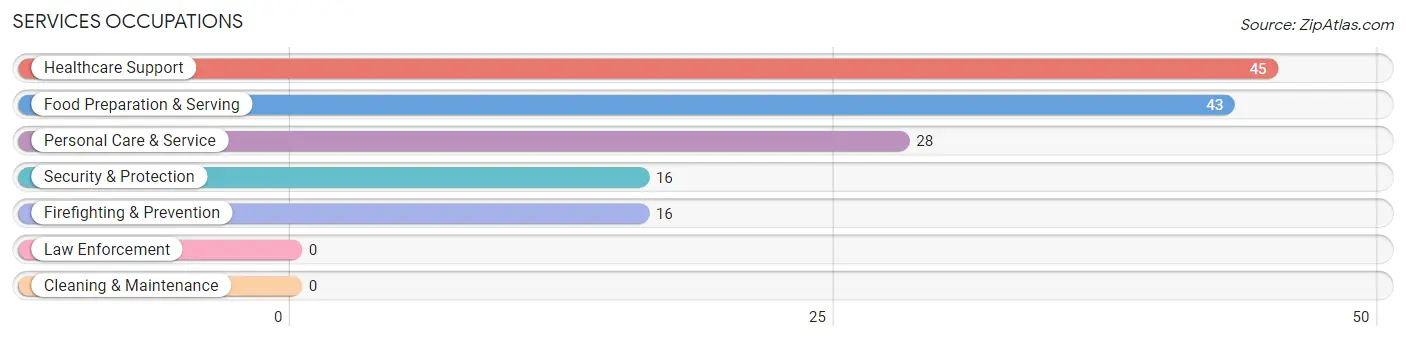
Services Occupations
The most common Services occupations in Searingtown are Healthcare Support (45 | 1.9%), Food Preparation & Serving (43 | 1.8%), Personal Care & Service (28 | 1.2%), Security & Protection (16 | 0.7%), and Firefighting & Prevention (16 | 0.7%).
Services Occupations by Sex
Within the Services occupations in Searingtown, the most male-oriented occupations are Personal Care & Service (25.0%), Food Preparation & Serving (23.3%), and Healthcare Support (20.0%), while the most female-oriented occupations are Security & Protection (100.0%), Firefighting & Prevention (100.0%), and Healthcare Support (80.0%).
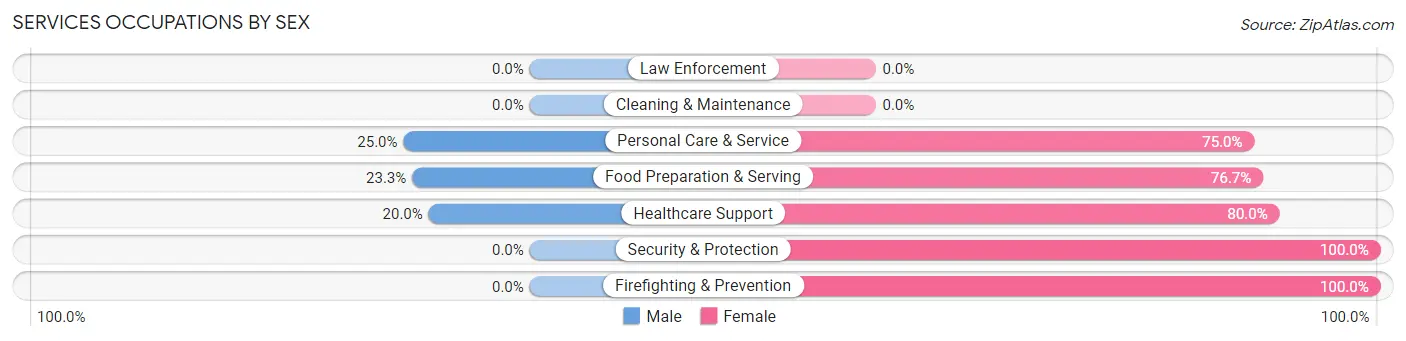
| Occupation | Male | Female |
| Healthcare Support | 9 (20.0%) | 36 (80.0%) |
| Security & Protection | 0 (0.0%) | 16 (100.0%) |
| Firefighting & Prevention | 0 (0.0%) | 16 (100.0%) |
| Law Enforcement | 0 (0.0%) | 0 (0.0%) |
| Food Preparation & Serving | 10 (23.3%) | 33 (76.7%) |
| Cleaning & Maintenance | 0 (0.0%) | 0 (0.0%) |
| Personal Care & Service | 7 (25.0%) | 21 (75.0%) |
| Total (Category) | 26 (19.7%) | 106 (80.3%) |
| Total (Overall) | 1,263 (53.0%) | 1,120 (47.0%) |
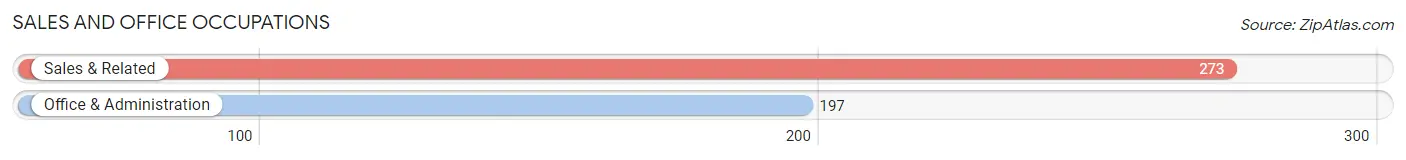
Sales and Office Occupations
The most common Sales and Office occupations in Searingtown are Sales & Related (273 | 11.5%), and Office & Administration (197 | 8.3%).
Sales and Office Occupations by Sex
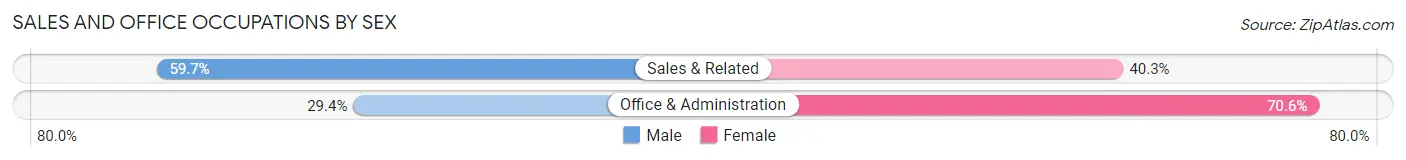
| Occupation | Male | Female |
| Sales & Related | 163 (59.7%) | 110 (40.3%) |
| Office & Administration | 58 (29.4%) | 139 (70.6%) |
| Total (Category) | 221 (47.0%) | 249 (53.0%) |
| Total (Overall) | 1,263 (53.0%) | 1,120 (47.0%) |
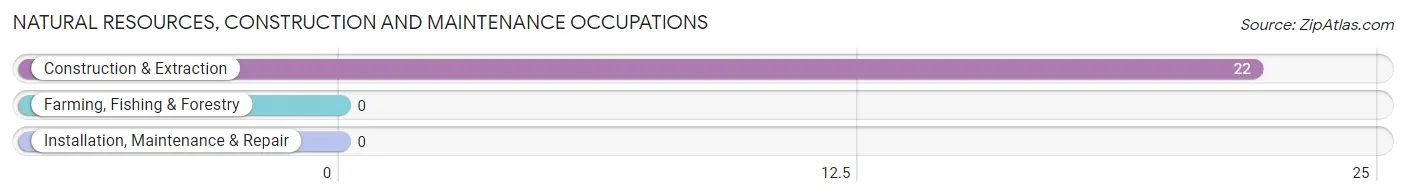
Natural Resources, Construction and Maintenance Occupations
The most common Natural Resources, Construction and Maintenance occupations in Searingtown are , and Construction & Extraction (22 | 0.9%).
Natural Resources, Construction and Maintenance Occupations by Sex
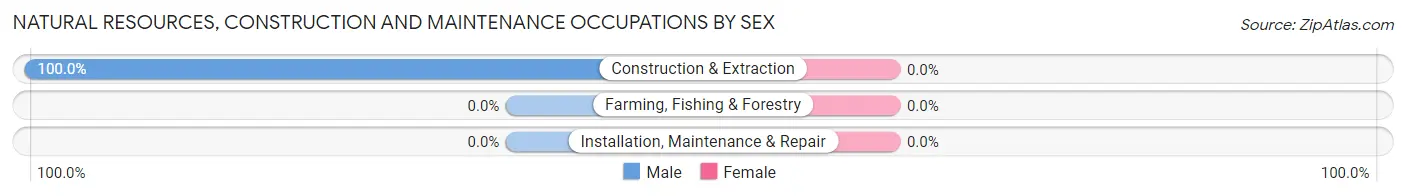
| Occupation | Male | Female |
| Farming, Fishing & Forestry | 0 (0.0%) | 0 (0.0%) |
| Construction & Extraction | 22 (100.0%) | 0 (0.0%) |
| Installation, Maintenance & Repair | 0 (0.0%) | 0 (0.0%) |
| Total (Category) | 22 (100.0%) | 0 (0.0%) |
| Total (Overall) | 1,263 (53.0%) | 1,120 (47.0%) |
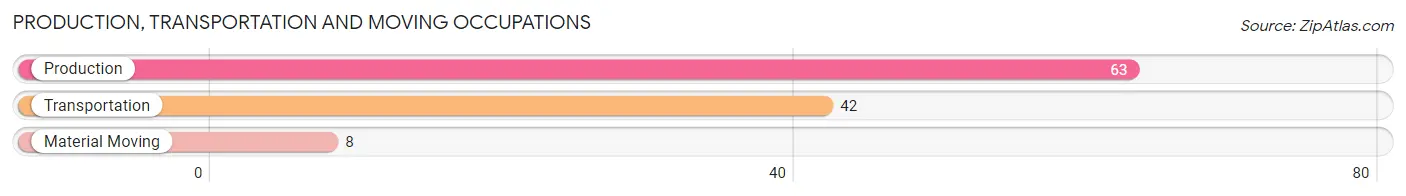
Production, Transportation and Moving Occupations
The most common Production, Transportation and Moving occupations in Searingtown are Production (63 | 2.6%), Transportation (42 | 1.8%), and Material Moving (8 | 0.3%).
Production, Transportation and Moving Occupations by Sex
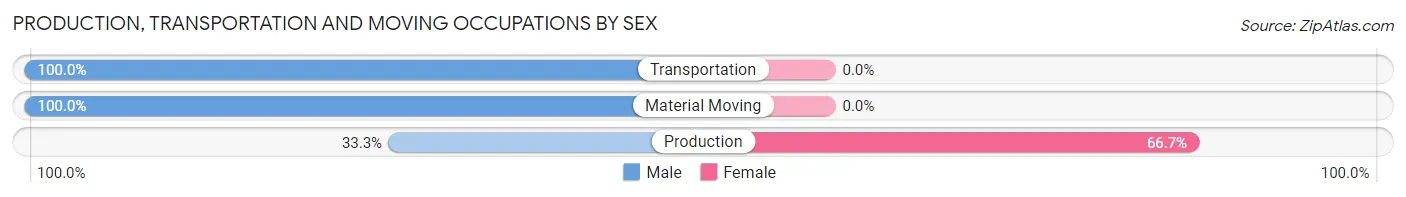
| Occupation | Male | Female |
| Production | 21 (33.3%) | 42 (66.7%) |
| Transportation | 42 (100.0%) | 0 (0.0%) |
| Material Moving | 8 (100.0%) | 0 (0.0%) |
| Total (Category) | 71 (62.8%) | 42 (37.2%) |
| Total (Overall) | 1,263 (53.0%) | 1,120 (47.0%) |
Employment Industries by Sex in Searingtown
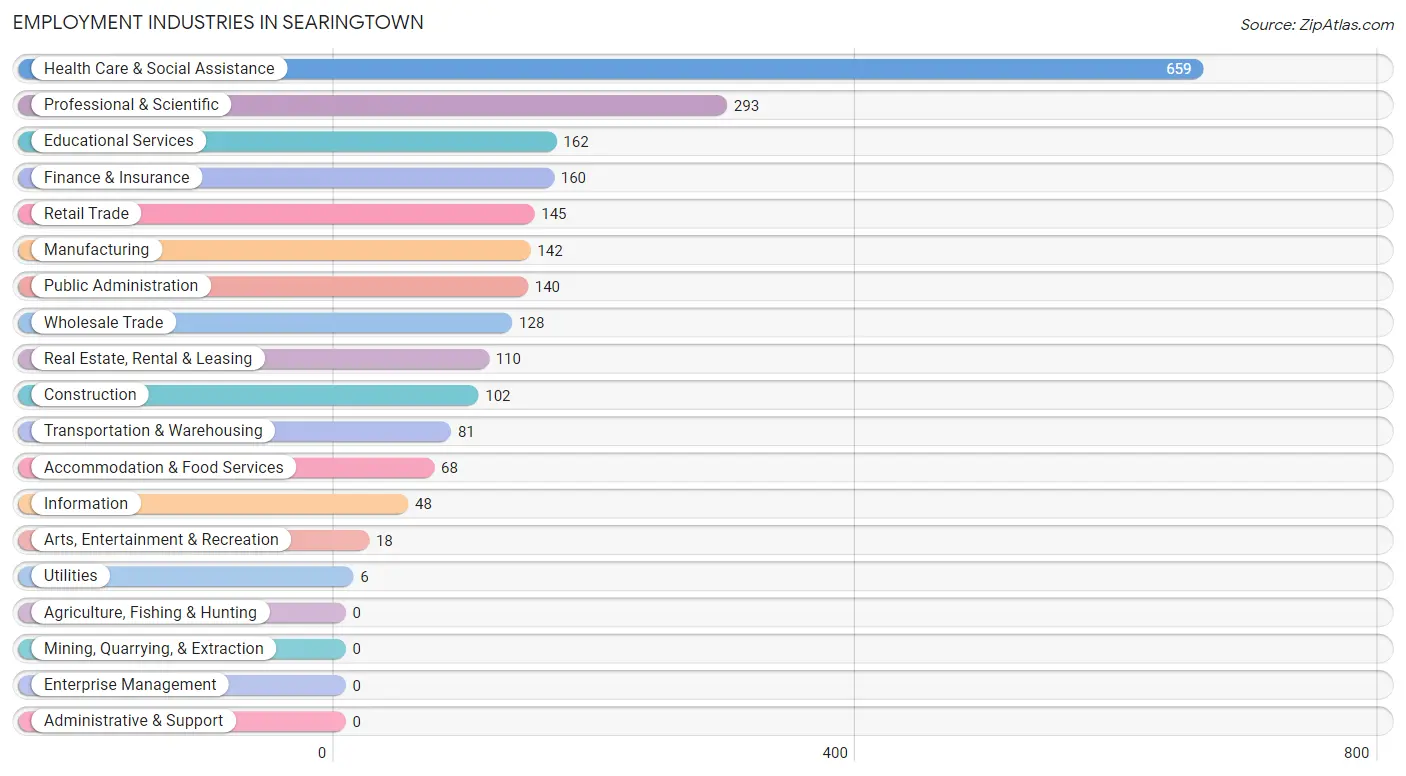
Employment Industries in Searingtown
The major employment industries in Searingtown include Health Care & Social Assistance (659 | 27.7%), Professional & Scientific (293 | 12.3%), Educational Services (162 | 6.8%), Finance & Insurance (160 | 6.7%), and Retail Trade (145 | 6.1%).
Employment Industries by Sex in Searingtown
The Searingtown industries that see more men than women are Utilities (100.0%), Information (100.0%), and Public Administration (81.4%), whereas the industries that tend to have a higher number of women are Health Care & Social Assistance (68.3%), Arts, Entertainment & Recreation (61.1%), and Accommodation & Food Services (57.4%).
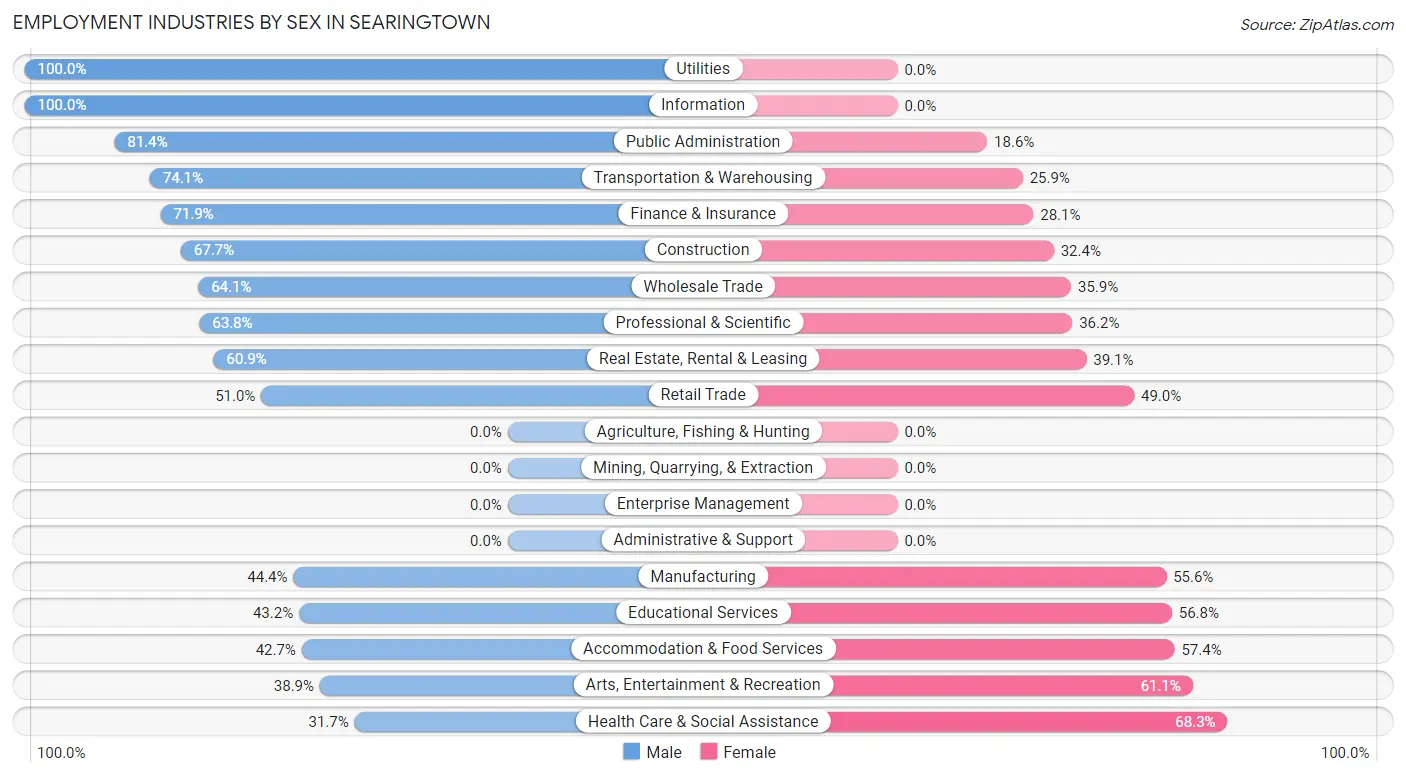
| Industry | Male | Female |
| Agriculture, Fishing & Hunting | 0 (0.0%) | 0 (0.0%) |
| Mining, Quarrying, & Extraction | 0 (0.0%) | 0 (0.0%) |
| Construction | 69 (67.6%) | 33 (32.4%) |
| Manufacturing | 63 (44.4%) | 79 (55.6%) |
| Wholesale Trade | 82 (64.1%) | 46 (35.9%) |
| Retail Trade | 74 (51.0%) | 71 (49.0%) |
| Transportation & Warehousing | 60 (74.1%) | 21 (25.9%) |
| Utilities | 6 (100.0%) | 0 (0.0%) |
| Information | 48 (100.0%) | 0 (0.0%) |
| Finance & Insurance | 115 (71.9%) | 45 (28.1%) |
| Real Estate, Rental & Leasing | 67 (60.9%) | 43 (39.1%) |
| Professional & Scientific | 187 (63.8%) | 106 (36.2%) |
| Enterprise Management | 0 (0.0%) | 0 (0.0%) |
| Administrative & Support | 0 (0.0%) | 0 (0.0%) |
| Educational Services | 70 (43.2%) | 92 (56.8%) |
| Health Care & Social Assistance | 209 (31.7%) | 450 (68.3%) |
| Arts, Entertainment & Recreation | 7 (38.9%) | 11 (61.1%) |
| Accommodation & Food Services | 29 (42.6%) | 39 (57.4%) |
| Public Administration | 114 (81.4%) | 26 (18.6%) |
| Total | 1,263 (53.0%) | 1,120 (47.0%) |
Education in Searingtown
School Enrollment in Searingtown
The most common levels of schooling among the 989 students in Searingtown are high school (276 | 27.9%), middle school (237 | 24.0%), and college / undergraduate (180 | 18.2%).
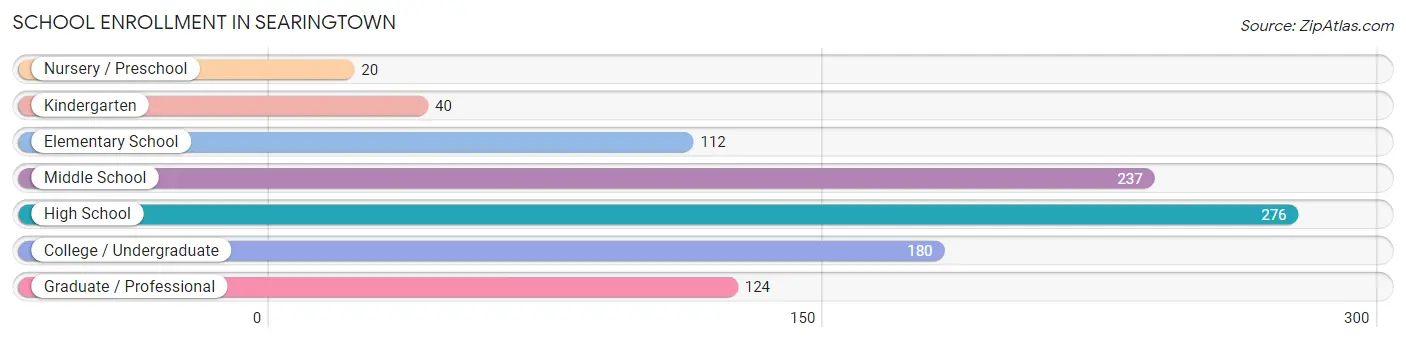
| School Level | # Students | % Students |
| Nursery / Preschool | 20 | 2.0% |
| Kindergarten | 40 | 4.0% |
| Elementary School | 112 | 11.3% |
| Middle School | 237 | 24.0% |
| High School | 276 | 27.9% |
| College / Undergraduate | 180 | 18.2% |
| Graduate / Professional | 124 | 12.5% |
| Total | 989 | 100.0% |
School Enrollment by Age by Funding Source in Searingtown
Out of a total of 989 students who are enrolled in schools in Searingtown, 234 (23.7%) attend a private institution, while the remaining 755 (76.3%) are enrolled in public schools. The age group of 3 to 4 year olds has the highest likelihood of being enrolled in private schools, with 11 (100.0% in the age bracket) enrolled. Conversely, the age group of 35 years and over has the lowest likelihood of being enrolled in a private school, with 11 (100.0% in the age bracket) attending a public institution.
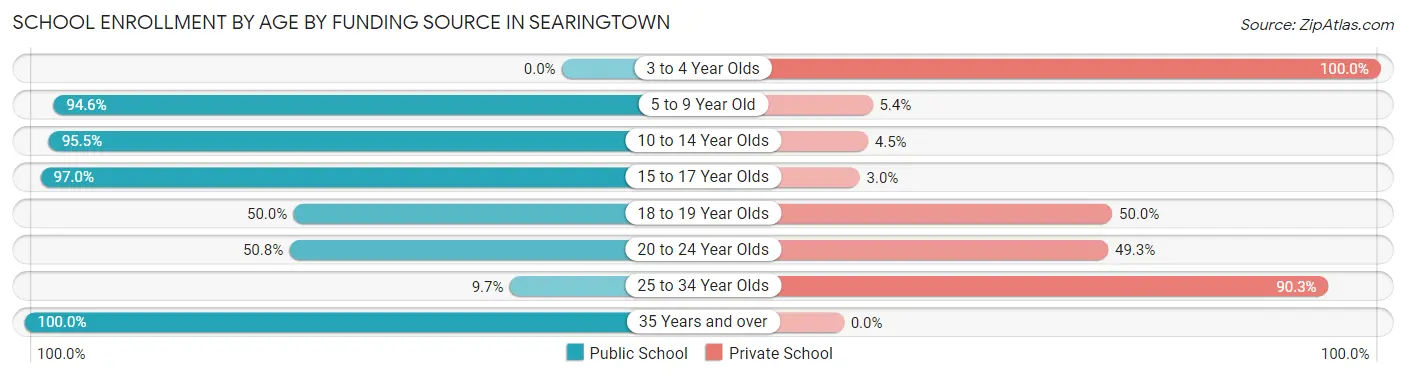
| Age Bracket | Public School | Private School |
| 3 to 4 Year Olds | 0 (0.0%) | 11 (100.0%) |
| 5 to 9 Year Old | 159 (94.6%) | 9 (5.4%) |
| 10 to 14 Year Olds | 276 (95.5%) | 13 (4.5%) |
| 15 to 17 Year Olds | 196 (97.0%) | 6 (3.0%) |
| 18 to 19 Year Olds | 69 (50.0%) | 69 (50.0%) |
| 20 to 24 Year Olds | 34 (50.7%) | 33 (49.2%) |
| 25 to 34 Year Olds | 10 (9.7%) | 93 (90.3%) |
| 35 Years and over | 11 (100.0%) | 0 (0.0%) |
| Total | 755 (76.3%) | 234 (23.7%) |
Educational Attainment by Field of Study in Searingtown
Business (590 | 22.4%), science & technology (388 | 14.7%), education (302 | 11.5%), engineering (275 | 10.5%), and bio, nature & agricultural (202 | 7.7%) are the most common fields of study among 2,630 individuals in Searingtown who have obtained a bachelor's degree or higher.
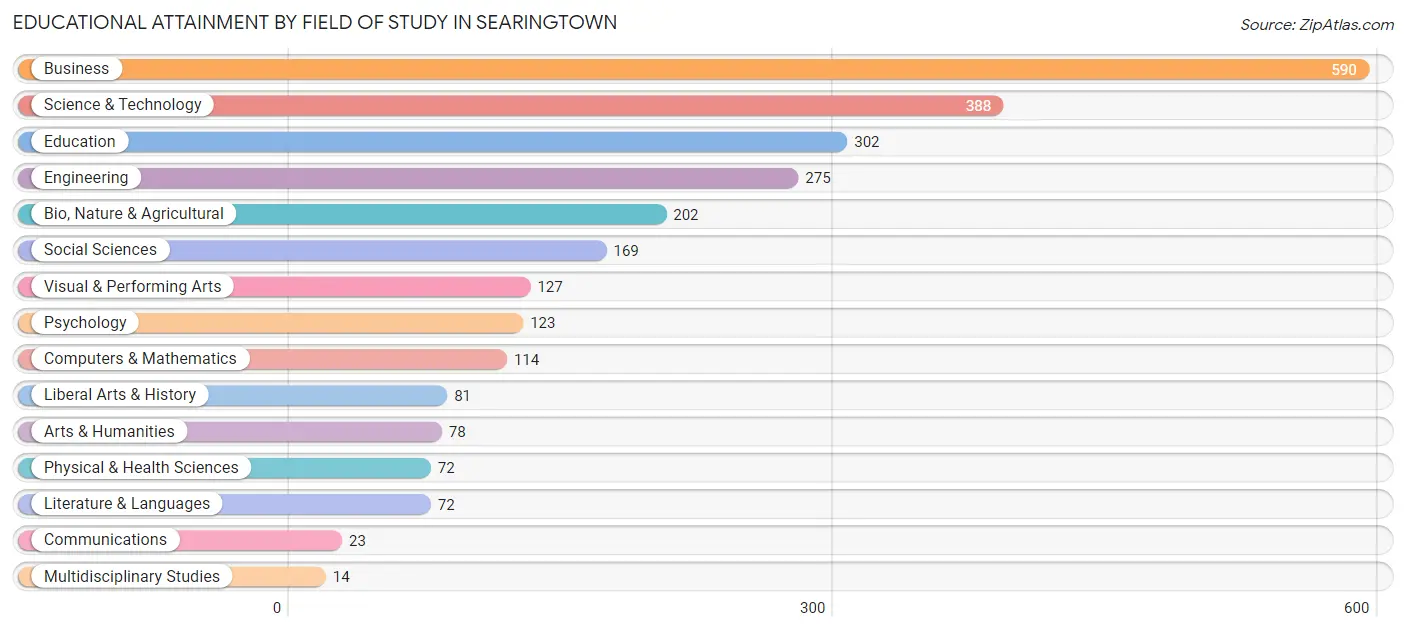
| Field of Study | # Graduates | % Graduates |
| Computers & Mathematics | 114 | 4.3% |
| Bio, Nature & Agricultural | 202 | 7.7% |
| Physical & Health Sciences | 72 | 2.7% |
| Psychology | 123 | 4.7% |
| Social Sciences | 169 | 6.4% |
| Engineering | 275 | 10.5% |
| Multidisciplinary Studies | 14 | 0.5% |
| Science & Technology | 388 | 14.7% |
| Business | 590 | 22.4% |
| Education | 302 | 11.5% |
| Literature & Languages | 72 | 2.7% |
| Liberal Arts & History | 81 | 3.1% |
| Visual & Performing Arts | 127 | 4.8% |
| Communications | 23 | 0.9% |
| Arts & Humanities | 78 | 3.0% |
| Total | 2,630 | 100.0% |
Transportation & Commute in Searingtown
Vehicle Availability by Sex in Searingtown
The most prevalent vehicle ownership categories in Searingtown are males with 2 vehicles (550, accounting for 43.8%) and females with 2 vehicles (450, making up 50.0%).
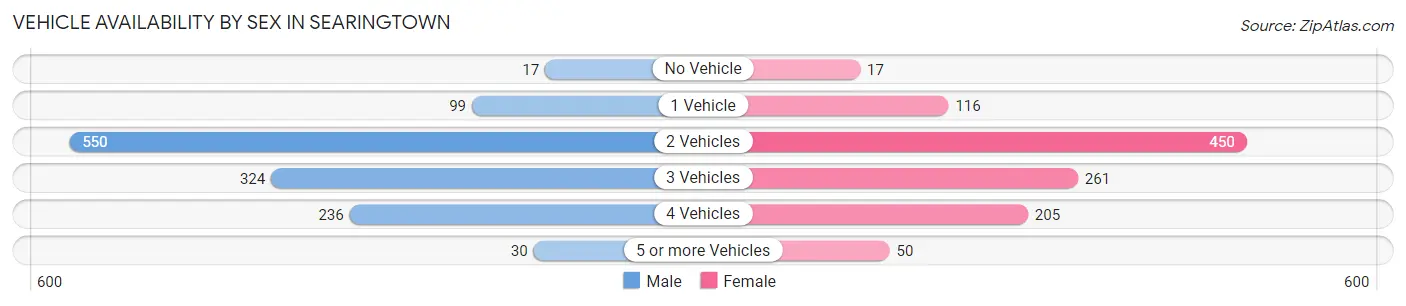
| Vehicles Available | Male | Female |
| No Vehicle | 17 (1.3%) | 17 (1.5%) |
| 1 Vehicle | 99 (7.9%) | 116 (10.6%) |
| 2 Vehicles | 550 (43.8%) | 450 (40.9%) |
| 3 Vehicles | 324 (25.8%) | 261 (23.7%) |
| 4 Vehicles | 236 (18.8%) | 205 (18.6%) |
| 5 or more Vehicles | 30 (2.4%) | 50 (4.5%) |
| Total | 1,256 (100.0%) | 1,099 (100.0%) |
Commute Time in Searingtown
The most frequently occuring commute durations in Searingtown are 20 to 24 minutes (419 commuters, 20.9%), 15 to 19 minutes (296 commuters, 14.7%), and 30 to 34 minutes (285 commuters, 14.2%).
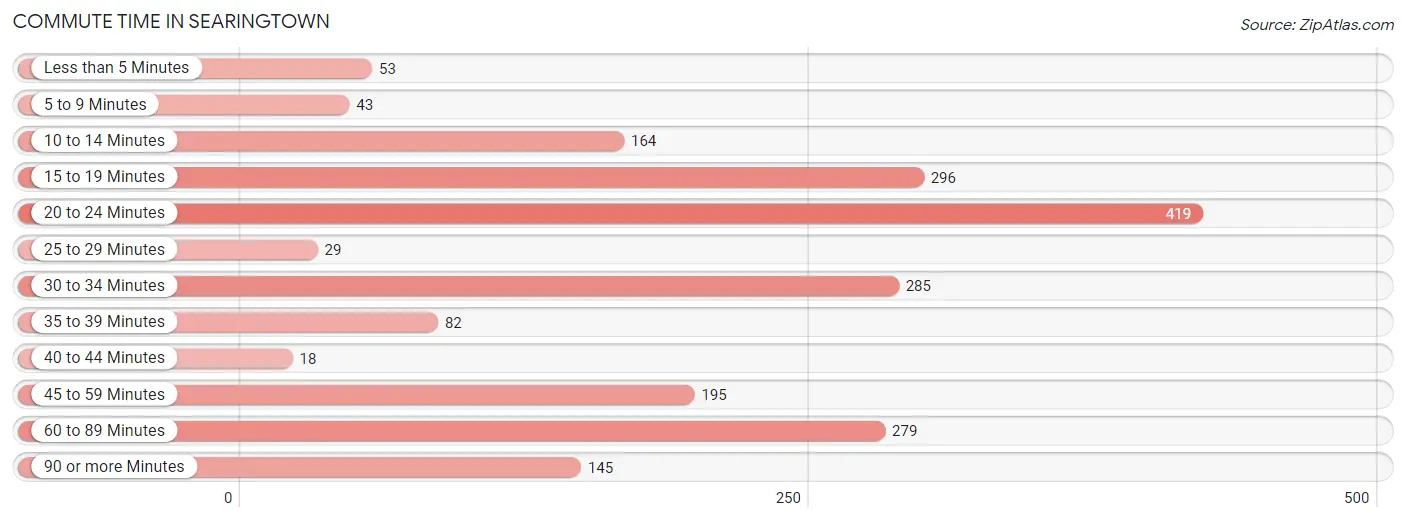
| Commute Time | # Commuters | % Commuters |
| Less than 5 Minutes | 53 | 2.6% |
| 5 to 9 Minutes | 43 | 2.1% |
| 10 to 14 Minutes | 164 | 8.2% |
| 15 to 19 Minutes | 296 | 14.7% |
| 20 to 24 Minutes | 419 | 20.9% |
| 25 to 29 Minutes | 29 | 1.4% |
| 30 to 34 Minutes | 285 | 14.2% |
| 35 to 39 Minutes | 82 | 4.1% |
| 40 to 44 Minutes | 18 | 0.9% |
| 45 to 59 Minutes | 195 | 9.7% |
| 60 to 89 Minutes | 279 | 13.9% |
| 90 or more Minutes | 145 | 7.2% |
Commute Time by Sex in Searingtown
The most common commute times in Searingtown are 60 to 89 minutes (233 commuters, 21.3%) for males and 20 to 24 minutes (238 commuters, 26.0%) for females.
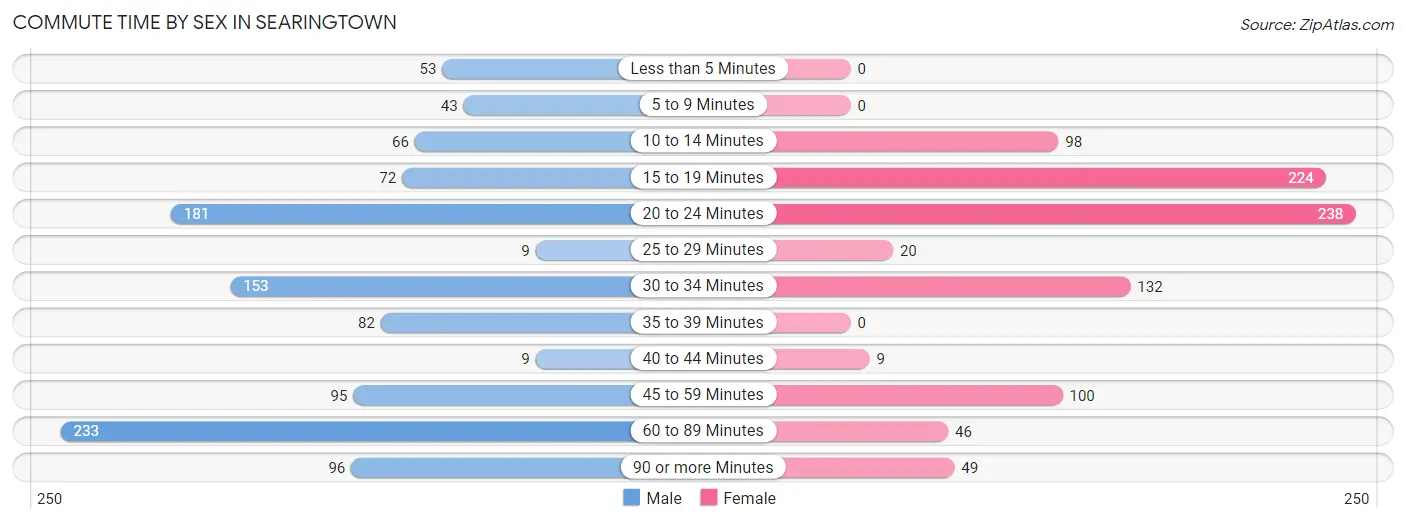
| Commute Time | Male | Female |
| Less than 5 Minutes | 53 (4.9%) | 0 (0.0%) |
| 5 to 9 Minutes | 43 (3.9%) | 0 (0.0%) |
| 10 to 14 Minutes | 66 (6.0%) | 98 (10.7%) |
| 15 to 19 Minutes | 72 (6.6%) | 224 (24.4%) |
| 20 to 24 Minutes | 181 (16.6%) | 238 (26.0%) |
| 25 to 29 Minutes | 9 (0.8%) | 20 (2.2%) |
| 30 to 34 Minutes | 153 (14.0%) | 132 (14.4%) |
| 35 to 39 Minutes | 82 (7.5%) | 0 (0.0%) |
| 40 to 44 Minutes | 9 (0.8%) | 9 (1.0%) |
| 45 to 59 Minutes | 95 (8.7%) | 100 (10.9%) |
| 60 to 89 Minutes | 233 (21.3%) | 46 (5.0%) |
| 90 or more Minutes | 96 (8.8%) | 49 (5.3%) |
Time of Departure to Work by Sex in Searingtown
The most frequent times of departure to work in Searingtown are 8:00 AM to 8:29 AM (255, 23.4%) for males and 9:00 AM to 9:59 AM (183, 20.0%) for females.
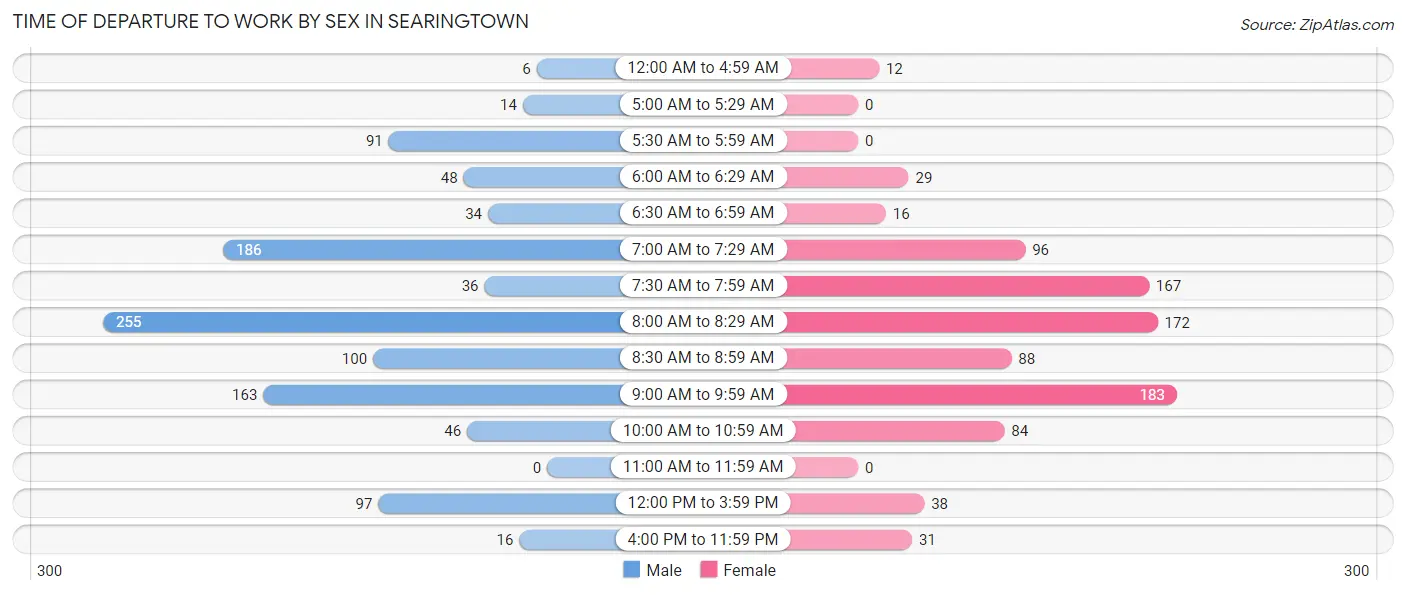
| Time of Departure | Male | Female |
| 12:00 AM to 4:59 AM | 6 (0.5%) | 12 (1.3%) |
| 5:00 AM to 5:29 AM | 14 (1.3%) | 0 (0.0%) |
| 5:30 AM to 5:59 AM | 91 (8.3%) | 0 (0.0%) |
| 6:00 AM to 6:29 AM | 48 (4.4%) | 29 (3.2%) |
| 6:30 AM to 6:59 AM | 34 (3.1%) | 16 (1.8%) |
| 7:00 AM to 7:29 AM | 186 (17.0%) | 96 (10.5%) |
| 7:30 AM to 7:59 AM | 36 (3.3%) | 167 (18.2%) |
| 8:00 AM to 8:29 AM | 255 (23.4%) | 172 (18.8%) |
| 8:30 AM to 8:59 AM | 100 (9.2%) | 88 (9.6%) |
| 9:00 AM to 9:59 AM | 163 (14.9%) | 183 (20.0%) |
| 10:00 AM to 10:59 AM | 46 (4.2%) | 84 (9.2%) |
| 11:00 AM to 11:59 AM | 0 (0.0%) | 0 (0.0%) |
| 12:00 PM to 3:59 PM | 97 (8.9%) | 38 (4.2%) |
| 4:00 PM to 11:59 PM | 16 (1.5%) | 31 (3.4%) |
| Total | 1,092 (100.0%) | 916 (100.0%) |
Housing Occupancy in Searingtown
Occupancy by Ownership in Searingtown
Of the total 1,572 dwellings in Searingtown, owner-occupied units account for 1,528 (97.2%), while renter-occupied units make up 44 (2.8%).
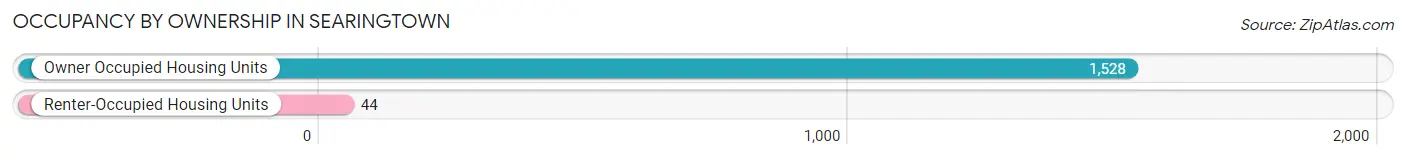
| Occupancy | # Housing Units | % Housing Units |
| Owner Occupied Housing Units | 1,528 | 97.2% |
| Renter-Occupied Housing Units | 44 | 2.8% |
| Total Occupied Housing Units | 1,572 | 100.0% |
Occupancy by Household Size in Searingtown
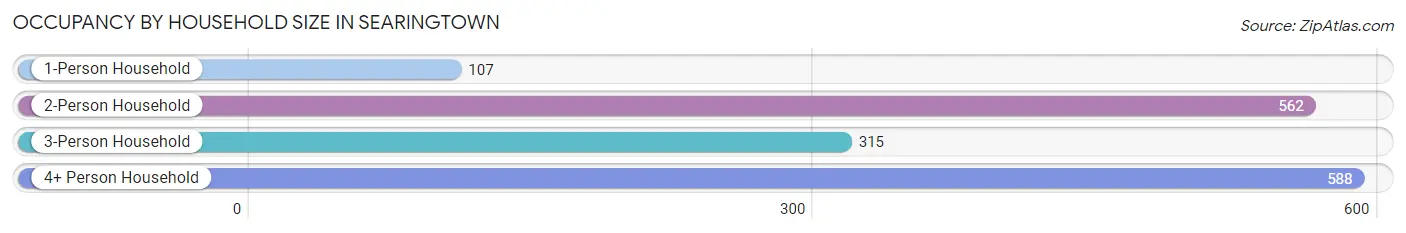
| Household Size | # Housing Units | % Housing Units |
| 1-Person Household | 107 | 6.8% |
| 2-Person Household | 562 | 35.7% |
| 3-Person Household | 315 | 20.0% |
| 4+ Person Household | 588 | 37.4% |
| Total Housing Units | 1,572 | 100.0% |
Occupancy by Ownership by Household Size in Searingtown
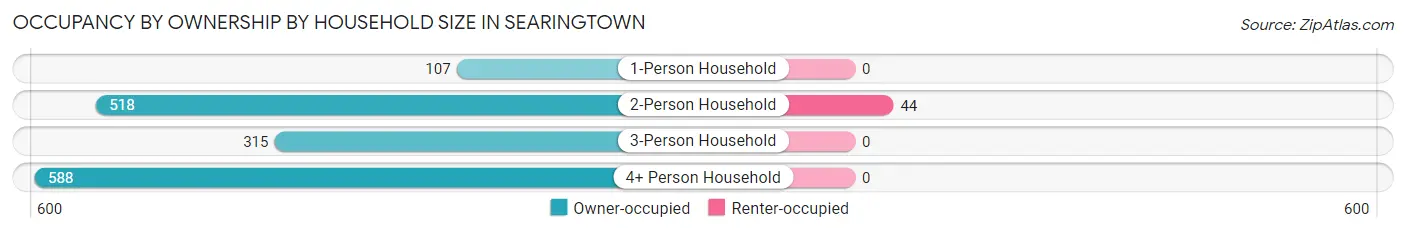
| Household Size | Owner-occupied | Renter-occupied |
| 1-Person Household | 107 (100.0%) | 0 (0.0%) |
| 2-Person Household | 518 (92.2%) | 44 (7.8%) |
| 3-Person Household | 315 (100.0%) | 0 (0.0%) |
| 4+ Person Household | 588 (100.0%) | 0 (0.0%) |
| Total Housing Units | 1,528 (97.2%) | 44 (2.8%) |
Occupancy by Educational Attainment in Searingtown
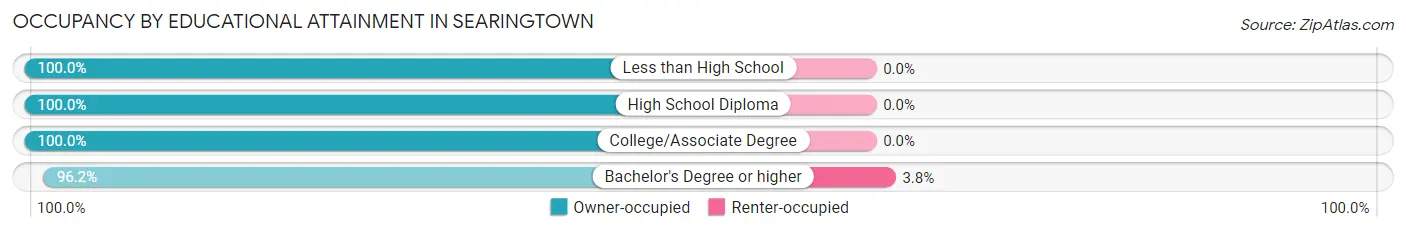
| Household Size | Owner-occupied | Renter-occupied |
| Less than High School | 39 (100.0%) | 0 (0.0%) |
| High School Diploma | 170 (100.0%) | 0 (0.0%) |
| College/Associate Degree | 212 (100.0%) | 0 (0.0%) |
| Bachelor's Degree or higher | 1,107 (96.2%) | 44 (3.8%) |
Occupancy by Age of Householder in Searingtown
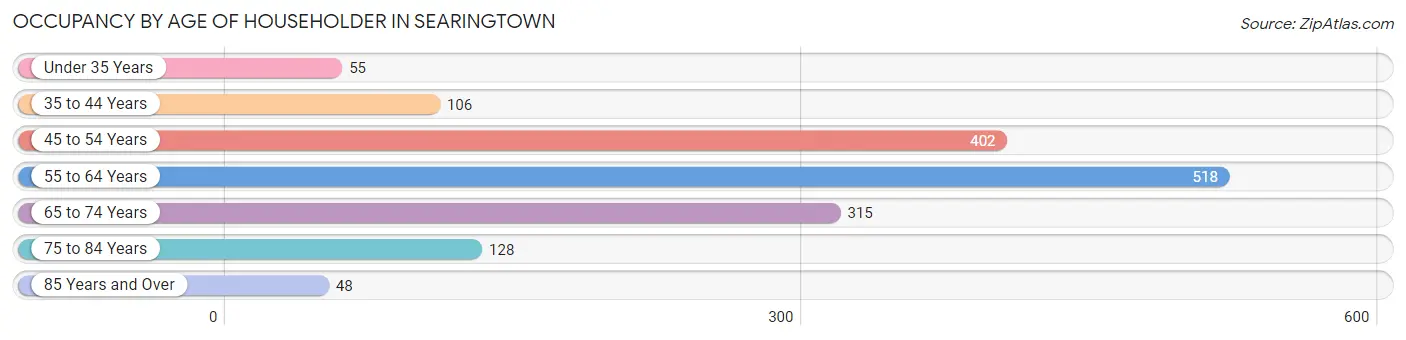
| Age Bracket | # Households | % Households |
| Under 35 Years | 55 | 3.5% |
| 35 to 44 Years | 106 | 6.7% |
| 45 to 54 Years | 402 | 25.6% |
| 55 to 64 Years | 518 | 33.0% |
| 65 to 74 Years | 315 | 20.0% |
| 75 to 84 Years | 128 | 8.1% |
| 85 Years and Over | 48 | 3.0% |
| Total | 1,572 | 100.0% |
Housing Finances in Searingtown
Median Income by Occupancy in Searingtown
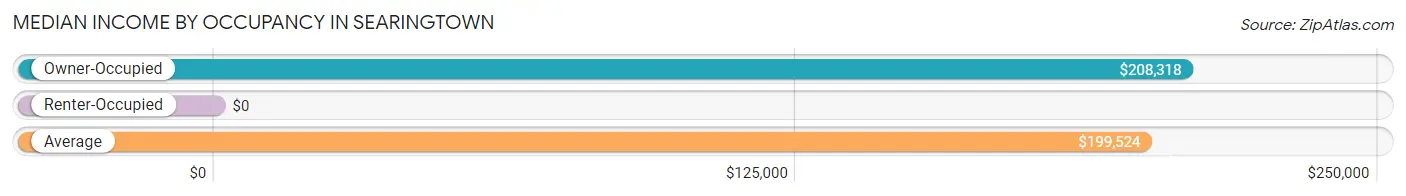
| Occupancy Type | # Households | Median Income |
| Owner-Occupied | 1,528 (97.2%) | $208,318 |
| Renter-Occupied | 44 (2.8%) | $0 |
| Average | 1,572 (100.0%) | $199,524 |
Occupancy by Householder Income Bracket in Searingtown
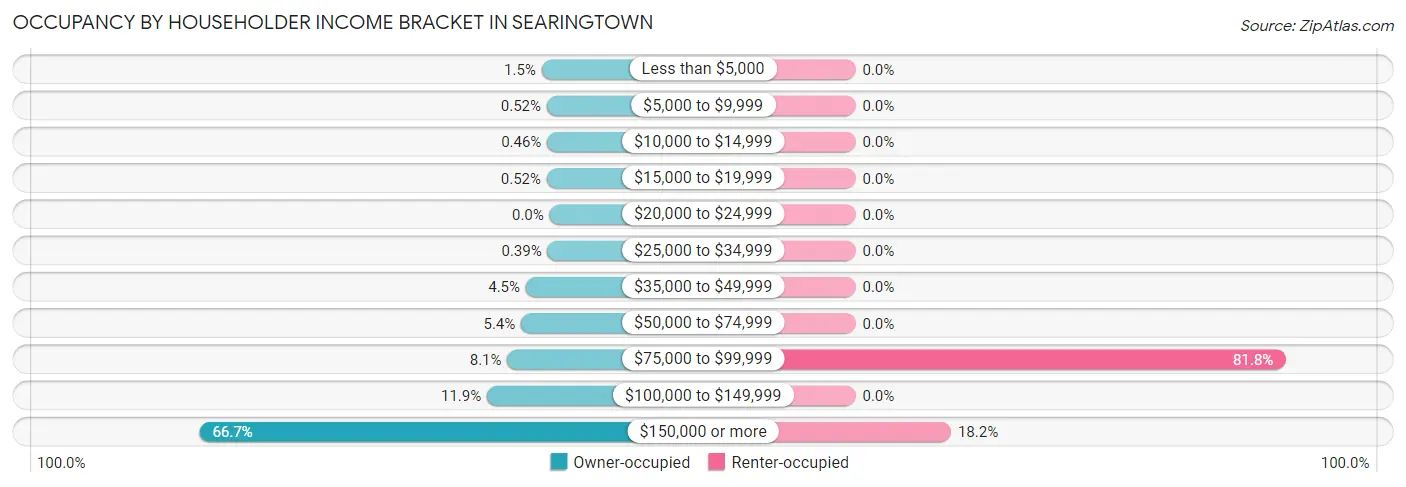
| Income Bracket | Owner-occupied | Renter-occupied |
| Less than $5,000 | 23 (1.5%) | 0 (0.0%) |
| $5,000 to $9,999 | 8 (0.5%) | 0 (0.0%) |
| $10,000 to $14,999 | 7 (0.5%) | 0 (0.0%) |
| $15,000 to $19,999 | 8 (0.5%) | 0 (0.0%) |
| $20,000 to $24,999 | 0 (0.0%) | 0 (0.0%) |
| $25,000 to $34,999 | 6 (0.4%) | 0 (0.0%) |
| $35,000 to $49,999 | 69 (4.5%) | 0 (0.0%) |
| $50,000 to $74,999 | 83 (5.4%) | 0 (0.0%) |
| $75,000 to $99,999 | 123 (8.1%) | 36 (81.8%) |
| $100,000 to $149,999 | 182 (11.9%) | 0 (0.0%) |
| $150,000 or more | 1,019 (66.7%) | 8 (18.2%) |
| Total | 1,528 (100.0%) | 44 (100.0%) |
Monthly Housing Cost Tiers in Searingtown
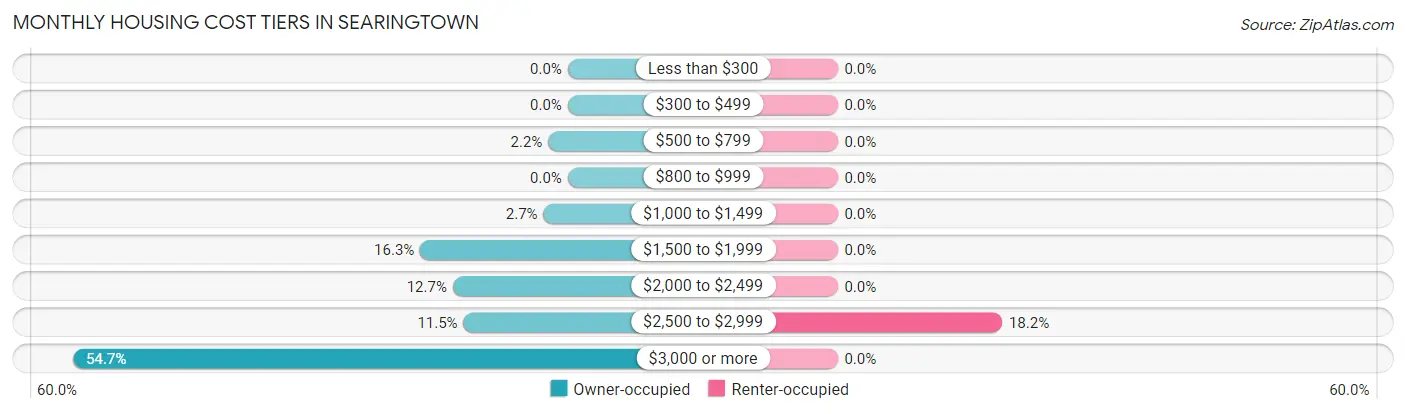
| Monthly Cost | Owner-occupied | Renter-occupied |
| Less than $300 | 0 (0.0%) | 0 (0.0%) |
| $300 to $499 | 0 (0.0%) | 0 (0.0%) |
| $500 to $799 | 33 (2.2%) | 0 (0.0%) |
| $800 to $999 | 0 (0.0%) | 0 (0.0%) |
| $1,000 to $1,499 | 41 (2.7%) | 0 (0.0%) |
| $1,500 to $1,999 | 249 (16.3%) | 0 (0.0%) |
| $2,000 to $2,499 | 194 (12.7%) | 0 (0.0%) |
| $2,500 to $2,999 | 176 (11.5%) | 8 (18.2%) |
| $3,000 or more | 835 (54.6%) | 0 (0.0%) |
| Total | 1,528 (100.0%) | 44 (100.0%) |
Physical Housing Characteristics in Searingtown
Housing Structures in Searingtown
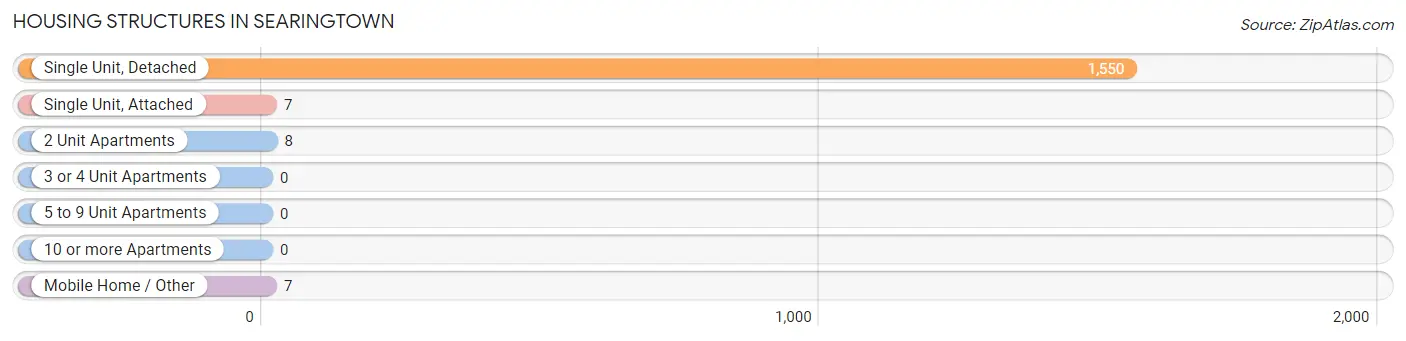
| Structure Type | # Housing Units | % Housing Units |
| Single Unit, Detached | 1,550 | 98.6% |
| Single Unit, Attached | 7 | 0.4% |
| 2 Unit Apartments | 8 | 0.5% |
| 3 or 4 Unit Apartments | 0 | 0.0% |
| 5 to 9 Unit Apartments | 0 | 0.0% |
| 10 or more Apartments | 0 | 0.0% |
| Mobile Home / Other | 7 | 0.4% |
| Total | 1,572 | 100.0% |
Housing Structures by Occupancy in Searingtown
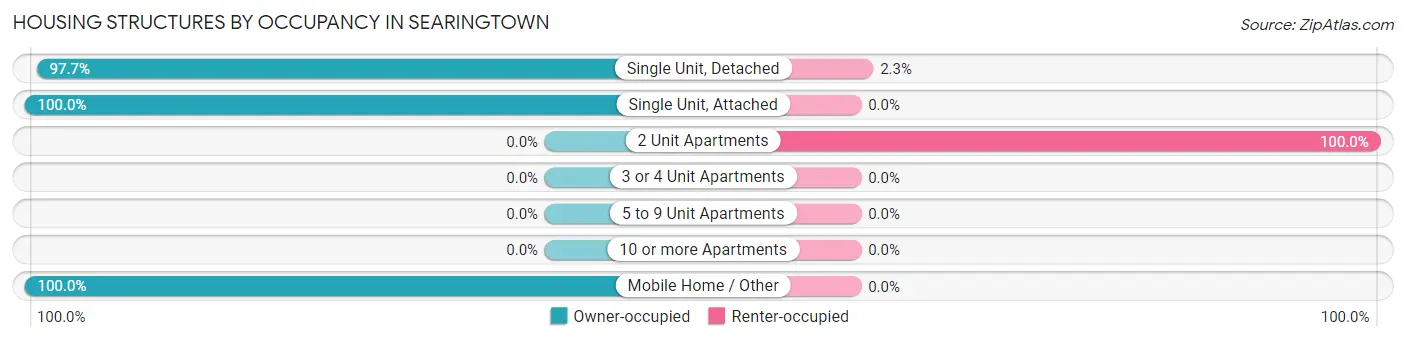
| Structure Type | Owner-occupied | Renter-occupied |
| Single Unit, Detached | 1,514 (97.7%) | 36 (2.3%) |
| Single Unit, Attached | 7 (100.0%) | 0 (0.0%) |
| 2 Unit Apartments | 0 (0.0%) | 8 (100.0%) |
| 3 or 4 Unit Apartments | 0 (0.0%) | 0 (0.0%) |
| 5 to 9 Unit Apartments | 0 (0.0%) | 0 (0.0%) |
| 10 or more Apartments | 0 (0.0%) | 0 (0.0%) |
| Mobile Home / Other | 7 (100.0%) | 0 (0.0%) |
| Total | 1,528 (97.2%) | 44 (2.8%) |
Housing Structures by Number of Rooms in Searingtown
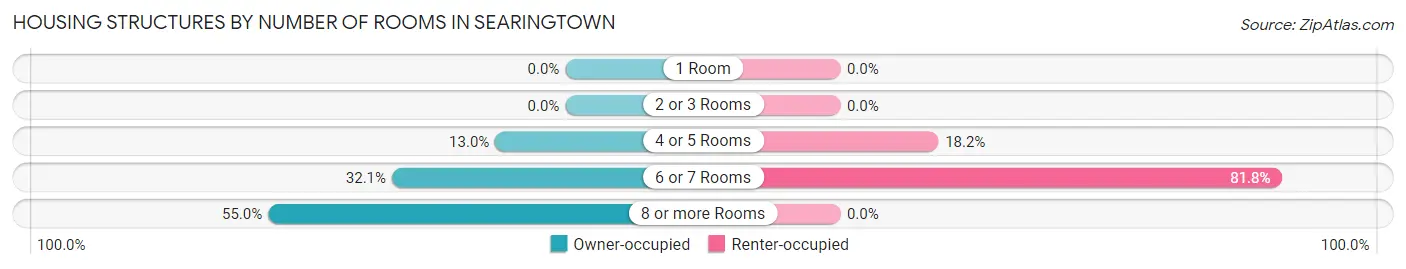
| Number of Rooms | Owner-occupied | Renter-occupied |
| 1 Room | 0 (0.0%) | 0 (0.0%) |
| 2 or 3 Rooms | 0 (0.0%) | 0 (0.0%) |
| 4 or 5 Rooms | 198 (13.0%) | 8 (18.2%) |
| 6 or 7 Rooms | 490 (32.1%) | 36 (81.8%) |
| 8 or more Rooms | 840 (55.0%) | 0 (0.0%) |
| Total | 1,528 (100.0%) | 44 (100.0%) |
Housing Structure by Heating Type in Searingtown
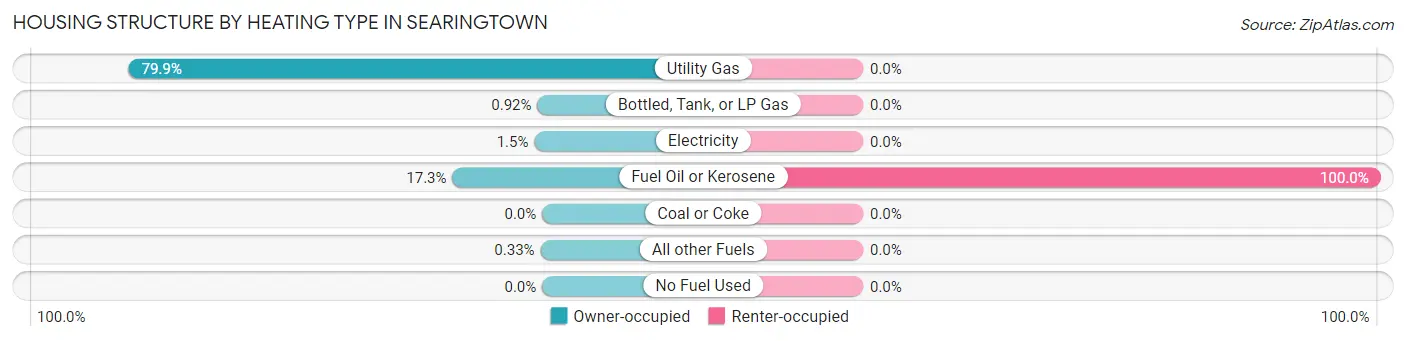
| Heating Type | Owner-occupied | Renter-occupied |
| Utility Gas | 1,221 (79.9%) | 0 (0.0%) |
| Bottled, Tank, or LP Gas | 14 (0.9%) | 0 (0.0%) |
| Electricity | 23 (1.5%) | 0 (0.0%) |
| Fuel Oil or Kerosene | 265 (17.3%) | 44 (100.0%) |
| Coal or Coke | 0 (0.0%) | 0 (0.0%) |
| All other Fuels | 5 (0.3%) | 0 (0.0%) |
| No Fuel Used | 0 (0.0%) | 0 (0.0%) |
| Total | 1,528 (100.0%) | 44 (100.0%) |
Household Vehicle Usage in Searingtown
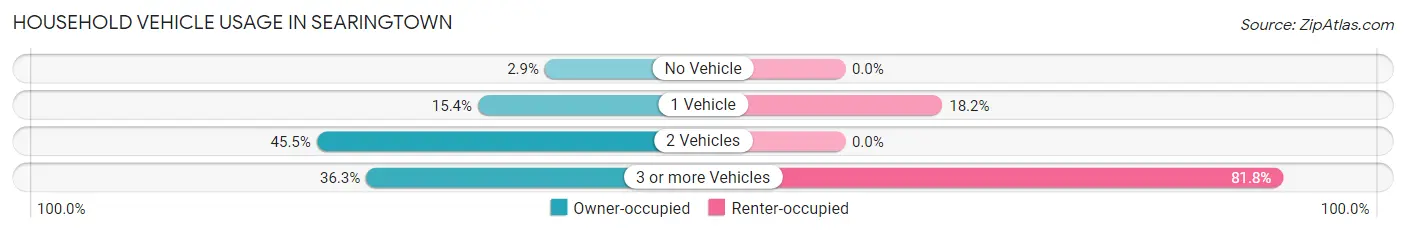
| Vehicles per Household | Owner-occupied | Renter-occupied |
| No Vehicle | 44 (2.9%) | 0 (0.0%) |
| 1 Vehicle | 235 (15.4%) | 8 (18.2%) |
| 2 Vehicles | 695 (45.5%) | 0 (0.0%) |
| 3 or more Vehicles | 554 (36.3%) | 36 (81.8%) |
| Total | 1,528 (100.0%) | 44 (100.0%) |
Real Estate & Mortgages in Searingtown
Real Estate and Mortgage Overview in Searingtown
| Characteristic | Without Mortgage | With Mortgage |
| Housing Units | 655 | 873 |
| Median Property Value | $979,600 | $1,076,500 |
| Median Household Income | $158,631 | $682 |
| Monthly Housing Costs | $1,501 | $772 |
| Real Estate Taxes | $10,001 | $0 |
Property Value by Mortgage Status in Searingtown
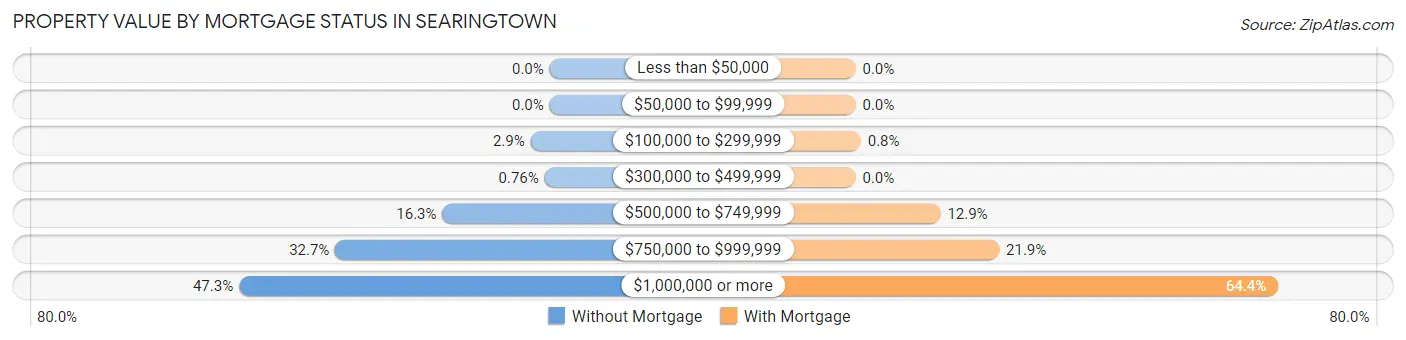
| Property Value | Without Mortgage | With Mortgage |
| Less than $50,000 | 0 (0.0%) | 0 (0.0%) |
| $50,000 to $99,999 | 0 (0.0%) | 0 (0.0%) |
| $100,000 to $299,999 | 19 (2.9%) | 7 (0.8%) |
| $300,000 to $499,999 | 5 (0.8%) | 0 (0.0%) |
| $500,000 to $749,999 | 107 (16.3%) | 113 (12.9%) |
| $750,000 to $999,999 | 214 (32.7%) | 191 (21.9%) |
| $1,000,000 or more | 310 (47.3%) | 562 (64.4%) |
| Total | 655 (100.0%) | 873 (100.0%) |
Household Income by Mortgage Status in Searingtown
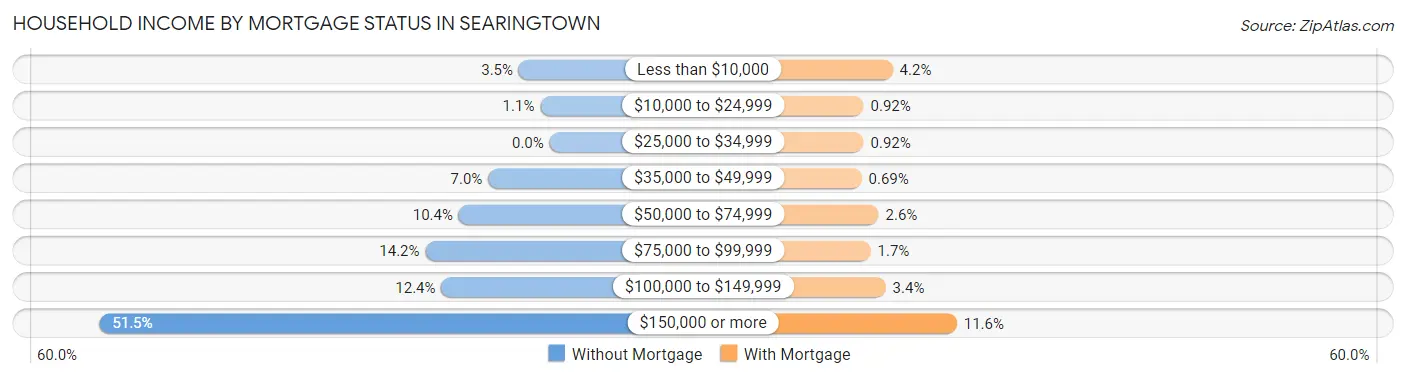
| Household Income | Without Mortgage | With Mortgage |
| Less than $10,000 | 23 (3.5%) | 37 (4.2%) |
| $10,000 to $24,999 | 7 (1.1%) | 8 (0.9%) |
| $25,000 to $34,999 | 0 (0.0%) | 8 (0.9%) |
| $35,000 to $49,999 | 46 (7.0%) | 6 (0.7%) |
| $50,000 to $74,999 | 68 (10.4%) | 23 (2.6%) |
| $75,000 to $99,999 | 93 (14.2%) | 15 (1.7%) |
| $100,000 to $149,999 | 81 (12.4%) | 30 (3.4%) |
| $150,000 or more | 337 (51.4%) | 101 (11.6%) |
| Total | 655 (100.0%) | 873 (100.0%) |
Property Value to Household Income Ratio in Searingtown
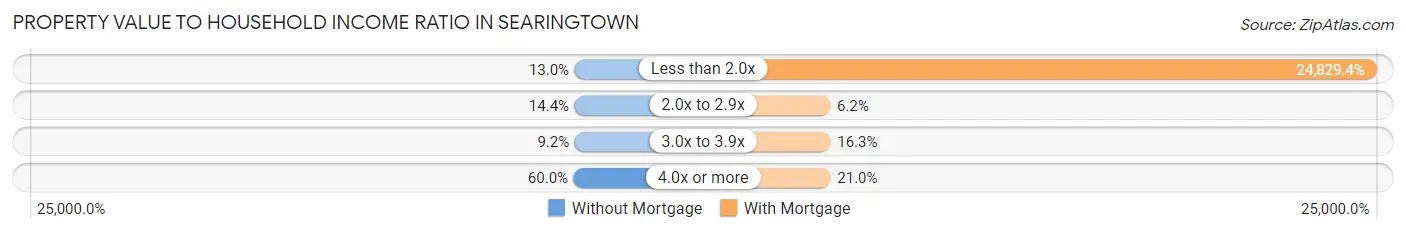
| Value-to-Income Ratio | Without Mortgage | With Mortgage |
| Less than 2.0x | 85 (13.0%) | 216,761 (24,829.4%) |
| 2.0x to 2.9x | 94 (14.3%) | 54 (6.2%) |
| 3.0x to 3.9x | 60 (9.2%) | 142 (16.3%) |
| 4.0x or more | 393 (60.0%) | 183 (21.0%) |
| Total | 655 (100.0%) | 873 (100.0%) |
Real Estate Taxes by Mortgage Status in Searingtown
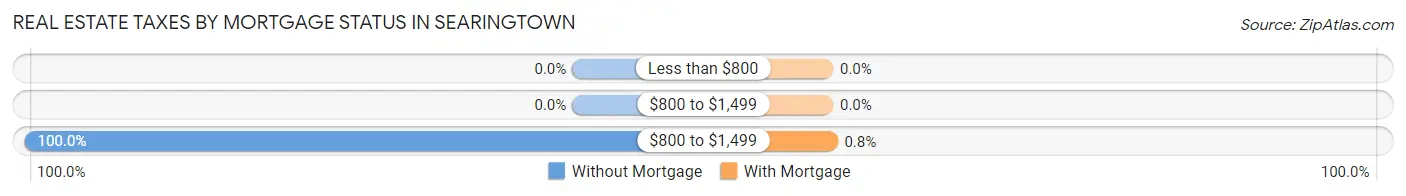
| Property Taxes | Without Mortgage | With Mortgage |
| Less than $800 | 0 (0.0%) | 0 (0.0%) |
| $800 to $1,499 | 0 (0.0%) | 0 (0.0%) |
| $800 to $1,499 | 655 (100.0%) | 7 (0.8%) |
| Total | 655 (100.0%) | 873 (100.0%) |
Health & Disability in Searingtown
Health Insurance Coverage by Age in Searingtown
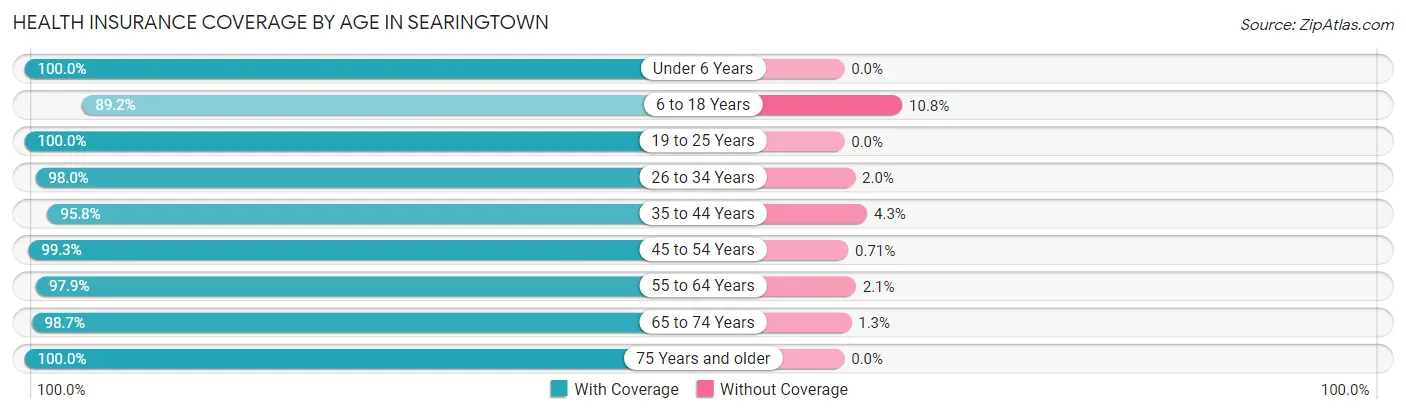
| Age Bracket | With Coverage | Without Coverage |
| Under 6 Years | 201 (100.0%) | 0 (0.0%) |
| 6 to 18 Years | 604 (89.2%) | 73 (10.8%) |
| 19 to 25 Years | 336 (100.0%) | 0 (0.0%) |
| 26 to 34 Years | 389 (98.0%) | 8 (2.0%) |
| 35 to 44 Years | 293 (95.8%) | 13 (4.3%) |
| 45 to 54 Years | 835 (99.3%) | 6 (0.7%) |
| 55 to 64 Years | 869 (97.9%) | 19 (2.1%) |
| 65 to 74 Years | 608 (98.7%) | 8 (1.3%) |
| 75 Years and older | 438 (100.0%) | 0 (0.0%) |
| Total | 4,573 (97.3%) | 127 (2.7%) |
Health Insurance Coverage by Citizenship Status in Searingtown
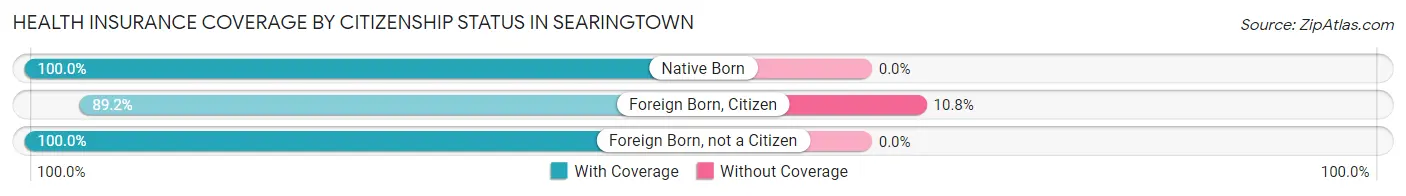
| Citizenship Status | With Coverage | Without Coverage |
| Native Born | 201 (100.0%) | 0 (0.0%) |
| Foreign Born, Citizen | 604 (89.2%) | 73 (10.8%) |
| Foreign Born, not a Citizen | 336 (100.0%) | 0 (0.0%) |
Health Insurance Coverage by Household Income in Searingtown
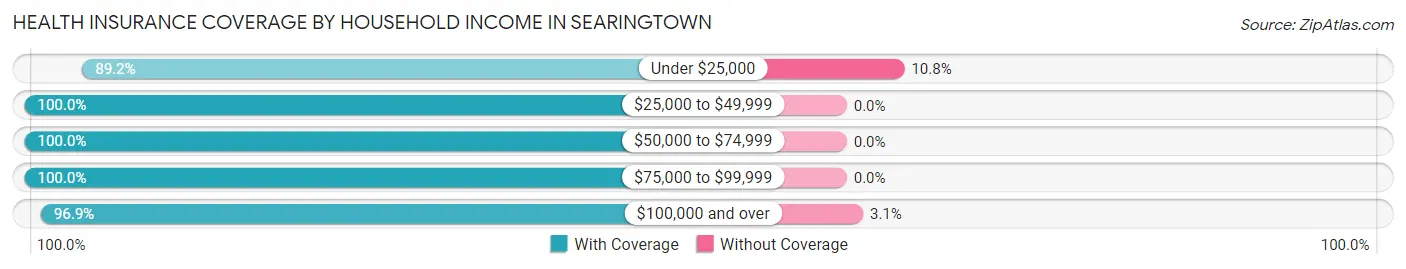
| Household Income | With Coverage | Without Coverage |
| Under $25,000 | 66 (89.2%) | 8 (10.8%) |
| $25,000 to $49,999 | 165 (100.0%) | 0 (0.0%) |
| $50,000 to $74,999 | 165 (100.0%) | 0 (0.0%) |
| $75,000 to $99,999 | 412 (100.0%) | 0 (0.0%) |
| $100,000 and over | 3,764 (96.9%) | 119 (3.1%) |
Public vs Private Health Insurance Coverage by Age in Searingtown
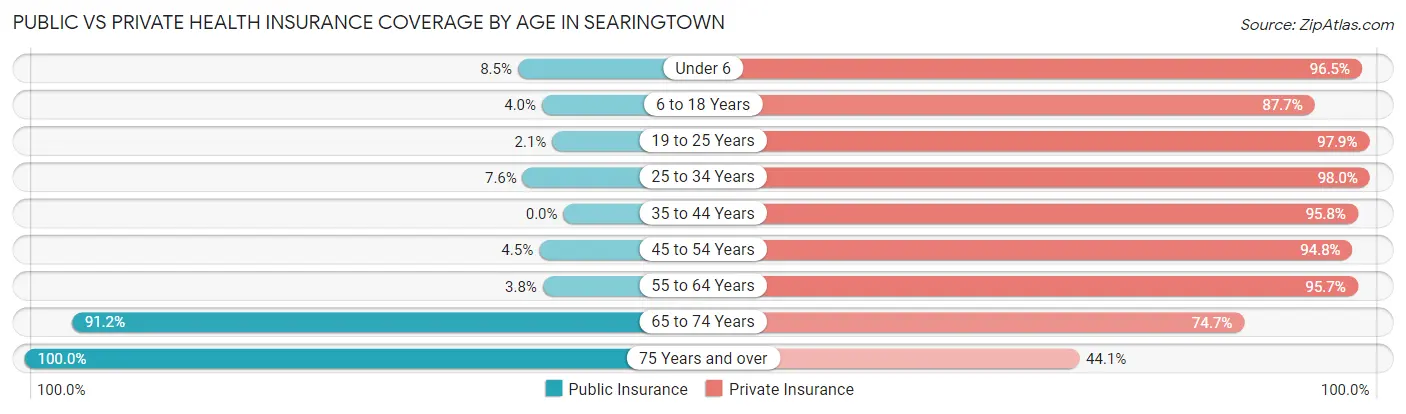
| Age Bracket | Public Insurance | Private Insurance |
| Under 6 | 17 (8.5%) | 194 (96.5%) |
| 6 to 18 Years | 27 (4.0%) | 594 (87.7%) |
| 19 to 25 Years | 7 (2.1%) | 329 (97.9%) |
| 25 to 34 Years | 30 (7.6%) | 389 (98.0%) |
| 35 to 44 Years | 0 (0.0%) | 293 (95.8%) |
| 45 to 54 Years | 38 (4.5%) | 797 (94.8%) |
| 55 to 64 Years | 34 (3.8%) | 850 (95.7%) |
| 65 to 74 Years | 562 (91.2%) | 460 (74.7%) |
| 75 Years and over | 438 (100.0%) | 193 (44.1%) |
| Total | 1,153 (24.5%) | 4,099 (87.2%) |
Disability Status by Sex by Age in Searingtown
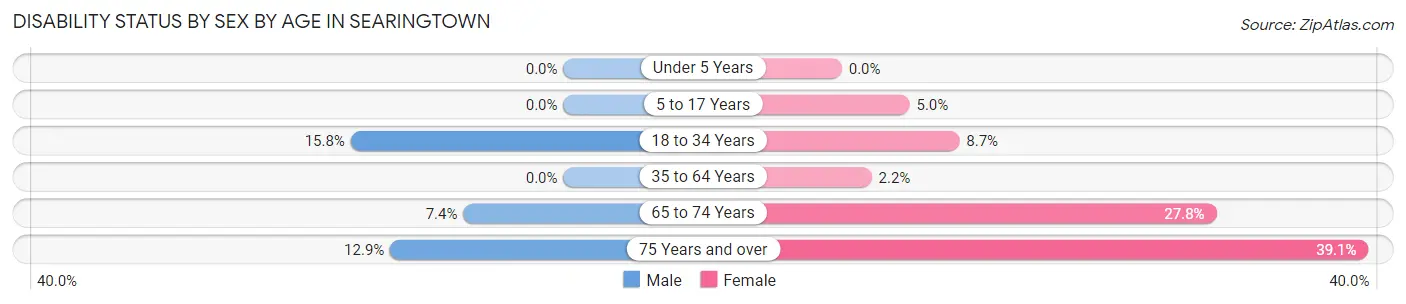
| Age Bracket | Male | Female |
| Under 5 Years | 0 (0.0%) | 0 (0.0%) |
| 5 to 17 Years | 0 (0.0%) | 17 (5.0%) |
| 18 to 34 Years | 60 (15.8%) | 35 (8.7%) |
| 35 to 64 Years | 0 (0.0%) | 24 (2.2%) |
| 65 to 74 Years | 22 (7.4%) | 89 (27.8%) |
| 75 Years and over | 31 (12.9%) | 77 (39.1%) |
Disability Class by Sex by Age in Searingtown
Disability Class: Hearing Difficulty
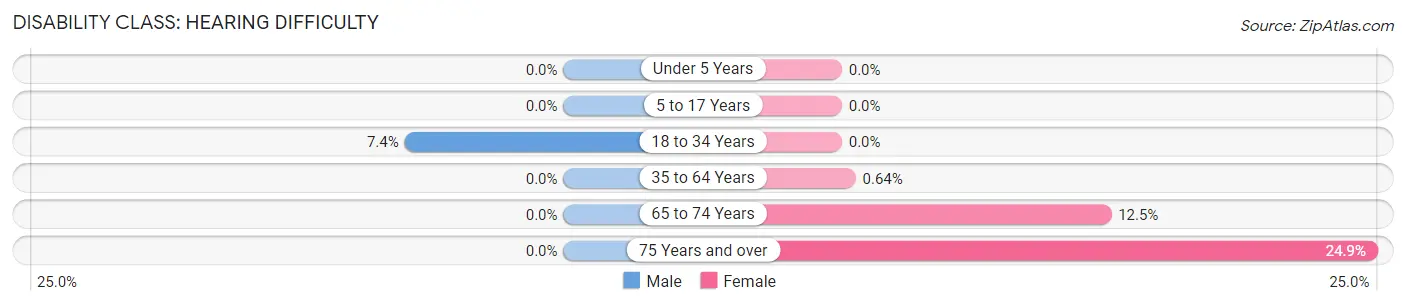
| Age Bracket | Male | Female |
| Under 5 Years | 0 (0.0%) | 0 (0.0%) |
| 5 to 17 Years | 0 (0.0%) | 0 (0.0%) |
| 18 to 34 Years | 28 (7.4%) | 0 (0.0%) |
| 35 to 64 Years | 0 (0.0%) | 7 (0.6%) |
| 65 to 74 Years | 0 (0.0%) | 40 (12.5%) |
| 75 Years and over | 0 (0.0%) | 49 (24.9%) |
Disability Class: Vision Difficulty
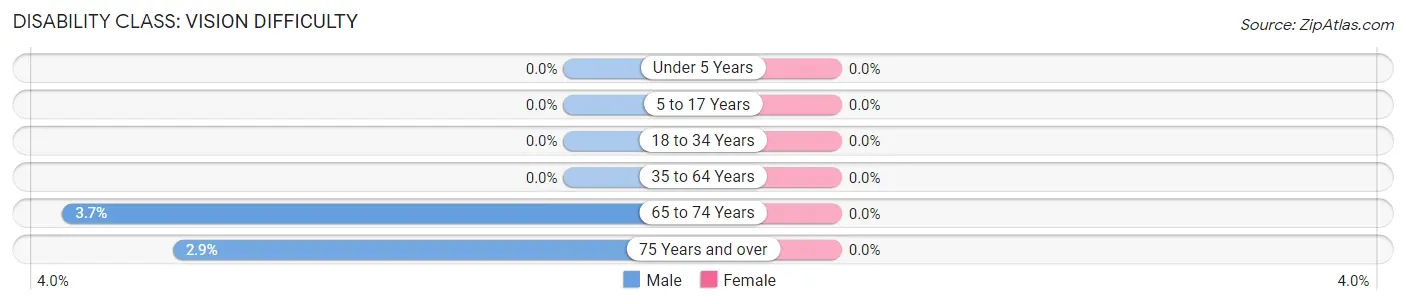
| Age Bracket | Male | Female |
| Under 5 Years | 0 (0.0%) | 0 (0.0%) |
| 5 to 17 Years | 0 (0.0%) | 0 (0.0%) |
| 18 to 34 Years | 0 (0.0%) | 0 (0.0%) |
| 35 to 64 Years | 0 (0.0%) | 0 (0.0%) |
| 65 to 74 Years | 11 (3.7%) | 0 (0.0%) |
| 75 Years and over | 7 (2.9%) | 0 (0.0%) |
Disability Class: Cognitive Difficulty
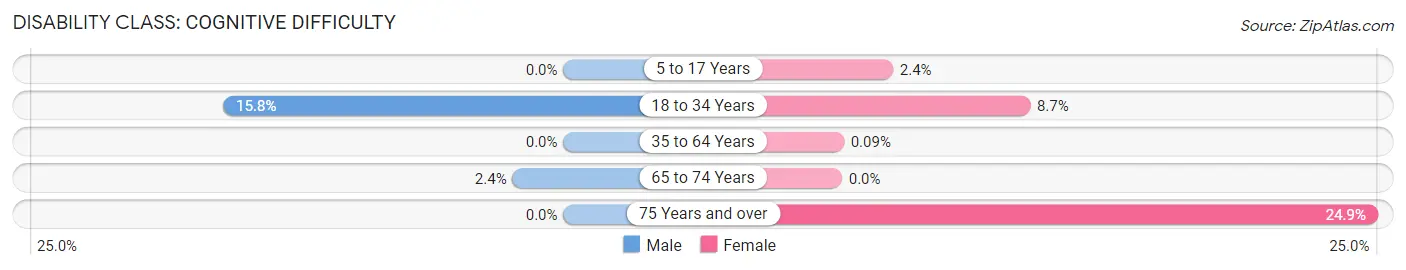
| Age Bracket | Male | Female |
| 5 to 17 Years | 0 (0.0%) | 8 (2.4%) |
| 18 to 34 Years | 60 (15.8%) | 35 (8.7%) |
| 35 to 64 Years | 0 (0.0%) | 1 (0.1%) |
| 65 to 74 Years | 7 (2.4%) | 0 (0.0%) |
| 75 Years and over | 0 (0.0%) | 49 (24.9%) |
Disability Class: Ambulatory Difficulty
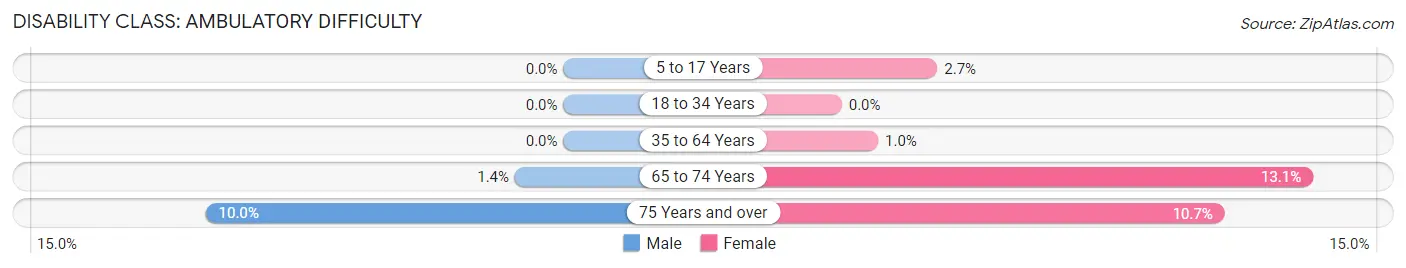
| Age Bracket | Male | Female |
| 5 to 17 Years | 0 (0.0%) | 9 (2.7%) |
| 18 to 34 Years | 0 (0.0%) | 0 (0.0%) |
| 35 to 64 Years | 0 (0.0%) | 11 (1.0%) |
| 65 to 74 Years | 4 (1.3%) | 42 (13.1%) |
| 75 Years and over | 24 (10.0%) | 21 (10.7%) |
Disability Class: Self-Care Difficulty
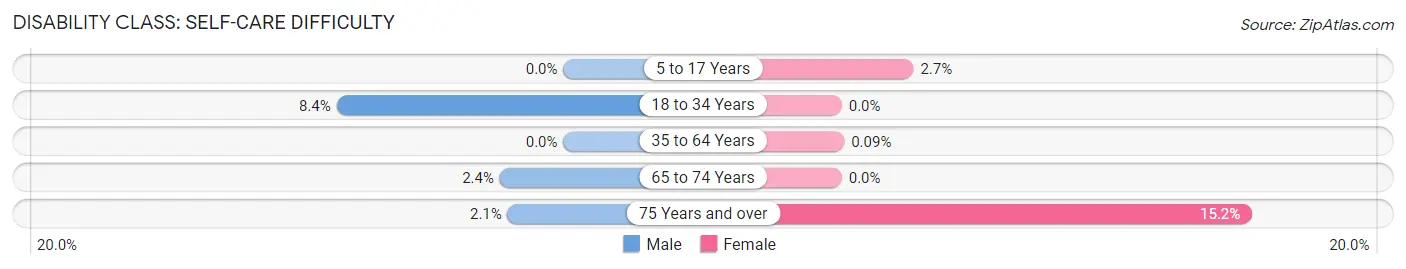
| Age Bracket | Male | Female |
| 5 to 17 Years | 0 (0.0%) | 9 (2.7%) |
| 18 to 34 Years | 32 (8.4%) | 0 (0.0%) |
| 35 to 64 Years | 0 (0.0%) | 1 (0.1%) |
| 65 to 74 Years | 7 (2.4%) | 0 (0.0%) |
| 75 Years and over | 5 (2.1%) | 30 (15.2%) |
Technology Access in Searingtown
Computing Device Access in Searingtown
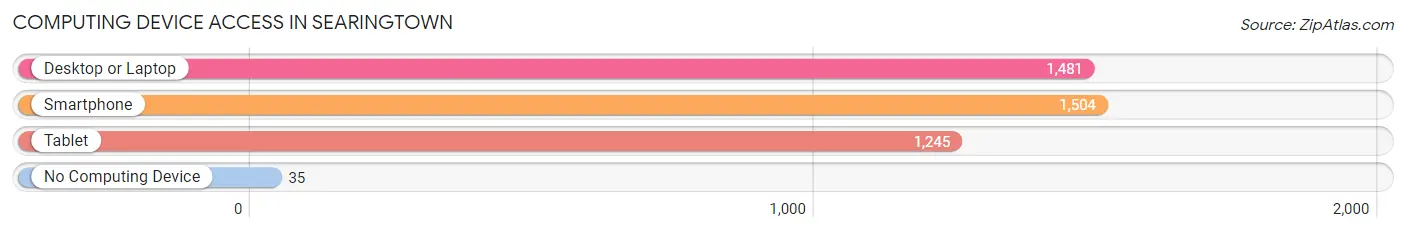
| Device Type | # Households | % Households |
| Desktop or Laptop | 1,481 | 94.2% |
| Smartphone | 1,504 | 95.7% |
| Tablet | 1,245 | 79.2% |
| No Computing Device | 35 | 2.2% |
| Total | 1,572 | 100.0% |
Internet Access in Searingtown
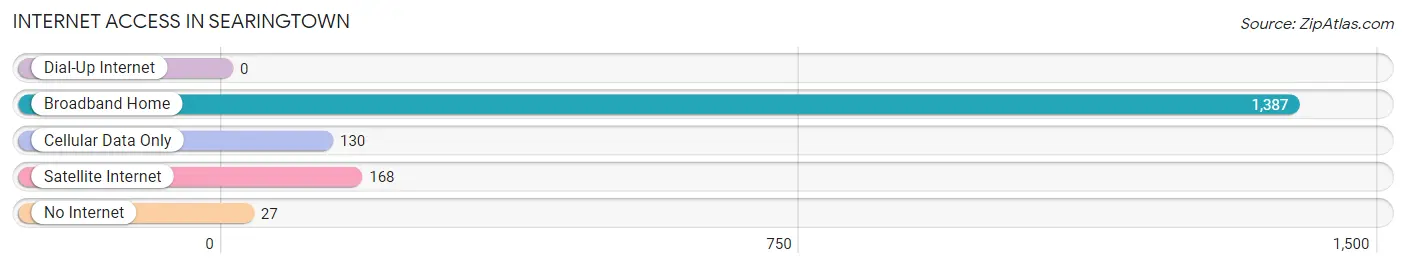
| Internet Type | # Households | % Households |
| Dial-Up Internet | 0 | 0.0% |
| Broadband Home | 1,387 | 88.2% |
| Cellular Data Only | 130 | 8.3% |
| Satellite Internet | 168 | 10.7% |
| No Internet | 27 | 1.7% |
| Total | 1,572 | 100.0% |
Searingtown Summary
Searingtown is a hamlet located in the Town of North Hempstead in Nassau County, New York. It is situated on the North Shore of Long Island, approximately 25 miles east of Manhattan. The hamlet is bordered by the villages of Roslyn and Flower Hill to the east, and the hamlets of Albertson and Manhasset to the west.
History
Searingtown was originally part of the Town of Hempstead, which was established in 1644. The area was first settled by the Searing family in the late 1700s. The family owned a large tract of land in the area, which was eventually divided up and sold off. In the early 1900s, the area began to develop as a residential community.
In the 1920s, the hamlet was home to a number of wealthy families, including the Vanderbilts, Whitneys, and Astors. The area was known for its large estates and luxurious homes.
In the 1950s, the area began to experience rapid growth as more people moved to the area. The hamlet was eventually incorporated into the Town of North Hempstead in the 1970s.
Geography
Searingtown is located in the Town of North Hempstead in Nassau County, New York. It is situated on the North Shore of Long Island, approximately 25 miles east of Manhattan. The hamlet is bordered by the villages of Roslyn and Flower Hill to the east, and the hamlets of Albertson and Manhasset to the west.
The hamlet is located in the Plandome Heights area of North Hempstead. It is situated on a plateau that rises above the surrounding area. The terrain is mostly flat, with some rolling hills.
The hamlet is home to several parks, including Searingtown Park, which features a playground, basketball court, and picnic area.
Economy
Searingtown is primarily a residential community, with most of its residents commuting to nearby cities for work. The hamlet is home to a number of small businesses, including restaurants, retail stores, and professional services.
The hamlet is also home to a number of corporate offices, including the headquarters of the North Shore-LIJ Health System.
Demographics
As of the 2010 census, the population of Searingtown was 5,845. The racial makeup of the hamlet was 79.3% White, 8.2% Asian, 6.2% African American, and 4.3% Hispanic or Latino.
The median household income in Searingtown was $117,917, and the median family income was $133,917. The per capita income was $50,917.
Conclusion
Searingtown is a hamlet located in the Town of North Hempstead in Nassau County, New York. It is situated on the North Shore of Long Island, approximately 25 miles east of Manhattan. The hamlet is bordered by the villages of Roslyn and Flower Hill to the east, and the hamlets of Albertson and Manhasset to the west. The hamlet is primarily a residential community, with most of its residents commuting to nearby cities for work. The hamlet is home to a number of small businesses, including restaurants, retail stores, and professional services. As of the 2010 census, the population of Searingtown was 5,845. The racial makeup of the hamlet was 79.3% White, 8.2% Asian, 6.2% African American, and 4.3% Hispanic or Latino. The median household income in Searingtown was $117,917, and the median family income was $133,917. The per capita income was $50,917.
Common Questions
What is Per Capita Income in Searingtown?
Per Capita income in Searingtown is $82,856.
What is the Median Family Income in Searingtown?
Median Family Income in Searingtown is $209,773.
What is the Median Household income in Searingtown?
Median Household Income in Searingtown is $199,524.
What is Income or Wage Gap in Searingtown?
Income or Wage Gap in Searingtown is 17.4%.
Women in Searingtown earn 82.6 cents for every dollar earned by a man.
What is Inequality or Gini Index in Searingtown?
Inequality or Gini Index in Searingtown is 0.41.
What is the Total Population of Searingtown?
Total Population of Searingtown is 4,700.
What is the Total Male Population of Searingtown?
Total Male Population of Searingtown is 2,305.
What is the Total Female Population of Searingtown?
Total Female Population of Searingtown is 2,395.
What is the Ratio of Males per 100 Females in Searingtown?
There are 96.24 Males per 100 Females in Searingtown.
What is the Ratio of Females per 100 Males in Searingtown?
There are 103.90 Females per 100 Males in Searingtown.
What is the Median Population Age in Searingtown?
Median Population Age in Searingtown is 50.8 Years.
What is the Average Family Size in Searingtown
Average Family Size in Searingtown is 3.1 People.
What is the Average Household Size in Searingtown
Average Household Size in Searingtown is 3.0 People.
How Large is the Labor Force in Searingtown?
There are 2,479 People in the Labor Forcein in Searingtown.
What is the Percentage of People in the Labor Force in Searingtown?
61.6% of People are in the Labor Force in Searingtown.
What is the Unemployment Rate in Searingtown?
Unemployment Rate in Searingtown is 3.9%.