Halesite, NY Map & Demographics
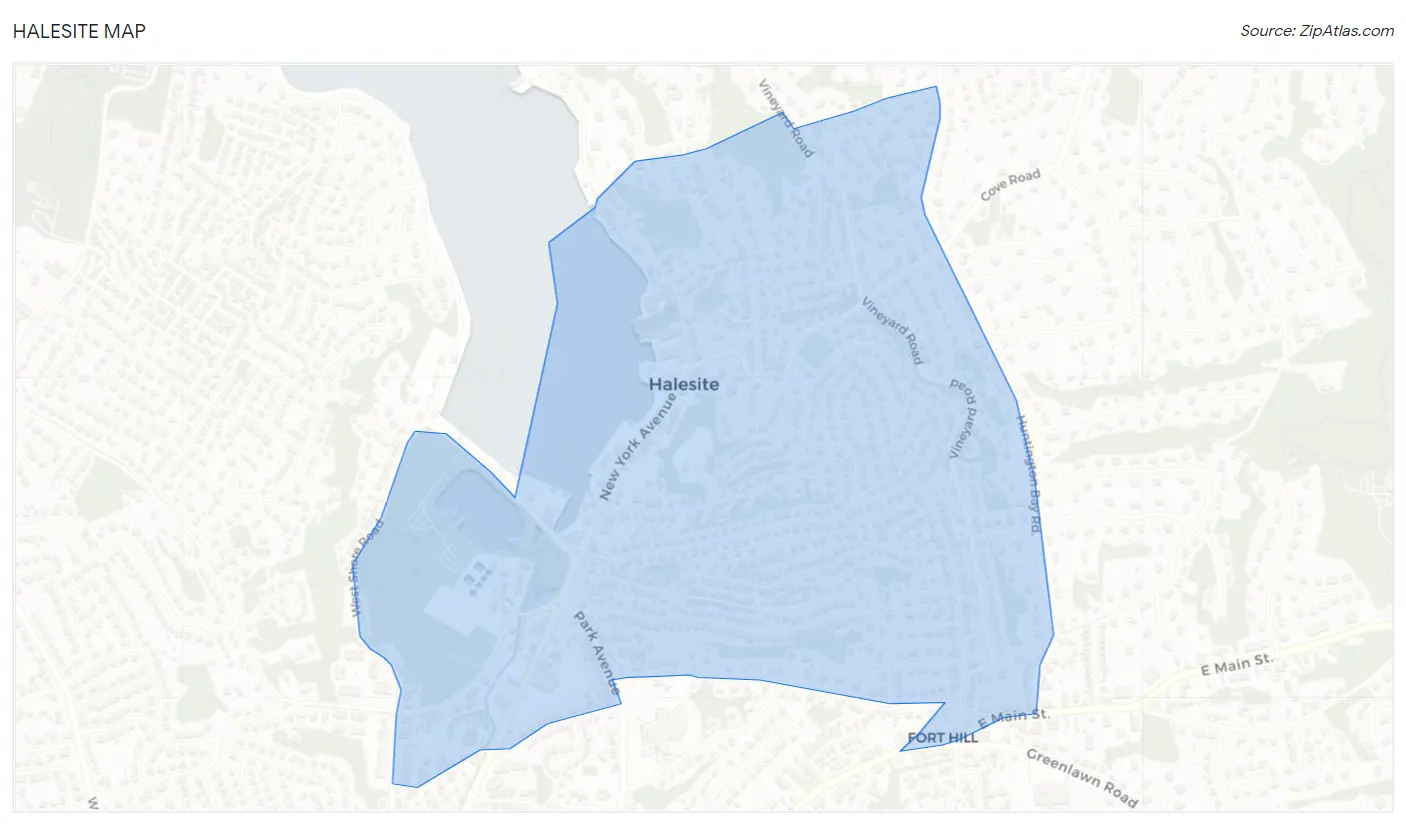
Halesite Map
Halesite Overview
$104,825
PER CAPITA INCOME
$238,403
AVG FAMILY INCOME
$177,917
AVG HOUSEHOLD INCOME
41.6%
WAGE / INCOME GAP [ % ]
58.4¢/ $1
WAGE / INCOME GAP [ $ ]
0.47
INEQUALITY / GINI INDEX
2,416
TOTAL POPULATION
1,087
MALE POPULATION
1,329
FEMALE POPULATION
81.79
MALES / 100 FEMALES
122.26
FEMALES / 100 MALES
48.0
MEDIAN AGE
3.1
AVG FAMILY SIZE
2.4
AVG HOUSEHOLD SIZE
1,318
LABOR FORCE [ PEOPLE ]
63.2%
PERCENT IN LABOR FORCE
8.0%
UNEMPLOYMENT RATE
Income in Halesite
Income Overview in Halesite
Per Capita Income in Halesite is $104,825, while median incomes of families and households are $238,403 and $177,917 respectively.
| Characteristic | Number | Measure |
| Per Capita Income | 2,416 | $104,825 |
| Median Family Income | 667 | $238,403 |
| Mean Family Income | 667 | $323,483 |
| Median Household Income | 997 | $177,917 |
| Mean Household Income | 997 | $252,513 |
| Income Deficit | 667 | $0 |
| Wage / Income Gap (%) | 2,416 | 41.65% |
| Wage / Income Gap ($) | 2,416 | 58.35¢ per $1 |
| Gini / Inequality Index | 2,416 | 0.47 |
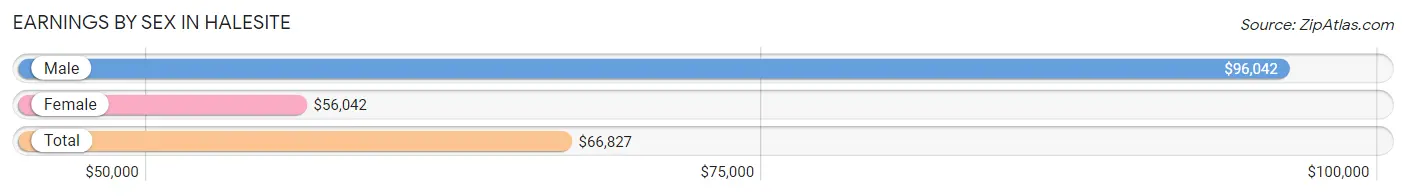
Earnings by Sex in Halesite
Average Earnings in Halesite are $66,827, $96,042 for men and $56,042 for women, a difference of 41.6%.
| Sex | Number | Average Earnings |
| Male | 667 (48.1%) | $96,042 |
| Female | 719 (51.9%) | $56,042 |
| Total | 1,386 (100.0%) | $66,827 |
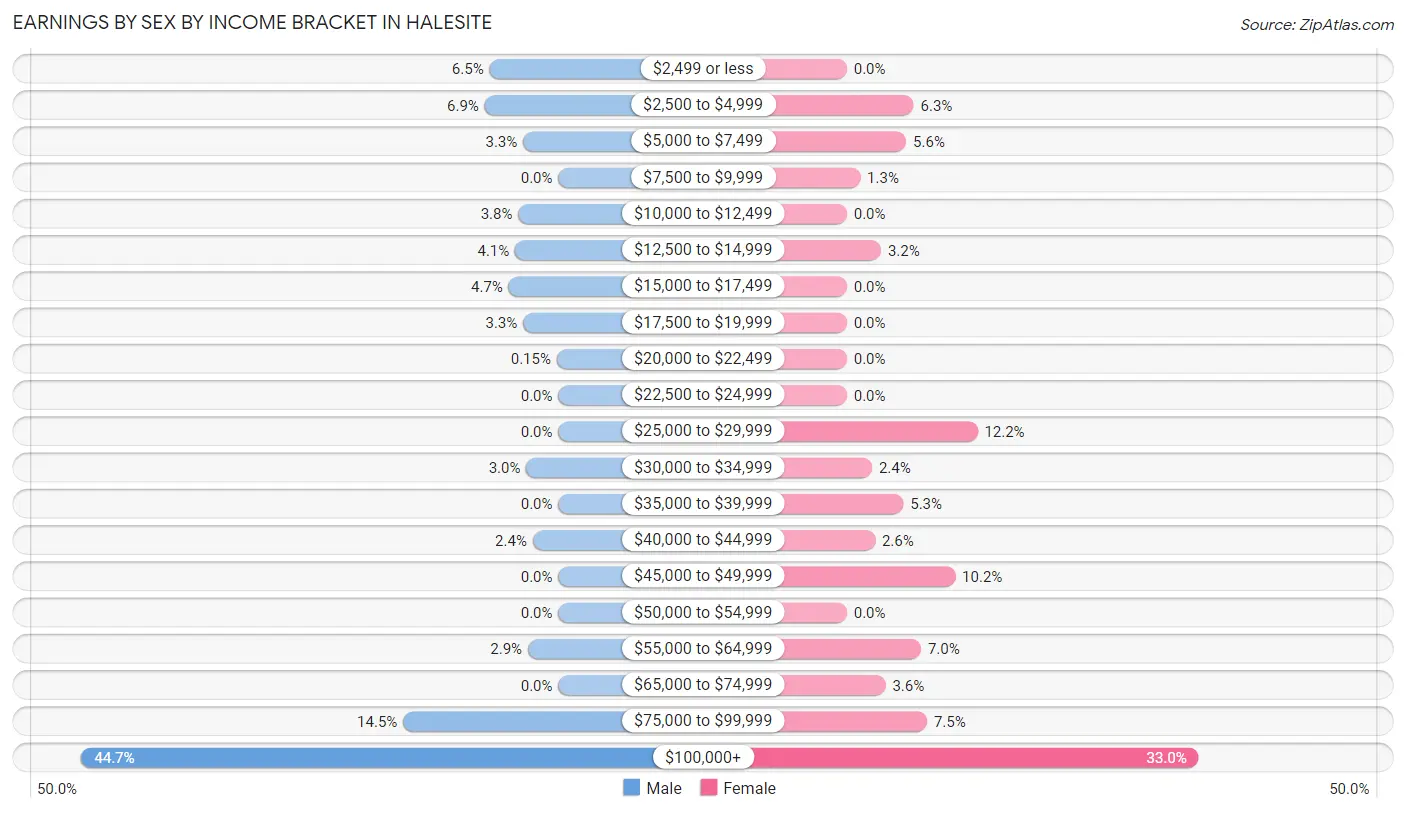
Earnings by Sex by Income Bracket in Halesite
The most common earnings brackets in Halesite are $100,000+ for men (298 | 44.7%) and $100,000+ for women (237 | 33.0%).
| Income | Male | Female |
| $2,499 or less | 43 (6.5%) | 0 (0.0%) |
| $2,500 to $4,999 | 46 (6.9%) | 45 (6.3%) |
| $5,000 to $7,499 | 22 (3.3%) | 40 (5.6%) |
| $7,500 to $9,999 | 0 (0.0%) | 9 (1.3%) |
| $10,000 to $12,499 | 25 (3.7%) | 0 (0.0%) |
| $12,500 to $14,999 | 27 (4.1%) | 23 (3.2%) |
| $15,000 to $17,499 | 31 (4.6%) | 0 (0.0%) |
| $17,500 to $19,999 | 22 (3.3%) | 0 (0.0%) |
| $20,000 to $22,499 | 1 (0.2%) | 0 (0.0%) |
| $22,500 to $24,999 | 0 (0.0%) | 0 (0.0%) |
| $25,000 to $29,999 | 0 (0.0%) | 88 (12.2%) |
| $30,000 to $34,999 | 20 (3.0%) | 17 (2.4%) |
| $35,000 to $39,999 | 0 (0.0%) | 38 (5.3%) |
| $40,000 to $44,999 | 16 (2.4%) | 19 (2.6%) |
| $45,000 to $49,999 | 0 (0.0%) | 73 (10.2%) |
| $50,000 to $54,999 | 0 (0.0%) | 0 (0.0%) |
| $55,000 to $64,999 | 19 (2.9%) | 50 (7.0%) |
| $65,000 to $74,999 | 0 (0.0%) | 26 (3.6%) |
| $75,000 to $99,999 | 97 (14.5%) | 54 (7.5%) |
| $100,000+ | 298 (44.7%) | 237 (33.0%) |
| Total | 667 (100.0%) | 719 (100.0%) |
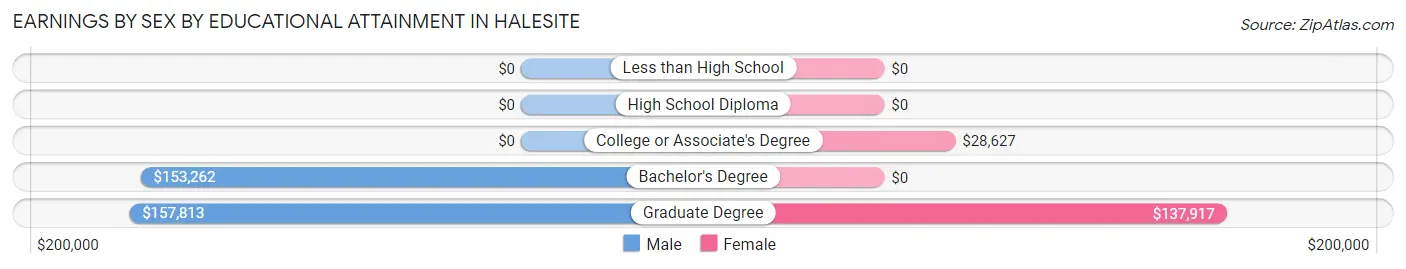
Earnings by Sex by Educational Attainment in Halesite
Average earnings in Halesite are $103,990 for men and $58,125 for women, a difference of 44.1%. Men with an educational attainment of graduate degree enjoy the highest average annual earnings of $157,813, while those with bachelor's degree education earn the least with $153,262. Women with an educational attainment of graduate degree earn the most with the average annual earnings of $137,917, while those with college or associate's degree education have the smallest earnings of $28,627.
| Educational Attainment | Male Income | Female Income |
| Less than High School | - | - |
| High School Diploma | - | - |
| College or Associate's Degree | - | - |
| Bachelor's Degree | $153,262 | $0 |
| Graduate Degree | $157,813 | $137,917 |
| Total | $103,990 | $58,125 |
Family Income in Halesite
Family Income Brackets in Halesite
According to the Halesite family income data, there are 465 families falling into the $200,000+ income range, which is the most common income bracket and makes up 69.7% of all families.
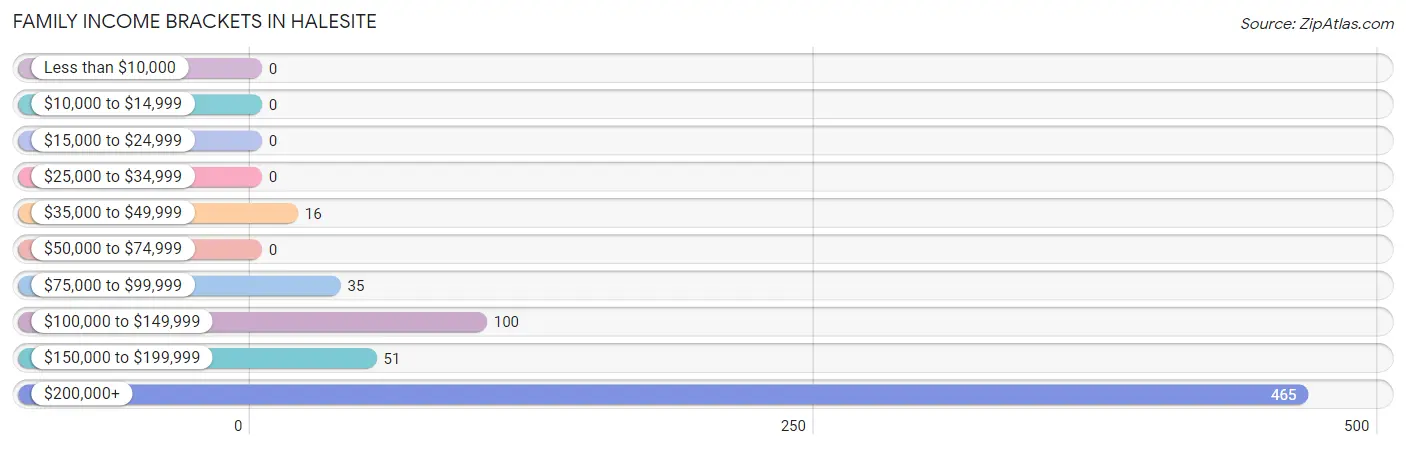
| Income Bracket | # Families | % Families |
| Less than $10,000 | 0 | 0.0% |
| $10,000 to $14,999 | 0 | 0.0% |
| $15,000 to $24,999 | 0 | 0.0% |
| $25,000 to $34,999 | 0 | 0.0% |
| $35,000 to $49,999 | 16 | 2.4% |
| $50,000 to $74,999 | 0 | 0.0% |
| $75,000 to $99,999 | 35 | 5.2% |
| $100,000 to $149,999 | 100 | 15.0% |
| $150,000 to $199,999 | 51 | 7.6% |
| $200,000+ | 465 | 69.7% |
Family Income by Famaliy Size in Halesite
4-person families (196 | 29.4%) account for the highest median family income in Halesite with $248,167 per family, while 3-person families (190 | 28.5%) have the highest median income of $81,694 per family member.
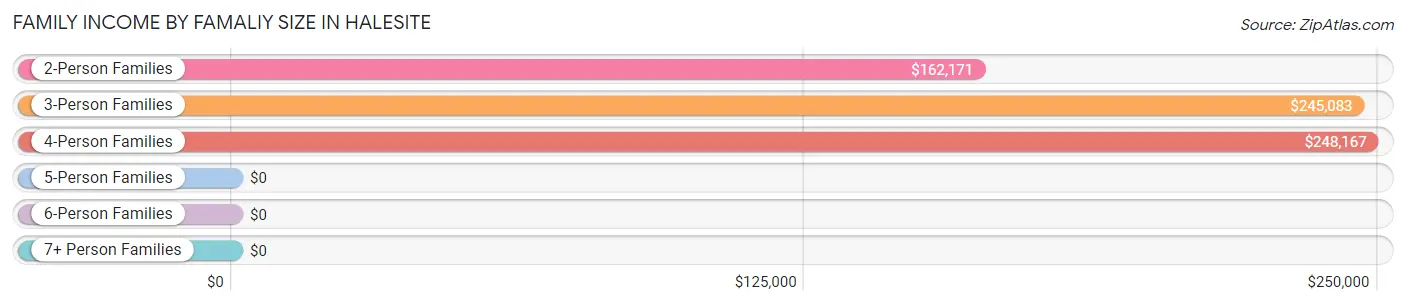
| Income Bracket | # Families | Median Income |
| 2-Person Families | 263 (39.4%) | $162,171 |
| 3-Person Families | 190 (28.5%) | $245,083 |
| 4-Person Families | 196 (29.4%) | $248,167 |
| 5-Person Families | 18 (2.7%) | $0 |
| 6-Person Families | 0 (0.0%) | $0 |
| 7+ Person Families | 0 (0.0%) | $0 |
| Total | 667 (100.0%) | $238,403 |
Family Income by Number of Earners in Halesite
The median family income in Halesite is $238,403, with families comprising 2 earners (238) having the highest median family income of $250,001, while families with 1 earner (140) have the lowest median family income of $149,231, accounting for 35.7% and 21.0% of families, respectively.
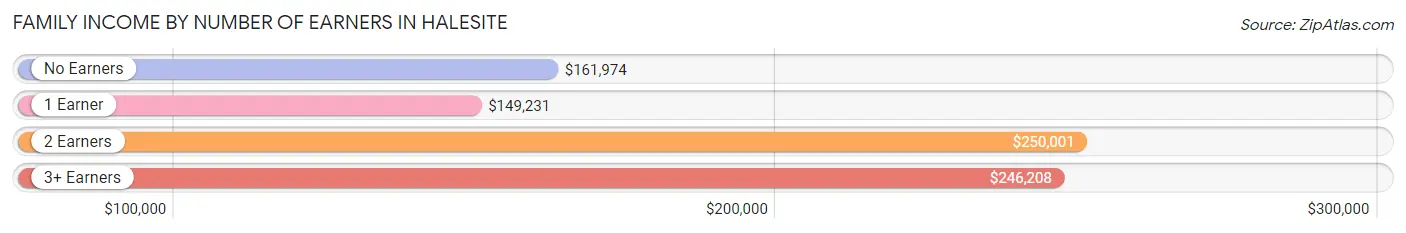
| Number of Earners | # Families | Median Income |
| No Earners | 108 (16.2%) | $161,974 |
| 1 Earner | 140 (21.0%) | $149,231 |
| 2 Earners | 238 (35.7%) | $250,001 |
| 3+ Earners | 181 (27.1%) | $246,208 |
| Total | 667 (100.0%) | $238,403 |
Household Income in Halesite
Household Income Brackets in Halesite
With 486 households falling in the category, the $200,000+ income range is the most frequent in Halesite, accounting for 48.7% of all households.
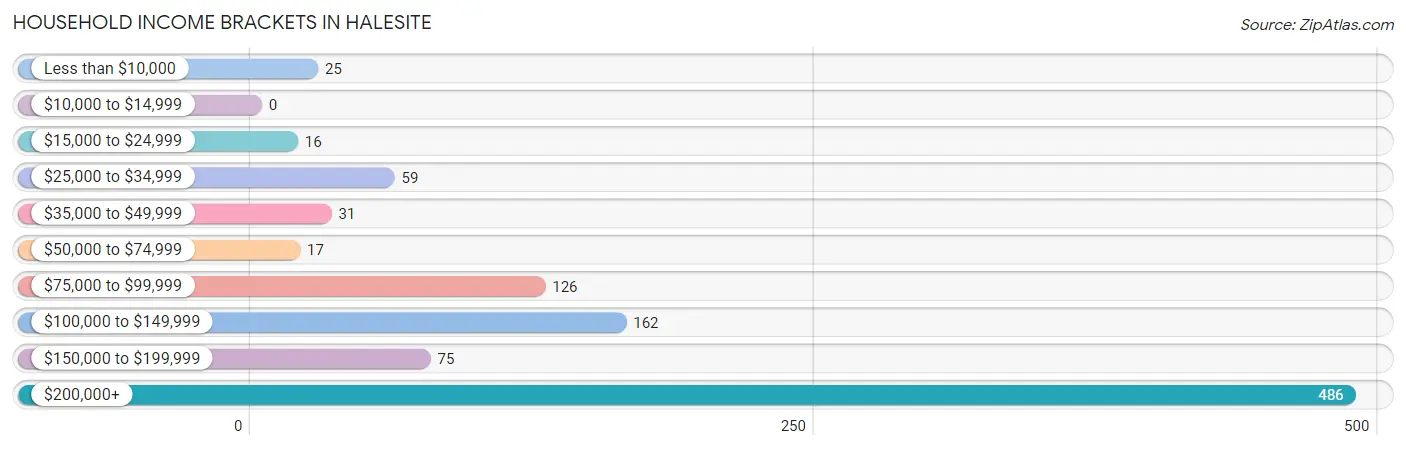
| Income Bracket | # Households | % Households |
| Less than $10,000 | 25 | 2.5% |
| $10,000 to $14,999 | 0 | 0.0% |
| $15,000 to $24,999 | 16 | 1.6% |
| $25,000 to $34,999 | 59 | 5.9% |
| $35,000 to $49,999 | 31 | 3.1% |
| $50,000 to $74,999 | 17 | 1.7% |
| $75,000 to $99,999 | 126 | 12.6% |
| $100,000 to $149,999 | 162 | 16.2% |
| $150,000 to $199,999 | 75 | 7.5% |
| $200,000+ | 486 | 48.7% |
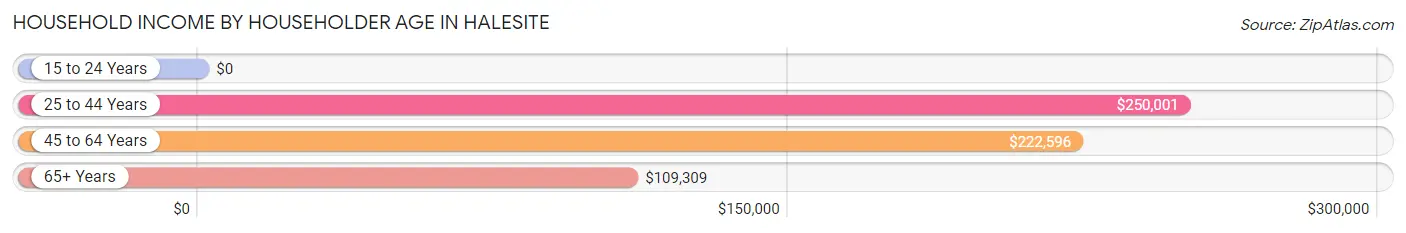
Household Income by Householder Age in Halesite
The median household income in Halesite is $177,917, with the highest median household income of $250,001 found in the 25 to 44 years age bracket for the primary householder. A total of 175 households (17.5%) fall into this category.
| Income Bracket | # Households | Median Income |
| 15 to 24 Years | 0 (0.0%) | $0 |
| 25 to 44 Years | 175 (17.5%) | $250,001 |
| 45 to 64 Years | 400 (40.1%) | $222,596 |
| 65+ Years | 422 (42.3%) | $109,309 |
| Total | 997 (100.0%) | $177,917 |
Poverty in Halesite
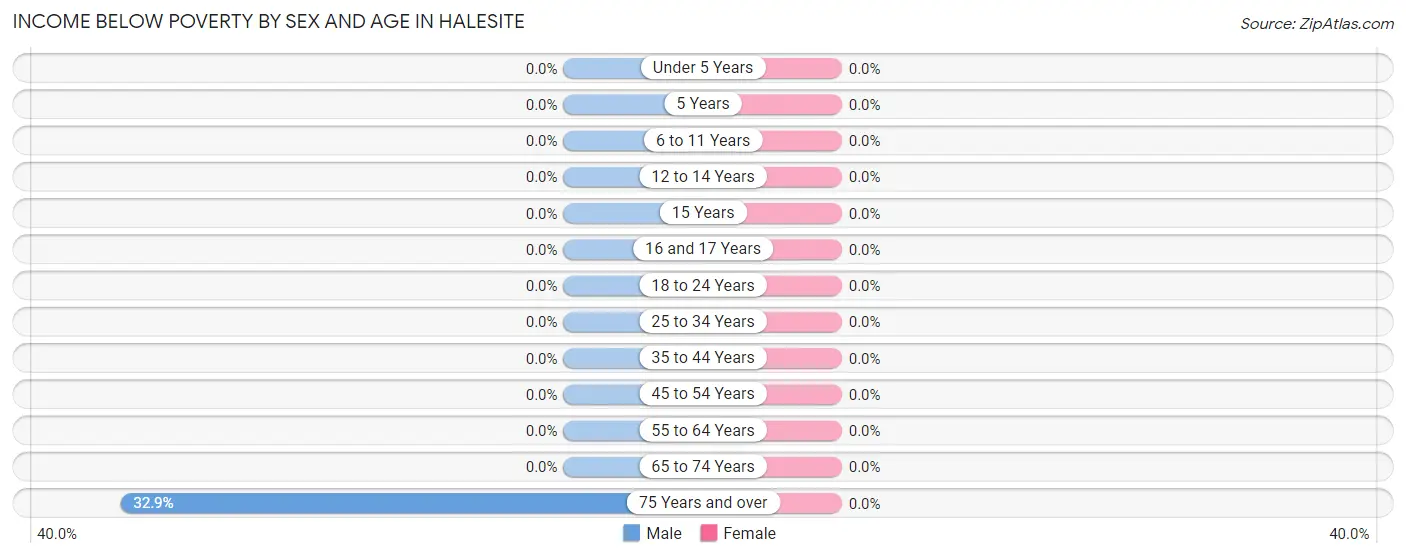
Income Below Poverty by Sex and Age in Halesite
| Age Bracket | Male | Female |
| Under 5 Years | 0 (0.0%) | 0 (0.0%) |
| 5 Years | 0 (0.0%) | 0 (0.0%) |
| 6 to 11 Years | 0 (0.0%) | 0 (0.0%) |
| 12 to 14 Years | 0 (0.0%) | 0 (0.0%) |
| 15 Years | 0 (0.0%) | 0 (0.0%) |
| 16 and 17 Years | 0 (0.0%) | 0 (0.0%) |
| 18 to 24 Years | 0 (0.0%) | 0 (0.0%) |
| 25 to 34 Years | 0 (0.0%) | 0 (0.0%) |
| 35 to 44 Years | 0 (0.0%) | 0 (0.0%) |
| 45 to 54 Years | 0 (0.0%) | 0 (0.0%) |
| 55 to 64 Years | 0 (0.0%) | 0 (0.0%) |
| 65 to 74 Years | 0 (0.0%) | 0 (0.0%) |
| 75 Years and over | 25 (32.9%) | 0 (0.0%) |
| Total | 25 (2.3%) | 0 (0.0%) |
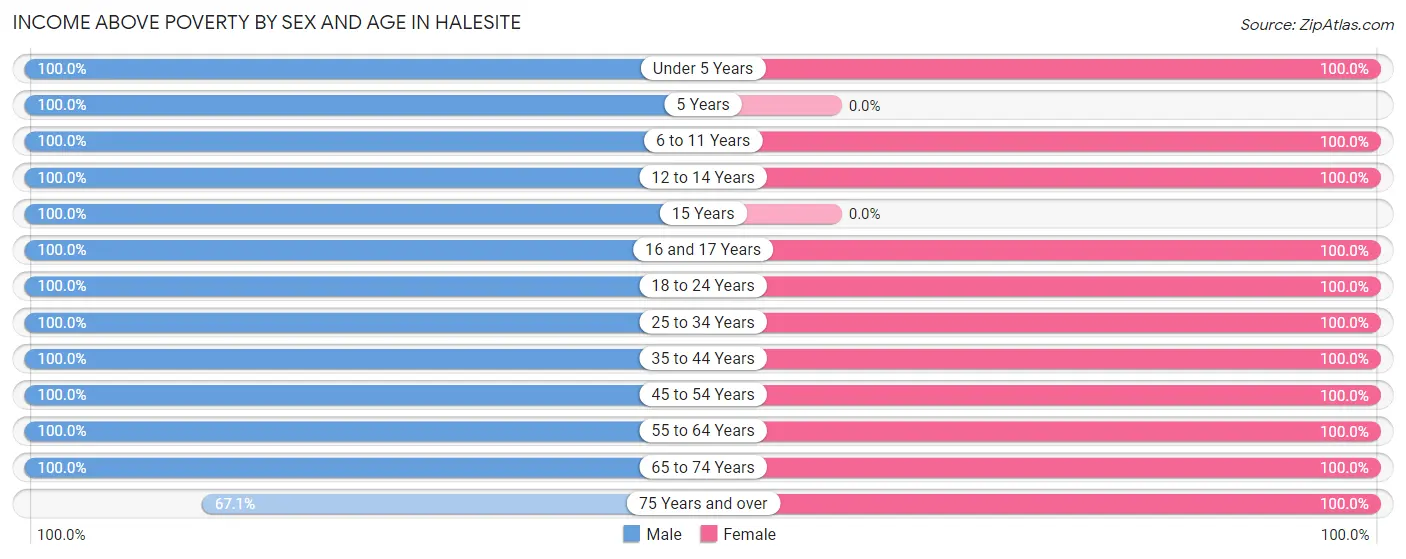
Income Above Poverty by Sex and Age in Halesite
According to the poverty statistics in Halesite, males aged under 5 years and females aged under 5 years are the age groups that are most secure financially, with 100.0% of males and 100.0% of females in these age groups living above the poverty line.
| Age Bracket | Male | Female |
| Under 5 Years | 84 (100.0%) | 29 (100.0%) |
| 5 Years | 28 (100.0%) | 0 (0.0%) |
| 6 to 11 Years | 44 (100.0%) | 48 (100.0%) |
| 12 to 14 Years | 37 (100.0%) | 52 (100.0%) |
| 15 Years | 9 (100.0%) | 0 (0.0%) |
| 16 and 17 Years | 52 (100.0%) | 22 (100.0%) |
| 18 to 24 Years | 71 (100.0%) | 84 (100.0%) |
| 25 to 34 Years | 63 (100.0%) | 179 (100.0%) |
| 35 to 44 Years | 97 (100.0%) | 166 (100.0%) |
| 45 to 54 Years | 181 (100.0%) | 195 (100.0%) |
| 55 to 64 Years | 190 (100.0%) | 153 (100.0%) |
| 65 to 74 Years | 154 (100.0%) | 312 (100.0%) |
| 75 Years and over | 51 (67.1%) | 88 (100.0%) |
| Total | 1,061 (97.7%) | 1,328 (100.0%) |
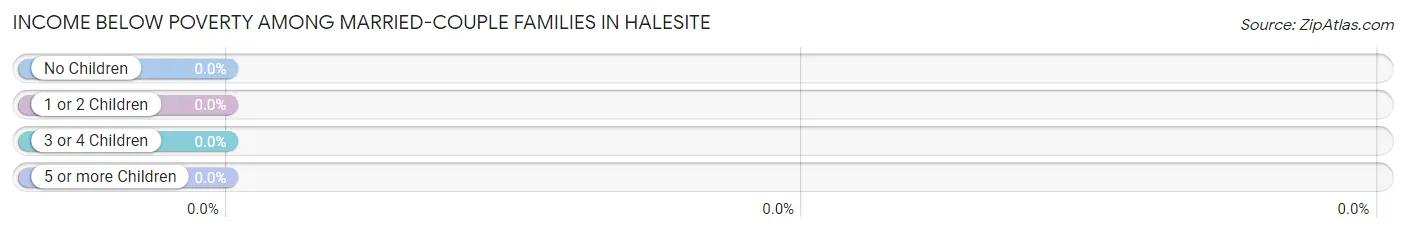
Income Below Poverty Among Married-Couple Families in Halesite
| Children | Above Poverty | Below Poverty |
| No Children | 372 (100.0%) | 0 (0.0%) |
| 1 or 2 Children | 178 (100.0%) | 0 (0.0%) |
| 3 or 4 Children | 0 (0.0%) | 0 (0.0%) |
| 5 or more Children | 0 (0.0%) | 0 (0.0%) |
| Total | 550 (100.0%) | 0 (0.0%) |
Income Below Poverty Among Single-Parent Households in Halesite
| Children | Single Father | Single Mother |
| No Children | 0 (0.0%) | 0 (0.0%) |
| 1 or 2 Children | 0 (0.0%) | 0 (0.0%) |
| 3 or 4 Children | 0 (0.0%) | 0 (0.0%) |
| 5 or more Children | 0 (0.0%) | 0 (0.0%) |
| Total | 0 (0.0%) | 0 (0.0%) |
Income Below Poverty Among Married-Couple vs Single-Parent Households in Halesite
| Children | Married-Couple Families | Single-Parent Households |
| No Children | 0 (0.0%) | 0 (0.0%) |
| 1 or 2 Children | 0 (0.0%) | 0 (0.0%) |
| 3 or 4 Children | 0 (0.0%) | 0 (0.0%) |
| 5 or more Children | 0 (0.0%) | 0 (0.0%) |
| Total | 0 (0.0%) | 0 (0.0%) |
Race in Halesite
The most populous races in Halesite are White / Caucasian (2,207 | 91.3%), Hispanic or Latino (197 | 8.2%), and Two or more Races (172 | 7.1%).
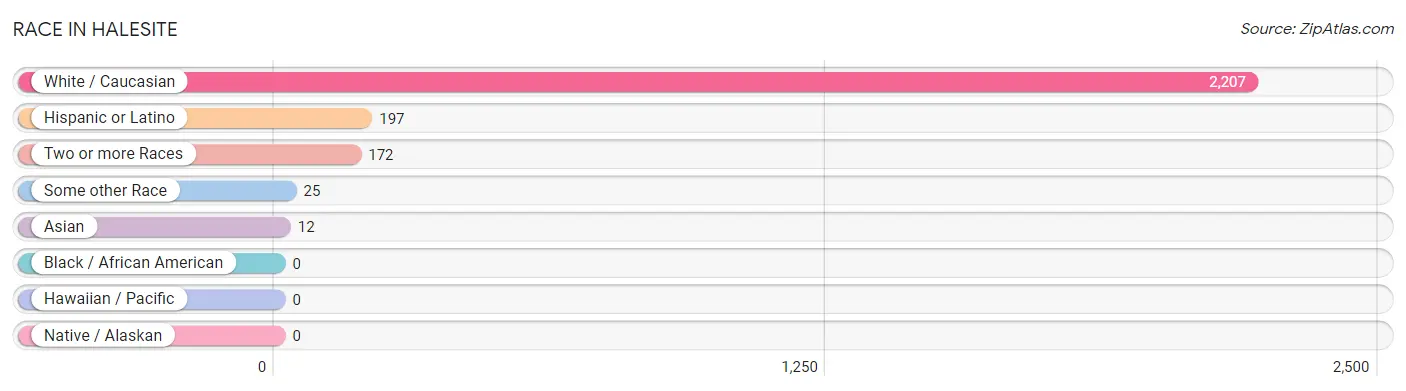
| Race | # Population | % Population |
| Asian | 12 | 0.5% |
| Black / African American | 0 | 0.0% |
| Hawaiian / Pacific | 0 | 0.0% |
| Hispanic or Latino | 197 | 8.2% |
| Native / Alaskan | 0 | 0.0% |
| White / Caucasian | 2,207 | 91.3% |
| Two or more Races | 172 | 7.1% |
| Some other Race | 25 | 1.0% |
| Total | 2,416 | 100.0% |
Ancestry in Halesite
The most populous ancestries reported in Halesite are Italian (652 | 27.0%), Irish (528 | 21.8%), German (408 | 16.9%), English (184 | 7.6%), and Croatian (141 | 5.8%), together accounting for 79.2% of all Halesite residents.
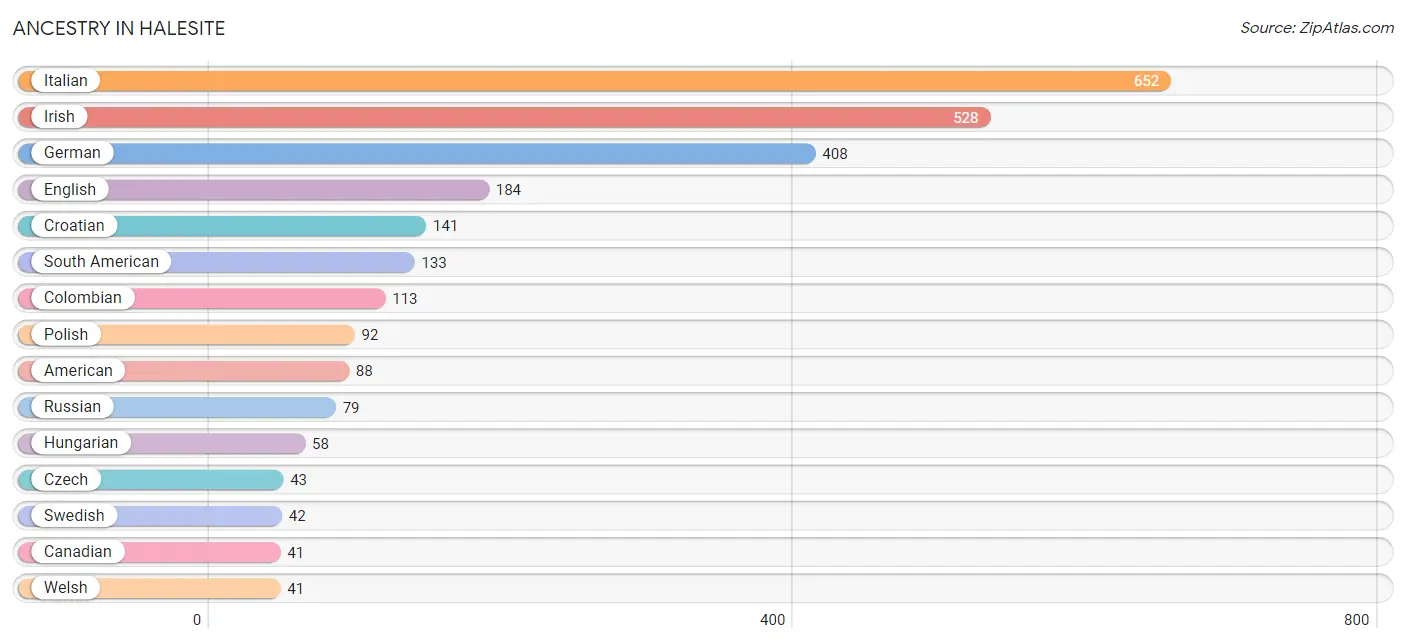
| Ancestry | # Population | % Population |
| American | 88 | 3.6% |
| Austrian | 20 | 0.8% |
| British | 18 | 0.7% |
| Burmese | 30 | 1.2% |
| Canadian | 41 | 1.7% |
| Central American | 25 | 1.0% |
| Colombian | 113 | 4.7% |
| Croatian | 141 | 5.8% |
| Cuban | 13 | 0.5% |
| Czech | 43 | 1.8% |
| Dutch | 31 | 1.3% |
| Eastern European | 33 | 1.4% |
| English | 184 | 7.6% |
| German | 408 | 16.9% |
| Guatemalan | 25 | 1.0% |
| Hungarian | 58 | 2.4% |
| Indian (Asian) | 1 | 0.0% |
| Irish | 528 | 21.8% |
| Italian | 652 | 27.0% |
| Lithuanian | 15 | 0.6% |
| Northern European | 18 | 0.7% |
| Peruvian | 20 | 0.8% |
| Polish | 92 | 3.8% |
| Puerto Rican | 26 | 1.1% |
| Romanian | 14 | 0.6% |
| Russian | 79 | 3.3% |
| Scottish | 37 | 1.5% |
| South American | 133 | 5.5% |
| Swedish | 42 | 1.7% |
| Thai | 1 | 0.0% |
| Ukrainian | 10 | 0.4% |
| Welsh | 41 | 1.7% |
| Yugoslavian | 9 | 0.4% | View All 33 Rows |
Immigrants in Halesite
The most numerous immigrant groups reported in Halesite came from Europe (82 | 3.4%), Eastern Europe (43 | 1.8%), Russia (43 | 1.8%), Western Europe (39 | 1.6%), and Austria (20 | 0.8%), together accounting for 9.4% of all Halesite residents.
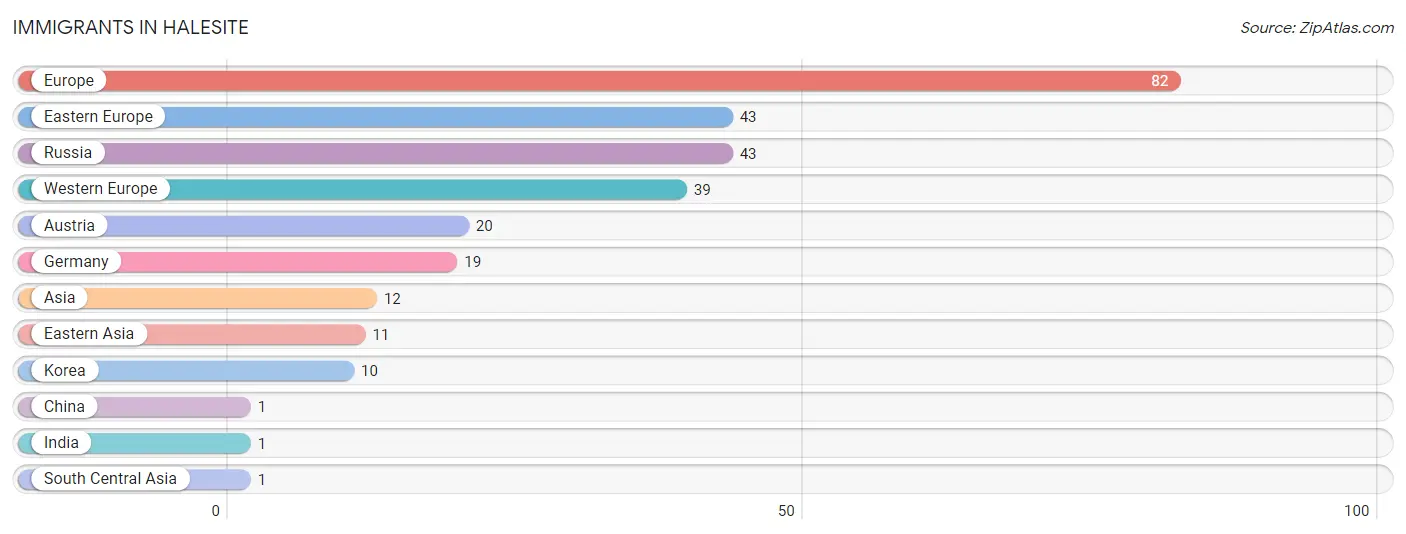
| Immigration Origin | # Population | % Population |
| Asia | 12 | 0.5% |
| Austria | 20 | 0.8% |
| China | 1 | 0.0% |
| Eastern Asia | 11 | 0.5% |
| Eastern Europe | 43 | 1.8% |
| Europe | 82 | 3.4% |
| Germany | 19 | 0.8% |
| India | 1 | 0.0% |
| Korea | 10 | 0.4% |
| Russia | 43 | 1.8% |
| South Central Asia | 1 | 0.0% |
| Western Europe | 39 | 1.6% | View All 12 Rows |
Sex and Age in Halesite
Sex and Age in Halesite
The most populous age groups in Halesite are 45 to 49 Years (133 | 12.2%) for men and 70 to 74 Years (216 | 16.3%) for women.
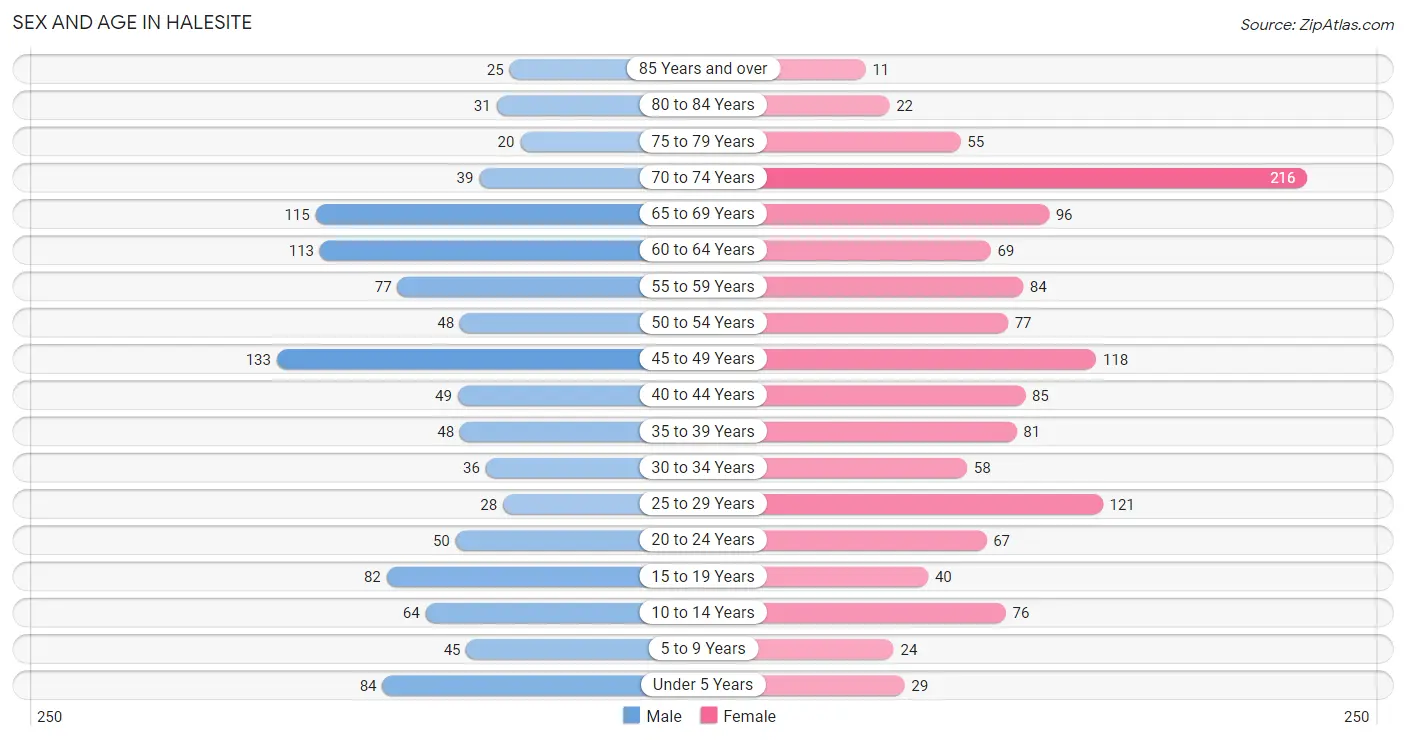
| Age Bracket | Male | Female |
| Under 5 Years | 84 (7.7%) | 29 (2.2%) |
| 5 to 9 Years | 45 (4.1%) | 24 (1.8%) |
| 10 to 14 Years | 64 (5.9%) | 76 (5.7%) |
| 15 to 19 Years | 82 (7.5%) | 40 (3.0%) |
| 20 to 24 Years | 50 (4.6%) | 67 (5.0%) |
| 25 to 29 Years | 28 (2.6%) | 121 (9.1%) |
| 30 to 34 Years | 36 (3.3%) | 58 (4.4%) |
| 35 to 39 Years | 48 (4.4%) | 81 (6.1%) |
| 40 to 44 Years | 49 (4.5%) | 85 (6.4%) |
| 45 to 49 Years | 133 (12.2%) | 118 (8.9%) |
| 50 to 54 Years | 48 (4.4%) | 77 (5.8%) |
| 55 to 59 Years | 77 (7.1%) | 84 (6.3%) |
| 60 to 64 Years | 113 (10.4%) | 69 (5.2%) |
| 65 to 69 Years | 115 (10.6%) | 96 (7.2%) |
| 70 to 74 Years | 39 (3.6%) | 216 (16.3%) |
| 75 to 79 Years | 20 (1.8%) | 55 (4.1%) |
| 80 to 84 Years | 31 (2.9%) | 22 (1.7%) |
| 85 Years and over | 25 (2.3%) | 11 (0.8%) |
| Total | 1,087 (100.0%) | 1,329 (100.0%) |
Families and Households in Halesite
Median Family Size in Halesite
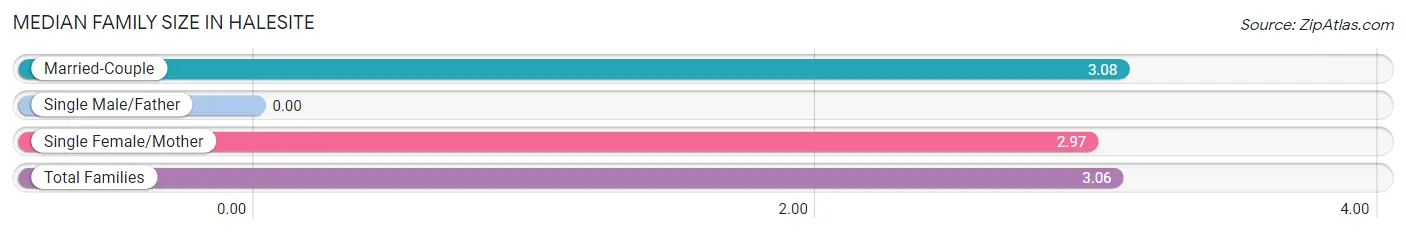
| Family Type | # Families | Family Size |
| Married-Couple | 550 (82.5%) | 3.08 |
| Single Male/Father | 0 (0.0%) | - |
| Single Female/Mother | 117 (17.5%) | 2.97 |
| Total Families | 667 (100.0%) | 3.06 |
Median Household Size in Halesite
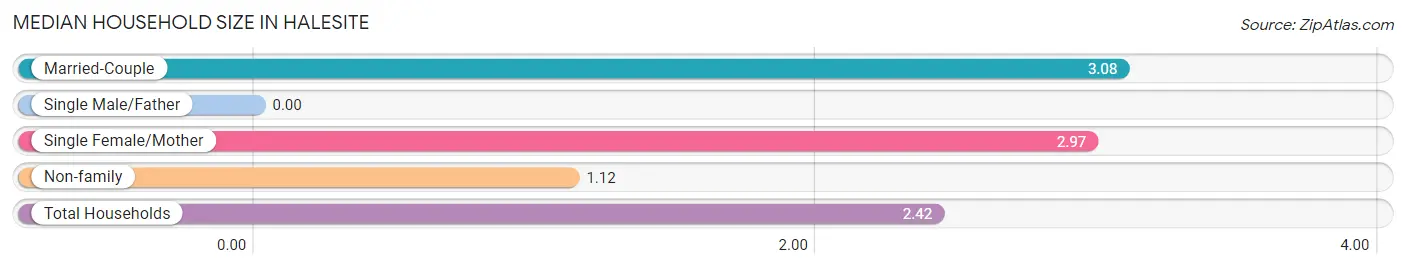
| Household Type | # Households | Household Size |
| Married-Couple | 550 (55.2%) | 3.08 |
| Single Male/Father | 0 (0.0%) | - |
| Single Female/Mother | 117 (11.7%) | 2.97 |
| Non-family | 330 (33.1%) | 1.12 |
| Total Households | 997 (100.0%) | 2.42 |
Household Size by Marriage Status in Halesite
Out of a total of 997 households in Halesite, 667 (66.9%) are family households, while 330 (33.1%) are nonfamily households. The most numerous type of family households are 2-person households, comprising 263, and the most common type of nonfamily households are 1-person households, comprising 285.
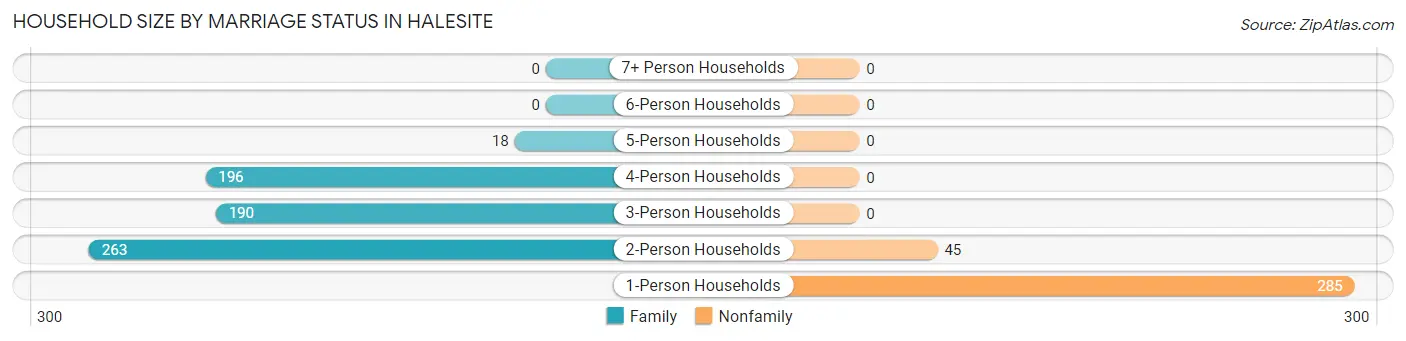
| Household Size | Family Households | Nonfamily Households |
| 1-Person Households | - | 285 (28.6%) |
| 2-Person Households | 263 (26.4%) | 45 (4.5%) |
| 3-Person Households | 190 (19.1%) | 0 (0.0%) |
| 4-Person Households | 196 (19.7%) | 0 (0.0%) |
| 5-Person Households | 18 (1.8%) | 0 (0.0%) |
| 6-Person Households | 0 (0.0%) | 0 (0.0%) |
| 7+ Person Households | 0 (0.0%) | 0 (0.0%) |
| Total | 667 (66.9%) | 330 (33.1%) |
Female Fertility in Halesite
Fertility by Age in Halesite
Average fertility rate in Halesite is 18.0 births per 1,000 women. Women in the age bracket of 35 to 50 years have the highest fertility rate with 35.0 births per 1,000 women. Women in the age bracket of 35 to 50 years acount for 100.0% of all women with births.
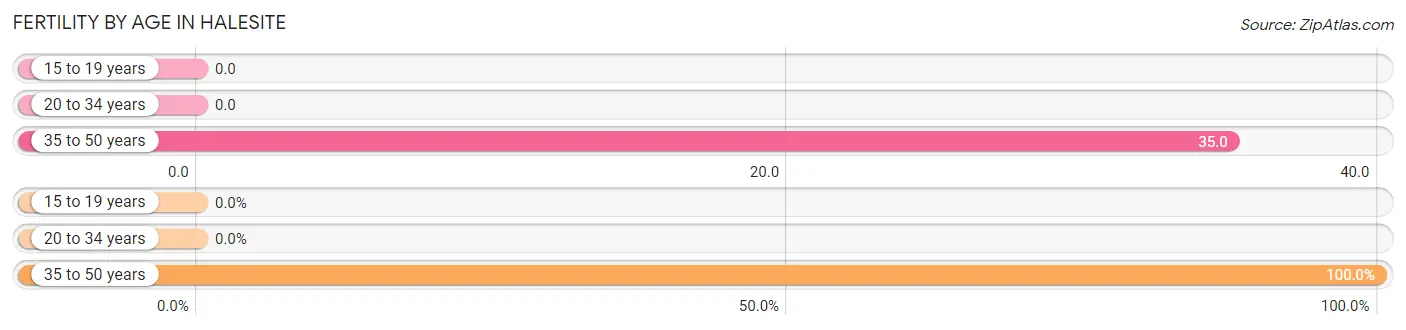
| Age Bracket | Women with Births | Births / 1,000 Women |
| 15 to 19 years | 0 (0.0%) | 0.0 |
| 20 to 34 years | 0 (0.0%) | 0.0 |
| 35 to 50 years | 10 (100.0%) | 35.0 |
| Total | 10 (100.0%) | 18.0 |
Fertility by Age by Marriage Status in Halesite
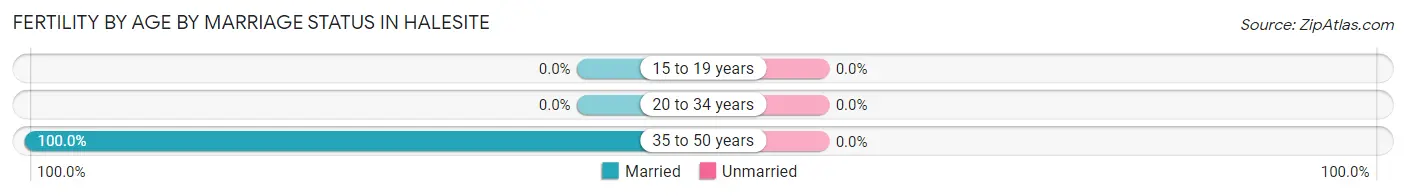
| Age Bracket | Married | Unmarried |
| 15 to 19 years | 0 (0.0%) | 0 (0.0%) |
| 20 to 34 years | 0 (0.0%) | 0 (0.0%) |
| 35 to 50 years | 10 (100.0%) | 0 (0.0%) |
| Total | 10 (100.0%) | 0 (0.0%) |
Fertility by Education in Halesite
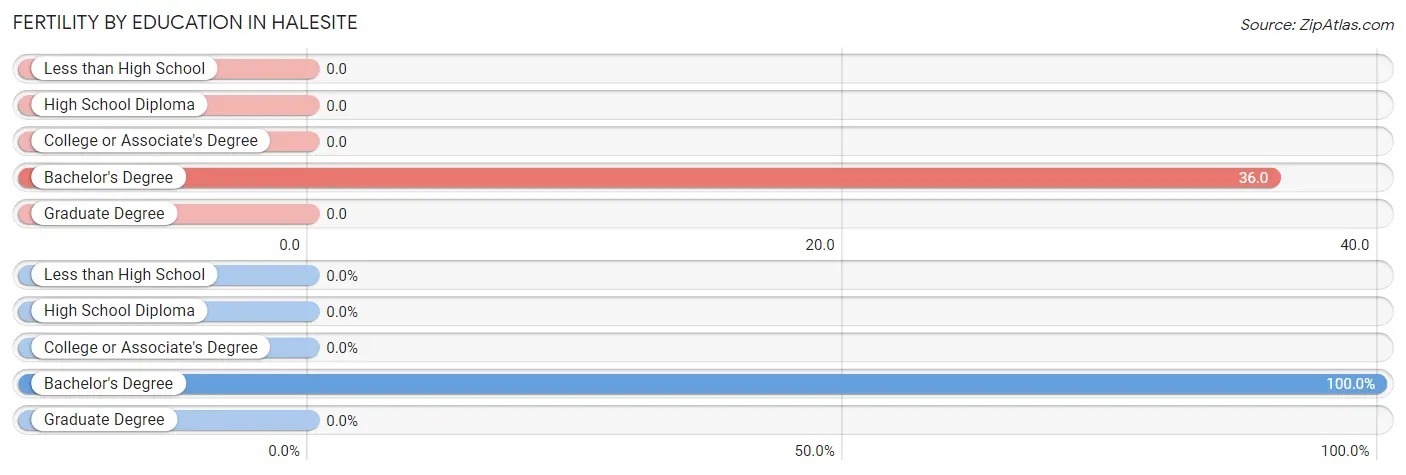
| Educational Attainment | Women with Births | Births / 1,000 Women |
| Less than High School | 0 (0.0%) | 0.0 |
| High School Diploma | 0 (0.0%) | 0.0 |
| College or Associate's Degree | 0 (0.0%) | 0.0 |
| Bachelor's Degree | 10 (100.0%) | 36.0 |
| Graduate Degree | 0 (0.0%) | 0.0 |
| Total | 10 (100.0%) | 18.0 |
Fertility by Education by Marriage Status in Halesite
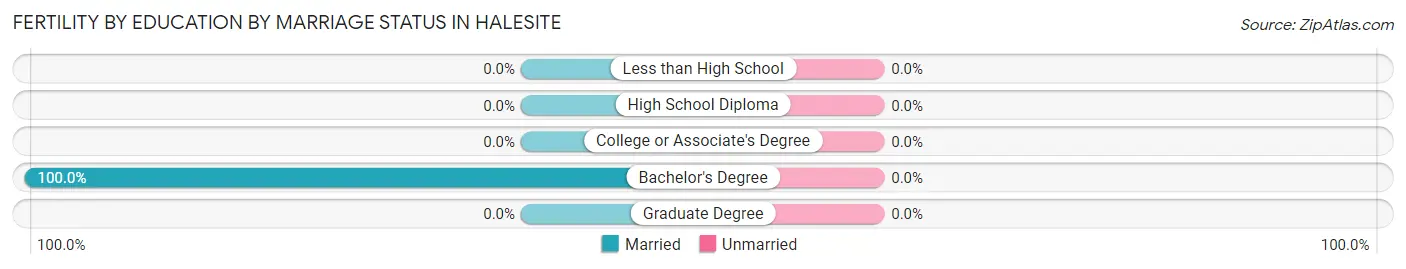
| Educational Attainment | Married | Unmarried |
| Less than High School | 0 (0.0%) | 0 (0.0%) |
| High School Diploma | 0 (0.0%) | 0 (0.0%) |
| College or Associate's Degree | 0 (0.0%) | 0 (0.0%) |
| Bachelor's Degree | 10 (100.0%) | 0 (0.0%) |
| Graduate Degree | 0 (0.0%) | 0 (0.0%) |
| Total | 10 (100.0%) | 0 (0.0%) |
Employment Characteristics in Halesite
Employment by Class of Employer in Halesite
Among the 1,212 employed individuals in Halesite, private company employees (584 | 48.2%), self-employed (incorporated) (159 | 13.1%), and not-for-profit organizations (125 | 10.3%) make up the most common classes of employment.
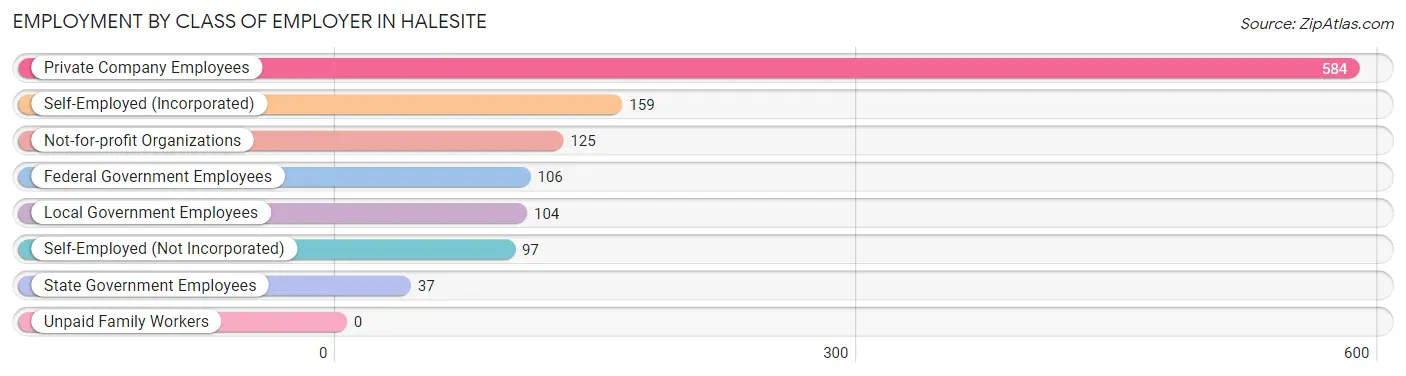
| Employer Class | # Employees | % Employees |
| Private Company Employees | 584 | 48.2% |
| Self-Employed (Incorporated) | 159 | 13.1% |
| Self-Employed (Not Incorporated) | 97 | 8.0% |
| Not-for-profit Organizations | 125 | 10.3% |
| Local Government Employees | 104 | 8.6% |
| State Government Employees | 37 | 3.0% |
| Federal Government Employees | 106 | 8.7% |
| Unpaid Family Workers | 0 | 0.0% |
| Total | 1,212 | 100.0% |
Employment Status by Age in Halesite
According to the labor force statistics for Halesite, out of the total population over 16 years of age (2,085), 63.2% or 1,318 individuals are in the labor force, with 8.0% or 105 of them unemployed. The age group with the highest labor force participation rate is 25 to 29 years, with 100.0% or 149 individuals in the labor force. Within the labor force, the 16 to 19 years age range has the highest percentage of unemployed individuals, with 100.0% or 31 of them being unemployed.
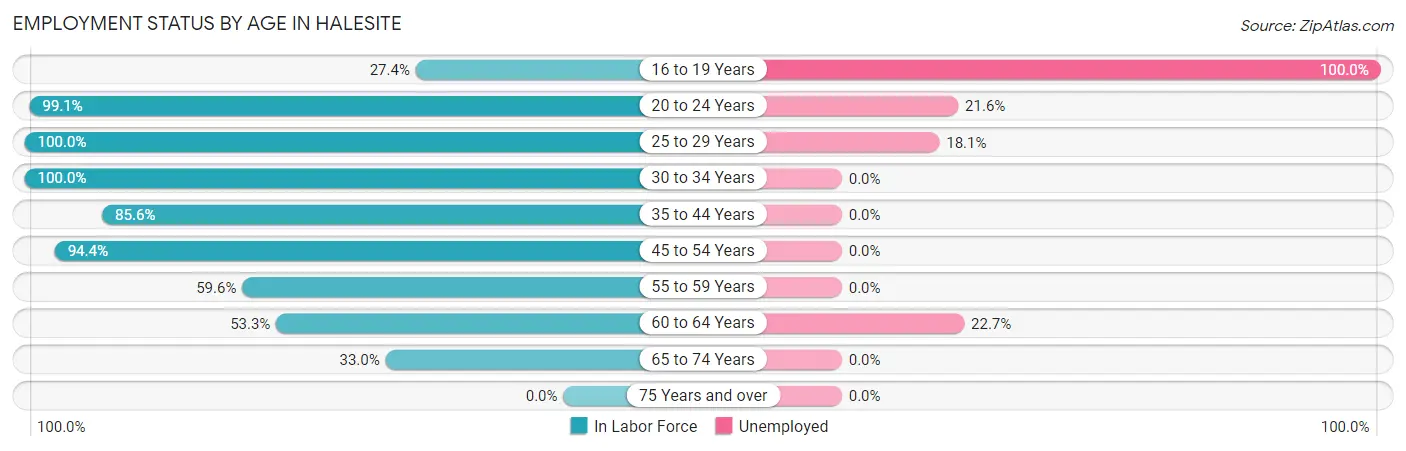
| Age Bracket | In Labor Force | Unemployed |
| 16 to 19 Years | 31 (27.4%) | 31 (100.0%) |
| 20 to 24 Years | 116 (99.1%) | 25 (21.6%) |
| 25 to 29 Years | 149 (100.0%) | 27 (18.1%) |
| 30 to 34 Years | 94 (100.0%) | 0 (0.0%) |
| 35 to 44 Years | 225 (85.6%) | 0 (0.0%) |
| 45 to 54 Years | 355 (94.4%) | 0 (0.0%) |
| 55 to 59 Years | 96 (59.6%) | 0 (0.0%) |
| 60 to 64 Years | 97 (53.3%) | 22 (22.7%) |
| 65 to 74 Years | 154 (33.0%) | 0 (0.0%) |
| 75 Years and over | 0 (0.0%) | 0 (0.0%) |
| Total | 1,318 (63.2%) | 105 (8.0%) |
Employment Status by Educational Attainment in Halesite
According to labor force statistics for Halesite, 82.9% of individuals (1,016) out of the total population between 25 and 64 years of age (1,225) are in the labor force, with 4.8% or 49 of them being unemployed. The group with the highest labor force participation rate are those with the educational attainment of bachelor's degree or higher, with 90.4% or 841 individuals in the labor force. Within the labor force, individuals with college / associate degree education have the highest percentage of unemployment, with 13.3% or 22 of them being unemployed.
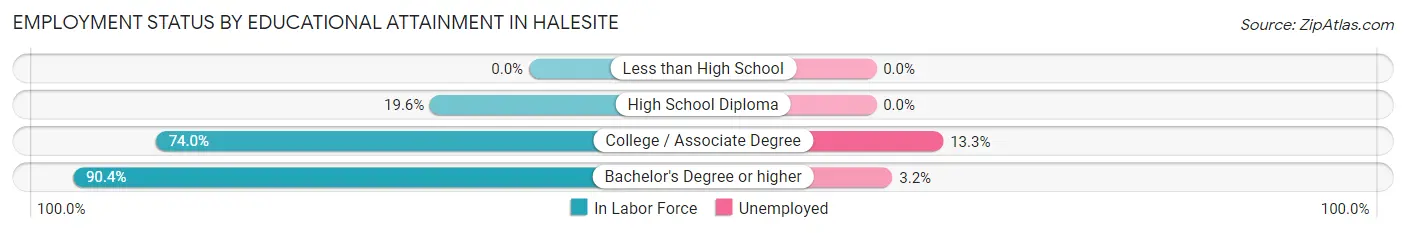
| Educational Attainment | In Labor Force | Unemployed |
| Less than High School | 0 (0.0%) | 0 (0.0%) |
| High School Diploma | 10 (19.6%) | 0 (0.0%) |
| College / Associate Degree | 165 (74.0%) | 30 (13.3%) |
| Bachelor's Degree or higher | 841 (90.4%) | 30 (3.2%) |
| Total | 1,016 (82.9%) | 59 (4.8%) |
Employment Occupations by Sex in Halesite
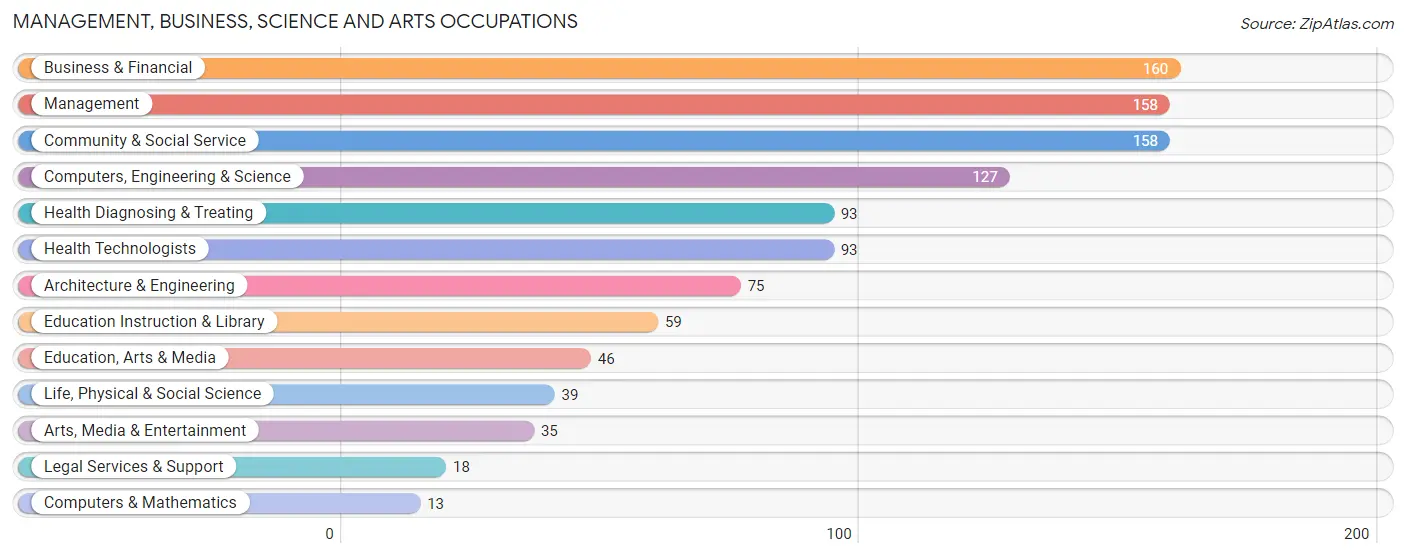
Management, Business, Science and Arts Occupations
The most common Management, Business, Science and Arts occupations in Halesite are Business & Financial (160 | 13.2%), Management (158 | 13.0%), Community & Social Service (158 | 13.0%), Computers, Engineering & Science (127 | 10.5%), and Health Diagnosing & Treating (93 | 7.7%).
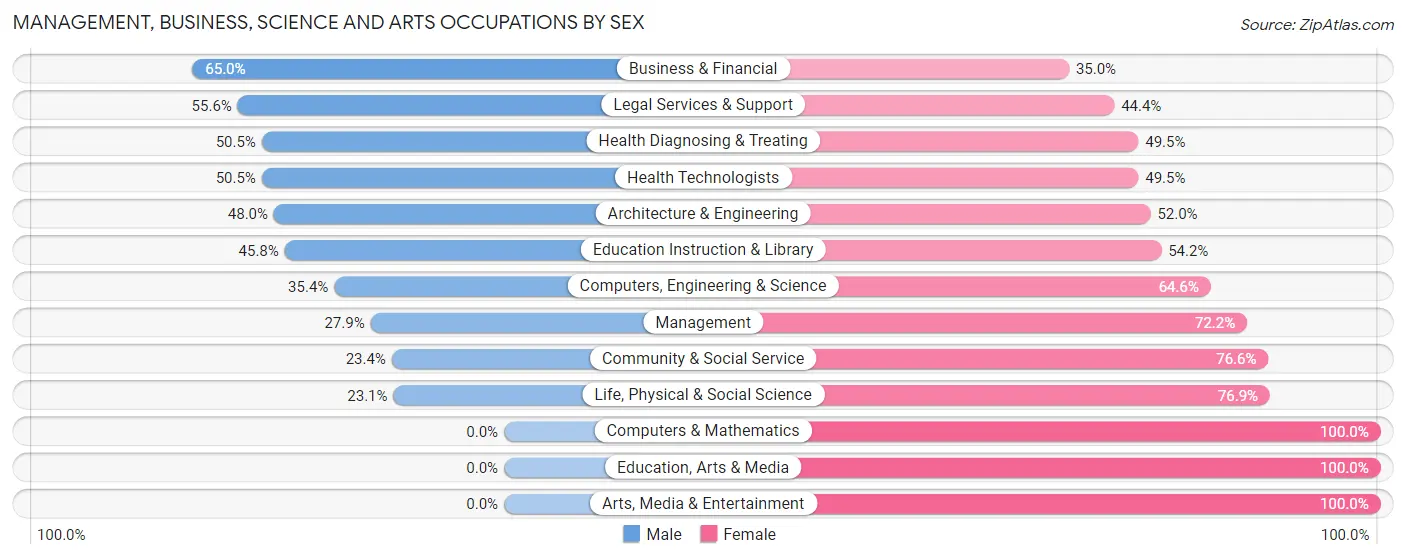
Management, Business, Science and Arts Occupations by Sex
Within the Management, Business, Science and Arts occupations in Halesite, the most male-oriented occupations are Business & Financial (65.0%), Legal Services & Support (55.6%), and Health Diagnosing & Treating (50.5%), while the most female-oriented occupations are Computers & Mathematics (100.0%), Education, Arts & Media (100.0%), and Arts, Media & Entertainment (100.0%).
| Occupation | Male | Female |
| Management | 44 (27.9%) | 114 (72.2%) |
| Business & Financial | 104 (65.0%) | 56 (35.0%) |
| Computers, Engineering & Science | 45 (35.4%) | 82 (64.6%) |
| Computers & Mathematics | 0 (0.0%) | 13 (100.0%) |
| Architecture & Engineering | 36 (48.0%) | 39 (52.0%) |
| Life, Physical & Social Science | 9 (23.1%) | 30 (76.9%) |
| Community & Social Service | 37 (23.4%) | 121 (76.6%) |
| Education, Arts & Media | 0 (0.0%) | 46 (100.0%) |
| Legal Services & Support | 10 (55.6%) | 8 (44.4%) |
| Education Instruction & Library | 27 (45.8%) | 32 (54.2%) |
| Arts, Media & Entertainment | 0 (0.0%) | 35 (100.0%) |
| Health Diagnosing & Treating | 47 (50.5%) | 46 (49.5%) |
| Health Technologists | 47 (50.5%) | 46 (49.5%) |
| Total (Category) | 277 (39.8%) | 419 (60.2%) |
| Total (Overall) | 516 (42.6%) | 696 (57.4%) |
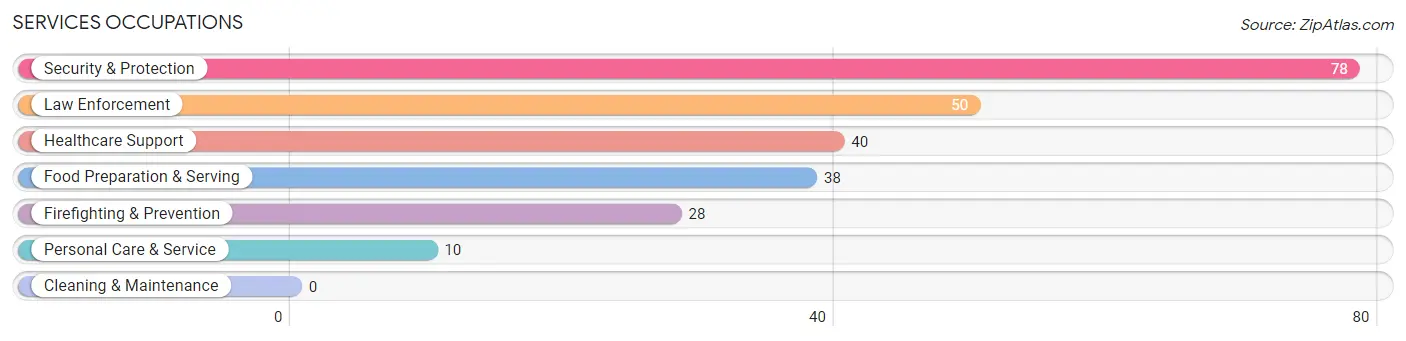
Services Occupations
The most common Services occupations in Halesite are Security & Protection (78 | 6.4%), Law Enforcement (50 | 4.1%), Healthcare Support (40 | 3.3%), Food Preparation & Serving (38 | 3.1%), and Firefighting & Prevention (28 | 2.3%).
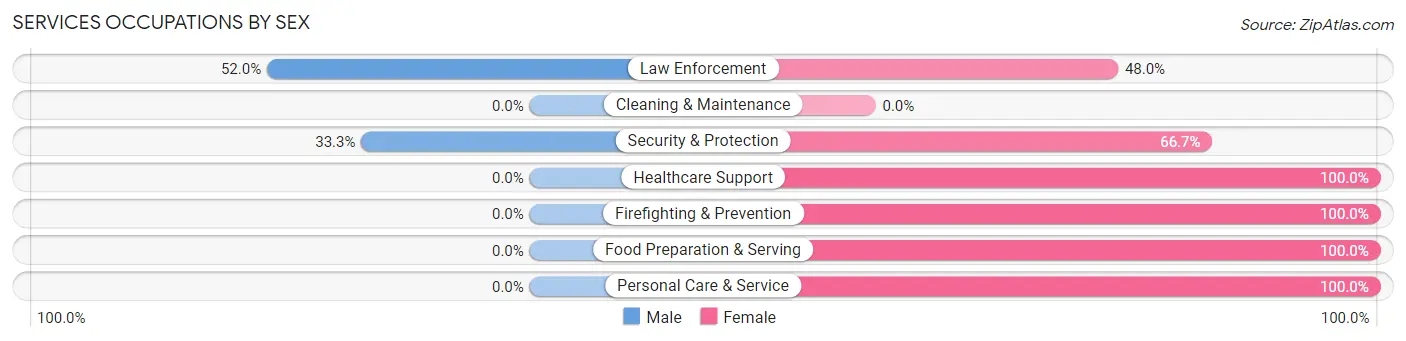
Services Occupations by Sex
Within the Services occupations in Halesite, the most male-oriented occupations are Law Enforcement (52.0%), and Security & Protection (33.3%), while the most female-oriented occupations are Healthcare Support (100.0%), Firefighting & Prevention (100.0%), and Food Preparation & Serving (100.0%).
| Occupation | Male | Female |
| Healthcare Support | 0 (0.0%) | 40 (100.0%) |
| Security & Protection | 26 (33.3%) | 52 (66.7%) |
| Firefighting & Prevention | 0 (0.0%) | 28 (100.0%) |
| Law Enforcement | 26 (52.0%) | 24 (48.0%) |
| Food Preparation & Serving | 0 (0.0%) | 38 (100.0%) |
| Cleaning & Maintenance | 0 (0.0%) | 0 (0.0%) |
| Personal Care & Service | 0 (0.0%) | 10 (100.0%) |
| Total (Category) | 26 (15.7%) | 140 (84.3%) |
| Total (Overall) | 516 (42.6%) | 696 (57.4%) |
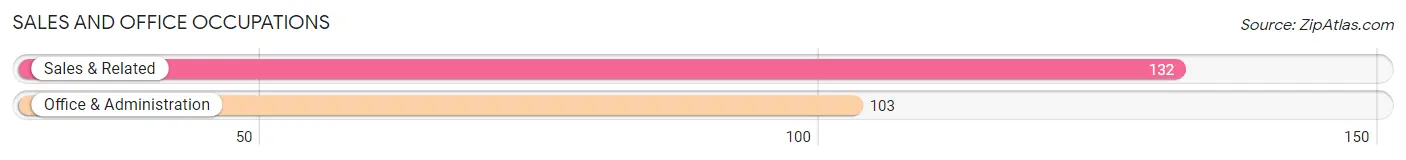
Sales and Office Occupations
The most common Sales and Office occupations in Halesite are Sales & Related (132 | 10.9%), and Office & Administration (103 | 8.5%).
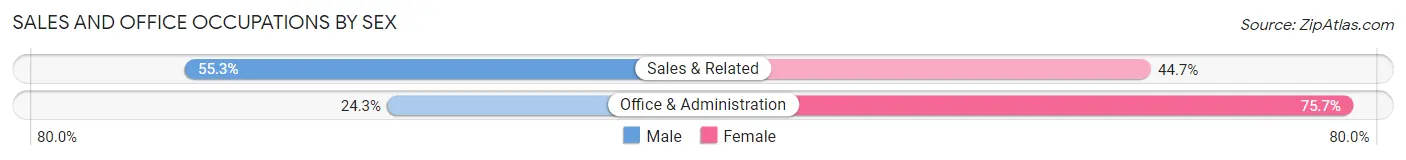
Sales and Office Occupations by Sex
| Occupation | Male | Female |
| Sales & Related | 73 (55.3%) | 59 (44.7%) |
| Office & Administration | 25 (24.3%) | 78 (75.7%) |
| Total (Category) | 98 (41.7%) | 137 (58.3%) |
| Total (Overall) | 516 (42.6%) | 696 (57.4%) |
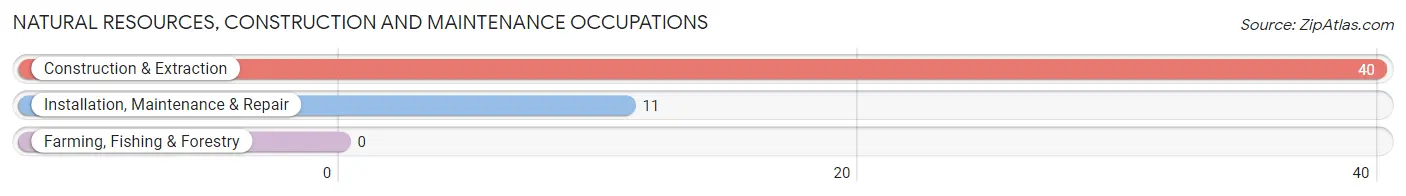
Natural Resources, Construction and Maintenance Occupations
The most common Natural Resources, Construction and Maintenance occupations in Halesite are Construction & Extraction (40 | 3.3%), and Installation, Maintenance & Repair (11 | 0.9%).
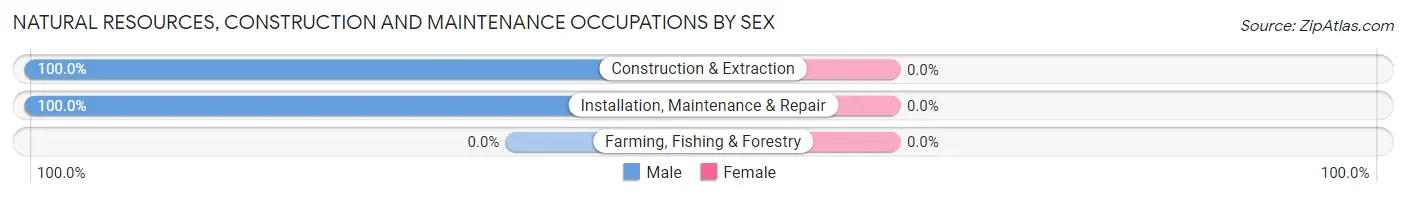
Natural Resources, Construction and Maintenance Occupations by Sex
| Occupation | Male | Female |
| Farming, Fishing & Forestry | 0 (0.0%) | 0 (0.0%) |
| Construction & Extraction | 40 (100.0%) | 0 (0.0%) |
| Installation, Maintenance & Repair | 11 (100.0%) | 0 (0.0%) |
| Total (Category) | 51 (100.0%) | 0 (0.0%) |
| Total (Overall) | 516 (42.6%) | 696 (57.4%) |
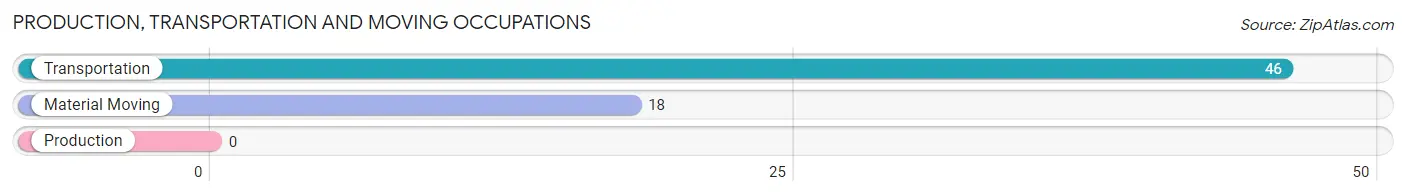
Production, Transportation and Moving Occupations
The most common Production, Transportation and Moving occupations in Halesite are Transportation (46 | 3.8%), and Material Moving (18 | 1.5%).
Production, Transportation and Moving Occupations by Sex
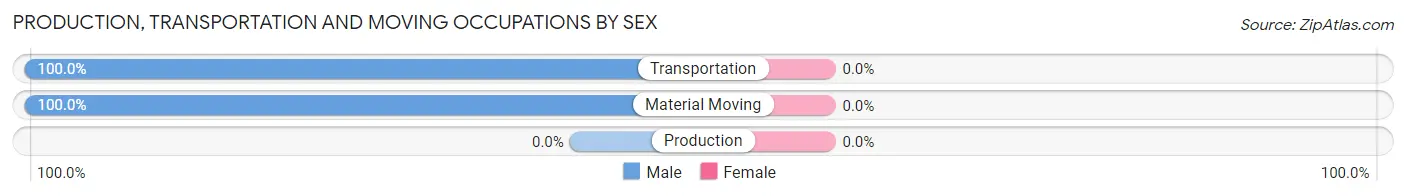
| Occupation | Male | Female |
| Production | 0 (0.0%) | 0 (0.0%) |
| Transportation | 46 (100.0%) | 0 (0.0%) |
| Material Moving | 18 (100.0%) | 0 (0.0%) |
| Total (Category) | 64 (100.0%) | 0 (0.0%) |
| Total (Overall) | 516 (42.6%) | 696 (57.4%) |
Employment Industries by Sex in Halesite
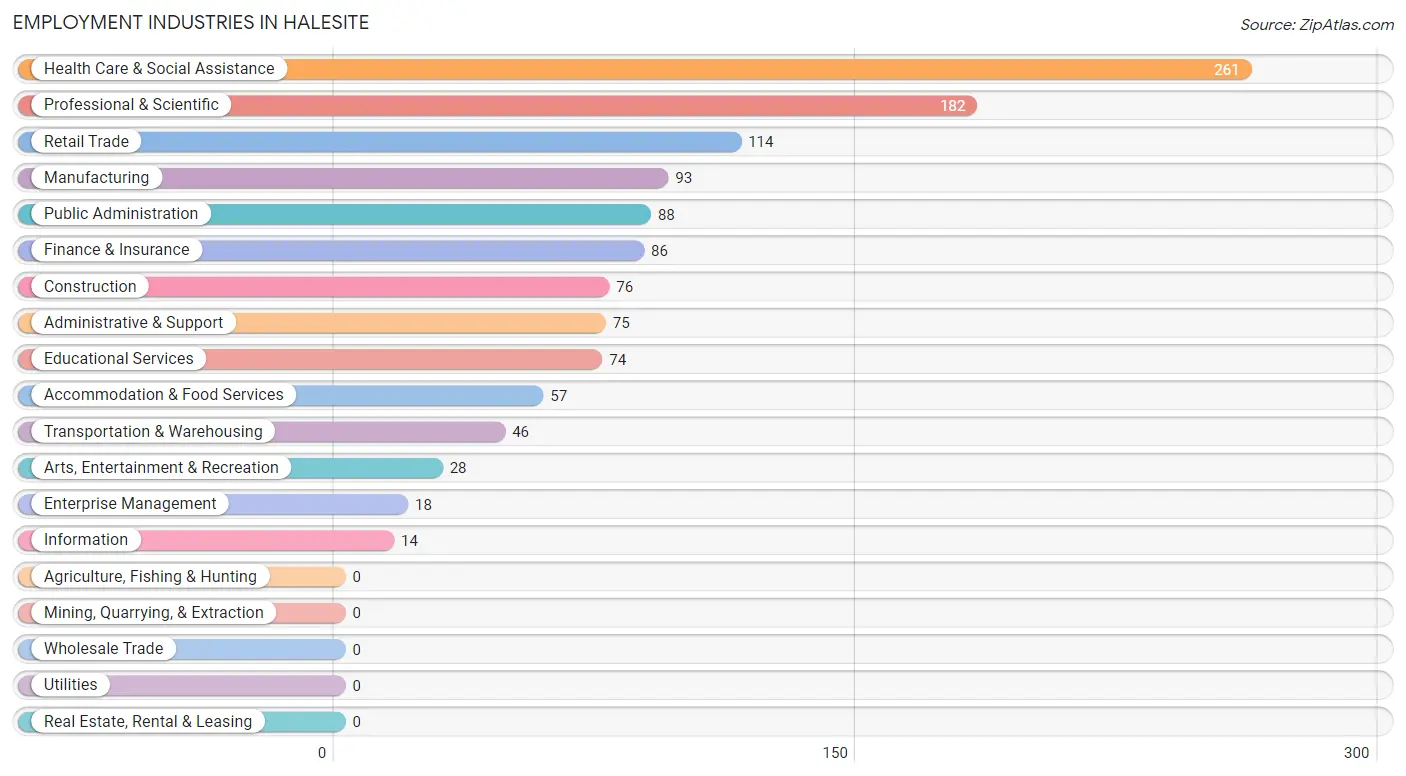
Employment Industries in Halesite
The major employment industries in Halesite include Health Care & Social Assistance (261 | 21.5%), Professional & Scientific (182 | 15.0%), Retail Trade (114 | 9.4%), Manufacturing (93 | 7.7%), and Public Administration (88 | 7.3%).
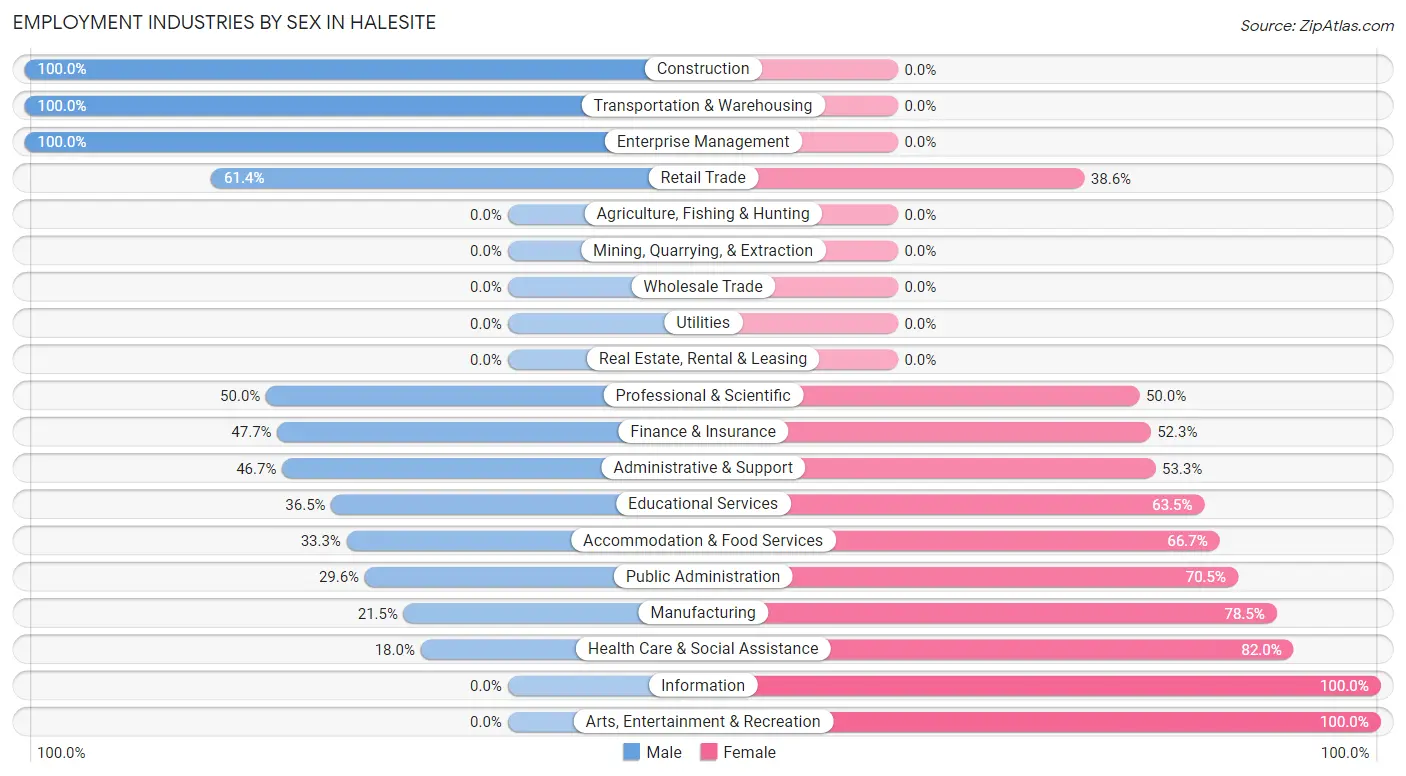
Employment Industries by Sex in Halesite
The Halesite industries that see more men than women are Construction (100.0%), Transportation & Warehousing (100.0%), and Enterprise Management (100.0%), whereas the industries that tend to have a higher number of women are Information (100.0%), Arts, Entertainment & Recreation (100.0%), and Health Care & Social Assistance (82.0%).
| Industry | Male | Female |
| Agriculture, Fishing & Hunting | 0 (0.0%) | 0 (0.0%) |
| Mining, Quarrying, & Extraction | 0 (0.0%) | 0 (0.0%) |
| Construction | 76 (100.0%) | 0 (0.0%) |
| Manufacturing | 20 (21.5%) | 73 (78.5%) |
| Wholesale Trade | 0 (0.0%) | 0 (0.0%) |
| Retail Trade | 70 (61.4%) | 44 (38.6%) |
| Transportation & Warehousing | 46 (100.0%) | 0 (0.0%) |
| Utilities | 0 (0.0%) | 0 (0.0%) |
| Information | 0 (0.0%) | 14 (100.0%) |
| Finance & Insurance | 41 (47.7%) | 45 (52.3%) |
| Real Estate, Rental & Leasing | 0 (0.0%) | 0 (0.0%) |
| Professional & Scientific | 91 (50.0%) | 91 (50.0%) |
| Enterprise Management | 18 (100.0%) | 0 (0.0%) |
| Administrative & Support | 35 (46.7%) | 40 (53.3%) |
| Educational Services | 27 (36.5%) | 47 (63.5%) |
| Health Care & Social Assistance | 47 (18.0%) | 214 (82.0%) |
| Arts, Entertainment & Recreation | 0 (0.0%) | 28 (100.0%) |
| Accommodation & Food Services | 19 (33.3%) | 38 (66.7%) |
| Public Administration | 26 (29.5%) | 62 (70.5%) |
| Total | 516 (42.6%) | 696 (57.4%) |
Education in Halesite
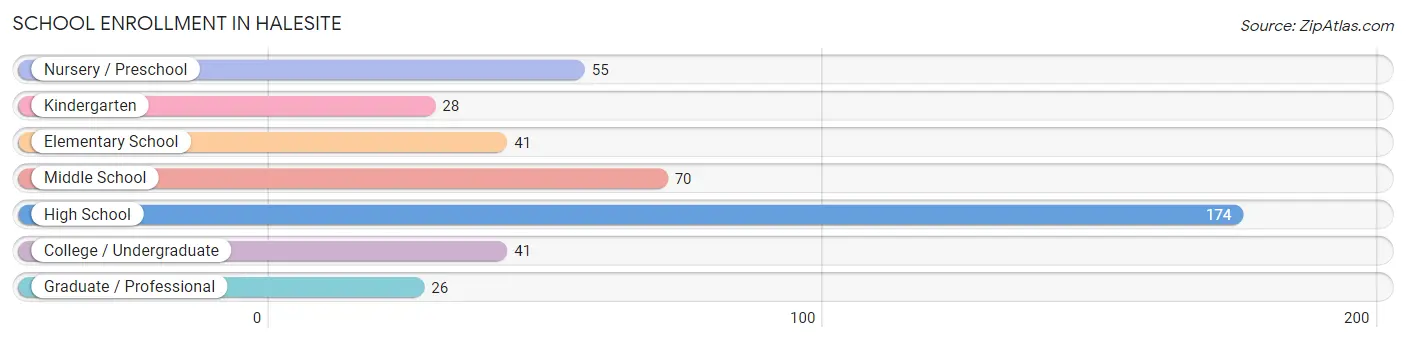
School Enrollment in Halesite
The most common levels of schooling among the 435 students in Halesite are high school (174 | 40.0%), middle school (70 | 16.1%), and nursery / preschool (55 | 12.6%).
| School Level | # Students | % Students |
| Nursery / Preschool | 55 | 12.6% |
| Kindergarten | 28 | 6.4% |
| Elementary School | 41 | 9.4% |
| Middle School | 70 | 16.1% |
| High School | 174 | 40.0% |
| College / Undergraduate | 41 | 9.4% |
| Graduate / Professional | 26 | 6.0% |
| Total | 435 | 100.0% |
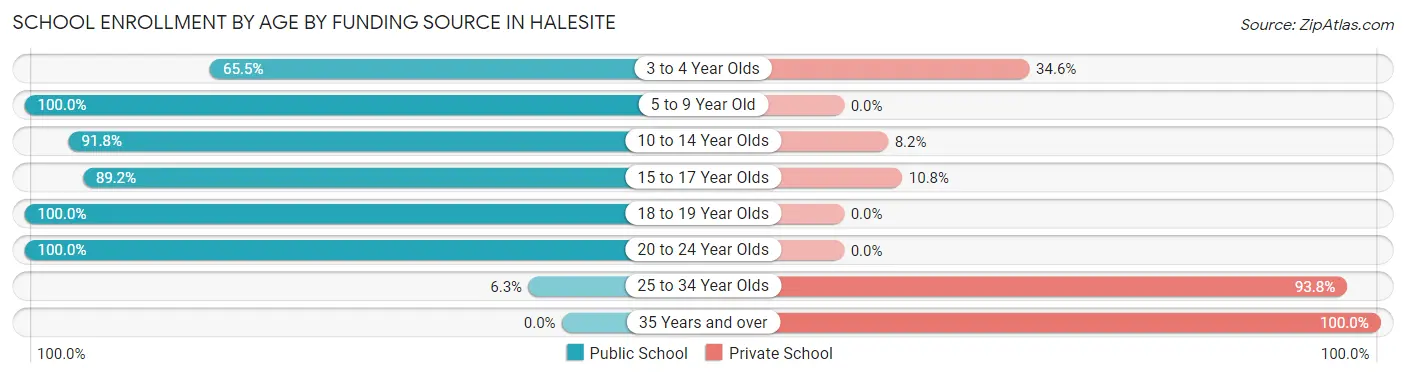
School Enrollment by Age by Funding Source in Halesite
Out of a total of 435 students who are enrolled in schools in Halesite, 63 (14.5%) attend a private institution, while the remaining 372 (85.5%) are enrolled in public schools. The age group of 35 years and over has the highest likelihood of being enrolled in private schools, with 10 (100.0% in the age bracket) enrolled. Conversely, the age group of 5 to 9 year old has the lowest likelihood of being enrolled in a private school, with 69 (100.0% in the age bracket) attending a public institution.
| Age Bracket | Public School | Private School |
| 3 to 4 Year Olds | 36 (65.4%) | 19 (34.5%) |
| 5 to 9 Year Old | 69 (100.0%) | 0 (0.0%) |
| 10 to 14 Year Olds | 112 (91.8%) | 10 (8.2%) |
| 15 to 17 Year Olds | 74 (89.2%) | 9 (10.8%) |
| 18 to 19 Year Olds | 39 (100.0%) | 0 (0.0%) |
| 20 to 24 Year Olds | 41 (100.0%) | 0 (0.0%) |
| 25 to 34 Year Olds | 1 (6.2%) | 15 (93.8%) |
| 35 Years and over | 0 (0.0%) | 10 (100.0%) |
| Total | 372 (85.5%) | 63 (14.5%) |
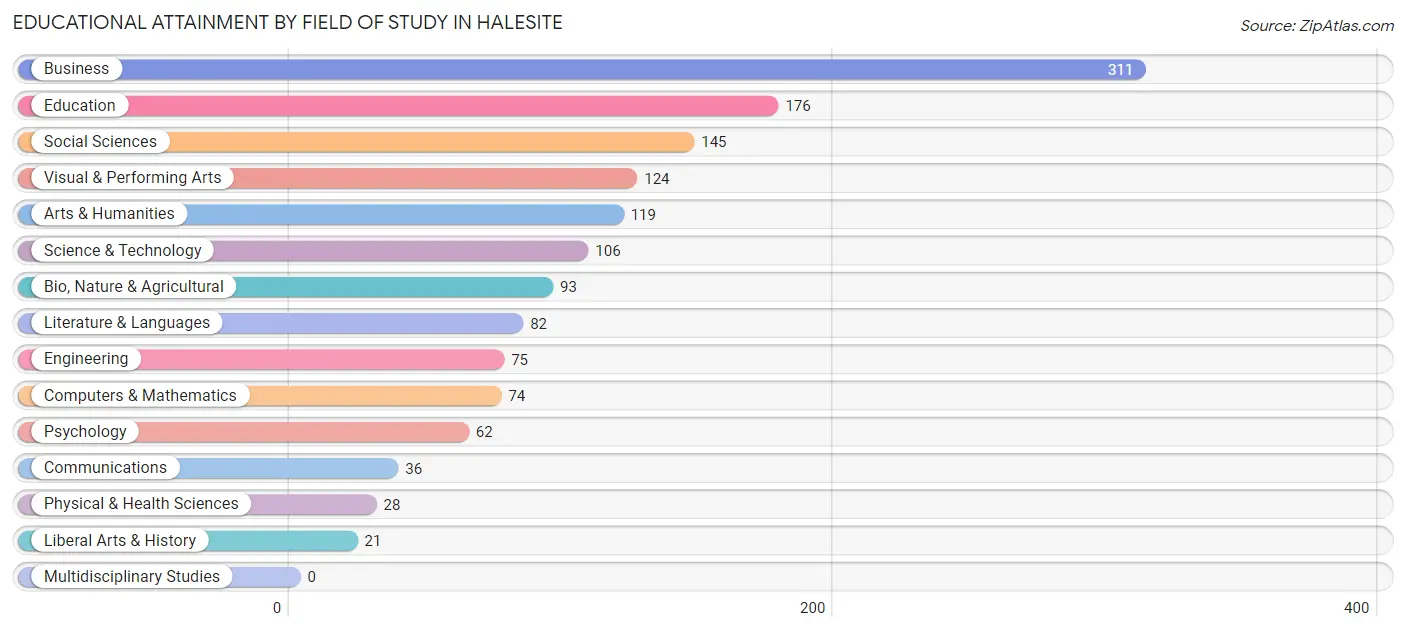
Educational Attainment by Field of Study in Halesite
Business (311 | 21.4%), education (176 | 12.1%), social sciences (145 | 10.0%), visual & performing arts (124 | 8.5%), and arts & humanities (119 | 8.2%) are the most common fields of study among 1,452 individuals in Halesite who have obtained a bachelor's degree or higher.
| Field of Study | # Graduates | % Graduates |
| Computers & Mathematics | 74 | 5.1% |
| Bio, Nature & Agricultural | 93 | 6.4% |
| Physical & Health Sciences | 28 | 1.9% |
| Psychology | 62 | 4.3% |
| Social Sciences | 145 | 10.0% |
| Engineering | 75 | 5.2% |
| Multidisciplinary Studies | 0 | 0.0% |
| Science & Technology | 106 | 7.3% |
| Business | 311 | 21.4% |
| Education | 176 | 12.1% |
| Literature & Languages | 82 | 5.7% |
| Liberal Arts & History | 21 | 1.5% |
| Visual & Performing Arts | 124 | 8.5% |
| Communications | 36 | 2.5% |
| Arts & Humanities | 119 | 8.2% |
| Total | 1,452 | 100.0% |
Transportation & Commute in Halesite
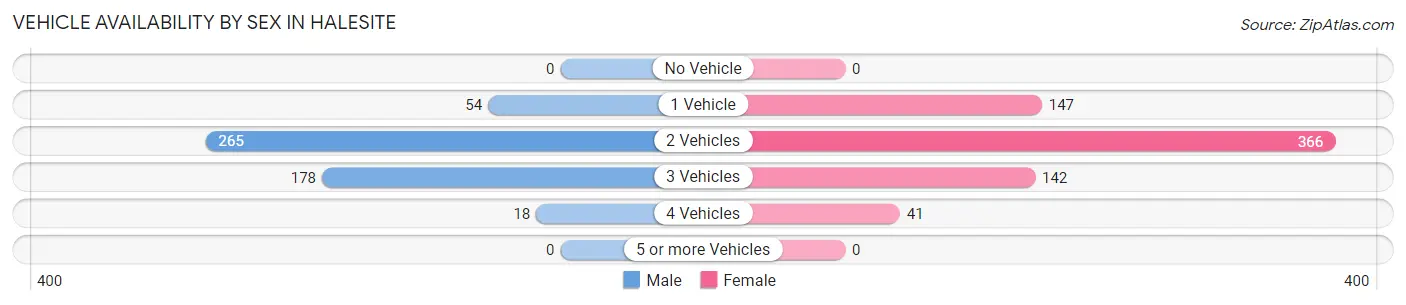
Vehicle Availability by Sex in Halesite
The most prevalent vehicle ownership categories in Halesite are males with 2 vehicles (265, accounting for 51.5%) and females with 2 vehicles (366, making up 38.1%).
| Vehicles Available | Male | Female |
| No Vehicle | 0 (0.0%) | 0 (0.0%) |
| 1 Vehicle | 54 (10.5%) | 147 (21.1%) |
| 2 Vehicles | 265 (51.5%) | 366 (52.6%) |
| 3 Vehicles | 178 (34.6%) | 142 (20.4%) |
| 4 Vehicles | 18 (3.5%) | 41 (5.9%) |
| 5 or more Vehicles | 0 (0.0%) | 0 (0.0%) |
| Total | 515 (100.0%) | 696 (100.0%) |
Commute Time in Halesite
The most frequently occuring commute durations in Halesite are 90 or more minutes (162 commuters, 17.1%), 5 to 9 minutes (148 commuters, 15.6%), and 10 to 14 minutes (136 commuters, 14.4%).
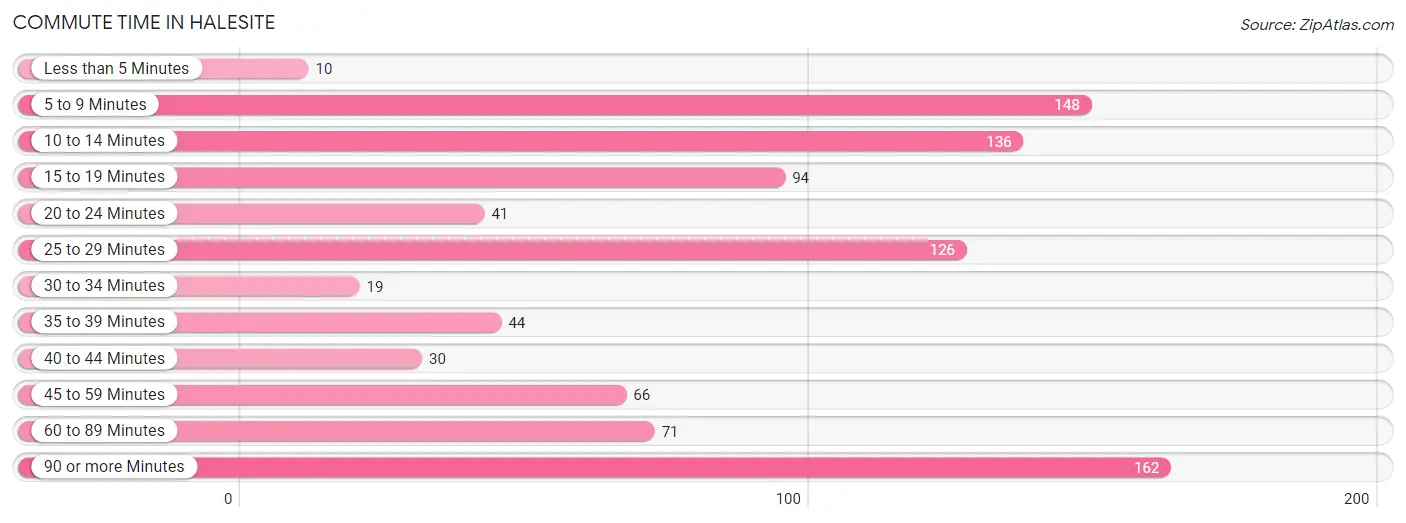
| Commute Time | # Commuters | % Commuters |
| Less than 5 Minutes | 10 | 1.1% |
| 5 to 9 Minutes | 148 | 15.6% |
| 10 to 14 Minutes | 136 | 14.4% |
| 15 to 19 Minutes | 94 | 9.9% |
| 20 to 24 Minutes | 41 | 4.3% |
| 25 to 29 Minutes | 126 | 13.3% |
| 30 to 34 Minutes | 19 | 2.0% |
| 35 to 39 Minutes | 44 | 4.6% |
| 40 to 44 Minutes | 30 | 3.2% |
| 45 to 59 Minutes | 66 | 7.0% |
| 60 to 89 Minutes | 71 | 7.5% |
| 90 or more Minutes | 162 | 17.1% |
Commute Time by Sex in Halesite
The most common commute times in Halesite are 90 or more minutes (83 commuters, 21.9%) for males and 25 to 29 minutes (105 commuters, 18.5%) for females.
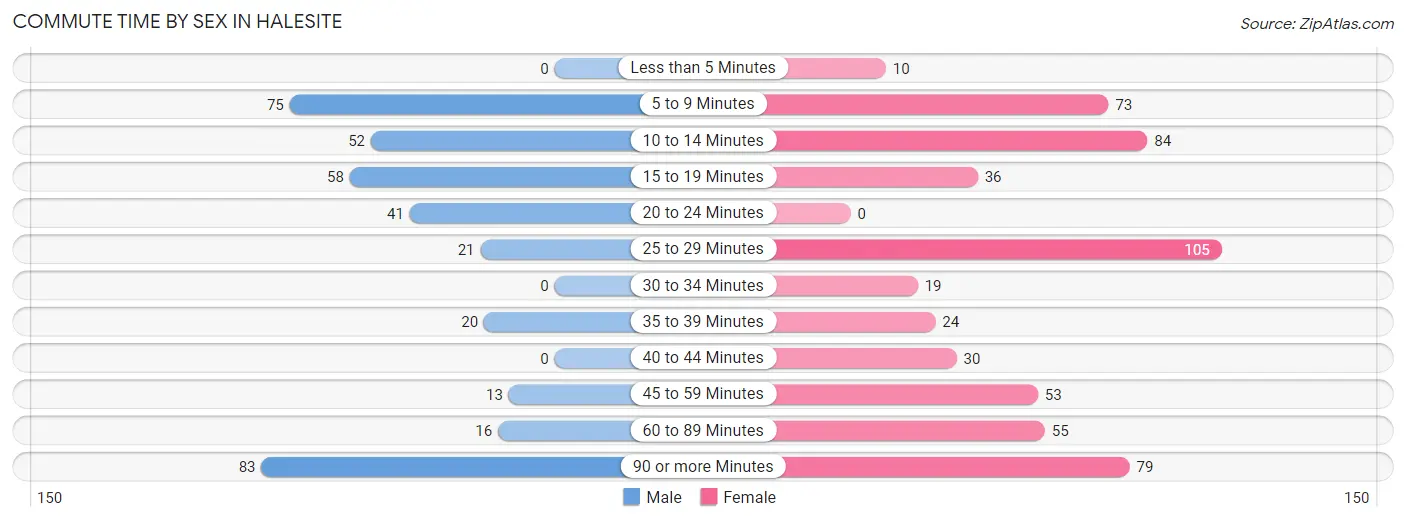
| Commute Time | Male | Female |
| Less than 5 Minutes | 0 (0.0%) | 10 (1.8%) |
| 5 to 9 Minutes | 75 (19.8%) | 73 (12.9%) |
| 10 to 14 Minutes | 52 (13.7%) | 84 (14.8%) |
| 15 to 19 Minutes | 58 (15.3%) | 36 (6.3%) |
| 20 to 24 Minutes | 41 (10.8%) | 0 (0.0%) |
| 25 to 29 Minutes | 21 (5.5%) | 105 (18.5%) |
| 30 to 34 Minutes | 0 (0.0%) | 19 (3.4%) |
| 35 to 39 Minutes | 20 (5.3%) | 24 (4.2%) |
| 40 to 44 Minutes | 0 (0.0%) | 30 (5.3%) |
| 45 to 59 Minutes | 13 (3.4%) | 53 (9.3%) |
| 60 to 89 Minutes | 16 (4.2%) | 55 (9.7%) |
| 90 or more Minutes | 83 (21.9%) | 79 (13.9%) |
Time of Departure to Work by Sex in Halesite
The most frequent times of departure to work in Halesite are 7:00 AM to 7:29 AM (68, 17.9%) for males and 7:00 AM to 7:29 AM (180, 31.7%) for females.
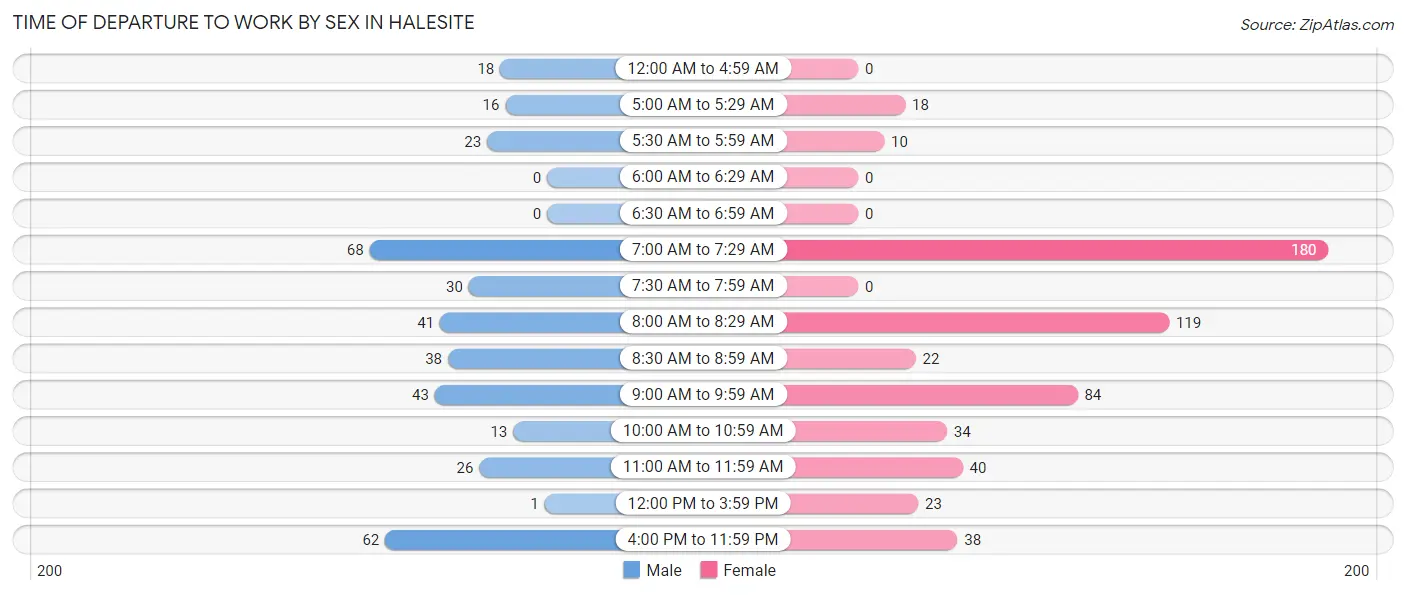
| Time of Departure | Male | Female |
| 12:00 AM to 4:59 AM | 18 (4.8%) | 0 (0.0%) |
| 5:00 AM to 5:29 AM | 16 (4.2%) | 18 (3.2%) |
| 5:30 AM to 5:59 AM | 23 (6.1%) | 10 (1.8%) |
| 6:00 AM to 6:29 AM | 0 (0.0%) | 0 (0.0%) |
| 6:30 AM to 6:59 AM | 0 (0.0%) | 0 (0.0%) |
| 7:00 AM to 7:29 AM | 68 (17.9%) | 180 (31.7%) |
| 7:30 AM to 7:59 AM | 30 (7.9%) | 0 (0.0%) |
| 8:00 AM to 8:29 AM | 41 (10.8%) | 119 (20.9%) |
| 8:30 AM to 8:59 AM | 38 (10.0%) | 22 (3.9%) |
| 9:00 AM to 9:59 AM | 43 (11.4%) | 84 (14.8%) |
| 10:00 AM to 10:59 AM | 13 (3.4%) | 34 (6.0%) |
| 11:00 AM to 11:59 AM | 26 (6.9%) | 40 (7.0%) |
| 12:00 PM to 3:59 PM | 1 (0.3%) | 23 (4.1%) |
| 4:00 PM to 11:59 PM | 62 (16.4%) | 38 (6.7%) |
| Total | 379 (100.0%) | 568 (100.0%) |
Housing Occupancy in Halesite
Occupancy by Ownership in Halesite
Of the total 997 dwellings in Halesite, owner-occupied units account for 872 (87.5%), while renter-occupied units make up 125 (12.5%).
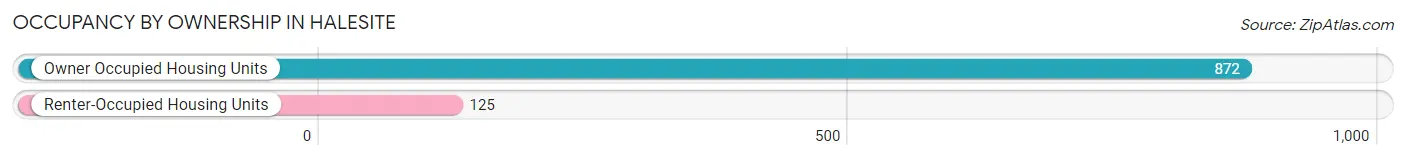
| Occupancy | # Housing Units | % Housing Units |
| Owner Occupied Housing Units | 872 | 87.5% |
| Renter-Occupied Housing Units | 125 | 12.5% |
| Total Occupied Housing Units | 997 | 100.0% |
Occupancy by Household Size in Halesite
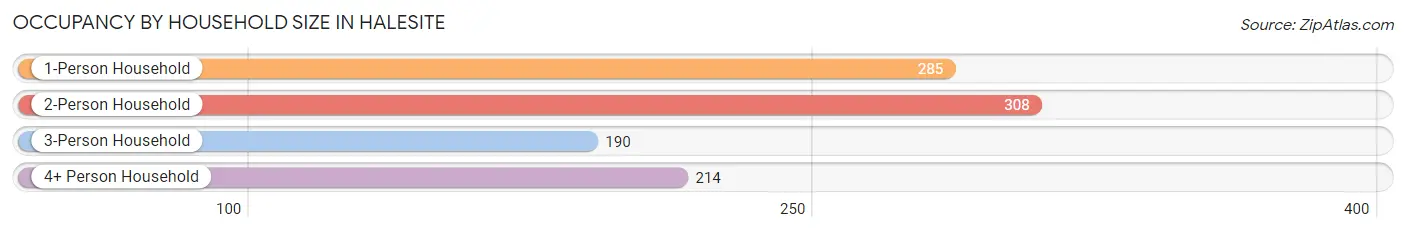
| Household Size | # Housing Units | % Housing Units |
| 1-Person Household | 285 | 28.6% |
| 2-Person Household | 308 | 30.9% |
| 3-Person Household | 190 | 19.1% |
| 4+ Person Household | 214 | 21.5% |
| Total Housing Units | 997 | 100.0% |
Occupancy by Ownership by Household Size in Halesite
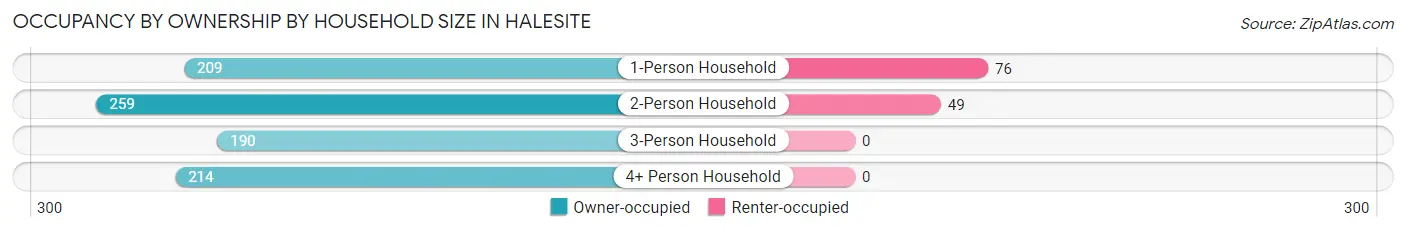
| Household Size | Owner-occupied | Renter-occupied |
| 1-Person Household | 209 (73.3%) | 76 (26.7%) |
| 2-Person Household | 259 (84.1%) | 49 (15.9%) |
| 3-Person Household | 190 (100.0%) | 0 (0.0%) |
| 4+ Person Household | 214 (100.0%) | 0 (0.0%) |
| Total Housing Units | 872 (87.5%) | 125 (12.5%) |
Occupancy by Educational Attainment in Halesite
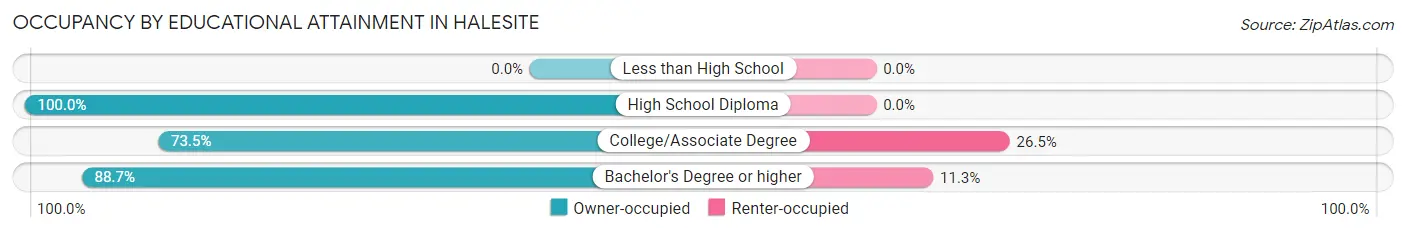
| Household Size | Owner-occupied | Renter-occupied |
| Less than High School | 0 (0.0%) | 0 (0.0%) |
| High School Diploma | 73 (100.0%) | 0 (0.0%) |
| College/Associate Degree | 100 (73.5%) | 36 (26.5%) |
| Bachelor's Degree or higher | 699 (88.7%) | 89 (11.3%) |
Occupancy by Age of Householder in Halesite
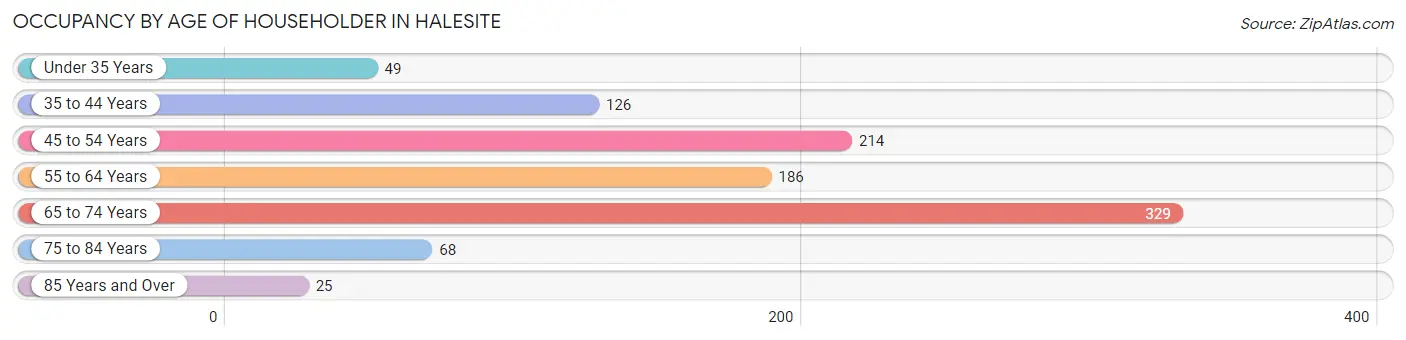
| Age Bracket | # Households | % Households |
| Under 35 Years | 49 | 4.9% |
| 35 to 44 Years | 126 | 12.6% |
| 45 to 54 Years | 214 | 21.5% |
| 55 to 64 Years | 186 | 18.7% |
| 65 to 74 Years | 329 | 33.0% |
| 75 to 84 Years | 68 | 6.8% |
| 85 Years and Over | 25 | 2.5% |
| Total | 997 | 100.0% |
Housing Finances in Halesite
Median Income by Occupancy in Halesite
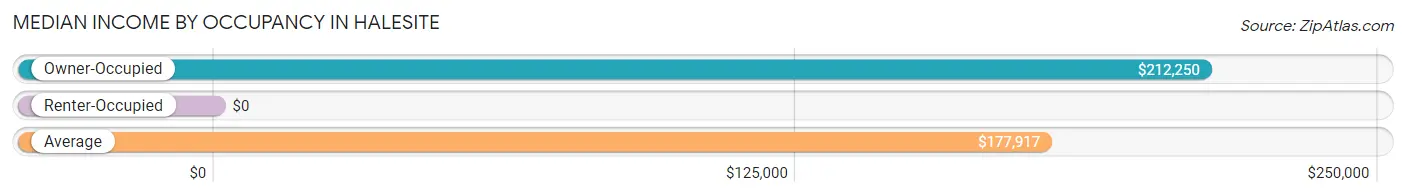
| Occupancy Type | # Households | Median Income |
| Owner-Occupied | 872 (87.5%) | $212,250 |
| Renter-Occupied | 125 (12.5%) | $0 |
| Average | 997 (100.0%) | $177,917 |
Occupancy by Householder Income Bracket in Halesite
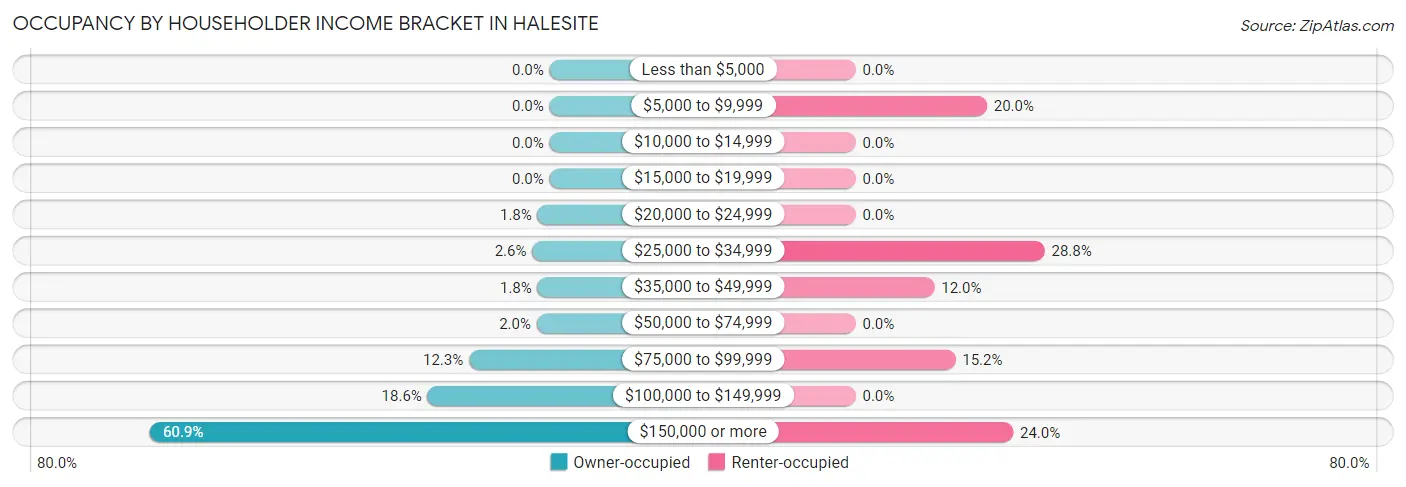
| Income Bracket | Owner-occupied | Renter-occupied |
| Less than $5,000 | 0 (0.0%) | 0 (0.0%) |
| $5,000 to $9,999 | 0 (0.0%) | 25 (20.0%) |
| $10,000 to $14,999 | 0 (0.0%) | 0 (0.0%) |
| $15,000 to $19,999 | 0 (0.0%) | 0 (0.0%) |
| $20,000 to $24,999 | 16 (1.8%) | 0 (0.0%) |
| $25,000 to $34,999 | 23 (2.6%) | 36 (28.8%) |
| $35,000 to $49,999 | 16 (1.8%) | 15 (12.0%) |
| $50,000 to $74,999 | 17 (1.9%) | 0 (0.0%) |
| $75,000 to $99,999 | 107 (12.3%) | 19 (15.2%) |
| $100,000 to $149,999 | 162 (18.6%) | 0 (0.0%) |
| $150,000 or more | 531 (60.9%) | 30 (24.0%) |
| Total | 872 (100.0%) | 125 (100.0%) |
Monthly Housing Cost Tiers in Halesite
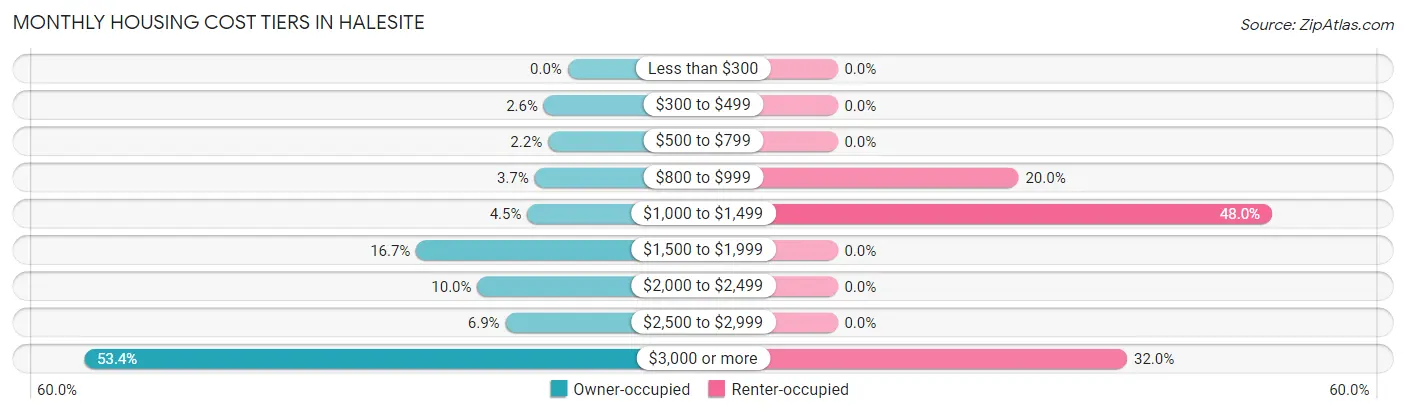
| Monthly Cost | Owner-occupied | Renter-occupied |
| Less than $300 | 0 (0.0%) | 0 (0.0%) |
| $300 to $499 | 23 (2.6%) | 0 (0.0%) |
| $500 to $799 | 19 (2.2%) | 0 (0.0%) |
| $800 to $999 | 32 (3.7%) | 25 (20.0%) |
| $1,000 to $1,499 | 39 (4.5%) | 60 (48.0%) |
| $1,500 to $1,999 | 146 (16.7%) | 0 (0.0%) |
| $2,000 to $2,499 | 87 (10.0%) | 0 (0.0%) |
| $2,500 to $2,999 | 60 (6.9%) | 0 (0.0%) |
| $3,000 or more | 466 (53.4%) | 40 (32.0%) |
| Total | 872 (100.0%) | 125 (100.0%) |
Physical Housing Characteristics in Halesite
Housing Structures in Halesite
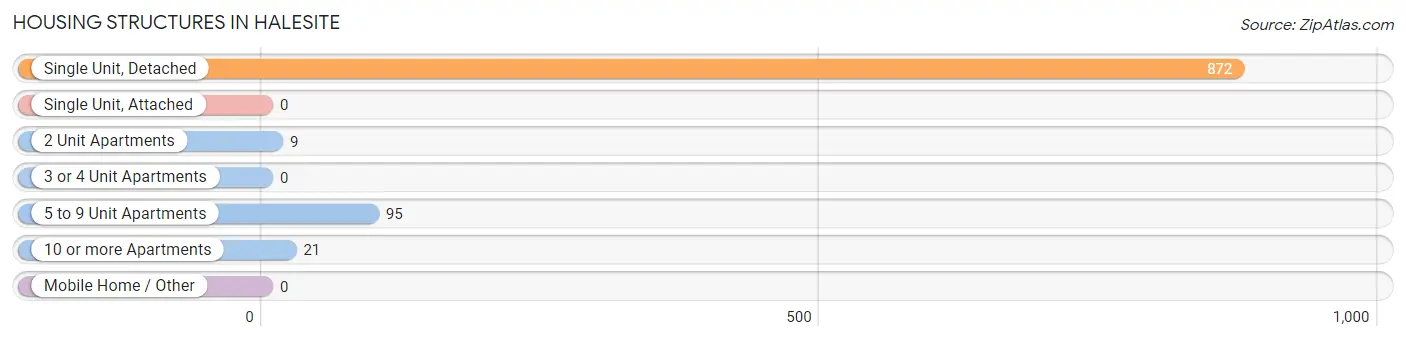
| Structure Type | # Housing Units | % Housing Units |
| Single Unit, Detached | 872 | 87.5% |
| Single Unit, Attached | 0 | 0.0% |
| 2 Unit Apartments | 9 | 0.9% |
| 3 or 4 Unit Apartments | 0 | 0.0% |
| 5 to 9 Unit Apartments | 95 | 9.5% |
| 10 or more Apartments | 21 | 2.1% |
| Mobile Home / Other | 0 | 0.0% |
| Total | 997 | 100.0% |
Housing Structures by Occupancy in Halesite
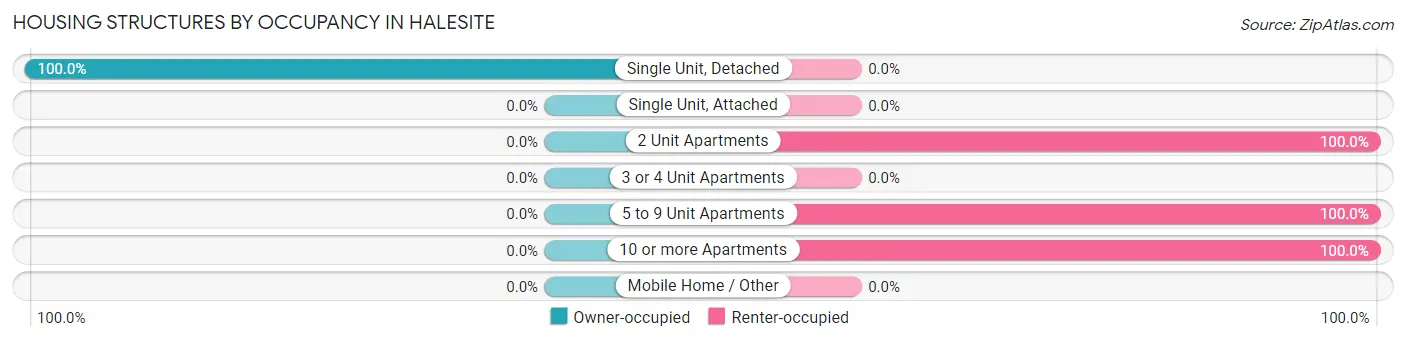
| Structure Type | Owner-occupied | Renter-occupied |
| Single Unit, Detached | 872 (100.0%) | 0 (0.0%) |
| Single Unit, Attached | 0 (0.0%) | 0 (0.0%) |
| 2 Unit Apartments | 0 (0.0%) | 9 (100.0%) |
| 3 or 4 Unit Apartments | 0 (0.0%) | 0 (0.0%) |
| 5 to 9 Unit Apartments | 0 (0.0%) | 95 (100.0%) |
| 10 or more Apartments | 0 (0.0%) | 21 (100.0%) |
| Mobile Home / Other | 0 (0.0%) | 0 (0.0%) |
| Total | 872 (87.5%) | 125 (12.5%) |
Housing Structures by Number of Rooms in Halesite
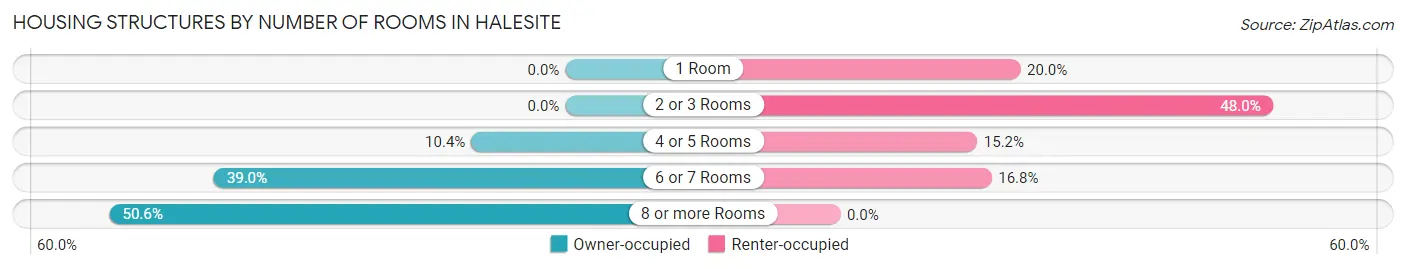
| Number of Rooms | Owner-occupied | Renter-occupied |
| 1 Room | 0 (0.0%) | 25 (20.0%) |
| 2 or 3 Rooms | 0 (0.0%) | 60 (48.0%) |
| 4 or 5 Rooms | 91 (10.4%) | 19 (15.2%) |
| 6 or 7 Rooms | 340 (39.0%) | 21 (16.8%) |
| 8 or more Rooms | 441 (50.6%) | 0 (0.0%) |
| Total | 872 (100.0%) | 125 (100.0%) |
Housing Structure by Heating Type in Halesite
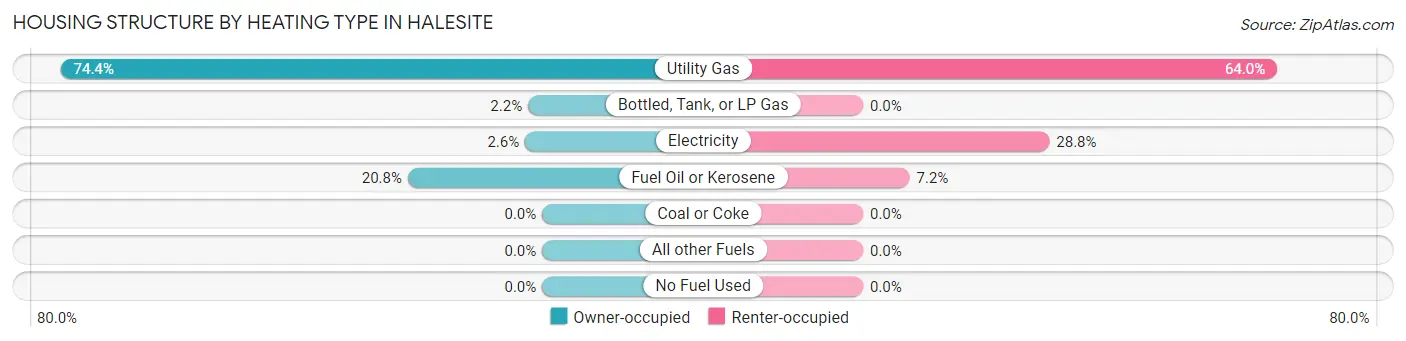
| Heating Type | Owner-occupied | Renter-occupied |
| Utility Gas | 649 (74.4%) | 80 (64.0%) |
| Bottled, Tank, or LP Gas | 19 (2.2%) | 0 (0.0%) |
| Electricity | 23 (2.6%) | 36 (28.8%) |
| Fuel Oil or Kerosene | 181 (20.8%) | 9 (7.2%) |
| Coal or Coke | 0 (0.0%) | 0 (0.0%) |
| All other Fuels | 0 (0.0%) | 0 (0.0%) |
| No Fuel Used | 0 (0.0%) | 0 (0.0%) |
| Total | 872 (100.0%) | 125 (100.0%) |
Household Vehicle Usage in Halesite
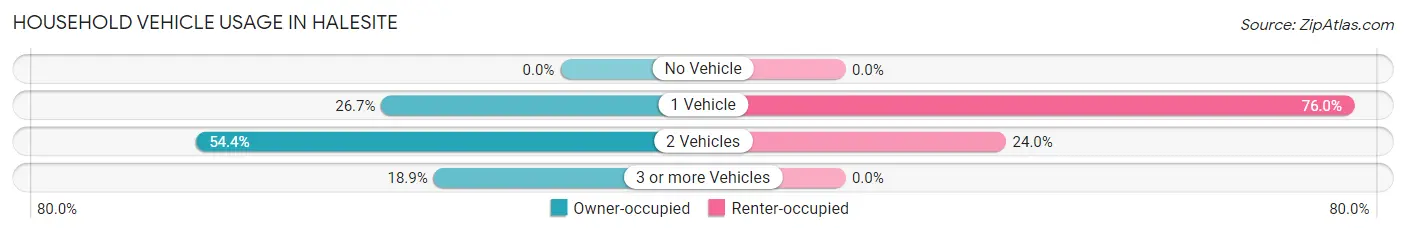
| Vehicles per Household | Owner-occupied | Renter-occupied |
| No Vehicle | 0 (0.0%) | 0 (0.0%) |
| 1 Vehicle | 233 (26.7%) | 95 (76.0%) |
| 2 Vehicles | 474 (54.4%) | 30 (24.0%) |
| 3 or more Vehicles | 165 (18.9%) | 0 (0.0%) |
| Total | 872 (100.0%) | 125 (100.0%) |
Real Estate & Mortgages in Halesite
Real Estate and Mortgage Overview in Halesite
| Characteristic | Without Mortgage | With Mortgage |
| Housing Units | 330 | 542 |
| Median Property Value | $687,100 | $822,900 |
| Median Household Income | $109,894 | $390 |
| Monthly Housing Costs | $1,501 | $466 |
| Real Estate Taxes | $10,001 | $0 |
Property Value by Mortgage Status in Halesite
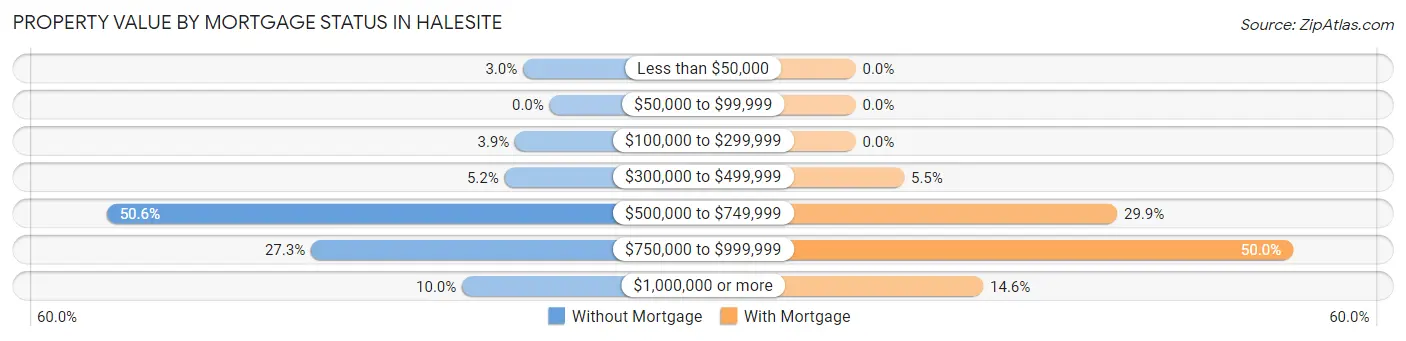
| Property Value | Without Mortgage | With Mortgage |
| Less than $50,000 | 10 (3.0%) | 0 (0.0%) |
| $50,000 to $99,999 | 0 (0.0%) | 0 (0.0%) |
| $100,000 to $299,999 | 13 (3.9%) | 0 (0.0%) |
| $300,000 to $499,999 | 17 (5.1%) | 30 (5.5%) |
| $500,000 to $749,999 | 167 (50.6%) | 162 (29.9%) |
| $750,000 to $999,999 | 90 (27.3%) | 271 (50.0%) |
| $1,000,000 or more | 33 (10.0%) | 79 (14.6%) |
| Total | 330 (100.0%) | 542 (100.0%) |
Household Income by Mortgage Status in Halesite
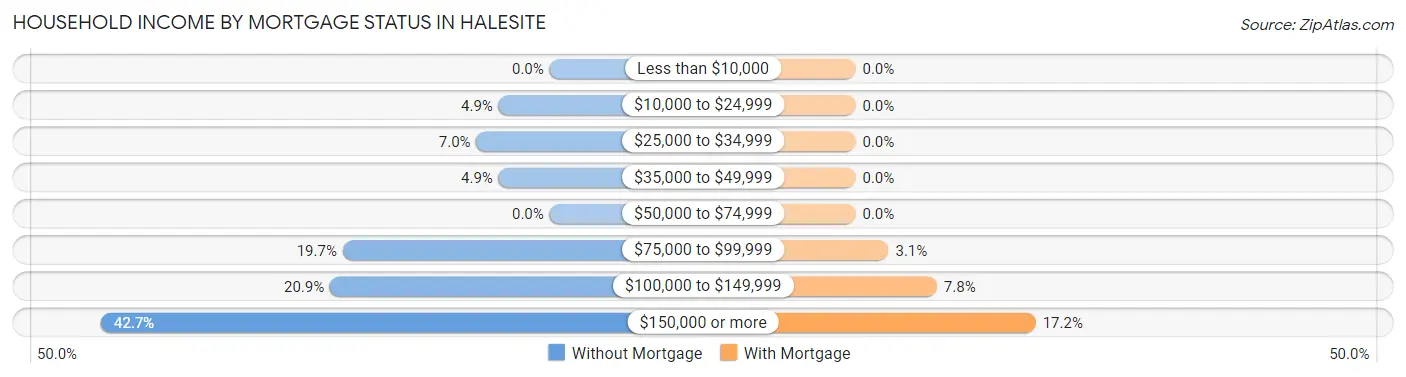
| Household Income | Without Mortgage | With Mortgage |
| Less than $10,000 | 0 (0.0%) | 0 (0.0%) |
| $10,000 to $24,999 | 16 (4.9%) | 0 (0.0%) |
| $25,000 to $34,999 | 23 (7.0%) | 0 (0.0%) |
| $35,000 to $49,999 | 16 (4.9%) | 0 (0.0%) |
| $50,000 to $74,999 | 0 (0.0%) | 0 (0.0%) |
| $75,000 to $99,999 | 65 (19.7%) | 17 (3.1%) |
| $100,000 to $149,999 | 69 (20.9%) | 42 (7.7%) |
| $150,000 or more | 141 (42.7%) | 93 (17.2%) |
| Total | 330 (100.0%) | 542 (100.0%) |
Property Value to Household Income Ratio in Halesite
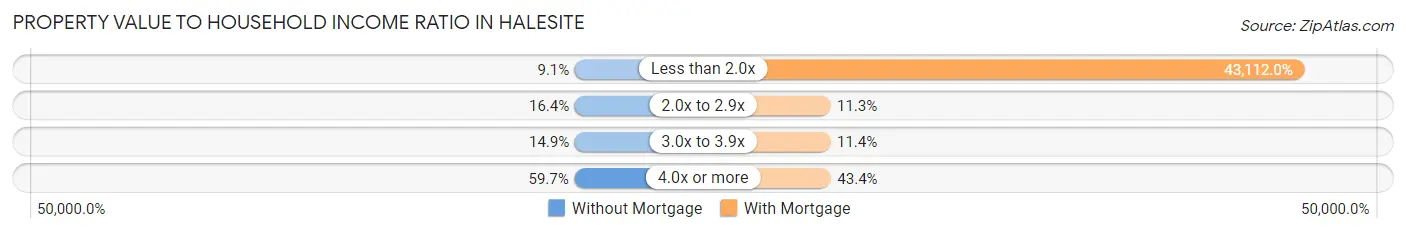
| Value-to-Income Ratio | Without Mortgage | With Mortgage |
| Less than 2.0x | 30 (9.1%) | 233,667 (43,112.0%) |
| 2.0x to 2.9x | 54 (16.4%) | 61 (11.3%) |
| 3.0x to 3.9x | 49 (14.8%) | 62 (11.4%) |
| 4.0x or more | 197 (59.7%) | 235 (43.4%) |
| Total | 330 (100.0%) | 542 (100.0%) |
Real Estate Taxes by Mortgage Status in Halesite
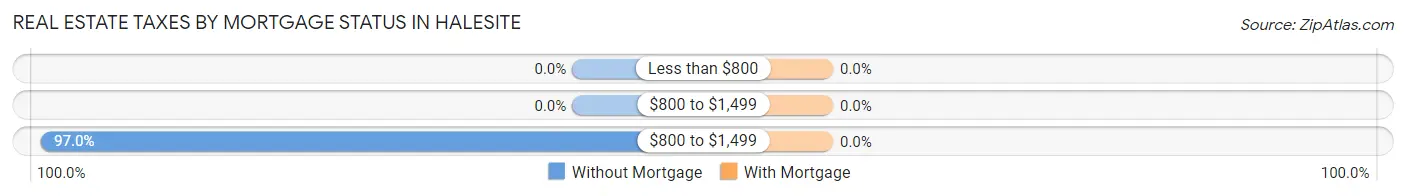
| Property Taxes | Without Mortgage | With Mortgage |
| Less than $800 | 0 (0.0%) | 0 (0.0%) |
| $800 to $1,499 | 0 (0.0%) | 0 (0.0%) |
| $800 to $1,499 | 320 (97.0%) | 0 (0.0%) |
| Total | 330 (100.0%) | 542 (100.0%) |
Health & Disability in Halesite
Health Insurance Coverage by Age in Halesite
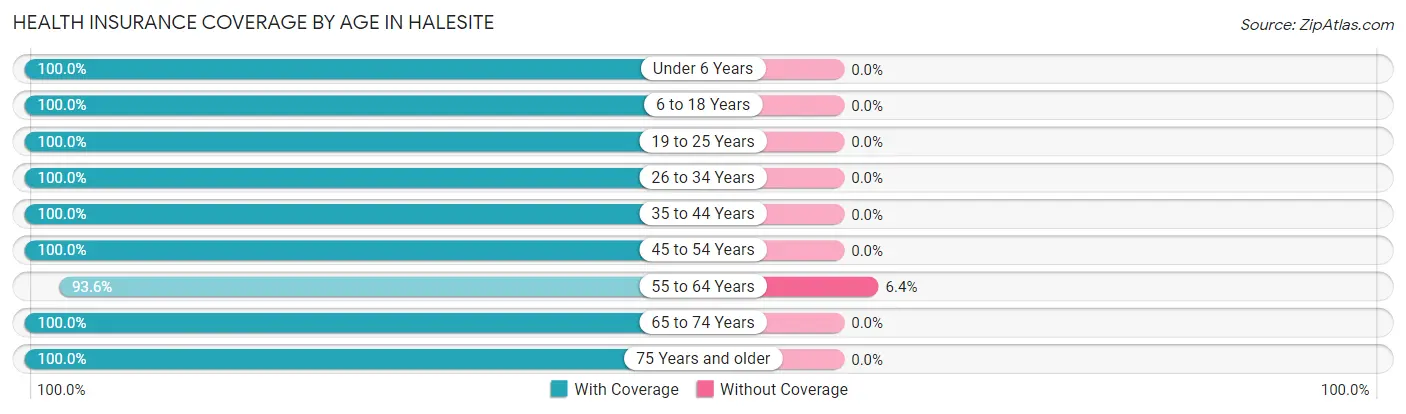
| Age Bracket | With Coverage | Without Coverage |
| Under 6 Years | 141 (100.0%) | 0 (0.0%) |
| 6 to 18 Years | 303 (100.0%) | 0 (0.0%) |
| 19 to 25 Years | 174 (100.0%) | 0 (0.0%) |
| 26 to 34 Years | 186 (100.0%) | 0 (0.0%) |
| 35 to 44 Years | 263 (100.0%) | 0 (0.0%) |
| 45 to 54 Years | 376 (100.0%) | 0 (0.0%) |
| 55 to 64 Years | 321 (93.6%) | 22 (6.4%) |
| 65 to 74 Years | 466 (100.0%) | 0 (0.0%) |
| 75 Years and older | 164 (100.0%) | 0 (0.0%) |
| Total | 2,394 (99.1%) | 22 (0.9%) |
Health Insurance Coverage by Citizenship Status in Halesite
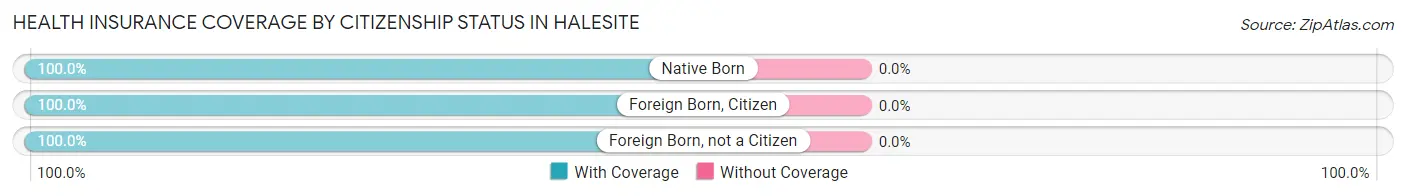
| Citizenship Status | With Coverage | Without Coverage |
| Native Born | 141 (100.0%) | 0 (0.0%) |
| Foreign Born, Citizen | 303 (100.0%) | 0 (0.0%) |
| Foreign Born, not a Citizen | 174 (100.0%) | 0 (0.0%) |
Health Insurance Coverage by Household Income in Halesite
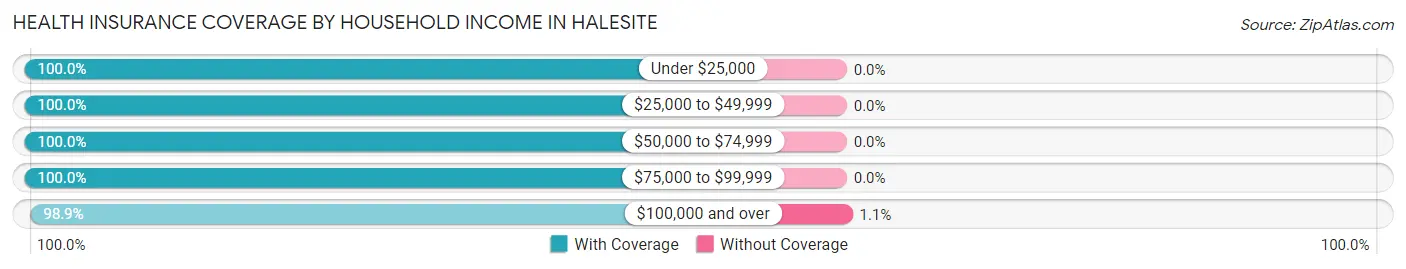
| Household Income | With Coverage | Without Coverage |
| Under $25,000 | 41 (100.0%) | 0 (0.0%) |
| $25,000 to $49,999 | 148 (100.0%) | 0 (0.0%) |
| $50,000 to $74,999 | 17 (100.0%) | 0 (0.0%) |
| $75,000 to $99,999 | 164 (100.0%) | 0 (0.0%) |
| $100,000 and over | 2,022 (98.9%) | 22 (1.1%) |
Public vs Private Health Insurance Coverage by Age in Halesite
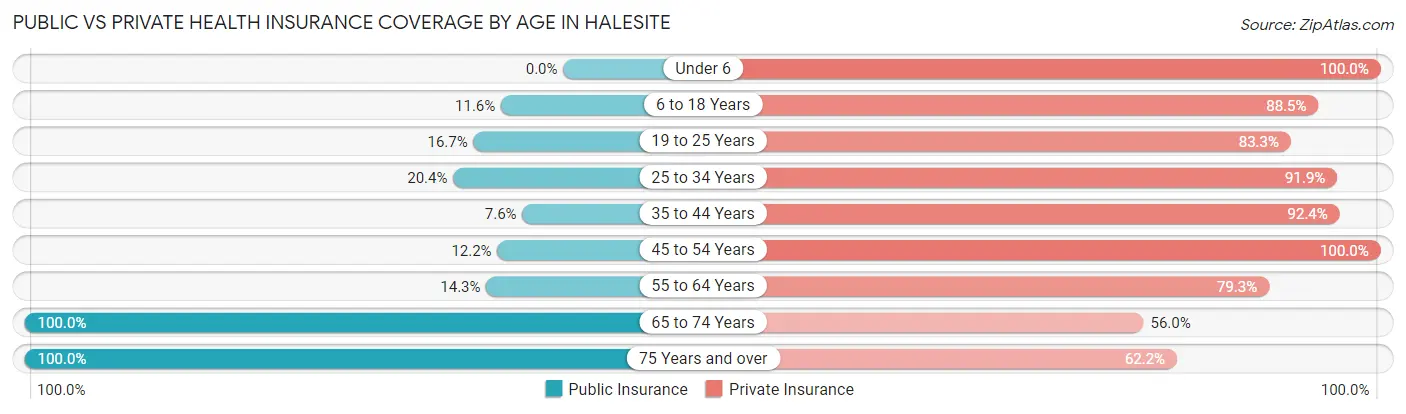
| Age Bracket | Public Insurance | Private Insurance |
| Under 6 | 0 (0.0%) | 141 (100.0%) |
| 6 to 18 Years | 35 (11.6%) | 268 (88.4%) |
| 19 to 25 Years | 29 (16.7%) | 145 (83.3%) |
| 25 to 34 Years | 38 (20.4%) | 171 (91.9%) |
| 35 to 44 Years | 20 (7.6%) | 243 (92.4%) |
| 45 to 54 Years | 46 (12.2%) | 376 (100.0%) |
| 55 to 64 Years | 49 (14.3%) | 272 (79.3%) |
| 65 to 74 Years | 466 (100.0%) | 261 (56.0%) |
| 75 Years and over | 164 (100.0%) | 102 (62.2%) |
| Total | 847 (35.1%) | 1,979 (81.9%) |
Disability Status by Sex by Age in Halesite
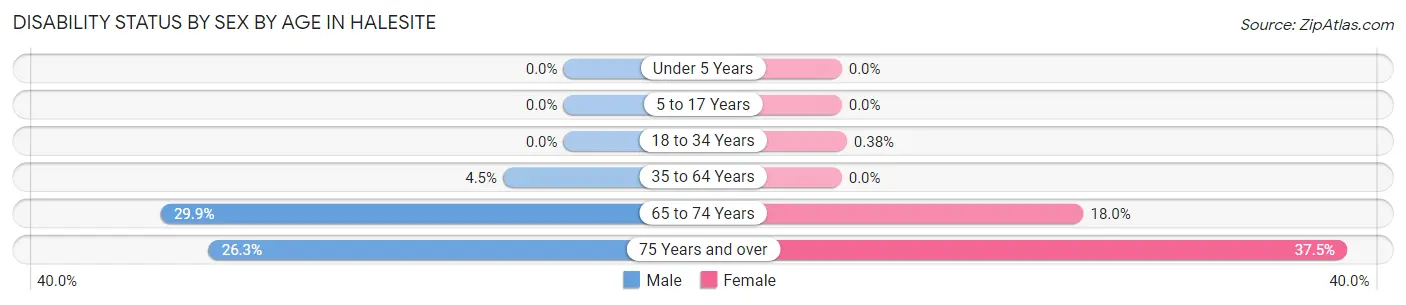
| Age Bracket | Male | Female |
| Under 5 Years | 0 (0.0%) | 0 (0.0%) |
| 5 to 17 Years | 0 (0.0%) | 0 (0.0%) |
| 18 to 34 Years | 0 (0.0%) | 1 (0.4%) |
| 35 to 64 Years | 21 (4.5%) | 0 (0.0%) |
| 65 to 74 Years | 46 (29.9%) | 56 (17.9%) |
| 75 Years and over | 20 (26.3%) | 33 (37.5%) |
Disability Class by Sex by Age in Halesite
Disability Class: Hearing Difficulty
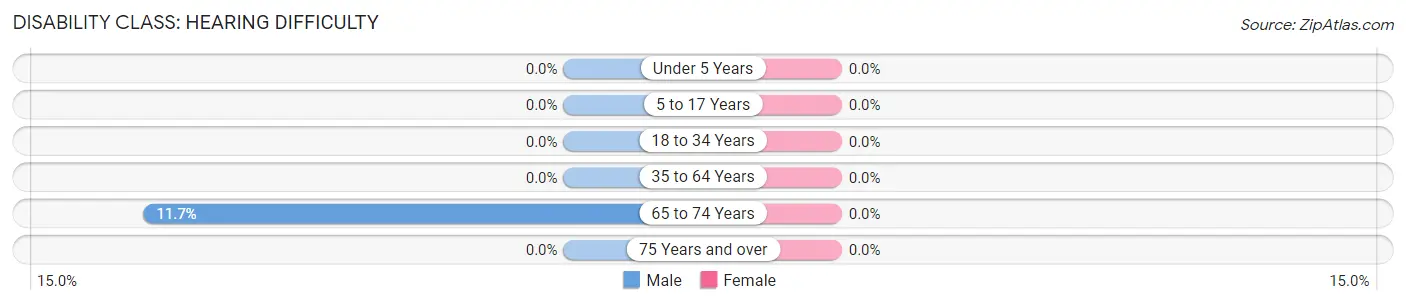
| Age Bracket | Male | Female |
| Under 5 Years | 0 (0.0%) | 0 (0.0%) |
| 5 to 17 Years | 0 (0.0%) | 0 (0.0%) |
| 18 to 34 Years | 0 (0.0%) | 0 (0.0%) |
| 35 to 64 Years | 0 (0.0%) | 0 (0.0%) |
| 65 to 74 Years | 18 (11.7%) | 0 (0.0%) |
| 75 Years and over | 0 (0.0%) | 0 (0.0%) |
Disability Class: Vision Difficulty
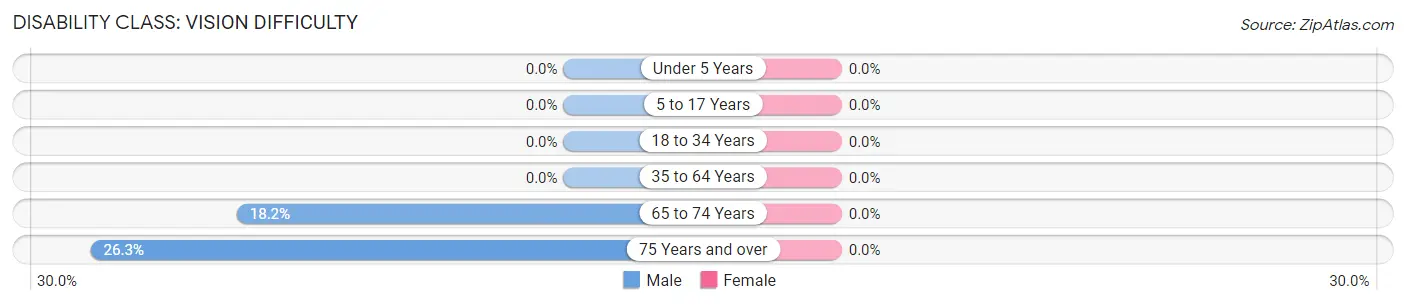
| Age Bracket | Male | Female |
| Under 5 Years | 0 (0.0%) | 0 (0.0%) |
| 5 to 17 Years | 0 (0.0%) | 0 (0.0%) |
| 18 to 34 Years | 0 (0.0%) | 0 (0.0%) |
| 35 to 64 Years | 0 (0.0%) | 0 (0.0%) |
| 65 to 74 Years | 28 (18.2%) | 0 (0.0%) |
| 75 Years and over | 20 (26.3%) | 0 (0.0%) |
Disability Class: Cognitive Difficulty
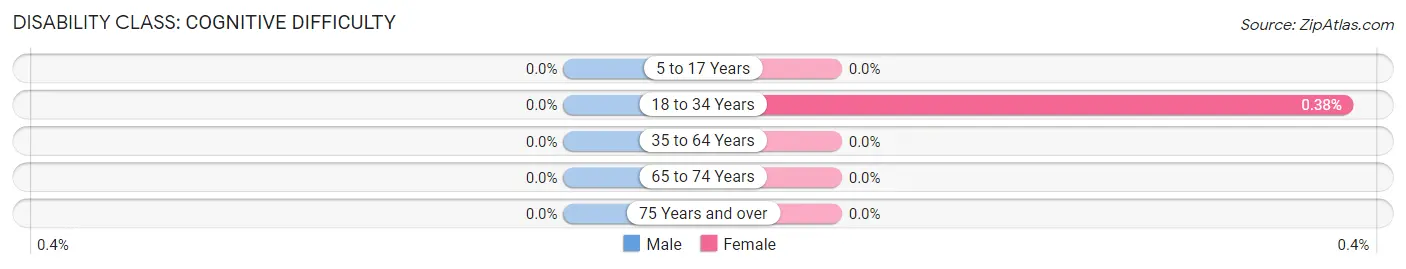
| Age Bracket | Male | Female |
| 5 to 17 Years | 0 (0.0%) | 0 (0.0%) |
| 18 to 34 Years | 0 (0.0%) | 1 (0.4%) |
| 35 to 64 Years | 0 (0.0%) | 0 (0.0%) |
| 65 to 74 Years | 0 (0.0%) | 0 (0.0%) |
| 75 Years and over | 0 (0.0%) | 0 (0.0%) |
Disability Class: Ambulatory Difficulty
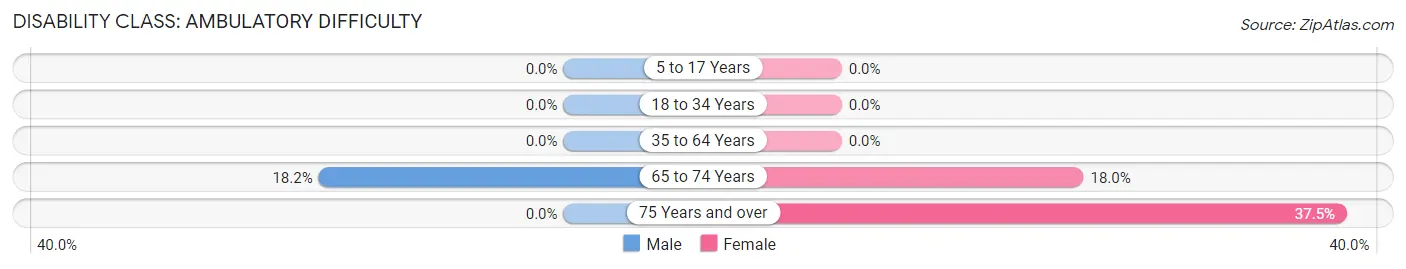
| Age Bracket | Male | Female |
| 5 to 17 Years | 0 (0.0%) | 0 (0.0%) |
| 18 to 34 Years | 0 (0.0%) | 0 (0.0%) |
| 35 to 64 Years | 0 (0.0%) | 0 (0.0%) |
| 65 to 74 Years | 28 (18.2%) | 56 (17.9%) |
| 75 Years and over | 0 (0.0%) | 33 (37.5%) |
Disability Class: Self-Care Difficulty
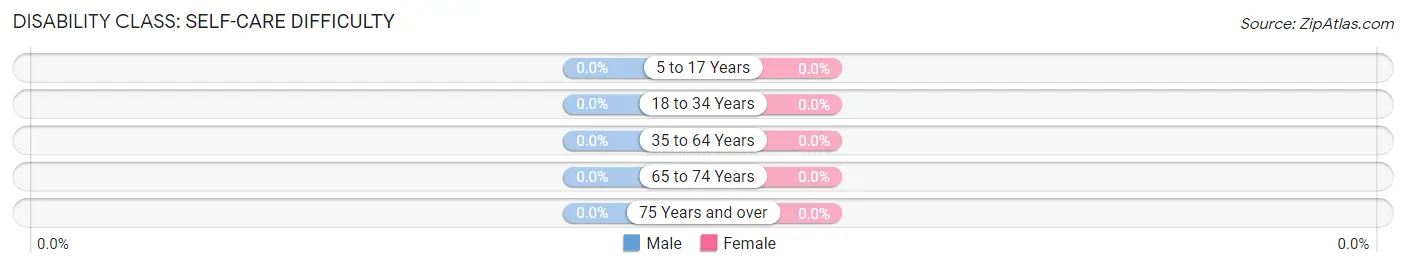
| Age Bracket | Male | Female |
| 5 to 17 Years | 0 (0.0%) | 0 (0.0%) |
| 18 to 34 Years | 0 (0.0%) | 0 (0.0%) |
| 35 to 64 Years | 0 (0.0%) | 0 (0.0%) |
| 65 to 74 Years | 0 (0.0%) | 0 (0.0%) |
| 75 Years and over | 0 (0.0%) | 0 (0.0%) |
Technology Access in Halesite
Computing Device Access in Halesite
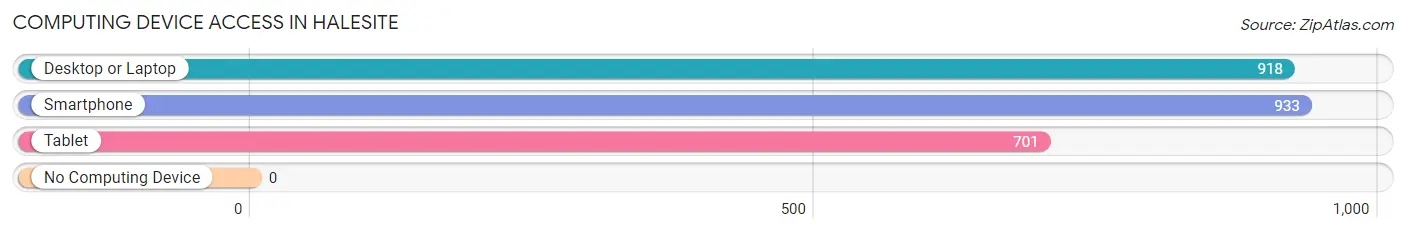
| Device Type | # Households | % Households |
| Desktop or Laptop | 918 | 92.1% |
| Smartphone | 933 | 93.6% |
| Tablet | 701 | 70.3% |
| No Computing Device | 0 | 0.0% |
| Total | 997 | 100.0% |
Internet Access in Halesite
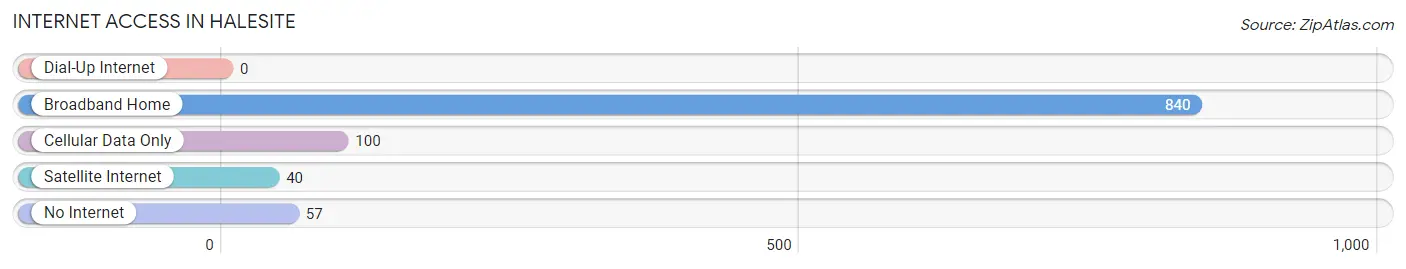
| Internet Type | # Households | % Households |
| Dial-Up Internet | 0 | 0.0% |
| Broadband Home | 840 | 84.3% |
| Cellular Data Only | 100 | 10.0% |
| Satellite Internet | 40 | 4.0% |
| No Internet | 57 | 5.7% |
| Total | 997 | 100.0% |
Halesite Summary
Halesite is a hamlet located in the Town of Huntington in Suffolk County, New York. It is situated on the north shore of Long Island, approximately 50 miles east of New York City. The hamlet is bordered by Huntington Bay to the north, Northport Bay to the east, and the Village of Huntington to the south.
History
Halesite was originally part of the Matinecock Native American tribe’s territory. The area was first settled by Europeans in the late 1600s, and the hamlet was officially established in 1790. The name “Halesite” is derived from the surname of the first settler, John Hale.
In the early 1800s, Halesite was a thriving agricultural community. The hamlet was home to several farms, as well as a grist mill, a saw mill, and a blacksmith shop. In the late 1800s, the hamlet began to transition from an agricultural to a residential community.
In the early 1900s, Halesite was a popular summer destination for wealthy New Yorkers. The hamlet was home to several large estates, including the estate of William K. Vanderbilt. The Vanderbilt estate was later converted into a golf course, which is now known as the Halesite Golf Club.
Geography
Halesite is located on the north shore of Long Island, approximately 50 miles east of New York City. The hamlet is bordered by Huntington Bay to the north, Northport Bay to the east, and the Village of Huntington to the south.
The hamlet is situated on a peninsula, with the Long Island Sound to the north and the Huntington Harbor to the south. The terrain is mostly flat, with some rolling hills. The area is heavily wooded, with a variety of trees, including oak, maple, and pine.
Economy
Halesite is primarily a residential community, with a small commercial district. The hamlet is home to several small businesses, including restaurants, shops, and professional services. The Halesite Golf Club is a popular destination for golfers, and the hamlet is also home to several marinas.
Demographics
As of the 2010 census, the population of Halesite was 2,845. The median household income was $90,945, and the median home value was $637,500. The population is predominantly white (90.2%), with small percentages of African American (3.2%), Asian (2.7%), and Hispanic (2.2%) residents.
Conclusion
Halesite is a small hamlet located on the north shore of Long Island, approximately 50 miles east of New York City. The hamlet was originally part of the Matinecock Native American tribe’s territory, and was first settled by Europeans in the late 1600s. Halesite is primarily a residential community, with a small commercial district. The population is predominantly white, with small percentages of African American, Asian, and Hispanic residents. The hamlet is home to several small businesses, as well as the Halesite Golf Club and several marinas.
Common Questions
What is Per Capita Income in Halesite?
Per Capita income in Halesite is $104,825.
What is the Median Family Income in Halesite?
Median Family Income in Halesite is $238,403.
What is the Median Household income in Halesite?
Median Household Income in Halesite is $177,917.
What is Income or Wage Gap in Halesite?
Income or Wage Gap in Halesite is 41.6%.
Women in Halesite earn 58.4 cents for every dollar earned by a man.
What is Inequality or Gini Index in Halesite?
Inequality or Gini Index in Halesite is 0.47.
What is the Total Population of Halesite?
Total Population of Halesite is 2,416.
What is the Total Male Population of Halesite?
Total Male Population of Halesite is 1,087.
What is the Total Female Population of Halesite?
Total Female Population of Halesite is 1,329.
What is the Ratio of Males per 100 Females in Halesite?
There are 81.79 Males per 100 Females in Halesite.
What is the Ratio of Females per 100 Males in Halesite?
There are 122.26 Females per 100 Males in Halesite.
What is the Median Population Age in Halesite?
Median Population Age in Halesite is 48.0 Years.
What is the Average Family Size in Halesite
Average Family Size in Halesite is 3.1 People.
What is the Average Household Size in Halesite
Average Household Size in Halesite is 2.4 People.
How Large is the Labor Force in Halesite?
There are 1,318 People in the Labor Forcein in Halesite.
What is the Percentage of People in the Labor Force in Halesite?
63.2% of People are in the Labor Force in Halesite.
What is the Unemployment Rate in Halesite?
Unemployment Rate in Halesite is 8.0%.