Fort Salonga, NY Map & Demographics
Fort Salonga Map
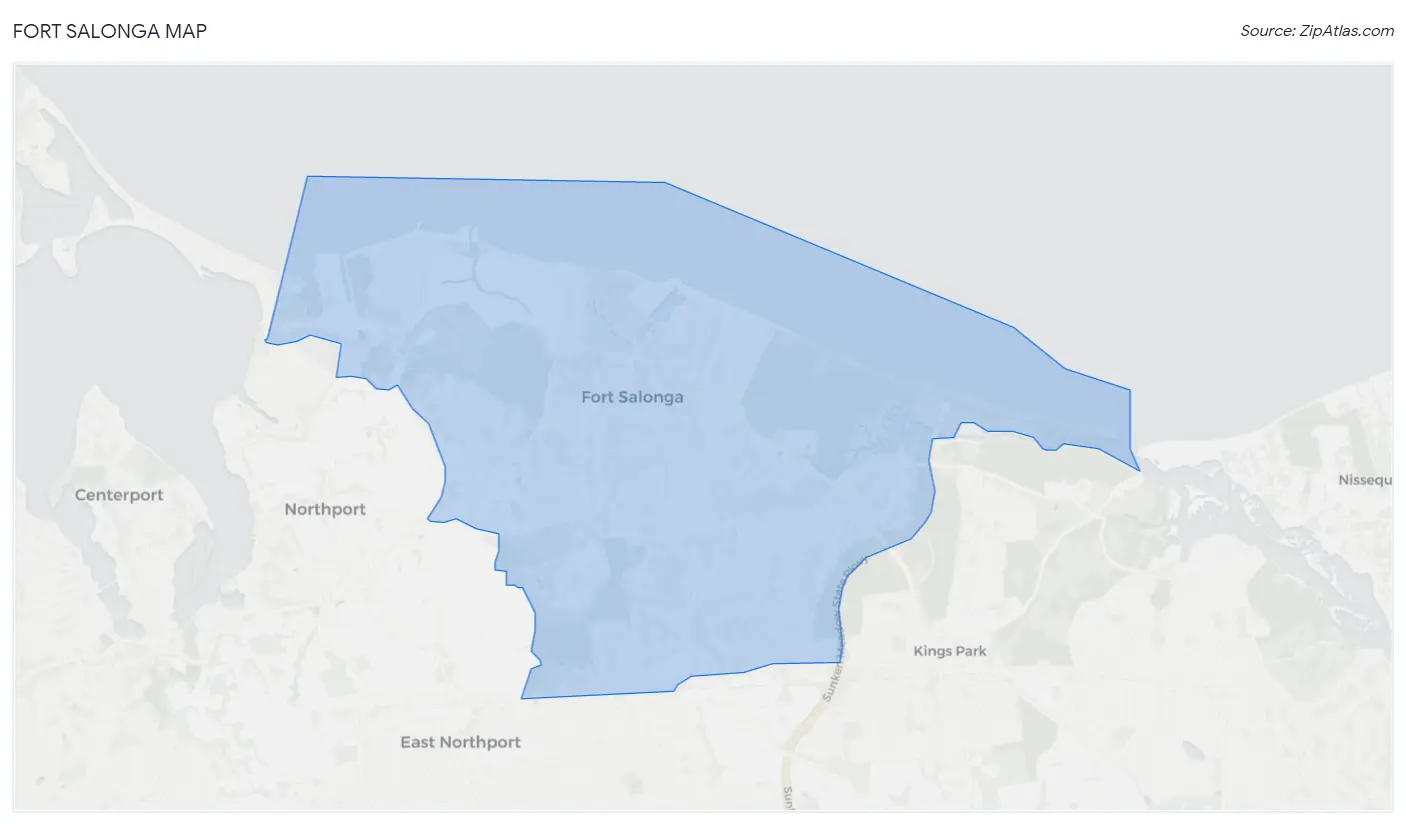
Fort Salonga Overview
$76,977
PER CAPITA INCOME
$200,114
AVG FAMILY INCOME
$179,568
AVG HOUSEHOLD INCOME
24.0%
WAGE / INCOME GAP [ % ]
76.0¢/ $1
WAGE / INCOME GAP [ $ ]
0.39
INEQUALITY / GINI INDEX
9,836
TOTAL POPULATION
5,007
MALE POPULATION
4,829
FEMALE POPULATION
103.69
MALES / 100 FEMALES
96.44
FEMALES / 100 MALES
48.0
MEDIAN AGE
3.3
AVG FAMILY SIZE
2.9
AVG HOUSEHOLD SIZE
5,194
LABOR FORCE [ PEOPLE ]
63.2%
PERCENT IN LABOR FORCE
5.6%
UNEMPLOYMENT RATE
Fort Salonga Area Codes
Income in Fort Salonga
Income Overview in Fort Salonga
Per Capita Income in Fort Salonga is $76,977, while median incomes of families and households are $200,114 and $179,568 respectively.
| Characteristic | Number | Measure |
| Per Capita Income | 9,836 | $76,977 |
| Median Family Income | 2,673 | $200,114 |
| Mean Family Income | 2,673 | $243,961 |
| Median Household Income | 3,359 | $179,568 |
| Mean Household Income | 3,359 | $220,599 |
| Income Deficit | 2,673 | $0 |
| Wage / Income Gap (%) | 9,836 | 23.97% |
| Wage / Income Gap ($) | 9,836 | 76.03¢ per $1 |
| Gini / Inequality Index | 9,836 | 0.39 |
Earnings by Sex in Fort Salonga
Average Earnings in Fort Salonga are $61,442, $71,774 for men and $54,571 for women, a difference of 24.0%.
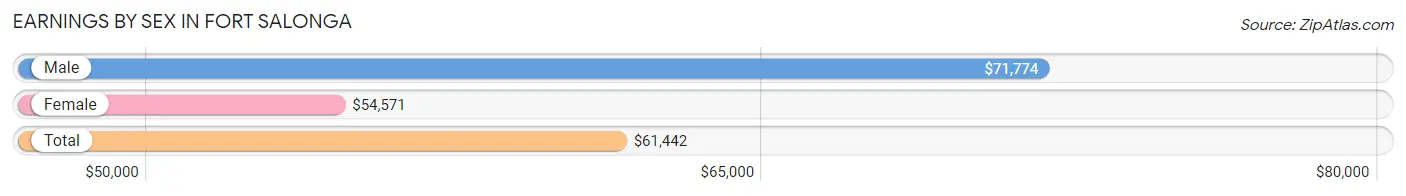
| Sex | Number | Average Earnings |
| Male | 3,138 (55.7%) | $71,774 |
| Female | 2,492 (44.3%) | $54,571 |
| Total | 5,630 (100.0%) | $61,442 |
Earnings by Sex by Income Bracket in Fort Salonga
The most common earnings brackets in Fort Salonga are $100,000+ for men (1,319 | 42.0%) and $100,000+ for women (754 | 30.3%).
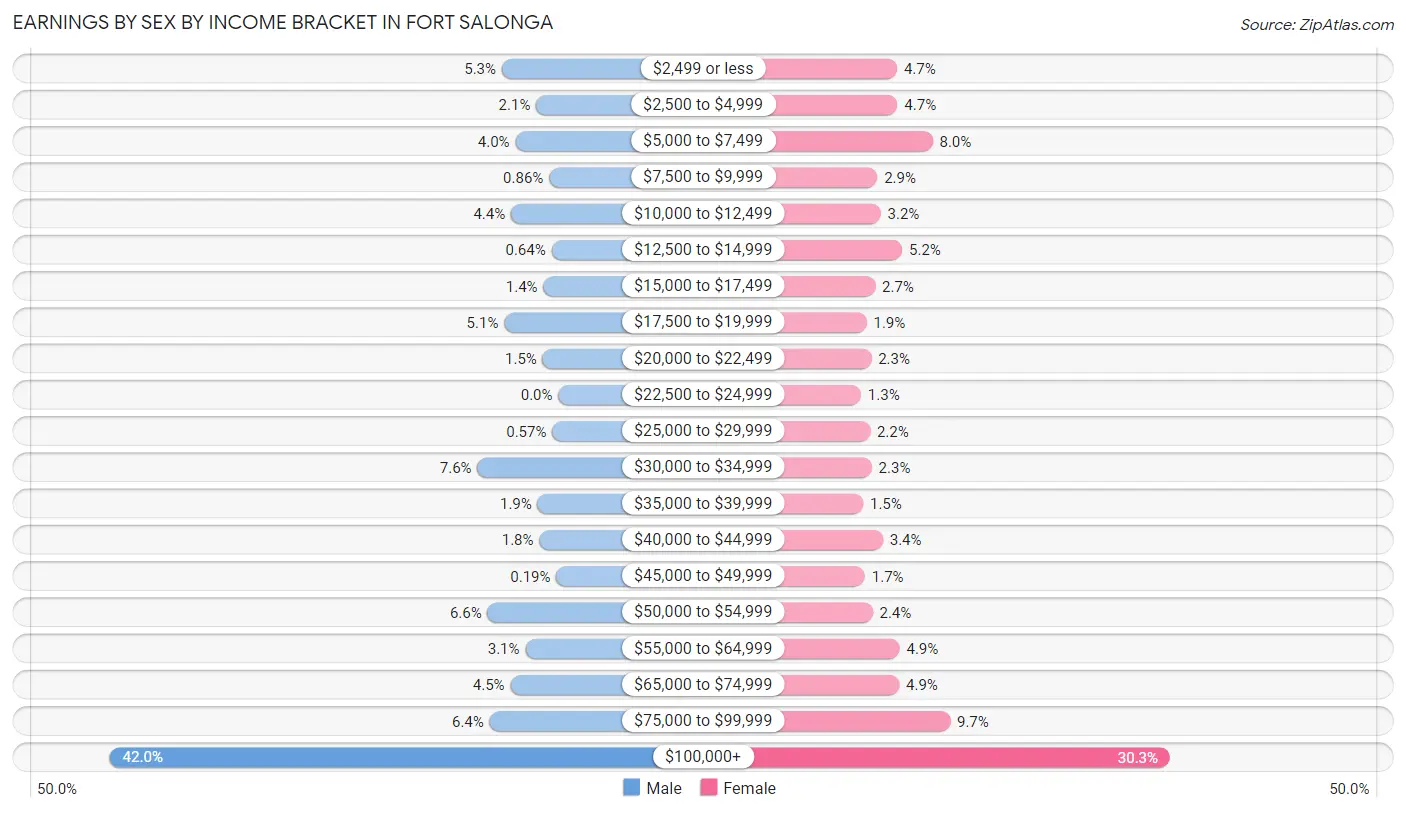
| Income | Male | Female |
| $2,499 or less | 166 (5.3%) | 117 (4.7%) |
| $2,500 to $4,999 | 65 (2.1%) | 118 (4.7%) |
| $5,000 to $7,499 | 126 (4.0%) | 200 (8.0%) |
| $7,500 to $9,999 | 27 (0.9%) | 71 (2.9%) |
| $10,000 to $12,499 | 139 (4.4%) | 79 (3.2%) |
| $12,500 to $14,999 | 20 (0.6%) | 129 (5.2%) |
| $15,000 to $17,499 | 44 (1.4%) | 66 (2.6%) |
| $17,500 to $19,999 | 159 (5.1%) | 46 (1.8%) |
| $20,000 to $22,499 | 46 (1.5%) | 57 (2.3%) |
| $22,500 to $24,999 | 0 (0.0%) | 33 (1.3%) |
| $25,000 to $29,999 | 18 (0.6%) | 54 (2.2%) |
| $30,000 to $34,999 | 238 (7.6%) | 58 (2.3%) |
| $35,000 to $39,999 | 61 (1.9%) | 38 (1.5%) |
| $40,000 to $44,999 | 56 (1.8%) | 84 (3.4%) |
| $45,000 to $49,999 | 6 (0.2%) | 42 (1.7%) |
| $50,000 to $54,999 | 208 (6.6%) | 60 (2.4%) |
| $55,000 to $64,999 | 97 (3.1%) | 123 (4.9%) |
| $65,000 to $74,999 | 141 (4.5%) | 122 (4.9%) |
| $75,000 to $99,999 | 202 (6.4%) | 241 (9.7%) |
| $100,000+ | 1,319 (42.0%) | 754 (30.3%) |
| Total | 3,138 (100.0%) | 2,492 (100.0%) |
Earnings by Sex by Educational Attainment in Fort Salonga
Average earnings in Fort Salonga are $108,009 for men and $70,450 for women, a difference of 34.8%. Men with an educational attainment of graduate degree enjoy the highest average annual earnings of $190,489, while those with college or associate's degree education earn the least with $51,315. Women with an educational attainment of graduate degree earn the most with the average annual earnings of $108,400, while those with high school diploma education have the smallest earnings of $14,679.
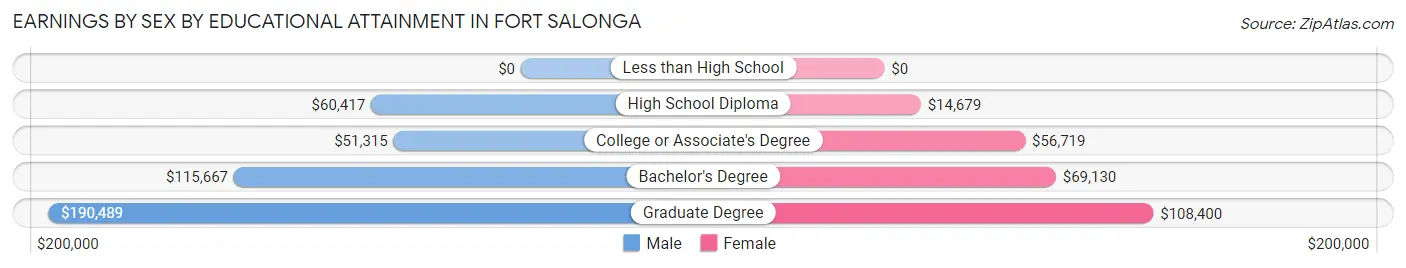
| Educational Attainment | Male Income | Female Income |
| Less than High School | - | - |
| High School Diploma | $60,417 | $14,679 |
| College or Associate's Degree | $51,315 | $56,719 |
| Bachelor's Degree | $115,667 | $69,130 |
| Graduate Degree | $190,489 | $108,400 |
| Total | $108,009 | $70,450 |
Family Income in Fort Salonga
Family Income Brackets in Fort Salonga
According to the Fort Salonga family income data, there are 1,336 families falling into the $200,000+ income range, which is the most common income bracket and makes up 50.0% of all families.
| Income Bracket | # Families | % Families |
| Less than $10,000 | 0 | 0.0% |
| $10,000 to $14,999 | 11 | 0.4% |
| $15,000 to $24,999 | 29 | 1.1% |
| $25,000 to $34,999 | 13 | 0.5% |
| $35,000 to $49,999 | 48 | 1.8% |
| $50,000 to $74,999 | 144 | 5.4% |
| $75,000 to $99,999 | 203 | 7.6% |
| $100,000 to $149,999 | 388 | 14.5% |
| $150,000 to $199,999 | 505 | 18.9% |
| $200,000+ | 1,336 | 50.0% |
Family Income by Famaliy Size in Fort Salonga
5-person families (183 | 6.9%) account for the highest median family income in Fort Salonga with $250,001 per family, while 2-person families (1,170 | 43.8%) have the highest median income of $80,798 per family member.
| Income Bracket | # Families | Median Income |
| 2-Person Families | 1,170 (43.8%) | $161,597 |
| 3-Person Families | 592 (22.2%) | $223,208 |
| 4-Person Families | 617 (23.1%) | $216,964 |
| 5-Person Families | 183 (6.9%) | $250,001 |
| 6-Person Families | 90 (3.4%) | $0 |
| 7+ Person Families | 21 (0.8%) | $250,001 |
| Total | 2,673 (100.0%) | $200,114 |
Family Income by Number of Earners in Fort Salonga
The median family income in Fort Salonga is $200,114, with families comprising 3+ earners (463) having the highest median family income of $223,942, while families with no earners (348) have the lowest median family income of $130,786, accounting for 17.3% and 13.0% of families, respectively.
| Number of Earners | # Families | Median Income |
| No Earners | 348 (13.0%) | $130,786 |
| 1 Earner | 692 (25.9%) | $139,375 |
| 2 Earners | 1,170 (43.8%) | $223,750 |
| 3+ Earners | 463 (17.3%) | $223,942 |
| Total | 2,673 (100.0%) | $200,114 |
Household Income in Fort Salonga
Household Income Brackets in Fort Salonga
With 1,424 households falling in the category, the $200,000+ income range is the most frequent in Fort Salonga, accounting for 42.4% of all households. In contrast, only 13 households (0.4%) fall into the less than $10,000 income bracket, making it the least populous group.
| Income Bracket | # Households | % Households |
| Less than $10,000 | 13 | 0.4% |
| $10,000 to $14,999 | 34 | 1.0% |
| $15,000 to $24,999 | 24 | 0.7% |
| $25,000 to $34,999 | 40 | 1.2% |
| $35,000 to $49,999 | 107 | 3.2% |
| $50,000 to $74,999 | 312 | 9.3% |
| $75,000 to $99,999 | 238 | 7.1% |
| $100,000 to $149,999 | 447 | 13.3% |
| $150,000 to $199,999 | 722 | 21.5% |
| $200,000+ | 1,424 | 42.4% |
Household Income by Householder Age in Fort Salonga
The median household income in Fort Salonga is $179,568, with the highest median household income of $215,898 found in the 45 to 64 years age bracket for the primary householder. A total of 1,731 households (51.5%) fall into this category.
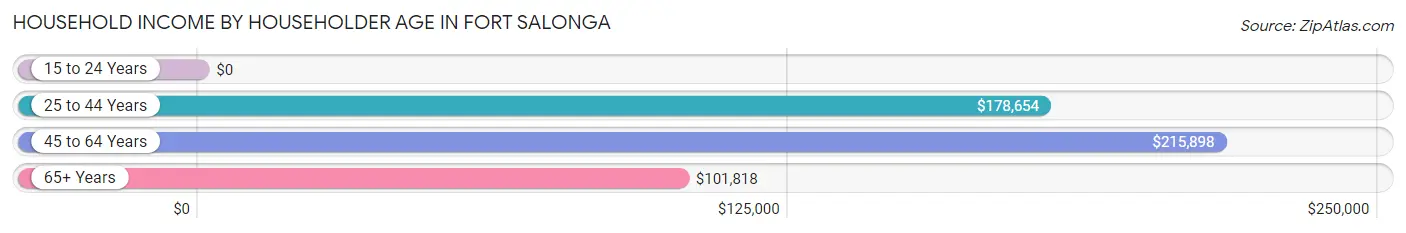
| Income Bracket | # Households | Median Income |
| 15 to 24 Years | 0 (0.0%) | $0 |
| 25 to 44 Years | 572 (17.0%) | $178,654 |
| 45 to 64 Years | 1,731 (51.5%) | $215,898 |
| 65+ Years | 1,056 (31.4%) | $101,818 |
| Total | 3,359 (100.0%) | $179,568 |
Poverty in Fort Salonga
Income Below Poverty by Sex and Age in Fort Salonga
With 1.5% poverty level for males and 3.0% for females among the residents of Fort Salonga, 5 year old males and 35 to 44 year old females are the most vulnerable to poverty, with 17 males (100.0%) and 52 females (11.5%) in their respective age groups living below the poverty level.
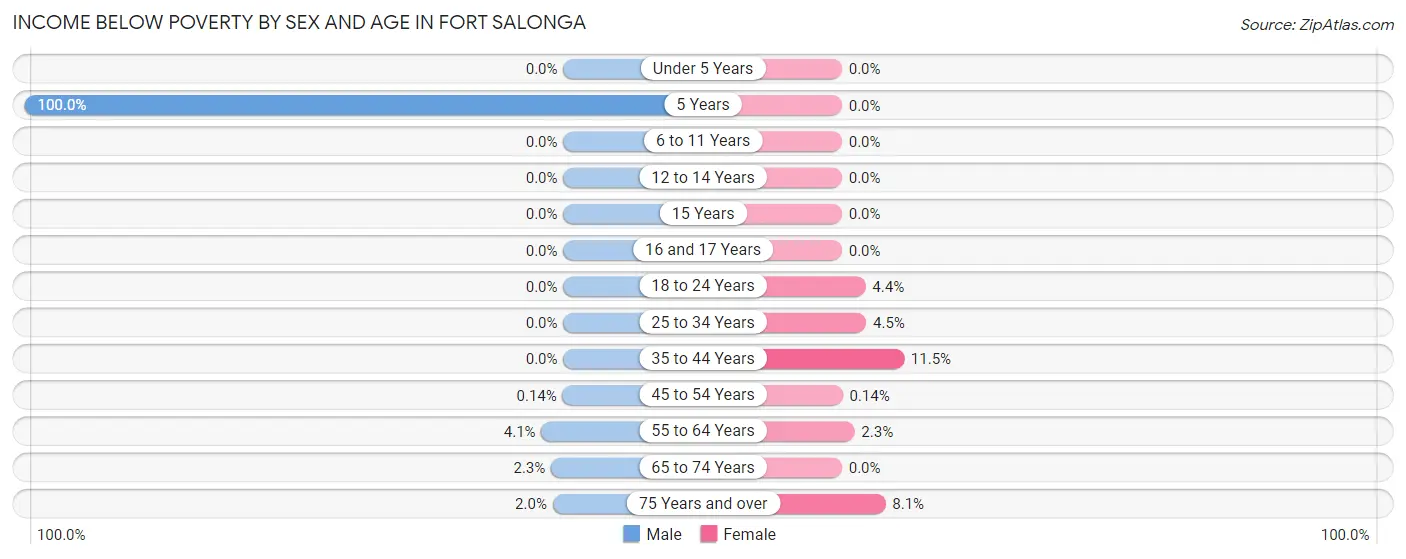
| Age Bracket | Male | Female |
| Under 5 Years | 0 (0.0%) | 0 (0.0%) |
| 5 Years | 17 (100.0%) | 0 (0.0%) |
| 6 to 11 Years | 0 (0.0%) | 0 (0.0%) |
| 12 to 14 Years | 0 (0.0%) | 0 (0.0%) |
| 15 Years | 0 (0.0%) | 0 (0.0%) |
| 16 and 17 Years | 0 (0.0%) | 0 (0.0%) |
| 18 to 24 Years | 0 (0.0%) | 14 (4.4%) |
| 25 to 34 Years | 0 (0.0%) | 19 (4.5%) |
| 35 to 44 Years | 0 (0.0%) | 52 (11.5%) |
| 45 to 54 Years | 1 (0.1%) | 1 (0.1%) |
| 55 to 64 Years | 31 (4.1%) | 22 (2.3%) |
| 65 to 74 Years | 12 (2.3%) | 0 (0.0%) |
| 75 Years and over | 10 (2.0%) | 33 (8.1%) |
| Total | 71 (1.5%) | 141 (3.0%) |
Income Above Poverty by Sex and Age in Fort Salonga
According to the poverty statistics in Fort Salonga, males aged under 5 years and females aged under 5 years are the age groups that are most secure financially, with 100.0% of males and 100.0% of females in these age groups living above the poverty line.
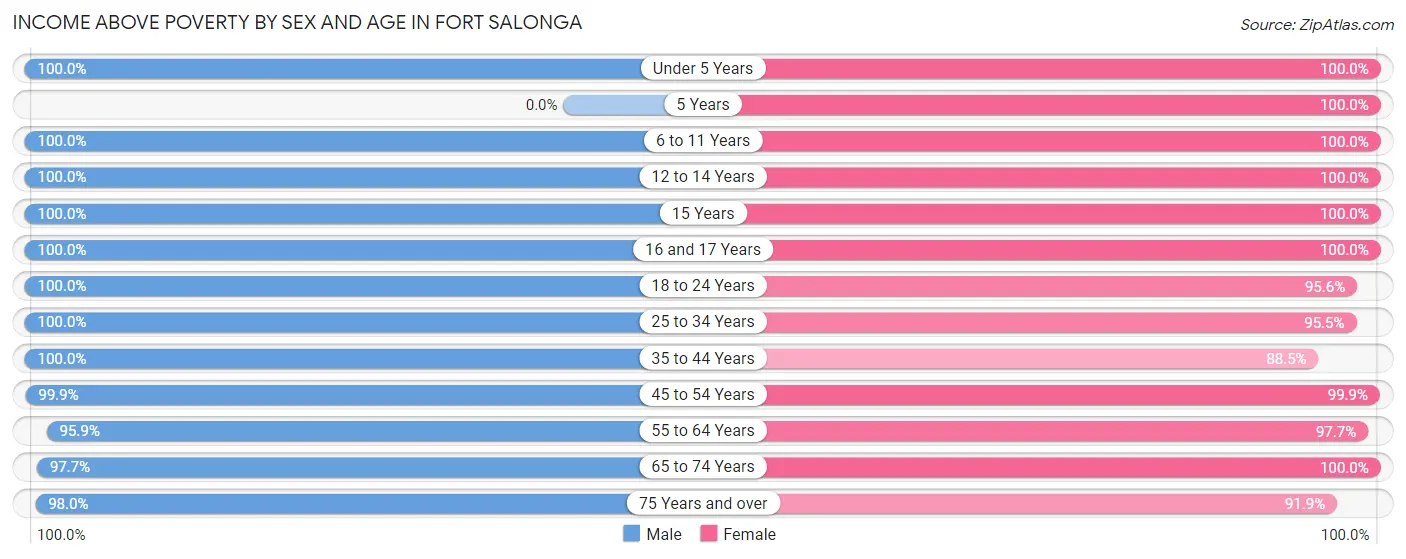
| Age Bracket | Male | Female |
| Under 5 Years | 210 (100.0%) | 250 (100.0%) |
| 5 Years | 0 (0.0%) | 3 (100.0%) |
| 6 to 11 Years | 246 (100.0%) | 356 (100.0%) |
| 12 to 14 Years | 121 (100.0%) | 248 (100.0%) |
| 15 Years | 112 (100.0%) | 17 (100.0%) |
| 16 and 17 Years | 217 (100.0%) | 199 (100.0%) |
| 18 to 24 Years | 611 (100.0%) | 306 (95.6%) |
| 25 to 34 Years | 396 (100.0%) | 402 (95.5%) |
| 35 to 44 Years | 466 (100.0%) | 399 (88.5%) |
| 45 to 54 Years | 710 (99.9%) | 698 (99.9%) |
| 55 to 64 Years | 731 (95.9%) | 920 (97.7%) |
| 65 to 74 Years | 517 (97.7%) | 447 (100.0%) |
| 75 Years and over | 498 (98.0%) | 375 (91.9%) |
| Total | 4,835 (98.6%) | 4,620 (97.0%) |
Income Below Poverty Among Married-Couple Families in Fort Salonga
The poverty statistics for married-couple families in Fort Salonga show that 0.8% or 20 of the total 2,395 families live below the poverty line. Families with no children have the highest poverty rate of 1.5%, comprising of 20 families. On the other hand, families with 1 or 2 children have the lowest poverty rate of 0.0%, which includes 0 families.
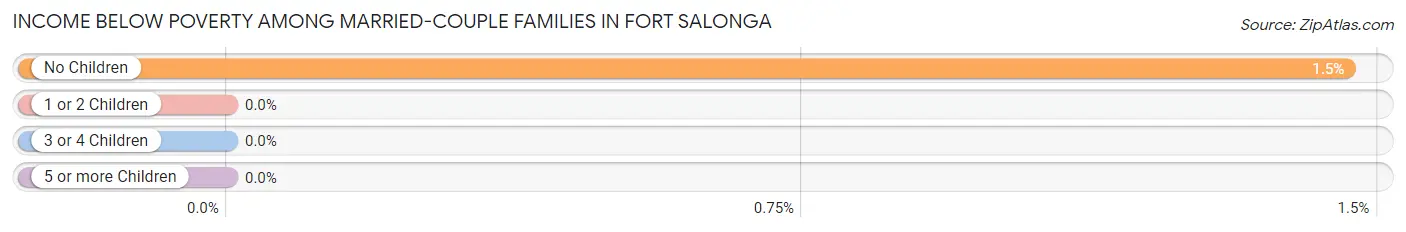
| Children | Above Poverty | Below Poverty |
| No Children | 1,350 (98.5%) | 20 (1.5%) |
| 1 or 2 Children | 896 (100.0%) | 0 (0.0%) |
| 3 or 4 Children | 129 (100.0%) | 0 (0.0%) |
| 5 or more Children | 0 (0.0%) | 0 (0.0%) |
| Total | 2,375 (99.2%) | 20 (0.8%) |
Income Below Poverty Among Single-Parent Households in Fort Salonga
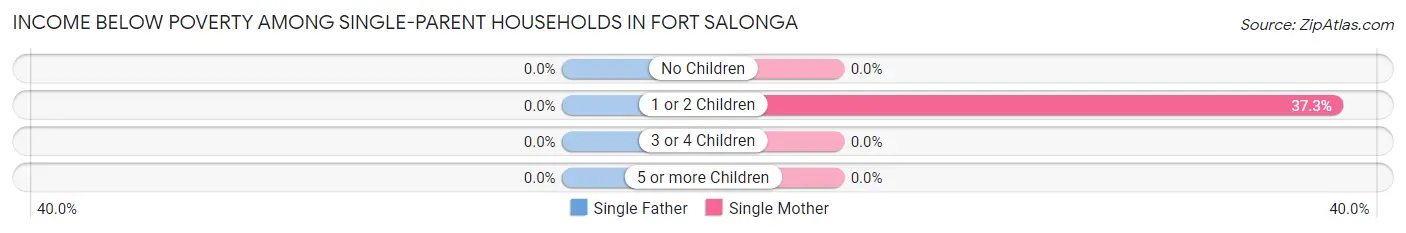
| Children | Single Father | Single Mother |
| No Children | 0 (0.0%) | 0 (0.0%) |
| 1 or 2 Children | 0 (0.0%) | 19 (37.2%) |
| 3 or 4 Children | 0 (0.0%) | 0 (0.0%) |
| 5 or more Children | 0 (0.0%) | 0 (0.0%) |
| Total | 0 (0.0%) | 19 (7.7%) |
Income Below Poverty Among Married-Couple vs Single-Parent Households in Fort Salonga
The poverty data for Fort Salonga shows that 20 of the married-couple family households (0.8%) and 19 of the single-parent households (6.8%) are living below the poverty level. Within the married-couple family households, those with no children have the highest poverty rate, with 20 households (1.5%) falling below the poverty line. Among the single-parent households, those with 1 or 2 children have the highest poverty rate, with 19 household (27.9%) living below poverty.
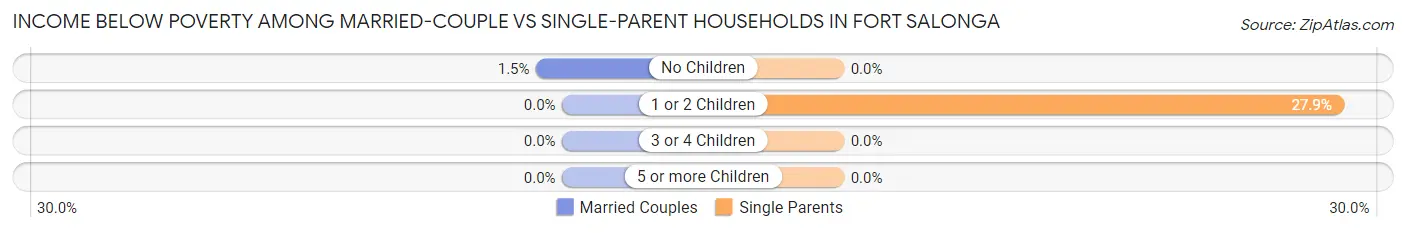
| Children | Married-Couple Families | Single-Parent Households |
| No Children | 20 (1.5%) | 0 (0.0%) |
| 1 or 2 Children | 0 (0.0%) | 19 (27.9%) |
| 3 or 4 Children | 0 (0.0%) | 0 (0.0%) |
| 5 or more Children | 0 (0.0%) | 0 (0.0%) |
| Total | 20 (0.8%) | 19 (6.8%) |
Race in Fort Salonga
The most populous races in Fort Salonga are White / Caucasian (8,992 | 91.4%), Hispanic or Latino (702 | 7.1%), and Two or more Races (567 | 5.8%).
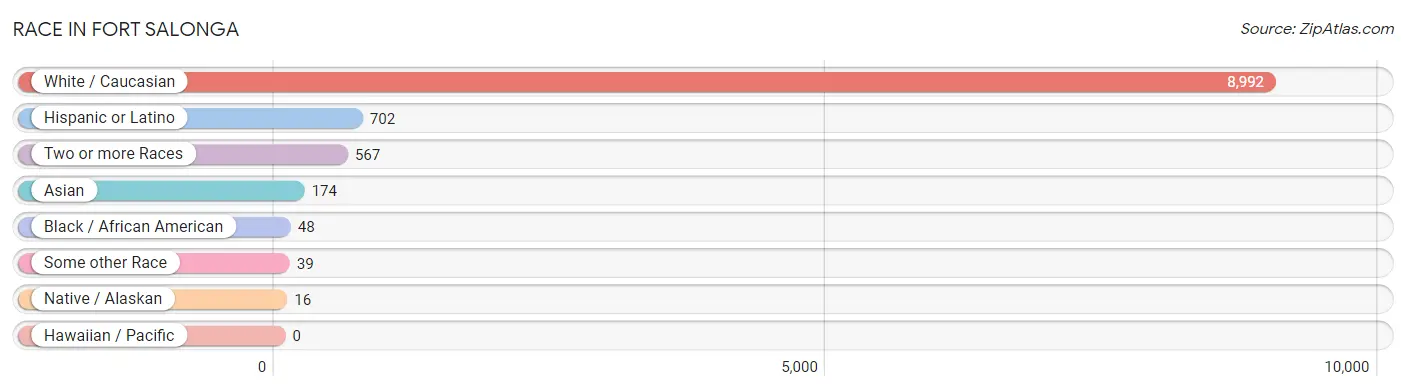
| Race | # Population | % Population |
| Asian | 174 | 1.8% |
| Black / African American | 48 | 0.5% |
| Hawaiian / Pacific | 0 | 0.0% |
| Hispanic or Latino | 702 | 7.1% |
| Native / Alaskan | 16 | 0.2% |
| White / Caucasian | 8,992 | 91.4% |
| Two or more Races | 567 | 5.8% |
| Some other Race | 39 | 0.4% |
| Total | 9,836 | 100.0% |
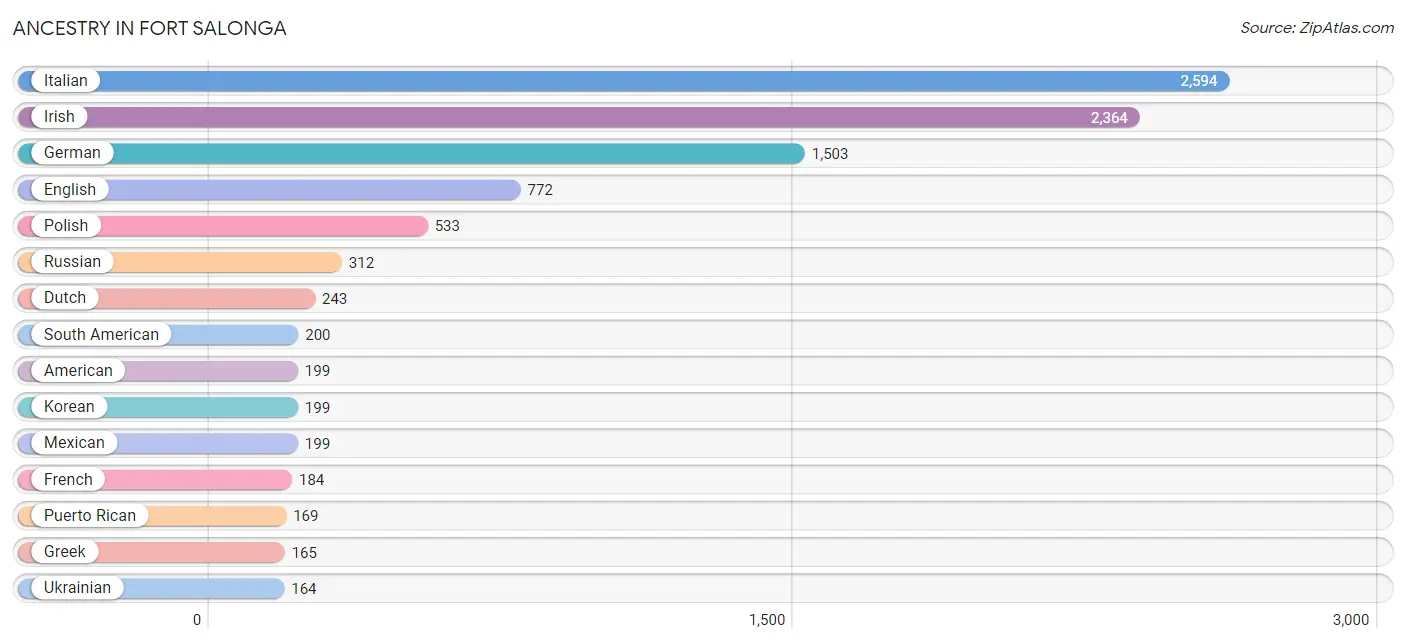
Ancestry in Fort Salonga
The most populous ancestries reported in Fort Salonga are Italian (2,594 | 26.4%), Irish (2,364 | 24.0%), German (1,503 | 15.3%), English (772 | 7.9%), and Polish (533 | 5.4%), together accounting for 79.0% of all Fort Salonga residents.
| Ancestry | # Population | % Population |
| American | 199 | 2.0% |
| Arab | 48 | 0.5% |
| Austrian | 100 | 1.0% |
| Bhutanese | 36 | 0.4% |
| Bolivian | 25 | 0.3% |
| British | 32 | 0.3% |
| British West Indian | 9 | 0.1% |
| Burmese | 43 | 0.4% |
| Canadian | 30 | 0.3% |
| Central American | 42 | 0.4% |
| Colombian | 55 | 0.6% |
| Croatian | 27 | 0.3% |
| Cuban | 92 | 0.9% |
| Czech | 35 | 0.4% |
| Danish | 63 | 0.6% |
| Dutch | 243 | 2.5% |
| Eastern European | 53 | 0.5% |
| Ecuadorian | 76 | 0.8% |
| English | 772 | 7.9% |
| European | 105 | 1.1% |
| French | 184 | 1.9% |
| German | 1,503 | 15.3% |
| Greek | 165 | 1.7% |
| Guatemalan | 21 | 0.2% |
| Haitian | 99 | 1.0% |
| Hungarian | 70 | 0.7% |
| Indian (Asian) | 82 | 0.8% |
| Iranian | 21 | 0.2% |
| Irish | 2,364 | 24.0% |
| Italian | 2,594 | 26.4% |
| Korean | 199 | 2.0% |
| Lithuanian | 54 | 0.5% |
| Malaysian | 31 | 0.3% |
| Maltese | 11 | 0.1% |
| Mexican | 199 | 2.0% |
| Moroccan | 48 | 0.5% |
| Northern European | 74 | 0.7% |
| Norwegian | 88 | 0.9% |
| Peruvian | 44 | 0.4% |
| Polish | 533 | 5.4% |
| Puerto Rican | 169 | 1.7% |
| Romanian | 26 | 0.3% |
| Russian | 312 | 3.2% |
| Salvadoran | 21 | 0.2% |
| Scandinavian | 25 | 0.3% |
| Scotch-Irish | 100 | 1.0% |
| Scottish | 70 | 0.7% |
| Slavic | 24 | 0.2% |
| Slovak | 9 | 0.1% |
| Slovene | 17 | 0.2% |
| South American | 200 | 2.0% |
| Swedish | 105 | 1.1% |
| Swiss | 32 | 0.3% |
| Thai | 42 | 0.4% |
| Ukrainian | 164 | 1.7% | View All 55 Rows |
Immigrants in Fort Salonga
The most numerous immigrant groups reported in Fort Salonga came from Europe (290 | 2.9%), Eastern Europe (158 | 1.6%), Asia (146 | 1.5%), Latin America (88 | 0.9%), and Western Europe (88 | 0.9%), together accounting for 7.8% of all Fort Salonga residents.
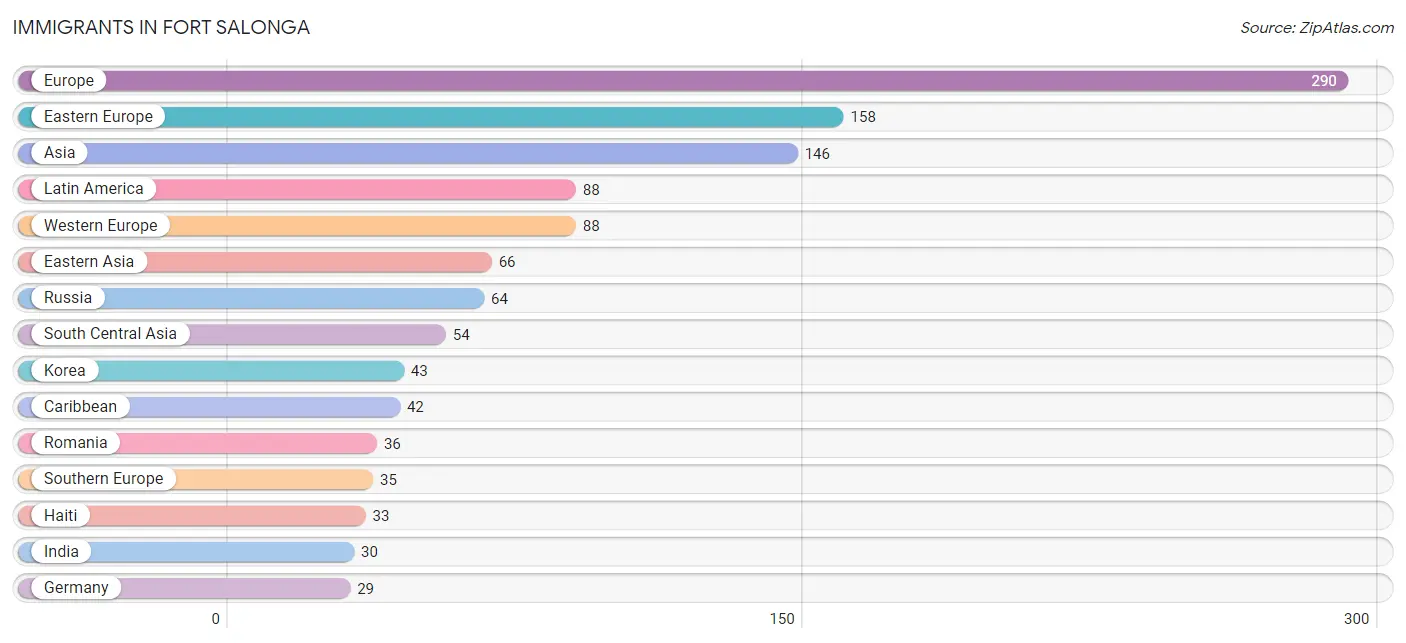
| Immigration Origin | # Population | % Population |
| Asia | 146 | 1.5% |
| Austria | 14 | 0.1% |
| Canada | 6 | 0.1% |
| Caribbean | 42 | 0.4% |
| Central America | 21 | 0.2% |
| China | 14 | 0.1% |
| Colombia | 5 | 0.1% |
| Eastern Asia | 66 | 0.7% |
| Eastern Europe | 158 | 1.6% |
| Ecuador | 20 | 0.2% |
| El Salvador | 21 | 0.2% |
| Europe | 290 | 2.9% |
| France | 28 | 0.3% |
| Germany | 29 | 0.3% |
| Greece | 12 | 0.1% |
| Haiti | 33 | 0.3% |
| India | 30 | 0.3% |
| Iran | 8 | 0.1% |
| Italy | 23 | 0.2% |
| Japan | 9 | 0.1% |
| Korea | 43 | 0.4% |
| Laos | 11 | 0.1% |
| Latin America | 88 | 0.9% |
| Lebanon | 15 | 0.2% |
| Netherlands | 17 | 0.2% |
| Northern Europe | 9 | 0.1% |
| Pakistan | 16 | 0.2% |
| Romania | 36 | 0.4% |
| Russia | 64 | 0.6% |
| Serbia | 26 | 0.3% |
| South America | 25 | 0.3% |
| South Central Asia | 54 | 0.5% |
| South Eastern Asia | 11 | 0.1% |
| Southern Europe | 35 | 0.4% |
| Western Asia | 15 | 0.2% |
| Western Europe | 88 | 0.9% | View All 36 Rows |
Sex and Age in Fort Salonga
Sex and Age in Fort Salonga
The most populous age groups in Fort Salonga are 15 to 19 Years (530 | 10.6%) for men and 55 to 59 Years (575 | 11.9%) for women.
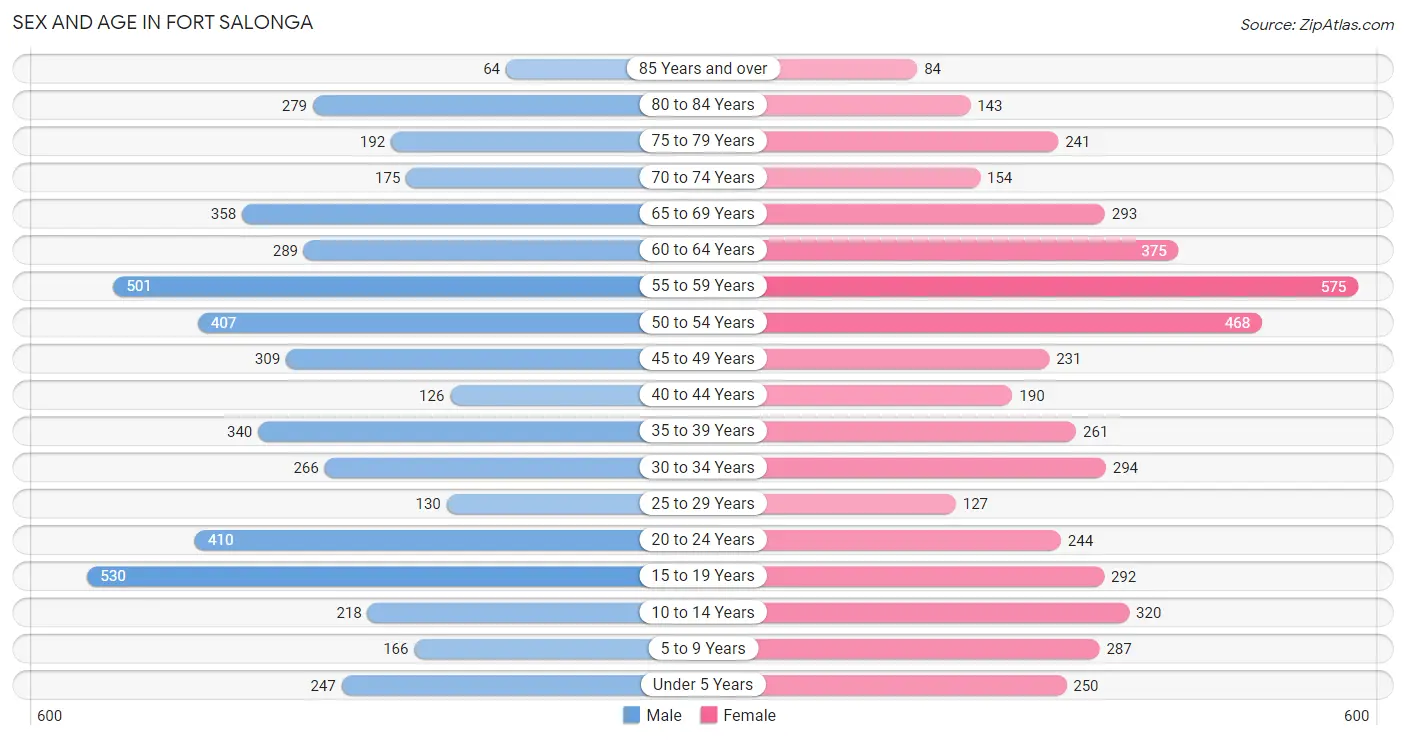
| Age Bracket | Male | Female |
| Under 5 Years | 247 (4.9%) | 250 (5.2%) |
| 5 to 9 Years | 166 (3.3%) | 287 (5.9%) |
| 10 to 14 Years | 218 (4.3%) | 320 (6.6%) |
| 15 to 19 Years | 530 (10.6%) | 292 (6.0%) |
| 20 to 24 Years | 410 (8.2%) | 244 (5.1%) |
| 25 to 29 Years | 130 (2.6%) | 127 (2.6%) |
| 30 to 34 Years | 266 (5.3%) | 294 (6.1%) |
| 35 to 39 Years | 340 (6.8%) | 261 (5.4%) |
| 40 to 44 Years | 126 (2.5%) | 190 (3.9%) |
| 45 to 49 Years | 309 (6.2%) | 231 (4.8%) |
| 50 to 54 Years | 407 (8.1%) | 468 (9.7%) |
| 55 to 59 Years | 501 (10.0%) | 575 (11.9%) |
| 60 to 64 Years | 289 (5.8%) | 375 (7.8%) |
| 65 to 69 Years | 358 (7.1%) | 293 (6.1%) |
| 70 to 74 Years | 175 (3.5%) | 154 (3.2%) |
| 75 to 79 Years | 192 (3.8%) | 241 (5.0%) |
| 80 to 84 Years | 279 (5.6%) | 143 (3.0%) |
| 85 Years and over | 64 (1.3%) | 84 (1.7%) |
| Total | 5,007 (100.0%) | 4,829 (100.0%) |
Families and Households in Fort Salonga
Median Family Size in Fort Salonga
The median family size in Fort Salonga is 3.26 persons per family, with married-couple families (2,395 | 89.6%) accounting for the largest median family size of 3.32 persons per family. On the other hand, single female/mother families (246 | 9.2%) represent the smallest median family size with 2.73 persons per family.
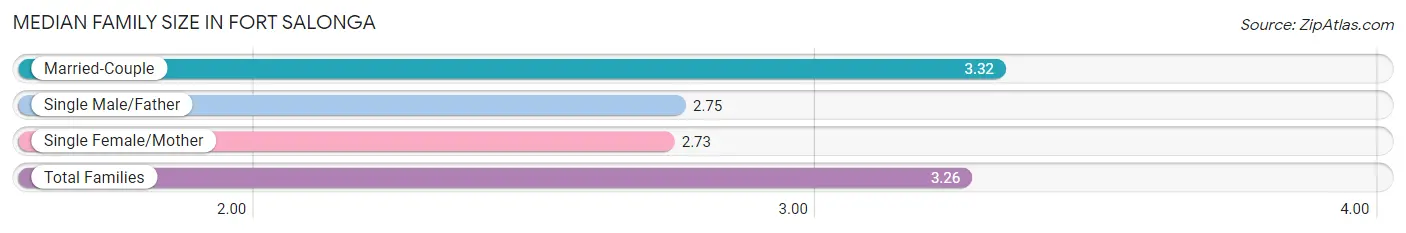
| Family Type | # Families | Family Size |
| Married-Couple | 2,395 (89.6%) | 3.32 |
| Single Male/Father | 32 (1.2%) | 2.75 |
| Single Female/Mother | 246 (9.2%) | 2.73 |
| Total Families | 2,673 (100.0%) | 3.26 |
Median Household Size in Fort Salonga
The median household size in Fort Salonga is 2.85 persons per household, with married-couple households (2,395 | 71.3%) accounting for the largest median household size of 3.35 persons per household. non-family households (686 | 20.4%) represent the smallest median household size with 1.14 persons per household.
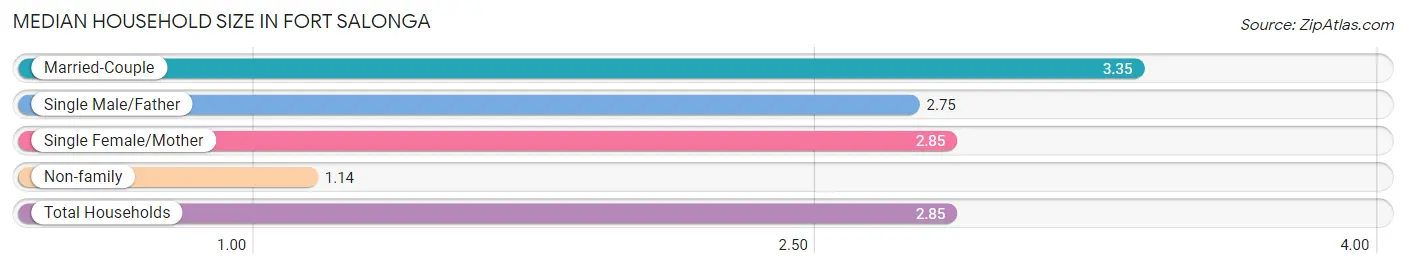
| Household Type | # Households | Household Size |
| Married-Couple | 2,395 (71.3%) | 3.35 |
| Single Male/Father | 32 (0.9%) | 2.75 |
| Single Female/Mother | 246 (7.3%) | 2.85 |
| Non-family | 686 (20.4%) | 1.14 |
| Total Households | 3,359 (100.0%) | 2.85 |
Household Size by Marriage Status in Fort Salonga
Out of a total of 3,359 households in Fort Salonga, 2,673 (79.6%) are family households, while 686 (20.4%) are nonfamily households. The most numerous type of family households are 2-person households, comprising 1,134, and the most common type of nonfamily households are 1-person households, comprising 621.
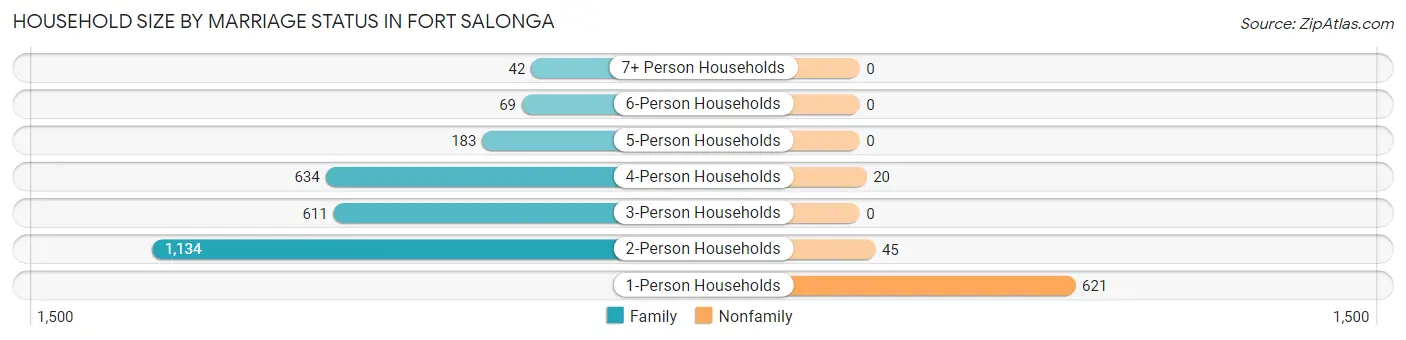
| Household Size | Family Households | Nonfamily Households |
| 1-Person Households | - | 621 (18.5%) |
| 2-Person Households | 1,134 (33.8%) | 45 (1.3%) |
| 3-Person Households | 611 (18.2%) | 0 (0.0%) |
| 4-Person Households | 634 (18.9%) | 20 (0.6%) |
| 5-Person Households | 183 (5.4%) | 0 (0.0%) |
| 6-Person Households | 69 (2.1%) | 0 (0.0%) |
| 7+ Person Households | 42 (1.3%) | 0 (0.0%) |
| Total | 2,673 (79.6%) | 686 (20.4%) |
Female Fertility in Fort Salonga
Fertility by Age in Fort Salonga
Average fertility rate in Fort Salonga is 52.0 births per 1,000 women. Women in the age bracket of 20 to 34 years have the highest fertility rate with 114.0 births per 1,000 women. Women in the age bracket of 20 to 34 years acount for 85.4% of all women with births.
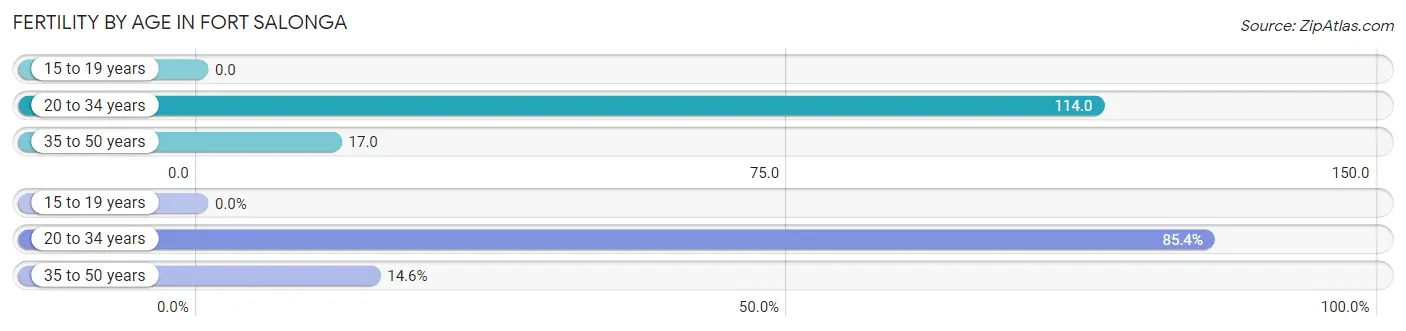
| Age Bracket | Women with Births | Births / 1,000 Women |
| 15 to 19 years | 0 (0.0%) | 0.0 |
| 20 to 34 years | 76 (85.4%) | 114.0 |
| 35 to 50 years | 13 (14.6%) | 17.0 |
| Total | 89 (100.0%) | 52.0 |
Fertility by Age by Marriage Status in Fort Salonga
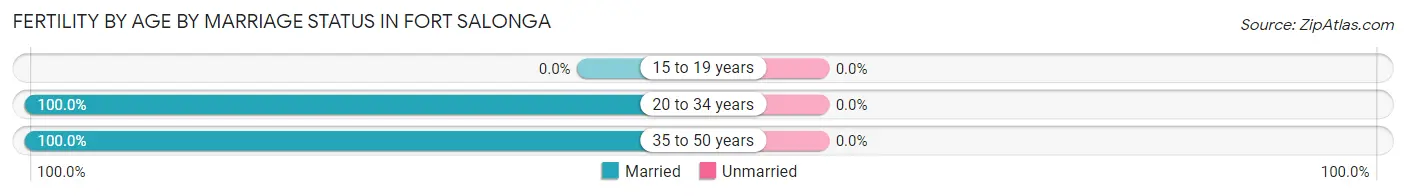
| Age Bracket | Married | Unmarried |
| 15 to 19 years | 0 (0.0%) | 0 (0.0%) |
| 20 to 34 years | 76 (100.0%) | 0 (0.0%) |
| 35 to 50 years | 13 (100.0%) | 0 (0.0%) |
| Total | 89 (100.0%) | 0 (0.0%) |
Fertility by Education in Fort Salonga
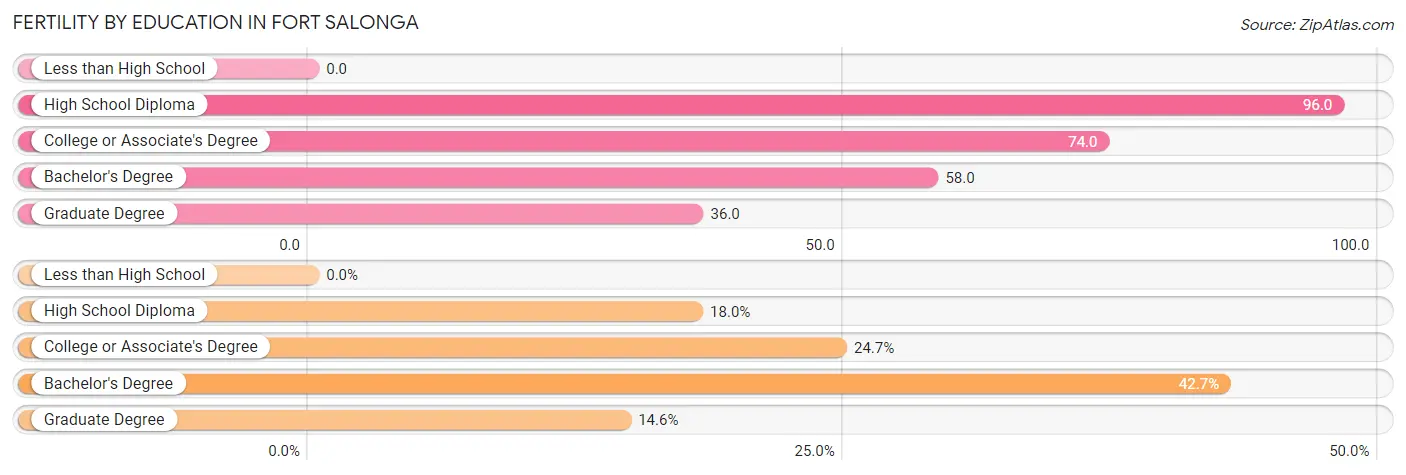
| Educational Attainment | Women with Births | Births / 1,000 Women |
| Less than High School | 0 (0.0%) | 0.0 |
| High School Diploma | 16 (18.0%) | 96.0 |
| College or Associate's Degree | 22 (24.7%) | 74.0 |
| Bachelor's Degree | 38 (42.7%) | 58.0 |
| Graduate Degree | 13 (14.6%) | 36.0 |
| Total | 89 (100.0%) | 52.0 |
Fertility by Education by Marriage Status in Fort Salonga
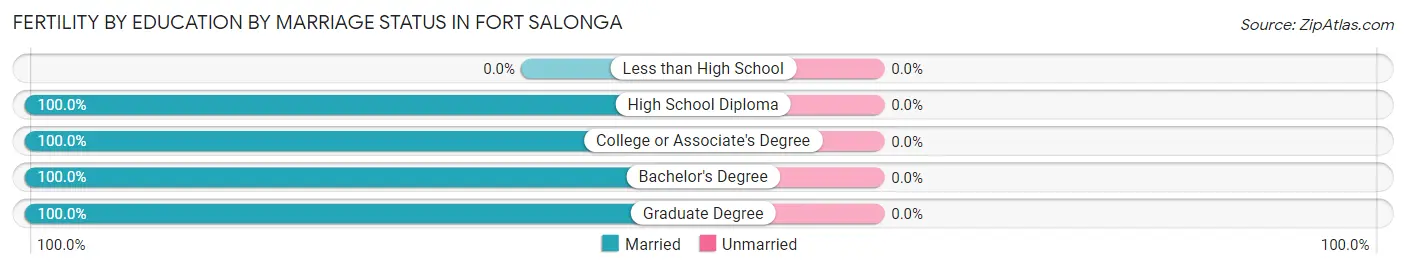
| Educational Attainment | Married | Unmarried |
| Less than High School | 0 (0.0%) | 0 (0.0%) |
| High School Diploma | 16 (100.0%) | 0 (0.0%) |
| College or Associate's Degree | 22 (100.0%) | 0 (0.0%) |
| Bachelor's Degree | 38 (100.0%) | 0 (0.0%) |
| Graduate Degree | 13 (100.0%) | 0 (0.0%) |
| Total | 89 (100.0%) | 0 (0.0%) |
Employment Characteristics in Fort Salonga
Employment by Class of Employer in Fort Salonga
Among the 4,789 employed individuals in Fort Salonga, private company employees (2,804 | 58.6%), local government employees (718 | 15.0%), and self-employed (incorporated) (330 | 6.9%) make up the most common classes of employment.
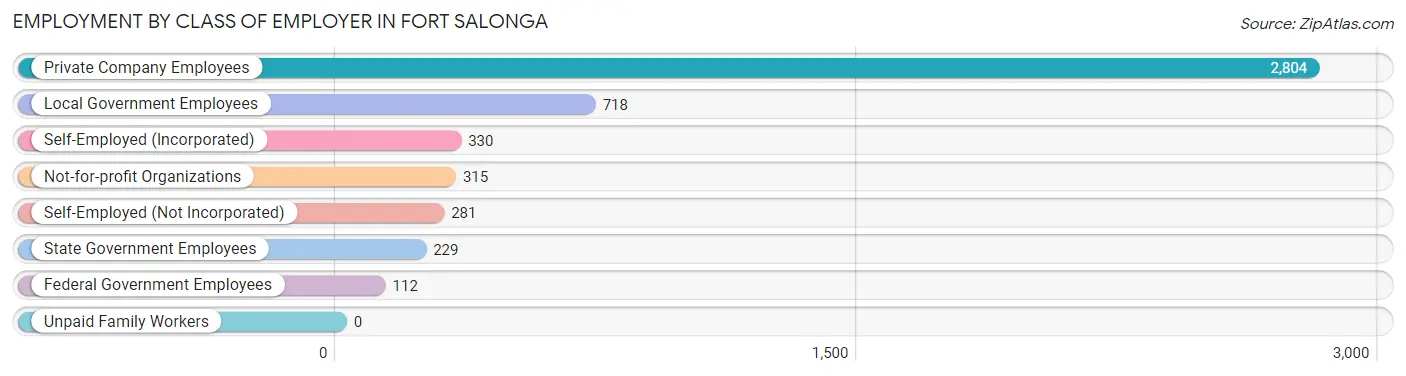
| Employer Class | # Employees | % Employees |
| Private Company Employees | 2,804 | 58.6% |
| Self-Employed (Incorporated) | 330 | 6.9% |
| Self-Employed (Not Incorporated) | 281 | 5.9% |
| Not-for-profit Organizations | 315 | 6.6% |
| Local Government Employees | 718 | 15.0% |
| State Government Employees | 229 | 4.8% |
| Federal Government Employees | 112 | 2.3% |
| Unpaid Family Workers | 0 | 0.0% |
| Total | 4,789 | 100.0% |
Employment Status by Age in Fort Salonga
According to the labor force statistics for Fort Salonga, out of the total population over 16 years of age (8,219), 63.2% or 5,194 individuals are in the labor force, with 5.6% or 291 of them unemployed. The age group with the highest labor force participation rate is 25 to 29 years, with 96.5% or 248 individuals in the labor force. Within the labor force, the 20 to 24 years age range has the highest percentage of unemployed individuals, with 24.1% or 102 of them being unemployed.
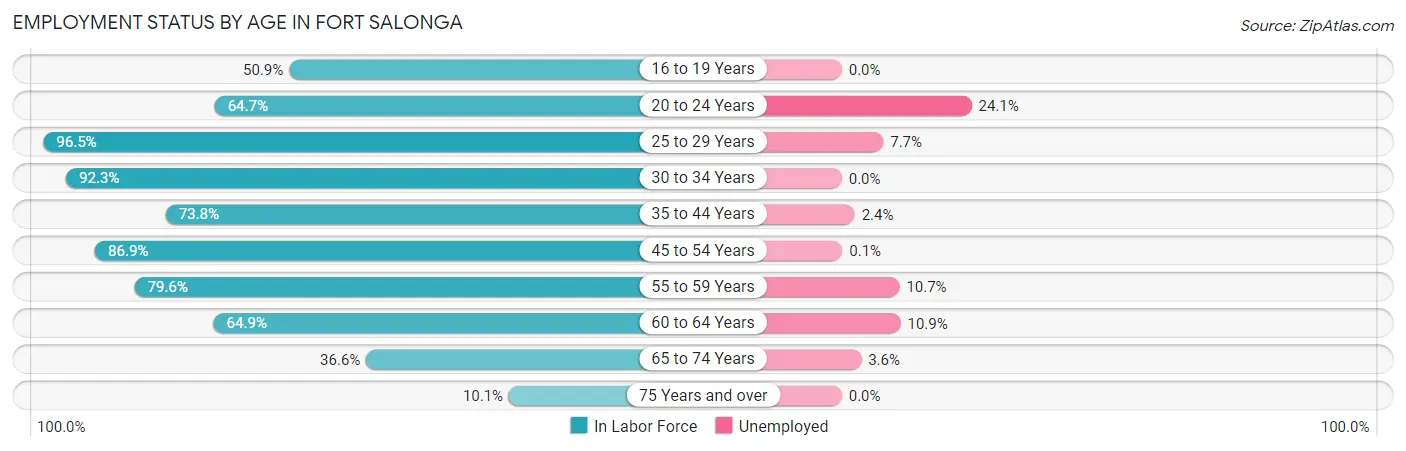
| Age Bracket | In Labor Force | Unemployed |
| 16 to 19 Years | 353 (50.9%) | 0 (0.0%) |
| 20 to 24 Years | 423 (64.7%) | 102 (24.1%) |
| 25 to 29 Years | 248 (96.5%) | 19 (7.7%) |
| 30 to 34 Years | 517 (92.3%) | 0 (0.0%) |
| 35 to 44 Years | 677 (73.8%) | 16 (2.4%) |
| 45 to 54 Years | 1,230 (86.9%) | 1 (0.1%) |
| 55 to 59 Years | 856 (79.6%) | 92 (10.7%) |
| 60 to 64 Years | 431 (64.9%) | 47 (10.9%) |
| 65 to 74 Years | 359 (36.6%) | 13 (3.6%) |
| 75 Years and over | 101 (10.1%) | 0 (0.0%) |
| Total | 5,194 (63.2%) | 291 (5.6%) |
Employment Status by Educational Attainment in Fort Salonga
According to labor force statistics for Fort Salonga, 81.0% of individuals (3,960) out of the total population between 25 and 64 years of age (4,889) are in the labor force, with 4.4% or 174 of them being unemployed. The group with the highest labor force participation rate are those with the educational attainment of high school diploma, with 85.4% or 615 individuals in the labor force. Within the labor force, individuals with college / associate degree education have the highest percentage of unemployment, with 13.5% or 92 of them being unemployed.
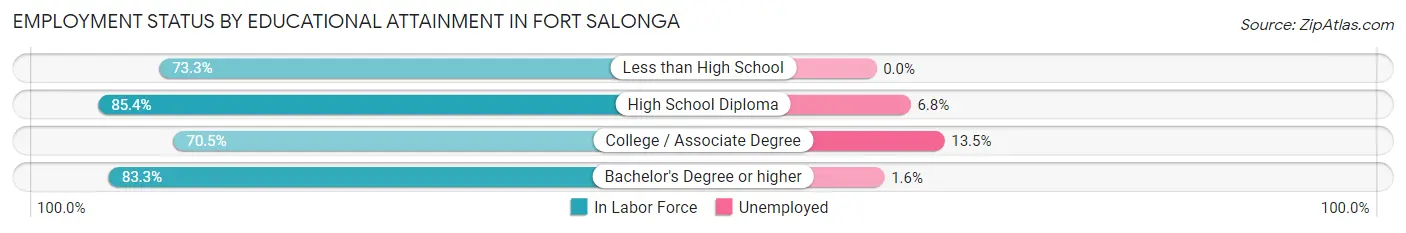
| Educational Attainment | In Labor Force | Unemployed |
| Less than High School | 44 (73.3%) | 0 (0.0%) |
| High School Diploma | 615 (85.4%) | 49 (6.8%) |
| College / Associate Degree | 681 (70.5%) | 130 (13.5%) |
| Bachelor's Degree or higher | 2,618 (83.3%) | 50 (1.6%) |
| Total | 3,960 (81.0%) | 215 (4.4%) |
Employment Occupations by Sex in Fort Salonga
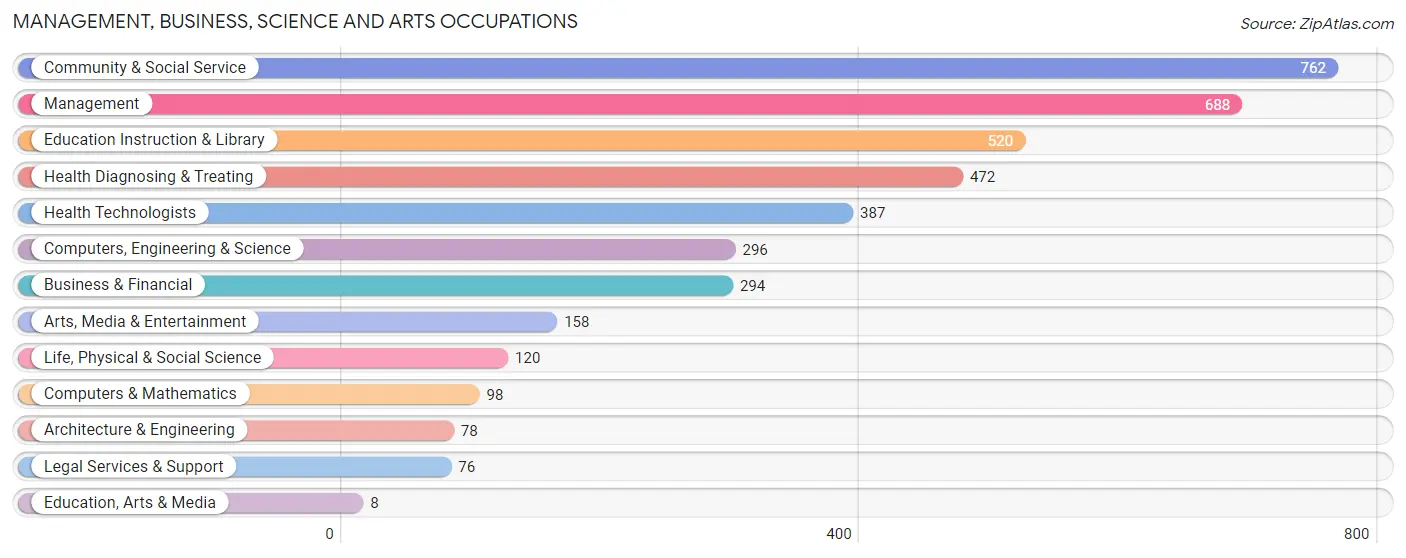
Management, Business, Science and Arts Occupations
The most common Management, Business, Science and Arts occupations in Fort Salonga are Community & Social Service (762 | 15.5%), Management (688 | 14.0%), Education Instruction & Library (520 | 10.6%), Health Diagnosing & Treating (472 | 9.6%), and Health Technologists (387 | 7.9%).
Management, Business, Science and Arts Occupations by Sex
Within the Management, Business, Science and Arts occupations in Fort Salonga, the most male-oriented occupations are Architecture & Engineering (100.0%), Arts, Media & Entertainment (79.1%), and Computers, Engineering & Science (67.9%), while the most female-oriented occupations are Education, Arts & Media (100.0%), Education Instruction & Library (89.6%), and Health Technologists (77.3%).
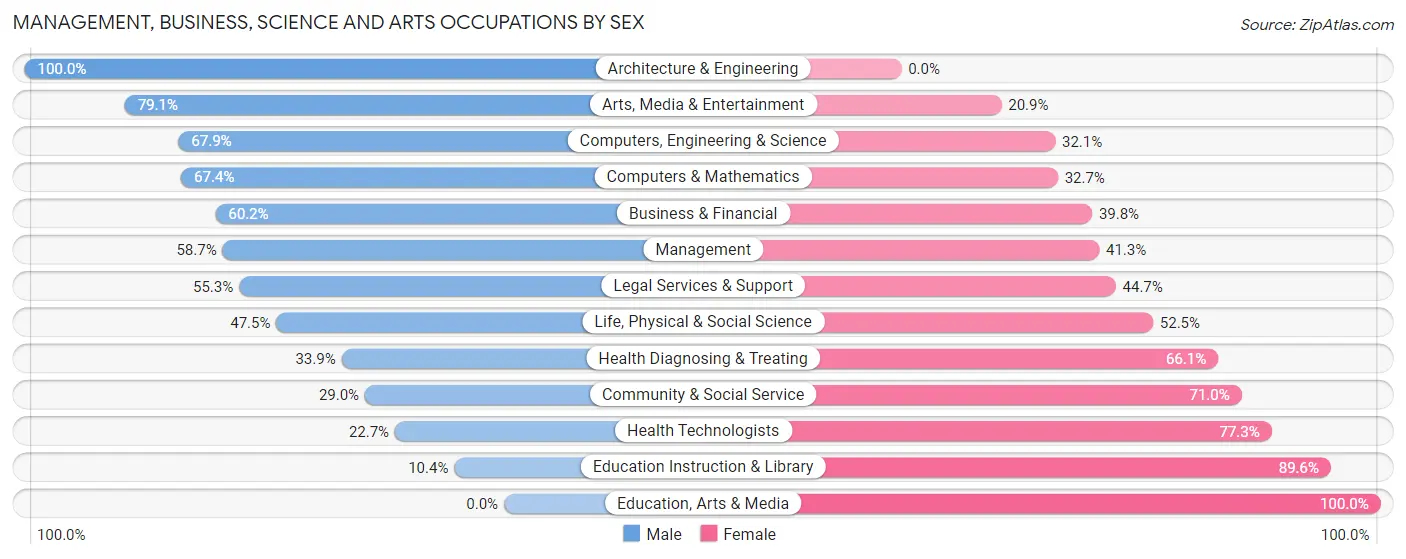
| Occupation | Male | Female |
| Management | 404 (58.7%) | 284 (41.3%) |
| Business & Financial | 177 (60.2%) | 117 (39.8%) |
| Computers, Engineering & Science | 201 (67.9%) | 95 (32.1%) |
| Computers & Mathematics | 66 (67.3%) | 32 (32.7%) |
| Architecture & Engineering | 78 (100.0%) | 0 (0.0%) |
| Life, Physical & Social Science | 57 (47.5%) | 63 (52.5%) |
| Community & Social Service | 221 (29.0%) | 541 (71.0%) |
| Education, Arts & Media | 0 (0.0%) | 8 (100.0%) |
| Legal Services & Support | 42 (55.3%) | 34 (44.7%) |
| Education Instruction & Library | 54 (10.4%) | 466 (89.6%) |
| Arts, Media & Entertainment | 125 (79.1%) | 33 (20.9%) |
| Health Diagnosing & Treating | 160 (33.9%) | 312 (66.1%) |
| Health Technologists | 88 (22.7%) | 299 (77.3%) |
| Total (Category) | 1,163 (46.3%) | 1,349 (53.7%) |
| Total (Overall) | 2,743 (55.9%) | 2,162 (44.1%) |
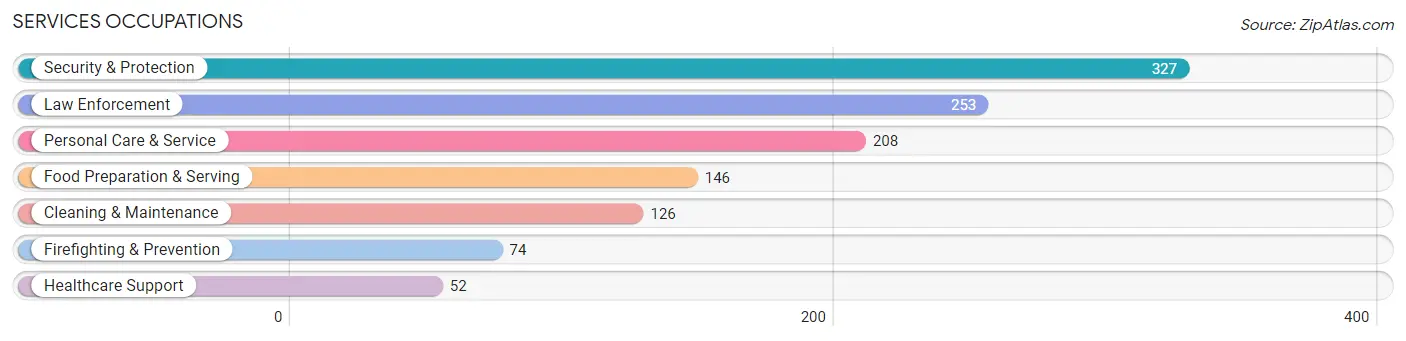
Services Occupations
The most common Services occupations in Fort Salonga are Security & Protection (327 | 6.7%), Law Enforcement (253 | 5.2%), Personal Care & Service (208 | 4.2%), Food Preparation & Serving (146 | 3.0%), and Cleaning & Maintenance (126 | 2.6%).
Services Occupations by Sex
Within the Services occupations in Fort Salonga, the most male-oriented occupations are Cleaning & Maintenance (100.0%), Law Enforcement (97.2%), and Security & Protection (92.0%), while the most female-oriented occupations are Healthcare Support (86.5%), Food Preparation & Serving (76.7%), and Personal Care & Service (57.7%).
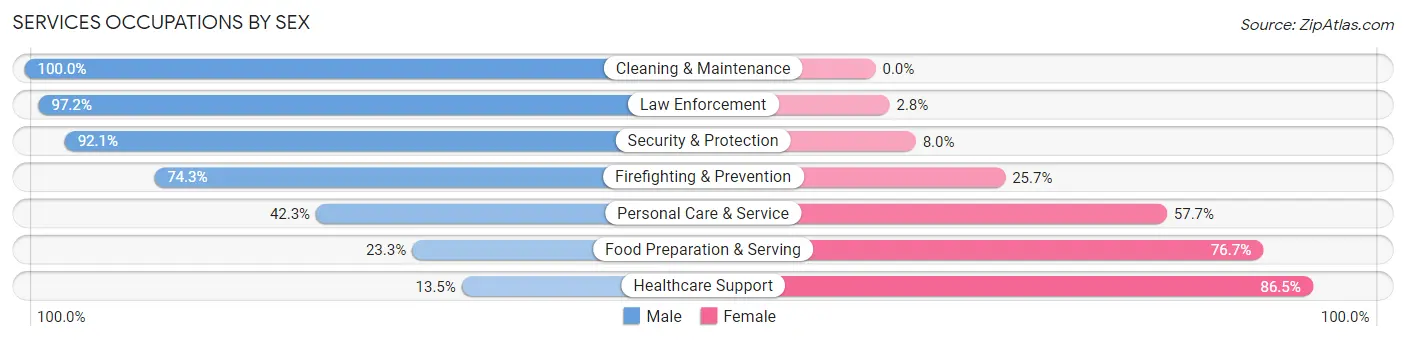
| Occupation | Male | Female |
| Healthcare Support | 7 (13.5%) | 45 (86.5%) |
| Security & Protection | 301 (92.0%) | 26 (8.0%) |
| Firefighting & Prevention | 55 (74.3%) | 19 (25.7%) |
| Law Enforcement | 246 (97.2%) | 7 (2.8%) |
| Food Preparation & Serving | 34 (23.3%) | 112 (76.7%) |
| Cleaning & Maintenance | 126 (100.0%) | 0 (0.0%) |
| Personal Care & Service | 88 (42.3%) | 120 (57.7%) |
| Total (Category) | 556 (64.7%) | 303 (35.3%) |
| Total (Overall) | 2,743 (55.9%) | 2,162 (44.1%) |
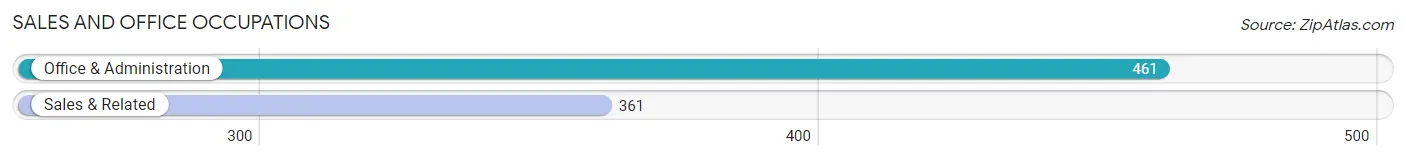
Sales and Office Occupations
The most common Sales and Office occupations in Fort Salonga are Office & Administration (461 | 9.4%), and Sales & Related (361 | 7.4%).
Sales and Office Occupations by Sex
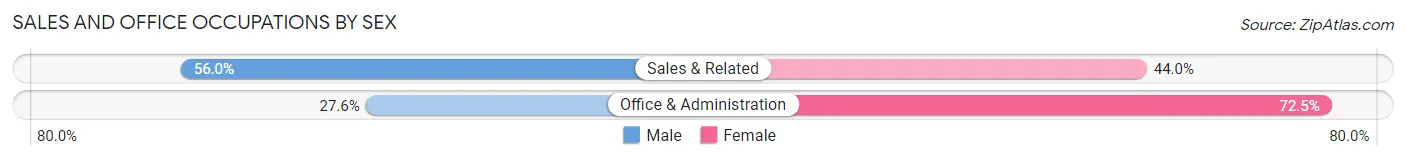
| Occupation | Male | Female |
| Sales & Related | 202 (56.0%) | 159 (44.0%) |
| Office & Administration | 127 (27.6%) | 334 (72.5%) |
| Total (Category) | 329 (40.0%) | 493 (60.0%) |
| Total (Overall) | 2,743 (55.9%) | 2,162 (44.1%) |
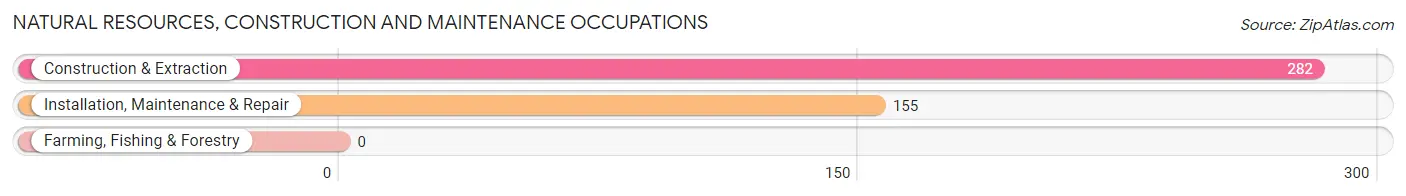
Natural Resources, Construction and Maintenance Occupations
The most common Natural Resources, Construction and Maintenance occupations in Fort Salonga are Construction & Extraction (282 | 5.8%), and Installation, Maintenance & Repair (155 | 3.2%).
Natural Resources, Construction and Maintenance Occupations by Sex
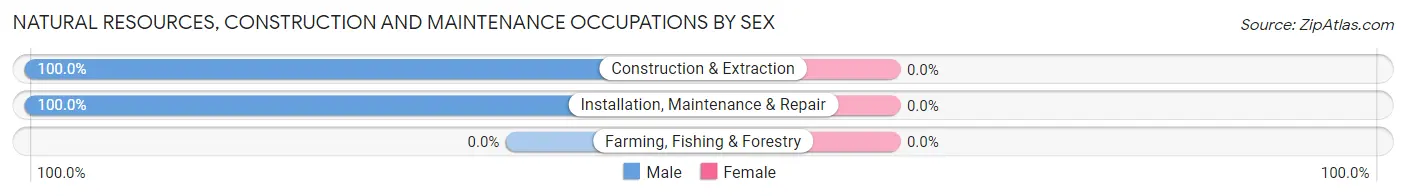
| Occupation | Male | Female |
| Farming, Fishing & Forestry | 0 (0.0%) | 0 (0.0%) |
| Construction & Extraction | 282 (100.0%) | 0 (0.0%) |
| Installation, Maintenance & Repair | 155 (100.0%) | 0 (0.0%) |
| Total (Category) | 437 (100.0%) | 0 (0.0%) |
| Total (Overall) | 2,743 (55.9%) | 2,162 (44.1%) |
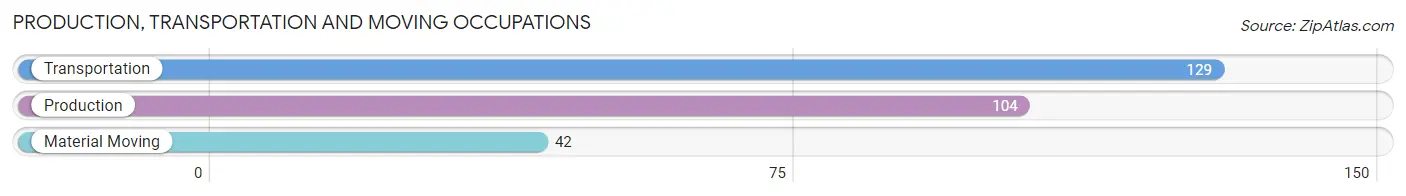
Production, Transportation and Moving Occupations
The most common Production, Transportation and Moving occupations in Fort Salonga are Transportation (129 | 2.6%), Production (104 | 2.1%), and Material Moving (42 | 0.9%).
Production, Transportation and Moving Occupations by Sex
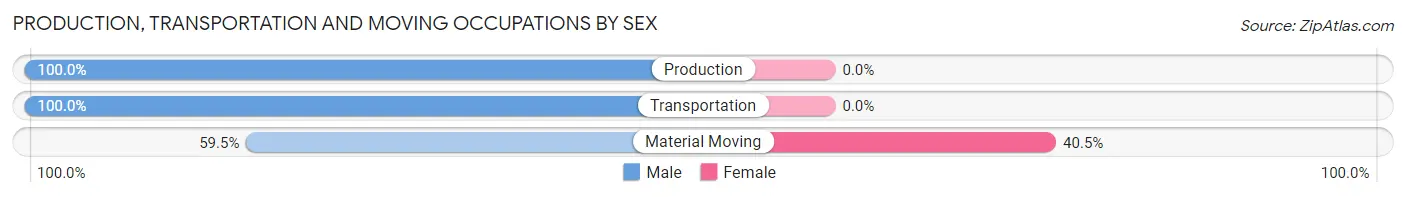
| Occupation | Male | Female |
| Production | 104 (100.0%) | 0 (0.0%) |
| Transportation | 129 (100.0%) | 0 (0.0%) |
| Material Moving | 25 (59.5%) | 17 (40.5%) |
| Total (Category) | 258 (93.8%) | 17 (6.2%) |
| Total (Overall) | 2,743 (55.9%) | 2,162 (44.1%) |
Employment Industries by Sex in Fort Salonga
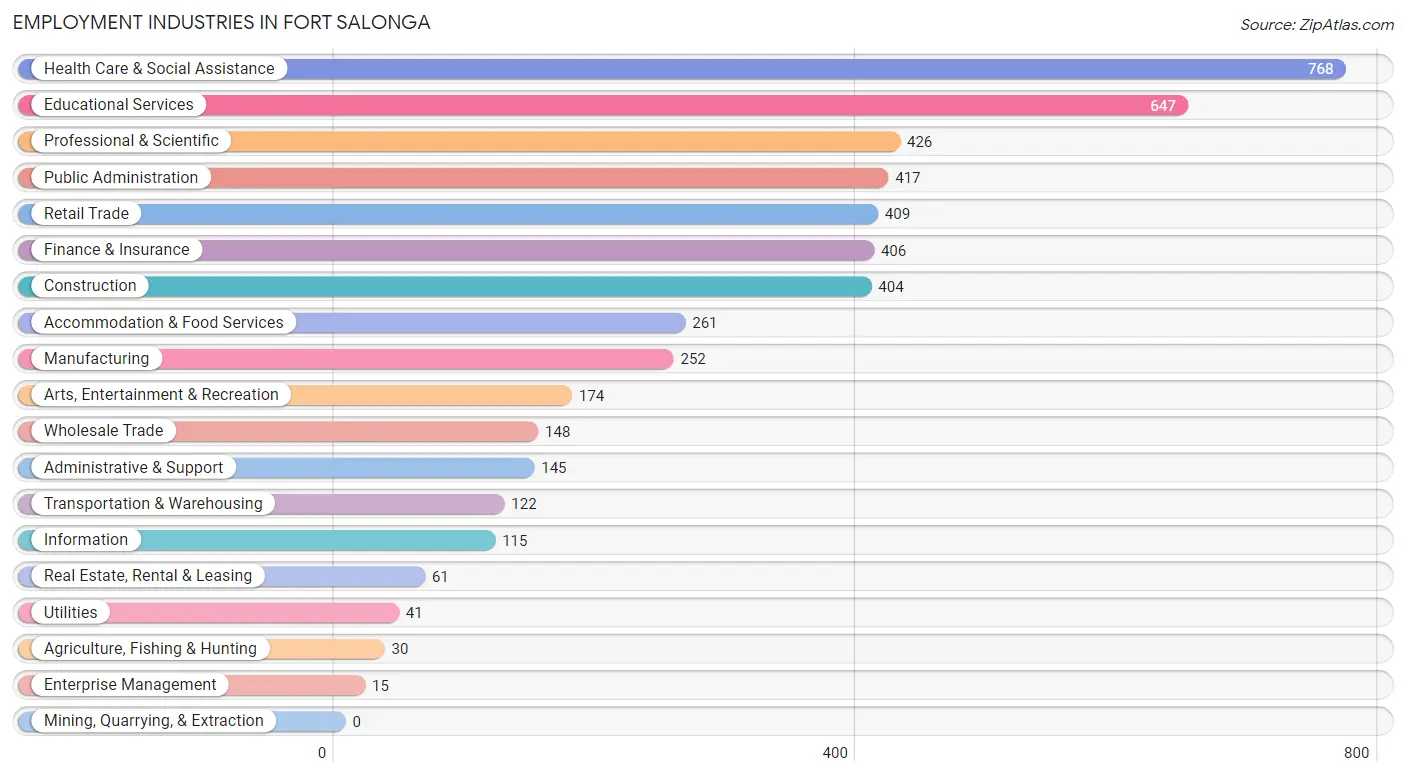
Employment Industries in Fort Salonga
The major employment industries in Fort Salonga include Health Care & Social Assistance (768 | 15.7%), Educational Services (647 | 13.2%), Professional & Scientific (426 | 8.7%), Public Administration (417 | 8.5%), and Retail Trade (409 | 8.3%).
Employment Industries by Sex in Fort Salonga
The Fort Salonga industries that see more men than women are Agriculture, Fishing & Hunting (100.0%), Transportation & Warehousing (100.0%), and Utilities (100.0%), whereas the industries that tend to have a higher number of women are Enterprise Management (100.0%), Accommodation & Food Services (87.0%), and Educational Services (83.9%).
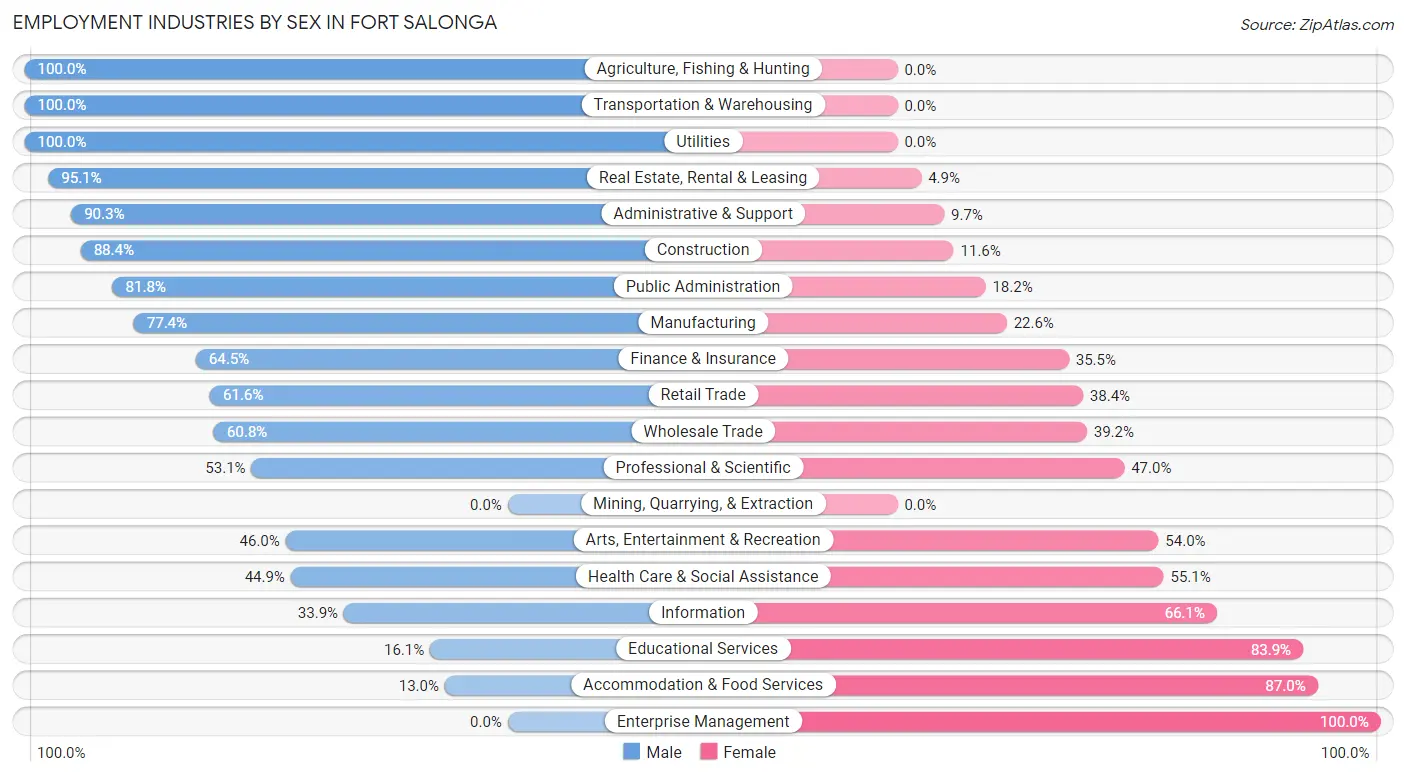
| Industry | Male | Female |
| Agriculture, Fishing & Hunting | 30 (100.0%) | 0 (0.0%) |
| Mining, Quarrying, & Extraction | 0 (0.0%) | 0 (0.0%) |
| Construction | 357 (88.4%) | 47 (11.6%) |
| Manufacturing | 195 (77.4%) | 57 (22.6%) |
| Wholesale Trade | 90 (60.8%) | 58 (39.2%) |
| Retail Trade | 252 (61.6%) | 157 (38.4%) |
| Transportation & Warehousing | 122 (100.0%) | 0 (0.0%) |
| Utilities | 41 (100.0%) | 0 (0.0%) |
| Information | 39 (33.9%) | 76 (66.1%) |
| Finance & Insurance | 262 (64.5%) | 144 (35.5%) |
| Real Estate, Rental & Leasing | 58 (95.1%) | 3 (4.9%) |
| Professional & Scientific | 226 (53.0%) | 200 (46.9%) |
| Enterprise Management | 0 (0.0%) | 15 (100.0%) |
| Administrative & Support | 131 (90.3%) | 14 (9.7%) |
| Educational Services | 104 (16.1%) | 543 (83.9%) |
| Health Care & Social Assistance | 345 (44.9%) | 423 (55.1%) |
| Arts, Entertainment & Recreation | 80 (46.0%) | 94 (54.0%) |
| Accommodation & Food Services | 34 (13.0%) | 227 (87.0%) |
| Public Administration | 341 (81.8%) | 76 (18.2%) |
| Total | 2,743 (55.9%) | 2,162 (44.1%) |
Education in Fort Salonga
School Enrollment in Fort Salonga
The most common levels of schooling among the 2,267 students in Fort Salonga are high school (701 | 30.9%), college / undergraduate (461 | 20.3%), and middle school (376 | 16.6%).
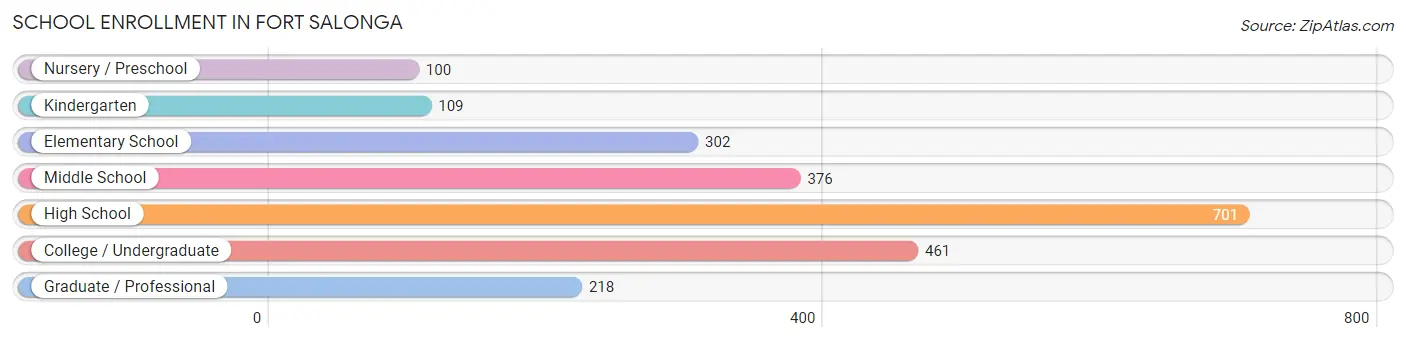
| School Level | # Students | % Students |
| Nursery / Preschool | 100 | 4.4% |
| Kindergarten | 109 | 4.8% |
| Elementary School | 302 | 13.3% |
| Middle School | 376 | 16.6% |
| High School | 701 | 30.9% |
| College / Undergraduate | 461 | 20.3% |
| Graduate / Professional | 218 | 9.6% |
| Total | 2,267 | 100.0% |
School Enrollment by Age by Funding Source in Fort Salonga
Out of a total of 2,267 students who are enrolled in schools in Fort Salonga, 453 (20.0%) attend a private institution, while the remaining 1,814 (80.0%) are enrolled in public schools. The age group of 35 years and over has the highest likelihood of being enrolled in private schools, with 66 (60.0% in the age bracket) enrolled. Conversely, the age group of 15 to 17 year olds has the lowest likelihood of being enrolled in a private school, with 512 (97.2% in the age bracket) attending a public institution.
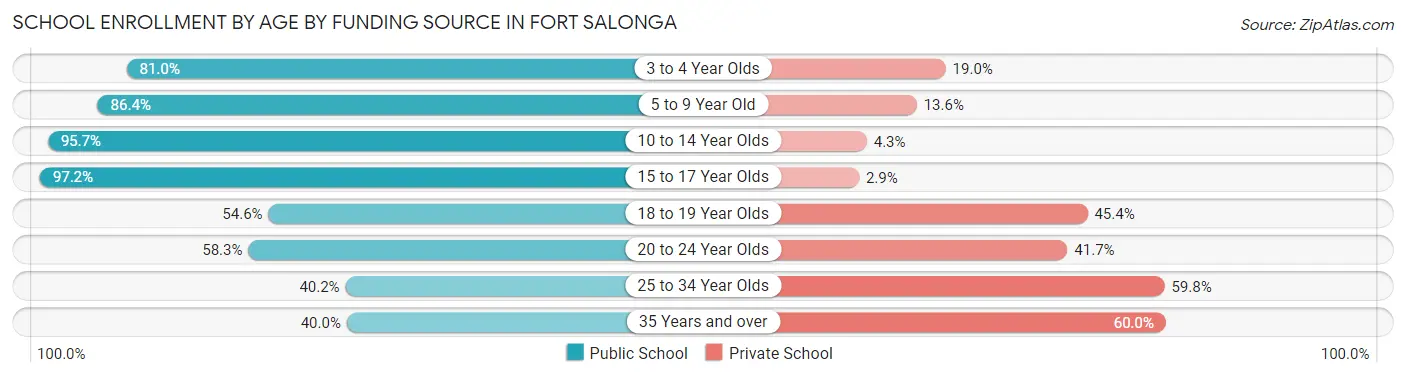
| Age Bracket | Public School | Private School |
| 3 to 4 Year Olds | 81 (81.0%) | 19 (19.0%) |
| 5 to 9 Year Old | 330 (86.4%) | 52 (13.6%) |
| 10 to 14 Year Olds | 511 (95.7%) | 23 (4.3%) |
| 15 to 17 Year Olds | 512 (97.2%) | 15 (2.9%) |
| 18 to 19 Year Olds | 107 (54.6%) | 89 (45.4%) |
| 20 to 24 Year Olds | 196 (58.3%) | 140 (41.7%) |
| 25 to 34 Year Olds | 33 (40.2%) | 49 (59.8%) |
| 35 Years and over | 44 (40.0%) | 66 (60.0%) |
| Total | 1,814 (80.0%) | 453 (20.0%) |
Educational Attainment by Field of Study in Fort Salonga
Business (982 | 22.0%), education (622 | 14.0%), social sciences (558 | 12.5%), science & technology (530 | 11.9%), and engineering (300 | 6.7%) are the most common fields of study among 4,455 individuals in Fort Salonga who have obtained a bachelor's degree or higher.
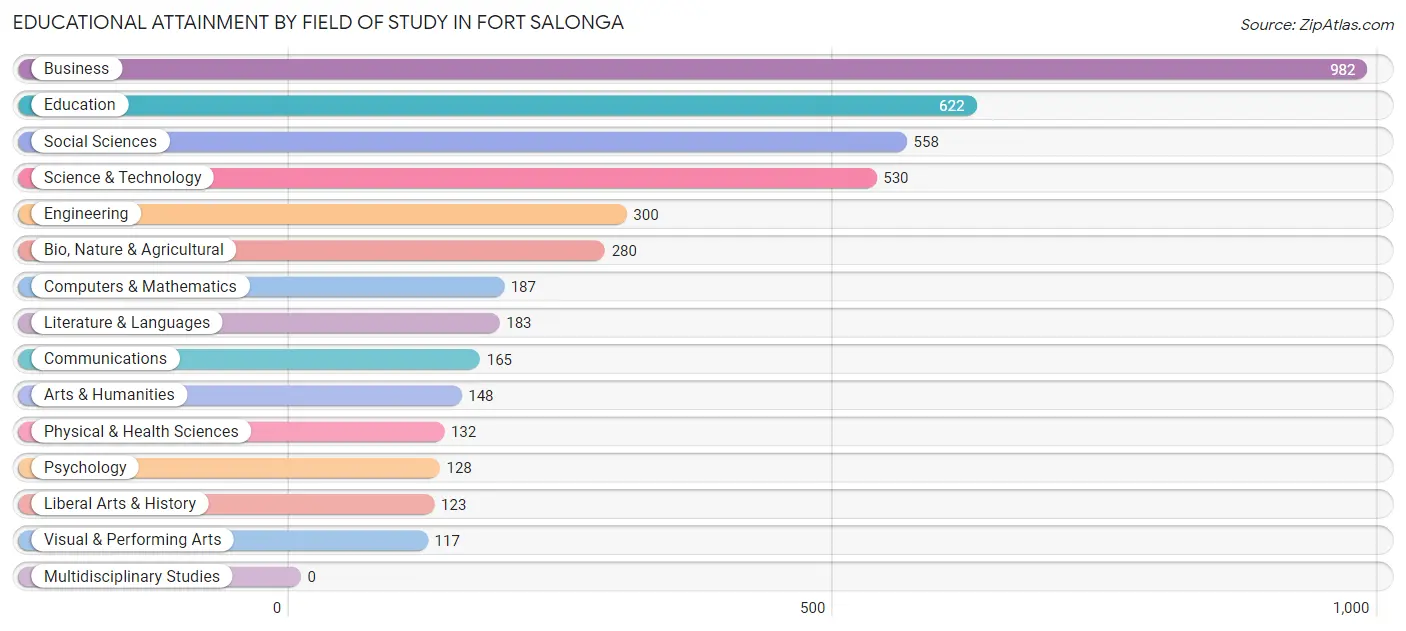
| Field of Study | # Graduates | % Graduates |
| Computers & Mathematics | 187 | 4.2% |
| Bio, Nature & Agricultural | 280 | 6.3% |
| Physical & Health Sciences | 132 | 3.0% |
| Psychology | 128 | 2.9% |
| Social Sciences | 558 | 12.5% |
| Engineering | 300 | 6.7% |
| Multidisciplinary Studies | 0 | 0.0% |
| Science & Technology | 530 | 11.9% |
| Business | 982 | 22.0% |
| Education | 622 | 14.0% |
| Literature & Languages | 183 | 4.1% |
| Liberal Arts & History | 123 | 2.8% |
| Visual & Performing Arts | 117 | 2.6% |
| Communications | 165 | 3.7% |
| Arts & Humanities | 148 | 3.3% |
| Total | 4,455 | 100.0% |
Transportation & Commute in Fort Salonga
Vehicle Availability by Sex in Fort Salonga
The most prevalent vehicle ownership categories in Fort Salonga are males with 3 vehicles (980, accounting for 37.3%) and females with 3 vehicles (606, making up 46.3%).
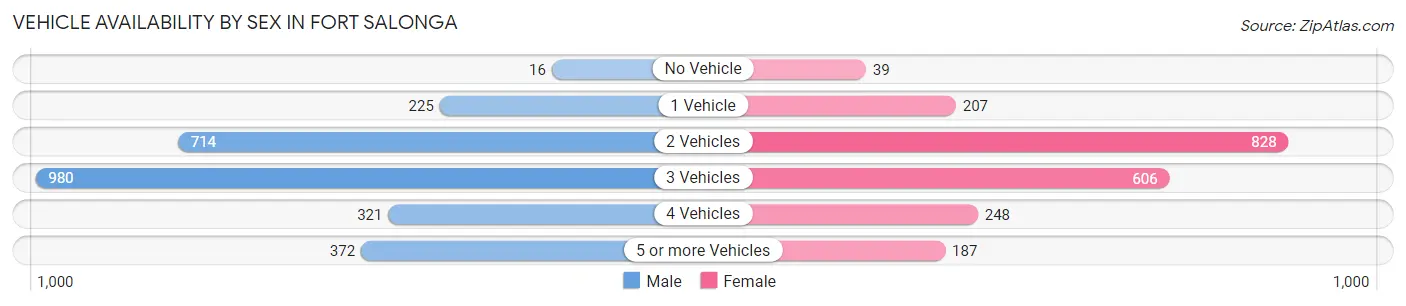
| Vehicles Available | Male | Female |
| No Vehicle | 16 (0.6%) | 39 (1.8%) |
| 1 Vehicle | 225 (8.6%) | 207 (9.8%) |
| 2 Vehicles | 714 (27.2%) | 828 (39.2%) |
| 3 Vehicles | 980 (37.3%) | 606 (28.6%) |
| 4 Vehicles | 321 (12.2%) | 248 (11.7%) |
| 5 or more Vehicles | 372 (14.2%) | 187 (8.8%) |
| Total | 2,628 (100.0%) | 2,115 (100.0%) |
Commute Time in Fort Salonga
The most frequently occuring commute durations in Fort Salonga are 20 to 24 minutes (759 commuters, 18.0%), 30 to 34 minutes (598 commuters, 14.2%), and 45 to 59 minutes (433 commuters, 10.3%).
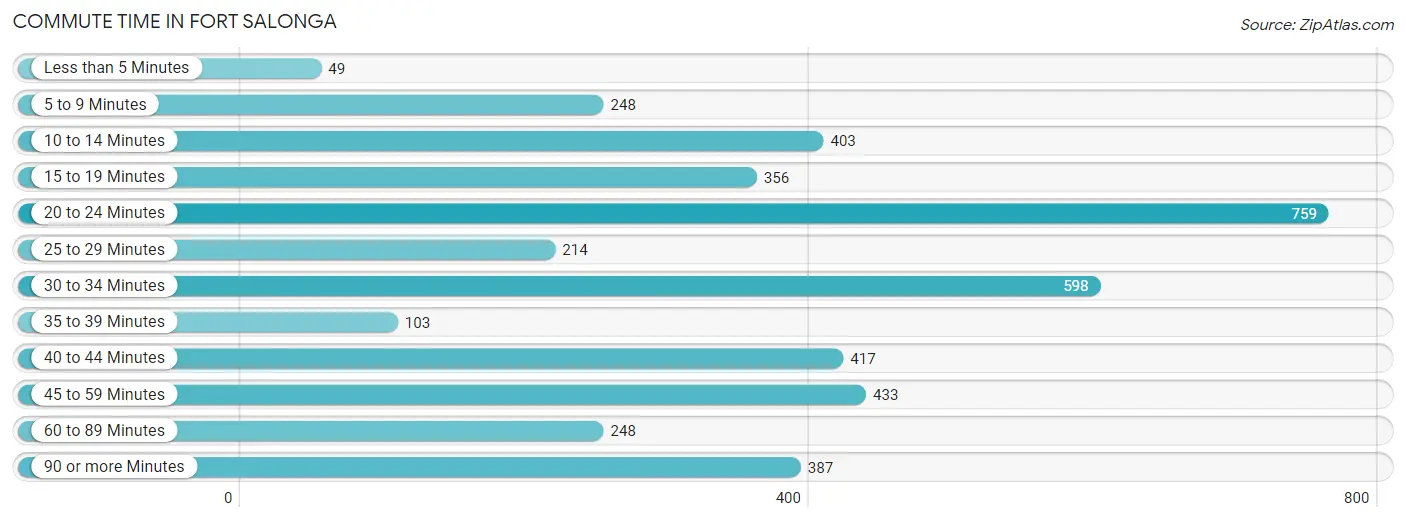
| Commute Time | # Commuters | % Commuters |
| Less than 5 Minutes | 49 | 1.2% |
| 5 to 9 Minutes | 248 | 5.9% |
| 10 to 14 Minutes | 403 | 9.6% |
| 15 to 19 Minutes | 356 | 8.5% |
| 20 to 24 Minutes | 759 | 18.0% |
| 25 to 29 Minutes | 214 | 5.1% |
| 30 to 34 Minutes | 598 | 14.2% |
| 35 to 39 Minutes | 103 | 2.4% |
| 40 to 44 Minutes | 417 | 9.9% |
| 45 to 59 Minutes | 433 | 10.3% |
| 60 to 89 Minutes | 248 | 5.9% |
| 90 or more Minutes | 387 | 9.2% |
Commute Time by Sex in Fort Salonga
The most common commute times in Fort Salonga are 20 to 24 minutes (538 commuters, 22.7%) for males and 10 to 14 minutes (233 commuters, 12.7%) for females.
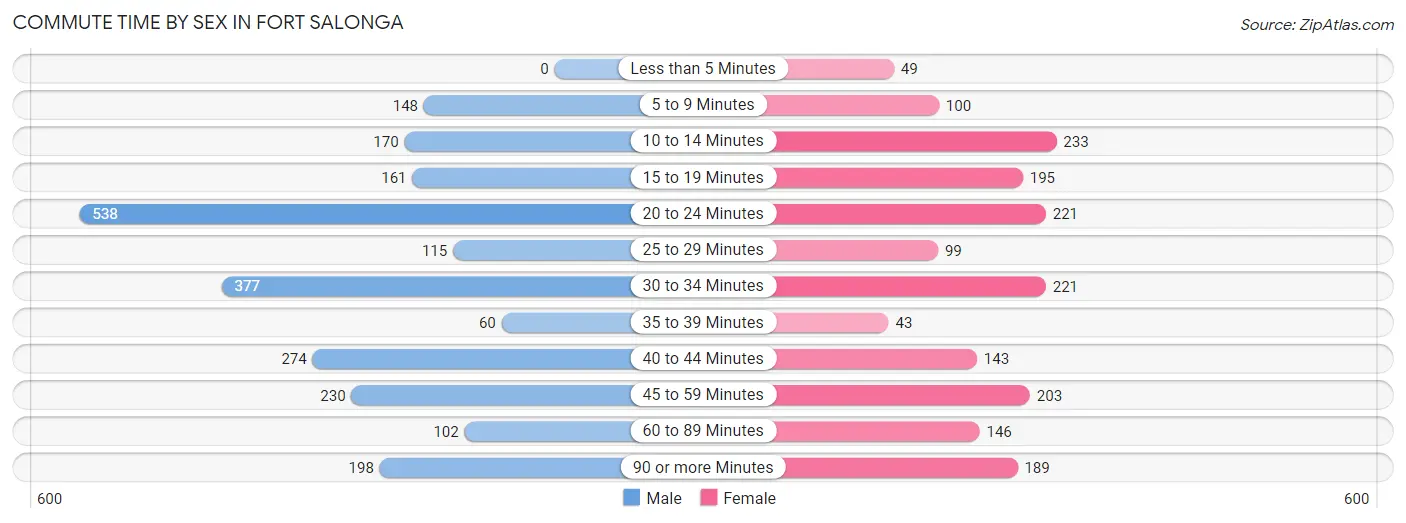
| Commute Time | Male | Female |
| Less than 5 Minutes | 0 (0.0%) | 49 (2.7%) |
| 5 to 9 Minutes | 148 (6.2%) | 100 (5.4%) |
| 10 to 14 Minutes | 170 (7.2%) | 233 (12.7%) |
| 15 to 19 Minutes | 161 (6.8%) | 195 (10.6%) |
| 20 to 24 Minutes | 538 (22.7%) | 221 (12.0%) |
| 25 to 29 Minutes | 115 (4.9%) | 99 (5.4%) |
| 30 to 34 Minutes | 377 (15.9%) | 221 (12.0%) |
| 35 to 39 Minutes | 60 (2.5%) | 43 (2.3%) |
| 40 to 44 Minutes | 274 (11.6%) | 143 (7.8%) |
| 45 to 59 Minutes | 230 (9.7%) | 203 (11.0%) |
| 60 to 89 Minutes | 102 (4.3%) | 146 (7.9%) |
| 90 or more Minutes | 198 (8.3%) | 189 (10.3%) |
Time of Departure to Work by Sex in Fort Salonga
The most frequent times of departure to work in Fort Salonga are 8:00 AM to 8:29 AM (513, 21.6%) for males and 8:00 AM to 8:29 AM (466, 25.3%) for females.
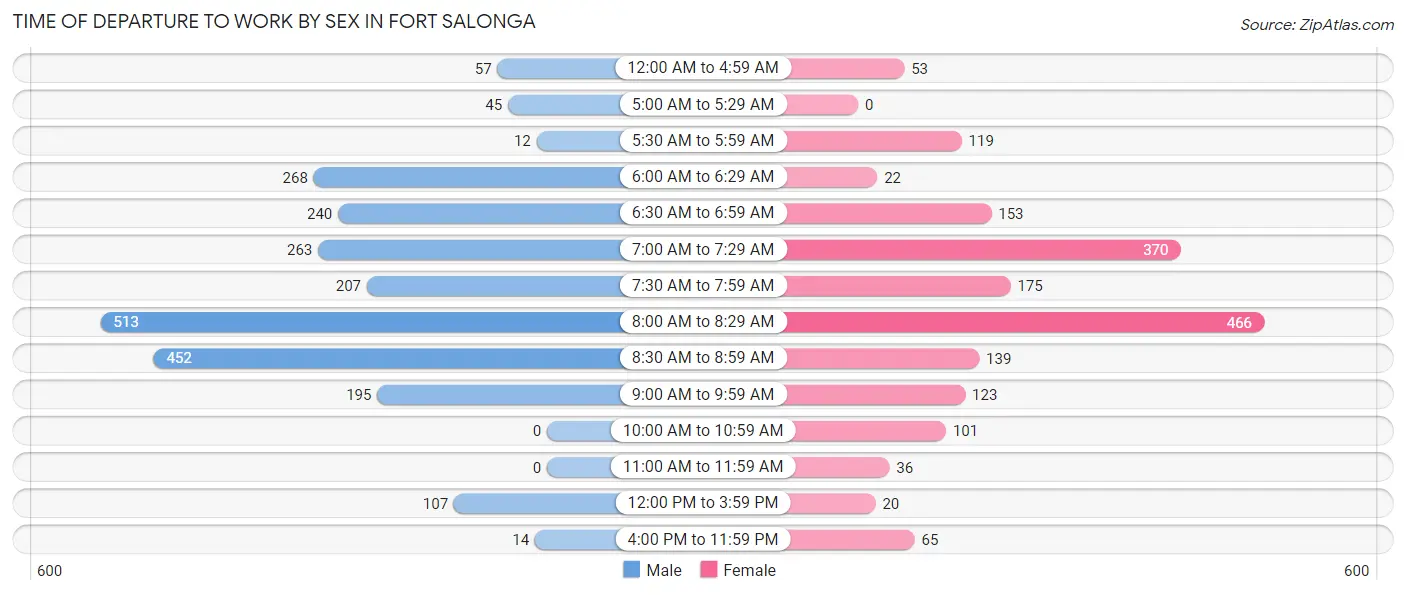
| Time of Departure | Male | Female |
| 12:00 AM to 4:59 AM | 57 (2.4%) | 53 (2.9%) |
| 5:00 AM to 5:29 AM | 45 (1.9%) | 0 (0.0%) |
| 5:30 AM to 5:59 AM | 12 (0.5%) | 119 (6.5%) |
| 6:00 AM to 6:29 AM | 268 (11.3%) | 22 (1.2%) |
| 6:30 AM to 6:59 AM | 240 (10.1%) | 153 (8.3%) |
| 7:00 AM to 7:29 AM | 263 (11.1%) | 370 (20.1%) |
| 7:30 AM to 7:59 AM | 207 (8.7%) | 175 (9.5%) |
| 8:00 AM to 8:29 AM | 513 (21.6%) | 466 (25.3%) |
| 8:30 AM to 8:59 AM | 452 (19.1%) | 139 (7.5%) |
| 9:00 AM to 9:59 AM | 195 (8.2%) | 123 (6.7%) |
| 10:00 AM to 10:59 AM | 0 (0.0%) | 101 (5.5%) |
| 11:00 AM to 11:59 AM | 0 (0.0%) | 36 (1.9%) |
| 12:00 PM to 3:59 PM | 107 (4.5%) | 20 (1.1%) |
| 4:00 PM to 11:59 PM | 14 (0.6%) | 65 (3.5%) |
| Total | 2,373 (100.0%) | 1,842 (100.0%) |
Housing Occupancy in Fort Salonga
Occupancy by Ownership in Fort Salonga
Of the total 3,359 dwellings in Fort Salonga, owner-occupied units account for 3,256 (96.9%), while renter-occupied units make up 103 (3.1%).
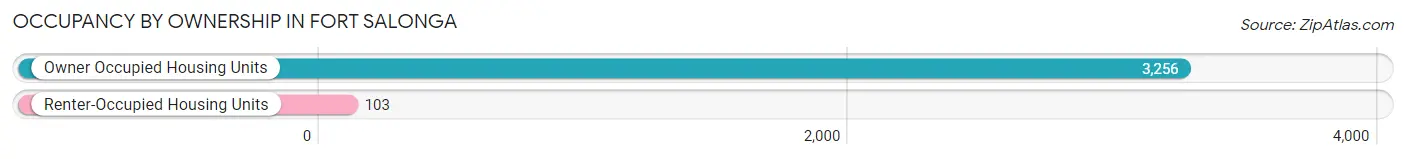
| Occupancy | # Housing Units | % Housing Units |
| Owner Occupied Housing Units | 3,256 | 96.9% |
| Renter-Occupied Housing Units | 103 | 3.1% |
| Total Occupied Housing Units | 3,359 | 100.0% |
Occupancy by Household Size in Fort Salonga
| Household Size | # Housing Units | % Housing Units |
| 1-Person Household | 621 | 18.5% |
| 2-Person Household | 1,179 | 35.1% |
| 3-Person Household | 611 | 18.2% |
| 4+ Person Household | 948 | 28.2% |
| Total Housing Units | 3,359 | 100.0% |
Occupancy by Ownership by Household Size in Fort Salonga
| Household Size | Owner-occupied | Renter-occupied |
| 1-Person Household | 599 (96.5%) | 22 (3.5%) |
| 2-Person Household | 1,109 (94.1%) | 70 (5.9%) |
| 3-Person Household | 604 (98.9%) | 7 (1.1%) |
| 4+ Person Household | 944 (99.6%) | 4 (0.4%) |
| Total Housing Units | 3,256 (96.9%) | 103 (3.1%) |
Occupancy by Educational Attainment in Fort Salonga
| Household Size | Owner-occupied | Renter-occupied |
| Less than High School | 28 (100.0%) | 0 (0.0%) |
| High School Diploma | 450 (96.8%) | 15 (3.2%) |
| College/Associate Degree | 553 (100.0%) | 0 (0.0%) |
| Bachelor's Degree or higher | 2,225 (96.2%) | 88 (3.8%) |
Occupancy by Age of Householder in Fort Salonga
| Age Bracket | # Households | % Households |
| Under 35 Years | 216 | 6.4% |
| 35 to 44 Years | 356 | 10.6% |
| 45 to 54 Years | 696 | 20.7% |
| 55 to 64 Years | 1,035 | 30.8% |
| 65 to 74 Years | 474 | 14.1% |
| 75 to 84 Years | 495 | 14.7% |
| 85 Years and Over | 87 | 2.6% |
| Total | 3,359 | 100.0% |
Housing Finances in Fort Salonga
Median Income by Occupancy in Fort Salonga
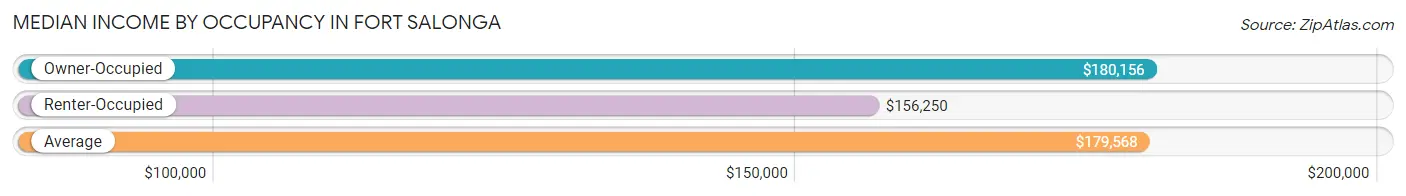
| Occupancy Type | # Households | Median Income |
| Owner-Occupied | 3,256 (96.9%) | $180,156 |
| Renter-Occupied | 103 (3.1%) | $156,250 |
| Average | 3,359 (100.0%) | $179,568 |
Occupancy by Householder Income Bracket in Fort Salonga
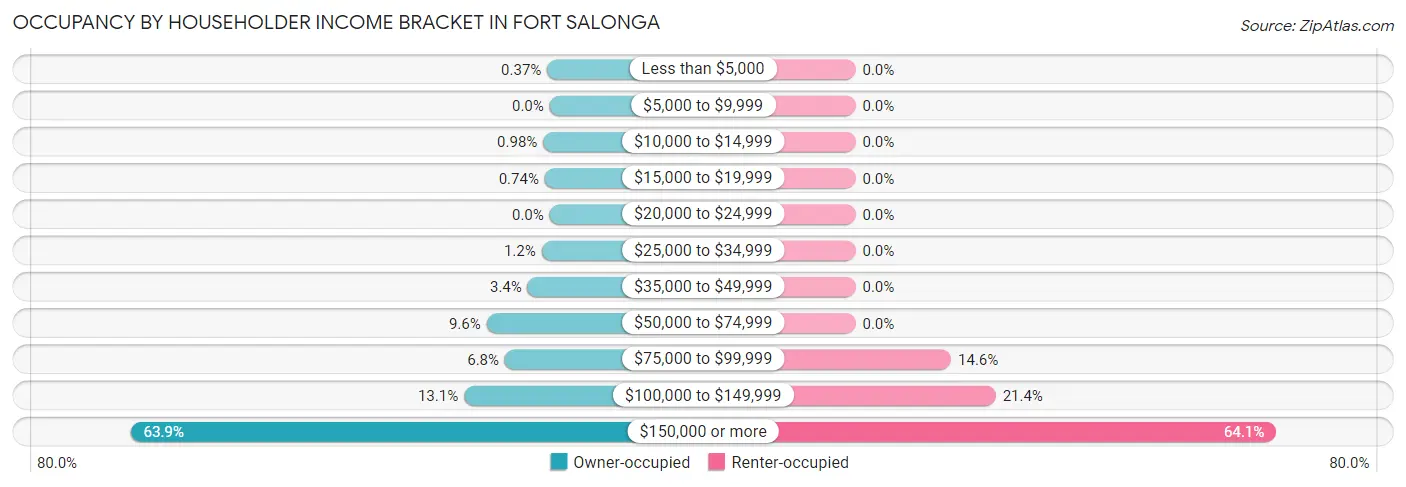
| Income Bracket | Owner-occupied | Renter-occupied |
| Less than $5,000 | 12 (0.4%) | 0 (0.0%) |
| $5,000 to $9,999 | 0 (0.0%) | 0 (0.0%) |
| $10,000 to $14,999 | 32 (1.0%) | 0 (0.0%) |
| $15,000 to $19,999 | 24 (0.7%) | 0 (0.0%) |
| $20,000 to $24,999 | 0 (0.0%) | 0 (0.0%) |
| $25,000 to $34,999 | 40 (1.2%) | 0 (0.0%) |
| $35,000 to $49,999 | 109 (3.4%) | 0 (0.0%) |
| $50,000 to $74,999 | 313 (9.6%) | 0 (0.0%) |
| $75,000 to $99,999 | 222 (6.8%) | 15 (14.6%) |
| $100,000 to $149,999 | 425 (13.1%) | 22 (21.4%) |
| $150,000 or more | 2,079 (63.8%) | 66 (64.1%) |
| Total | 3,256 (100.0%) | 103 (100.0%) |
Monthly Housing Cost Tiers in Fort Salonga
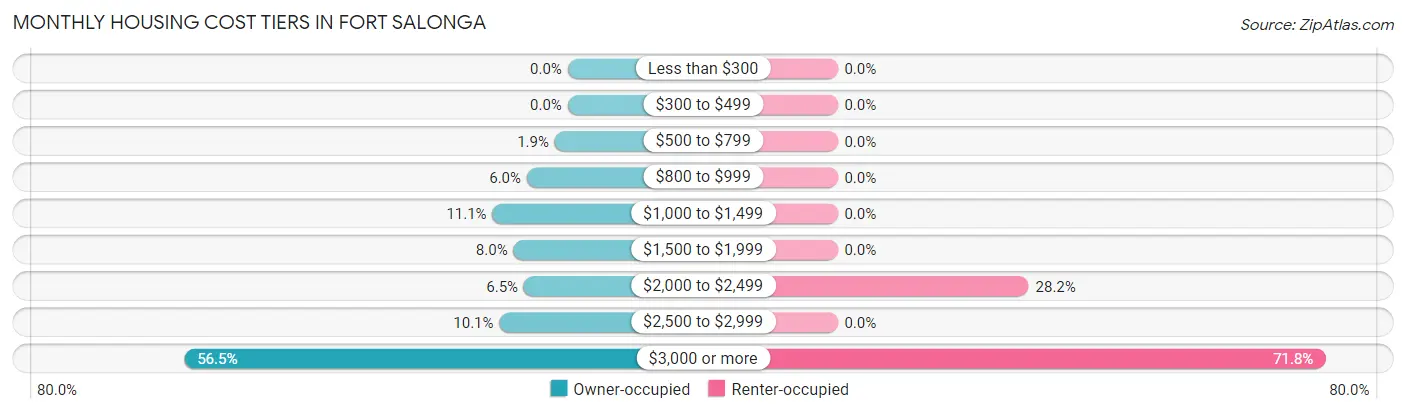
| Monthly Cost | Owner-occupied | Renter-occupied |
| Less than $300 | 0 (0.0%) | 0 (0.0%) |
| $300 to $499 | 0 (0.0%) | 0 (0.0%) |
| $500 to $799 | 62 (1.9%) | 0 (0.0%) |
| $800 to $999 | 196 (6.0%) | 0 (0.0%) |
| $1,000 to $1,499 | 361 (11.1%) | 0 (0.0%) |
| $1,500 to $1,999 | 260 (8.0%) | 0 (0.0%) |
| $2,000 to $2,499 | 210 (6.5%) | 29 (28.2%) |
| $2,500 to $2,999 | 328 (10.1%) | 0 (0.0%) |
| $3,000 or more | 1,839 (56.5%) | 74 (71.8%) |
| Total | 3,256 (100.0%) | 103 (100.0%) |
Physical Housing Characteristics in Fort Salonga
Housing Structures in Fort Salonga
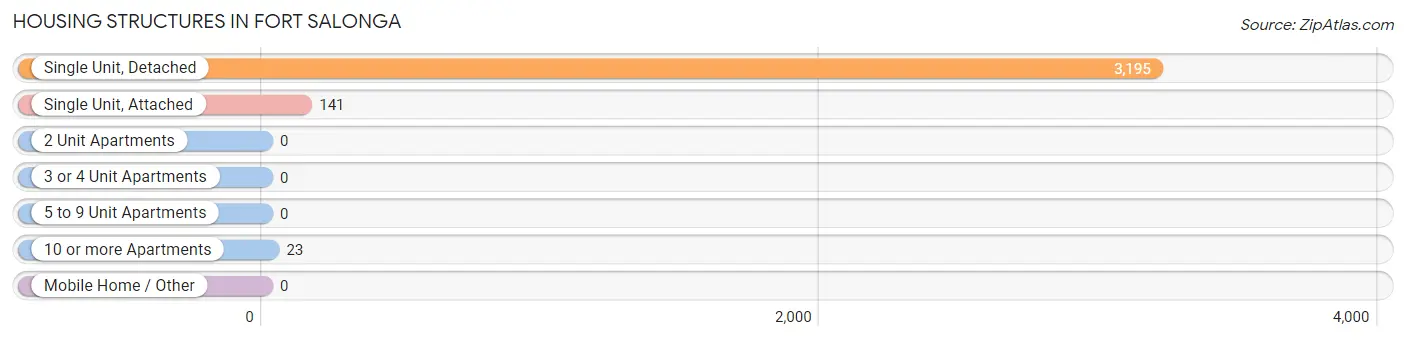
| Structure Type | # Housing Units | % Housing Units |
| Single Unit, Detached | 3,195 | 95.1% |
| Single Unit, Attached | 141 | 4.2% |
| 2 Unit Apartments | 0 | 0.0% |
| 3 or 4 Unit Apartments | 0 | 0.0% |
| 5 to 9 Unit Apartments | 0 | 0.0% |
| 10 or more Apartments | 23 | 0.7% |
| Mobile Home / Other | 0 | 0.0% |
| Total | 3,359 | 100.0% |
Housing Structures by Occupancy in Fort Salonga
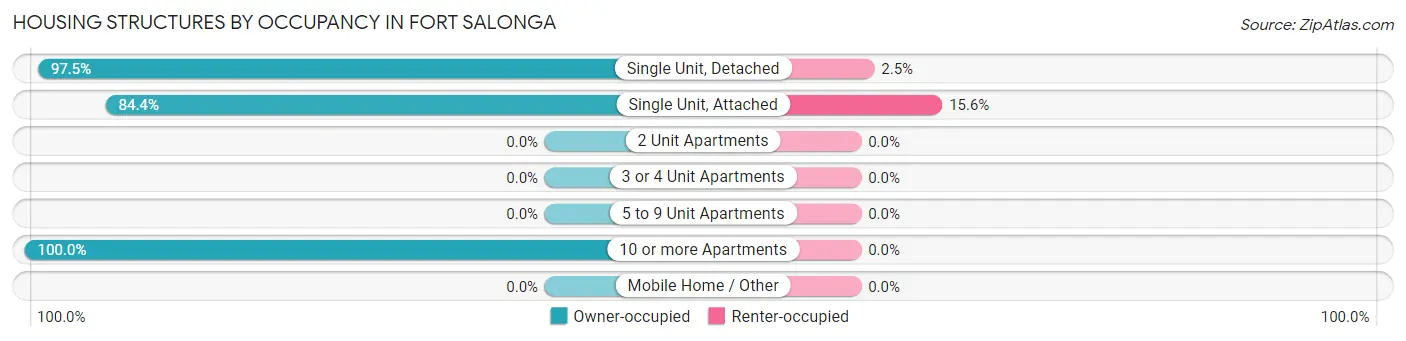
| Structure Type | Owner-occupied | Renter-occupied |
| Single Unit, Detached | 3,114 (97.5%) | 81 (2.5%) |
| Single Unit, Attached | 119 (84.4%) | 22 (15.6%) |
| 2 Unit Apartments | 0 (0.0%) | 0 (0.0%) |
| 3 or 4 Unit Apartments | 0 (0.0%) | 0 (0.0%) |
| 5 to 9 Unit Apartments | 0 (0.0%) | 0 (0.0%) |
| 10 or more Apartments | 23 (100.0%) | 0 (0.0%) |
| Mobile Home / Other | 0 (0.0%) | 0 (0.0%) |
| Total | 3,256 (96.9%) | 103 (3.1%) |
Housing Structures by Number of Rooms in Fort Salonga
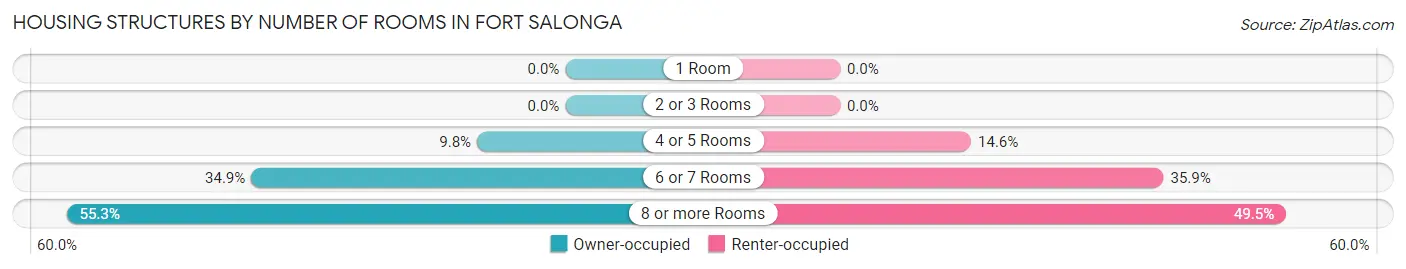
| Number of Rooms | Owner-occupied | Renter-occupied |
| 1 Room | 0 (0.0%) | 0 (0.0%) |
| 2 or 3 Rooms | 0 (0.0%) | 0 (0.0%) |
| 4 or 5 Rooms | 319 (9.8%) | 15 (14.6%) |
| 6 or 7 Rooms | 1,135 (34.9%) | 37 (35.9%) |
| 8 or more Rooms | 1,802 (55.3%) | 51 (49.5%) |
| Total | 3,256 (100.0%) | 103 (100.0%) |
Housing Structure by Heating Type in Fort Salonga
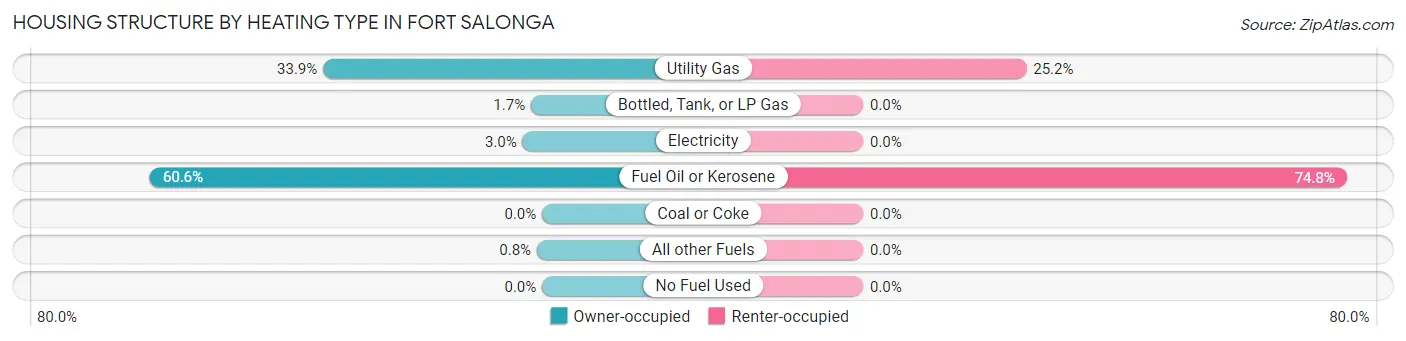
| Heating Type | Owner-occupied | Renter-occupied |
| Utility Gas | 1,102 (33.9%) | 26 (25.2%) |
| Bottled, Tank, or LP Gas | 56 (1.7%) | 0 (0.0%) |
| Electricity | 98 (3.0%) | 0 (0.0%) |
| Fuel Oil or Kerosene | 1,974 (60.6%) | 77 (74.8%) |
| Coal or Coke | 0 (0.0%) | 0 (0.0%) |
| All other Fuels | 26 (0.8%) | 0 (0.0%) |
| No Fuel Used | 0 (0.0%) | 0 (0.0%) |
| Total | 3,256 (100.0%) | 103 (100.0%) |
Household Vehicle Usage in Fort Salonga
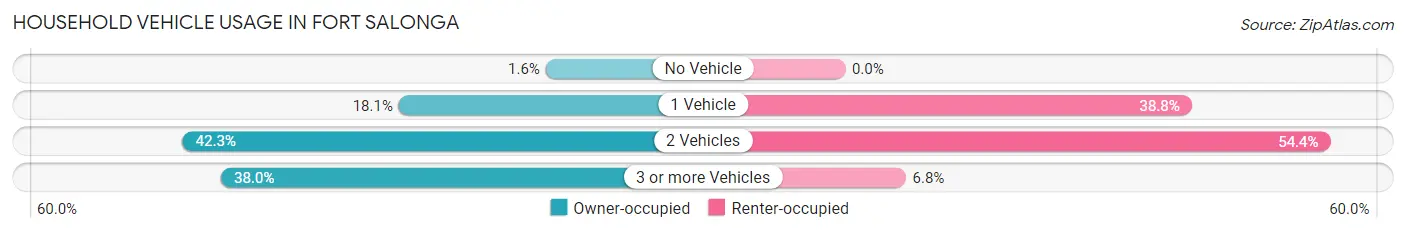
| Vehicles per Household | Owner-occupied | Renter-occupied |
| No Vehicle | 53 (1.6%) | 0 (0.0%) |
| 1 Vehicle | 589 (18.1%) | 40 (38.8%) |
| 2 Vehicles | 1,377 (42.3%) | 56 (54.4%) |
| 3 or more Vehicles | 1,237 (38.0%) | 7 (6.8%) |
| Total | 3,256 (100.0%) | 103 (100.0%) |
Real Estate & Mortgages in Fort Salonga
Real Estate and Mortgage Overview in Fort Salonga
| Characteristic | Without Mortgage | With Mortgage |
| Housing Units | 1,218 | 2,038 |
| Median Property Value | $705,000 | $800,700 |
| Median Household Income | $119,904 | $1,539 |
| Monthly Housing Costs | $1,484 | $1,702 |
| Real Estate Taxes | $10,001 | $18 |
Property Value by Mortgage Status in Fort Salonga
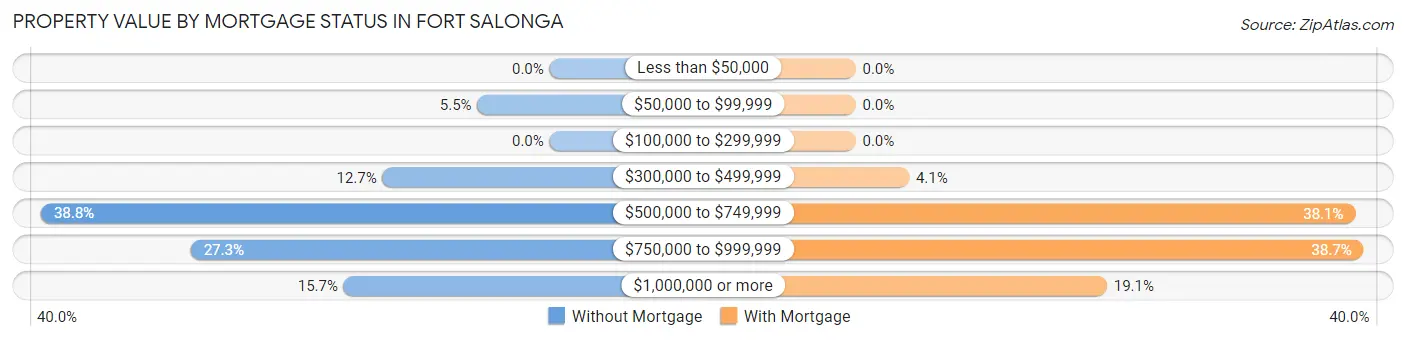
| Property Value | Without Mortgage | With Mortgage |
| Less than $50,000 | 0 (0.0%) | 0 (0.0%) |
| $50,000 to $99,999 | 67 (5.5%) | 0 (0.0%) |
| $100,000 to $299,999 | 0 (0.0%) | 0 (0.0%) |
| $300,000 to $499,999 | 155 (12.7%) | 83 (4.1%) |
| $500,000 to $749,999 | 472 (38.8%) | 776 (38.1%) |
| $750,000 to $999,999 | 333 (27.3%) | 789 (38.7%) |
| $1,000,000 or more | 191 (15.7%) | 390 (19.1%) |
| Total | 1,218 (100.0%) | 2,038 (100.0%) |
Household Income by Mortgage Status in Fort Salonga
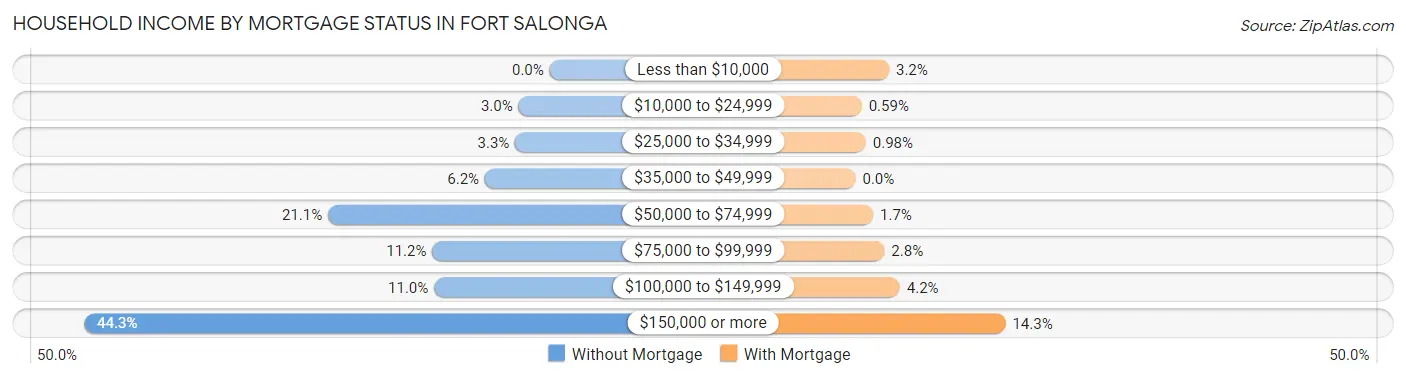
| Household Income | Without Mortgage | With Mortgage |
| Less than $10,000 | 0 (0.0%) | 65 (3.2%) |
| $10,000 to $24,999 | 36 (3.0%) | 12 (0.6%) |
| $25,000 to $34,999 | 40 (3.3%) | 20 (1.0%) |
| $35,000 to $49,999 | 75 (6.2%) | 0 (0.0%) |
| $50,000 to $74,999 | 257 (21.1%) | 34 (1.7%) |
| $75,000 to $99,999 | 136 (11.2%) | 56 (2.8%) |
| $100,000 to $149,999 | 134 (11.0%) | 86 (4.2%) |
| $150,000 or more | 540 (44.3%) | 291 (14.3%) |
| Total | 1,218 (100.0%) | 2,038 (100.0%) |
Property Value to Household Income Ratio in Fort Salonga
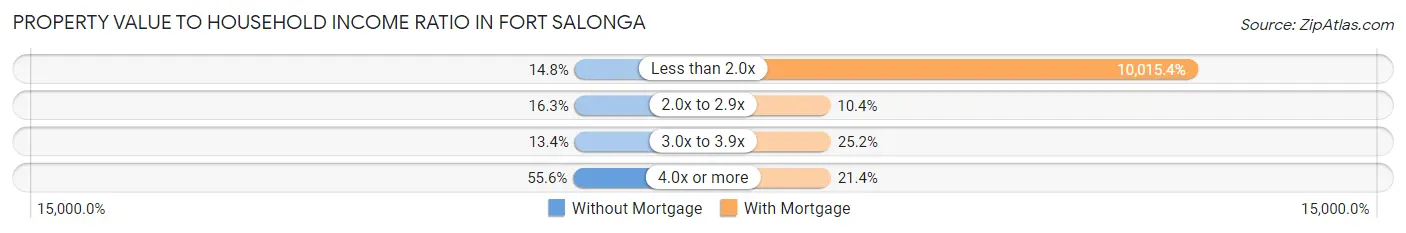
| Value-to-Income Ratio | Without Mortgage | With Mortgage |
| Less than 2.0x | 180 (14.8%) | 204,113 (10,015.4%) |
| 2.0x to 2.9x | 198 (16.3%) | 212 (10.4%) |
| 3.0x to 3.9x | 163 (13.4%) | 513 (25.2%) |
| 4.0x or more | 677 (55.6%) | 436 (21.4%) |
| Total | 1,218 (100.0%) | 2,038 (100.0%) |
Real Estate Taxes by Mortgage Status in Fort Salonga
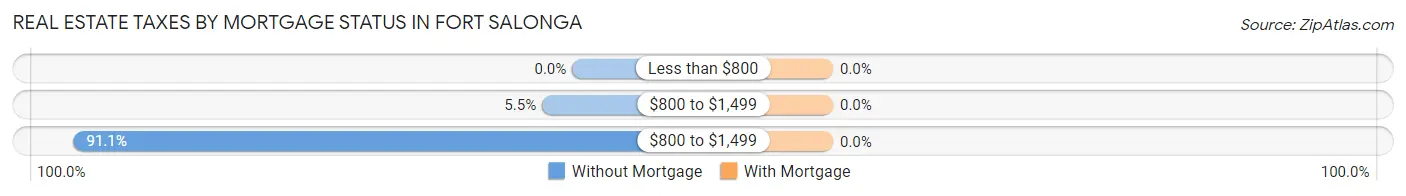
| Property Taxes | Without Mortgage | With Mortgage |
| Less than $800 | 0 (0.0%) | 0 (0.0%) |
| $800 to $1,499 | 67 (5.5%) | 0 (0.0%) |
| $800 to $1,499 | 1,109 (91.0%) | 0 (0.0%) |
| Total | 1,218 (100.0%) | 2,038 (100.0%) |
Health & Disability in Fort Salonga
Health Insurance Coverage by Age in Fort Salonga
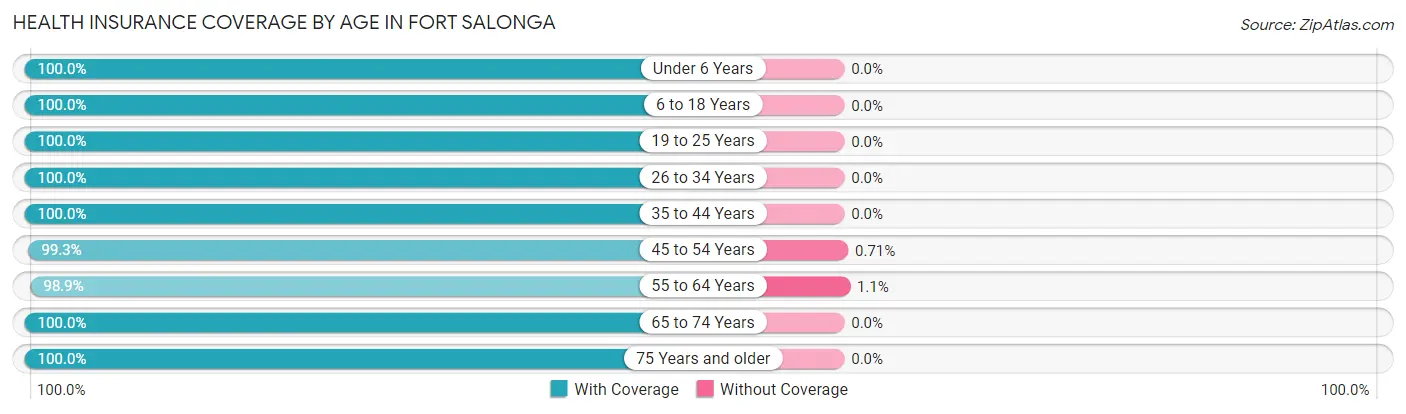
| Age Bracket | With Coverage | Without Coverage |
| Under 6 Years | 517 (100.0%) | 0 (0.0%) |
| 6 to 18 Years | 1,603 (100.0%) | 0 (0.0%) |
| 19 to 25 Years | 908 (100.0%) | 0 (0.0%) |
| 26 to 34 Years | 753 (100.0%) | 0 (0.0%) |
| 35 to 44 Years | 917 (100.0%) | 0 (0.0%) |
| 45 to 54 Years | 1,400 (99.3%) | 10 (0.7%) |
| 55 to 64 Years | 1,686 (98.9%) | 18 (1.1%) |
| 65 to 74 Years | 976 (100.0%) | 0 (0.0%) |
| 75 Years and older | 916 (100.0%) | 0 (0.0%) |
| Total | 9,676 (99.7%) | 28 (0.3%) |
Health Insurance Coverage by Citizenship Status in Fort Salonga
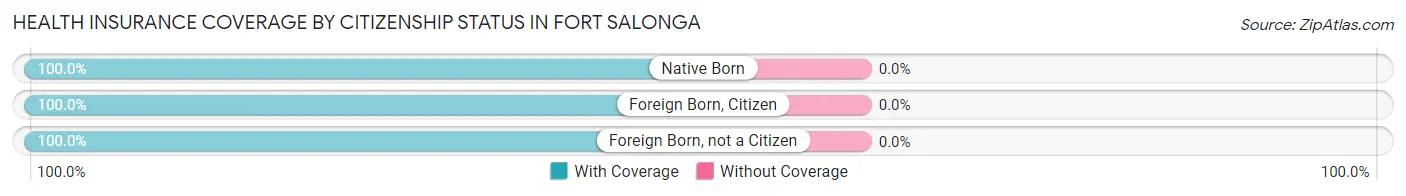
| Citizenship Status | With Coverage | Without Coverage |
| Native Born | 517 (100.0%) | 0 (0.0%) |
| Foreign Born, Citizen | 1,603 (100.0%) | 0 (0.0%) |
| Foreign Born, not a Citizen | 908 (100.0%) | 0 (0.0%) |
Health Insurance Coverage by Household Income in Fort Salonga
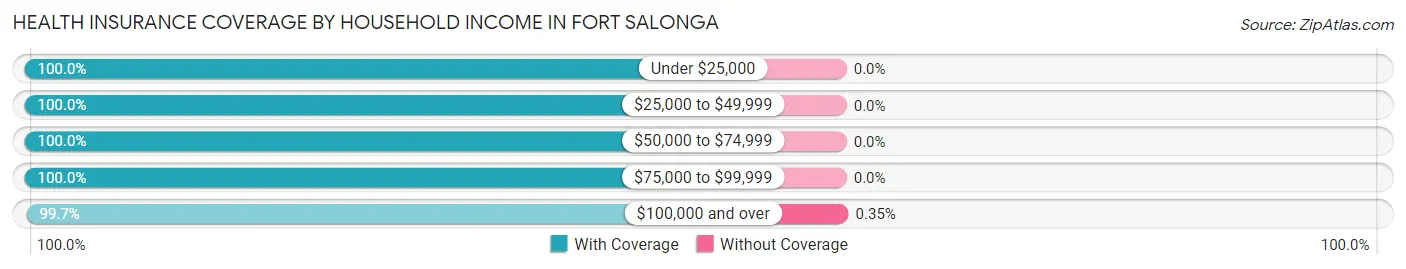
| Household Income | With Coverage | Without Coverage |
| Under $25,000 | 116 (100.0%) | 0 (0.0%) |
| $25,000 to $49,999 | 211 (100.0%) | 0 (0.0%) |
| $50,000 to $74,999 | 519 (100.0%) | 0 (0.0%) |
| $75,000 to $99,999 | 656 (100.0%) | 0 (0.0%) |
| $100,000 and over | 8,059 (99.7%) | 28 (0.4%) |
Public vs Private Health Insurance Coverage by Age in Fort Salonga
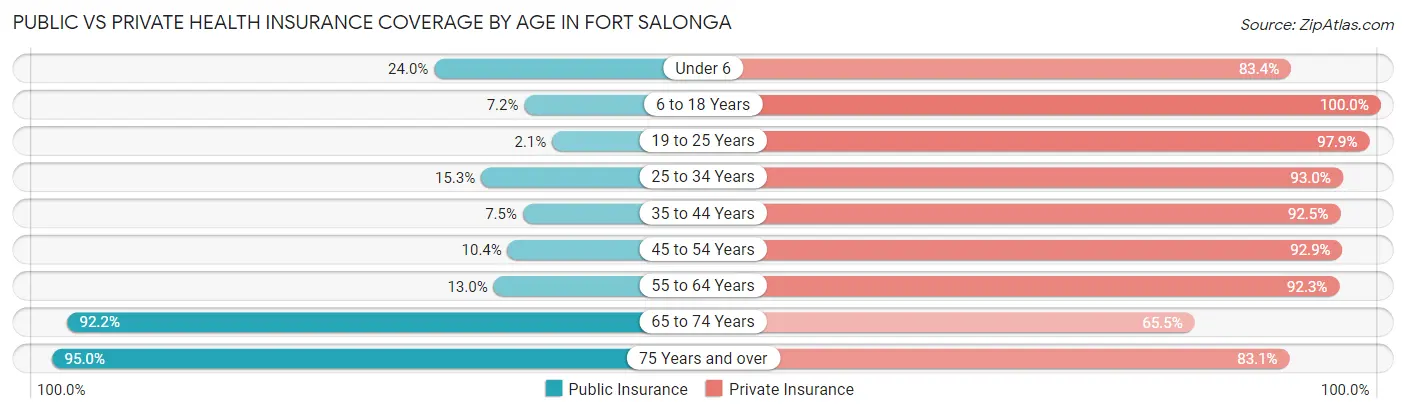
| Age Bracket | Public Insurance | Private Insurance |
| Under 6 | 124 (24.0%) | 431 (83.4%) |
| 6 to 18 Years | 116 (7.2%) | 1,603 (100.0%) |
| 19 to 25 Years | 19 (2.1%) | 889 (97.9%) |
| 25 to 34 Years | 115 (15.3%) | 700 (93.0%) |
| 35 to 44 Years | 69 (7.5%) | 848 (92.5%) |
| 45 to 54 Years | 146 (10.3%) | 1,310 (92.9%) |
| 55 to 64 Years | 221 (13.0%) | 1,573 (92.3%) |
| 65 to 74 Years | 900 (92.2%) | 639 (65.5%) |
| 75 Years and over | 870 (95.0%) | 761 (83.1%) |
| Total | 2,580 (26.6%) | 8,754 (90.2%) |
Disability Status by Sex by Age in Fort Salonga
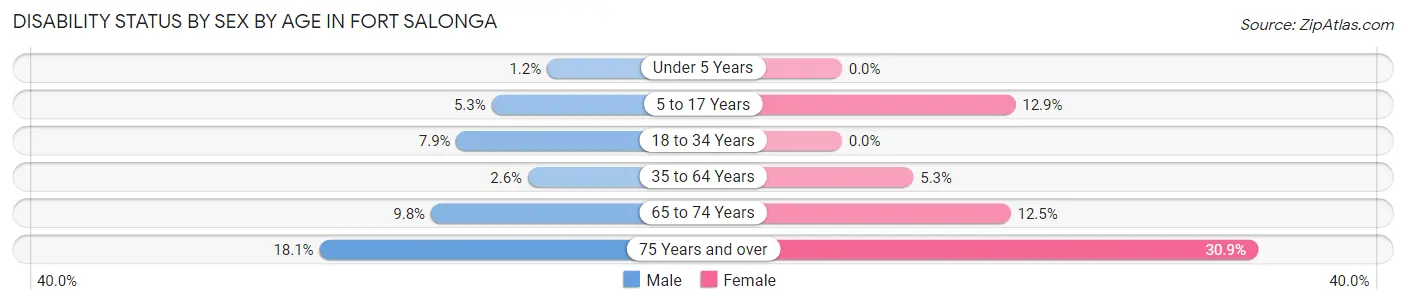
| Age Bracket | Male | Female |
| Under 5 Years | 3 (1.2%) | 0 (0.0%) |
| 5 to 17 Years | 38 (5.3%) | 106 (12.9%) |
| 18 to 34 Years | 80 (7.9%) | 0 (0.0%) |
| 35 to 64 Years | 51 (2.6%) | 111 (5.3%) |
| 65 to 74 Years | 52 (9.8%) | 56 (12.5%) |
| 75 Years and over | 92 (18.1%) | 126 (30.9%) |
Disability Class by Sex by Age in Fort Salonga
Disability Class: Hearing Difficulty
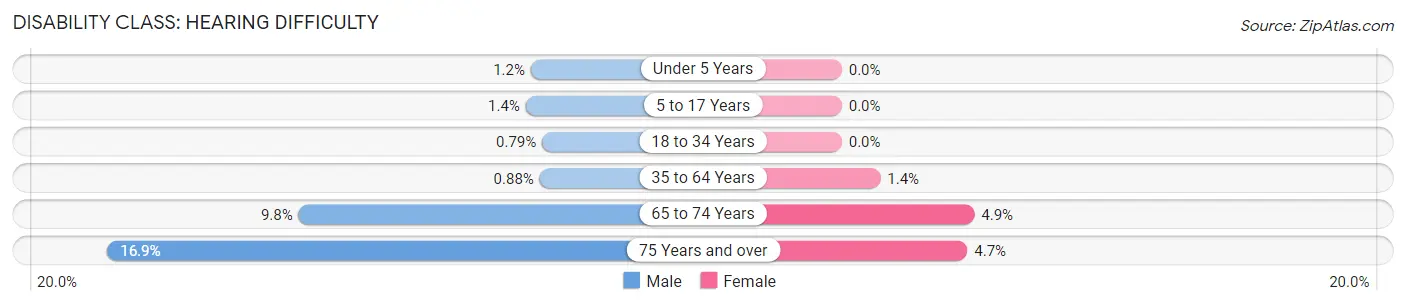
| Age Bracket | Male | Female |
| Under 5 Years | 3 (1.2%) | 0 (0.0%) |
| 5 to 17 Years | 10 (1.4%) | 0 (0.0%) |
| 18 to 34 Years | 8 (0.8%) | 0 (0.0%) |
| 35 to 64 Years | 17 (0.9%) | 30 (1.4%) |
| 65 to 74 Years | 52 (9.8%) | 22 (4.9%) |
| 75 Years and over | 86 (16.9%) | 19 (4.7%) |
Disability Class: Vision Difficulty
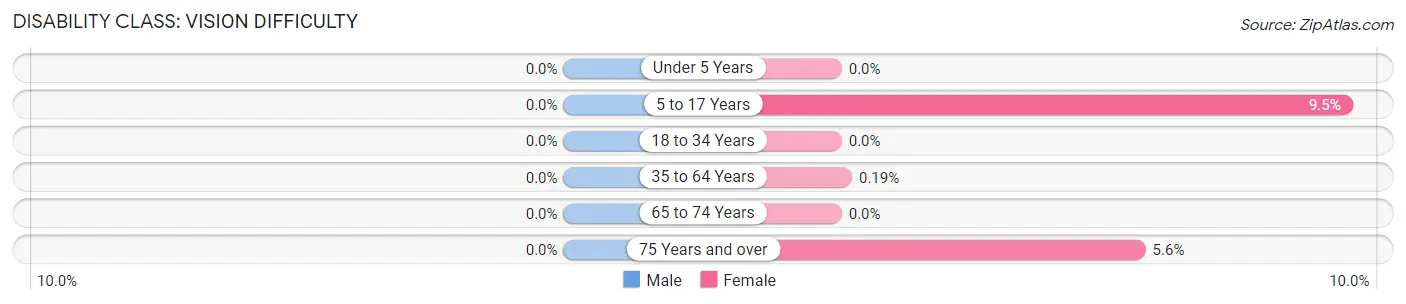
| Age Bracket | Male | Female |
| Under 5 Years | 0 (0.0%) | 0 (0.0%) |
| 5 to 17 Years | 0 (0.0%) | 78 (9.5%) |
| 18 to 34 Years | 0 (0.0%) | 0 (0.0%) |
| 35 to 64 Years | 0 (0.0%) | 4 (0.2%) |
| 65 to 74 Years | 0 (0.0%) | 0 (0.0%) |
| 75 Years and over | 0 (0.0%) | 23 (5.6%) |
Disability Class: Cognitive Difficulty
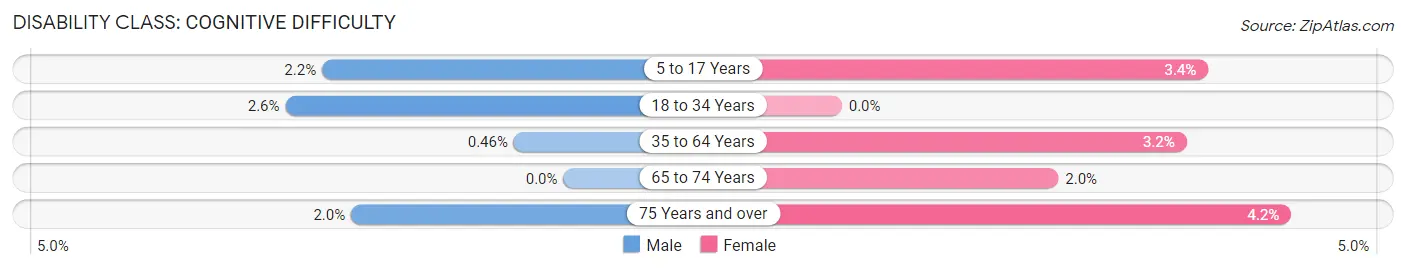
| Age Bracket | Male | Female |
| 5 to 17 Years | 16 (2.2%) | 28 (3.4%) |
| 18 to 34 Years | 26 (2.6%) | 0 (0.0%) |
| 35 to 64 Years | 9 (0.5%) | 67 (3.2%) |
| 65 to 74 Years | 0 (0.0%) | 9 (2.0%) |
| 75 Years and over | 10 (2.0%) | 17 (4.2%) |
Disability Class: Ambulatory Difficulty
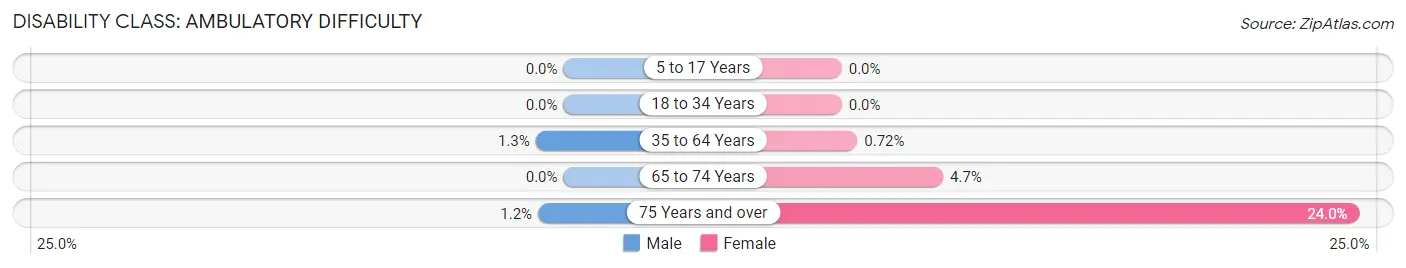
| Age Bracket | Male | Female |
| 5 to 17 Years | 0 (0.0%) | 0 (0.0%) |
| 18 to 34 Years | 0 (0.0%) | 0 (0.0%) |
| 35 to 64 Years | 25 (1.3%) | 15 (0.7%) |
| 65 to 74 Years | 0 (0.0%) | 21 (4.7%) |
| 75 Years and over | 6 (1.2%) | 98 (24.0%) |
Disability Class: Self-Care Difficulty
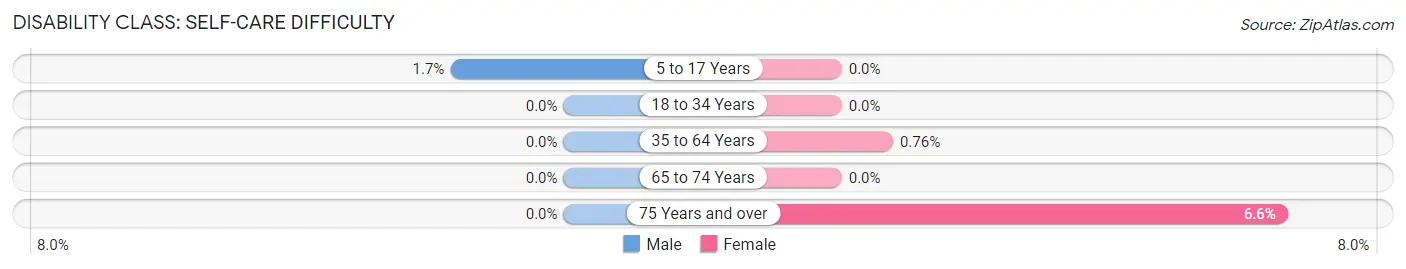
| Age Bracket | Male | Female |
| 5 to 17 Years | 12 (1.7%) | 0 (0.0%) |
| 18 to 34 Years | 0 (0.0%) | 0 (0.0%) |
| 35 to 64 Years | 0 (0.0%) | 16 (0.8%) |
| 65 to 74 Years | 0 (0.0%) | 0 (0.0%) |
| 75 Years and over | 0 (0.0%) | 27 (6.6%) |
Technology Access in Fort Salonga
Computing Device Access in Fort Salonga
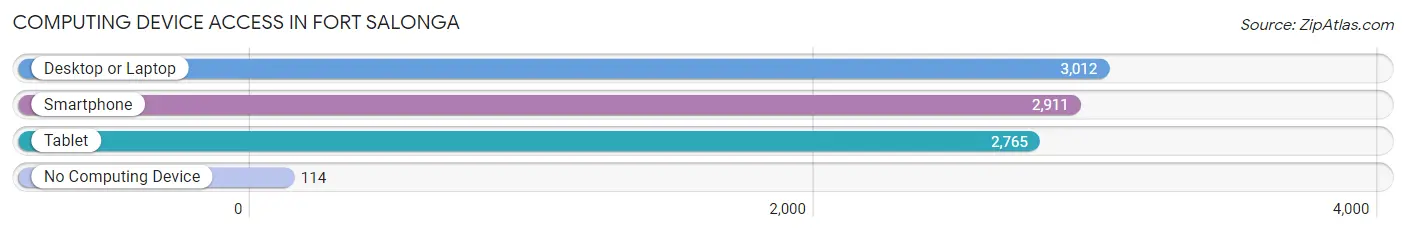
| Device Type | # Households | % Households |
| Desktop or Laptop | 3,012 | 89.7% |
| Smartphone | 2,911 | 86.7% |
| Tablet | 2,765 | 82.3% |
| No Computing Device | 114 | 3.4% |
| Total | 3,359 | 100.0% |
Internet Access in Fort Salonga
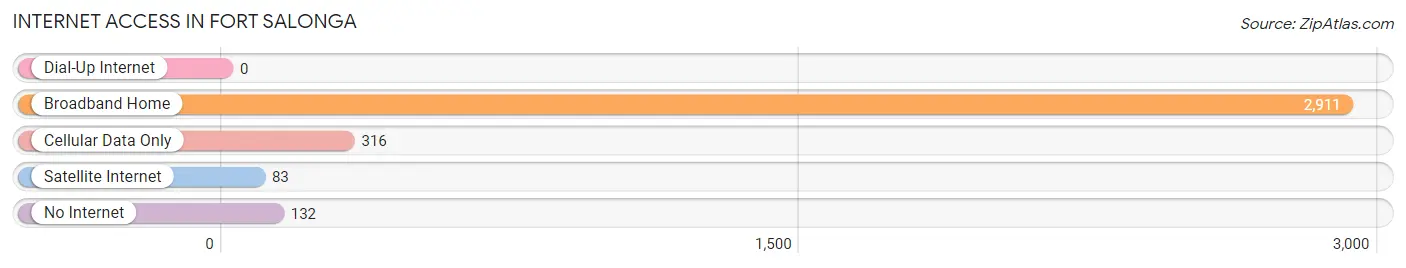
| Internet Type | # Households | % Households |
| Dial-Up Internet | 0 | 0.0% |
| Broadband Home | 2,911 | 86.7% |
| Cellular Data Only | 316 | 9.4% |
| Satellite Internet | 83 | 2.5% |
| No Internet | 132 | 3.9% |
| Total | 3,359 | 100.0% |
Fort Salonga Summary
Fort Salonga is a hamlet located in the Town of Huntington in Suffolk County, New York. It is situated on the north shore of Long Island, approximately 50 miles east of New York City. The hamlet is bordered by the hamlets of Northport to the east, Kings Park to the south, and Smithtown to the west.
History
The area that is now Fort Salonga was originally inhabited by the Matinecock Native American tribe. The first European settlers arrived in the area in the late 1600s, and the hamlet was officially established in 1750. The hamlet was named after a fort that was built in the area during the Revolutionary War. The fort was used to protect the area from British forces, and was named after a local Native American chief named Salonga.
The hamlet remained a rural farming community until the mid-1900s, when it began to experience rapid growth due to its proximity to New York City. The hamlet was officially incorporated in the Town of Huntington in 1967.
Geography
Fort Salonga is located on the north shore of Long Island, approximately 50 miles east of New York City. The hamlet is bordered by the hamlets of Northport to the east, Kings Park to the south, and Smithtown to the west. The hamlet is situated on the Long Island Sound, and is home to several beaches and parks.
The hamlet has a total area of 4.2 square miles, of which 3.9 square miles is land and 0.3 square miles is water. The hamlet is located in the Town of Huntington, which is part of Suffolk County.
Economy
Fort Salonga is primarily a residential community, and the majority of its residents are employed in the nearby cities of New York City and Long Island. The hamlet is home to several small businesses, including restaurants, retail stores, and professional services.
Demographics
As of the 2010 census, the population of Fort Salonga was 8,845. The population is predominantly white (90.2%), with small percentages of African American (3.2%), Asian (3.1%), and Hispanic or Latino (2.2%) residents. The median household income is $107,917, and the median age is 43.
The hamlet is served by the Commack School District, which includes four elementary schools, one middle school, and one high school. The hamlet is also home to several private schools, including St. John the Baptist Diocesan High School and St. Anthony's High School.
Common Questions
What is Per Capita Income in Fort Salonga?
Per Capita income in Fort Salonga is $76,977.
What is the Median Family Income in Fort Salonga?
Median Family Income in Fort Salonga is $200,114.
What is the Median Household income in Fort Salonga?
Median Household Income in Fort Salonga is $179,568.
What is Income or Wage Gap in Fort Salonga?
Income or Wage Gap in Fort Salonga is 24.0%.
Women in Fort Salonga earn 76.0 cents for every dollar earned by a man.
What is Inequality or Gini Index in Fort Salonga?
Inequality or Gini Index in Fort Salonga is 0.39.
What is the Total Population of Fort Salonga?
Total Population of Fort Salonga is 9,836.
What is the Total Male Population of Fort Salonga?
Total Male Population of Fort Salonga is 5,007.
What is the Total Female Population of Fort Salonga?
Total Female Population of Fort Salonga is 4,829.
What is the Ratio of Males per 100 Females in Fort Salonga?
There are 103.69 Males per 100 Females in Fort Salonga.
What is the Ratio of Females per 100 Males in Fort Salonga?
There are 96.44 Females per 100 Males in Fort Salonga.
What is the Median Population Age in Fort Salonga?
Median Population Age in Fort Salonga is 48.0 Years.
What is the Average Family Size in Fort Salonga
Average Family Size in Fort Salonga is 3.3 People.
What is the Average Household Size in Fort Salonga
Average Household Size in Fort Salonga is 2.9 People.
How Large is the Labor Force in Fort Salonga?
There are 5,194 People in the Labor Forcein in Fort Salonga.
What is the Percentage of People in the Labor Force in Fort Salonga?
63.2% of People are in the Labor Force in Fort Salonga.
What is the Unemployment Rate in Fort Salonga?
Unemployment Rate in Fort Salonga is 5.6%.