Poquott, NY Map & Demographics
Poquott Map
Poquott Overview
$115,040
PER CAPITA INCOME
$216,000
AVG FAMILY INCOME
$190,417
AVG HOUSEHOLD INCOME
36.1%
WAGE / INCOME GAP [ % ]
63.9¢/ $1
WAGE / INCOME GAP [ $ ]
$16,156
FAMILY INCOME DEFICIT
0.49
INEQUALITY / GINI INDEX
1,107
TOTAL POPULATION
608
MALE POPULATION
499
FEMALE POPULATION
121.84
MALES / 100 FEMALES
82.07
FEMALES / 100 MALES
43.7
MEDIAN AGE
3.3
AVG FAMILY SIZE
2.7
AVG HOUSEHOLD SIZE
616
LABOR FORCE [ PEOPLE ]
72.3%
PERCENT IN LABOR FORCE
2.6%
UNEMPLOYMENT RATE
Income in Poquott
Income Overview in Poquott
Per Capita Income in Poquott is $115,040, while median incomes of families and households are $216,000 and $190,417 respectively.
| Characteristic | Number | Measure |
| Per Capita Income | 1,107 | $115,040 |
| Median Family Income | 274 | $216,000 |
| Mean Family Income | 274 | $372,982 |
| Median Household Income | 405 | $190,417 |
| Mean Household Income | 405 | $314,902 |
| Income Deficit | 274 | $16,156 |
| Wage / Income Gap (%) | 1,107 | 36.08% |
| Wage / Income Gap ($) | 1,107 | 63.92¢ per $1 |
| Gini / Inequality Index | 1,107 | 0.49 |
Earnings by Sex in Poquott
Average Earnings in Poquott are $111,750, $130,625 for men and $83,500 for women, a difference of 36.1%.
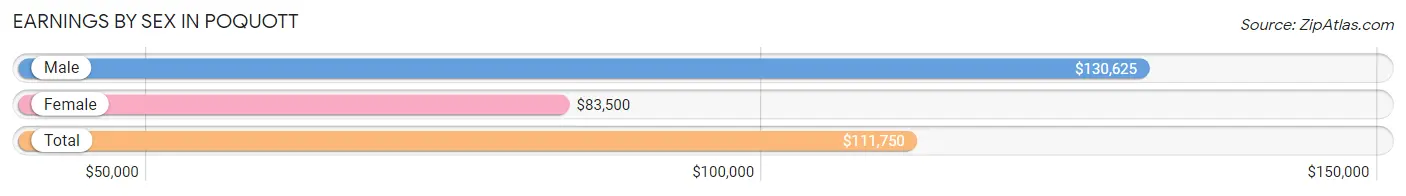
| Sex | Number | Average Earnings |
| Male | 365 (58.2%) | $130,625 |
| Female | 262 (41.8%) | $83,500 |
| Total | 627 (100.0%) | $111,750 |
Earnings by Sex by Income Bracket in Poquott
The most common earnings brackets in Poquott are $100,000+ for men (224 | 61.4%) and $100,000+ for women (113 | 43.1%).
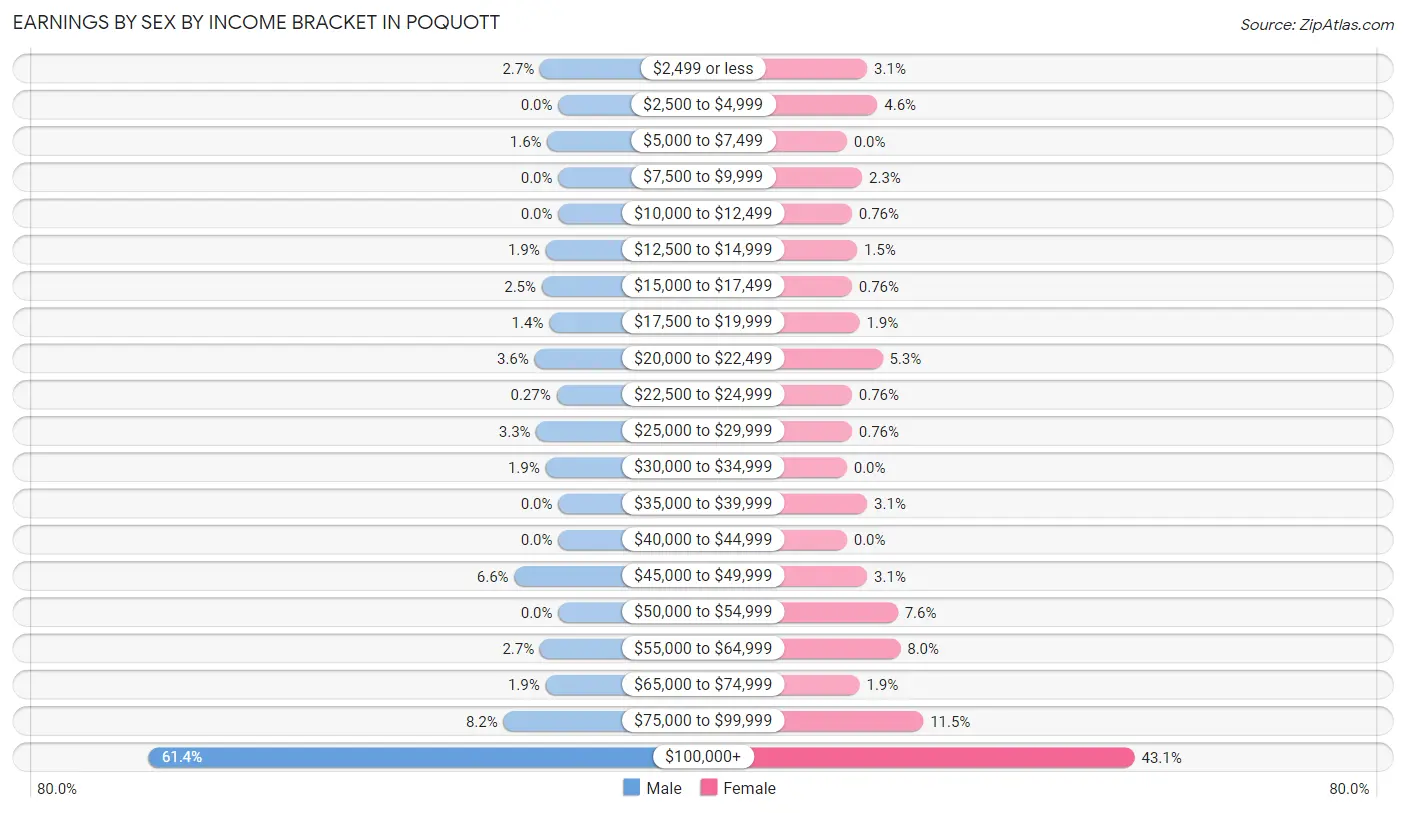
| Income | Male | Female |
| $2,499 or less | 10 (2.7%) | 8 (3.0%) |
| $2,500 to $4,999 | 0 (0.0%) | 12 (4.6%) |
| $5,000 to $7,499 | 6 (1.6%) | 0 (0.0%) |
| $7,500 to $9,999 | 0 (0.0%) | 6 (2.3%) |
| $10,000 to $12,499 | 0 (0.0%) | 2 (0.8%) |
| $12,500 to $14,999 | 7 (1.9%) | 4 (1.5%) |
| $15,000 to $17,499 | 9 (2.5%) | 2 (0.8%) |
| $17,500 to $19,999 | 5 (1.4%) | 5 (1.9%) |
| $20,000 to $22,499 | 13 (3.6%) | 14 (5.3%) |
| $22,500 to $24,999 | 1 (0.3%) | 2 (0.8%) |
| $25,000 to $29,999 | 12 (3.3%) | 2 (0.8%) |
| $30,000 to $34,999 | 7 (1.9%) | 0 (0.0%) |
| $35,000 to $39,999 | 0 (0.0%) | 8 (3.0%) |
| $40,000 to $44,999 | 0 (0.0%) | 0 (0.0%) |
| $45,000 to $49,999 | 24 (6.6%) | 8 (3.0%) |
| $50,000 to $54,999 | 0 (0.0%) | 20 (7.6%) |
| $55,000 to $64,999 | 10 (2.7%) | 21 (8.0%) |
| $65,000 to $74,999 | 7 (1.9%) | 5 (1.9%) |
| $75,000 to $99,999 | 30 (8.2%) | 30 (11.5%) |
| $100,000+ | 224 (61.4%) | 113 (43.1%) |
| Total | 365 (100.0%) | 262 (100.0%) |
Earnings by Sex by Educational Attainment in Poquott
Average earnings in Poquott are $146,422 for men and $96,500 for women, a difference of 34.1%. Men with an educational attainment of graduate degree enjoy the highest average annual earnings of $223,438, while those with high school diploma education earn the least with $46,528. Women with an educational attainment of graduate degree earn the most with the average annual earnings of $166,250, while those with college or associate's degree education have the smallest earnings of $64,583.
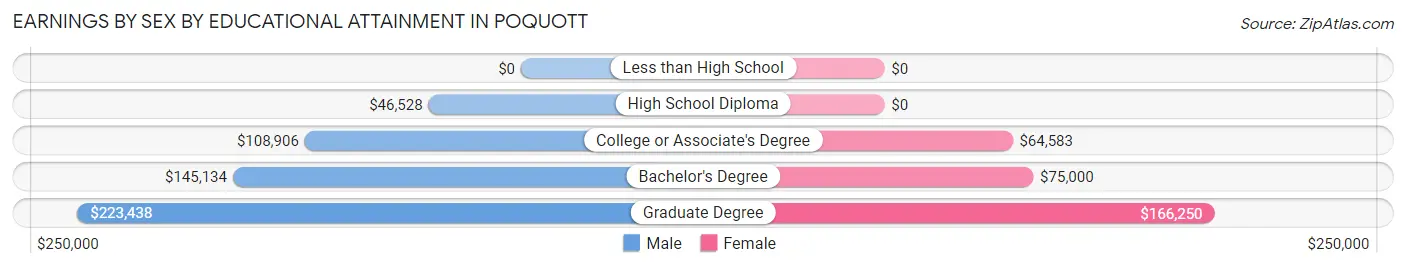
| Educational Attainment | Male Income | Female Income |
| Less than High School | - | - |
| High School Diploma | $46,528 | $0 |
| College or Associate's Degree | $108,906 | $64,583 |
| Bachelor's Degree | $145,134 | $75,000 |
| Graduate Degree | $223,438 | $166,250 |
| Total | $146,422 | $96,500 |
Family Income in Poquott
Family Income Brackets in Poquott
According to the Poquott family income data, there are 160 families falling into the $200,000+ income range, which is the most common income bracket and makes up 58.4% of all families. Conversely, the $10,000 to $14,999 income bracket is the least frequent group with only 2 families (0.7%) belonging to this category.
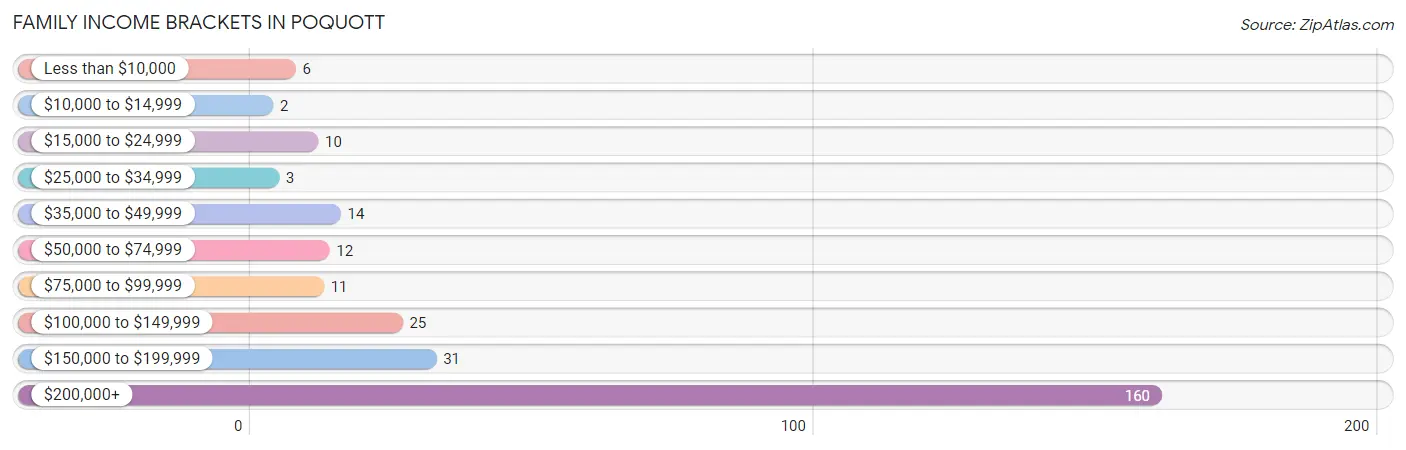
| Income Bracket | # Families | % Families |
| Less than $10,000 | 6 | 2.2% |
| $10,000 to $14,999 | 2 | 0.7% |
| $15,000 to $24,999 | 10 | 3.6% |
| $25,000 to $34,999 | 3 | 1.1% |
| $35,000 to $49,999 | 14 | 5.1% |
| $50,000 to $74,999 | 12 | 4.4% |
| $75,000 to $99,999 | 11 | 4.0% |
| $100,000 to $149,999 | 25 | 9.1% |
| $150,000 to $199,999 | 31 | 11.3% |
| $200,000+ | 160 | 58.4% |
Family Income by Famaliy Size in Poquott
4-person families (67 | 24.4%) account for the highest median family income in Poquott with $250,001 per family, while 2-person families (97 | 35.4%) have the highest median income of $88,802 per family member.
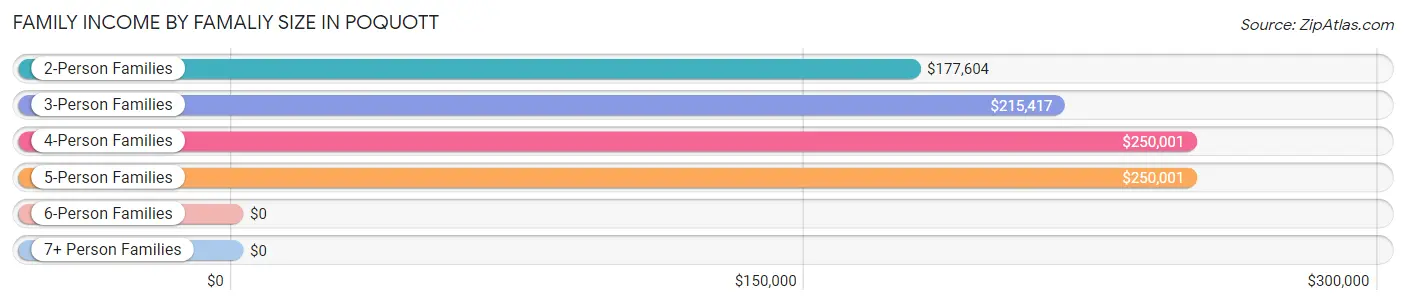
| Income Bracket | # Families | Median Income |
| 2-Person Families | 97 (35.4%) | $177,604 |
| 3-Person Families | 75 (27.4%) | $215,417 |
| 4-Person Families | 67 (24.4%) | $250,001 |
| 5-Person Families | 33 (12.0%) | $250,001 |
| 6-Person Families | 0 (0.0%) | $0 |
| 7+ Person Families | 2 (0.7%) | $0 |
| Total | 274 (100.0%) | $216,000 |
Family Income by Number of Earners in Poquott
The median family income in Poquott is $216,000, with families comprising 2 earners (114) having the highest median family income of $250,001, while families with no earners (35) have the lowest median family income of $138,958, accounting for 41.6% and 12.8% of families, respectively.
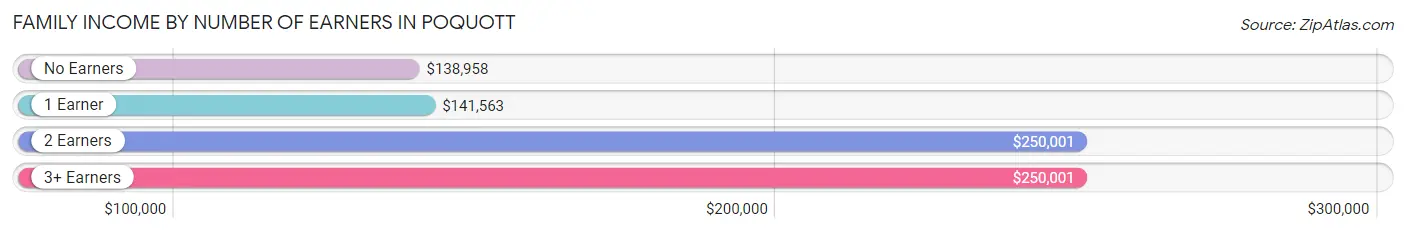
| Number of Earners | # Families | Median Income |
| No Earners | 35 (12.8%) | $138,958 |
| 1 Earner | 83 (30.3%) | $141,563 |
| 2 Earners | 114 (41.6%) | $250,001 |
| 3+ Earners | 42 (15.3%) | $250,001 |
| Total | 274 (100.0%) | $216,000 |
Household Income in Poquott
Household Income Brackets in Poquott
With 186 households falling in the category, the $200,000+ income range is the most frequent in Poquott, accounting for 45.9% of all households. In contrast, only 3 households (0.7%) fall into the $15,000 to $24,999 income bracket, making it the least populous group.
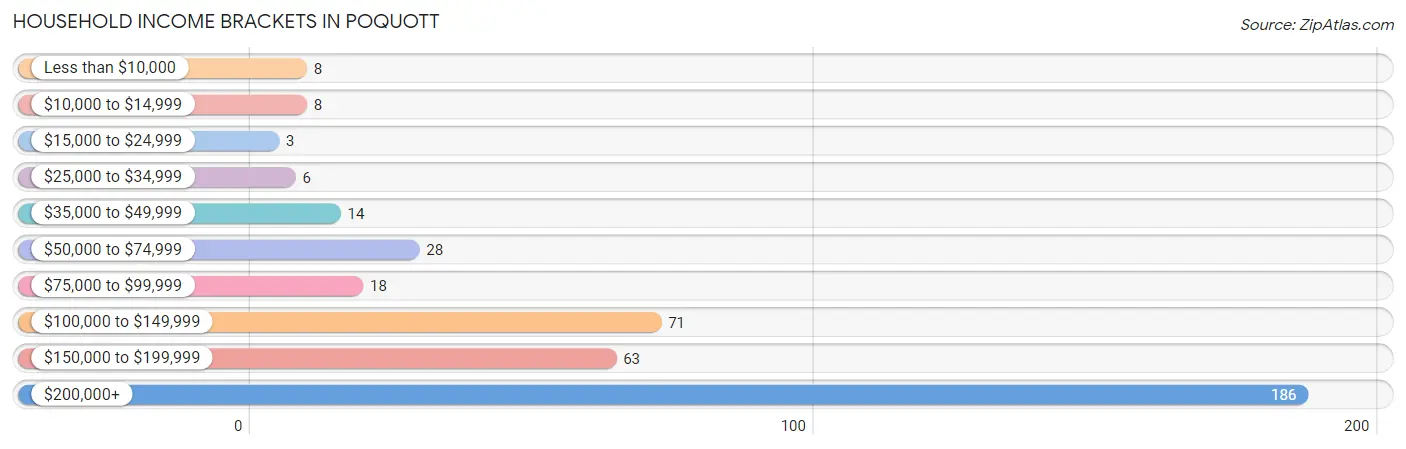
| Income Bracket | # Households | % Households |
| Less than $10,000 | 8 | 2.0% |
| $10,000 to $14,999 | 8 | 2.0% |
| $15,000 to $24,999 | 3 | 0.7% |
| $25,000 to $34,999 | 6 | 1.5% |
| $35,000 to $49,999 | 14 | 3.5% |
| $50,000 to $74,999 | 28 | 6.9% |
| $75,000 to $99,999 | 18 | 4.4% |
| $100,000 to $149,999 | 71 | 17.5% |
| $150,000 to $199,999 | 63 | 15.6% |
| $200,000+ | 186 | 45.9% |
Household Income by Householder Age in Poquott
The median household income in Poquott is $190,417, with the highest median household income of $216,250 found in the 45 to 64 years age bracket for the primary householder. A total of 247 households (61.0%) fall into this category. Meanwhile, the 15 to 24 years age bracket for the primary householder has the lowest median household income of $0, with 5 households (1.2%) in this group.
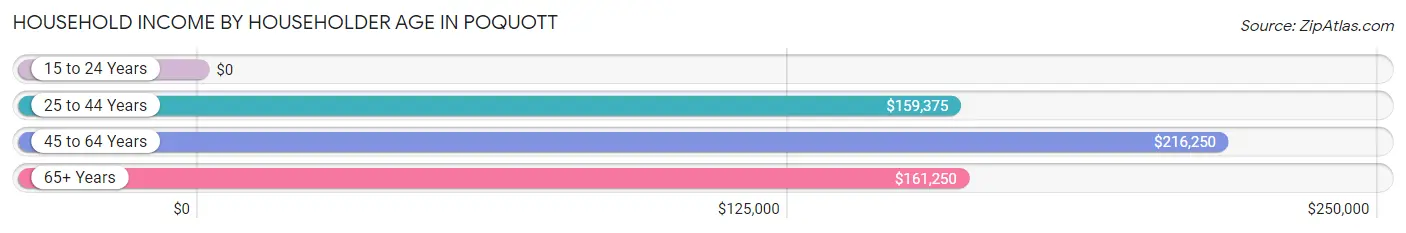
| Income Bracket | # Households | Median Income |
| 15 to 24 Years | 5 (1.2%) | $0 |
| 25 to 44 Years | 59 (14.6%) | $159,375 |
| 45 to 64 Years | 247 (61.0%) | $216,250 |
| 65+ Years | 94 (23.2%) | $161,250 |
| Total | 405 (100.0%) | $190,417 |
Poverty in Poquott
Income Below Poverty by Sex and Age in Poquott
With 6.1% poverty level for males and 9.2% for females among the residents of Poquott, under 5 year old males and 16 and 17 year old females are the most vulnerable to poverty, with 13 males (50.0%) and 7 females (70.0%) in their respective age groups living below the poverty level.
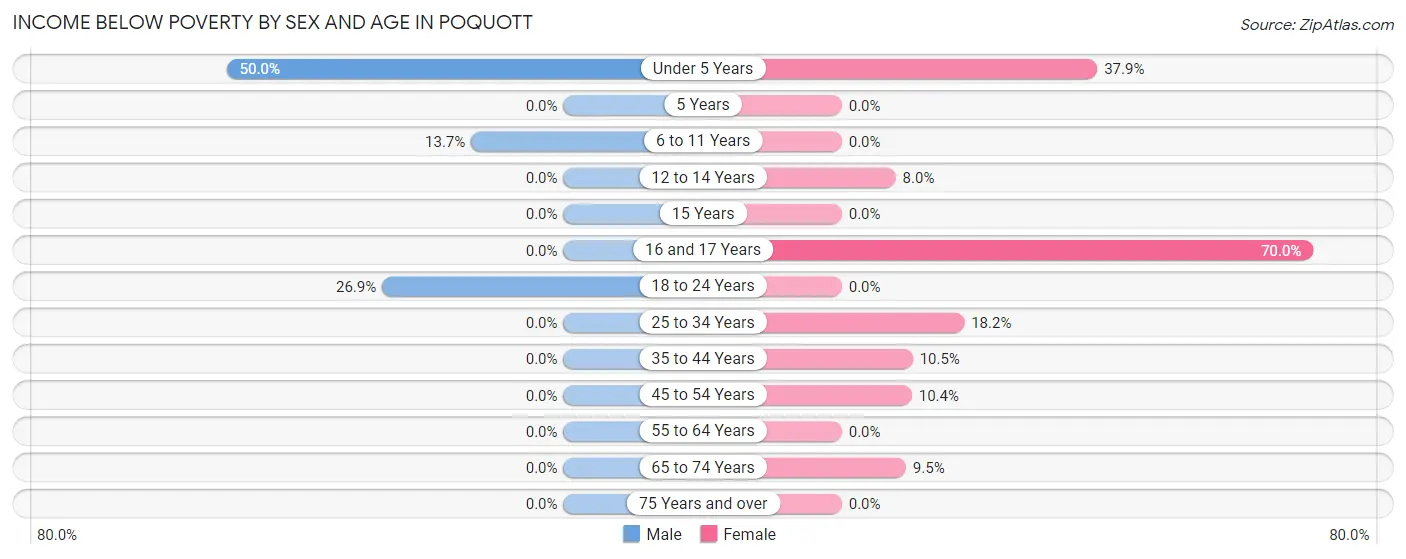
| Age Bracket | Male | Female |
| Under 5 Years | 13 (50.0%) | 11 (37.9%) |
| 5 Years | 0 (0.0%) | 0 (0.0%) |
| 6 to 11 Years | 10 (13.7%) | 0 (0.0%) |
| 12 to 14 Years | 0 (0.0%) | 2 (8.0%) |
| 15 Years | 0 (0.0%) | 0 (0.0%) |
| 16 and 17 Years | 0 (0.0%) | 7 (70.0%) |
| 18 to 24 Years | 14 (26.9%) | 0 (0.0%) |
| 25 to 34 Years | 0 (0.0%) | 6 (18.2%) |
| 35 to 44 Years | 0 (0.0%) | 8 (10.5%) |
| 45 to 54 Years | 0 (0.0%) | 8 (10.4%) |
| 55 to 64 Years | 0 (0.0%) | 0 (0.0%) |
| 65 to 74 Years | 0 (0.0%) | 4 (9.5%) |
| 75 Years and over | 0 (0.0%) | 0 (0.0%) |
| Total | 37 (6.1%) | 46 (9.2%) |
Income Above Poverty by Sex and Age in Poquott
According to the poverty statistics in Poquott, males aged 5 years and females aged 5 years are the age groups that are most secure financially, with 100.0% of males and 100.0% of females in these age groups living above the poverty line.
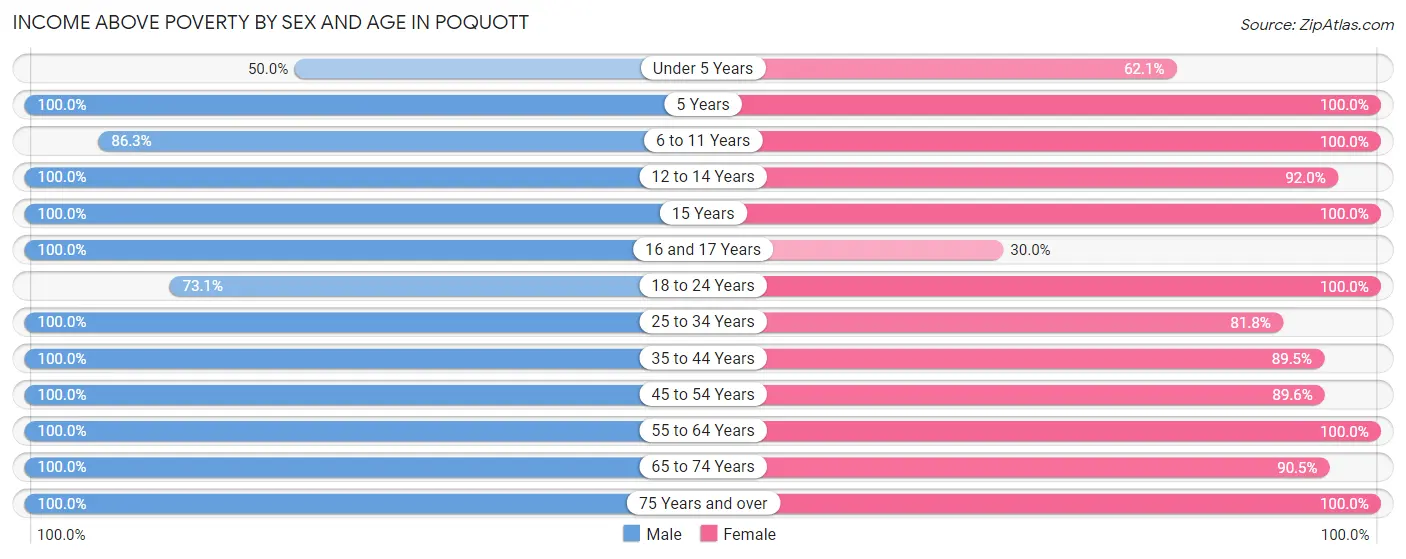
| Age Bracket | Male | Female |
| Under 5 Years | 13 (50.0%) | 18 (62.1%) |
| 5 Years | 2 (100.0%) | 3 (100.0%) |
| 6 to 11 Years | 63 (86.3%) | 32 (100.0%) |
| 12 to 14 Years | 48 (100.0%) | 23 (92.0%) |
| 15 Years | 9 (100.0%) | 6 (100.0%) |
| 16 and 17 Years | 9 (100.0%) | 3 (30.0%) |
| 18 to 24 Years | 38 (73.1%) | 37 (100.0%) |
| 25 to 34 Years | 58 (100.0%) | 27 (81.8%) |
| 35 to 44 Years | 30 (100.0%) | 68 (89.5%) |
| 45 to 54 Years | 103 (100.0%) | 69 (89.6%) |
| 55 to 64 Years | 126 (100.0%) | 82 (100.0%) |
| 65 to 74 Years | 31 (100.0%) | 38 (90.5%) |
| 75 Years and over | 39 (100.0%) | 47 (100.0%) |
| Total | 569 (93.9%) | 453 (90.8%) |
Income Below Poverty Among Married-Couple Families in Poquott
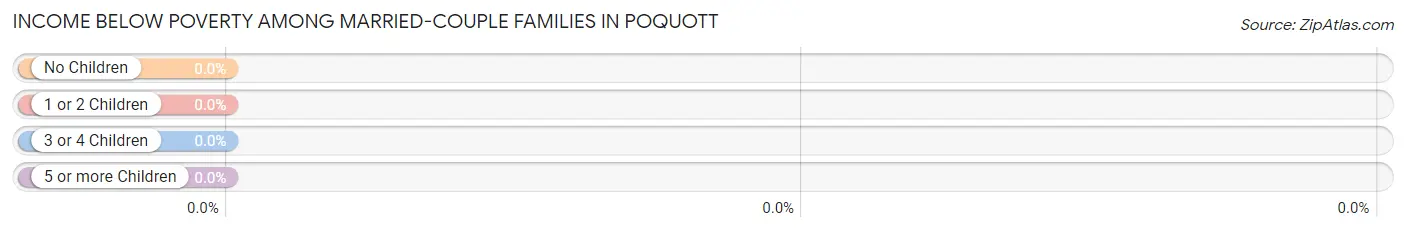
| Children | Above Poverty | Below Poverty |
| No Children | 126 (100.0%) | 0 (0.0%) |
| 1 or 2 Children | 93 (100.0%) | 0 (0.0%) |
| 3 or 4 Children | 13 (100.0%) | 0 (0.0%) |
| 5 or more Children | 2 (100.0%) | 0 (0.0%) |
| Total | 234 (100.0%) | 0 (0.0%) |
Income Below Poverty Among Single-Parent Households in Poquott
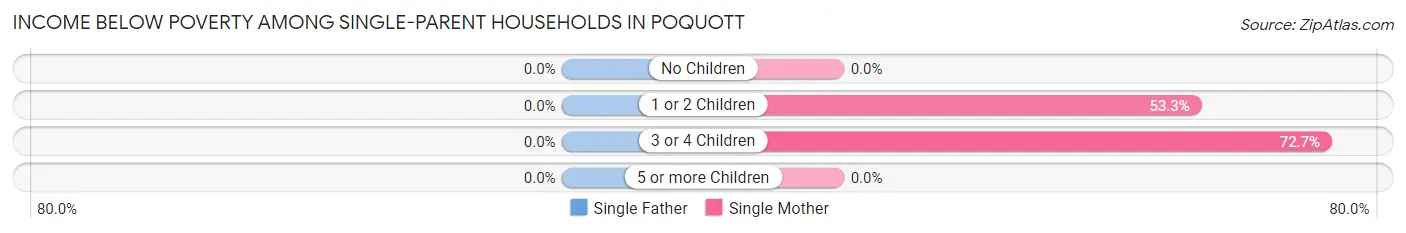
| Children | Single Father | Single Mother |
| No Children | 0 (0.0%) | 0 (0.0%) |
| 1 or 2 Children | 0 (0.0%) | 8 (53.3%) |
| 3 or 4 Children | 0 (0.0%) | 8 (72.7%) |
| 5 or more Children | 0 (0.0%) | 0 (0.0%) |
| Total | 0 (0.0%) | 16 (45.7%) |
Income Below Poverty Among Married-Couple vs Single-Parent Households in Poquott
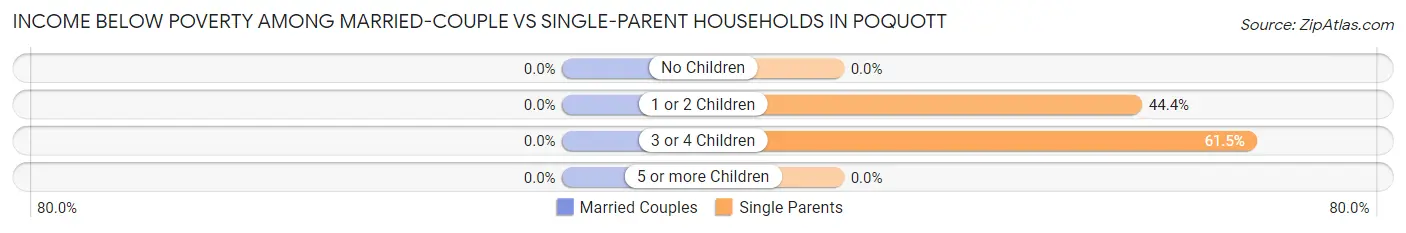
| Children | Married-Couple Families | Single-Parent Households |
| No Children | 0 (0.0%) | 0 (0.0%) |
| 1 or 2 Children | 0 (0.0%) | 8 (44.4%) |
| 3 or 4 Children | 0 (0.0%) | 8 (61.5%) |
| 5 or more Children | 0 (0.0%) | 0 (0.0%) |
| Total | 0 (0.0%) | 16 (40.0%) |
Race in Poquott
The most populous races in Poquott are White / Caucasian (843 | 76.1%), Asian (114 | 10.3%), and Hispanic or Latino (99 | 8.9%).
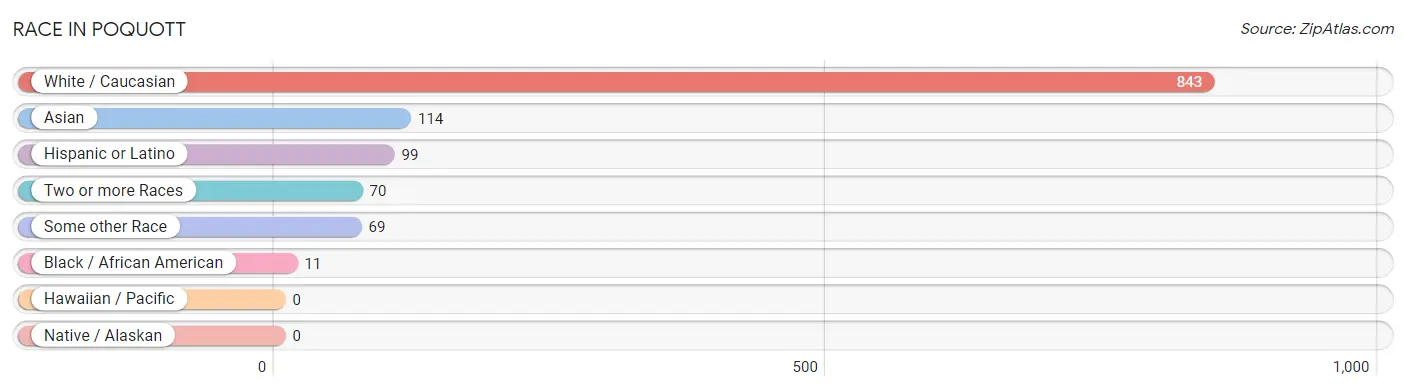
| Race | # Population | % Population |
| Asian | 114 | 10.3% |
| Black / African American | 11 | 1.0% |
| Hawaiian / Pacific | 0 | 0.0% |
| Hispanic or Latino | 99 | 8.9% |
| Native / Alaskan | 0 | 0.0% |
| White / Caucasian | 843 | 76.1% |
| Two or more Races | 70 | 6.3% |
| Some other Race | 69 | 6.2% |
| Total | 1,107 | 100.0% |
Ancestry in Poquott
The most populous ancestries reported in Poquott are German (233 | 21.0%), Italian (177 | 16.0%), French (142 | 12.8%), Irish (133 | 12.0%), and Indian (Asian) (82 | 7.4%), together accounting for 69.3% of all Poquott residents.
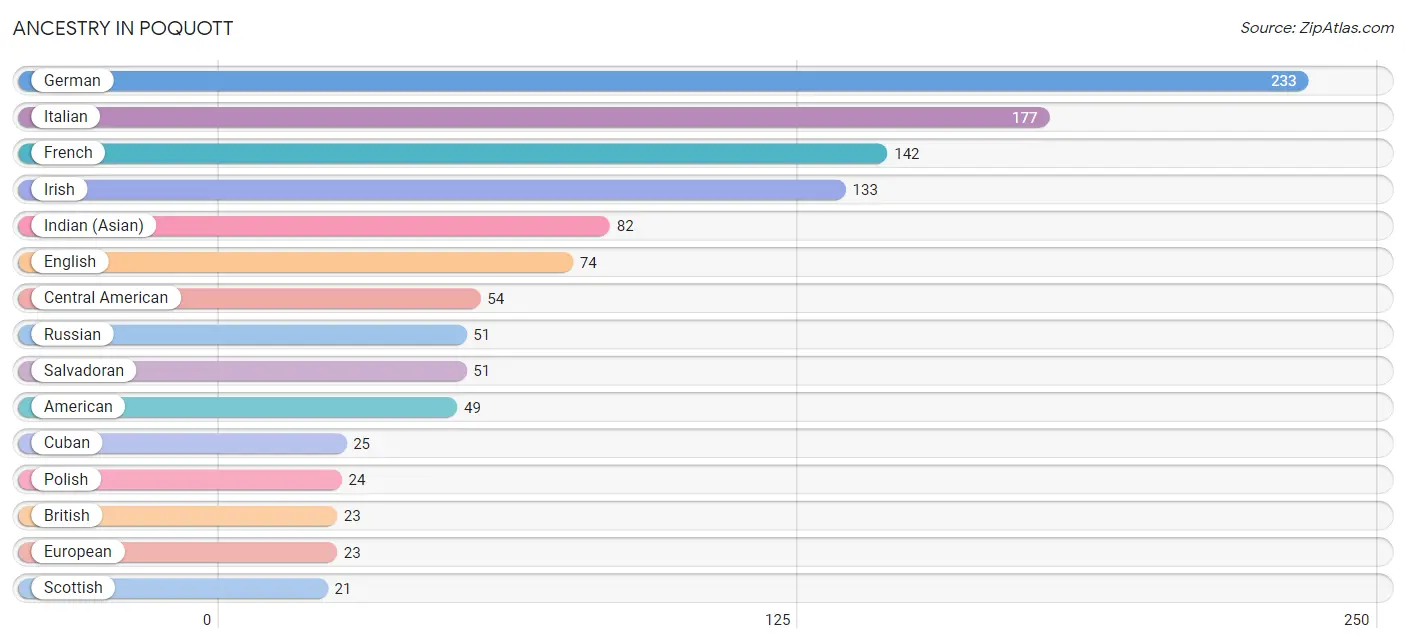
| Ancestry | # Population | % Population |
| Albanian | 2 | 0.2% |
| American | 49 | 4.4% |
| Armenian | 5 | 0.4% |
| Austrian | 13 | 1.2% |
| Bhutanese | 5 | 0.4% |
| British | 23 | 2.1% |
| Burmese | 12 | 1.1% |
| Central American | 54 | 4.9% |
| Cuban | 25 | 2.3% |
| Cypriot | 2 | 0.2% |
| Czechoslovakian | 3 | 0.3% |
| Danish | 2 | 0.2% |
| Dutch | 6 | 0.5% |
| Eastern European | 12 | 1.1% |
| Ecuadorian | 6 | 0.5% |
| English | 74 | 6.7% |
| European | 23 | 2.1% |
| French | 142 | 12.8% |
| German | 233 | 21.0% |
| Greek | 6 | 0.5% |
| Hungarian | 14 | 1.3% |
| Indian (Asian) | 82 | 7.4% |
| Irish | 133 | 12.0% |
| Israeli | 1 | 0.1% |
| Italian | 177 | 16.0% |
| Korean | 1 | 0.1% |
| Latvian | 2 | 0.2% |
| Mexican | 12 | 1.1% |
| Native Hawaiian | 3 | 0.3% |
| Northern European | 7 | 0.6% |
| Norwegian | 2 | 0.2% |
| Pakistani | 2 | 0.2% |
| Panamanian | 3 | 0.3% |
| Polish | 24 | 2.2% |
| Romanian | 10 | 0.9% |
| Russian | 51 | 4.6% |
| Salvadoran | 51 | 4.6% |
| Scandinavian | 2 | 0.2% |
| Scotch-Irish | 9 | 0.8% |
| Scottish | 21 | 1.9% |
| Slovak | 2 | 0.2% |
| South American | 6 | 0.5% |
| Spaniard | 2 | 0.2% |
| Swedish | 2 | 0.2% |
| Swiss | 5 | 0.4% |
| Thai | 11 | 1.0% |
| Turkish | 11 | 1.0% |
| Ukrainian | 4 | 0.4% |
| Welsh | 6 | 0.5% |
| West Indian | 3 | 0.3% | View All 50 Rows |
Immigrants in Poquott
The most numerous immigrant groups reported in Poquott came from Asia (80 | 7.2%), Eastern Asia (62 | 5.6%), Europe (57 | 5.1%), China (55 | 5.0%), and Latin America (40 | 3.6%), together accounting for 26.6% of all Poquott residents.
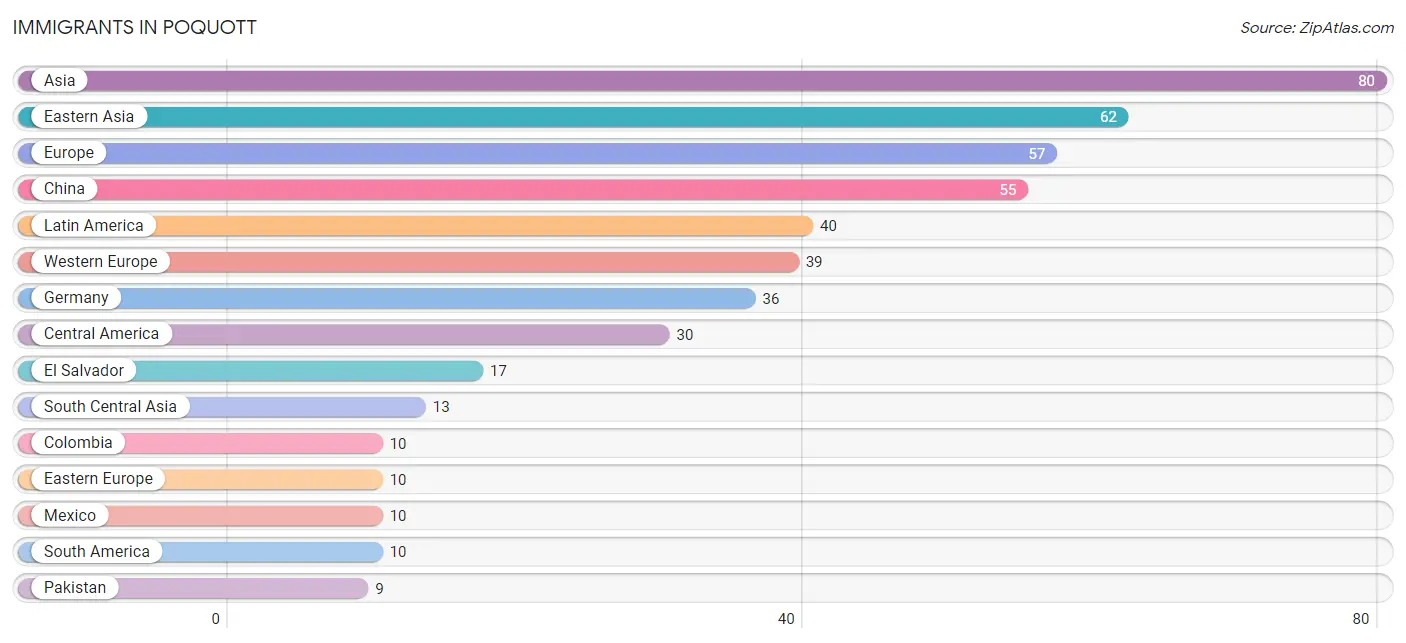
| Immigration Origin | # Population | % Population |
| Asia | 80 | 7.2% |
| Central America | 30 | 2.7% |
| China | 55 | 5.0% |
| Colombia | 10 | 0.9% |
| Eastern Asia | 62 | 5.6% |
| Eastern Europe | 10 | 0.9% |
| El Salvador | 17 | 1.5% |
| England | 2 | 0.2% |
| Europe | 57 | 5.1% |
| France | 3 | 0.3% |
| Germany | 36 | 3.3% |
| Hungary | 2 | 0.2% |
| Ireland | 2 | 0.2% |
| Israel | 1 | 0.1% |
| Italy | 2 | 0.2% |
| Japan | 5 | 0.4% |
| Kazakhstan | 4 | 0.4% |
| Korea | 2 | 0.2% |
| Latin America | 40 | 3.6% |
| Mexico | 10 | 0.9% |
| Northern Europe | 6 | 0.5% |
| Pakistan | 9 | 0.8% |
| Panama | 3 | 0.3% |
| Romania | 8 | 0.7% |
| South America | 10 | 0.9% |
| South Central Asia | 13 | 1.2% |
| South Eastern Asia | 2 | 0.2% |
| Southern Europe | 2 | 0.2% |
| Taiwan | 3 | 0.3% |
| Thailand | 2 | 0.2% |
| Western Asia | 3 | 0.3% |
| Western Europe | 39 | 3.5% | View All 32 Rows |
Sex and Age in Poquott
Sex and Age in Poquott
The most populous age groups in Poquott are 10 to 14 Years (105 | 17.3%) for men and 50 to 54 Years (58 | 11.6%) for women.
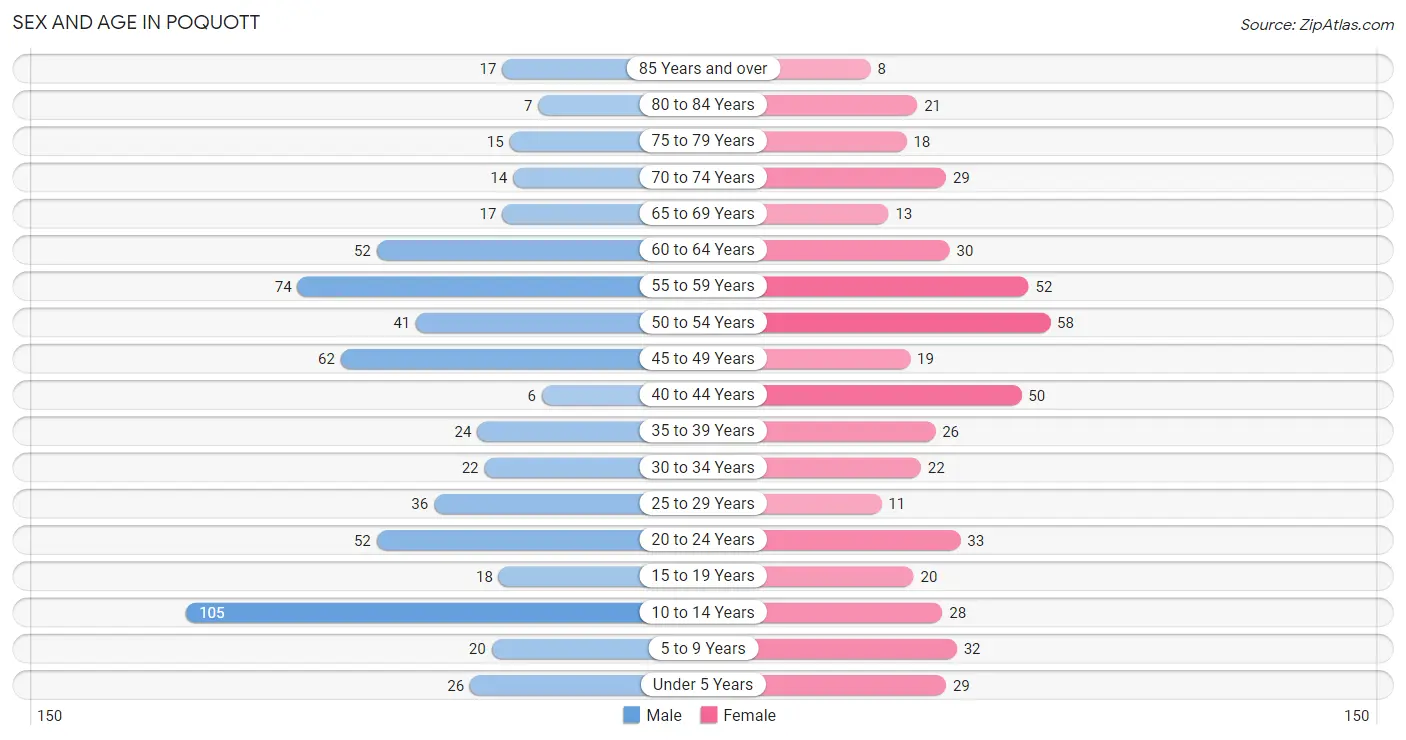
| Age Bracket | Male | Female |
| Under 5 Years | 26 (4.3%) | 29 (5.8%) |
| 5 to 9 Years | 20 (3.3%) | 32 (6.4%) |
| 10 to 14 Years | 105 (17.3%) | 28 (5.6%) |
| 15 to 19 Years | 18 (3.0%) | 20 (4.0%) |
| 20 to 24 Years | 52 (8.6%) | 33 (6.6%) |
| 25 to 29 Years | 36 (5.9%) | 11 (2.2%) |
| 30 to 34 Years | 22 (3.6%) | 22 (4.4%) |
| 35 to 39 Years | 24 (4.0%) | 26 (5.2%) |
| 40 to 44 Years | 6 (1.0%) | 50 (10.0%) |
| 45 to 49 Years | 62 (10.2%) | 19 (3.8%) |
| 50 to 54 Years | 41 (6.7%) | 58 (11.6%) |
| 55 to 59 Years | 74 (12.2%) | 52 (10.4%) |
| 60 to 64 Years | 52 (8.6%) | 30 (6.0%) |
| 65 to 69 Years | 17 (2.8%) | 13 (2.6%) |
| 70 to 74 Years | 14 (2.3%) | 29 (5.8%) |
| 75 to 79 Years | 15 (2.5%) | 18 (3.6%) |
| 80 to 84 Years | 7 (1.1%) | 21 (4.2%) |
| 85 Years and over | 17 (2.8%) | 8 (1.6%) |
| Total | 608 (100.0%) | 499 (100.0%) |
Families and Households in Poquott
Median Family Size in Poquott
The median family size in Poquott is 3.28 persons per family, with single female/mother families (35 | 12.8%) accounting for the largest median family size of 3.49 persons per family. On the other hand, single male/father families (5 | 1.8%) represent the smallest median family size with 2.60 persons per family.
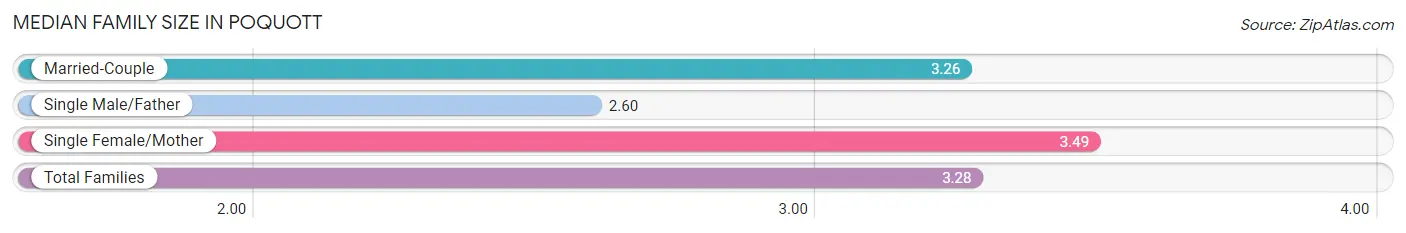
| Family Type | # Families | Family Size |
| Married-Couple | 234 (85.4%) | 3.26 |
| Single Male/Father | 5 (1.8%) | 2.60 |
| Single Female/Mother | 35 (12.8%) | 3.49 |
| Total Families | 274 (100.0%) | 3.28 |
Median Household Size in Poquott
The median household size in Poquott is 2.73 persons per household, with single female/mother households (35 | 8.6%) accounting for the largest median household size of 4.14 persons per household. non-family households (131 | 32.4%) represent the smallest median household size with 1.39 persons per household.
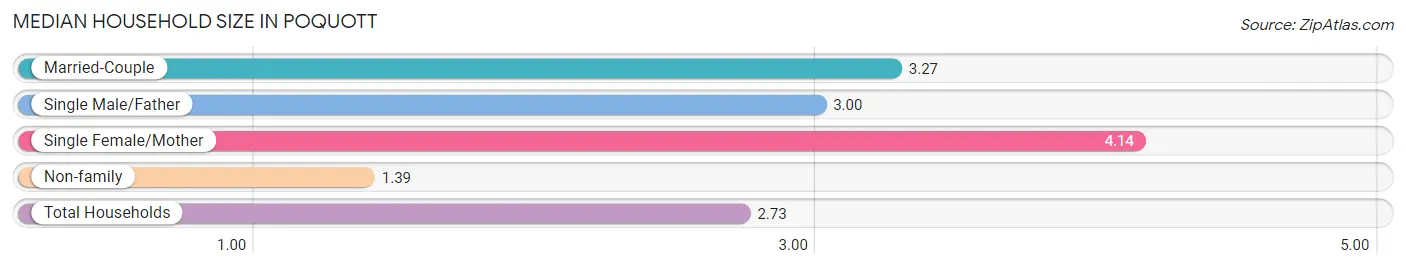
| Household Type | # Households | Household Size |
| Married-Couple | 234 (57.8%) | 3.27 |
| Single Male/Father | 5 (1.2%) | 3.00 |
| Single Female/Mother | 35 (8.6%) | 4.14 |
| Non-family | 131 (32.4%) | 1.39 |
| Total Households | 405 (100.0%) | 2.73 |
Household Size by Marriage Status in Poquott
Out of a total of 405 households in Poquott, 274 (67.6%) are family households, while 131 (32.4%) are nonfamily households. The most numerous type of family households are 2-person households, comprising 92, and the most common type of nonfamily households are 1-person households, comprising 100.
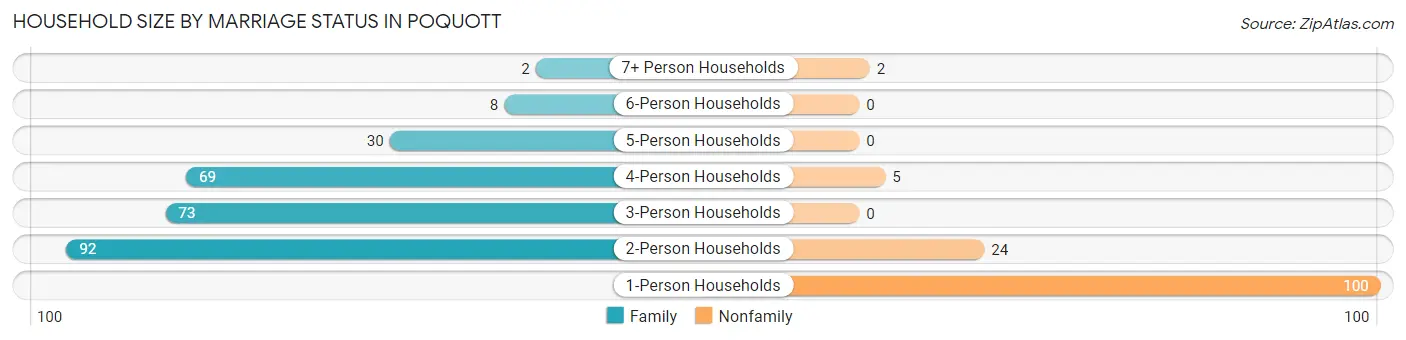
| Household Size | Family Households | Nonfamily Households |
| 1-Person Households | - | 100 (24.7%) |
| 2-Person Households | 92 (22.7%) | 24 (5.9%) |
| 3-Person Households | 73 (18.0%) | 0 (0.0%) |
| 4-Person Households | 69 (17.0%) | 5 (1.2%) |
| 5-Person Households | 30 (7.4%) | 0 (0.0%) |
| 6-Person Households | 8 (2.0%) | 0 (0.0%) |
| 7+ Person Households | 2 (0.5%) | 2 (0.5%) |
| Total | 274 (67.6%) | 131 (32.4%) |
Female Fertility in Poquott
Fertility by Age in Poquott
Average fertility rate in Poquott is 81.0 births per 1,000 women. Women in the age bracket of 35 to 50 years have the highest fertility rate with 101.0 births per 1,000 women. Women in the age bracket of 35 to 50 years acount for 66.7% of all women with births.
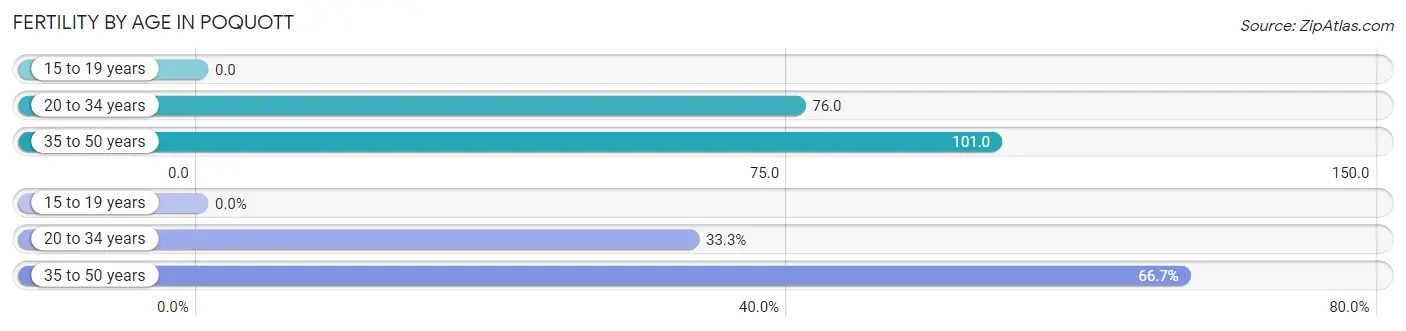
| Age Bracket | Women with Births | Births / 1,000 Women |
| 15 to 19 years | 0 (0.0%) | 0.0 |
| 20 to 34 years | 5 (33.3%) | 76.0 |
| 35 to 50 years | 10 (66.7%) | 101.0 |
| Total | 15 (100.0%) | 81.0 |
Fertility by Age by Marriage Status in Poquott
20.0% of women with births (15) in Poquott are married. The highest percentage of unmarried women with births falls into 35 to 50 years age bracket with 100.0% of them unmarried at the time of birth, while the lowest percentage of unmarried women with births belong to 20 to 34 years age bracket with 40.0% of them unmarried.
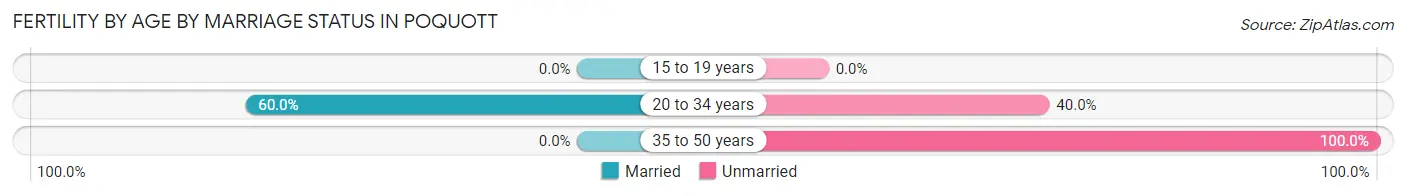
| Age Bracket | Married | Unmarried |
| 15 to 19 years | 0 (0.0%) | 0 (0.0%) |
| 20 to 34 years | 3 (60.0%) | 2 (40.0%) |
| 35 to 50 years | 0 (0.0%) | 10 (100.0%) |
| Total | 3 (20.0%) | 12 (80.0%) |
Fertility by Education in Poquott
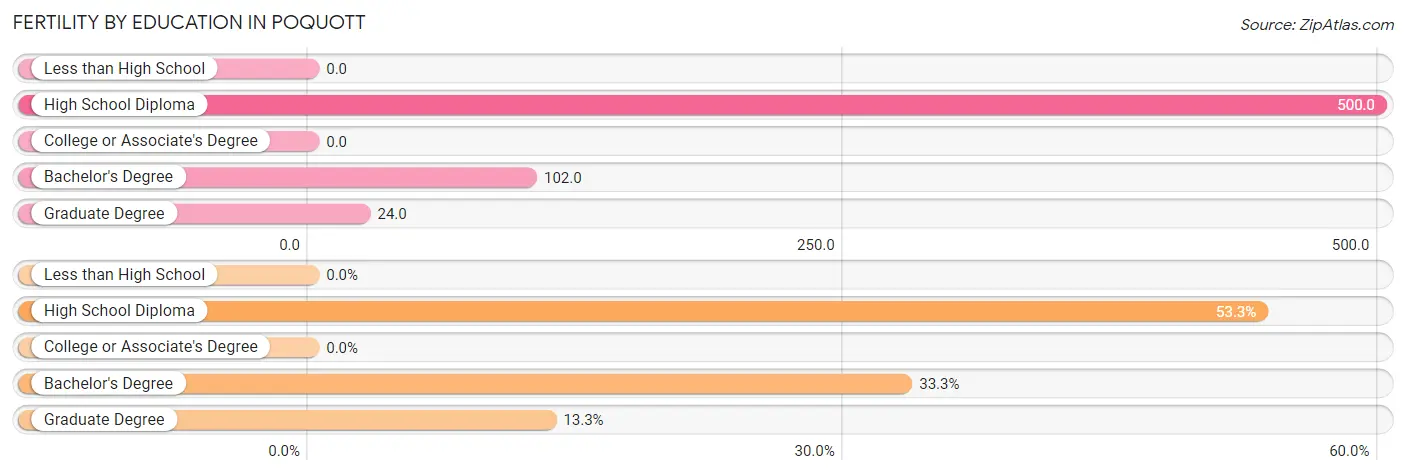
| Educational Attainment | Women with Births | Births / 1,000 Women |
| Less than High School | 0 (0.0%) | 0.0 |
| High School Diploma | 8 (53.3%) | 500.0 |
| College or Associate's Degree | 0 (0.0%) | 0.0 |
| Bachelor's Degree | 5 (33.3%) | 102.0 |
| Graduate Degree | 2 (13.3%) | 24.0 |
| Total | 15 (100.0%) | 81.0 |
Fertility by Education by Marriage Status in Poquott
80.0% of women with births in Poquott are unmarried. Women with the educational attainment of bachelor's degree are most likely to be married with 60.0% of them married at childbirth, while women with the educational attainment of high school diploma are least likely to be married with 100.0% of them unmarried at childbirth.
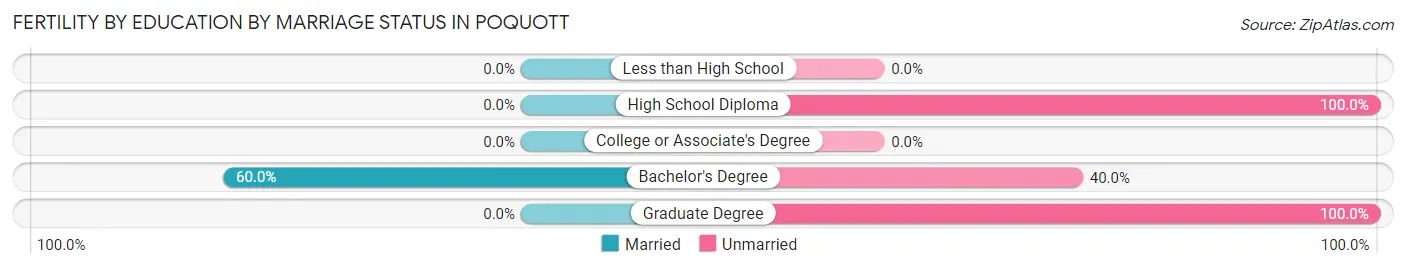
| Educational Attainment | Married | Unmarried |
| Less than High School | 0 (0.0%) | 0 (0.0%) |
| High School Diploma | 0 (0.0%) | 8 (100.0%) |
| College or Associate's Degree | 0 (0.0%) | 0 (0.0%) |
| Bachelor's Degree | 3 (60.0%) | 2 (40.0%) |
| Graduate Degree | 0 (0.0%) | 2 (100.0%) |
| Total | 3 (20.0%) | 12 (80.0%) |
Employment Characteristics in Poquott
Employment by Class of Employer in Poquott
Among the 597 employed individuals in Poquott, private company employees (329 | 55.1%), state government employees (120 | 20.1%), and local government employees (51 | 8.5%) make up the most common classes of employment.
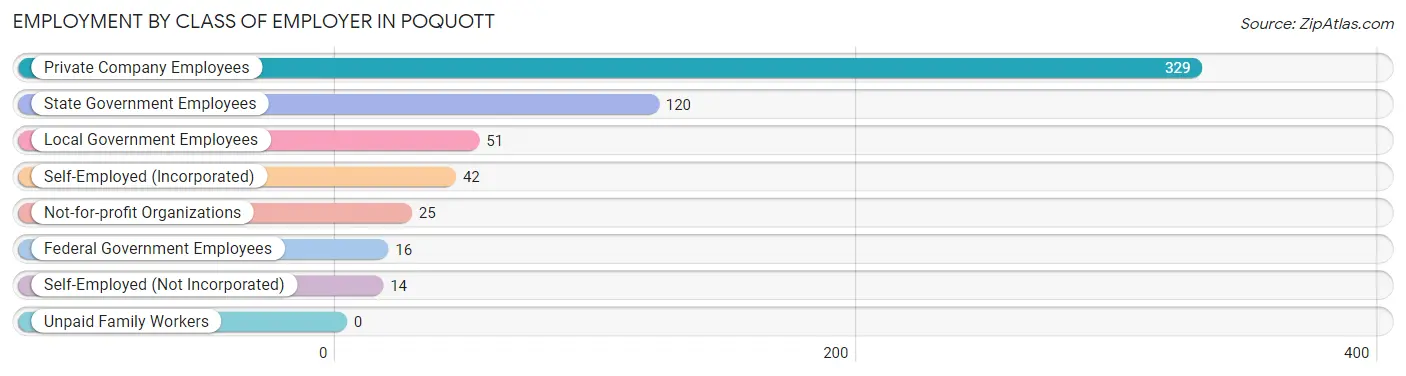
| Employer Class | # Employees | % Employees |
| Private Company Employees | 329 | 55.1% |
| Self-Employed (Incorporated) | 42 | 7.0% |
| Self-Employed (Not Incorporated) | 14 | 2.4% |
| Not-for-profit Organizations | 25 | 4.2% |
| Local Government Employees | 51 | 8.5% |
| State Government Employees | 120 | 20.1% |
| Federal Government Employees | 16 | 2.7% |
| Unpaid Family Workers | 0 | 0.0% |
| Total | 597 | 100.0% |
Employment Status by Age in Poquott
According to the labor force statistics for Poquott, out of the total population over 16 years of age (852), 72.3% or 616 individuals are in the labor force, with 2.6% or 16 of them unemployed. The age group with the highest labor force participation rate is 20 to 24 years, with 89.4% or 76 individuals in the labor force. Within the labor force, the 16 to 19 years age range has the highest percentage of unemployed individuals, with 30.0% or 3 of them being unemployed.
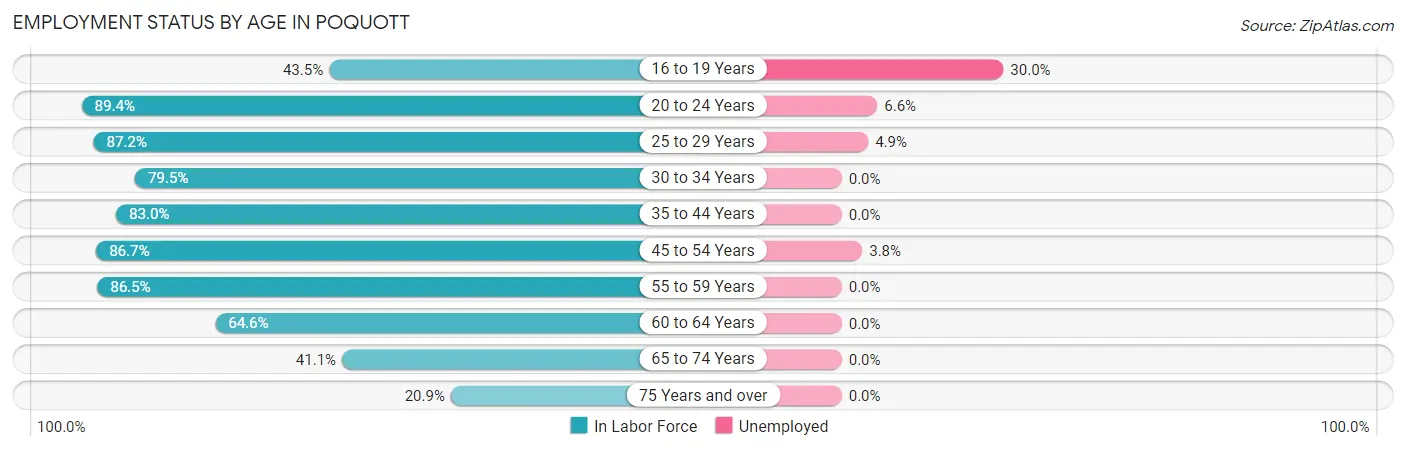
| Age Bracket | In Labor Force | Unemployed |
| 16 to 19 Years | 10 (43.5%) | 3 (30.0%) |
| 20 to 24 Years | 76 (89.4%) | 5 (6.6%) |
| 25 to 29 Years | 41 (87.2%) | 2 (4.9%) |
| 30 to 34 Years | 35 (79.5%) | 0 (0.0%) |
| 35 to 44 Years | 88 (83.0%) | 0 (0.0%) |
| 45 to 54 Years | 156 (86.7%) | 6 (3.8%) |
| 55 to 59 Years | 109 (86.5%) | 0 (0.0%) |
| 60 to 64 Years | 53 (64.6%) | 0 (0.0%) |
| 65 to 74 Years | 30 (41.1%) | 0 (0.0%) |
| 75 Years and over | 18 (20.9%) | 0 (0.0%) |
| Total | 616 (72.3%) | 16 (2.6%) |
Employment Status by Educational Attainment in Poquott
According to labor force statistics for Poquott, 82.4% of individuals (482) out of the total population between 25 and 64 years of age (585) are in the labor force, with 1.7% or 8 of them being unemployed. The group with the highest labor force participation rate are those with the educational attainment of bachelor's degree or higher, with 87.3% or 405 individuals in the labor force. Within the labor force, individuals with college / associate degree education have the highest percentage of unemployment, with 13.3% or 6 of them being unemployed.
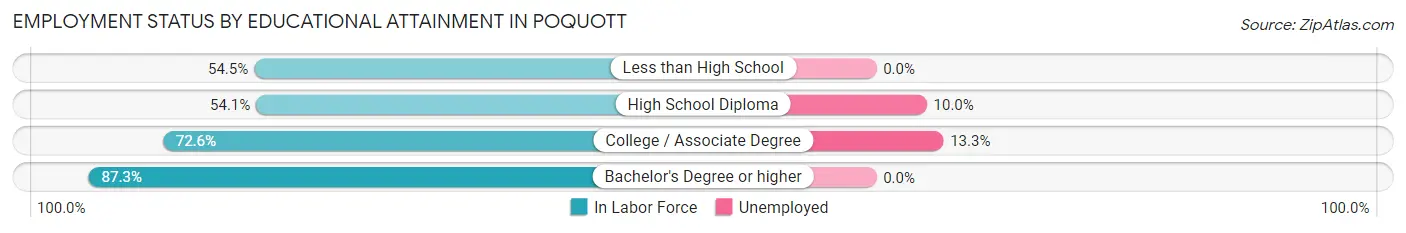
| Educational Attainment | In Labor Force | Unemployed |
| Less than High School | 12 (54.5%) | 0 (0.0%) |
| High School Diploma | 20 (54.1%) | 4 (10.0%) |
| College / Associate Degree | 45 (72.6%) | 8 (13.3%) |
| Bachelor's Degree or higher | 405 (87.3%) | 0 (0.0%) |
| Total | 482 (82.4%) | 10 (1.7%) |
Employment Occupations by Sex in Poquott
Management, Business, Science and Arts Occupations
The most common Management, Business, Science and Arts occupations in Poquott are Community & Social Service (119 | 19.8%), Health Diagnosing & Treating (119 | 19.8%), Health Technologists (108 | 18.0%), Computers, Engineering & Science (89 | 14.8%), and Management (88 | 14.7%).
Management, Business, Science and Arts Occupations by Sex
Within the Management, Business, Science and Arts occupations in Poquott, the most male-oriented occupations are Computers & Mathematics (97.6%), Computers, Engineering & Science (82.0%), and Business & Financial (70.0%), while the most female-oriented occupations are Education, Arts & Media (71.4%), Arts, Media & Entertainment (61.9%), and Community & Social Service (57.1%).
| Occupation | Male | Female |
| Management | 50 (56.8%) | 38 (43.2%) |
| Business & Financial | 14 (70.0%) | 6 (30.0%) |
| Computers, Engineering & Science | 73 (82.0%) | 16 (18.0%) |
| Computers & Mathematics | 40 (97.6%) | 1 (2.4%) |
| Architecture & Engineering | 8 (66.7%) | 4 (33.3%) |
| Life, Physical & Social Science | 25 (69.4%) | 11 (30.6%) |
| Community & Social Service | 51 (42.9%) | 68 (57.1%) |
| Education, Arts & Media | 4 (28.6%) | 10 (71.4%) |
| Legal Services & Support | 8 (57.1%) | 6 (42.9%) |
| Education Instruction & Library | 31 (44.3%) | 39 (55.7%) |
| Arts, Media & Entertainment | 8 (38.1%) | 13 (61.9%) |
| Health Diagnosing & Treating | 57 (47.9%) | 62 (52.1%) |
| Health Technologists | 52 (48.1%) | 56 (51.8%) |
| Total (Category) | 245 (56.3%) | 190 (43.7%) |
| Total (Overall) | 356 (59.3%) | 244 (40.7%) |
Services Occupations
The most common Services occupations in Poquott are Food Preparation & Serving (20 | 3.3%), Security & Protection (9 | 1.5%), Law Enforcement (9 | 1.5%), Healthcare Support (2 | 0.3%), and Personal Care & Service (2 | 0.3%).
Services Occupations by Sex
Within the Services occupations in Poquott, the most male-oriented occupations are Security & Protection (77.8%), Law Enforcement (77.8%), and Food Preparation & Serving (15.0%), while the most female-oriented occupations are Healthcare Support (100.0%), Personal Care & Service (100.0%), and Food Preparation & Serving (85.0%).
| Occupation | Male | Female |
| Healthcare Support | 0 (0.0%) | 2 (100.0%) |
| Security & Protection | 7 (77.8%) | 2 (22.2%) |
| Firefighting & Prevention | 0 (0.0%) | 0 (0.0%) |
| Law Enforcement | 7 (77.8%) | 2 (22.2%) |
| Food Preparation & Serving | 3 (15.0%) | 17 (85.0%) |
| Cleaning & Maintenance | 0 (0.0%) | 0 (0.0%) |
| Personal Care & Service | 0 (0.0%) | 2 (100.0%) |
| Total (Category) | 10 (30.3%) | 23 (69.7%) |
| Total (Overall) | 356 (59.3%) | 244 (40.7%) |
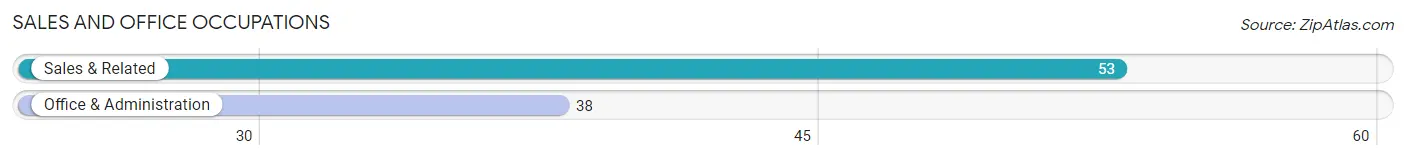
Sales and Office Occupations
The most common Sales and Office occupations in Poquott are Sales & Related (53 | 8.8%), and Office & Administration (38 | 6.3%).
Sales and Office Occupations by Sex
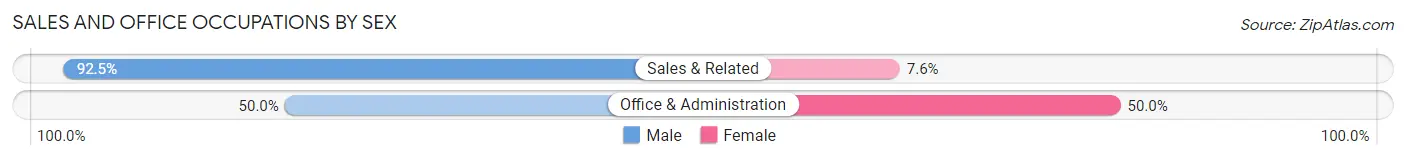
| Occupation | Male | Female |
| Sales & Related | 49 (92.4%) | 4 (7.5%) |
| Office & Administration | 19 (50.0%) | 19 (50.0%) |
| Total (Category) | 68 (74.7%) | 23 (25.3%) |
| Total (Overall) | 356 (59.3%) | 244 (40.7%) |
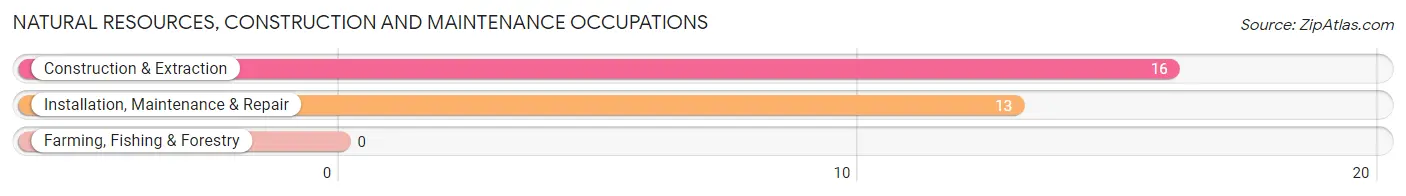
Natural Resources, Construction and Maintenance Occupations
The most common Natural Resources, Construction and Maintenance occupations in Poquott are Construction & Extraction (16 | 2.7%), and Installation, Maintenance & Repair (13 | 2.2%).
Natural Resources, Construction and Maintenance Occupations by Sex
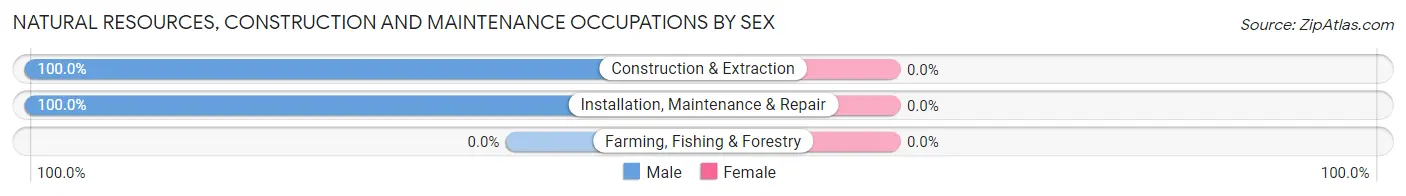
| Occupation | Male | Female |
| Farming, Fishing & Forestry | 0 (0.0%) | 0 (0.0%) |
| Construction & Extraction | 16 (100.0%) | 0 (0.0%) |
| Installation, Maintenance & Repair | 13 (100.0%) | 0 (0.0%) |
| Total (Category) | 29 (100.0%) | 0 (0.0%) |
| Total (Overall) | 356 (59.3%) | 244 (40.7%) |
Production, Transportation and Moving Occupations
The most common Production, Transportation and Moving occupations in Poquott are Production (8 | 1.3%), Transportation (2 | 0.3%), and Material Moving (2 | 0.3%).
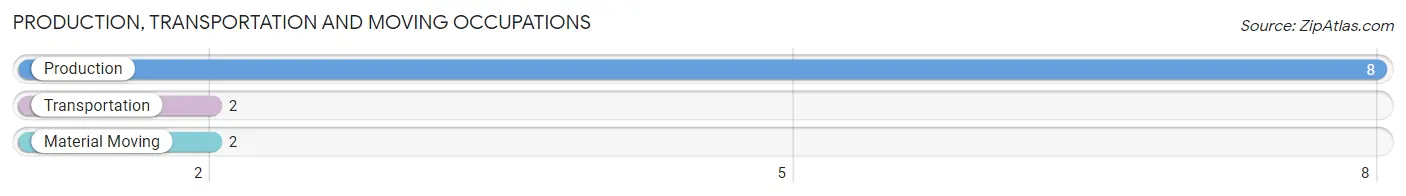
Production, Transportation and Moving Occupations by Sex
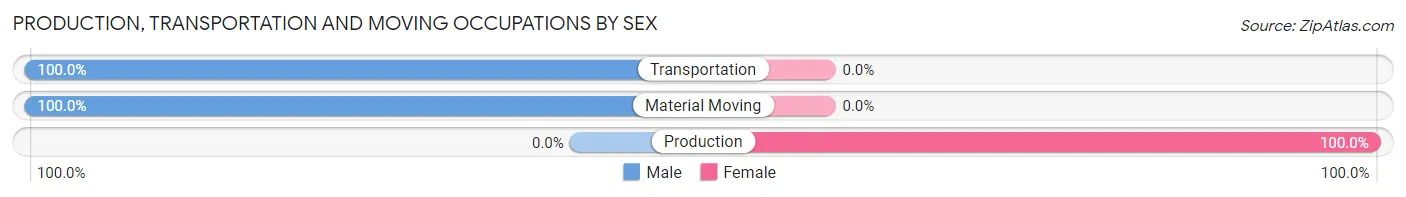
| Occupation | Male | Female |
| Production | 0 (0.0%) | 8 (100.0%) |
| Transportation | 2 (100.0%) | 0 (0.0%) |
| Material Moving | 2 (100.0%) | 0 (0.0%) |
| Total (Category) | 4 (33.3%) | 8 (66.7%) |
| Total (Overall) | 356 (59.3%) | 244 (40.7%) |
Employment Industries by Sex in Poquott
Employment Industries in Poquott
The major employment industries in Poquott include Educational Services (120 | 20.0%), Professional & Scientific (108 | 18.0%), Health Care & Social Assistance (90 | 15.0%), Finance & Insurance (59 | 9.8%), and Retail Trade (48 | 8.0%).
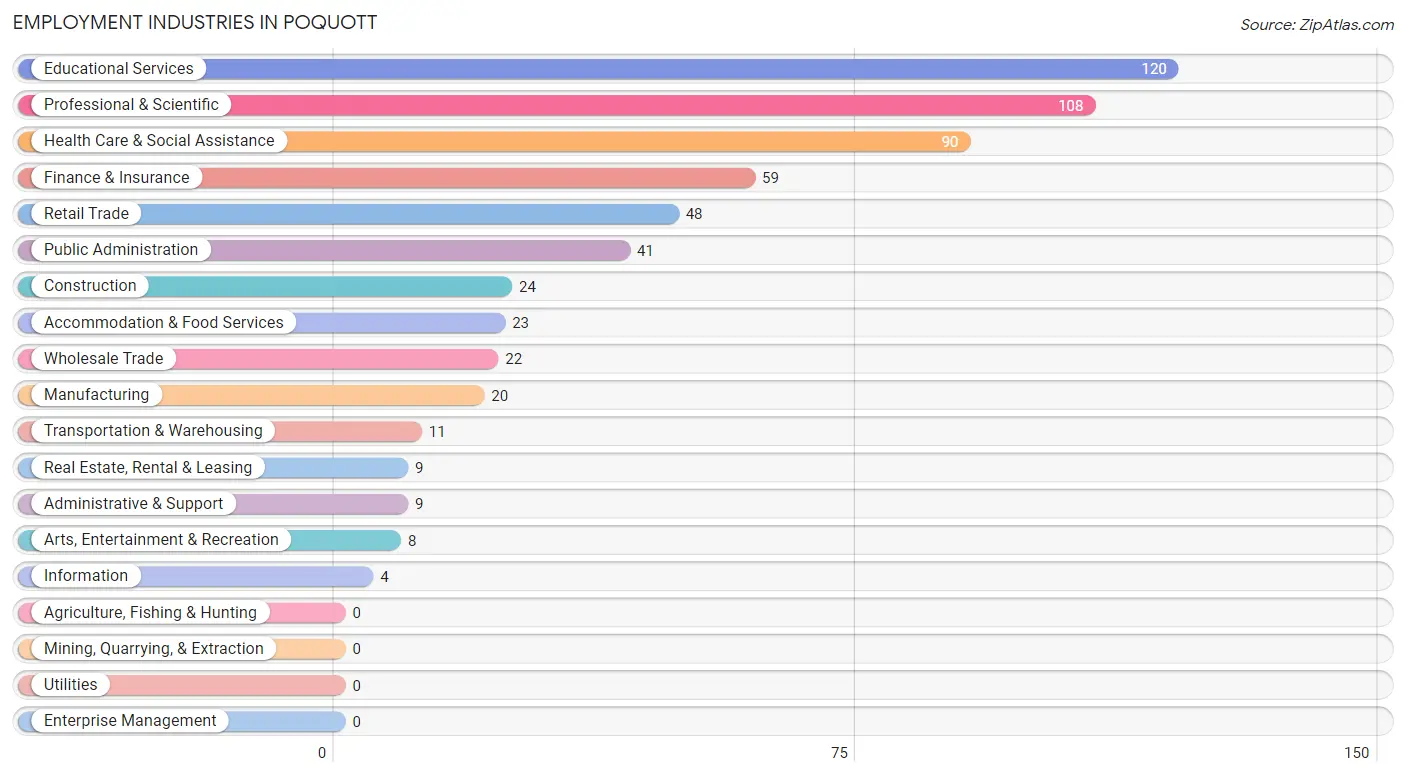
Employment Industries by Sex in Poquott
The Poquott industries that see more men than women are Transportation & Warehousing (100.0%), Construction (91.7%), and Retail Trade (81.2%), whereas the industries that tend to have a higher number of women are Administrative & Support (100.0%), Arts, Entertainment & Recreation (100.0%), and Information (75.0%).
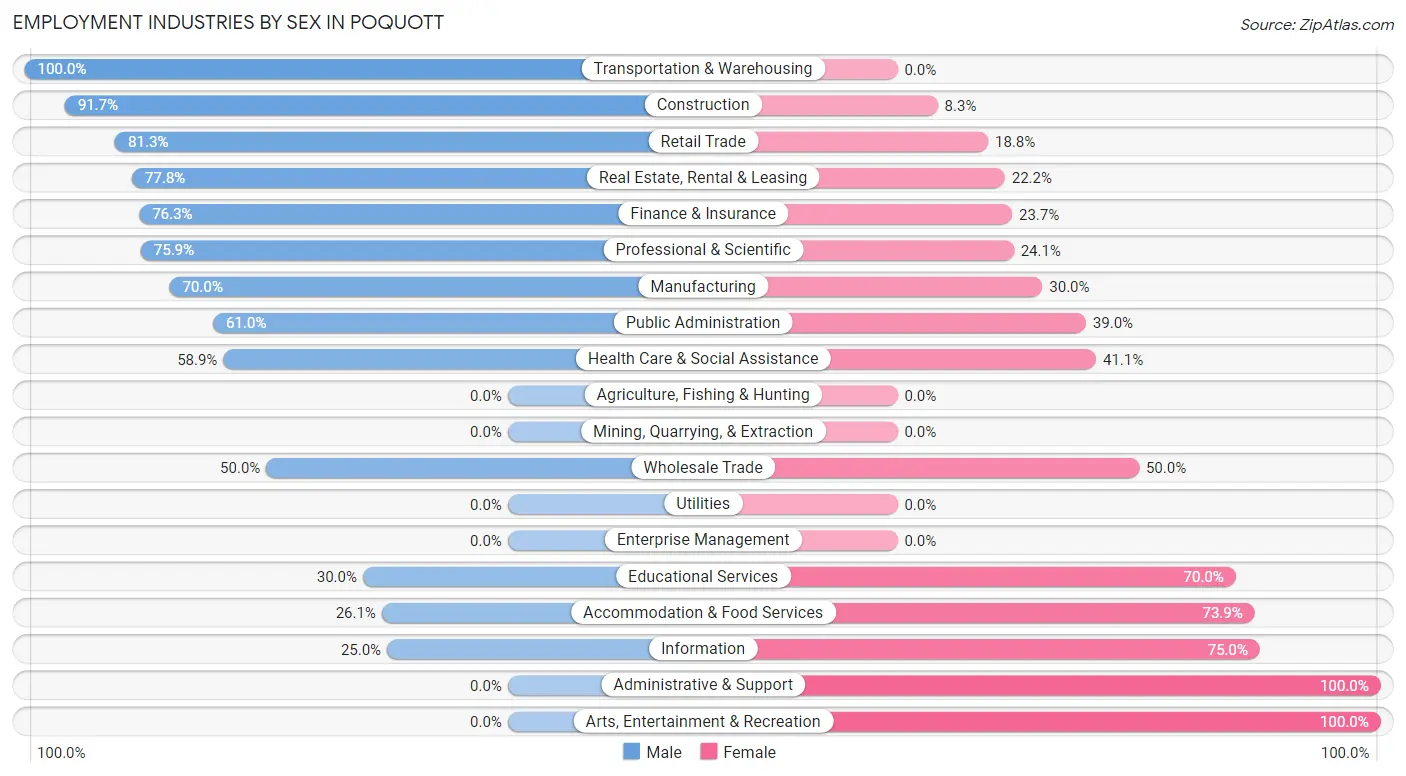
| Industry | Male | Female |
| Agriculture, Fishing & Hunting | 0 (0.0%) | 0 (0.0%) |
| Mining, Quarrying, & Extraction | 0 (0.0%) | 0 (0.0%) |
| Construction | 22 (91.7%) | 2 (8.3%) |
| Manufacturing | 14 (70.0%) | 6 (30.0%) |
| Wholesale Trade | 11 (50.0%) | 11 (50.0%) |
| Retail Trade | 39 (81.2%) | 9 (18.8%) |
| Transportation & Warehousing | 11 (100.0%) | 0 (0.0%) |
| Utilities | 0 (0.0%) | 0 (0.0%) |
| Information | 1 (25.0%) | 3 (75.0%) |
| Finance & Insurance | 45 (76.3%) | 14 (23.7%) |
| Real Estate, Rental & Leasing | 7 (77.8%) | 2 (22.2%) |
| Professional & Scientific | 82 (75.9%) | 26 (24.1%) |
| Enterprise Management | 0 (0.0%) | 0 (0.0%) |
| Administrative & Support | 0 (0.0%) | 9 (100.0%) |
| Educational Services | 36 (30.0%) | 84 (70.0%) |
| Health Care & Social Assistance | 53 (58.9%) | 37 (41.1%) |
| Arts, Entertainment & Recreation | 0 (0.0%) | 8 (100.0%) |
| Accommodation & Food Services | 6 (26.1%) | 17 (73.9%) |
| Public Administration | 25 (61.0%) | 16 (39.0%) |
| Total | 356 (59.3%) | 244 (40.7%) |
Education in Poquott
School Enrollment in Poquott
The most common levels of schooling among the 302 students in Poquott are elementary school (87 | 28.8%), middle school (84 | 27.8%), and graduate / professional (38 | 12.6%).
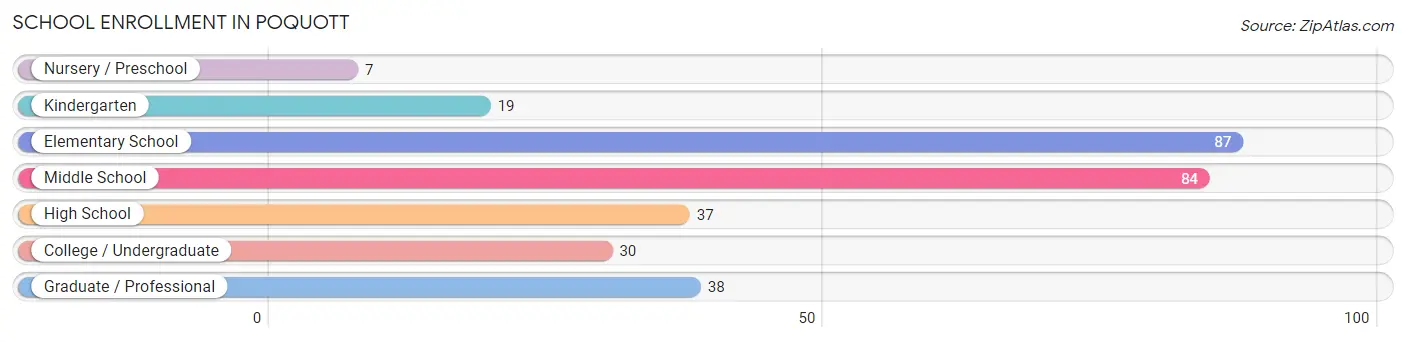
| School Level | # Students | % Students |
| Nursery / Preschool | 7 | 2.3% |
| Kindergarten | 19 | 6.3% |
| Elementary School | 87 | 28.8% |
| Middle School | 84 | 27.8% |
| High School | 37 | 12.2% |
| College / Undergraduate | 30 | 9.9% |
| Graduate / Professional | 38 | 12.6% |
| Total | 302 | 100.0% |
School Enrollment by Age by Funding Source in Poquott
Out of a total of 302 students who are enrolled in schools in Poquott, 44 (14.6%) attend a private institution, while the remaining 258 (85.4%) are enrolled in public schools. The age group of 25 to 34 year olds has the highest likelihood of being enrolled in private schools, with 20 (64.5% in the age bracket) enrolled. Conversely, the age group of 10 to 14 year olds has the lowest likelihood of being enrolled in a private school, with 128 (96.2% in the age bracket) attending a public institution.
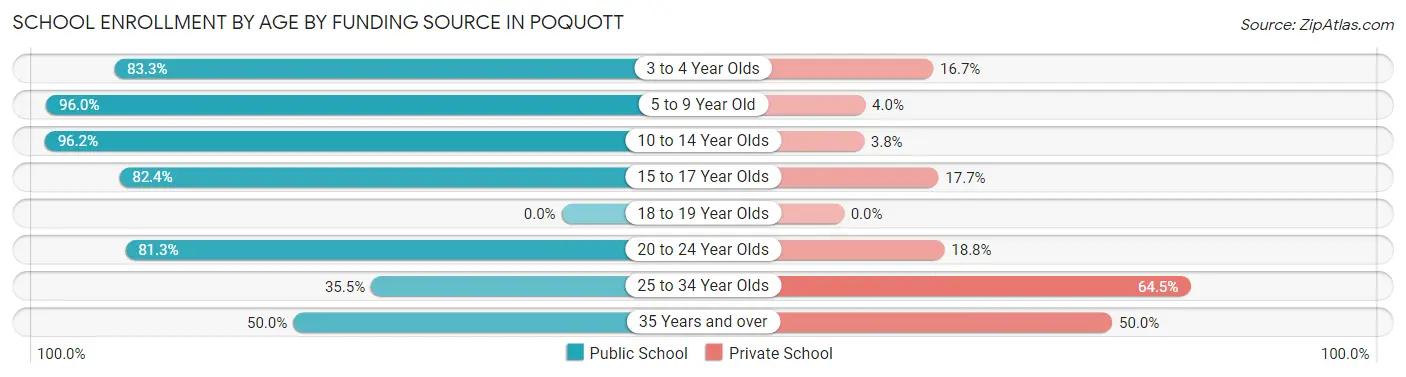
| Age Bracket | Public School | Private School |
| 3 to 4 Year Olds | 15 (83.3%) | 3 (16.7%) |
| 5 to 9 Year Old | 48 (96.0%) | 2 (4.0%) |
| 10 to 14 Year Olds | 128 (96.2%) | 5 (3.8%) |
| 15 to 17 Year Olds | 28 (82.4%) | 6 (17.6%) |
| 18 to 19 Year Olds | 0 (0.0%) | 0 (0.0%) |
| 20 to 24 Year Olds | 26 (81.2%) | 6 (18.8%) |
| 25 to 34 Year Olds | 11 (35.5%) | 20 (64.5%) |
| 35 Years and over | 2 (50.0%) | 2 (50.0%) |
| Total | 258 (85.4%) | 44 (14.6%) |
Educational Attainment by Field of Study in Poquott
Bio, nature & agricultural (114 | 18.4%), physical & health sciences (83 | 13.4%), business (77 | 12.4%), education (59 | 9.5%), and social sciences (55 | 8.9%) are the most common fields of study among 620 individuals in Poquott who have obtained a bachelor's degree or higher.
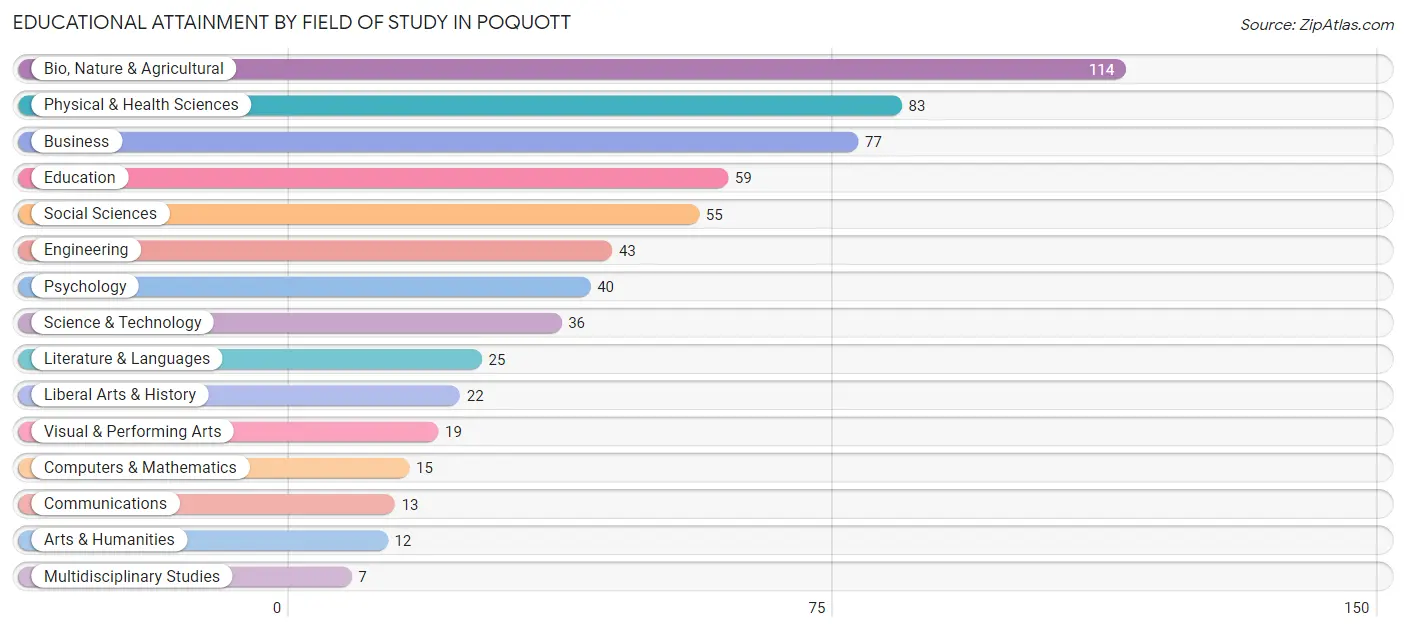
| Field of Study | # Graduates | % Graduates |
| Computers & Mathematics | 15 | 2.4% |
| Bio, Nature & Agricultural | 114 | 18.4% |
| Physical & Health Sciences | 83 | 13.4% |
| Psychology | 40 | 6.5% |
| Social Sciences | 55 | 8.9% |
| Engineering | 43 | 6.9% |
| Multidisciplinary Studies | 7 | 1.1% |
| Science & Technology | 36 | 5.8% |
| Business | 77 | 12.4% |
| Education | 59 | 9.5% |
| Literature & Languages | 25 | 4.0% |
| Liberal Arts & History | 22 | 3.5% |
| Visual & Performing Arts | 19 | 3.1% |
| Communications | 13 | 2.1% |
| Arts & Humanities | 12 | 1.9% |
| Total | 620 | 100.0% |
Transportation & Commute in Poquott
Vehicle Availability by Sex in Poquott
The most prevalent vehicle ownership categories in Poquott are males with 2 vehicles (175, accounting for 49.3%) and females with 2 vehicles (112, making up 72.3%).
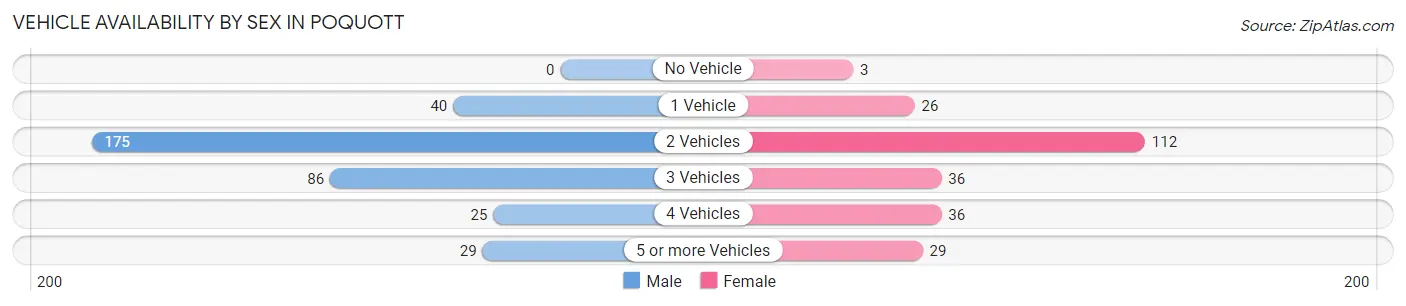
| Vehicles Available | Male | Female |
| No Vehicle | 0 (0.0%) | 3 (1.2%) |
| 1 Vehicle | 40 (11.3%) | 26 (10.7%) |
| 2 Vehicles | 175 (49.3%) | 112 (46.3%) |
| 3 Vehicles | 86 (24.2%) | 36 (14.9%) |
| 4 Vehicles | 25 (7.0%) | 36 (14.9%) |
| 5 or more Vehicles | 29 (8.2%) | 29 (12.0%) |
| Total | 355 (100.0%) | 242 (100.0%) |
Commute Time in Poquott
The most frequently occuring commute durations in Poquott are 15 to 19 minutes (91 commuters, 18.8%), 90 or more minutes (69 commuters, 14.3%), and 10 to 14 minutes (67 commuters, 13.8%).
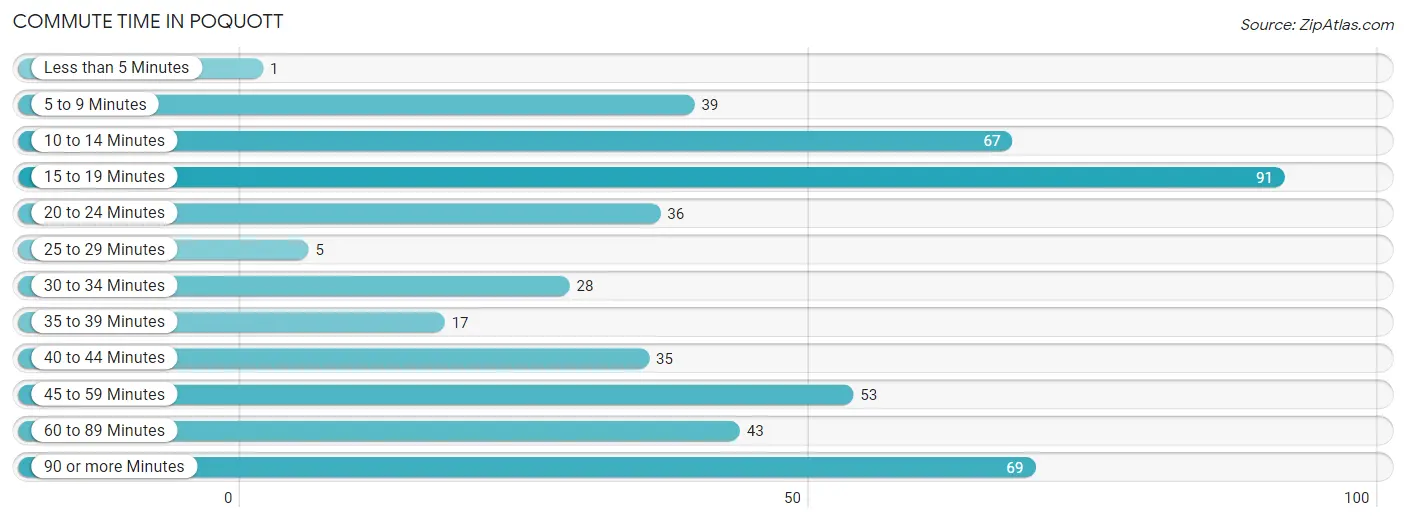
| Commute Time | # Commuters | % Commuters |
| Less than 5 Minutes | 1 | 0.2% |
| 5 to 9 Minutes | 39 | 8.1% |
| 10 to 14 Minutes | 67 | 13.8% |
| 15 to 19 Minutes | 91 | 18.8% |
| 20 to 24 Minutes | 36 | 7.4% |
| 25 to 29 Minutes | 5 | 1.0% |
| 30 to 34 Minutes | 28 | 5.8% |
| 35 to 39 Minutes | 17 | 3.5% |
| 40 to 44 Minutes | 35 | 7.2% |
| 45 to 59 Minutes | 53 | 11.0% |
| 60 to 89 Minutes | 43 | 8.9% |
| 90 or more Minutes | 69 | 14.3% |
Commute Time by Sex in Poquott
The most common commute times in Poquott are 10 to 14 minutes (49 commuters, 18.0%) for males and 15 to 19 minutes (65 commuters, 30.7%) for females.
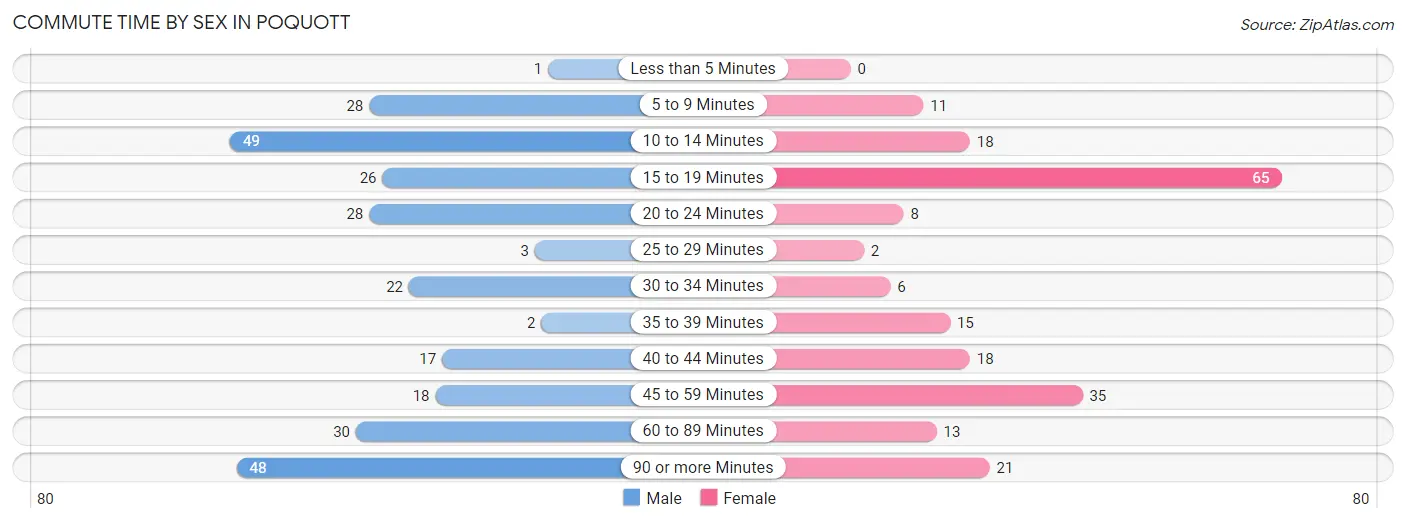
| Commute Time | Male | Female |
| Less than 5 Minutes | 1 (0.4%) | 0 (0.0%) |
| 5 to 9 Minutes | 28 (10.3%) | 11 (5.2%) |
| 10 to 14 Minutes | 49 (18.0%) | 18 (8.5%) |
| 15 to 19 Minutes | 26 (9.6%) | 65 (30.7%) |
| 20 to 24 Minutes | 28 (10.3%) | 8 (3.8%) |
| 25 to 29 Minutes | 3 (1.1%) | 2 (0.9%) |
| 30 to 34 Minutes | 22 (8.1%) | 6 (2.8%) |
| 35 to 39 Minutes | 2 (0.7%) | 15 (7.1%) |
| 40 to 44 Minutes | 17 (6.2%) | 18 (8.5%) |
| 45 to 59 Minutes | 18 (6.6%) | 35 (16.5%) |
| 60 to 89 Minutes | 30 (11.0%) | 13 (6.1%) |
| 90 or more Minutes | 48 (17.6%) | 21 (9.9%) |
Time of Departure to Work by Sex in Poquott
The most frequent times of departure to work in Poquott are 8:00 AM to 8:29 AM (55, 20.2%) for males and 8:00 AM to 8:29 AM (60, 28.3%) for females.
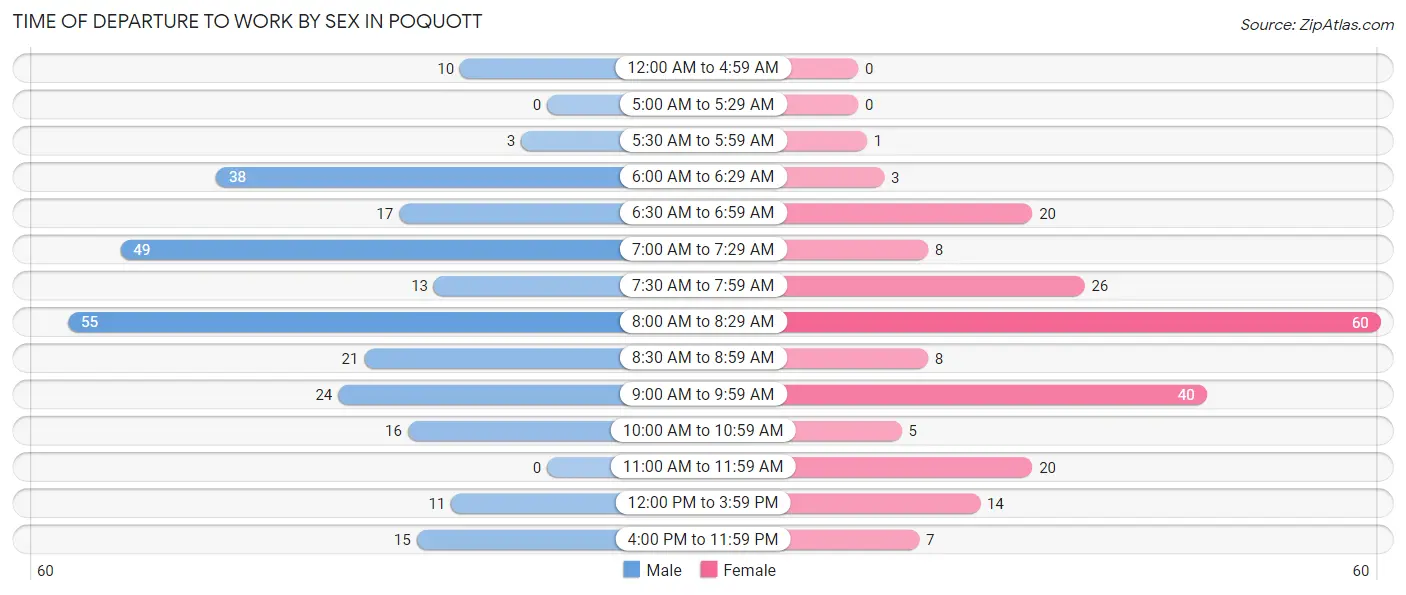
| Time of Departure | Male | Female |
| 12:00 AM to 4:59 AM | 10 (3.7%) | 0 (0.0%) |
| 5:00 AM to 5:29 AM | 0 (0.0%) | 0 (0.0%) |
| 5:30 AM to 5:59 AM | 3 (1.1%) | 1 (0.5%) |
| 6:00 AM to 6:29 AM | 38 (14.0%) | 3 (1.4%) |
| 6:30 AM to 6:59 AM | 17 (6.2%) | 20 (9.4%) |
| 7:00 AM to 7:29 AM | 49 (18.0%) | 8 (3.8%) |
| 7:30 AM to 7:59 AM | 13 (4.8%) | 26 (12.3%) |
| 8:00 AM to 8:29 AM | 55 (20.2%) | 60 (28.3%) |
| 8:30 AM to 8:59 AM | 21 (7.7%) | 8 (3.8%) |
| 9:00 AM to 9:59 AM | 24 (8.8%) | 40 (18.9%) |
| 10:00 AM to 10:59 AM | 16 (5.9%) | 5 (2.4%) |
| 11:00 AM to 11:59 AM | 0 (0.0%) | 20 (9.4%) |
| 12:00 PM to 3:59 PM | 11 (4.0%) | 14 (6.6%) |
| 4:00 PM to 11:59 PM | 15 (5.5%) | 7 (3.3%) |
| Total | 272 (100.0%) | 212 (100.0%) |
Housing Occupancy in Poquott
Occupancy by Ownership in Poquott
Of the total 405 dwellings in Poquott, owner-occupied units account for 350 (86.4%), while renter-occupied units make up 55 (13.6%).
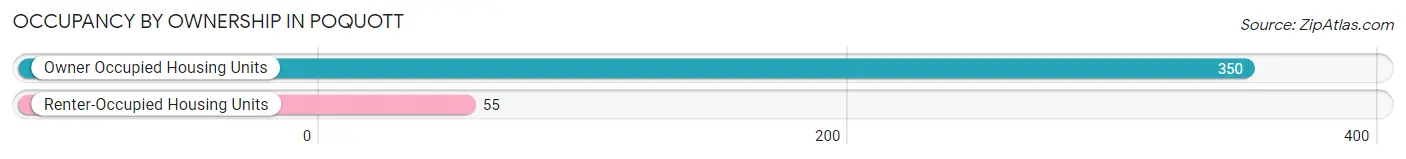
| Occupancy | # Housing Units | % Housing Units |
| Owner Occupied Housing Units | 350 | 86.4% |
| Renter-Occupied Housing Units | 55 | 13.6% |
| Total Occupied Housing Units | 405 | 100.0% |
Occupancy by Household Size in Poquott
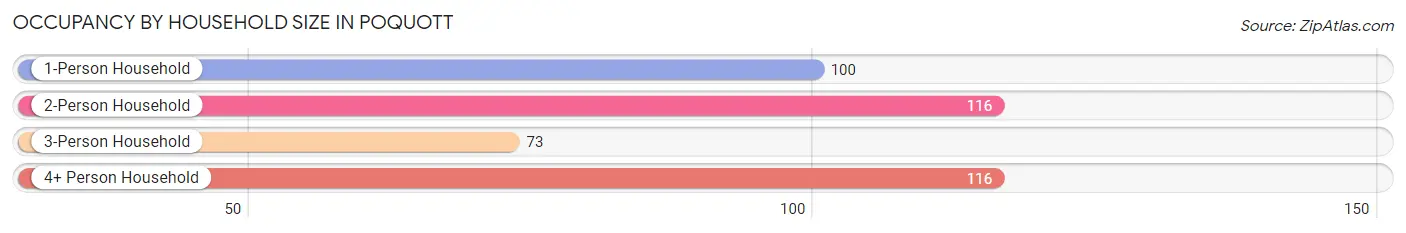
| Household Size | # Housing Units | % Housing Units |
| 1-Person Household | 100 | 24.7% |
| 2-Person Household | 116 | 28.6% |
| 3-Person Household | 73 | 18.0% |
| 4+ Person Household | 116 | 28.6% |
| Total Housing Units | 405 | 100.0% |
Occupancy by Ownership by Household Size in Poquott
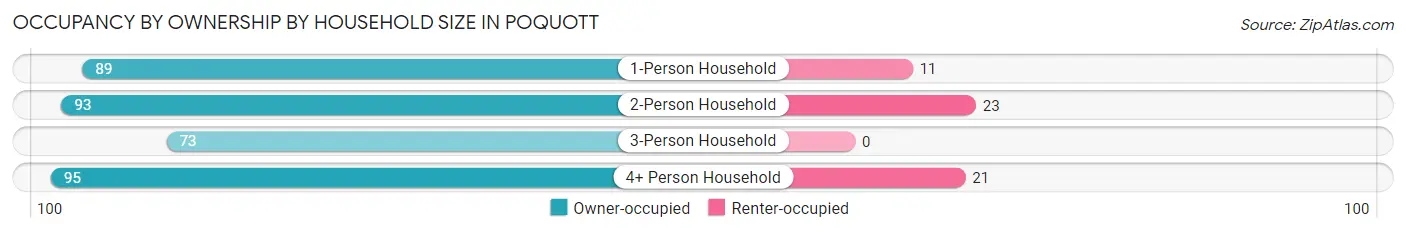
| Household Size | Owner-occupied | Renter-occupied |
| 1-Person Household | 89 (89.0%) | 11 (11.0%) |
| 2-Person Household | 93 (80.2%) | 23 (19.8%) |
| 3-Person Household | 73 (100.0%) | 0 (0.0%) |
| 4+ Person Household | 95 (81.9%) | 21 (18.1%) |
| Total Housing Units | 350 (86.4%) | 55 (13.6%) |
Occupancy by Educational Attainment in Poquott
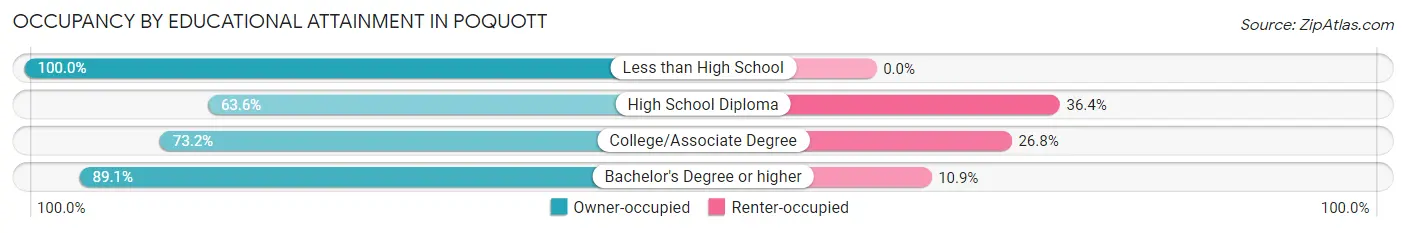
| Household Size | Owner-occupied | Renter-occupied |
| Less than High School | 12 (100.0%) | 0 (0.0%) |
| High School Diploma | 14 (63.6%) | 8 (36.4%) |
| College/Associate Degree | 30 (73.2%) | 11 (26.8%) |
| Bachelor's Degree or higher | 294 (89.1%) | 36 (10.9%) |
Occupancy by Age of Householder in Poquott
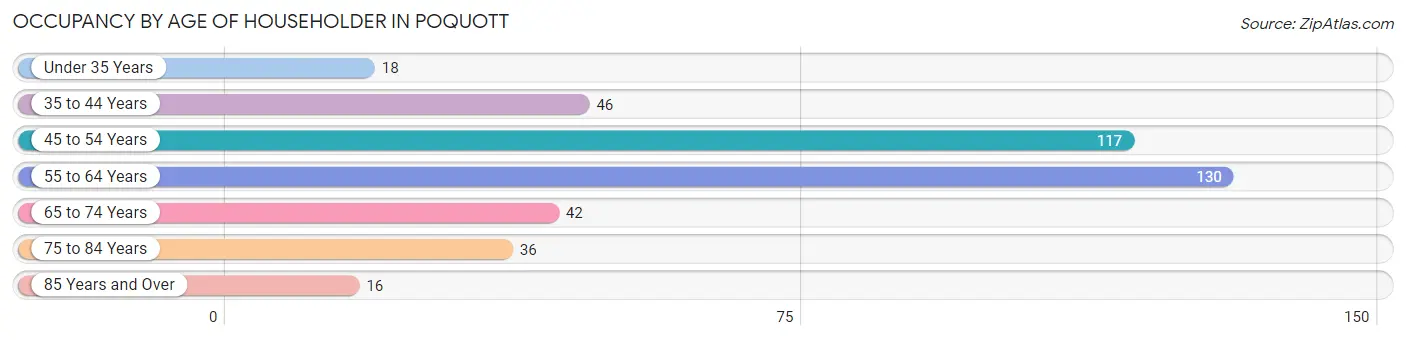
| Age Bracket | # Households | % Households |
| Under 35 Years | 18 | 4.4% |
| 35 to 44 Years | 46 | 11.4% |
| 45 to 54 Years | 117 | 28.9% |
| 55 to 64 Years | 130 | 32.1% |
| 65 to 74 Years | 42 | 10.4% |
| 75 to 84 Years | 36 | 8.9% |
| 85 Years and Over | 16 | 4.0% |
| Total | 405 | 100.0% |
Housing Finances in Poquott
Median Income by Occupancy in Poquott
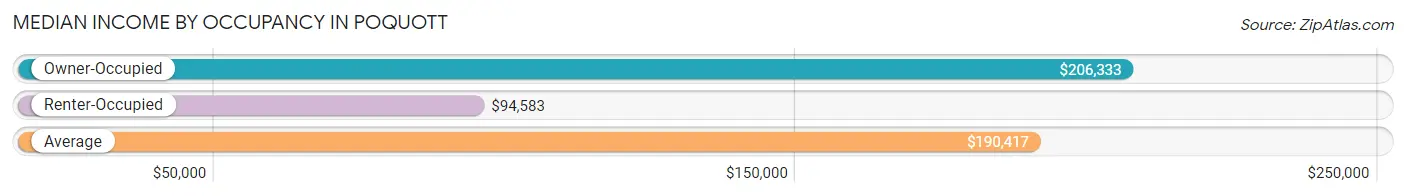
| Occupancy Type | # Households | Median Income |
| Owner-Occupied | 350 (86.4%) | $206,333 |
| Renter-Occupied | 55 (13.6%) | $94,583 |
| Average | 405 (100.0%) | $190,417 |
Occupancy by Householder Income Bracket in Poquott
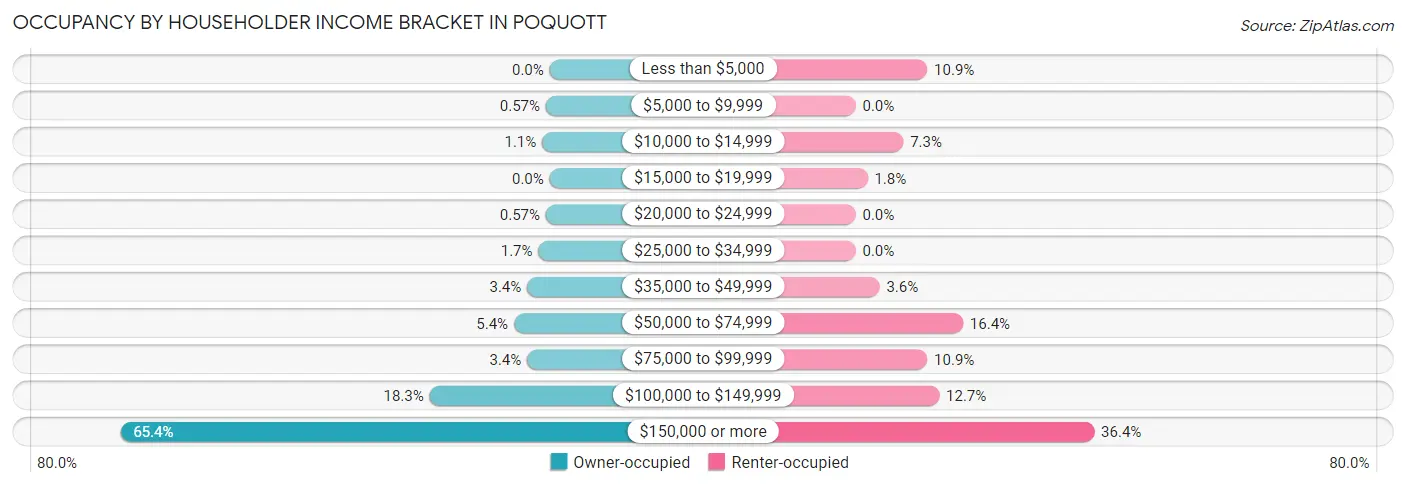
| Income Bracket | Owner-occupied | Renter-occupied |
| Less than $5,000 | 0 (0.0%) | 6 (10.9%) |
| $5,000 to $9,999 | 2 (0.6%) | 0 (0.0%) |
| $10,000 to $14,999 | 4 (1.1%) | 4 (7.3%) |
| $15,000 to $19,999 | 0 (0.0%) | 1 (1.8%) |
| $20,000 to $24,999 | 2 (0.6%) | 0 (0.0%) |
| $25,000 to $34,999 | 6 (1.7%) | 0 (0.0%) |
| $35,000 to $49,999 | 12 (3.4%) | 2 (3.6%) |
| $50,000 to $74,999 | 19 (5.4%) | 9 (16.4%) |
| $75,000 to $99,999 | 12 (3.4%) | 6 (10.9%) |
| $100,000 to $149,999 | 64 (18.3%) | 7 (12.7%) |
| $150,000 or more | 229 (65.4%) | 20 (36.4%) |
| Total | 350 (100.0%) | 55 (100.0%) |
Monthly Housing Cost Tiers in Poquott
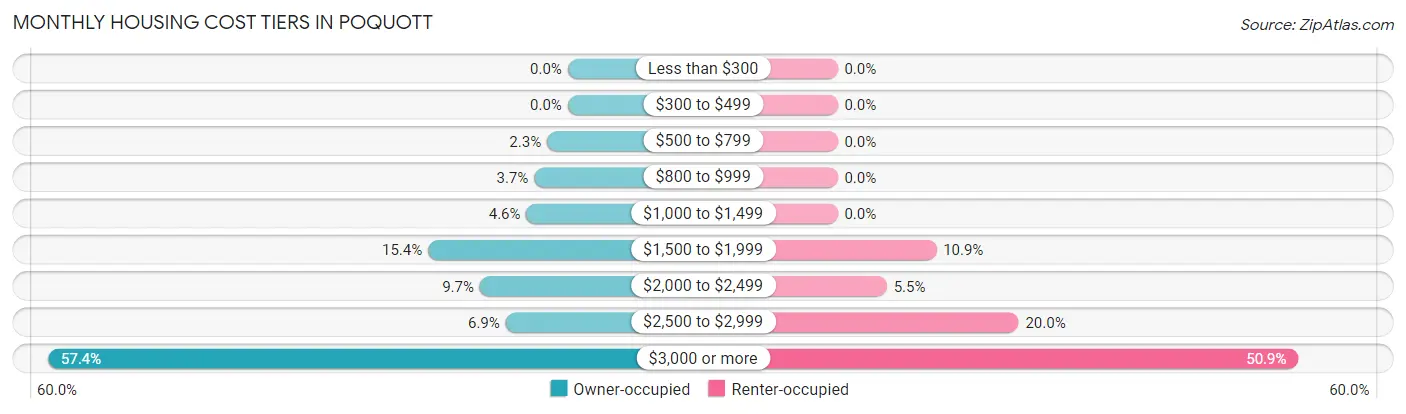
| Monthly Cost | Owner-occupied | Renter-occupied |
| Less than $300 | 0 (0.0%) | 0 (0.0%) |
| $300 to $499 | 0 (0.0%) | 0 (0.0%) |
| $500 to $799 | 8 (2.3%) | 0 (0.0%) |
| $800 to $999 | 13 (3.7%) | 0 (0.0%) |
| $1,000 to $1,499 | 16 (4.6%) | 0 (0.0%) |
| $1,500 to $1,999 | 54 (15.4%) | 6 (10.9%) |
| $2,000 to $2,499 | 34 (9.7%) | 3 (5.4%) |
| $2,500 to $2,999 | 24 (6.9%) | 11 (20.0%) |
| $3,000 or more | 201 (57.4%) | 28 (50.9%) |
| Total | 350 (100.0%) | 55 (100.0%) |
Physical Housing Characteristics in Poquott
Housing Structures in Poquott
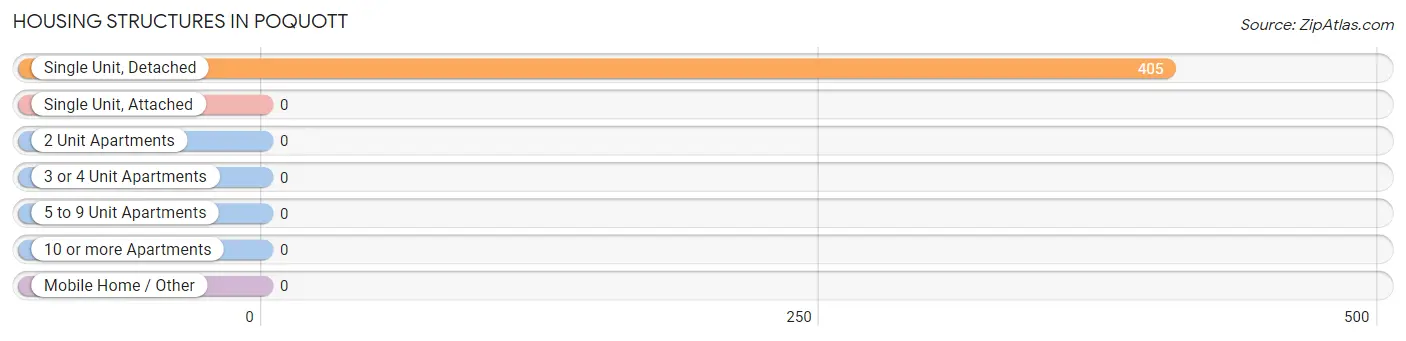
| Structure Type | # Housing Units | % Housing Units |
| Single Unit, Detached | 405 | 100.0% |
| Single Unit, Attached | 0 | 0.0% |
| 2 Unit Apartments | 0 | 0.0% |
| 3 or 4 Unit Apartments | 0 | 0.0% |
| 5 to 9 Unit Apartments | 0 | 0.0% |
| 10 or more Apartments | 0 | 0.0% |
| Mobile Home / Other | 0 | 0.0% |
| Total | 405 | 100.0% |
Housing Structures by Occupancy in Poquott
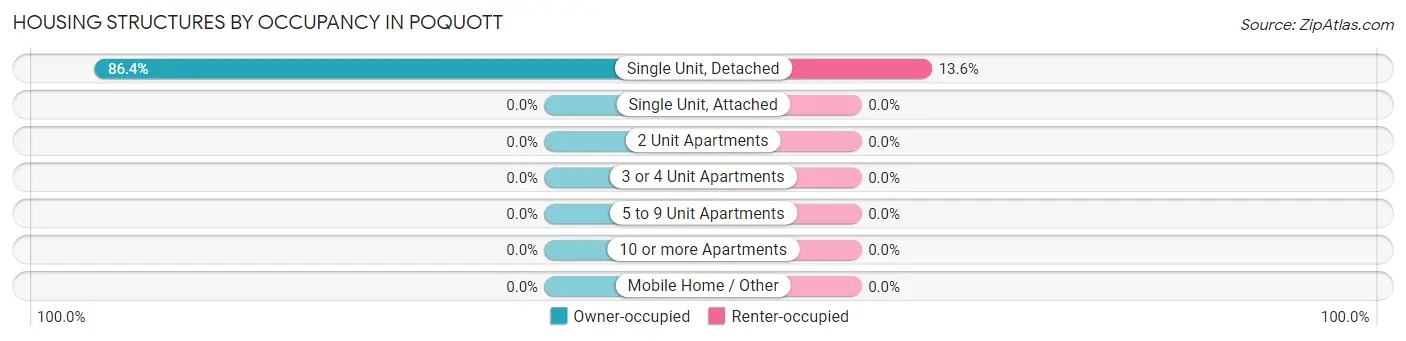
| Structure Type | Owner-occupied | Renter-occupied |
| Single Unit, Detached | 350 (86.4%) | 55 (13.6%) |
| Single Unit, Attached | 0 (0.0%) | 0 (0.0%) |
| 2 Unit Apartments | 0 (0.0%) | 0 (0.0%) |
| 3 or 4 Unit Apartments | 0 (0.0%) | 0 (0.0%) |
| 5 to 9 Unit Apartments | 0 (0.0%) | 0 (0.0%) |
| 10 or more Apartments | 0 (0.0%) | 0 (0.0%) |
| Mobile Home / Other | 0 (0.0%) | 0 (0.0%) |
| Total | 350 (86.4%) | 55 (13.6%) |
Housing Structures by Number of Rooms in Poquott
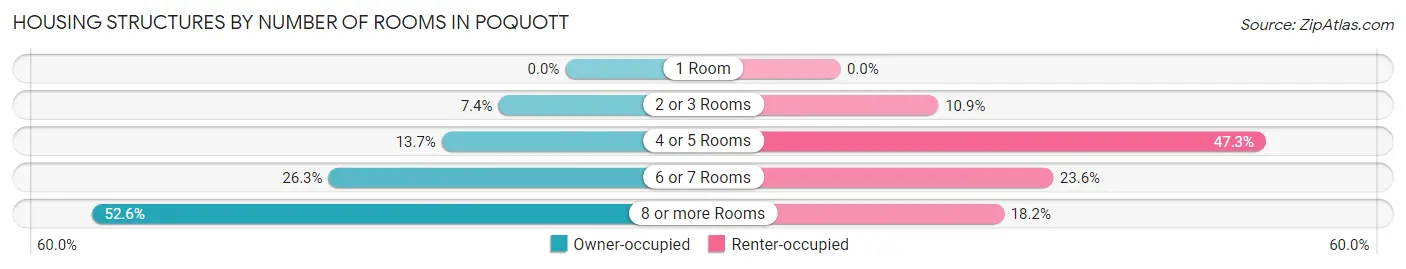
| Number of Rooms | Owner-occupied | Renter-occupied |
| 1 Room | 0 (0.0%) | 0 (0.0%) |
| 2 or 3 Rooms | 26 (7.4%) | 6 (10.9%) |
| 4 or 5 Rooms | 48 (13.7%) | 26 (47.3%) |
| 6 or 7 Rooms | 92 (26.3%) | 13 (23.6%) |
| 8 or more Rooms | 184 (52.6%) | 10 (18.2%) |
| Total | 350 (100.0%) | 55 (100.0%) |
Housing Structure by Heating Type in Poquott
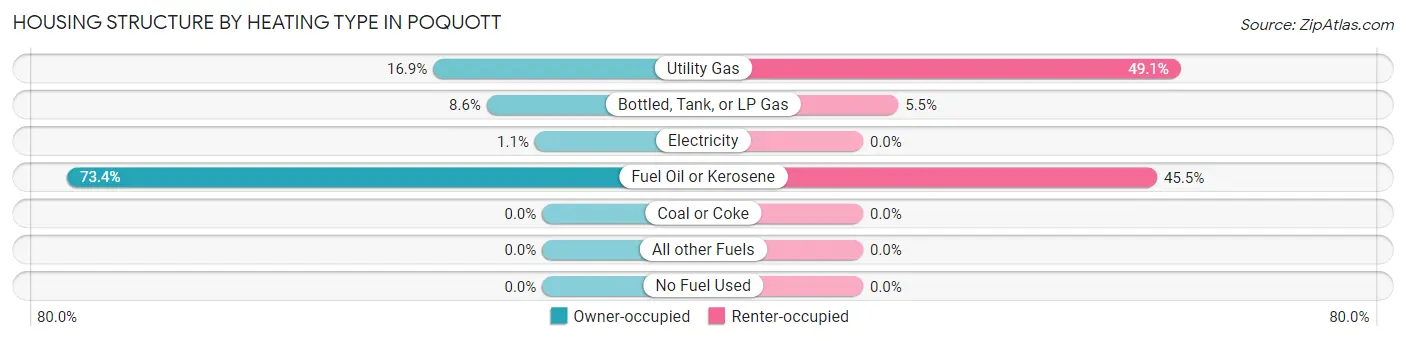
| Heating Type | Owner-occupied | Renter-occupied |
| Utility Gas | 59 (16.9%) | 27 (49.1%) |
| Bottled, Tank, or LP Gas | 30 (8.6%) | 3 (5.4%) |
| Electricity | 4 (1.1%) | 0 (0.0%) |
| Fuel Oil or Kerosene | 257 (73.4%) | 25 (45.5%) |
| Coal or Coke | 0 (0.0%) | 0 (0.0%) |
| All other Fuels | 0 (0.0%) | 0 (0.0%) |
| No Fuel Used | 0 (0.0%) | 0 (0.0%) |
| Total | 350 (100.0%) | 55 (100.0%) |
Household Vehicle Usage in Poquott
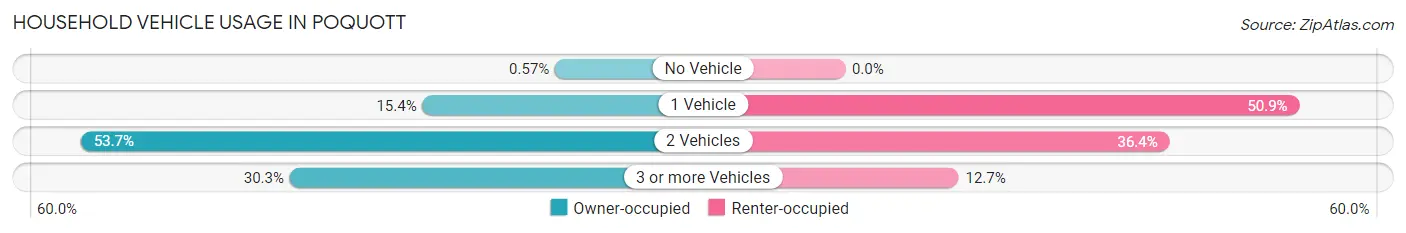
| Vehicles per Household | Owner-occupied | Renter-occupied |
| No Vehicle | 2 (0.6%) | 0 (0.0%) |
| 1 Vehicle | 54 (15.4%) | 28 (50.9%) |
| 2 Vehicles | 188 (53.7%) | 20 (36.4%) |
| 3 or more Vehicles | 106 (30.3%) | 7 (12.7%) |
| Total | 350 (100.0%) | 55 (100.0%) |
Real Estate & Mortgages in Poquott
Real Estate and Mortgage Overview in Poquott
| Characteristic | Without Mortgage | With Mortgage |
| Housing Units | 157 | 193 |
| Median Property Value | $965,000 | $700,500 |
| Median Household Income | $221,250 | $122 |
| Monthly Housing Costs | $1,501 | $125 |
| Real Estate Taxes | $10,001 | $0 |
Property Value by Mortgage Status in Poquott
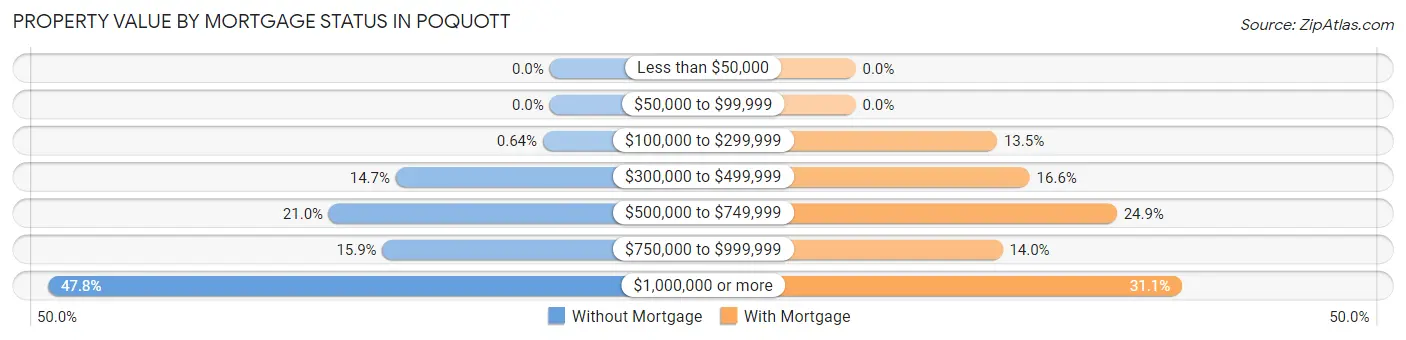
| Property Value | Without Mortgage | With Mortgage |
| Less than $50,000 | 0 (0.0%) | 0 (0.0%) |
| $50,000 to $99,999 | 0 (0.0%) | 0 (0.0%) |
| $100,000 to $299,999 | 1 (0.6%) | 26 (13.5%) |
| $300,000 to $499,999 | 23 (14.6%) | 32 (16.6%) |
| $500,000 to $749,999 | 33 (21.0%) | 48 (24.9%) |
| $750,000 to $999,999 | 25 (15.9%) | 27 (14.0%) |
| $1,000,000 or more | 75 (47.8%) | 60 (31.1%) |
| Total | 157 (100.0%) | 193 (100.0%) |
Household Income by Mortgage Status in Poquott
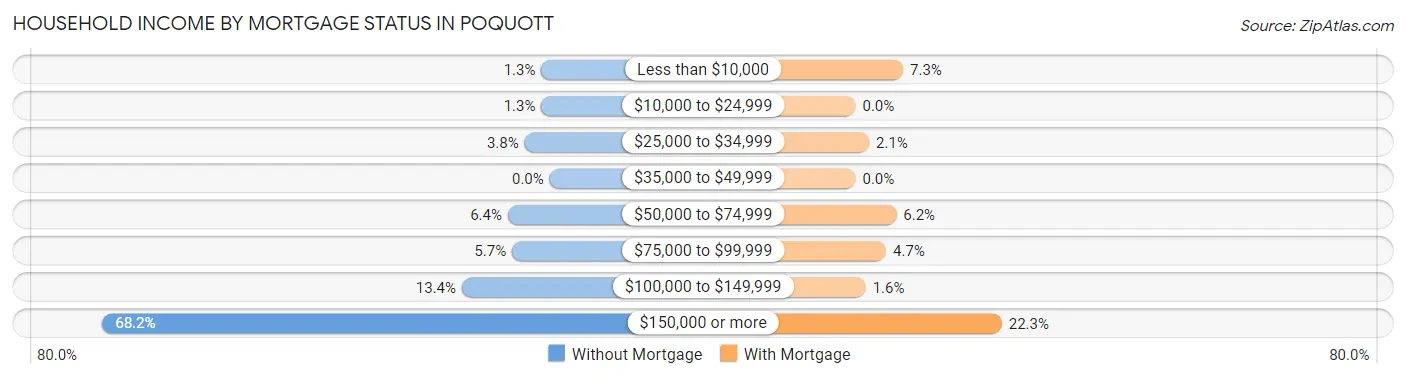
| Household Income | Without Mortgage | With Mortgage |
| Less than $10,000 | 2 (1.3%) | 14 (7.2%) |
| $10,000 to $24,999 | 2 (1.3%) | 0 (0.0%) |
| $25,000 to $34,999 | 6 (3.8%) | 4 (2.1%) |
| $35,000 to $49,999 | 0 (0.0%) | 0 (0.0%) |
| $50,000 to $74,999 | 10 (6.4%) | 12 (6.2%) |
| $75,000 to $99,999 | 9 (5.7%) | 9 (4.7%) |
| $100,000 to $149,999 | 21 (13.4%) | 3 (1.5%) |
| $150,000 or more | 107 (68.1%) | 43 (22.3%) |
| Total | 157 (100.0%) | 193 (100.0%) |
Property Value to Household Income Ratio in Poquott
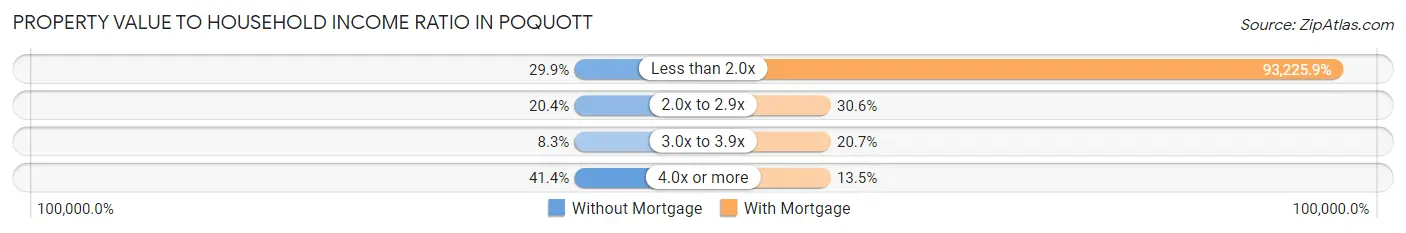
| Value-to-Income Ratio | Without Mortgage | With Mortgage |
| Less than 2.0x | 47 (29.9%) | 179,926 (93,225.9%) |
| 2.0x to 2.9x | 32 (20.4%) | 59 (30.6%) |
| 3.0x to 3.9x | 13 (8.3%) | 40 (20.7%) |
| 4.0x or more | 65 (41.4%) | 26 (13.5%) |
| Total | 157 (100.0%) | 193 (100.0%) |
Real Estate Taxes by Mortgage Status in Poquott
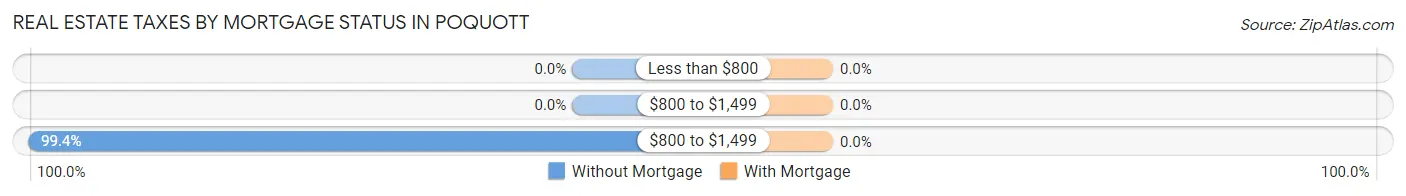
| Property Taxes | Without Mortgage | With Mortgage |
| Less than $800 | 0 (0.0%) | 0 (0.0%) |
| $800 to $1,499 | 0 (0.0%) | 0 (0.0%) |
| $800 to $1,499 | 156 (99.4%) | 0 (0.0%) |
| Total | 157 (100.0%) | 193 (100.0%) |
Health & Disability in Poquott
Health Insurance Coverage by Age in Poquott
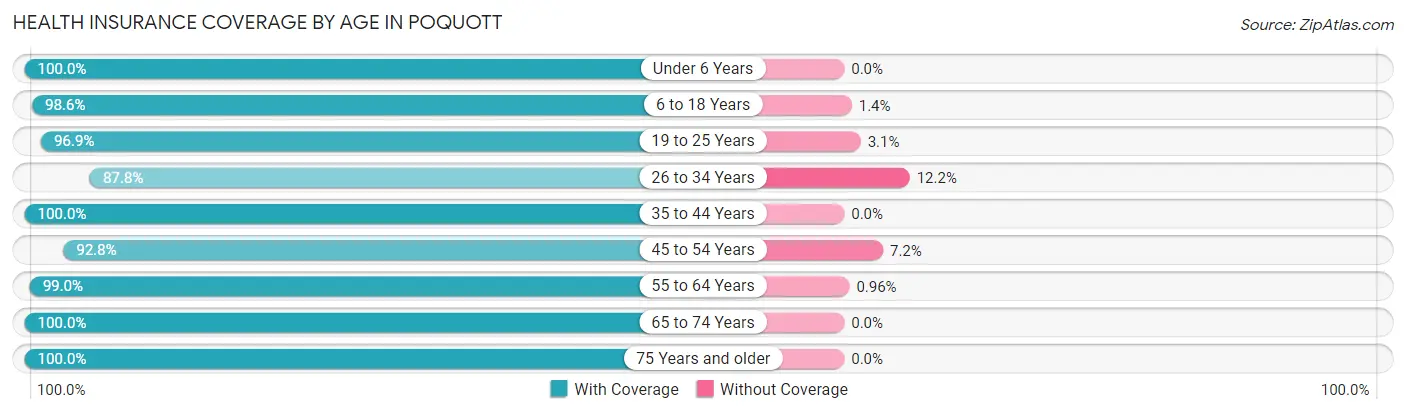
| Age Bracket | With Coverage | Without Coverage |
| Under 6 Years | 60 (100.0%) | 0 (0.0%) |
| 6 to 18 Years | 211 (98.6%) | 3 (1.4%) |
| 19 to 25 Years | 95 (96.9%) | 3 (3.1%) |
| 26 to 34 Years | 72 (87.8%) | 10 (12.2%) |
| 35 to 44 Years | 106 (100.0%) | 0 (0.0%) |
| 45 to 54 Years | 167 (92.8%) | 13 (7.2%) |
| 55 to 64 Years | 206 (99.0%) | 2 (1.0%) |
| 65 to 74 Years | 73 (100.0%) | 0 (0.0%) |
| 75 Years and older | 86 (100.0%) | 0 (0.0%) |
| Total | 1,076 (97.2%) | 31 (2.8%) |
Health Insurance Coverage by Citizenship Status in Poquott
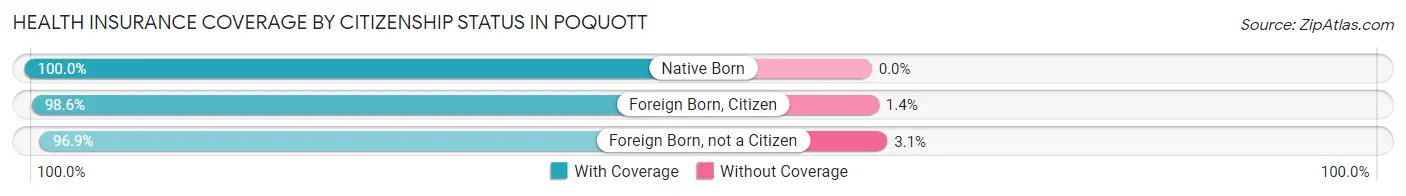
| Citizenship Status | With Coverage | Without Coverage |
| Native Born | 60 (100.0%) | 0 (0.0%) |
| Foreign Born, Citizen | 211 (98.6%) | 3 (1.4%) |
| Foreign Born, not a Citizen | 95 (96.9%) | 3 (3.1%) |
Health Insurance Coverage by Household Income in Poquott
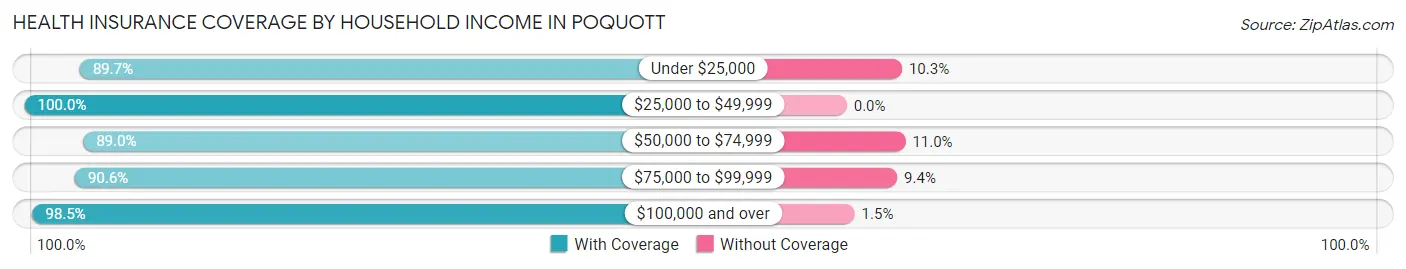
| Household Income | With Coverage | Without Coverage |
| Under $25,000 | 26 (89.7%) | 3 (10.3%) |
| $25,000 to $49,999 | 51 (100.0%) | 0 (0.0%) |
| $50,000 to $74,999 | 81 (89.0%) | 10 (11.0%) |
| $75,000 to $99,999 | 48 (90.6%) | 5 (9.4%) |
| $100,000 and over | 870 (98.5%) | 13 (1.5%) |
Public vs Private Health Insurance Coverage by Age in Poquott
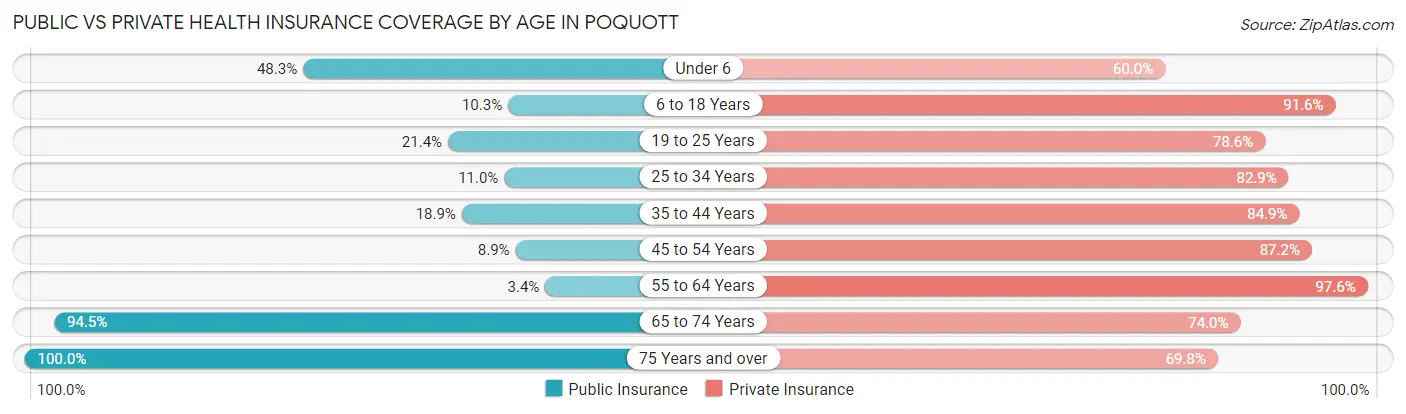
| Age Bracket | Public Insurance | Private Insurance |
| Under 6 | 29 (48.3%) | 36 (60.0%) |
| 6 to 18 Years | 22 (10.3%) | 196 (91.6%) |
| 19 to 25 Years | 21 (21.4%) | 77 (78.6%) |
| 25 to 34 Years | 9 (11.0%) | 68 (82.9%) |
| 35 to 44 Years | 20 (18.9%) | 90 (84.9%) |
| 45 to 54 Years | 16 (8.9%) | 157 (87.2%) |
| 55 to 64 Years | 7 (3.4%) | 203 (97.6%) |
| 65 to 74 Years | 69 (94.5%) | 54 (74.0%) |
| 75 Years and over | 86 (100.0%) | 60 (69.8%) |
| Total | 279 (25.2%) | 941 (85.0%) |
Disability Status by Sex by Age in Poquott
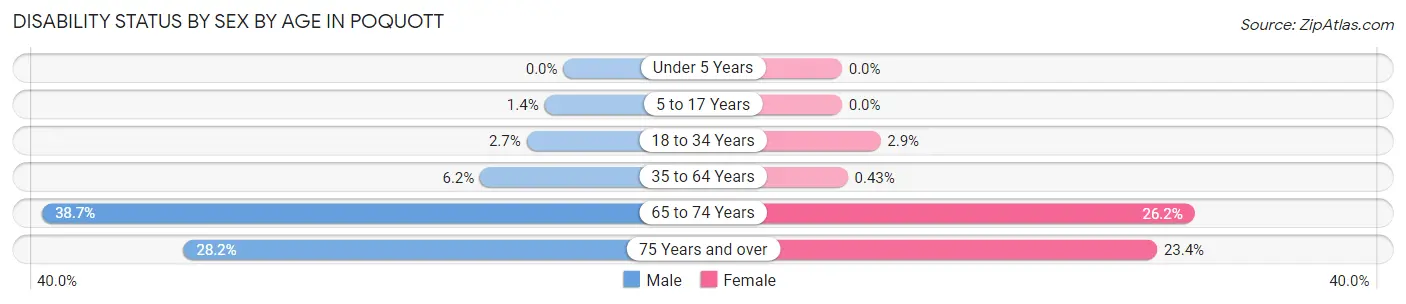
| Age Bracket | Male | Female |
| Under 5 Years | 0 (0.0%) | 0 (0.0%) |
| 5 to 17 Years | 2 (1.4%) | 0 (0.0%) |
| 18 to 34 Years | 3 (2.7%) | 2 (2.9%) |
| 35 to 64 Years | 16 (6.2%) | 1 (0.4%) |
| 65 to 74 Years | 12 (38.7%) | 11 (26.2%) |
| 75 Years and over | 11 (28.2%) | 11 (23.4%) |
Disability Class by Sex by Age in Poquott
Disability Class: Hearing Difficulty
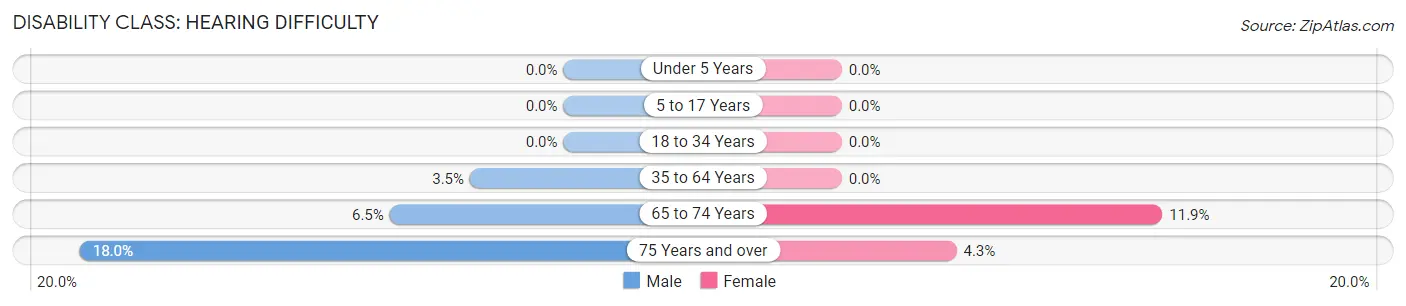
| Age Bracket | Male | Female |
| Under 5 Years | 0 (0.0%) | 0 (0.0%) |
| 5 to 17 Years | 0 (0.0%) | 0 (0.0%) |
| 18 to 34 Years | 0 (0.0%) | 0 (0.0%) |
| 35 to 64 Years | 9 (3.5%) | 0 (0.0%) |
| 65 to 74 Years | 2 (6.5%) | 5 (11.9%) |
| 75 Years and over | 7 (17.9%) | 2 (4.3%) |
Disability Class: Vision Difficulty
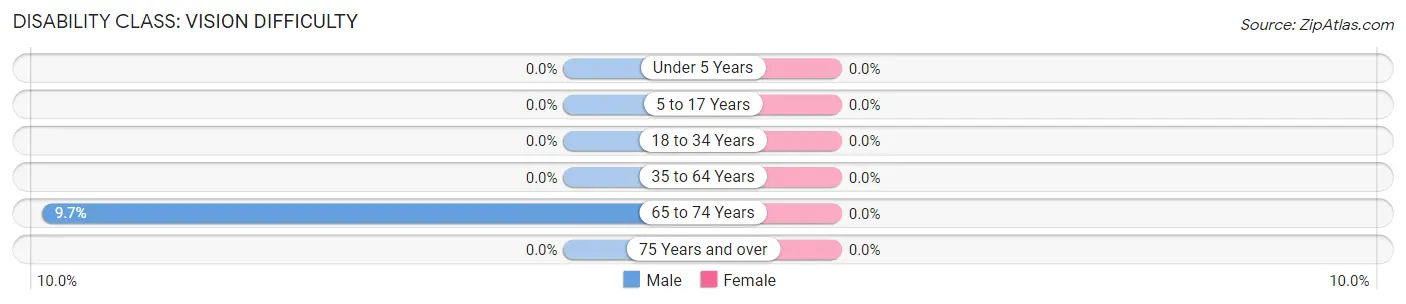
| Age Bracket | Male | Female |
| Under 5 Years | 0 (0.0%) | 0 (0.0%) |
| 5 to 17 Years | 0 (0.0%) | 0 (0.0%) |
| 18 to 34 Years | 0 (0.0%) | 0 (0.0%) |
| 35 to 64 Years | 0 (0.0%) | 0 (0.0%) |
| 65 to 74 Years | 3 (9.7%) | 0 (0.0%) |
| 75 Years and over | 0 (0.0%) | 0 (0.0%) |
Disability Class: Cognitive Difficulty
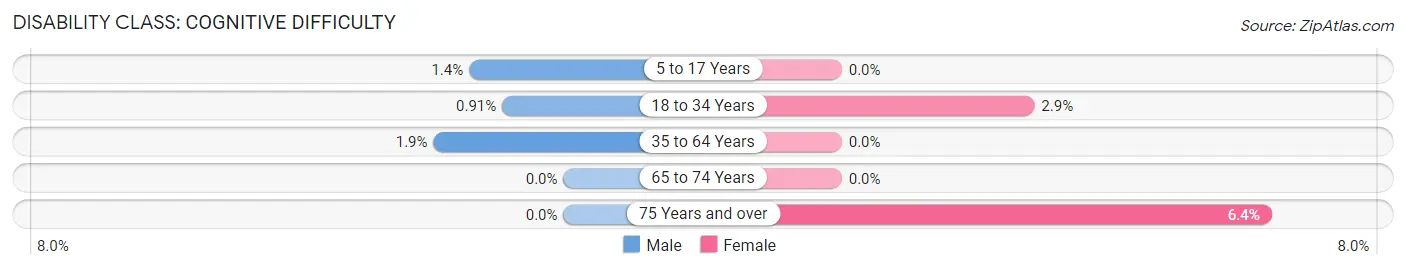
| Age Bracket | Male | Female |
| 5 to 17 Years | 2 (1.4%) | 0 (0.0%) |
| 18 to 34 Years | 1 (0.9%) | 2 (2.9%) |
| 35 to 64 Years | 5 (1.9%) | 0 (0.0%) |
| 65 to 74 Years | 0 (0.0%) | 0 (0.0%) |
| 75 Years and over | 0 (0.0%) | 3 (6.4%) |
Disability Class: Ambulatory Difficulty
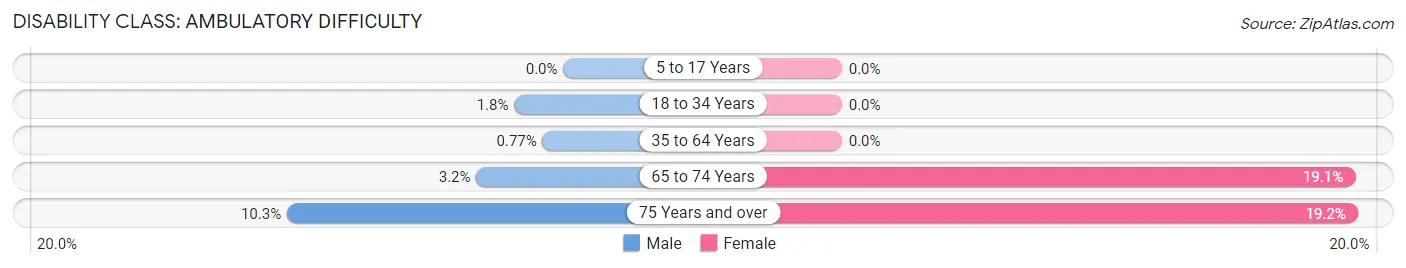
| Age Bracket | Male | Female |
| 5 to 17 Years | 0 (0.0%) | 0 (0.0%) |
| 18 to 34 Years | 2 (1.8%) | 0 (0.0%) |
| 35 to 64 Years | 2 (0.8%) | 0 (0.0%) |
| 65 to 74 Years | 1 (3.2%) | 8 (19.1%) |
| 75 Years and over | 4 (10.3%) | 9 (19.2%) |
Disability Class: Self-Care Difficulty
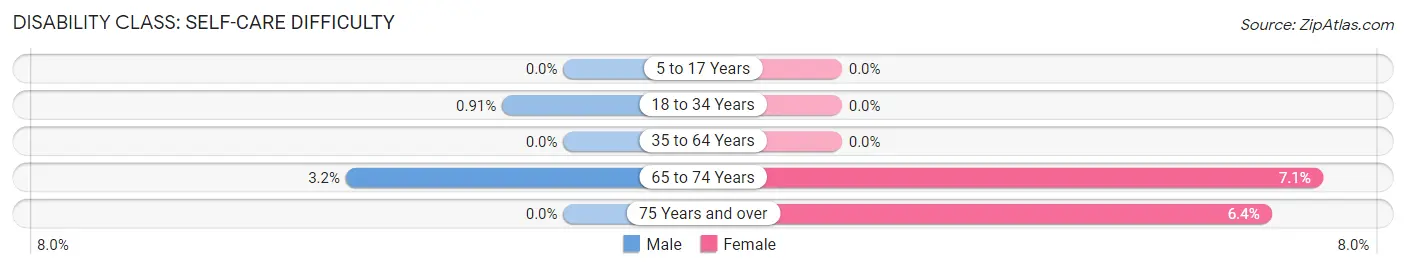
| Age Bracket | Male | Female |
| 5 to 17 Years | 0 (0.0%) | 0 (0.0%) |
| 18 to 34 Years | 1 (0.9%) | 0 (0.0%) |
| 35 to 64 Years | 0 (0.0%) | 0 (0.0%) |
| 65 to 74 Years | 1 (3.2%) | 3 (7.1%) |
| 75 Years and over | 0 (0.0%) | 3 (6.4%) |
Technology Access in Poquott
Computing Device Access in Poquott
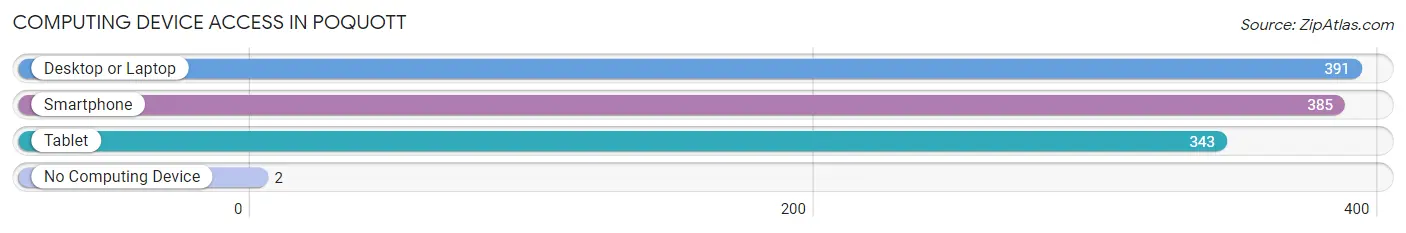
| Device Type | # Households | % Households |
| Desktop or Laptop | 391 | 96.5% |
| Smartphone | 385 | 95.1% |
| Tablet | 343 | 84.7% |
| No Computing Device | 2 | 0.5% |
| Total | 405 | 100.0% |
Internet Access in Poquott
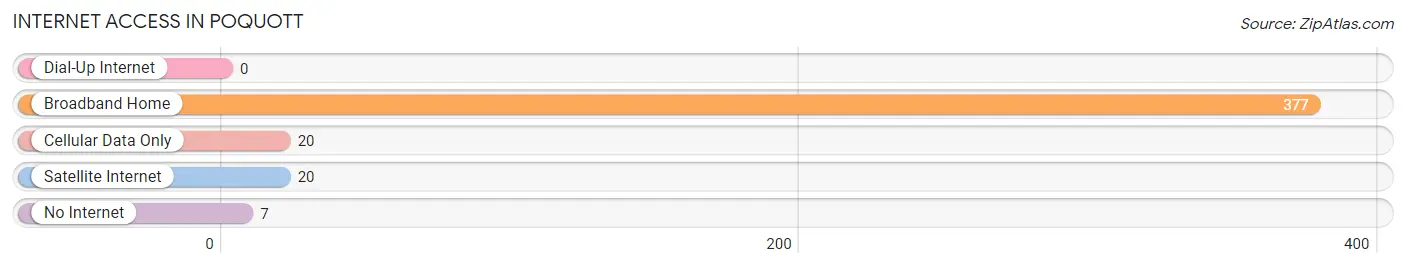
| Internet Type | # Households | % Households |
| Dial-Up Internet | 0 | 0.0% |
| Broadband Home | 377 | 93.1% |
| Cellular Data Only | 20 | 4.9% |
| Satellite Internet | 20 | 4.9% |
| No Internet | 7 | 1.7% |
| Total | 405 | 100.0% |
Poquott Summary
Poquott is a small hamlet located in the Town of Brookhaven in Suffolk County, New York. It is situated on the north shore of Long Island, approximately 60 miles east of New York City. The hamlet is bordered by the hamlets of Setauket to the west, Port Jefferson to the east, and Stony Brook to the south. Poquott is a small, residential community with a population of approximately 1,000 people.
History
The area now known as Poquott was originally inhabited by the Setalcott Indians, a branch of the Algonquin tribe. The name Poquott is derived from the Algonquin word “pokquat,” which means “place of the pines.” The area was first settled by Europeans in the late 1600s, and the hamlet was officially established in 1790.
In the early 1800s, Poquott was a thriving agricultural community, with many farms and orchards. The hamlet was also home to several mills, including a grist mill, a saw mill, and a paper mill. In the late 1800s, the hamlet began to transition from an agricultural to a residential community. The population of Poquott grew steadily throughout the 20th century, and the hamlet is now a quiet, residential community.
Geography
Poquott is located on the north shore of Long Island, approximately 60 miles east of New York City. The hamlet is bordered by the hamlets of Setauket to the west, Port Jefferson to the east, and Stony Brook to the south. Poquott is situated on a peninsula, with the Long Island Sound to the north and the Nissequogue River to the south. The hamlet is approximately 1.5 square miles in size, and is mostly residential, with some small businesses and a few parks.
Economy
The economy of Poquott is largely based on the service industry. The hamlet is home to several small businesses, including restaurants, retail stores, and professional services. The hamlet is also home to a few small manufacturing companies. The majority of the population is employed in the service industry, with many residents commuting to nearby towns and cities for work.
Demographics
As of the 2010 census, the population of Poquott was 1,000 people. The population is predominantly white (90%), with small percentages of African American (4%), Asian (3%), and Hispanic (2%) residents. The median household income is $90,000, and the median home value is $400,000. The majority of the population is married (60%), and the median age is 43 years.
Conclusion
Poquott is a small hamlet located in the Town of Brookhaven in Suffolk County, New York. It is situated on the north shore of Long Island, approximately 60 miles east of New York City. The hamlet is bordered by the hamlets of Setauket to the west, Port Jefferson to the east, and Stony Brook to the south. Poquott is a small, residential community with a population of approximately 1,000 people. The economy of Poquott is largely based on the service industry, and the population is predominantly white. Poquott is a quiet, residential community with a median household income of $90,000 and a median home value of $400,000.
Common Questions
What is Per Capita Income in Poquott?
Per Capita income in Poquott is $115,040.
What is the Median Family Income in Poquott?
Median Family Income in Poquott is $216,000.
What is the Median Household income in Poquott?
Median Household Income in Poquott is $190,417.
What is Income or Wage Gap in Poquott?
Income or Wage Gap in Poquott is 36.1%.
Women in Poquott earn 63.9 cents for every dollar earned by a man.
What is Family Income Deficit in Poquott?
Family Income Deficit in Poquott is $16,156.
Families that are below poverty line in Poquott earn $16,156 less on average than the poverty threshold level.
What is Inequality or Gini Index in Poquott?
Inequality or Gini Index in Poquott is 0.49.
What is the Total Population of Poquott?
Total Population of Poquott is 1,107.
What is the Total Male Population of Poquott?
Total Male Population of Poquott is 608.
What is the Total Female Population of Poquott?
Total Female Population of Poquott is 499.
What is the Ratio of Males per 100 Females in Poquott?
There are 121.84 Males per 100 Females in Poquott.
What is the Ratio of Females per 100 Males in Poquott?
There are 82.07 Females per 100 Males in Poquott.
What is the Median Population Age in Poquott?
Median Population Age in Poquott is 43.7 Years.
What is the Average Family Size in Poquott
Average Family Size in Poquott is 3.3 People.
What is the Average Household Size in Poquott
Average Household Size in Poquott is 2.7 People.
How Large is the Labor Force in Poquott?
There are 616 People in the Labor Forcein in Poquott.
What is the Percentage of People in the Labor Force in Poquott?
72.3% of People are in the Labor Force in Poquott.
What is the Unemployment Rate in Poquott?
Unemployment Rate in Poquott is 2.6%.